Linthicum, MD Map & Demographics
Linthicum Map
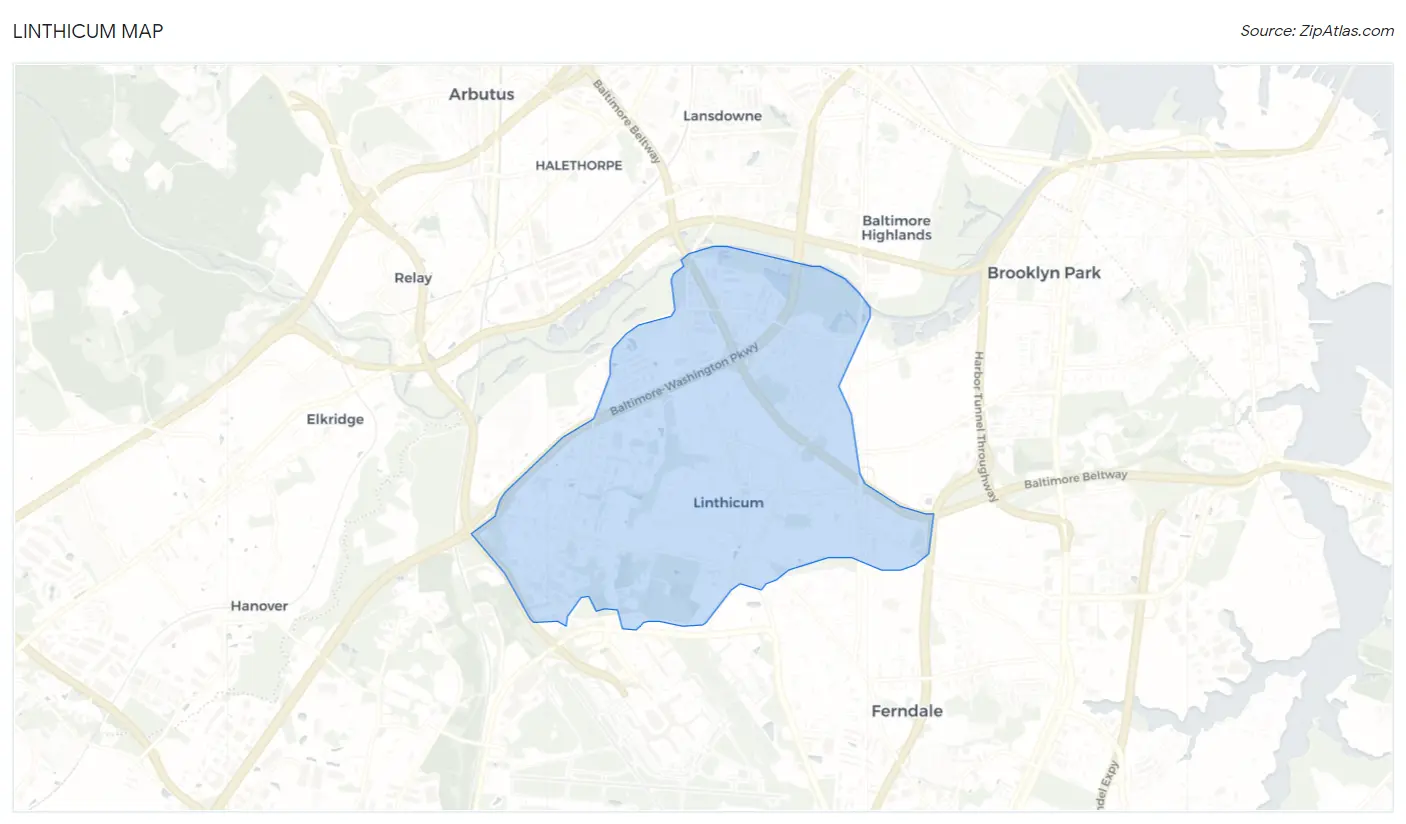
Linthicum Overview
$49,848
PER CAPITA INCOME
$132,746
AVG FAMILY INCOME
$116,250
AVG HOUSEHOLD INCOME
31.2%
WAGE / INCOME GAP [ % ]
68.8¢/ $1
WAGE / INCOME GAP [ $ ]
0.32
INEQUALITY / GINI INDEX
10,731
TOTAL POPULATION
5,455
MALE POPULATION
5,276
FEMALE POPULATION
103.39
MALES / 100 FEMALES
96.72
FEMALES / 100 MALES
38.6
MEDIAN AGE
3.1
AVG FAMILY SIZE
2.6
AVG HOUSEHOLD SIZE
5,949
LABOR FORCE [ PEOPLE ]
69.9%
PERCENT IN LABOR FORCE
2.4%
UNEMPLOYMENT RATE
Income in Linthicum
Income Overview in Linthicum
Per Capita Income in Linthicum is $49,848, while median incomes of families and households are $132,746 and $116,250 respectively.
| Characteristic | Number | Measure |
| Per Capita Income | 10,731 | $49,848 |
| Median Family Income | 2,814 | $132,746 |
| Mean Family Income | 2,814 | $141,621 |
| Median Household Income | 4,111 | $116,250 |
| Mean Household Income | 4,111 | $128,037 |
| Income Deficit | 2,814 | $0 |
| Wage / Income Gap (%) | 10,731 | 31.19% |
| Wage / Income Gap ($) | 10,731 | 68.81¢ per $1 |
| Gini / Inequality Index | 10,731 | 0.32 |
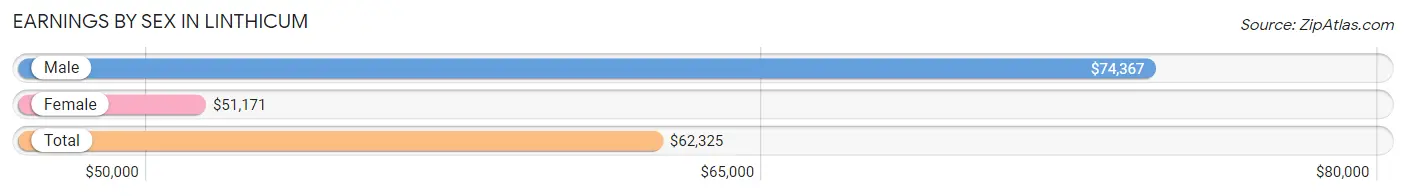
Earnings by Sex in Linthicum
Average Earnings in Linthicum are $62,325, $74,367 for men and $51,171 for women, a difference of 31.2%.
| Sex | Number | Average Earnings |
| Male | 3,406 (55.9%) | $74,367 |
| Female | 2,685 (44.1%) | $51,171 |
| Total | 6,091 (100.0%) | $62,325 |
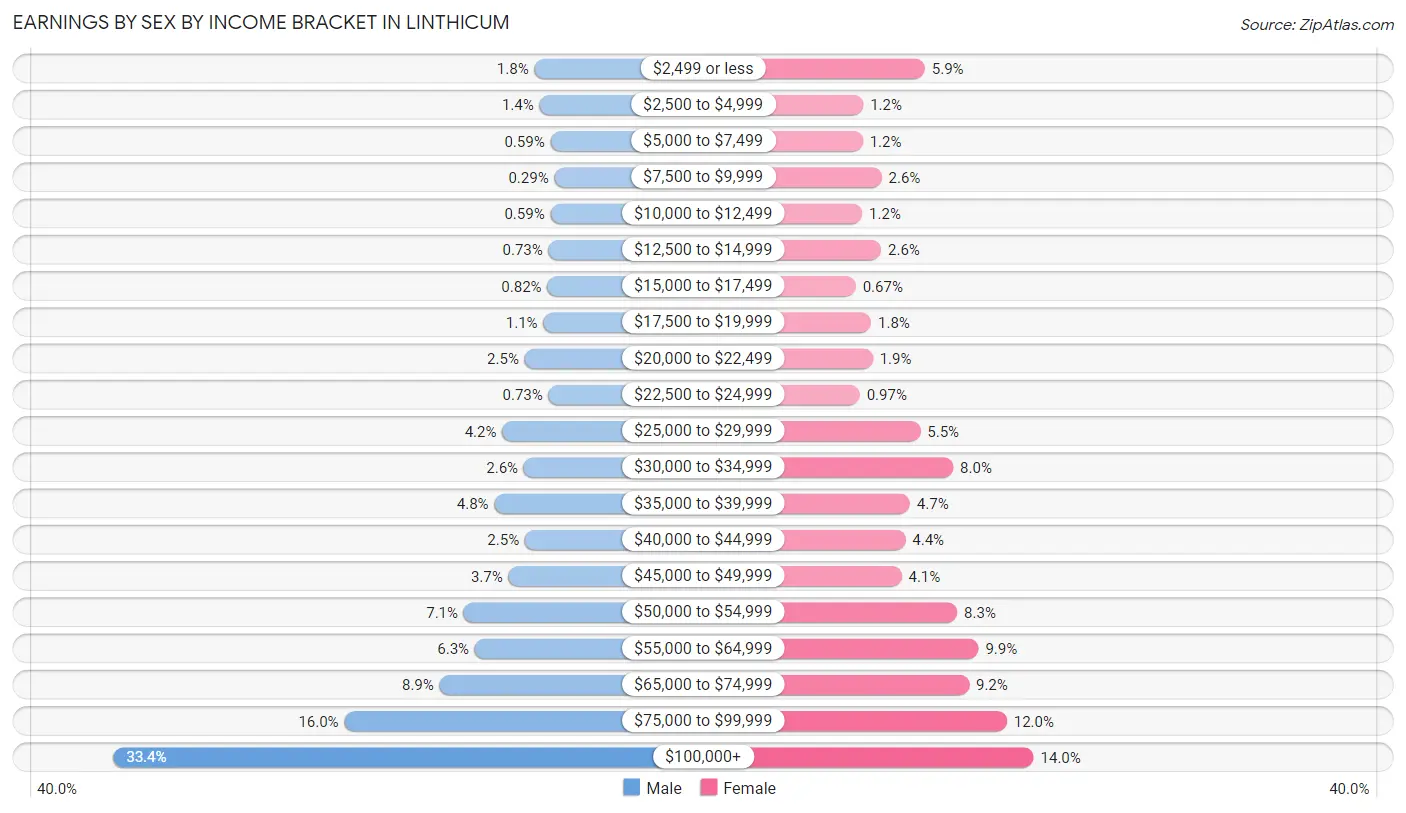
Earnings by Sex by Income Bracket in Linthicum
The most common earnings brackets in Linthicum are $100,000+ for men (1,136 | 33.4%) and $100,000+ for women (376 | 14.0%).
| Income | Male | Female |
| $2,499 or less | 61 (1.8%) | 157 (5.9%) |
| $2,500 to $4,999 | 48 (1.4%) | 33 (1.2%) |
| $5,000 to $7,499 | 20 (0.6%) | 32 (1.2%) |
| $7,500 to $9,999 | 10 (0.3%) | 70 (2.6%) |
| $10,000 to $12,499 | 20 (0.6%) | 31 (1.1%) |
| $12,500 to $14,999 | 25 (0.7%) | 69 (2.6%) |
| $15,000 to $17,499 | 28 (0.8%) | 18 (0.7%) |
| $17,500 to $19,999 | 38 (1.1%) | 49 (1.8%) |
| $20,000 to $22,499 | 86 (2.5%) | 52 (1.9%) |
| $22,500 to $24,999 | 25 (0.7%) | 26 (1.0%) |
| $25,000 to $29,999 | 143 (4.2%) | 148 (5.5%) |
| $30,000 to $34,999 | 88 (2.6%) | 214 (8.0%) |
| $35,000 to $39,999 | 163 (4.8%) | 127 (4.7%) |
| $40,000 to $44,999 | 85 (2.5%) | 118 (4.4%) |
| $45,000 to $49,999 | 127 (3.7%) | 110 (4.1%) |
| $50,000 to $54,999 | 241 (7.1%) | 222 (8.3%) |
| $55,000 to $64,999 | 213 (6.2%) | 265 (9.9%) |
| $65,000 to $74,999 | 303 (8.9%) | 246 (9.2%) |
| $75,000 to $99,999 | 546 (16.0%) | 322 (12.0%) |
| $100,000+ | 1,136 (33.4%) | 376 (14.0%) |
| Total | 3,406 (100.0%) | 2,685 (100.0%) |
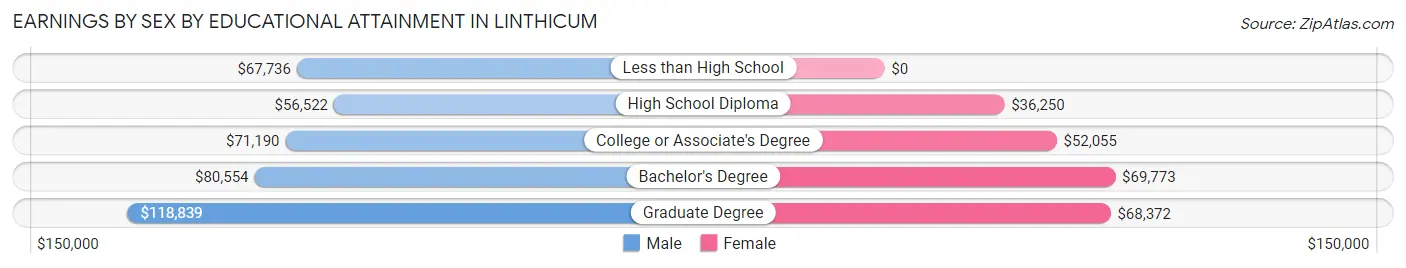
Earnings by Sex by Educational Attainment in Linthicum
Average earnings in Linthicum are $81,197 for men and $53,712 for women, a difference of 33.9%. Men with an educational attainment of graduate degree enjoy the highest average annual earnings of $118,839, while those with high school diploma education earn the least with $56,522. Women with an educational attainment of bachelor's degree earn the most with the average annual earnings of $69,773, while those with high school diploma education have the smallest earnings of $36,250.
| Educational Attainment | Male Income | Female Income |
| Less than High School | $67,736 | $0 |
| High School Diploma | $56,522 | $36,250 |
| College or Associate's Degree | $71,190 | $52,055 |
| Bachelor's Degree | $80,554 | $69,773 |
| Graduate Degree | $118,839 | $68,372 |
| Total | $81,197 | $53,712 |
Family Income in Linthicum
Family Income Brackets in Linthicum
According to the Linthicum family income data, there are 903 families falling into the $100,000 to $149,999 income range, which is the most common income bracket and makes up 32.1% of all families.
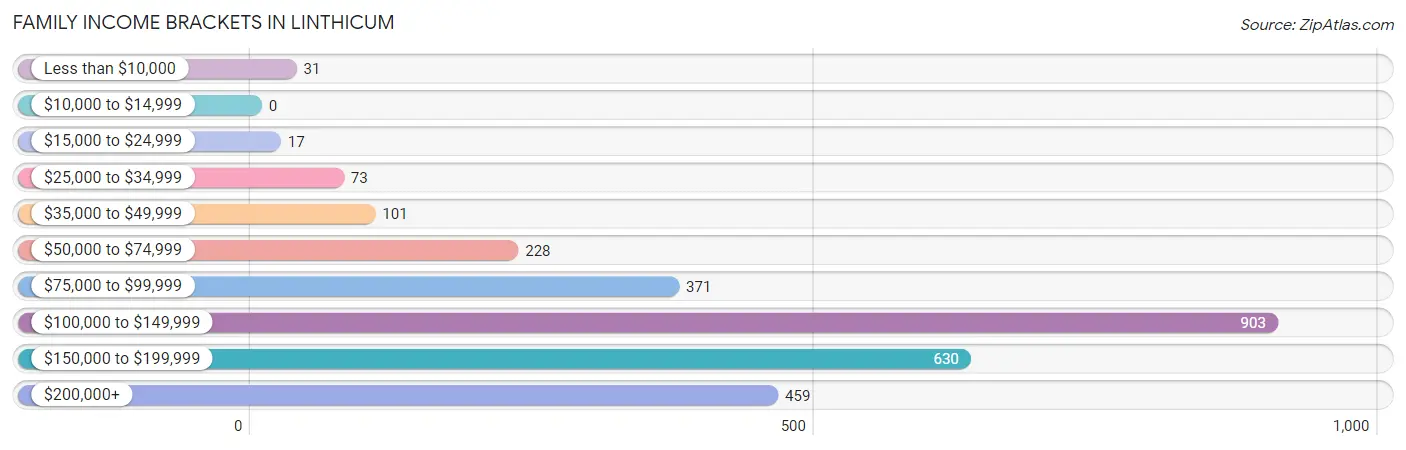
| Income Bracket | # Families | % Families |
| Less than $10,000 | 31 | 1.1% |
| $10,000 to $14,999 | 0 | 0.0% |
| $15,000 to $24,999 | 17 | 0.6% |
| $25,000 to $34,999 | 73 | 2.6% |
| $35,000 to $49,999 | 101 | 3.6% |
| $50,000 to $74,999 | 228 | 8.1% |
| $75,000 to $99,999 | 371 | 13.2% |
| $100,000 to $149,999 | 903 | 32.1% |
| $150,000 to $199,999 | 630 | 22.4% |
| $200,000+ | 459 | 16.3% |
Family Income by Famaliy Size in Linthicum
4-person families (486 | 17.3%) account for the highest median family income in Linthicum with $160,156 per family, while 2-person families (1,395 | 49.6%) have the highest median income of $56,467 per family member.
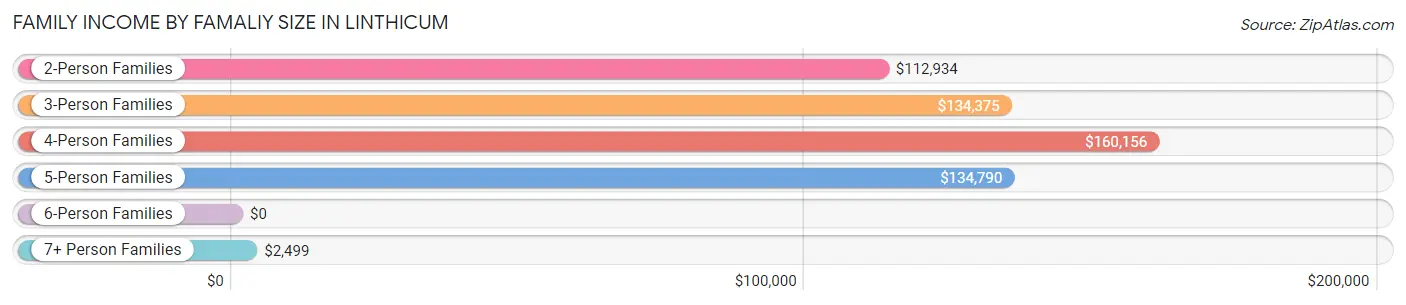
| Income Bracket | # Families | Median Income |
| 2-Person Families | 1,395 (49.6%) | $112,934 |
| 3-Person Families | 506 (18.0%) | $134,375 |
| 4-Person Families | 486 (17.3%) | $160,156 |
| 5-Person Families | 338 (12.0%) | $134,790 |
| 6-Person Families | 52 (1.8%) | $0 |
| 7+ Person Families | 37 (1.3%) | $2,499 |
| Total | 2,814 (100.0%) | $132,746 |
Family Income by Number of Earners in Linthicum
The median family income in Linthicum is $132,746, with families comprising 3+ earners (223) having the highest median family income of $163,542, while families with no earners (419) have the lowest median family income of $76,094, accounting for 7.9% and 14.9% of families, respectively.
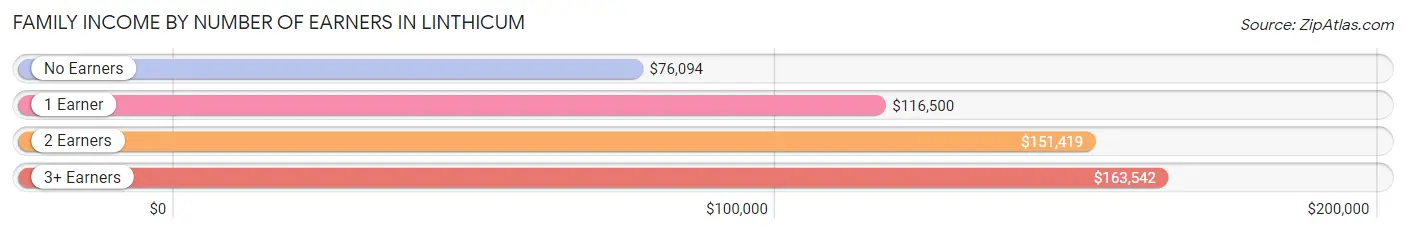
| Number of Earners | # Families | Median Income |
| No Earners | 419 (14.9%) | $76,094 |
| 1 Earner | 698 (24.8%) | $116,500 |
| 2 Earners | 1,474 (52.4%) | $151,419 |
| 3+ Earners | 223 (7.9%) | $163,542 |
| Total | 2,814 (100.0%) | $132,746 |
Household Income in Linthicum
Household Income Brackets in Linthicum
With 1,217 households falling in the category, the $100,000 to $149,999 income range is the most frequent in Linthicum, accounting for 29.6% of all households. In contrast, only 16 households (0.4%) fall into the $10,000 to $14,999 income bracket, making it the least populous group.
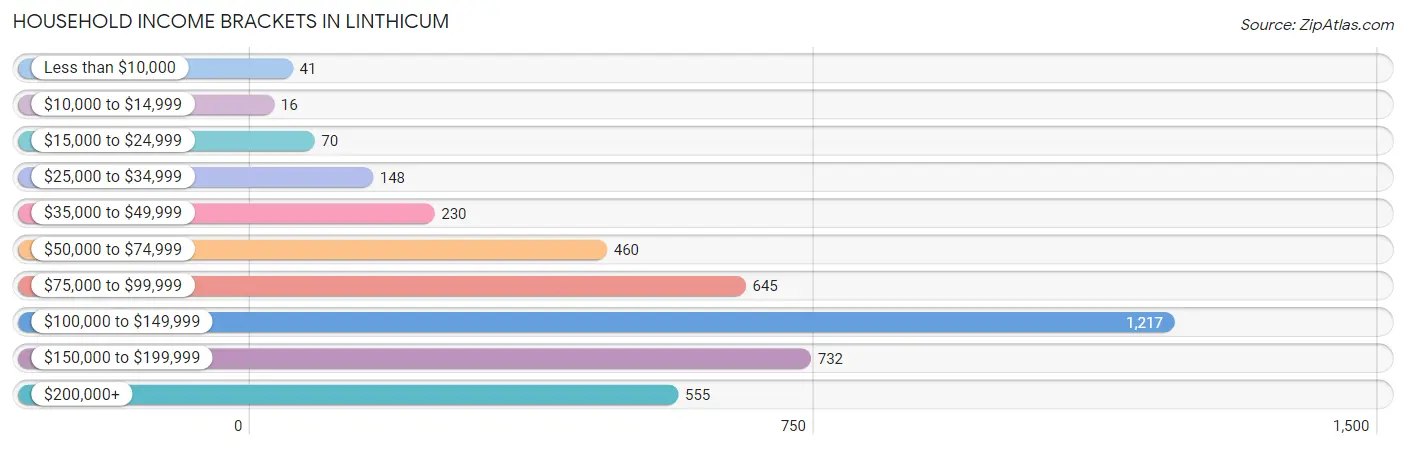
| Income Bracket | # Households | % Households |
| Less than $10,000 | 41 | 1.0% |
| $10,000 to $14,999 | 16 | 0.4% |
| $15,000 to $24,999 | 70 | 1.7% |
| $25,000 to $34,999 | 148 | 3.6% |
| $35,000 to $49,999 | 230 | 5.6% |
| $50,000 to $74,999 | 460 | 11.2% |
| $75,000 to $99,999 | 645 | 15.7% |
| $100,000 to $149,999 | 1,217 | 29.6% |
| $150,000 to $199,999 | 732 | 17.8% |
| $200,000+ | 555 | 13.5% |
Household Income by Householder Age in Linthicum
The median household income in Linthicum is $116,250, with the highest median household income of $149,135 found in the 45 to 64 years age bracket for the primary householder. A total of 1,390 households (33.8%) fall into this category. Meanwhile, the 15 to 24 years age bracket for the primary householder has the lowest median household income of $76,071, with 96 households (2.3%) in this group.
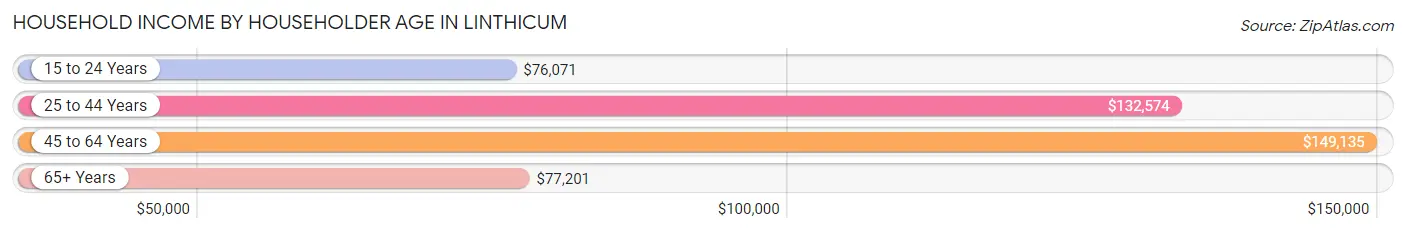
| Income Bracket | # Households | Median Income |
| 15 to 24 Years | 96 (2.3%) | $76,071 |
| 25 to 44 Years | 1,438 (35.0%) | $132,574 |
| 45 to 64 Years | 1,390 (33.8%) | $149,135 |
| 65+ Years | 1,187 (28.9%) | $77,201 |
| Total | 4,111 (100.0%) | $116,250 |
Poverty in Linthicum
Income Below Poverty by Sex and Age in Linthicum
With 3.4% poverty level for males and 5.1% for females among the residents of Linthicum, 5 year old males and 12 to 14 year old females are the most vulnerable to poverty, with 24 males (37.5%) and 46 females (31.7%) in their respective age groups living below the poverty level.
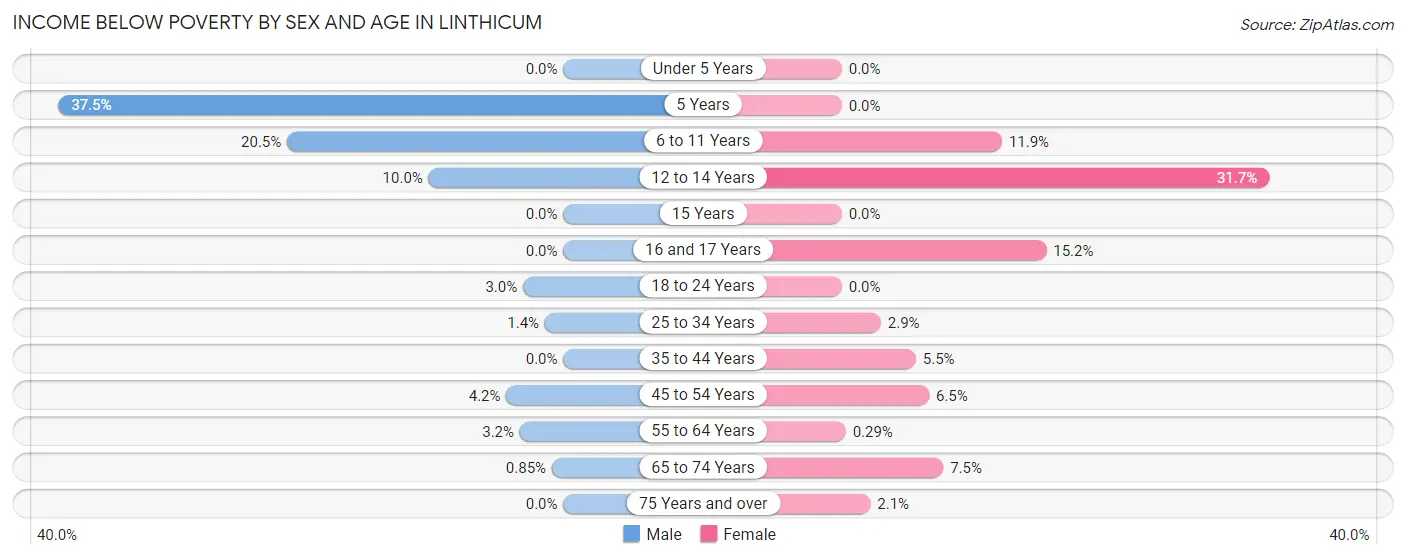
| Age Bracket | Male | Female |
| Under 5 Years | 0 (0.0%) | 0 (0.0%) |
| 5 Years | 24 (37.5%) | 0 (0.0%) |
| 6 to 11 Years | 72 (20.5%) | 44 (11.9%) |
| 12 to 14 Years | 16 (10.0%) | 46 (31.7%) |
| 15 Years | 0 (0.0%) | 0 (0.0%) |
| 16 and 17 Years | 0 (0.0%) | 17 (15.2%) |
| 18 to 24 Years | 11 (3.0%) | 0 (0.0%) |
| 25 to 34 Years | 13 (1.4%) | 24 (2.9%) |
| 35 to 44 Years | 0 (0.0%) | 29 (5.5%) |
| 45 to 54 Years | 28 (4.2%) | 43 (6.5%) |
| 55 to 64 Years | 20 (3.2%) | 2 (0.3%) |
| 65 to 74 Years | 3 (0.9%) | 51 (7.5%) |
| 75 Years and over | 0 (0.0%) | 9 (2.1%) |
| Total | 187 (3.4%) | 265 (5.1%) |
Income Above Poverty by Sex and Age in Linthicum
According to the poverty statistics in Linthicum, males aged under 5 years and females aged under 5 years are the age groups that are most secure financially, with 100.0% of males and 100.0% of females in these age groups living above the poverty line.
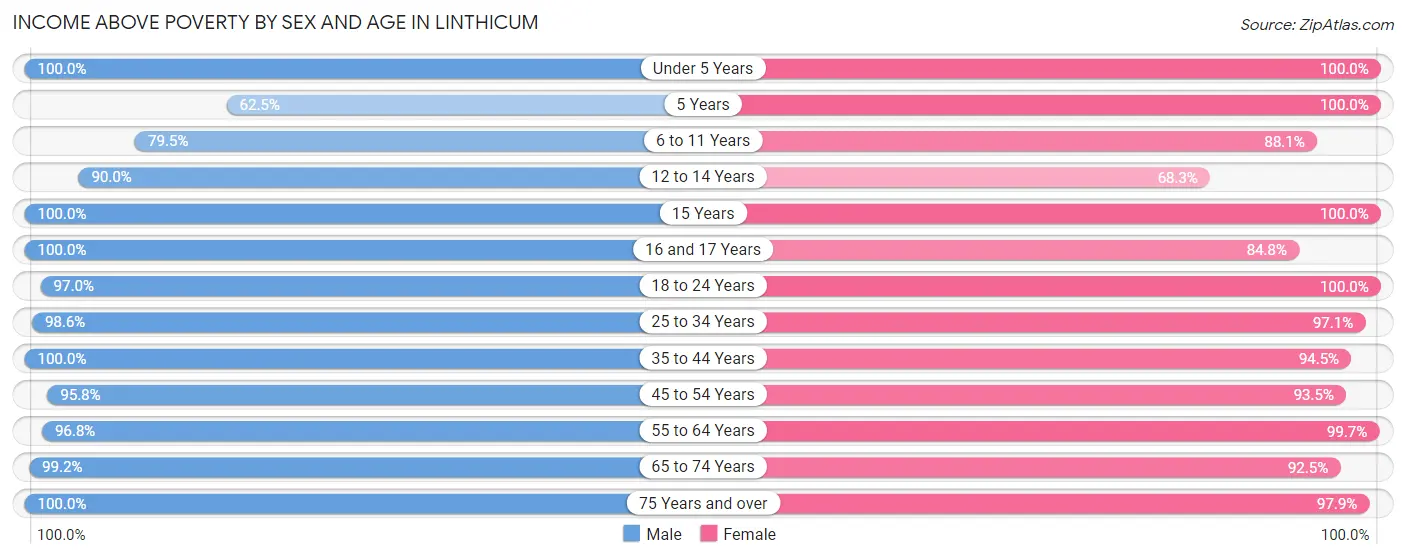
| Age Bracket | Male | Female |
| Under 5 Years | 365 (100.0%) | 329 (100.0%) |
| 5 Years | 40 (62.5%) | 58 (100.0%) |
| 6 to 11 Years | 279 (79.5%) | 326 (88.1%) |
| 12 to 14 Years | 144 (90.0%) | 99 (68.3%) |
| 15 Years | 159 (100.0%) | 166 (100.0%) |
| 16 and 17 Years | 100 (100.0%) | 95 (84.8%) |
| 18 to 24 Years | 357 (97.0%) | 220 (100.0%) |
| 25 to 34 Years | 939 (98.6%) | 805 (97.1%) |
| 35 to 44 Years | 888 (100.0%) | 498 (94.5%) |
| 45 to 54 Years | 634 (95.8%) | 622 (93.5%) |
| 55 to 64 Years | 599 (96.8%) | 687 (99.7%) |
| 65 to 74 Years | 348 (99.2%) | 626 (92.5%) |
| 75 Years and over | 398 (100.0%) | 416 (97.9%) |
| Total | 5,250 (96.6%) | 4,947 (94.9%) |
Income Below Poverty Among Married-Couple Families in Linthicum
The poverty statistics for married-couple families in Linthicum show that 1.0% or 22 of the total 2,238 families live below the poverty line. Families with 3 or 4 children have the highest poverty rate of 7.2%, comprising of 22 families. On the other hand, families with no children have the lowest poverty rate of 0.0%, which includes 0 families.
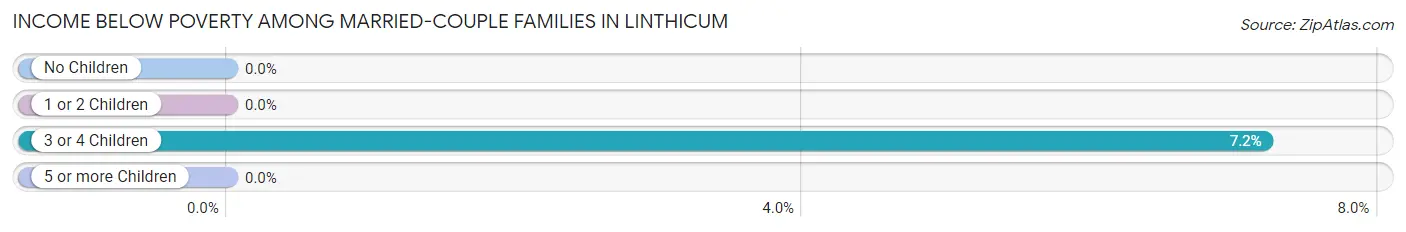
| Children | Above Poverty | Below Poverty |
| No Children | 1,300 (100.0%) | 0 (0.0%) |
| 1 or 2 Children | 633 (100.0%) | 0 (0.0%) |
| 3 or 4 Children | 283 (92.8%) | 22 (7.2%) |
| 5 or more Children | 0 (0.0%) | 0 (0.0%) |
| Total | 2,216 (99.0%) | 22 (1.0%) |
Income Below Poverty Among Single-Parent Households in Linthicum
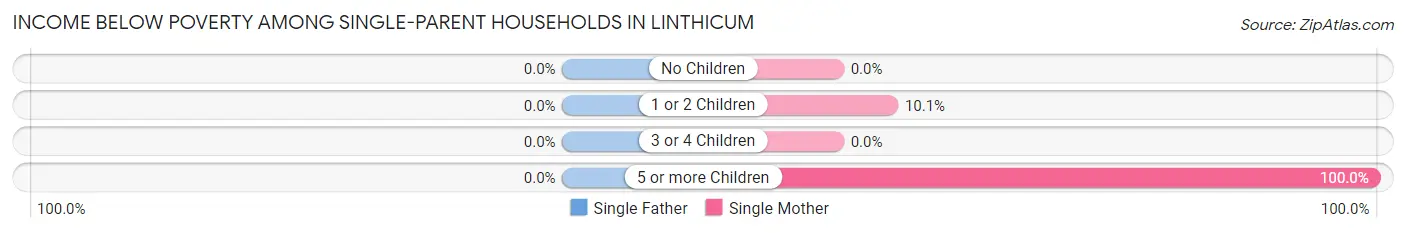
| Children | Single Father | Single Mother |
| No Children | 0 (0.0%) | 0 (0.0%) |
| 1 or 2 Children | 0 (0.0%) | 9 (10.1%) |
| 3 or 4 Children | 0 (0.0%) | 0 (0.0%) |
| 5 or more Children | 0 (0.0%) | 23 (100.0%) |
| Total | 0 (0.0%) | 32 (7.0%) |
Income Below Poverty Among Married-Couple vs Single-Parent Households in Linthicum
The poverty data for Linthicum shows that 22 of the married-couple family households (1.0%) and 32 of the single-parent households (5.6%) are living below the poverty level. Within the married-couple family households, those with 3 or 4 children have the highest poverty rate, with 22 households (7.2%) falling below the poverty line. Among the single-parent households, those with 5 or more children have the highest poverty rate, with 23 household (100.0%) living below poverty.
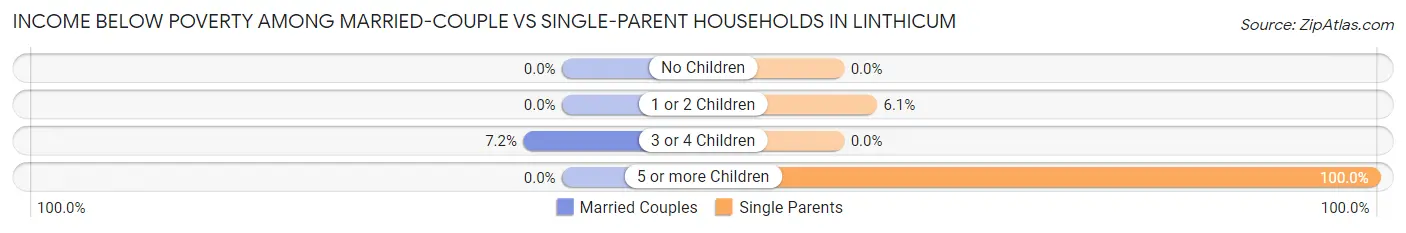
| Children | Married-Couple Families | Single-Parent Households |
| No Children | 0 (0.0%) | 0 (0.0%) |
| 1 or 2 Children | 0 (0.0%) | 9 (6.1%) |
| 3 or 4 Children | 22 (7.2%) | 0 (0.0%) |
| 5 or more Children | 0 (0.0%) | 23 (100.0%) |
| Total | 22 (1.0%) | 32 (5.6%) |
Race in Linthicum
The most populous races in Linthicum are White / Caucasian (8,988 | 83.8%), Black / African American (656 | 6.1%), and Asian (520 | 4.9%).
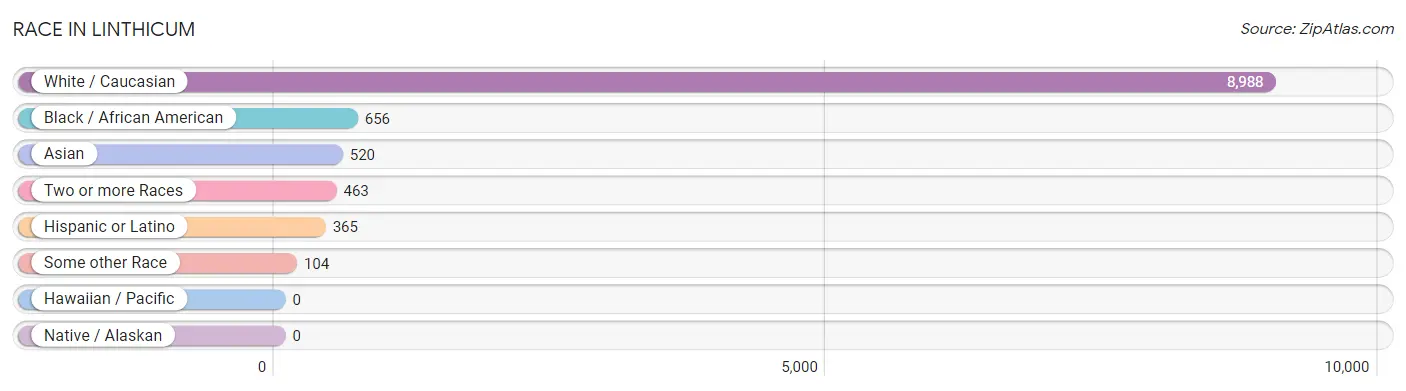
| Race | # Population | % Population |
| Asian | 520 | 4.9% |
| Black / African American | 656 | 6.1% |
| Hawaiian / Pacific | 0 | 0.0% |
| Hispanic or Latino | 365 | 3.4% |
| Native / Alaskan | 0 | 0.0% |
| White / Caucasian | 8,988 | 83.8% |
| Two or more Races | 463 | 4.3% |
| Some other Race | 104 | 1.0% |
| Total | 10,731 | 100.0% |
Ancestry in Linthicum
The most populous ancestries reported in Linthicum are German (2,501 | 23.3%), Irish (1,980 | 18.4%), English (1,502 | 14.0%), Italian (1,227 | 11.4%), and Polish (540 | 5.0%), together accounting for 72.2% of all Linthicum residents.
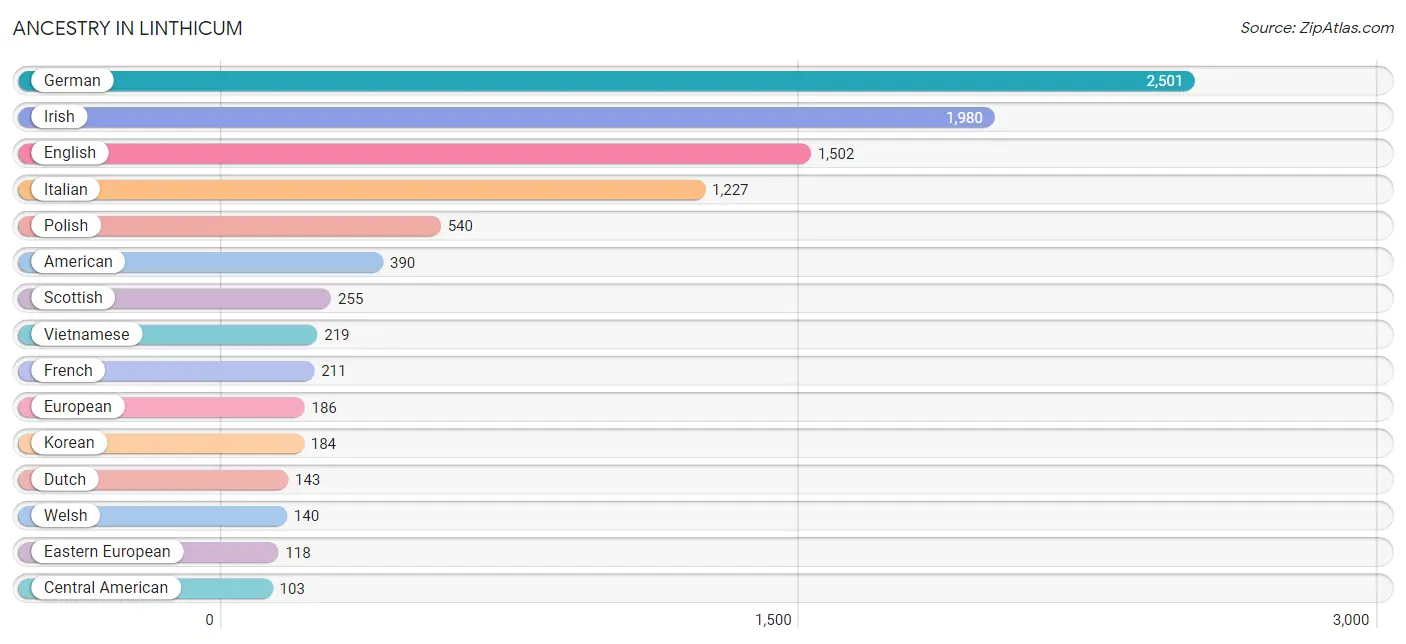
| Ancestry | # Population | % Population |
| African | 17 | 0.2% |
| American | 390 | 3.6% |
| Arab | 11 | 0.1% |
| Argentinean | 11 | 0.1% |
| Belgian | 19 | 0.2% |
| Bhutanese | 31 | 0.3% |
| Bolivian | 7 | 0.1% |
| Brazilian | 12 | 0.1% |
| British | 59 | 0.5% |
| Burmese | 80 | 0.7% |
| Canadian | 9 | 0.1% |
| Central American | 103 | 1.0% |
| Central American Indian | 7 | 0.1% |
| Cherokee | 22 | 0.2% |
| Cuban | 56 | 0.5% |
| Czech | 38 | 0.4% |
| Danish | 27 | 0.3% |
| Dutch | 143 | 1.3% |
| Eastern European | 118 | 1.1% |
| Egyptian | 11 | 0.1% |
| English | 1,502 | 14.0% |
| European | 186 | 1.7% |
| Filipino | 16 | 0.2% |
| French | 211 | 2.0% |
| French Canadian | 48 | 0.4% |
| German | 2,501 | 23.3% |
| Guatemalan | 64 | 0.6% |
| Honduran | 39 | 0.4% |
| Hungarian | 86 | 0.8% |
| Indian (Asian) | 31 | 0.3% |
| Irish | 1,980 | 18.4% |
| Italian | 1,227 | 11.4% |
| Korean | 184 | 1.7% |
| Lithuanian | 43 | 0.4% |
| Mexican | 74 | 0.7% |
| Nigerian | 9 | 0.1% |
| Northern European | 19 | 0.2% |
| Norwegian | 33 | 0.3% |
| Pakistani | 15 | 0.1% |
| Polish | 540 | 5.0% |
| Portuguese | 17 | 0.2% |
| Puerto Rican | 84 | 0.8% |
| Russian | 36 | 0.3% |
| Scandinavian | 4 | 0.0% |
| Scotch-Irish | 93 | 0.9% |
| Scottish | 255 | 2.4% |
| Slovak | 6 | 0.1% |
| South American | 18 | 0.2% |
| Spanish | 30 | 0.3% |
| Sri Lankan | 27 | 0.3% |
| Subsaharan African | 26 | 0.2% |
| Swedish | 67 | 0.6% |
| Swiss | 12 | 0.1% |
| Thai | 76 | 0.7% |
| Ukrainian | 49 | 0.5% |
| Vietnamese | 219 | 2.0% |
| Welsh | 140 | 1.3% |
| Yugoslavian | 2 | 0.0% | View All 58 Rows |
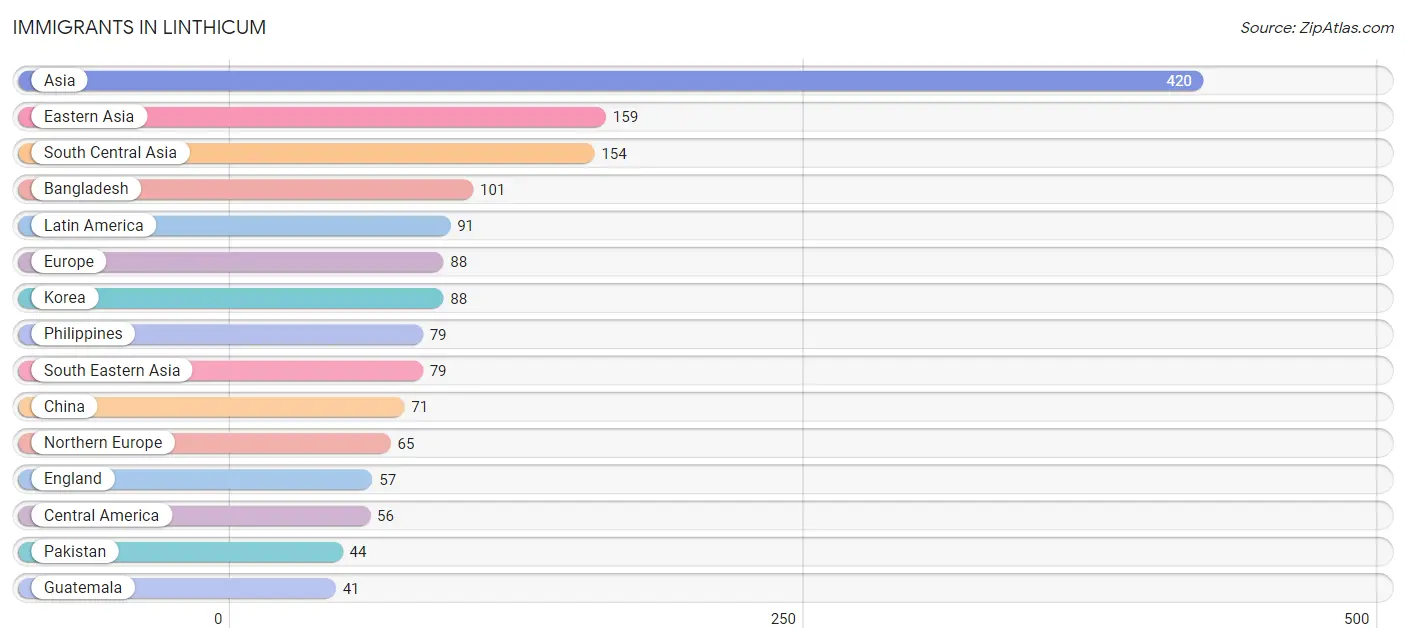
Immigrants in Linthicum
The most numerous immigrant groups reported in Linthicum came from Asia (420 | 3.9%), Eastern Asia (159 | 1.5%), South Central Asia (154 | 1.4%), Bangladesh (101 | 0.9%), and Latin America (91 | 0.9%), together accounting for 8.6% of all Linthicum residents.
| Immigration Origin | # Population | % Population |
| Africa | 26 | 0.2% |
| Argentina | 11 | 0.1% |
| Asia | 420 | 3.9% |
| Australia | 8 | 0.1% |
| Bangladesh | 101 | 0.9% |
| Bolivia | 7 | 0.1% |
| Canada | 11 | 0.1% |
| Caribbean | 17 | 0.2% |
| Central America | 56 | 0.5% |
| China | 71 | 0.7% |
| Dominican Republic | 17 | 0.2% |
| Eastern Africa | 17 | 0.2% |
| Eastern Asia | 159 | 1.5% |
| England | 57 | 0.5% |
| Europe | 88 | 0.8% |
| Germany | 19 | 0.2% |
| Guatemala | 41 | 0.4% |
| Honduras | 15 | 0.1% |
| India | 9 | 0.1% |
| Kenya | 17 | 0.2% |
| Korea | 88 | 0.8% |
| Latin America | 91 | 0.9% |
| Netherlands | 4 | 0.0% |
| Nigeria | 9 | 0.1% |
| Northern Europe | 65 | 0.6% |
| Oceania | 8 | 0.1% |
| Pakistan | 44 | 0.4% |
| Philippines | 79 | 0.7% |
| Scotland | 8 | 0.1% |
| South America | 18 | 0.2% |
| South Central Asia | 154 | 1.4% |
| South Eastern Asia | 79 | 0.7% |
| Taiwan | 16 | 0.2% |
| Western Africa | 9 | 0.1% |
| Western Asia | 28 | 0.3% |
| Western Europe | 23 | 0.2% | View All 36 Rows |
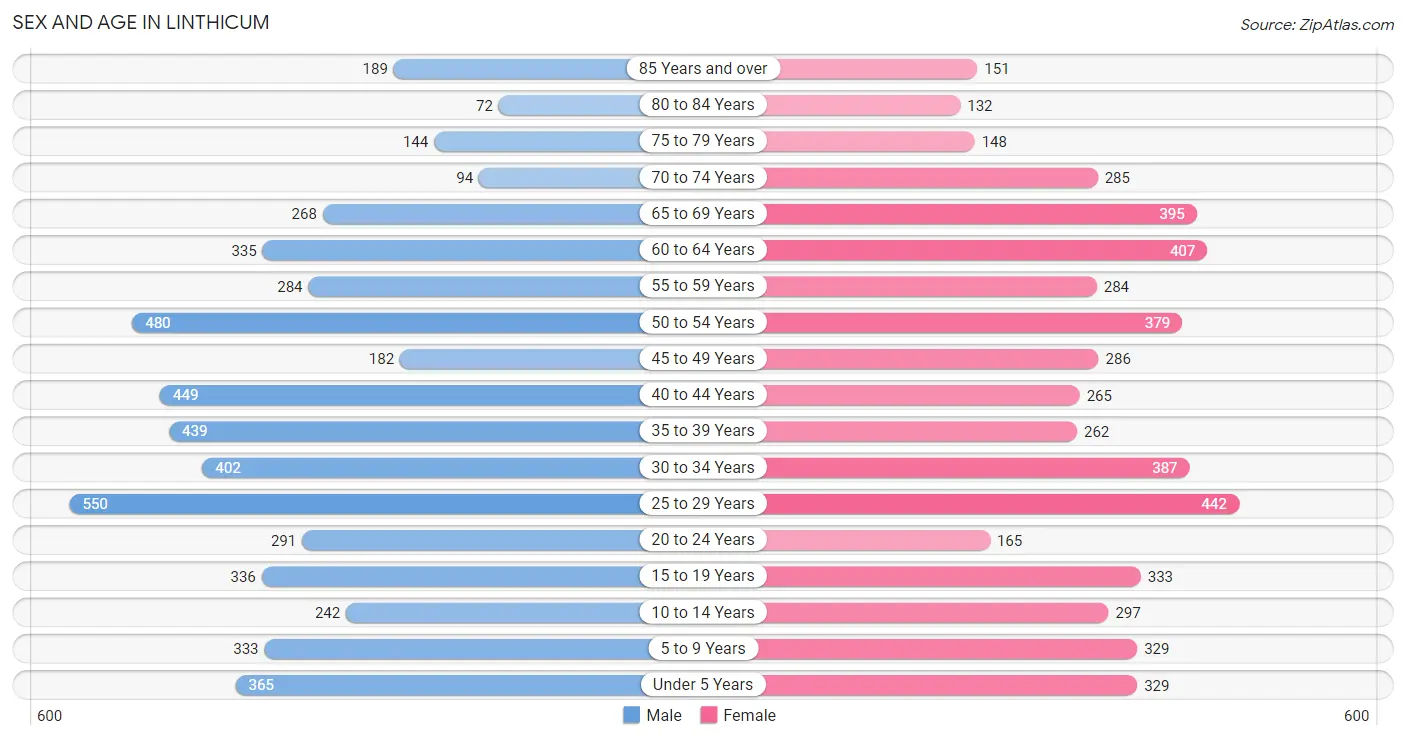
Sex and Age in Linthicum
Sex and Age in Linthicum
The most populous age groups in Linthicum are 25 to 29 Years (550 | 10.1%) for men and 25 to 29 Years (442 | 8.4%) for women.
| Age Bracket | Male | Female |
| Under 5 Years | 365 (6.7%) | 329 (6.2%) |
| 5 to 9 Years | 333 (6.1%) | 329 (6.2%) |
| 10 to 14 Years | 242 (4.4%) | 297 (5.6%) |
| 15 to 19 Years | 336 (6.2%) | 333 (6.3%) |
| 20 to 24 Years | 291 (5.3%) | 165 (3.1%) |
| 25 to 29 Years | 550 (10.1%) | 442 (8.4%) |
| 30 to 34 Years | 402 (7.4%) | 387 (7.3%) |
| 35 to 39 Years | 439 (8.1%) | 262 (5.0%) |
| 40 to 44 Years | 449 (8.2%) | 265 (5.0%) |
| 45 to 49 Years | 182 (3.3%) | 286 (5.4%) |
| 50 to 54 Years | 480 (8.8%) | 379 (7.2%) |
| 55 to 59 Years | 284 (5.2%) | 284 (5.4%) |
| 60 to 64 Years | 335 (6.1%) | 407 (7.7%) |
| 65 to 69 Years | 268 (4.9%) | 395 (7.5%) |
| 70 to 74 Years | 94 (1.7%) | 285 (5.4%) |
| 75 to 79 Years | 144 (2.6%) | 148 (2.8%) |
| 80 to 84 Years | 72 (1.3%) | 132 (2.5%) |
| 85 Years and over | 189 (3.5%) | 151 (2.9%) |
| Total | 5,455 (100.0%) | 5,276 (100.0%) |
Families and Households in Linthicum
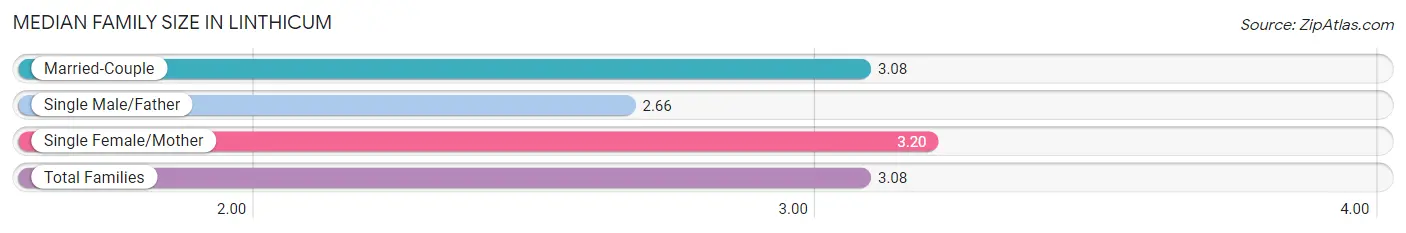
Median Family Size in Linthicum
The median family size in Linthicum is 3.08 persons per family, with single female/mother families (459 | 16.3%) accounting for the largest median family size of 3.2 persons per family. On the other hand, single male/father families (117 | 4.2%) represent the smallest median family size with 2.66 persons per family.
| Family Type | # Families | Family Size |
| Married-Couple | 2,238 (79.5%) | 3.08 |
| Single Male/Father | 117 (4.2%) | 2.66 |
| Single Female/Mother | 459 (16.3%) | 3.20 |
| Total Families | 2,814 (100.0%) | 3.08 |
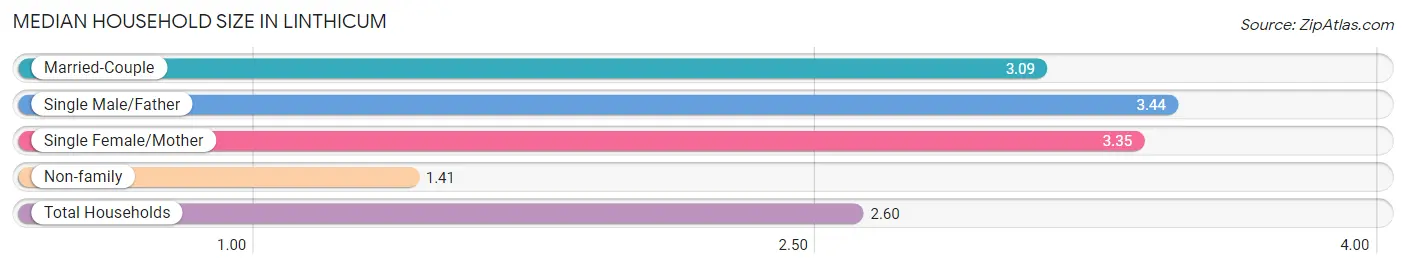
Median Household Size in Linthicum
The median household size in Linthicum is 2.60 persons per household, with single male/father households (117 | 2.9%) accounting for the largest median household size of 3.44 persons per household. non-family households (1,297 | 31.6%) represent the smallest median household size with 1.41 persons per household.
| Household Type | # Households | Household Size |
| Married-Couple | 2,238 (54.4%) | 3.09 |
| Single Male/Father | 117 (2.9%) | 3.44 |
| Single Female/Mother | 459 (11.2%) | 3.35 |
| Non-family | 1,297 (31.6%) | 1.41 |
| Total Households | 4,111 (100.0%) | 2.60 |
Household Size by Marriage Status in Linthicum
Out of a total of 4,111 households in Linthicum, 2,814 (68.4%) are family households, while 1,297 (31.6%) are nonfamily households. The most numerous type of family households are 2-person households, comprising 1,348, and the most common type of nonfamily households are 1-person households, comprising 951.
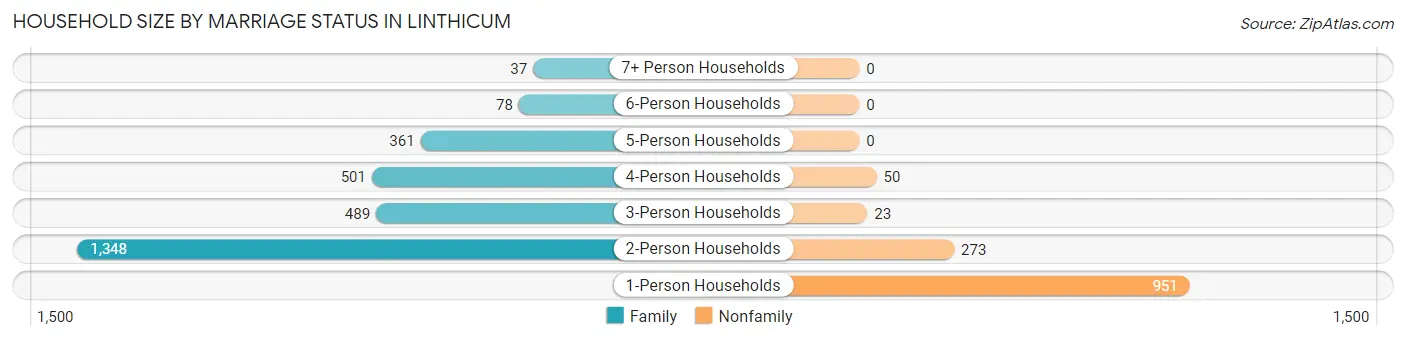
| Household Size | Family Households | Nonfamily Households |
| 1-Person Households | - | 951 (23.1%) |
| 2-Person Households | 1,348 (32.8%) | 273 (6.6%) |
| 3-Person Households | 489 (11.9%) | 23 (0.6%) |
| 4-Person Households | 501 (12.2%) | 50 (1.2%) |
| 5-Person Households | 361 (8.8%) | 0 (0.0%) |
| 6-Person Households | 78 (1.9%) | 0 (0.0%) |
| 7+ Person Households | 37 (0.9%) | 0 (0.0%) |
| Total | 2,814 (68.4%) | 1,297 (31.6%) |
Female Fertility in Linthicum
Fertility by Age in Linthicum
Average fertility rate in Linthicum is 24.0 births per 1,000 women. Women in the age bracket of 20 to 34 years have the highest fertility rate with 56.0 births per 1,000 women. Women in the age bracket of 20 to 34 years acount for 100.0% of all women with births.
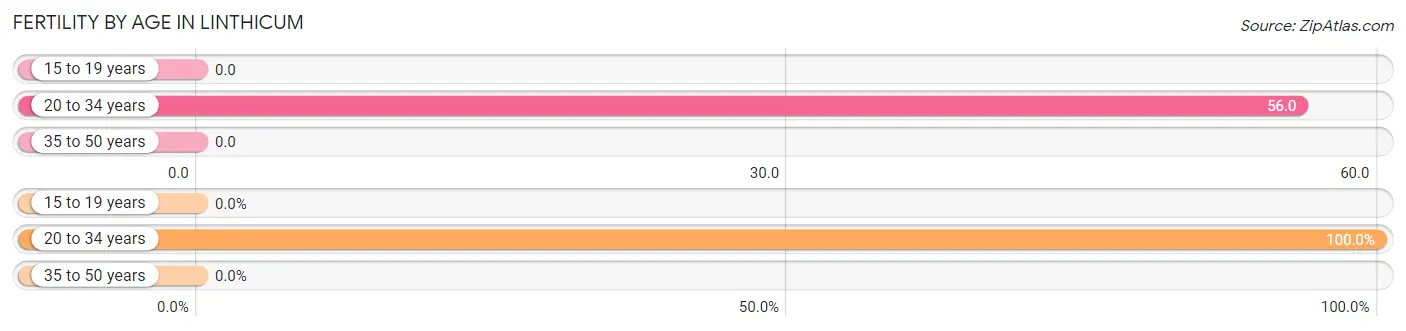
| Age Bracket | Women with Births | Births / 1,000 Women |
| 15 to 19 years | 0 (0.0%) | 0.0 |
| 20 to 34 years | 56 (100.0%) | 56.0 |
| 35 to 50 years | 0 (0.0%) | 0.0 |
| Total | 56 (100.0%) | 24.0 |
Fertility by Age by Marriage Status in Linthicum
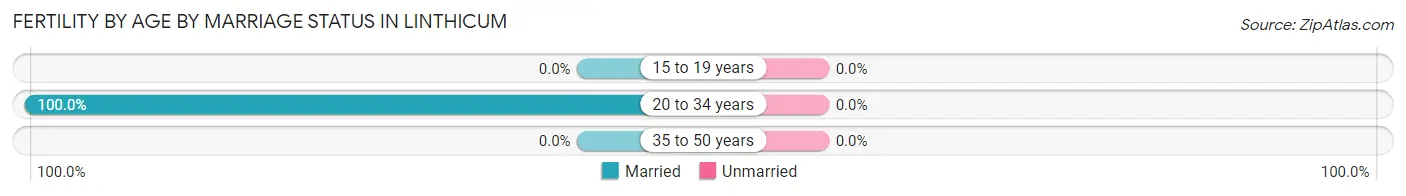
| Age Bracket | Married | Unmarried |
| 15 to 19 years | 0 (0.0%) | 0 (0.0%) |
| 20 to 34 years | 56 (100.0%) | 0 (0.0%) |
| 35 to 50 years | 0 (0.0%) | 0 (0.0%) |
| Total | 56 (100.0%) | 0 (0.0%) |
Fertility by Education in Linthicum
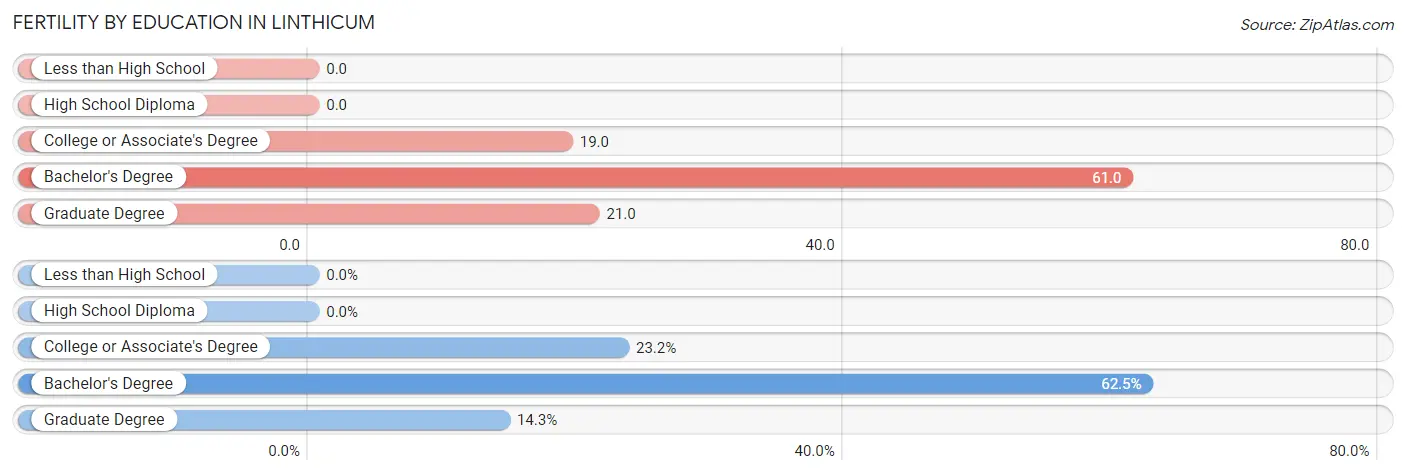
| Educational Attainment | Women with Births | Births / 1,000 Women |
| Less than High School | 0 (0.0%) | 0.0 |
| High School Diploma | 0 (0.0%) | 0.0 |
| College or Associate's Degree | 13 (23.2%) | 19.0 |
| Bachelor's Degree | 35 (62.5%) | 61.0 |
| Graduate Degree | 8 (14.3%) | 21.0 |
| Total | 56 (100.0%) | 24.0 |
Fertility by Education by Marriage Status in Linthicum
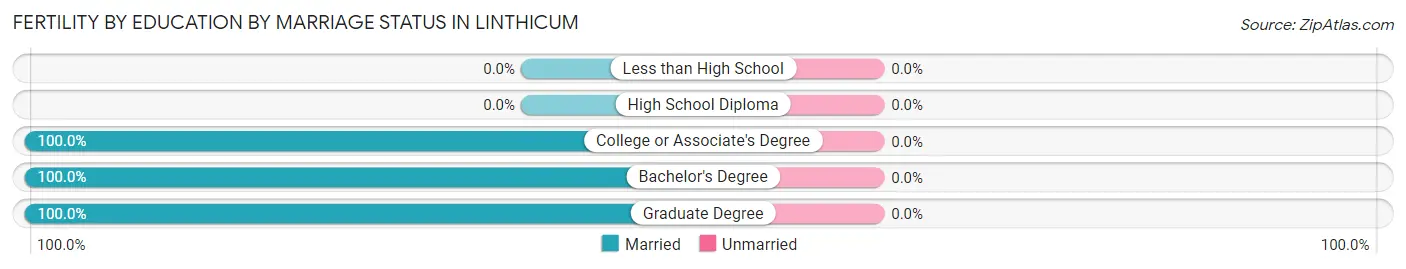
| Educational Attainment | Married | Unmarried |
| Less than High School | 0 (0.0%) | 0 (0.0%) |
| High School Diploma | 0 (0.0%) | 0 (0.0%) |
| College or Associate's Degree | 13 (100.0%) | 0 (0.0%) |
| Bachelor's Degree | 35 (100.0%) | 0 (0.0%) |
| Graduate Degree | 8 (100.0%) | 0 (0.0%) |
| Total | 56 (100.0%) | 0 (0.0%) |
Employment Characteristics in Linthicum
Employment by Class of Employer in Linthicum
Among the 5,773 employed individuals in Linthicum, private company employees (3,787 | 65.6%), federal government employees (591 | 10.2%), and local government employees (430 | 7.4%) make up the most common classes of employment.
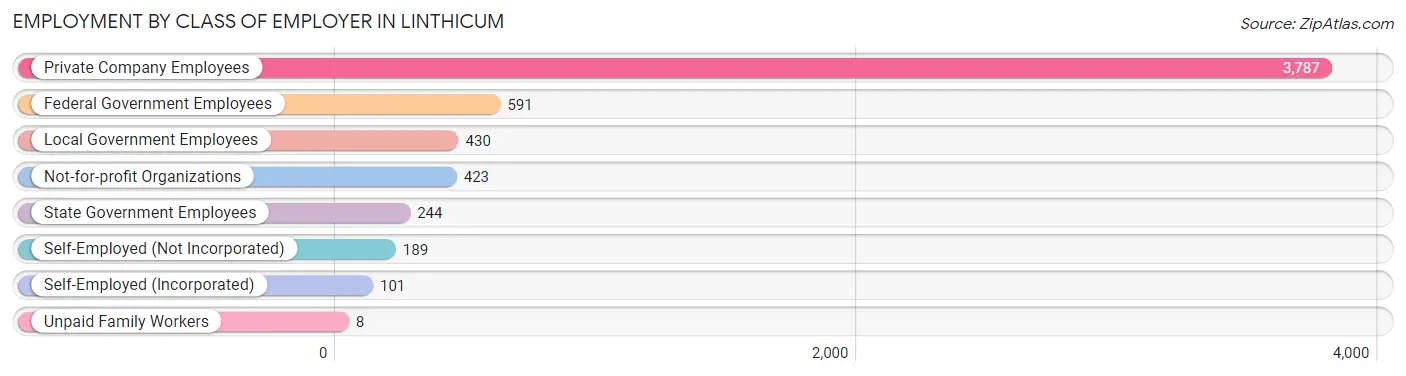
| Employer Class | # Employees | % Employees |
| Private Company Employees | 3,787 | 65.6% |
| Self-Employed (Incorporated) | 101 | 1.8% |
| Self-Employed (Not Incorporated) | 189 | 3.3% |
| Not-for-profit Organizations | 423 | 7.3% |
| Local Government Employees | 430 | 7.4% |
| State Government Employees | 244 | 4.2% |
| Federal Government Employees | 591 | 10.2% |
| Unpaid Family Workers | 8 | 0.1% |
| Total | 5,773 | 100.0% |
Employment Status by Age in Linthicum
According to the labor force statistics for Linthicum, out of the total population over 16 years of age (8,511), 69.9% or 5,949 individuals are in the labor force, with 2.4% or 143 of them unemployed. The age group with the highest labor force participation rate is 30 to 34 years, with 92.8% or 732 individuals in the labor force. Within the labor force, the 20 to 24 years age range has the highest percentage of unemployed individuals, with 7.5% or 31 of them being unemployed.
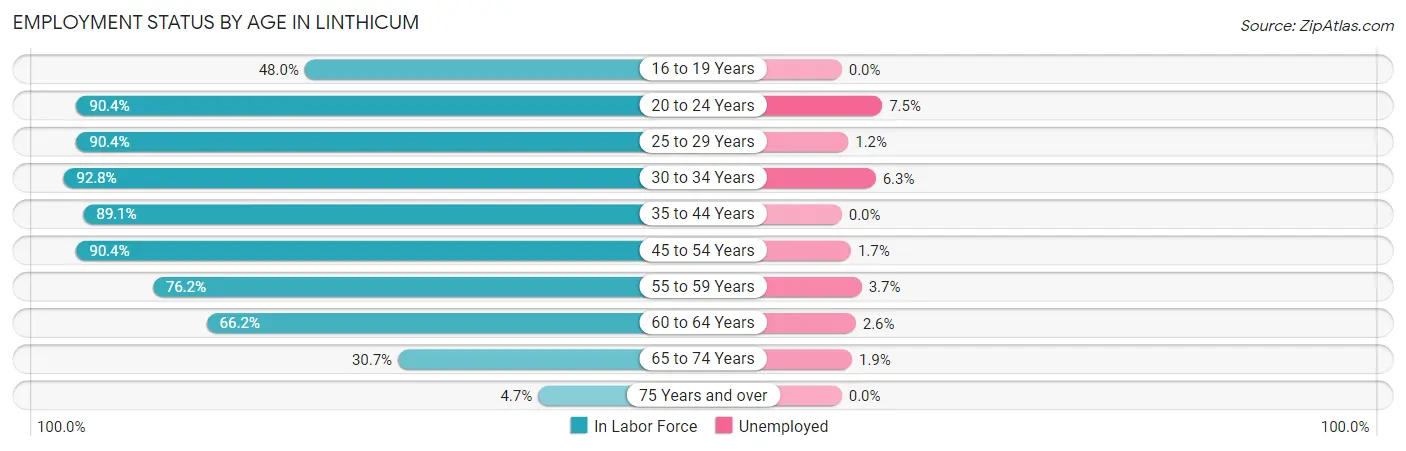
| Age Bracket | In Labor Force | Unemployed |
| 16 to 19 Years | 165 (48.0%) | 0 (0.0%) |
| 20 to 24 Years | 412 (90.4%) | 31 (7.5%) |
| 25 to 29 Years | 897 (90.4%) | 11 (1.2%) |
| 30 to 34 Years | 732 (92.8%) | 46 (6.3%) |
| 35 to 44 Years | 1,261 (89.1%) | 0 (0.0%) |
| 45 to 54 Years | 1,200 (90.4%) | 20 (1.7%) |
| 55 to 59 Years | 433 (76.2%) | 16 (3.7%) |
| 60 to 64 Years | 491 (66.2%) | 13 (2.6%) |
| 65 to 74 Years | 320 (30.7%) | 6 (1.9%) |
| 75 Years and over | 39 (4.7%) | 0 (0.0%) |
| Total | 5,949 (69.9%) | 143 (2.4%) |
Employment Status by Educational Attainment in Linthicum
According to labor force statistics for Linthicum, 86.0% of individuals (5,016) out of the total population between 25 and 64 years of age (5,833) are in the labor force, with 2.1% or 105 of them being unemployed. The group with the highest labor force participation rate are those with the educational attainment of bachelor's degree or higher, with 91.7% or 2,432 individuals in the labor force. Within the labor force, individuals with less than high school education have the highest percentage of unemployment, with 13.2% or 29 of them being unemployed.
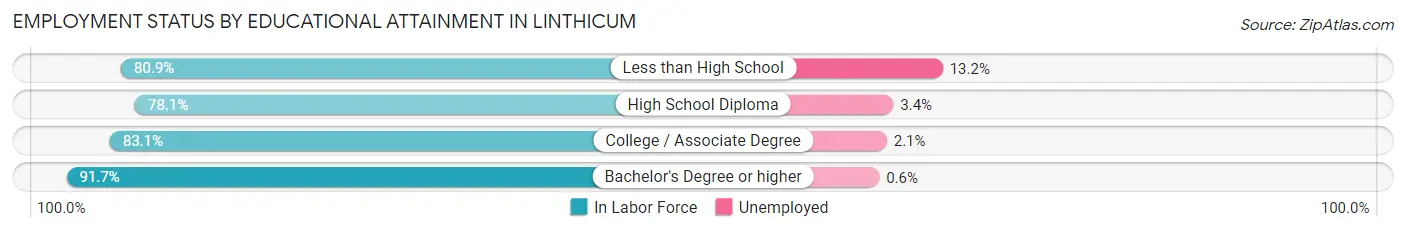
| Educational Attainment | In Labor Force | Unemployed |
| Less than High School | 220 (80.9%) | 36 (13.2%) |
| High School Diploma | 856 (78.1%) | 37 (3.4%) |
| College / Associate Degree | 1,507 (83.1%) | 38 (2.1%) |
| Bachelor's Degree or higher | 2,432 (91.7%) | 16 (0.6%) |
| Total | 5,016 (86.0%) | 122 (2.1%) |
Employment Occupations by Sex in Linthicum
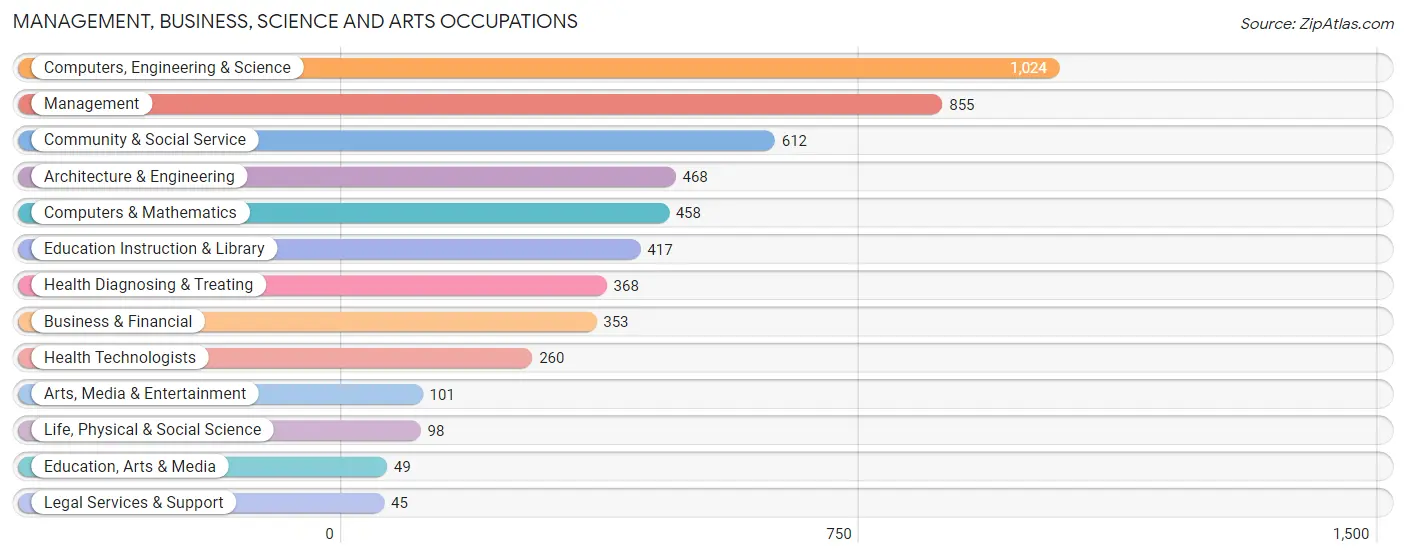
Management, Business, Science and Arts Occupations
The most common Management, Business, Science and Arts occupations in Linthicum are Computers, Engineering & Science (1,024 | 17.8%), Management (855 | 14.9%), Community & Social Service (612 | 10.6%), Architecture & Engineering (468 | 8.1%), and Computers & Mathematics (458 | 8.0%).
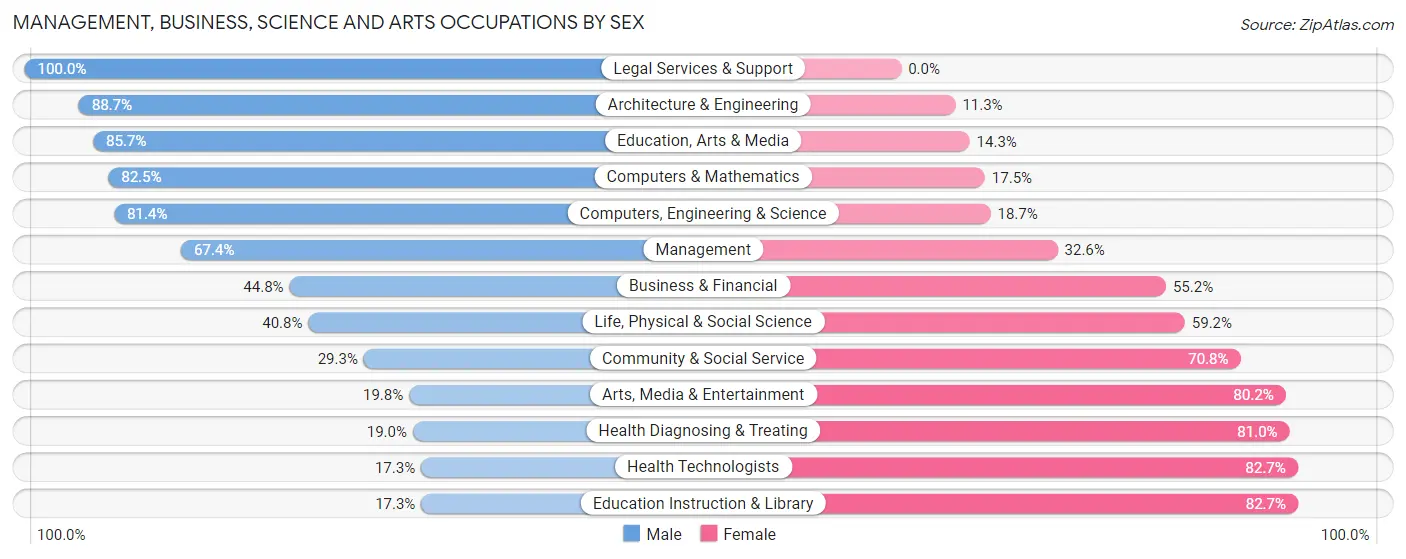
Management, Business, Science and Arts Occupations by Sex
Within the Management, Business, Science and Arts occupations in Linthicum, the most male-oriented occupations are Legal Services & Support (100.0%), Architecture & Engineering (88.7%), and Education, Arts & Media (85.7%), while the most female-oriented occupations are Education Instruction & Library (82.7%), Health Technologists (82.7%), and Health Diagnosing & Treating (81.0%).
| Occupation | Male | Female |
| Management | 576 (67.4%) | 279 (32.6%) |
| Business & Financial | 158 (44.8%) | 195 (55.2%) |
| Computers, Engineering & Science | 833 (81.4%) | 191 (18.6%) |
| Computers & Mathematics | 378 (82.5%) | 80 (17.5%) |
| Architecture & Engineering | 415 (88.7%) | 53 (11.3%) |
| Life, Physical & Social Science | 40 (40.8%) | 58 (59.2%) |
| Community & Social Service | 179 (29.2%) | 433 (70.8%) |
| Education, Arts & Media | 42 (85.7%) | 7 (14.3%) |
| Legal Services & Support | 45 (100.0%) | 0 (0.0%) |
| Education Instruction & Library | 72 (17.3%) | 345 (82.7%) |
| Arts, Media & Entertainment | 20 (19.8%) | 81 (80.2%) |
| Health Diagnosing & Treating | 70 (19.0%) | 298 (81.0%) |
| Health Technologists | 45 (17.3%) | 215 (82.7%) |
| Total (Category) | 1,816 (56.5%) | 1,396 (43.5%) |
| Total (Overall) | 3,256 (56.6%) | 2,493 (43.4%) |
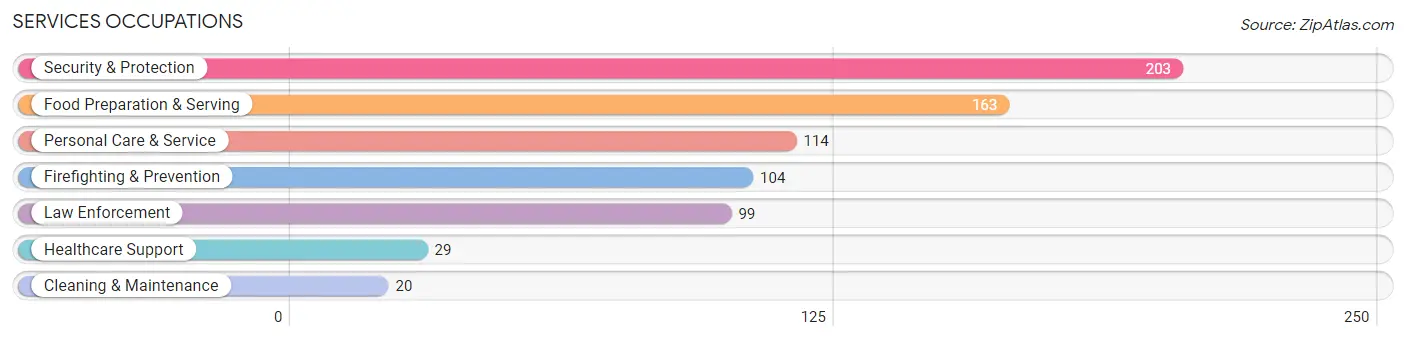
Services Occupations
The most common Services occupations in Linthicum are Security & Protection (203 | 3.5%), Food Preparation & Serving (163 | 2.8%), Personal Care & Service (114 | 2.0%), Firefighting & Prevention (104 | 1.8%), and Law Enforcement (99 | 1.7%).
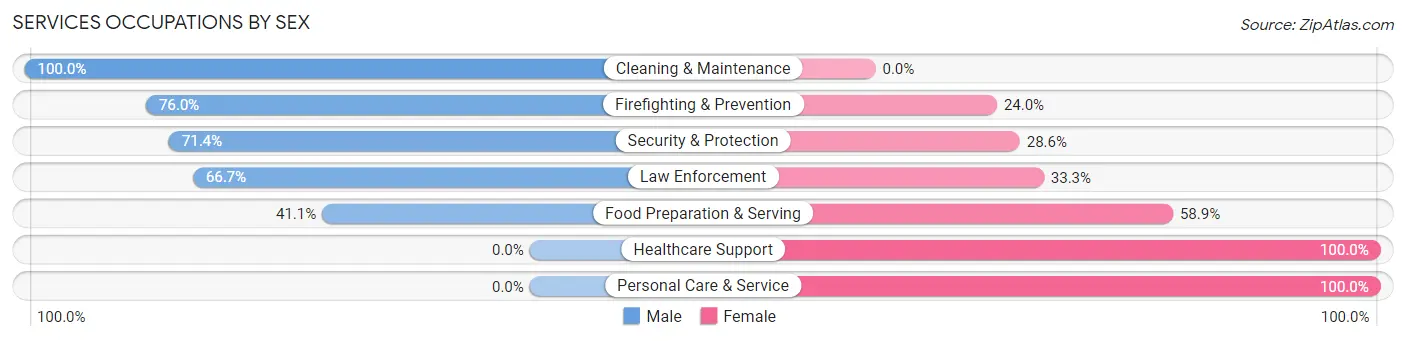
Services Occupations by Sex
Within the Services occupations in Linthicum, the most male-oriented occupations are Cleaning & Maintenance (100.0%), Firefighting & Prevention (76.0%), and Security & Protection (71.4%), while the most female-oriented occupations are Healthcare Support (100.0%), Personal Care & Service (100.0%), and Food Preparation & Serving (58.9%).
| Occupation | Male | Female |
| Healthcare Support | 0 (0.0%) | 29 (100.0%) |
| Security & Protection | 145 (71.4%) | 58 (28.6%) |
| Firefighting & Prevention | 79 (76.0%) | 25 (24.0%) |
| Law Enforcement | 66 (66.7%) | 33 (33.3%) |
| Food Preparation & Serving | 67 (41.1%) | 96 (58.9%) |
| Cleaning & Maintenance | 20 (100.0%) | 0 (0.0%) |
| Personal Care & Service | 0 (0.0%) | 114 (100.0%) |
| Total (Category) | 232 (43.9%) | 297 (56.1%) |
| Total (Overall) | 3,256 (56.6%) | 2,493 (43.4%) |
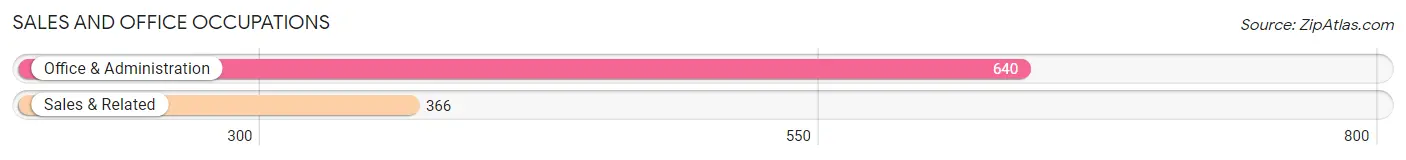
Sales and Office Occupations
The most common Sales and Office occupations in Linthicum are Office & Administration (640 | 11.1%), and Sales & Related (366 | 6.4%).
Sales and Office Occupations by Sex
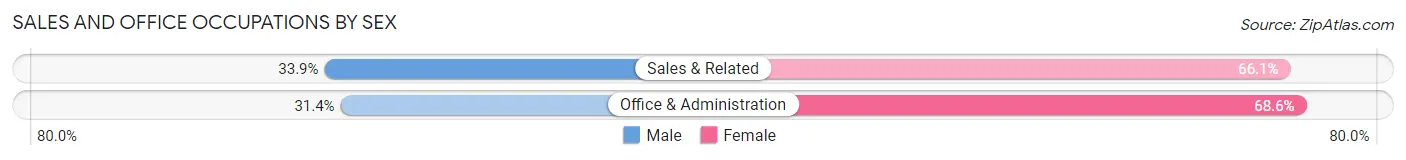
| Occupation | Male | Female |
| Sales & Related | 124 (33.9%) | 242 (66.1%) |
| Office & Administration | 201 (31.4%) | 439 (68.6%) |
| Total (Category) | 325 (32.3%) | 681 (67.7%) |
| Total (Overall) | 3,256 (56.6%) | 2,493 (43.4%) |
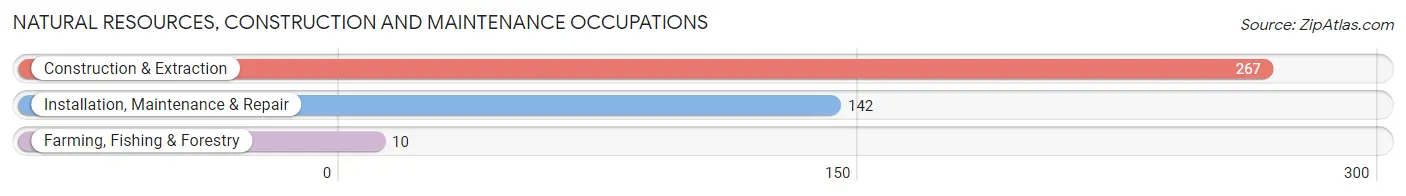
Natural Resources, Construction and Maintenance Occupations
The most common Natural Resources, Construction and Maintenance occupations in Linthicum are Construction & Extraction (267 | 4.6%), Installation, Maintenance & Repair (142 | 2.5%), and Farming, Fishing & Forestry (10 | 0.2%).
Natural Resources, Construction and Maintenance Occupations by Sex
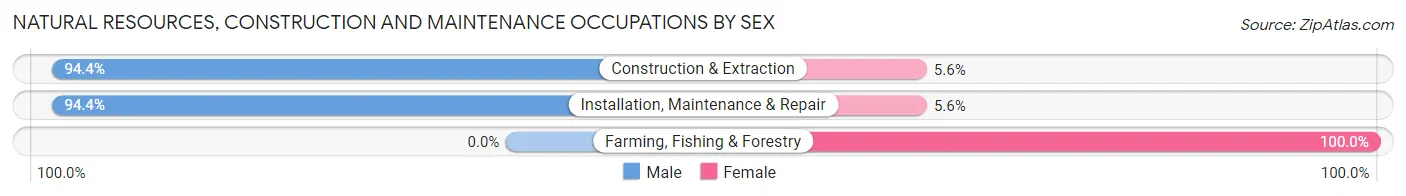
| Occupation | Male | Female |
| Farming, Fishing & Forestry | 0 (0.0%) | 10 (100.0%) |
| Construction & Extraction | 252 (94.4%) | 15 (5.6%) |
| Installation, Maintenance & Repair | 134 (94.4%) | 8 (5.6%) |
| Total (Category) | 386 (92.1%) | 33 (7.9%) |
| Total (Overall) | 3,256 (56.6%) | 2,493 (43.4%) |
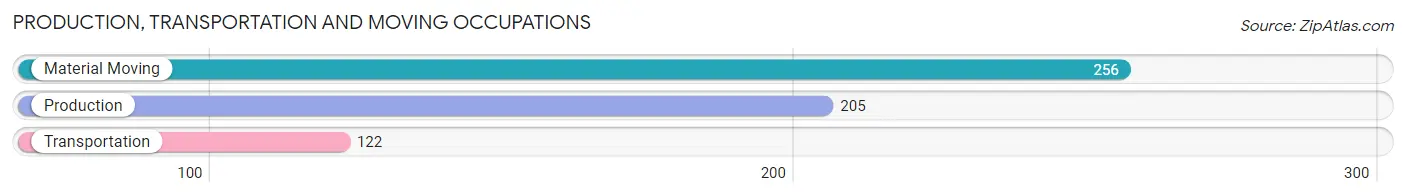
Production, Transportation and Moving Occupations
The most common Production, Transportation and Moving occupations in Linthicum are Material Moving (256 | 4.4%), Production (205 | 3.6%), and Transportation (122 | 2.1%).
Production, Transportation and Moving Occupations by Sex
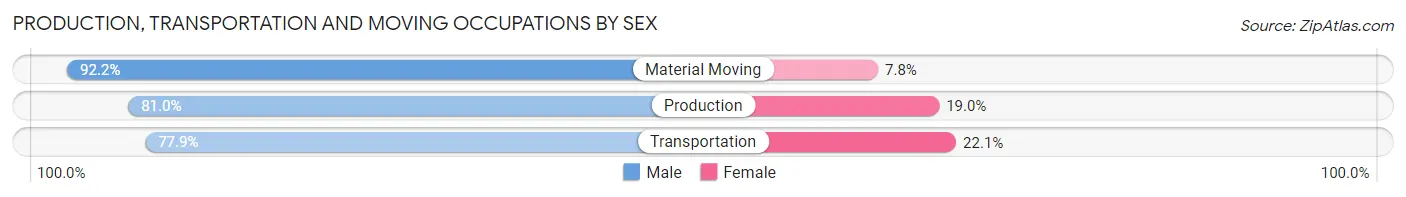
| Occupation | Male | Female |
| Production | 166 (81.0%) | 39 (19.0%) |
| Transportation | 95 (77.9%) | 27 (22.1%) |
| Material Moving | 236 (92.2%) | 20 (7.8%) |
| Total (Category) | 497 (85.3%) | 86 (14.7%) |
| Total (Overall) | 3,256 (56.6%) | 2,493 (43.4%) |
Employment Industries by Sex in Linthicum
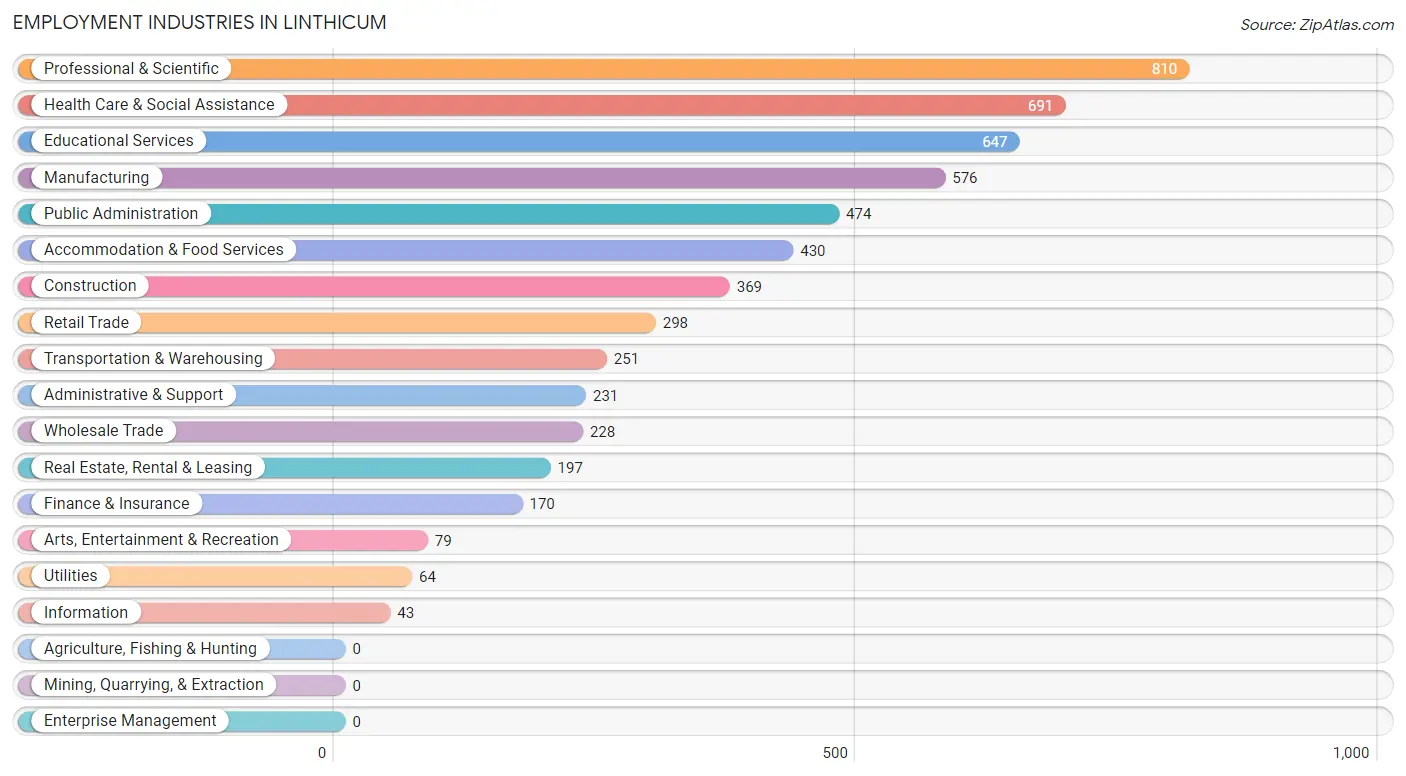
Employment Industries in Linthicum
The major employment industries in Linthicum include Professional & Scientific (810 | 14.1%), Health Care & Social Assistance (691 | 12.0%), Educational Services (647 | 11.3%), Manufacturing (576 | 10.0%), and Public Administration (474 | 8.2%).
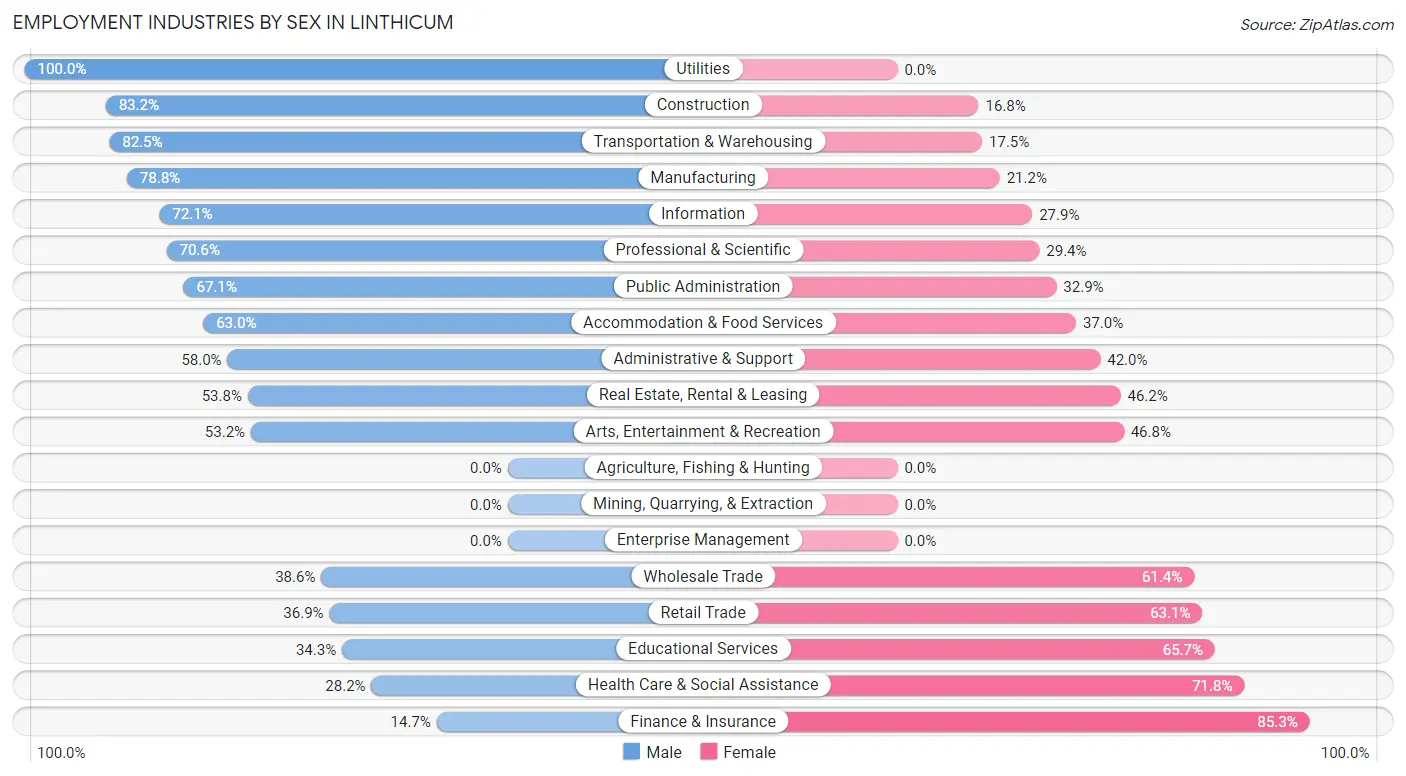
Employment Industries by Sex in Linthicum
The Linthicum industries that see more men than women are Utilities (100.0%), Construction (83.2%), and Transportation & Warehousing (82.5%), whereas the industries that tend to have a higher number of women are Finance & Insurance (85.3%), Health Care & Social Assistance (71.8%), and Educational Services (65.7%).
| Industry | Male | Female |
| Agriculture, Fishing & Hunting | 0 (0.0%) | 0 (0.0%) |
| Mining, Quarrying, & Extraction | 0 (0.0%) | 0 (0.0%) |
| Construction | 307 (83.2%) | 62 (16.8%) |
| Manufacturing | 454 (78.8%) | 122 (21.2%) |
| Wholesale Trade | 88 (38.6%) | 140 (61.4%) |
| Retail Trade | 110 (36.9%) | 188 (63.1%) |
| Transportation & Warehousing | 207 (82.5%) | 44 (17.5%) |
| Utilities | 64 (100.0%) | 0 (0.0%) |
| Information | 31 (72.1%) | 12 (27.9%) |
| Finance & Insurance | 25 (14.7%) | 145 (85.3%) |
| Real Estate, Rental & Leasing | 106 (53.8%) | 91 (46.2%) |
| Professional & Scientific | 572 (70.6%) | 238 (29.4%) |
| Enterprise Management | 0 (0.0%) | 0 (0.0%) |
| Administrative & Support | 134 (58.0%) | 97 (42.0%) |
| Educational Services | 222 (34.3%) | 425 (65.7%) |
| Health Care & Social Assistance | 195 (28.2%) | 496 (71.8%) |
| Arts, Entertainment & Recreation | 42 (53.2%) | 37 (46.8%) |
| Accommodation & Food Services | 271 (63.0%) | 159 (37.0%) |
| Public Administration | 318 (67.1%) | 156 (32.9%) |
| Total | 3,256 (56.6%) | 2,493 (43.4%) |
Education in Linthicum
School Enrollment in Linthicum
The most common levels of schooling among the 2,599 students in Linthicum are high school (623 | 24.0%), elementary school (608 | 23.4%), and middle school (455 | 17.5%).
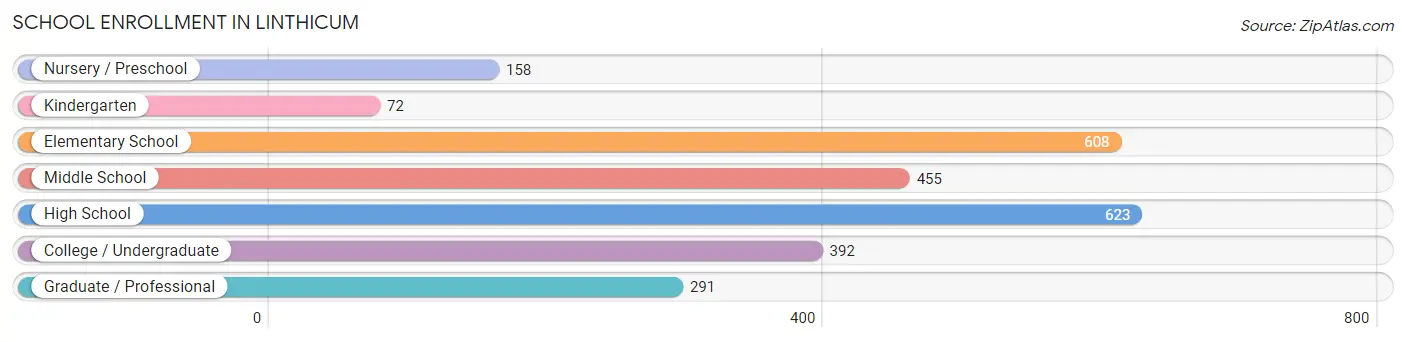
| School Level | # Students | % Students |
| Nursery / Preschool | 158 | 6.1% |
| Kindergarten | 72 | 2.8% |
| Elementary School | 608 | 23.4% |
| Middle School | 455 | 17.5% |
| High School | 623 | 24.0% |
| College / Undergraduate | 392 | 15.1% |
| Graduate / Professional | 291 | 11.2% |
| Total | 2,599 | 100.0% |
School Enrollment by Age by Funding Source in Linthicum
Out of a total of 2,599 students who are enrolled in schools in Linthicum, 608 (23.4%) attend a private institution, while the remaining 1,991 (76.6%) are enrolled in public schools. The age group of 3 to 4 year olds has the highest likelihood of being enrolled in private schools, with 62 (57.4% in the age bracket) enrolled. Conversely, the age group of 18 to 19 year olds has the lowest likelihood of being enrolled in a private school, with 84 (100.0% in the age bracket) attending a public institution.
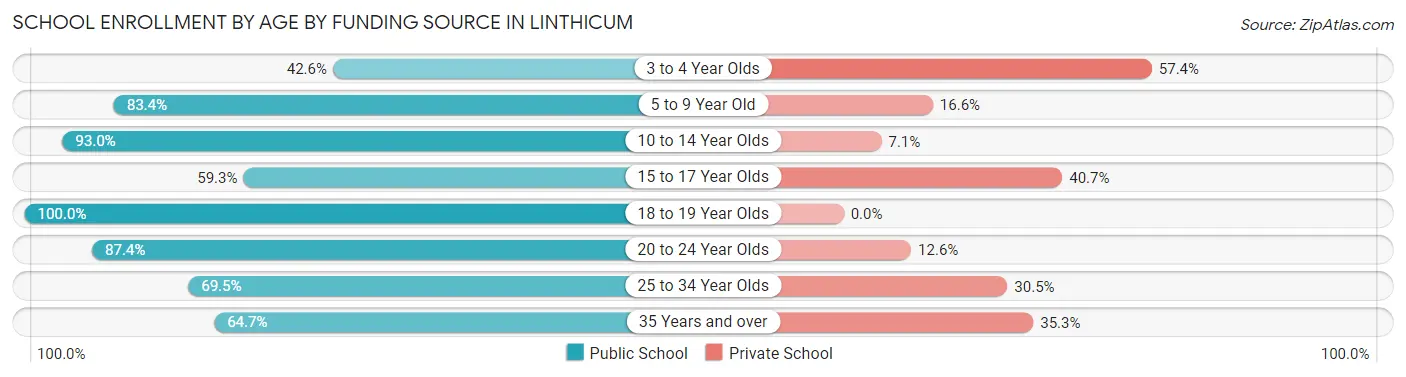
| Age Bracket | Public School | Private School |
| 3 to 4 Year Olds | 46 (42.6%) | 62 (57.4%) |
| 5 to 9 Year Old | 552 (83.4%) | 110 (16.6%) |
| 10 to 14 Year Olds | 501 (92.9%) | 38 (7.0%) |
| 15 to 17 Year Olds | 310 (59.3%) | 213 (40.7%) |
| 18 to 19 Year Olds | 84 (100.0%) | 0 (0.0%) |
| 20 to 24 Year Olds | 160 (87.4%) | 23 (12.6%) |
| 25 to 34 Year Olds | 196 (69.5%) | 86 (30.5%) |
| 35 Years and over | 141 (64.7%) | 77 (35.3%) |
| Total | 1,991 (76.6%) | 608 (23.4%) |
Educational Attainment by Field of Study in Linthicum
Business (468 | 13.9%), engineering (405 | 12.0%), education (356 | 10.6%), computers & mathematics (291 | 8.6%), and science & technology (278 | 8.3%) are the most common fields of study among 3,368 individuals in Linthicum who have obtained a bachelor's degree or higher.
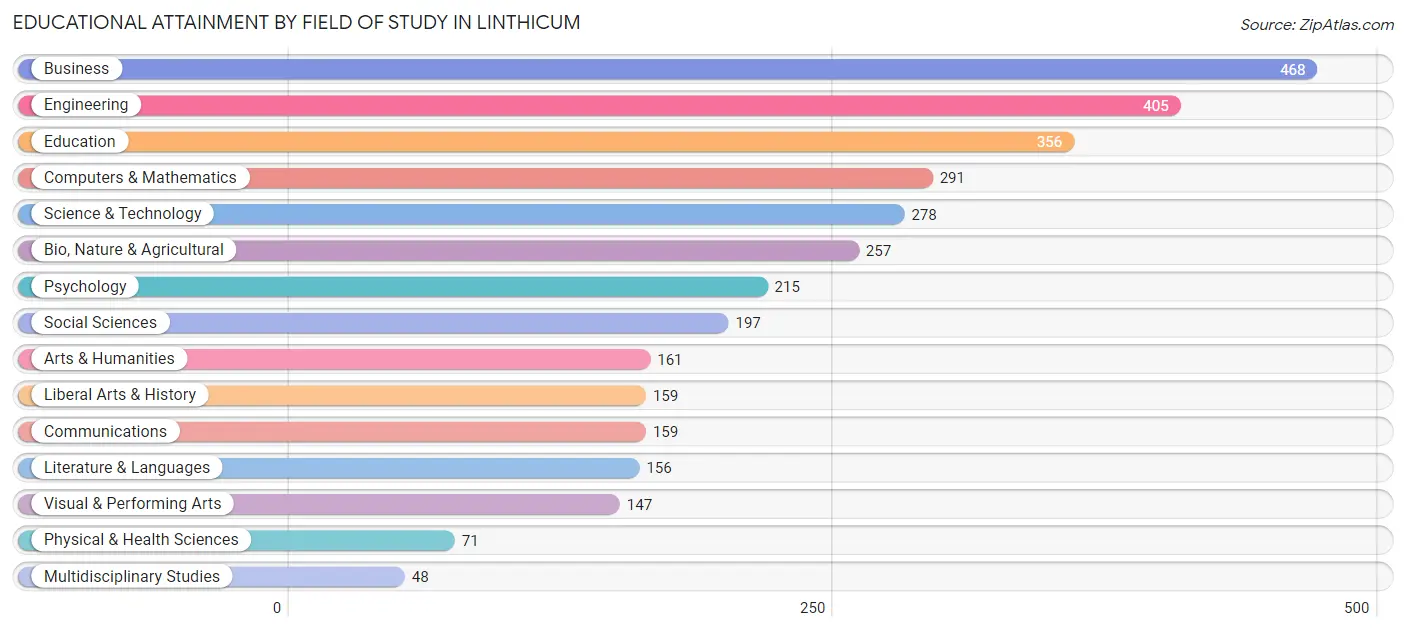
| Field of Study | # Graduates | % Graduates |
| Computers & Mathematics | 291 | 8.6% |
| Bio, Nature & Agricultural | 257 | 7.6% |
| Physical & Health Sciences | 71 | 2.1% |
| Psychology | 215 | 6.4% |
| Social Sciences | 197 | 5.9% |
| Engineering | 405 | 12.0% |
| Multidisciplinary Studies | 48 | 1.4% |
| Science & Technology | 278 | 8.3% |
| Business | 468 | 13.9% |
| Education | 356 | 10.6% |
| Literature & Languages | 156 | 4.6% |
| Liberal Arts & History | 159 | 4.7% |
| Visual & Performing Arts | 147 | 4.4% |
| Communications | 159 | 4.7% |
| Arts & Humanities | 161 | 4.8% |
| Total | 3,368 | 100.0% |
Transportation & Commute in Linthicum
Vehicle Availability by Sex in Linthicum
The most prevalent vehicle ownership categories in Linthicum are males with 2 vehicles (1,424, accounting for 43.5%) and females with 2 vehicles (1,179, making up 57.1%).
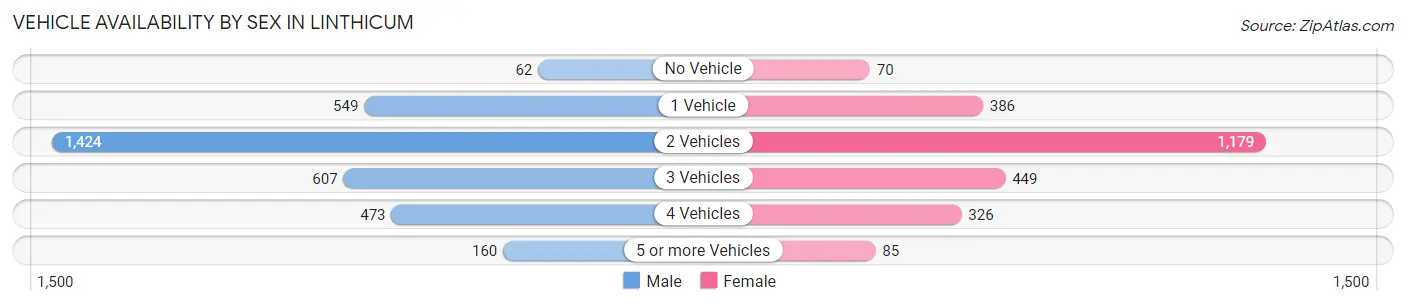
| Vehicles Available | Male | Female |
| No Vehicle | 62 (1.9%) | 70 (2.8%) |
| 1 Vehicle | 549 (16.8%) | 386 (15.5%) |
| 2 Vehicles | 1,424 (43.5%) | 1,179 (47.2%) |
| 3 Vehicles | 607 (18.5%) | 449 (18.0%) |
| 4 Vehicles | 473 (14.4%) | 326 (13.1%) |
| 5 or more Vehicles | 160 (4.9%) | 85 (3.4%) |
| Total | 3,275 (100.0%) | 2,495 (100.0%) |
Commute Time in Linthicum
The most frequently occuring commute durations in Linthicum are 15 to 19 minutes (1,029 commuters, 20.0%), 20 to 24 minutes (874 commuters, 17.0%), and 10 to 14 minutes (794 commuters, 15.4%).
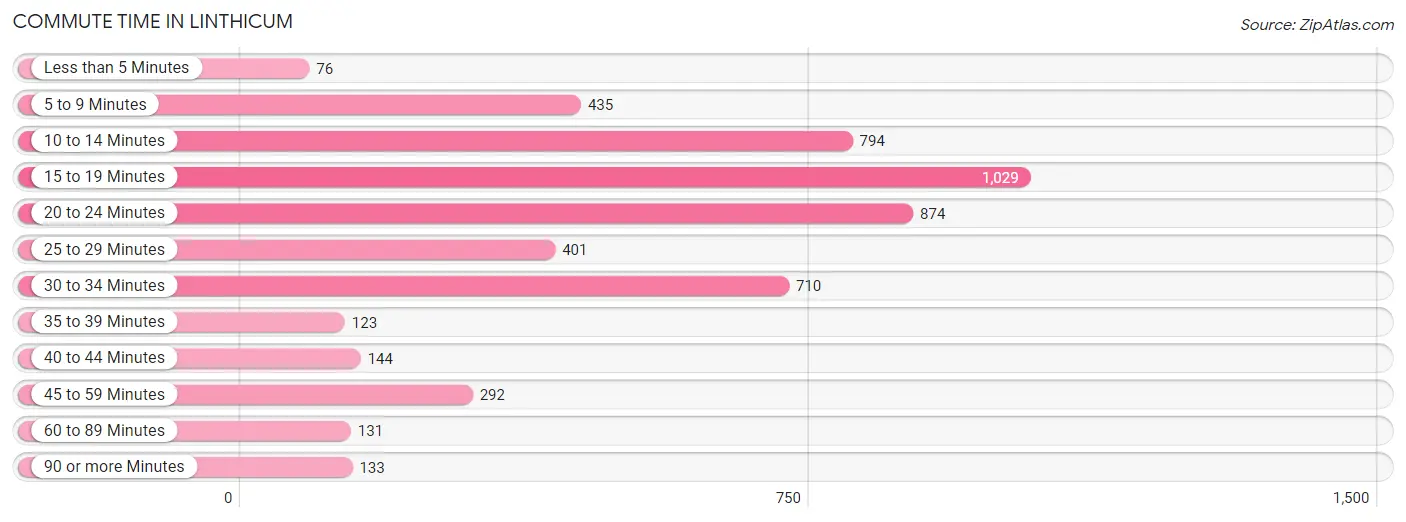
| Commute Time | # Commuters | % Commuters |
| Less than 5 Minutes | 76 | 1.5% |
| 5 to 9 Minutes | 435 | 8.5% |
| 10 to 14 Minutes | 794 | 15.4% |
| 15 to 19 Minutes | 1,029 | 20.0% |
| 20 to 24 Minutes | 874 | 17.0% |
| 25 to 29 Minutes | 401 | 7.8% |
| 30 to 34 Minutes | 710 | 13.8% |
| 35 to 39 Minutes | 123 | 2.4% |
| 40 to 44 Minutes | 144 | 2.8% |
| 45 to 59 Minutes | 292 | 5.7% |
| 60 to 89 Minutes | 131 | 2.5% |
| 90 or more Minutes | 133 | 2.6% |
Commute Time by Sex in Linthicum
The most common commute times in Linthicum are 20 to 24 minutes (505 commuters, 17.1%) for males and 15 to 19 minutes (547 commuters, 25.0%) for females.
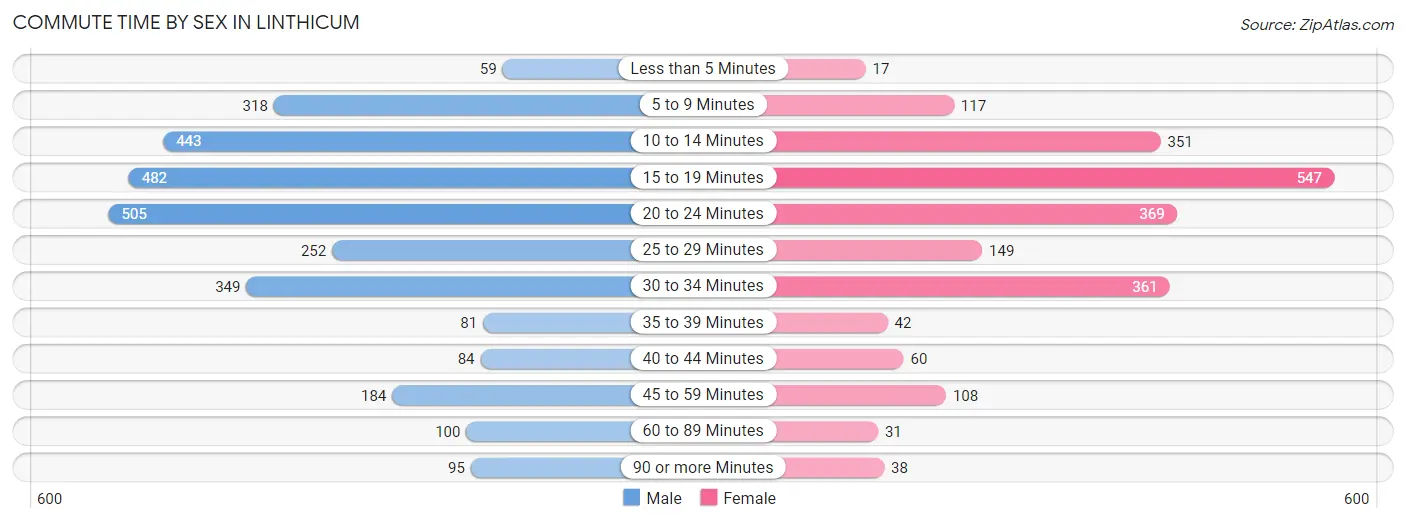
| Commute Time | Male | Female |
| Less than 5 Minutes | 59 (2.0%) | 17 (0.8%) |
| 5 to 9 Minutes | 318 (10.8%) | 117 (5.3%) |
| 10 to 14 Minutes | 443 (15.0%) | 351 (16.0%) |
| 15 to 19 Minutes | 482 (16.3%) | 547 (25.0%) |
| 20 to 24 Minutes | 505 (17.1%) | 369 (16.9%) |
| 25 to 29 Minutes | 252 (8.5%) | 149 (6.8%) |
| 30 to 34 Minutes | 349 (11.8%) | 361 (16.5%) |
| 35 to 39 Minutes | 81 (2.7%) | 42 (1.9%) |
| 40 to 44 Minutes | 84 (2.9%) | 60 (2.7%) |
| 45 to 59 Minutes | 184 (6.2%) | 108 (4.9%) |
| 60 to 89 Minutes | 100 (3.4%) | 31 (1.4%) |
| 90 or more Minutes | 95 (3.2%) | 38 (1.7%) |
Time of Departure to Work by Sex in Linthicum
The most frequent times of departure to work in Linthicum are 6:00 AM to 6:29 AM (529, 17.9%) for males and 7:00 AM to 7:29 AM (413, 18.9%) for females.
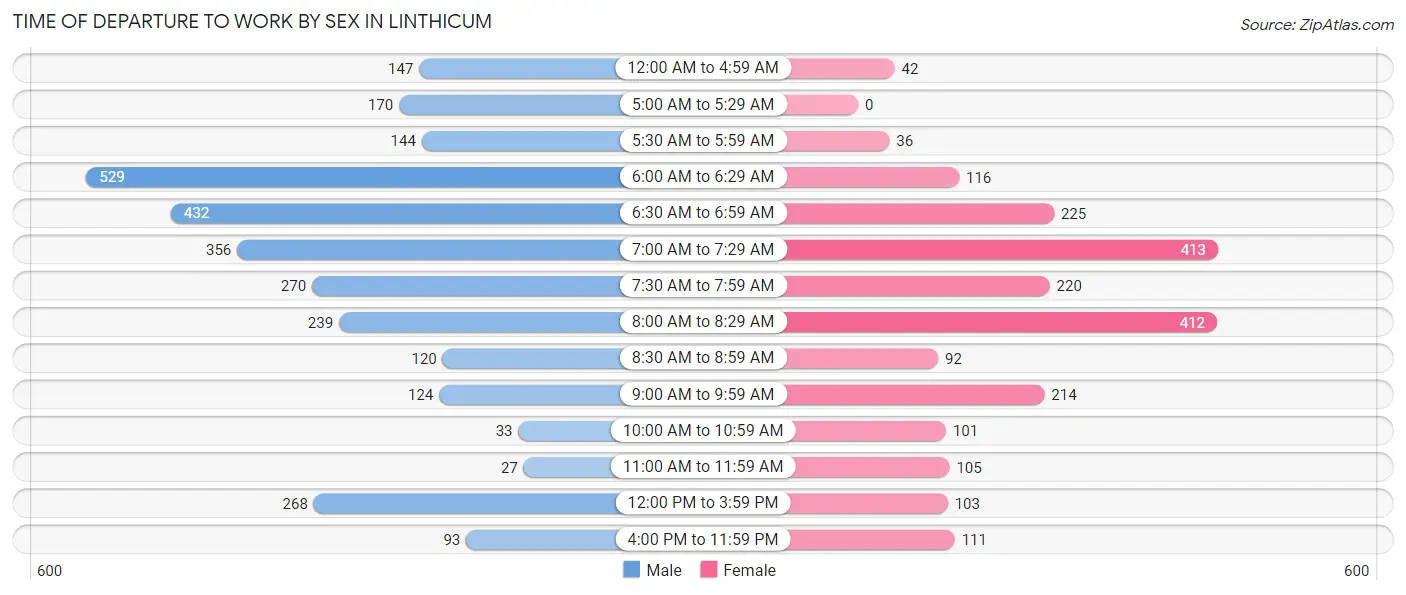
| Time of Departure | Male | Female |
| 12:00 AM to 4:59 AM | 147 (5.0%) | 42 (1.9%) |
| 5:00 AM to 5:29 AM | 170 (5.8%) | 0 (0.0%) |
| 5:30 AM to 5:59 AM | 144 (4.9%) | 36 (1.6%) |
| 6:00 AM to 6:29 AM | 529 (17.9%) | 116 (5.3%) |
| 6:30 AM to 6:59 AM | 432 (14.6%) | 225 (10.3%) |
| 7:00 AM to 7:29 AM | 356 (12.1%) | 413 (18.9%) |
| 7:30 AM to 7:59 AM | 270 (9.1%) | 220 (10.1%) |
| 8:00 AM to 8:29 AM | 239 (8.1%) | 412 (18.8%) |
| 8:30 AM to 8:59 AM | 120 (4.1%) | 92 (4.2%) |
| 9:00 AM to 9:59 AM | 124 (4.2%) | 214 (9.8%) |
| 10:00 AM to 10:59 AM | 33 (1.1%) | 101 (4.6%) |
| 11:00 AM to 11:59 AM | 27 (0.9%) | 105 (4.8%) |
| 12:00 PM to 3:59 PM | 268 (9.1%) | 103 (4.7%) |
| 4:00 PM to 11:59 PM | 93 (3.2%) | 111 (5.1%) |
| Total | 2,952 (100.0%) | 2,190 (100.0%) |
Housing Occupancy in Linthicum
Occupancy by Ownership in Linthicum
Of the total 4,111 dwellings in Linthicum, owner-occupied units account for 3,351 (81.5%), while renter-occupied units make up 760 (18.5%).
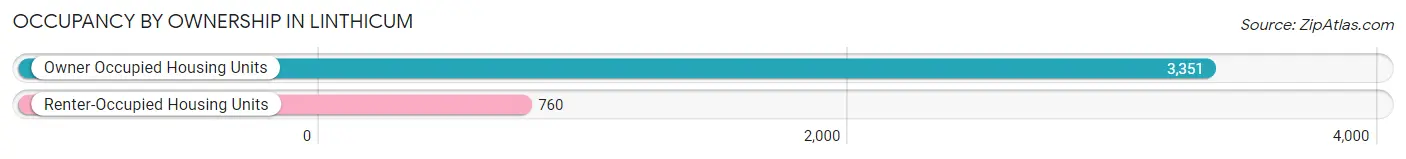
| Occupancy | # Housing Units | % Housing Units |
| Owner Occupied Housing Units | 3,351 | 81.5% |
| Renter-Occupied Housing Units | 760 | 18.5% |
| Total Occupied Housing Units | 4,111 | 100.0% |
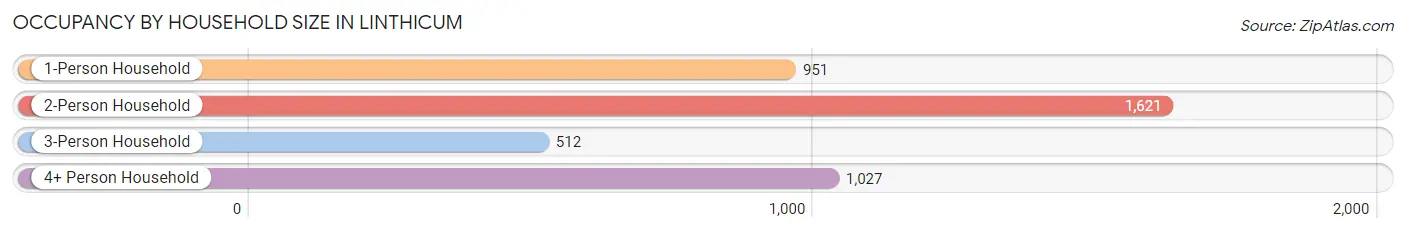
Occupancy by Household Size in Linthicum
| Household Size | # Housing Units | % Housing Units |
| 1-Person Household | 951 | 23.1% |
| 2-Person Household | 1,621 | 39.4% |
| 3-Person Household | 512 | 12.4% |
| 4+ Person Household | 1,027 | 25.0% |
| Total Housing Units | 4,111 | 100.0% |
Occupancy by Ownership by Household Size in Linthicum
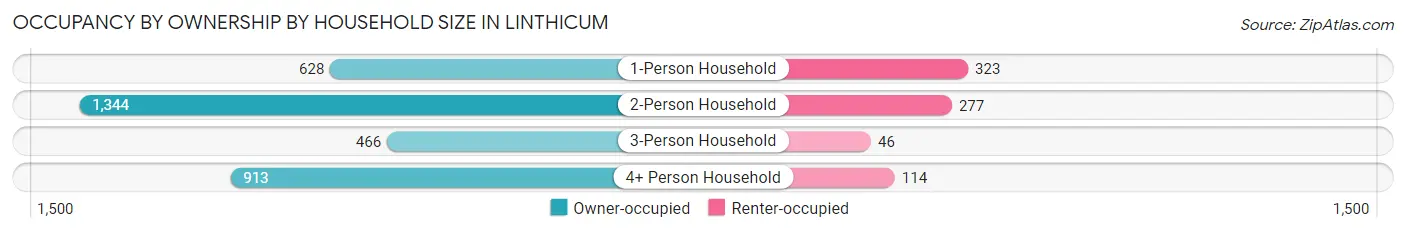
| Household Size | Owner-occupied | Renter-occupied |
| 1-Person Household | 628 (66.0%) | 323 (34.0%) |
| 2-Person Household | 1,344 (82.9%) | 277 (17.1%) |
| 3-Person Household | 466 (91.0%) | 46 (9.0%) |
| 4+ Person Household | 913 (88.9%) | 114 (11.1%) |
| Total Housing Units | 3,351 (81.5%) | 760 (18.5%) |
Occupancy by Educational Attainment in Linthicum
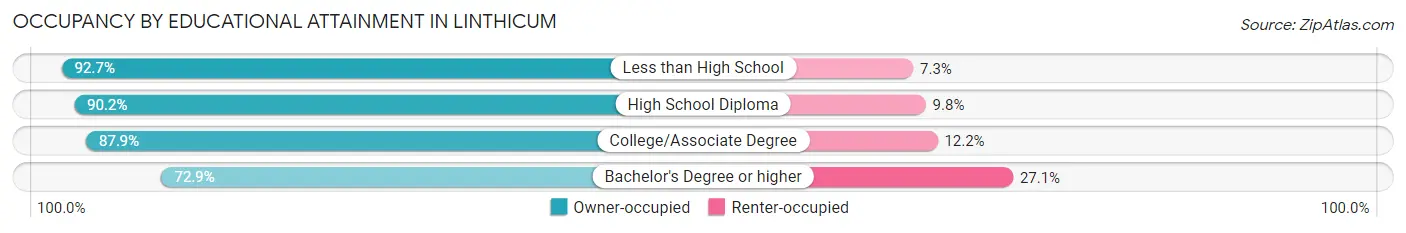
| Household Size | Owner-occupied | Renter-occupied |
| Less than High School | 152 (92.7%) | 12 (7.3%) |
| High School Diploma | 653 (90.2%) | 71 (9.8%) |
| College/Associate Degree | 1,157 (87.8%) | 160 (12.1%) |
| Bachelor's Degree or higher | 1,389 (72.9%) | 517 (27.1%) |
Occupancy by Age of Householder in Linthicum
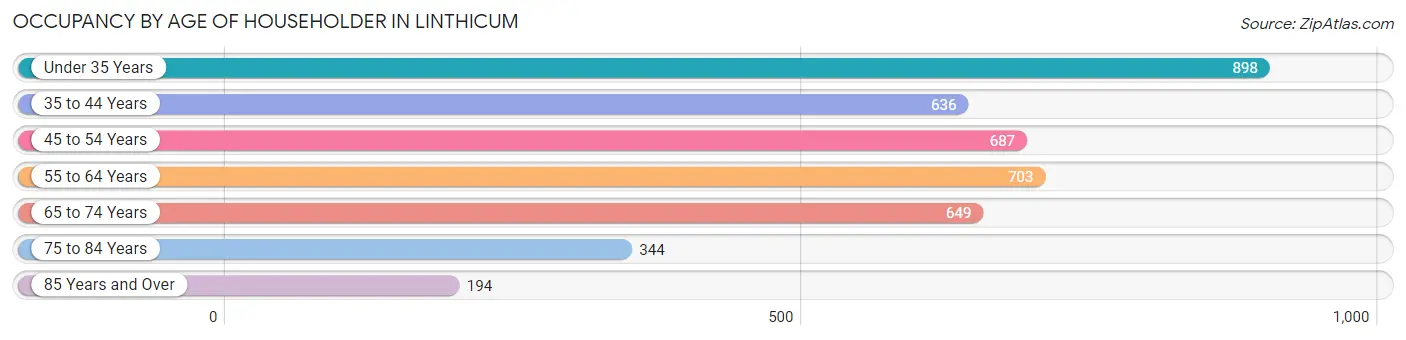
| Age Bracket | # Households | % Households |
| Under 35 Years | 898 | 21.8% |
| 35 to 44 Years | 636 | 15.5% |
| 45 to 54 Years | 687 | 16.7% |
| 55 to 64 Years | 703 | 17.1% |
| 65 to 74 Years | 649 | 15.8% |
| 75 to 84 Years | 344 | 8.4% |
| 85 Years and Over | 194 | 4.7% |
| Total | 4,111 | 100.0% |
Housing Finances in Linthicum
Median Income by Occupancy in Linthicum
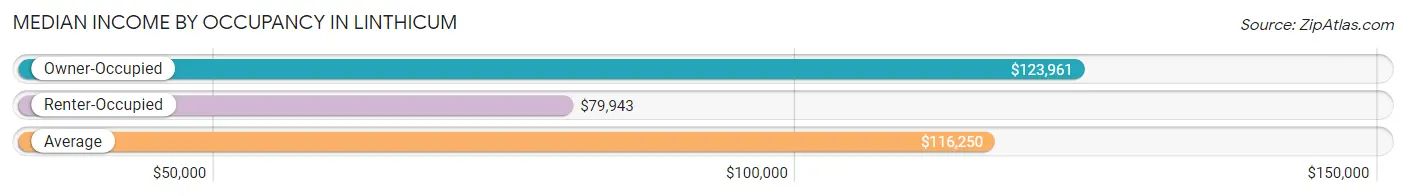
| Occupancy Type | # Households | Median Income |
| Owner-Occupied | 3,351 (81.5%) | $123,961 |
| Renter-Occupied | 760 (18.5%) | $79,943 |
| Average | 4,111 (100.0%) | $116,250 |
Occupancy by Householder Income Bracket in Linthicum
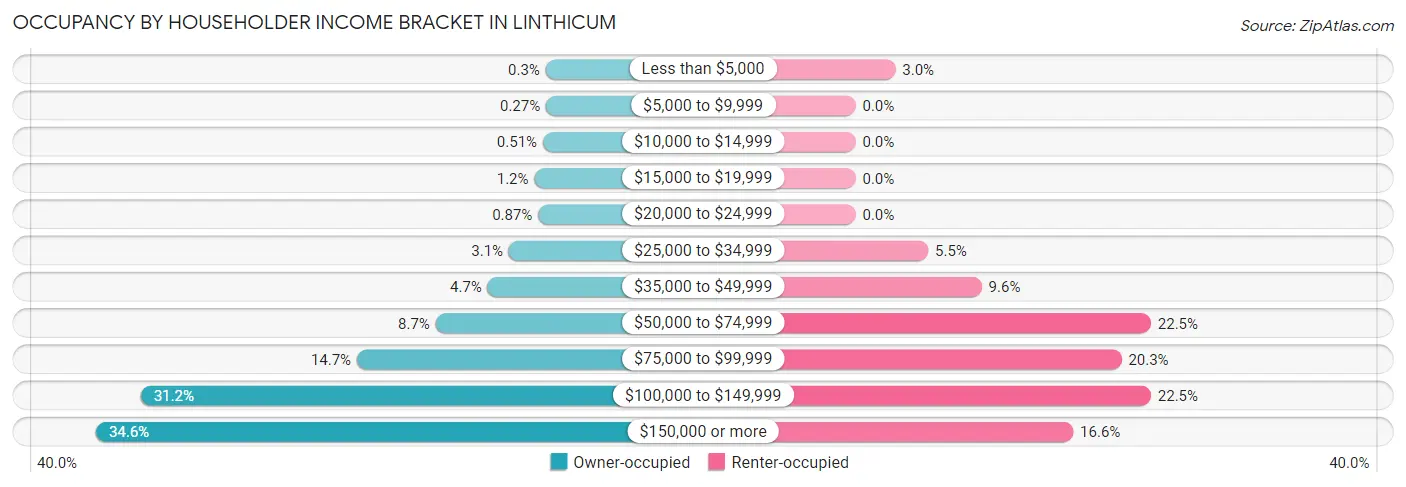
| Income Bracket | Owner-occupied | Renter-occupied |
| Less than $5,000 | 10 (0.3%) | 23 (3.0%) |
| $5,000 to $9,999 | 9 (0.3%) | 0 (0.0%) |
| $10,000 to $14,999 | 17 (0.5%) | 0 (0.0%) |
| $15,000 to $19,999 | 39 (1.2%) | 0 (0.0%) |
| $20,000 to $24,999 | 29 (0.9%) | 0 (0.0%) |
| $25,000 to $34,999 | 104 (3.1%) | 42 (5.5%) |
| $35,000 to $49,999 | 158 (4.7%) | 73 (9.6%) |
| $50,000 to $74,999 | 291 (8.7%) | 171 (22.5%) |
| $75,000 to $99,999 | 492 (14.7%) | 154 (20.3%) |
| $100,000 to $149,999 | 1,044 (31.1%) | 171 (22.5%) |
| $150,000 or more | 1,158 (34.6%) | 126 (16.6%) |
| Total | 3,351 (100.0%) | 760 (100.0%) |
Monthly Housing Cost Tiers in Linthicum
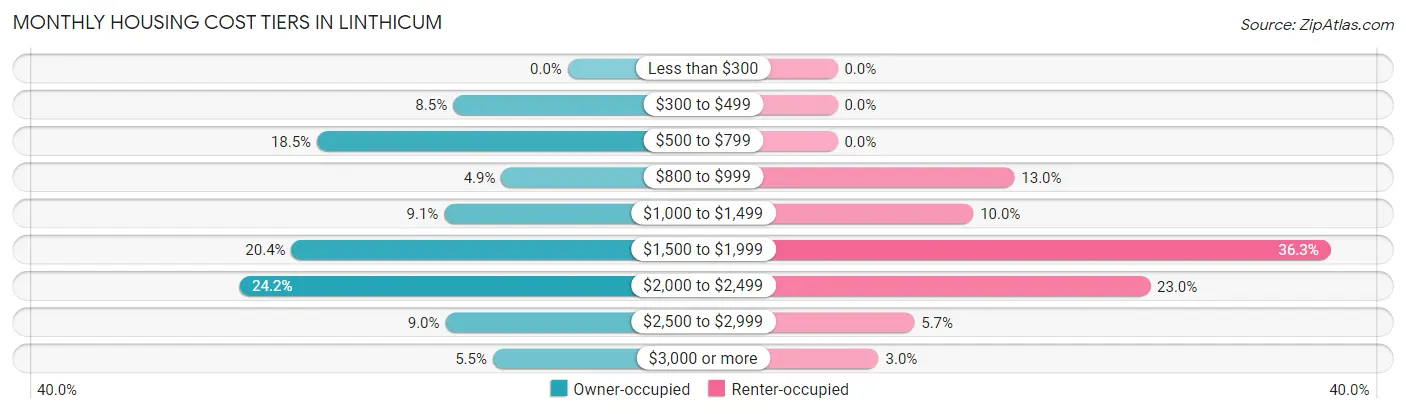
| Monthly Cost | Owner-occupied | Renter-occupied |
| Less than $300 | 0 (0.0%) | 0 (0.0%) |
| $300 to $499 | 283 (8.5%) | 0 (0.0%) |
| $500 to $799 | 619 (18.5%) | 0 (0.0%) |
| $800 to $999 | 164 (4.9%) | 99 (13.0%) |
| $1,000 to $1,499 | 305 (9.1%) | 76 (10.0%) |
| $1,500 to $1,999 | 682 (20.3%) | 276 (36.3%) |
| $2,000 to $2,499 | 811 (24.2%) | 175 (23.0%) |
| $2,500 to $2,999 | 302 (9.0%) | 43 (5.7%) |
| $3,000 or more | 185 (5.5%) | 23 (3.0%) |
| Total | 3,351 (100.0%) | 760 (100.0%) |
Physical Housing Characteristics in Linthicum
Housing Structures in Linthicum
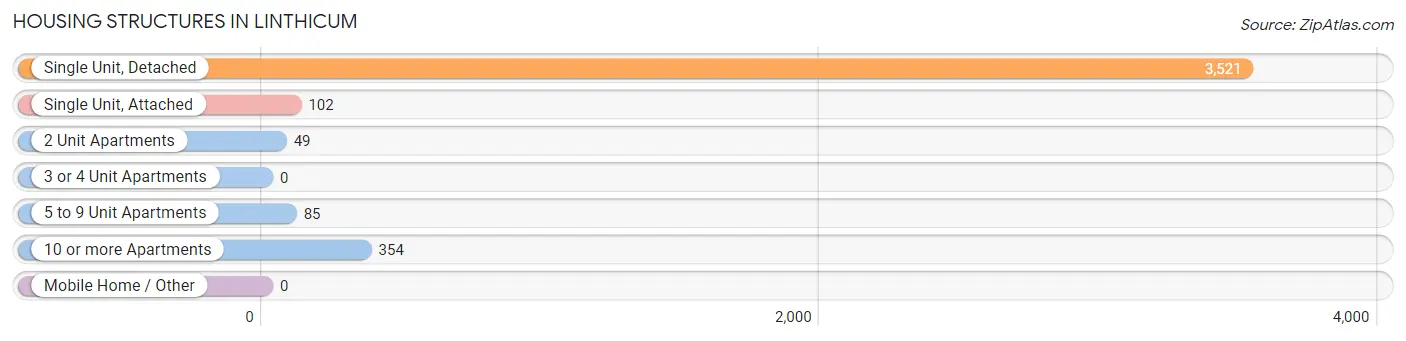
| Structure Type | # Housing Units | % Housing Units |
| Single Unit, Detached | 3,521 | 85.7% |
| Single Unit, Attached | 102 | 2.5% |
| 2 Unit Apartments | 49 | 1.2% |
| 3 or 4 Unit Apartments | 0 | 0.0% |
| 5 to 9 Unit Apartments | 85 | 2.1% |
| 10 or more Apartments | 354 | 8.6% |
| Mobile Home / Other | 0 | 0.0% |
| Total | 4,111 | 100.0% |
Housing Structures by Occupancy in Linthicum
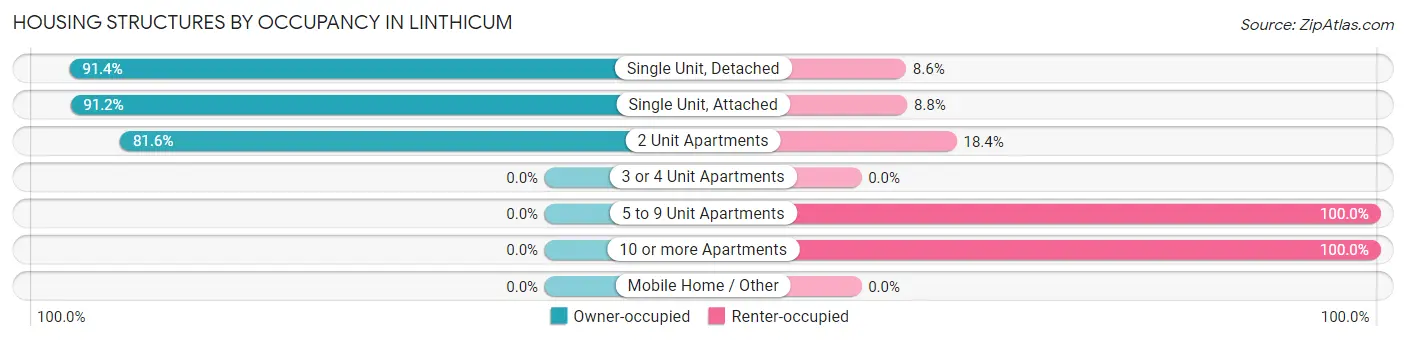
| Structure Type | Owner-occupied | Renter-occupied |
| Single Unit, Detached | 3,218 (91.4%) | 303 (8.6%) |
| Single Unit, Attached | 93 (91.2%) | 9 (8.8%) |
| 2 Unit Apartments | 40 (81.6%) | 9 (18.4%) |
| 3 or 4 Unit Apartments | 0 (0.0%) | 0 (0.0%) |
| 5 to 9 Unit Apartments | 0 (0.0%) | 85 (100.0%) |
| 10 or more Apartments | 0 (0.0%) | 354 (100.0%) |
| Mobile Home / Other | 0 (0.0%) | 0 (0.0%) |
| Total | 3,351 (81.5%) | 760 (18.5%) |
Housing Structures by Number of Rooms in Linthicum
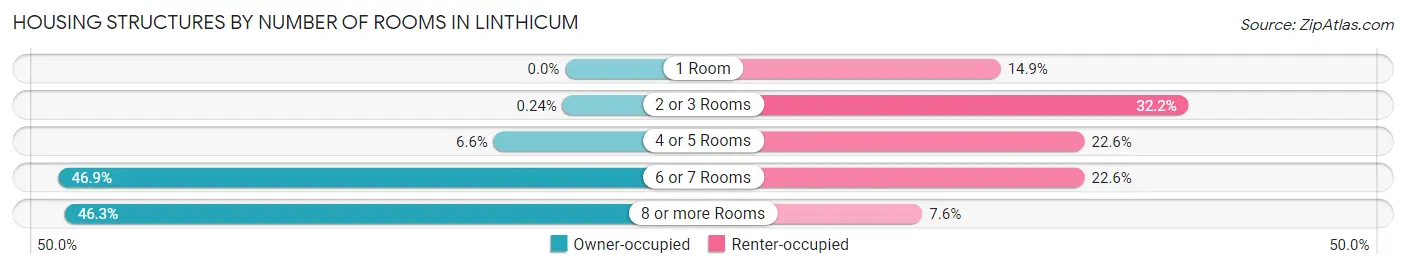
| Number of Rooms | Owner-occupied | Renter-occupied |
| 1 Room | 0 (0.0%) | 113 (14.9%) |
| 2 or 3 Rooms | 8 (0.2%) | 245 (32.2%) |
| 4 or 5 Rooms | 222 (6.6%) | 172 (22.6%) |
| 6 or 7 Rooms | 1,570 (46.9%) | 172 (22.6%) |
| 8 or more Rooms | 1,551 (46.3%) | 58 (7.6%) |
| Total | 3,351 (100.0%) | 760 (100.0%) |
Housing Structure by Heating Type in Linthicum
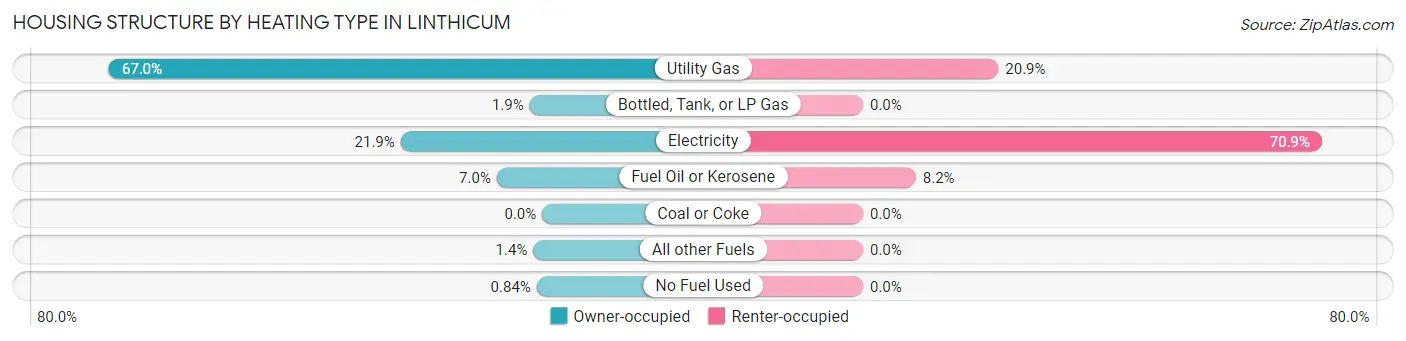
| Heating Type | Owner-occupied | Renter-occupied |
| Utility Gas | 2,244 (67.0%) | 159 (20.9%) |
| Bottled, Tank, or LP Gas | 65 (1.9%) | 0 (0.0%) |
| Electricity | 733 (21.9%) | 539 (70.9%) |
| Fuel Oil or Kerosene | 235 (7.0%) | 62 (8.2%) |
| Coal or Coke | 0 (0.0%) | 0 (0.0%) |
| All other Fuels | 46 (1.4%) | 0 (0.0%) |
| No Fuel Used | 28 (0.8%) | 0 (0.0%) |
| Total | 3,351 (100.0%) | 760 (100.0%) |
Household Vehicle Usage in Linthicum
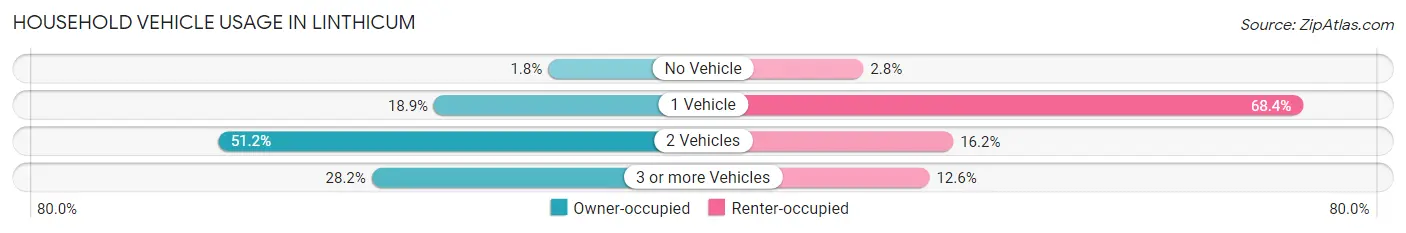
| Vehicles per Household | Owner-occupied | Renter-occupied |
| No Vehicle | 61 (1.8%) | 21 (2.8%) |
| 1 Vehicle | 632 (18.9%) | 520 (68.4%) |
| 2 Vehicles | 1,714 (51.1%) | 123 (16.2%) |
| 3 or more Vehicles | 944 (28.2%) | 96 (12.6%) |
| Total | 3,351 (100.0%) | 760 (100.0%) |
Real Estate & Mortgages in Linthicum
Real Estate and Mortgage Overview in Linthicum
| Characteristic | Without Mortgage | With Mortgage |
| Housing Units | 1,083 | 2,268 |
| Median Property Value | $364,400 | $367,900 |
| Median Household Income | $98,750 | $842 |
| Monthly Housing Costs | $614 | $185 |
| Real Estate Taxes | $2,787 | $16 |
Property Value by Mortgage Status in Linthicum
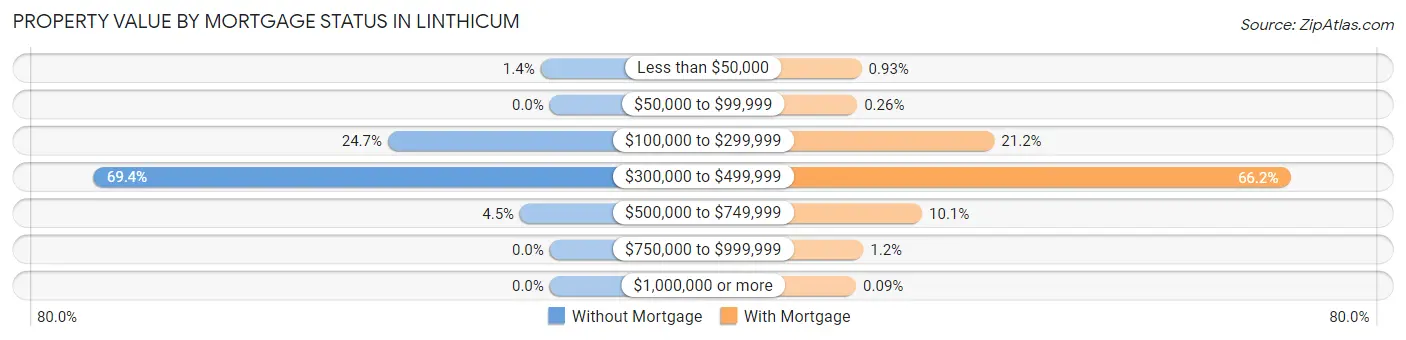
| Property Value | Without Mortgage | With Mortgage |
| Less than $50,000 | 15 (1.4%) | 21 (0.9%) |
| $50,000 to $99,999 | 0 (0.0%) | 6 (0.3%) |
| $100,000 to $299,999 | 267 (24.6%) | 480 (21.2%) |
| $300,000 to $499,999 | 752 (69.4%) | 1,502 (66.2%) |
| $500,000 to $749,999 | 49 (4.5%) | 230 (10.1%) |
| $750,000 to $999,999 | 0 (0.0%) | 27 (1.2%) |
| $1,000,000 or more | 0 (0.0%) | 2 (0.1%) |
| Total | 1,083 (100.0%) | 2,268 (100.0%) |
Household Income by Mortgage Status in Linthicum
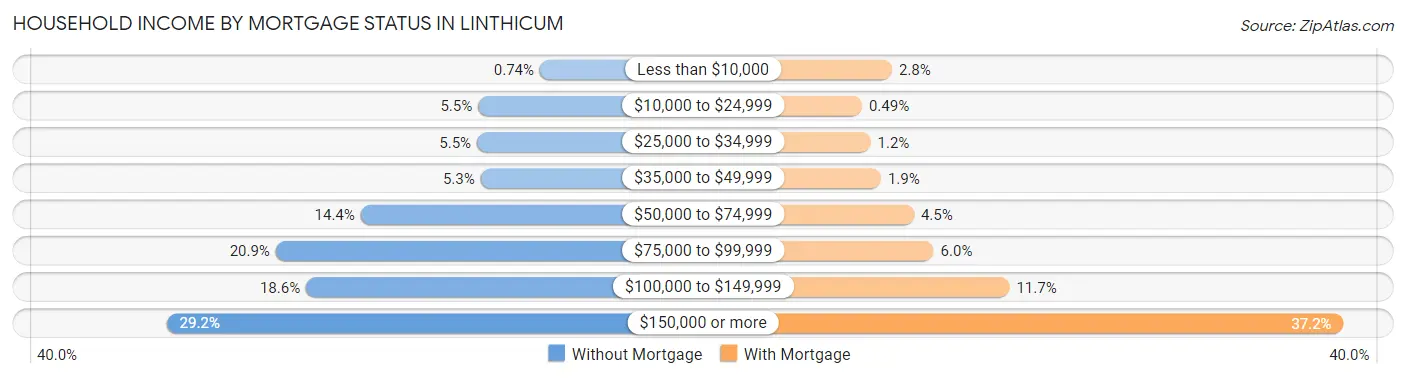
| Household Income | Without Mortgage | With Mortgage |
| Less than $10,000 | 8 (0.7%) | 63 (2.8%) |
| $10,000 to $24,999 | 59 (5.4%) | 11 (0.5%) |
| $25,000 to $34,999 | 60 (5.5%) | 26 (1.1%) |
| $35,000 to $49,999 | 57 (5.3%) | 44 (1.9%) |
| $50,000 to $74,999 | 156 (14.4%) | 101 (4.4%) |
| $75,000 to $99,999 | 226 (20.9%) | 135 (5.9%) |
| $100,000 to $149,999 | 201 (18.6%) | 266 (11.7%) |
| $150,000 or more | 316 (29.2%) | 843 (37.2%) |
| Total | 1,083 (100.0%) | 2,268 (100.0%) |
Property Value to Household Income Ratio in Linthicum
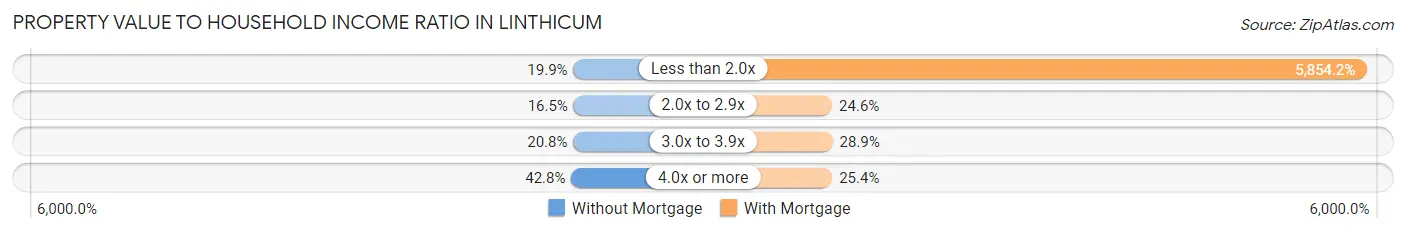
| Value-to-Income Ratio | Without Mortgage | With Mortgage |
| Less than 2.0x | 215 (19.9%) | 132,773 (5,854.2%) |
| 2.0x to 2.9x | 179 (16.5%) | 558 (24.6%) |
| 3.0x to 3.9x | 225 (20.8%) | 656 (28.9%) |
| 4.0x or more | 464 (42.8%) | 577 (25.4%) |
| Total | 1,083 (100.0%) | 2,268 (100.0%) |
Real Estate Taxes by Mortgage Status in Linthicum
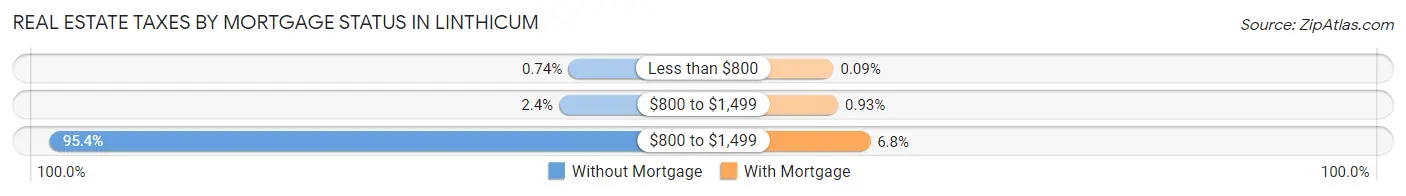
| Property Taxes | Without Mortgage | With Mortgage |
| Less than $800 | 8 (0.7%) | 2 (0.1%) |
| $800 to $1,499 | 26 (2.4%) | 21 (0.9%) |
| $800 to $1,499 | 1,033 (95.4%) | 154 (6.8%) |
| Total | 1,083 (100.0%) | 2,268 (100.0%) |
Health & Disability in Linthicum
Health Insurance Coverage by Age in Linthicum
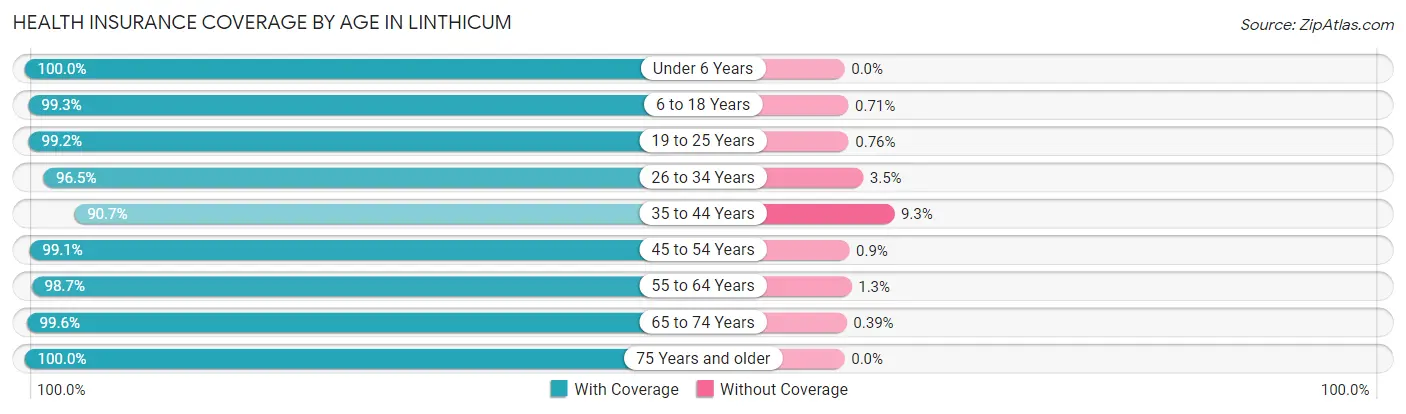
| Age Bracket | With Coverage | Without Coverage |
| Under 6 Years | 816 (100.0%) | 0 (0.0%) |
| 6 to 18 Years | 1,688 (99.3%) | 12 (0.7%) |
| 19 to 25 Years | 656 (99.2%) | 5 (0.8%) |
| 26 to 34 Years | 1,508 (96.5%) | 54 (3.5%) |
| 35 to 44 Years | 1,284 (90.7%) | 131 (9.3%) |
| 45 to 54 Years | 1,315 (99.1%) | 12 (0.9%) |
| 55 to 64 Years | 1,291 (98.7%) | 17 (1.3%) |
| 65 to 74 Years | 1,024 (99.6%) | 4 (0.4%) |
| 75 Years and older | 823 (100.0%) | 0 (0.0%) |
| Total | 10,405 (97.8%) | 235 (2.2%) |
Health Insurance Coverage by Citizenship Status in Linthicum
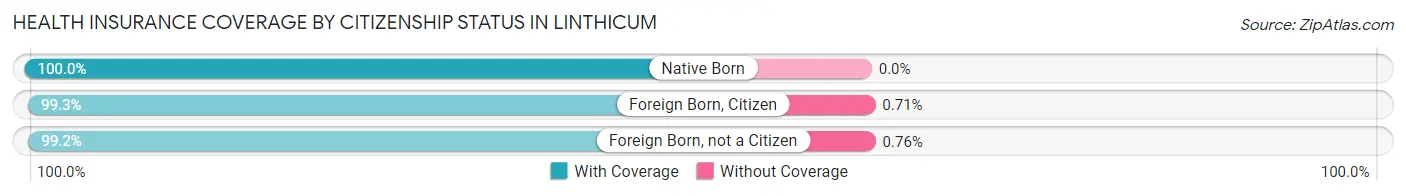
| Citizenship Status | With Coverage | Without Coverage |
| Native Born | 816 (100.0%) | 0 (0.0%) |
| Foreign Born, Citizen | 1,688 (99.3%) | 12 (0.7%) |
| Foreign Born, not a Citizen | 656 (99.2%) | 5 (0.8%) |
Health Insurance Coverage by Household Income in Linthicum
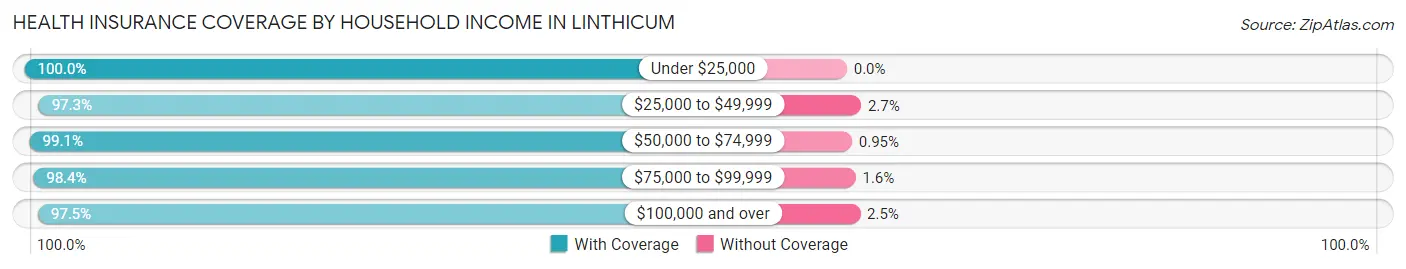
| Household Income | With Coverage | Without Coverage |
| Under $25,000 | 312 (100.0%) | 0 (0.0%) |
| $25,000 to $49,999 | 658 (97.3%) | 18 (2.7%) |
| $50,000 to $74,999 | 833 (99.1%) | 8 (0.9%) |
| $75,000 to $99,999 | 1,140 (98.4%) | 19 (1.6%) |
| $100,000 and over | 7,440 (97.5%) | 190 (2.5%) |
Public vs Private Health Insurance Coverage by Age in Linthicum
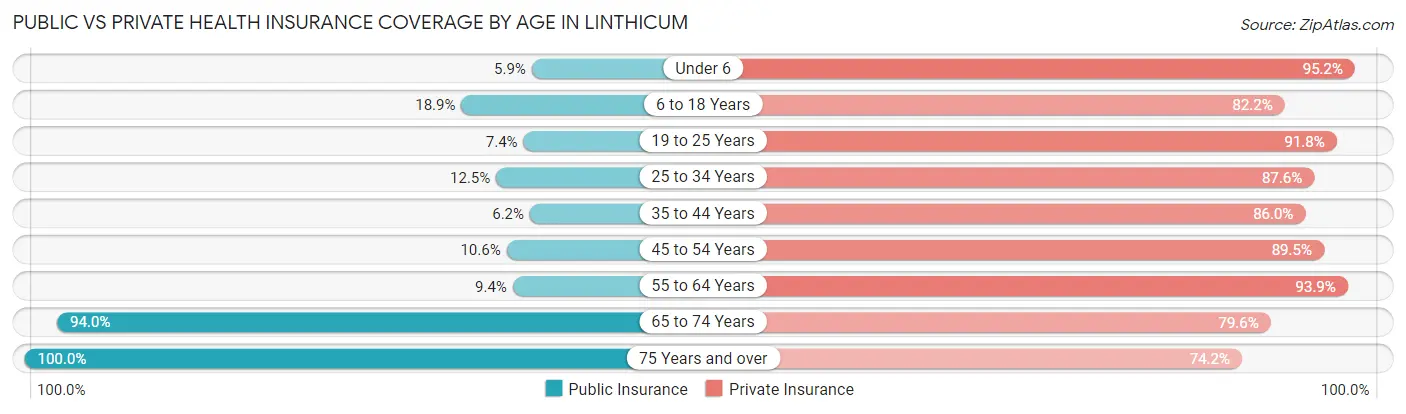
| Age Bracket | Public Insurance | Private Insurance |
| Under 6 | 48 (5.9%) | 777 (95.2%) |
| 6 to 18 Years | 322 (18.9%) | 1,397 (82.2%) |
| 19 to 25 Years | 49 (7.4%) | 607 (91.8%) |
| 25 to 34 Years | 195 (12.5%) | 1,369 (87.6%) |
| 35 to 44 Years | 88 (6.2%) | 1,217 (86.0%) |
| 45 to 54 Years | 140 (10.5%) | 1,187 (89.4%) |
| 55 to 64 Years | 123 (9.4%) | 1,228 (93.9%) |
| 65 to 74 Years | 966 (94.0%) | 818 (79.6%) |
| 75 Years and over | 823 (100.0%) | 611 (74.2%) |
| Total | 2,754 (25.9%) | 9,211 (86.6%) |
Disability Status by Sex by Age in Linthicum
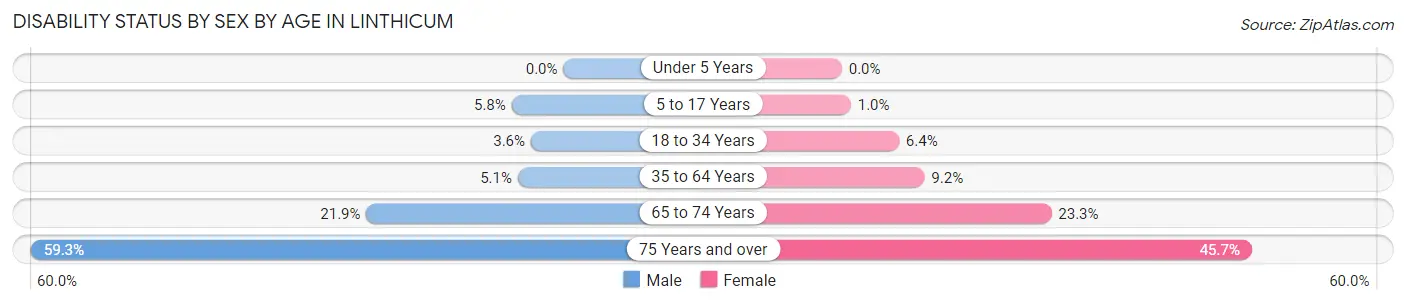
| Age Bracket | Male | Female |
| Under 5 Years | 0 (0.0%) | 0 (0.0%) |
| 5 to 17 Years | 48 (5.8%) | 9 (1.0%) |
| 18 to 34 Years | 46 (3.6%) | 66 (6.4%) |
| 35 to 64 Years | 110 (5.1%) | 173 (9.2%) |
| 65 to 74 Years | 77 (21.9%) | 158 (23.3%) |
| 75 Years and over | 236 (59.3%) | 194 (45.7%) |
Disability Class by Sex by Age in Linthicum
Disability Class: Hearing Difficulty
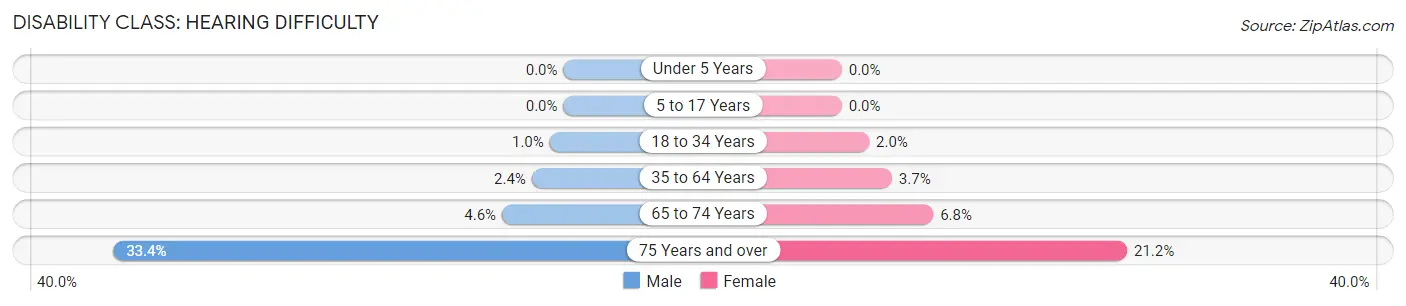
| Age Bracket | Male | Female |
| Under 5 Years | 0 (0.0%) | 0 (0.0%) |
| 5 to 17 Years | 0 (0.0%) | 0 (0.0%) |
| 18 to 34 Years | 13 (1.0%) | 21 (2.0%) |
| 35 to 64 Years | 51 (2.4%) | 70 (3.7%) |
| 65 to 74 Years | 16 (4.6%) | 46 (6.8%) |
| 75 Years and over | 133 (33.4%) | 90 (21.2%) |
Disability Class: Vision Difficulty
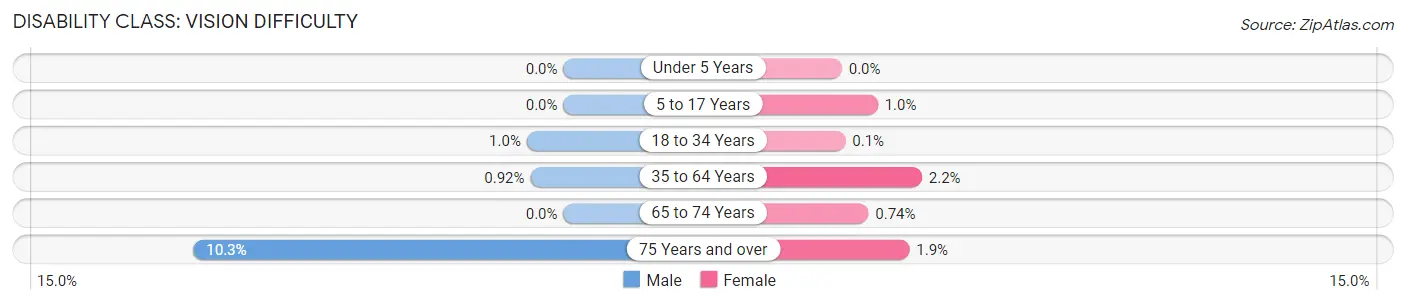
| Age Bracket | Male | Female |
| Under 5 Years | 0 (0.0%) | 0 (0.0%) |
| 5 to 17 Years | 0 (0.0%) | 9 (1.0%) |
| 18 to 34 Years | 13 (1.0%) | 1 (0.1%) |
| 35 to 64 Years | 20 (0.9%) | 42 (2.2%) |
| 65 to 74 Years | 0 (0.0%) | 5 (0.7%) |
| 75 Years and over | 41 (10.3%) | 8 (1.9%) |
Disability Class: Cognitive Difficulty
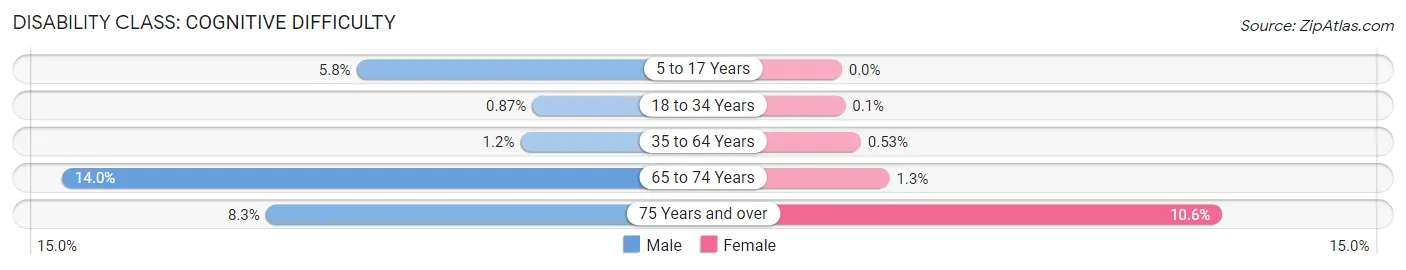
| Age Bracket | Male | Female |
| 5 to 17 Years | 48 (5.8%) | 0 (0.0%) |
| 18 to 34 Years | 11 (0.9%) | 1 (0.1%) |
| 35 to 64 Years | 26 (1.2%) | 10 (0.5%) |
| 65 to 74 Years | 49 (14.0%) | 9 (1.3%) |
| 75 Years and over | 33 (8.3%) | 45 (10.6%) |
Disability Class: Ambulatory Difficulty
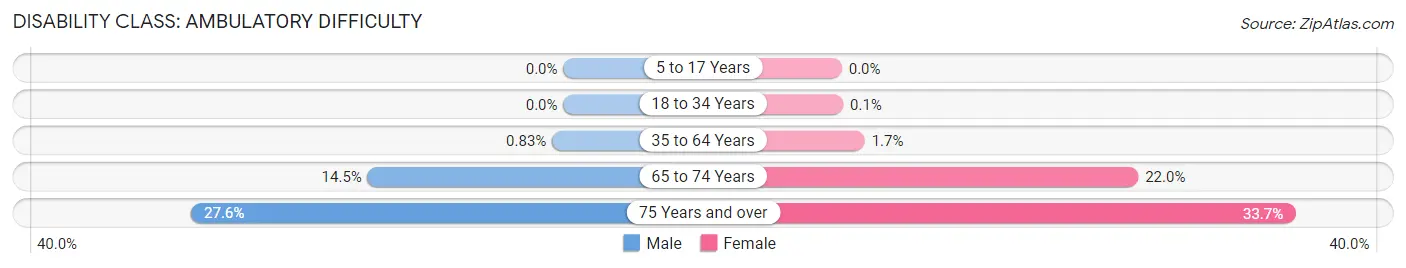
| Age Bracket | Male | Female |
| 5 to 17 Years | 0 (0.0%) | 0 (0.0%) |
| 18 to 34 Years | 0 (0.0%) | 1 (0.1%) |
| 35 to 64 Years | 18 (0.8%) | 32 (1.7%) |
| 65 to 74 Years | 51 (14.5%) | 149 (22.0%) |
| 75 Years and over | 110 (27.6%) | 143 (33.7%) |
Disability Class: Self-Care Difficulty
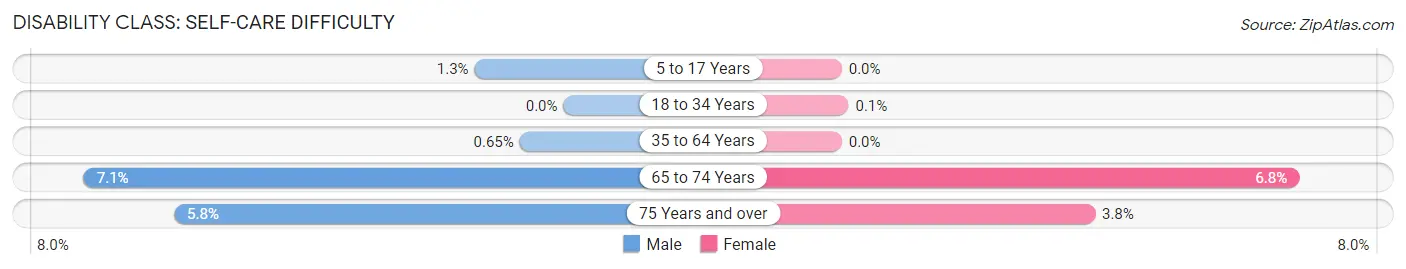
| Age Bracket | Male | Female |
| 5 to 17 Years | 11 (1.3%) | 0 (0.0%) |
| 18 to 34 Years | 0 (0.0%) | 1 (0.1%) |
| 35 to 64 Years | 14 (0.6%) | 0 (0.0%) |
| 65 to 74 Years | 25 (7.1%) | 46 (6.8%) |
| 75 Years and over | 23 (5.8%) | 16 (3.8%) |
Technology Access in Linthicum
Computing Device Access in Linthicum
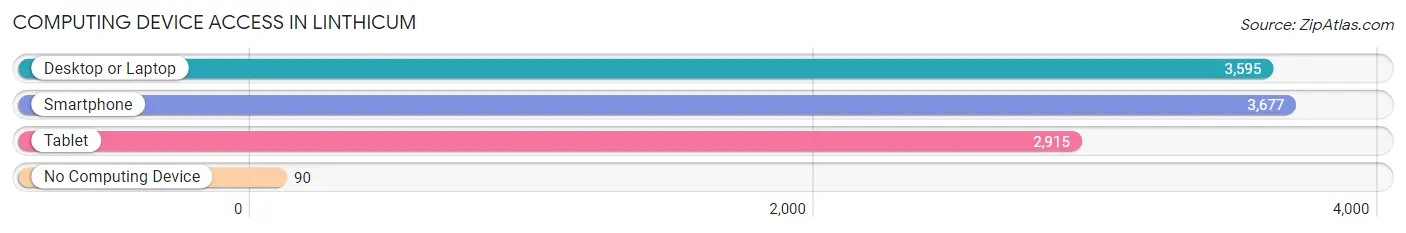
| Device Type | # Households | % Households |
| Desktop or Laptop | 3,595 | 87.5% |
| Smartphone | 3,677 | 89.4% |
| Tablet | 2,915 | 70.9% |
| No Computing Device | 90 | 2.2% |
| Total | 4,111 | 100.0% |
Internet Access in Linthicum
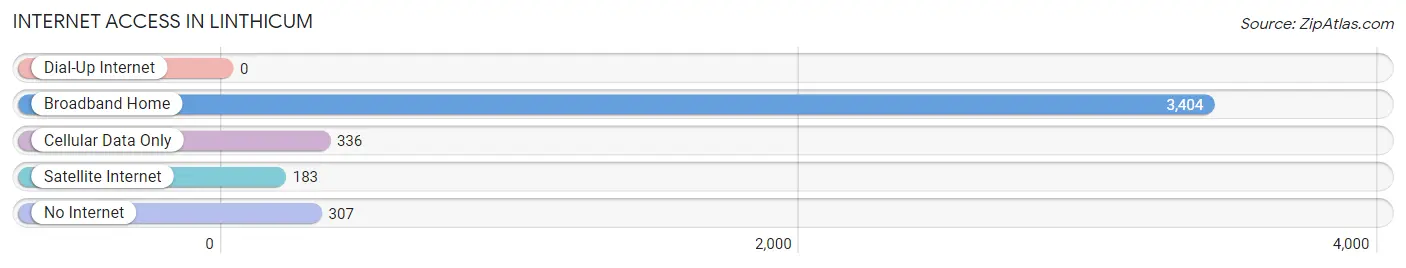
| Internet Type | # Households | % Households |
| Dial-Up Internet | 0 | 0.0% |
| Broadband Home | 3,404 | 82.8% |
| Cellular Data Only | 336 | 8.2% |
| Satellite Internet | 183 | 4.4% |
| No Internet | 307 | 7.5% |
| Total | 4,111 | 100.0% |
Linthicum Summary
Linthicum is an unincorporated community located in Anne Arundel County, Maryland, United States. It is located just north of Baltimore-Washington International Airport and is part of the Baltimore-Washington metropolitan area. The population of Linthicum was 10,324 as of the 2010 census.
History
Linthicum was first settled in the early 1700s by the Linthicum family, who were of English descent. The family owned a large tract of land in the area, which was known as Linthicum Heights. The area was primarily used for farming until the early 1900s, when the Baltimore and Annapolis Railroad was built through the area. This allowed for the development of the community, and the area began to grow.
In the 1920s, the area was annexed by the City of Baltimore, and the name was changed to North Linthicum. The area was then annexed by Anne Arundel County in the 1950s, and the name was changed back to Linthicum.
Geography
Linthicum is located at 39°13'45"N 76°37'17"W (39.229167, -76.621389). It is situated in the Piedmont region of Maryland, and is located just north of Baltimore-Washington International Airport. The area is mostly flat, with some rolling hills.
The climate in Linthicum is humid subtropical, with hot, humid summers and mild winters. The average annual temperature is around 60°F (15°C).
Economy
Linthicum is home to a variety of businesses, including retail stores, restaurants, and professional services. The area is also home to several large employers, including Northrop Grumman, Lockheed Martin, and the U.S. Department of Defense.
Demographics
As of the 2010 census, the population of Linthicum was 10,324. The racial makeup of the community was 79.3% White, 11.2% African American, 4.2% Asian, and 5.3% from other races. The median household income was $76,845, and the median family income was $90,945.
The largest age group in Linthicum is 25-44, making up 33.3% of the population. The median age is 38.7 years. The population is well-educated, with 87.3% of the population having a high school diploma or higher, and 44.2% having a bachelor's degree or higher.
Conclusion
Linthicum is a small, unincorporated community located in Anne Arundel County, Maryland. It is situated in the Piedmont region of Maryland, and is located just north of Baltimore-Washington International Airport. The population of Linthicum was 10,324 as of the 2010 census. The area is home to a variety of businesses, including retail stores, restaurants, and professional services. The largest age group in Linthicum is 25-44, making up 33.3% of the population. The median household income was $76,845, and the median family income was $90,945. Linthicum is a diverse and vibrant community that offers a variety of amenities and opportunities for its residents.
Common Questions
What is Per Capita Income in Linthicum?
Per Capita income in Linthicum is $49,848.
What is the Median Family Income in Linthicum?
Median Family Income in Linthicum is $132,746.
What is the Median Household income in Linthicum?
Median Household Income in Linthicum is $116,250.
What is Income or Wage Gap in Linthicum?
Income or Wage Gap in Linthicum is 31.2%.
Women in Linthicum earn 68.8 cents for every dollar earned by a man.
What is Inequality or Gini Index in Linthicum?
Inequality or Gini Index in Linthicum is 0.32.
What is the Total Population of Linthicum?
Total Population of Linthicum is 10,731.
What is the Total Male Population of Linthicum?
Total Male Population of Linthicum is 5,455.
What is the Total Female Population of Linthicum?
Total Female Population of Linthicum is 5,276.
What is the Ratio of Males per 100 Females in Linthicum?
There are 103.39 Males per 100 Females in Linthicum.
What is the Ratio of Females per 100 Males in Linthicum?
There are 96.72 Females per 100 Males in Linthicum.
What is the Median Population Age in Linthicum?
Median Population Age in Linthicum is 38.6 Years.
What is the Average Family Size in Linthicum
Average Family Size in Linthicum is 3.1 People.
What is the Average Household Size in Linthicum
Average Household Size in Linthicum is 2.6 People.
How Large is the Labor Force in Linthicum?
There are 5,949 People in the Labor Forcein in Linthicum.
What is the Percentage of People in the Labor Force in Linthicum?
69.9% of People are in the Labor Force in Linthicum.
What is the Unemployment Rate in Linthicum?
Unemployment Rate in Linthicum is 2.4%.