Monrovia, MD Map & Demographics
Monrovia Map
Monrovia Overview
$68,888
PER CAPITA INCOME
$224,545
AVG FAMILY INCOME
$224,886
AVG HOUSEHOLD INCOME
1.0%
WAGE / INCOME GAP [ % ]
99.0¢/ $1
WAGE / INCOME GAP [ $ ]
0.30
INEQUALITY / GINI INDEX
2,980
TOTAL POPULATION
1,597
MALE POPULATION
1,383
FEMALE POPULATION
115.47
MALES / 100 FEMALES
86.60
FEMALES / 100 MALES
38.9
MEDIAN AGE
3.7
AVG FAMILY SIZE
3.6
AVG HOUSEHOLD SIZE
1,978
LABOR FORCE [ PEOPLE ]
82.4%
PERCENT IN LABOR FORCE
0.7%
UNEMPLOYMENT RATE
Monrovia Zip Codes
Income in Monrovia
Income Overview in Monrovia
Per Capita Income in Monrovia is $68,888, while median incomes of families and households are $224,545 and $224,886 respectively.
| Characteristic | Number | Measure |
| Per Capita Income | 2,980 | $68,888 |
| Median Family Income | 760 | $224,545 |
| Mean Family Income | 760 | $249,992 |
| Median Household Income | 818 | $224,886 |
| Mean Household Income | 818 | $252,780 |
| Income Deficit | 760 | $0 |
| Wage / Income Gap (%) | 2,980 | 1.02% |
| Wage / Income Gap ($) | 2,980 | 98.98¢ per $1 |
| Gini / Inequality Index | 2,980 | 0.30 |
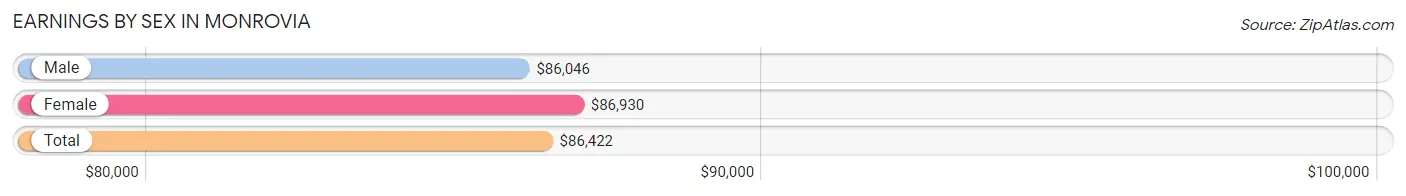
Earnings by Sex in Monrovia
Average Earnings in Monrovia are $86,422, $86,046 for men and $86,930 for women, a difference of 1.0%.
| Sex | Number | Average Earnings |
| Male | 1,189 (58.8%) | $86,046 |
| Female | 835 (41.2%) | $86,930 |
| Total | 2,024 (100.0%) | $86,422 |
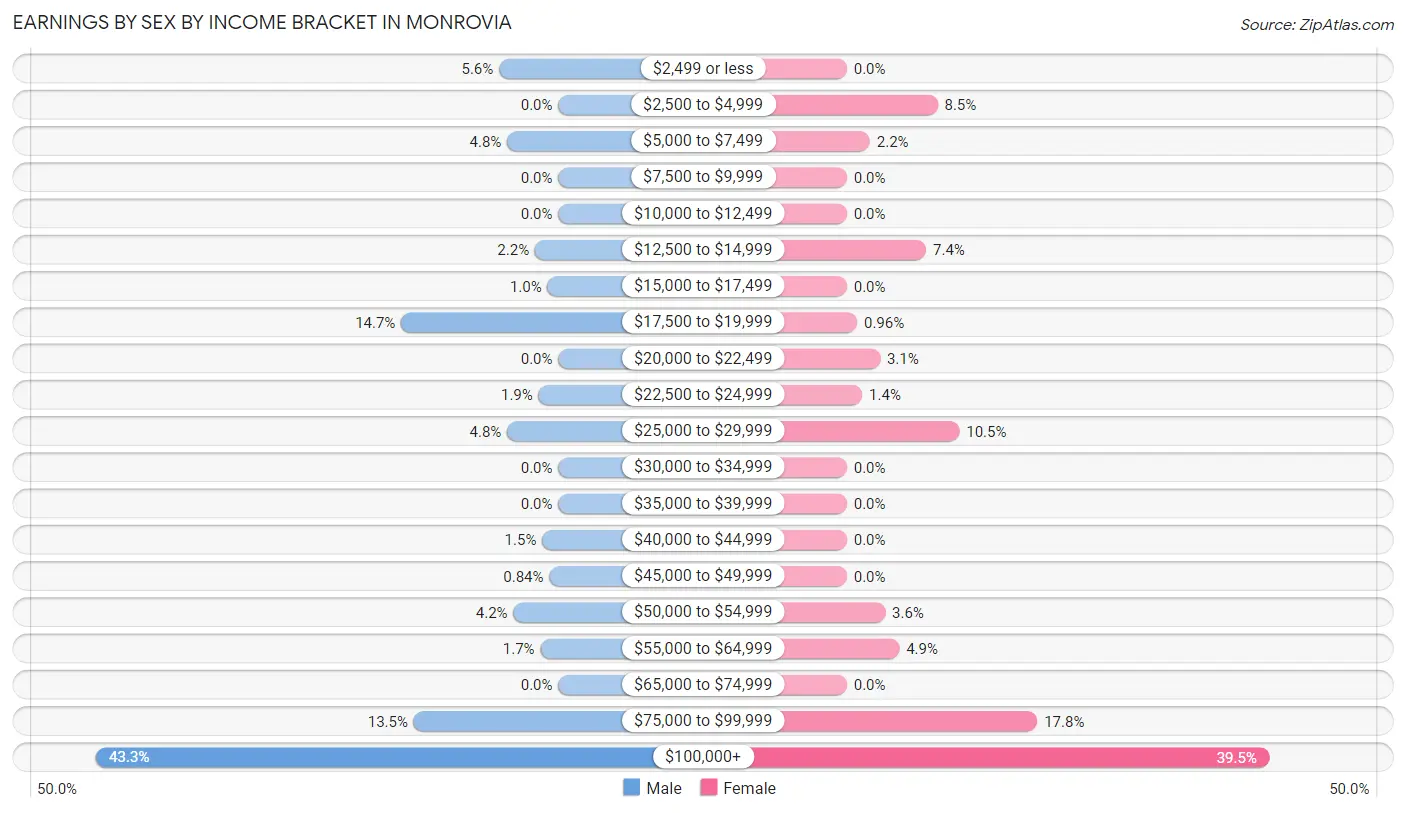
Earnings by Sex by Income Bracket in Monrovia
The most common earnings brackets in Monrovia are $100,000+ for men (515 | 43.3%) and $100,000+ for women (330 | 39.5%).
| Income | Male | Female |
| $2,499 or less | 66 (5.6%) | 0 (0.0%) |
| $2,500 to $4,999 | 0 (0.0%) | 71 (8.5%) |
| $5,000 to $7,499 | 57 (4.8%) | 18 (2.2%) |
| $7,500 to $9,999 | 0 (0.0%) | 0 (0.0%) |
| $10,000 to $12,499 | 0 (0.0%) | 0 (0.0%) |
| $12,500 to $14,999 | 26 (2.2%) | 62 (7.4%) |
| $15,000 to $17,499 | 12 (1.0%) | 0 (0.0%) |
| $17,500 to $19,999 | 175 (14.7%) | 8 (1.0%) |
| $20,000 to $22,499 | 0 (0.0%) | 26 (3.1%) |
| $22,500 to $24,999 | 22 (1.8%) | 12 (1.4%) |
| $25,000 to $29,999 | 57 (4.8%) | 88 (10.5%) |
| $30,000 to $34,999 | 0 (0.0%) | 0 (0.0%) |
| $35,000 to $39,999 | 0 (0.0%) | 0 (0.0%) |
| $40,000 to $44,999 | 18 (1.5%) | 0 (0.0%) |
| $45,000 to $49,999 | 10 (0.8%) | 0 (0.0%) |
| $50,000 to $54,999 | 50 (4.2%) | 30 (3.6%) |
| $55,000 to $64,999 | 20 (1.7%) | 41 (4.9%) |
| $65,000 to $74,999 | 0 (0.0%) | 0 (0.0%) |
| $75,000 to $99,999 | 161 (13.5%) | 149 (17.8%) |
| $100,000+ | 515 (43.3%) | 330 (39.5%) |
| Total | 1,189 (100.0%) | 835 (100.0%) |
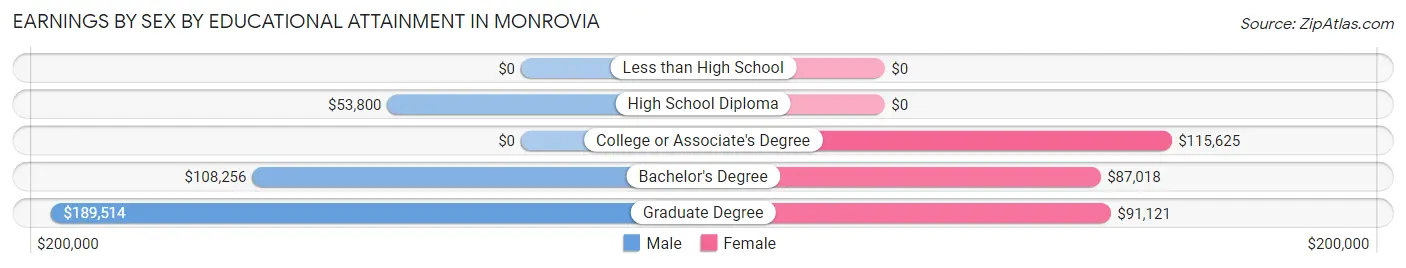
Earnings by Sex by Educational Attainment in Monrovia
Average earnings in Monrovia are $107,834 for men and $91,983 for women, a difference of 14.7%. Men with an educational attainment of graduate degree enjoy the highest average annual earnings of $189,514, while those with high school diploma education earn the least with $53,800. Women with an educational attainment of college or associate's degree earn the most with the average annual earnings of $115,625, while those with bachelor's degree education have the smallest earnings of $87,018.
| Educational Attainment | Male Income | Female Income |
| Less than High School | - | - |
| High School Diploma | $53,800 | $0 |
| College or Associate's Degree | - | - |
| Bachelor's Degree | $108,256 | $87,018 |
| Graduate Degree | $189,514 | $91,121 |
| Total | $107,834 | $91,983 |
Family Income in Monrovia
Family Income Brackets in Monrovia
According to the Monrovia family income data, there are 413 families falling into the $200,000+ income range, which is the most common income bracket and makes up 54.3% of all families.
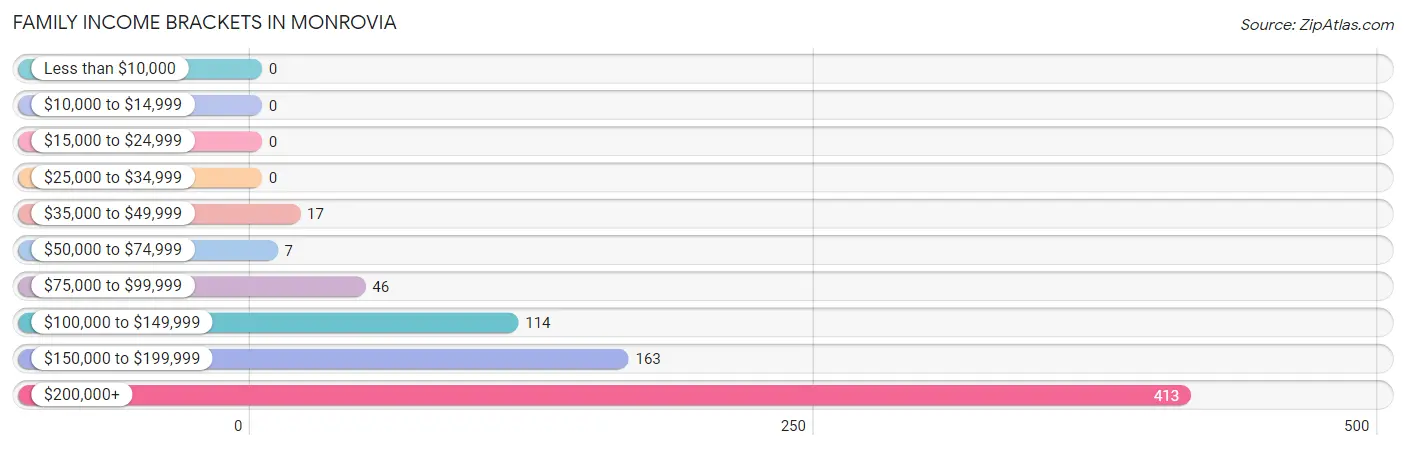
| Income Bracket | # Families | % Families |
| Less than $10,000 | 0 | 0.0% |
| $10,000 to $14,999 | 0 | 0.0% |
| $15,000 to $24,999 | 0 | 0.0% |
| $25,000 to $34,999 | 0 | 0.0% |
| $35,000 to $49,999 | 17 | 2.2% |
| $50,000 to $74,999 | 7 | 0.9% |
| $75,000 to $99,999 | 46 | 6.1% |
| $100,000 to $149,999 | 114 | 15.0% |
| $150,000 to $199,999 | 163 | 21.4% |
| $200,000+ | 413 | 54.3% |
Family Income by Famaliy Size in Monrovia
2-person families (206 | 27.1%) account for the highest median family income in Monrovia with $250,001 per family, while 2-person families (206 | 27.1%) have the highest median income of $125,000 per family member.
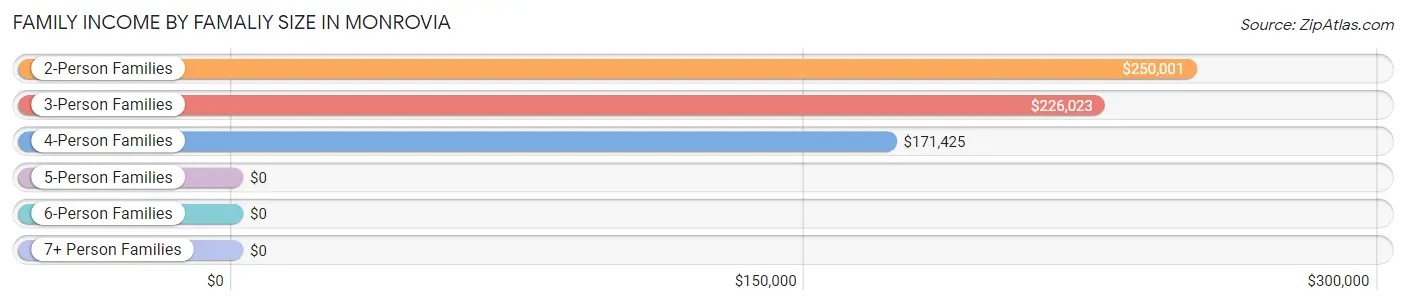
| Income Bracket | # Families | Median Income |
| 2-Person Families | 206 (27.1%) | $250,001 |
| 3-Person Families | 92 (12.1%) | $226,023 |
| 4-Person Families | 359 (47.2%) | $171,425 |
| 5-Person Families | 34 (4.5%) | $0 |
| 6-Person Families | 13 (1.7%) | $0 |
| 7+ Person Families | 56 (7.4%) | $0 |
| Total | 760 (100.0%) | $224,545 |
Family Income by Number of Earners in Monrovia
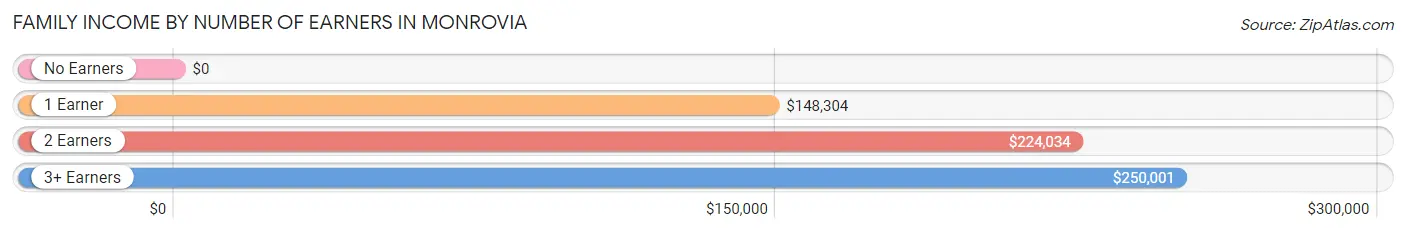
| Number of Earners | # Families | Median Income |
| No Earners | 17 (2.2%) | $0 |
| 1 Earner | 115 (15.1%) | $148,304 |
| 2 Earners | 471 (62.0%) | $224,034 |
| 3+ Earners | 157 (20.7%) | $250,001 |
| Total | 760 (100.0%) | $224,545 |
Household Income in Monrovia
Household Income Brackets in Monrovia
With 445 households falling in the category, the $200,000+ income range is the most frequent in Monrovia, accounting for 54.4% of all households.
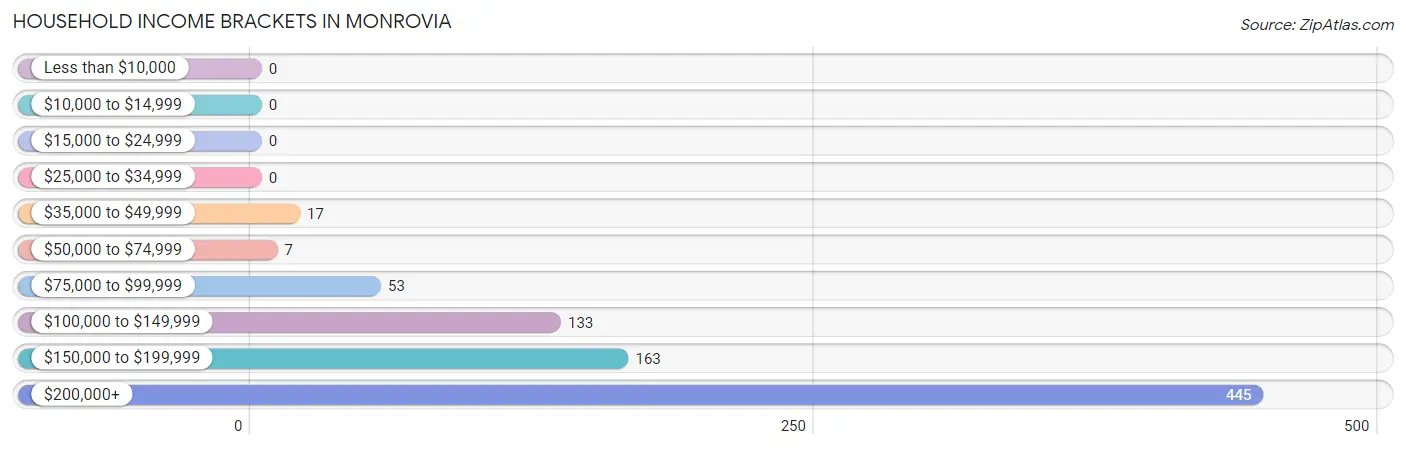
| Income Bracket | # Households | % Households |
| Less than $10,000 | 0 | 0.0% |
| $10,000 to $14,999 | 0 | 0.0% |
| $15,000 to $24,999 | 0 | 0.0% |
| $25,000 to $34,999 | 0 | 0.0% |
| $35,000 to $49,999 | 17 | 2.1% |
| $50,000 to $74,999 | 7 | 0.9% |
| $75,000 to $99,999 | 53 | 6.5% |
| $100,000 to $149,999 | 133 | 16.3% |
| $150,000 to $199,999 | 163 | 19.9% |
| $200,000+ | 445 | 54.4% |
Household Income by Householder Age in Monrovia
The median household income in Monrovia is $224,886, with the highest median household income of $250,001 found in the 45 to 64 years age bracket for the primary householder. A total of 397 households (48.5%) fall into this category.
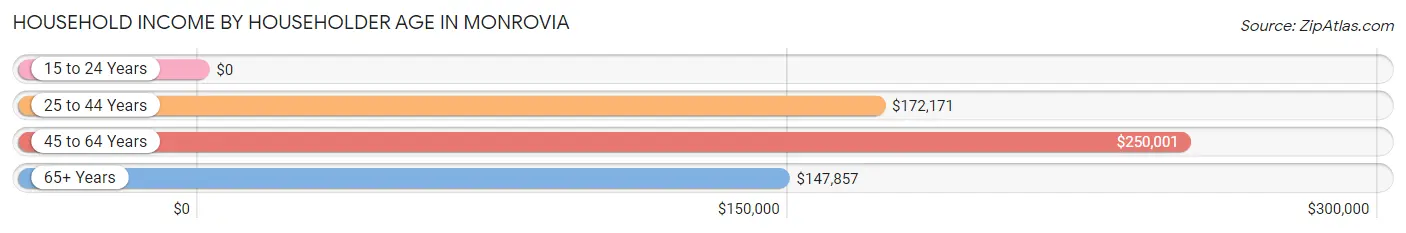
| Income Bracket | # Households | Median Income |
| 15 to 24 Years | 0 (0.0%) | $0 |
| 25 to 44 Years | 363 (44.4%) | $172,171 |
| 45 to 64 Years | 397 (48.5%) | $250,001 |
| 65+ Years | 58 (7.1%) | $147,857 |
| Total | 818 (100.0%) | $224,886 |
Poverty in Monrovia
Income Below Poverty by Sex and Age in Monrovia
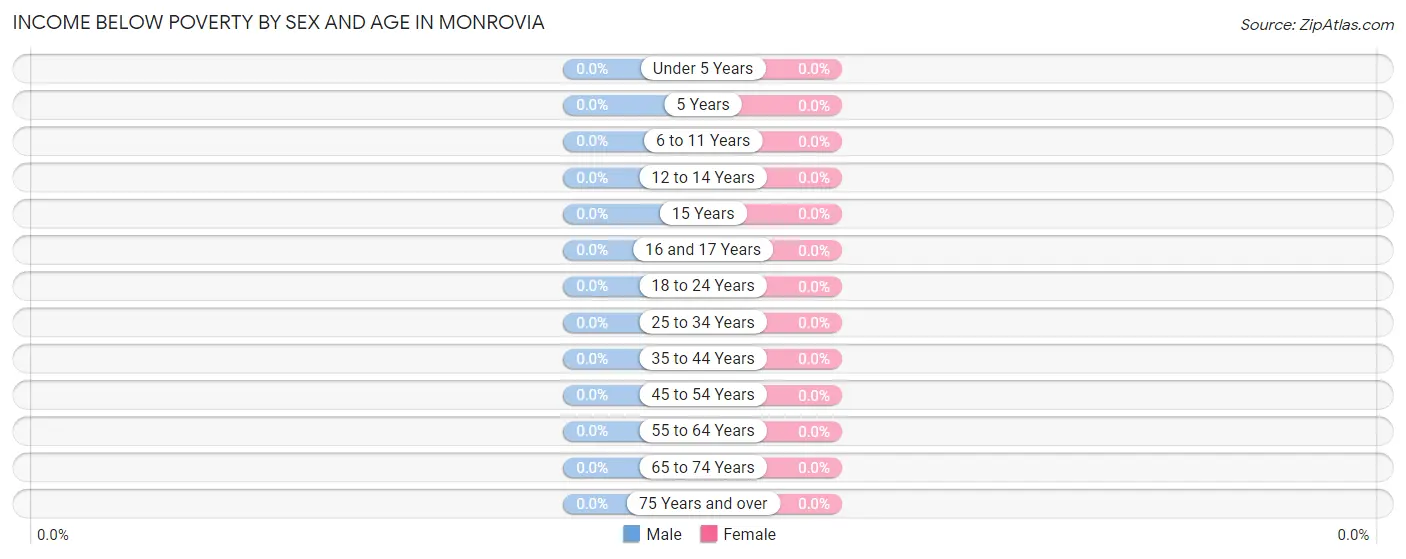
| Age Bracket | Male | Female |
| Under 5 Years | 0 (0.0%) | 0 (0.0%) |
| 5 Years | 0 (0.0%) | 0 (0.0%) |
| 6 to 11 Years | 0 (0.0%) | 0 (0.0%) |
| 12 to 14 Years | 0 (0.0%) | 0 (0.0%) |
| 15 Years | 0 (0.0%) | 0 (0.0%) |
| 16 and 17 Years | 0 (0.0%) | 0 (0.0%) |
| 18 to 24 Years | 0 (0.0%) | 0 (0.0%) |
| 25 to 34 Years | 0 (0.0%) | 0 (0.0%) |
| 35 to 44 Years | 0 (0.0%) | 0 (0.0%) |
| 45 to 54 Years | 0 (0.0%) | 0 (0.0%) |
| 55 to 64 Years | 0 (0.0%) | 0 (0.0%) |
| 65 to 74 Years | 0 (0.0%) | 0 (0.0%) |
| 75 Years and over | 0 (0.0%) | 0 (0.0%) |
| Total | 0 (0.0%) | 0 (0.0%) |
Income Above Poverty by Sex and Age in Monrovia
According to the poverty statistics in Monrovia, males aged under 5 years and females aged under 5 years are the age groups that are most secure financially, with 100.0% of males and 100.0% of females in these age groups living above the poverty line.
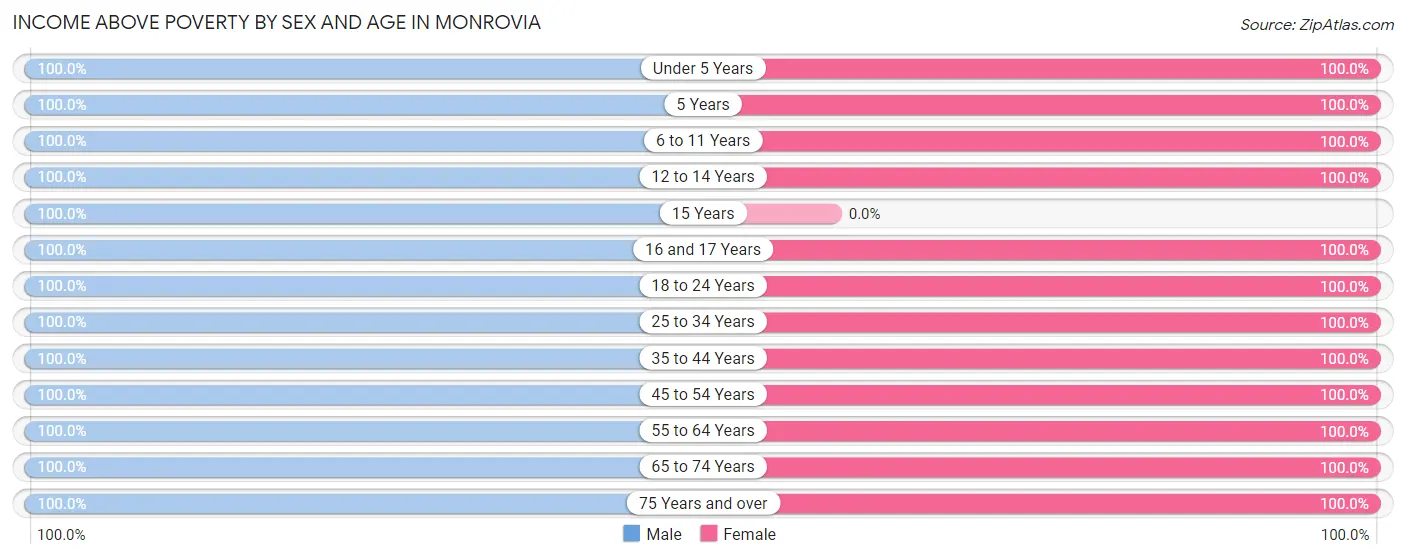
| Age Bracket | Male | Female |
| Under 5 Years | 55 (100.0%) | 72 (100.0%) |
| 5 Years | 28 (100.0%) | 50 (100.0%) |
| 6 to 11 Years | 108 (100.0%) | 130 (100.0%) |
| 12 to 14 Years | 88 (100.0%) | 39 (100.0%) |
| 15 Years | 10 (100.0%) | 0 (0.0%) |
| 16 and 17 Years | 45 (100.0%) | 39 (100.0%) |
| 18 to 24 Years | 216 (100.0%) | 133 (100.0%) |
| 25 to 34 Years | 165 (100.0%) | 72 (100.0%) |
| 35 to 44 Years | 371 (100.0%) | 297 (100.0%) |
| 45 to 54 Years | 213 (100.0%) | 213 (100.0%) |
| 55 to 64 Years | 159 (100.0%) | 191 (100.0%) |
| 65 to 74 Years | 79 (100.0%) | 130 (100.0%) |
| 75 Years and over | 60 (100.0%) | 17 (100.0%) |
| Total | 1,597 (100.0%) | 1,383 (100.0%) |
Income Below Poverty Among Married-Couple Families in Monrovia
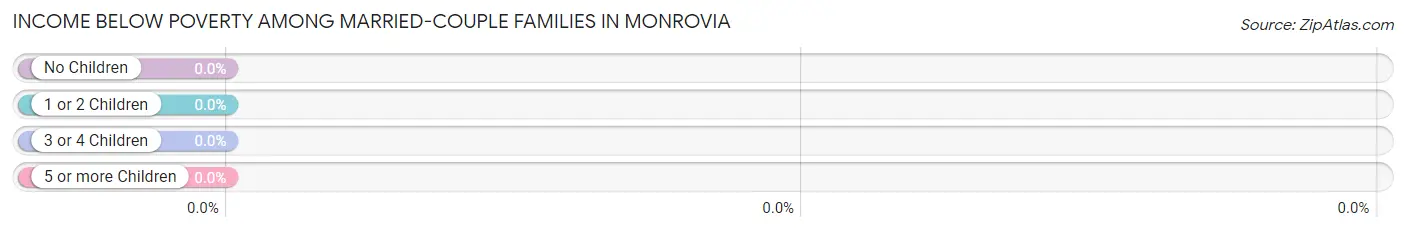
| Children | Above Poverty | Below Poverty |
| No Children | 323 (100.0%) | 0 (0.0%) |
| 1 or 2 Children | 394 (100.0%) | 0 (0.0%) |
| 3 or 4 Children | 30 (100.0%) | 0 (0.0%) |
| 5 or more Children | 0 (0.0%) | 0 (0.0%) |
| Total | 747 (100.0%) | 0 (0.0%) |
Income Below Poverty Among Single-Parent Households in Monrovia
| Children | Single Father | Single Mother |
| No Children | 0 (0.0%) | 0 (0.0%) |
| 1 or 2 Children | 0 (0.0%) | 0 (0.0%) |
| 3 or 4 Children | 0 (0.0%) | 0 (0.0%) |
| 5 or more Children | 0 (0.0%) | 0 (0.0%) |
| Total | 0 (0.0%) | 0 (0.0%) |
Income Below Poverty Among Married-Couple vs Single-Parent Households in Monrovia
| Children | Married-Couple Families | Single-Parent Households |
| No Children | 0 (0.0%) | 0 (0.0%) |
| 1 or 2 Children | 0 (0.0%) | 0 (0.0%) |
| 3 or 4 Children | 0 (0.0%) | 0 (0.0%) |
| 5 or more Children | 0 (0.0%) | 0 (0.0%) |
| Total | 0 (0.0%) | 0 (0.0%) |
Race in Monrovia
The most populous races in Monrovia are White / Caucasian (1,199 | 40.2%), Black / African American (781 | 26.2%), and Asian (753 | 25.3%).
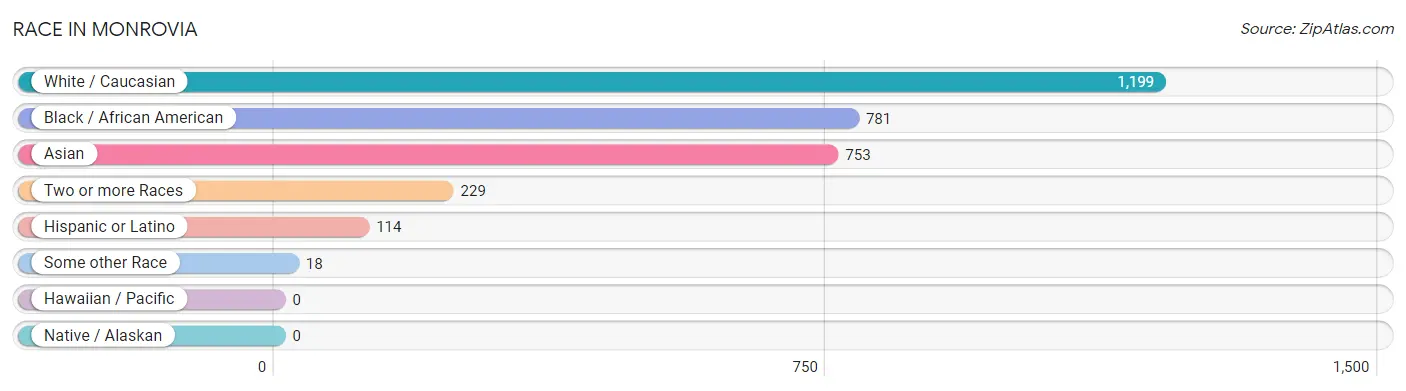
| Race | # Population | % Population |
| Asian | 753 | 25.3% |
| Black / African American | 781 | 26.2% |
| Hawaiian / Pacific | 0 | 0.0% |
| Hispanic or Latino | 114 | 3.8% |
| Native / Alaskan | 0 | 0.0% |
| White / Caucasian | 1,199 | 40.2% |
| Two or more Races | 229 | 7.7% |
| Some other Race | 18 | 0.6% |
| Total | 2,980 | 100.0% |
Ancestry in Monrovia
The most populous ancestries reported in Monrovia are Thai (453 | 15.2%), Trinidadian and Tobagonian (396 | 13.3%), Irish (354 | 11.9%), Subsaharan African (270 | 9.1%), and Korean (251 | 8.4%), together accounting for 57.9% of all Monrovia residents.
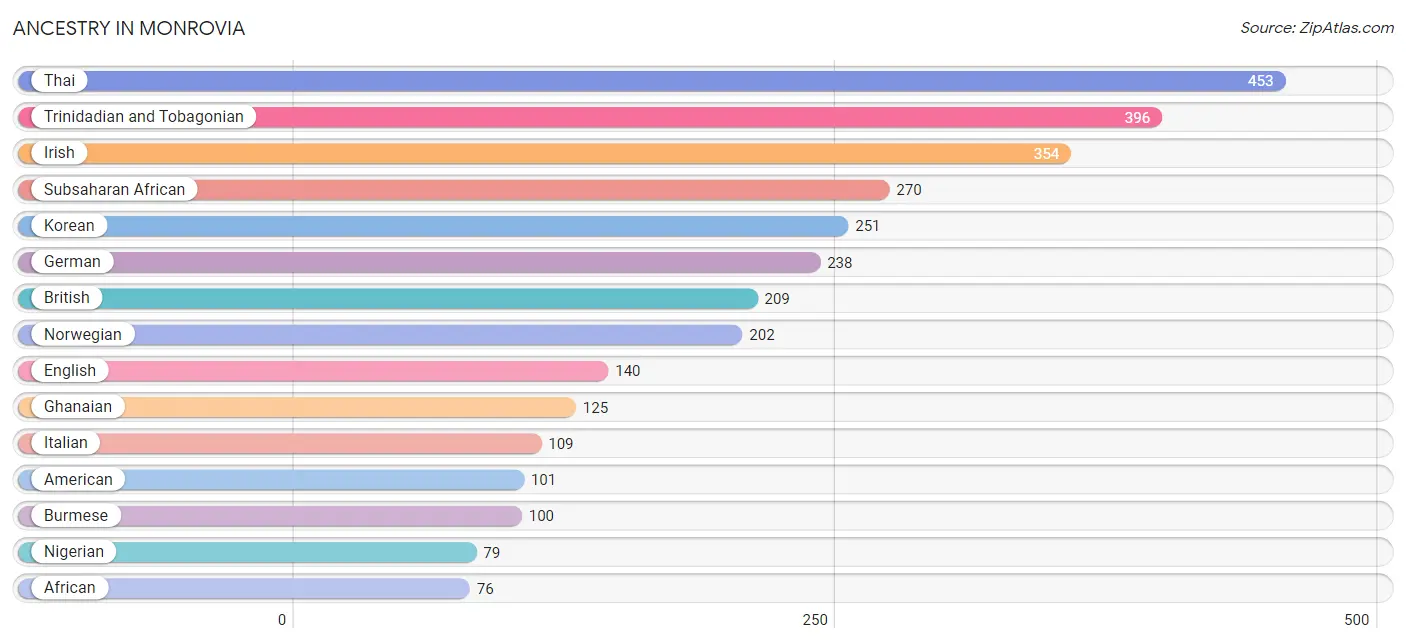
| Ancestry | # Population | % Population |
| African | 76 | 2.5% |
| Albanian | 25 | 0.8% |
| American | 101 | 3.4% |
| Arab | 11 | 0.4% |
| Austrian | 27 | 0.9% |
| Bhutanese | 29 | 1.0% |
| British | 209 | 7.0% |
| Burmese | 100 | 3.4% |
| Canadian | 8 | 0.3% |
| Central American | 36 | 1.2% |
| English | 140 | 4.7% |
| European | 17 | 0.6% |
| French | 7 | 0.2% |
| French Canadian | 6 | 0.2% |
| German | 238 | 8.0% |
| Ghanaian | 125 | 4.2% |
| Guatemalan | 18 | 0.6% |
| Honduran | 18 | 0.6% |
| Irish | 354 | 11.9% |
| Italian | 109 | 3.7% |
| Kenyan | 69 | 2.3% |
| Korean | 251 | 8.4% |
| Mexican | 53 | 1.8% |
| Moroccan | 11 | 0.4% |
| Nigerian | 79 | 2.6% |
| Norwegian | 202 | 6.8% |
| Polish | 18 | 0.6% |
| Russian | 22 | 0.7% |
| Scandinavian | 10 | 0.3% |
| Scottish | 47 | 1.6% |
| South American | 25 | 0.8% |
| Subsaharan African | 270 | 9.1% |
| Swedish | 7 | 0.2% |
| Swiss | 41 | 1.4% |
| Thai | 453 | 15.2% |
| Trinidadian and Tobagonian | 396 | 13.3% |
| Welsh | 7 | 0.2% | View All 37 Rows |
Immigrants in Monrovia
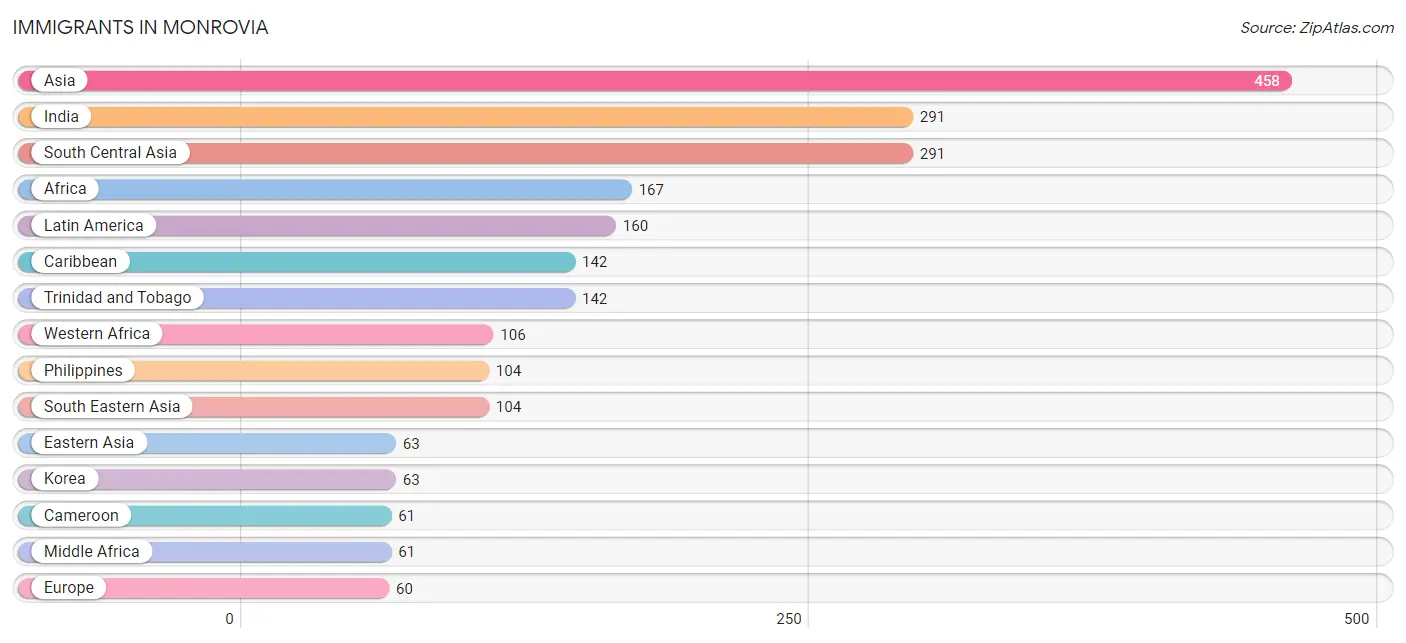
The most numerous immigrant groups reported in Monrovia came from Asia (458 | 15.4%), India (291 | 9.8%), South Central Asia (291 | 9.8%), Africa (167 | 5.6%), and Latin America (160 | 5.4%), together accounting for 45.9% of all Monrovia residents.
| Immigration Origin | # Population | % Population |
| Africa | 167 | 5.6% |
| Albania | 9 | 0.3% |
| Asia | 458 | 15.4% |
| Cameroon | 61 | 2.1% |
| Caribbean | 142 | 4.8% |
| Central America | 18 | 0.6% |
| Eastern Asia | 63 | 2.1% |
| Eastern Europe | 31 | 1.0% |
| Europe | 60 | 2.0% |
| France | 7 | 0.2% |
| Germany | 11 | 0.4% |
| Ghana | 49 | 1.6% |
| Guatemala | 18 | 0.6% |
| India | 291 | 9.8% |
| Korea | 63 | 2.1% |
| Latin America | 160 | 5.4% |
| Middle Africa | 61 | 2.1% |
| Nigeria | 57 | 1.9% |
| Northern Europe | 11 | 0.4% |
| Philippines | 104 | 3.5% |
| Russia | 22 | 0.7% |
| South Central Asia | 291 | 9.8% |
| South Eastern Asia | 104 | 3.5% |
| Trinidad and Tobago | 142 | 4.8% |
| Western Africa | 106 | 3.6% |
| Western Europe | 18 | 0.6% | View All 26 Rows |
Sex and Age in Monrovia
Sex and Age in Monrovia
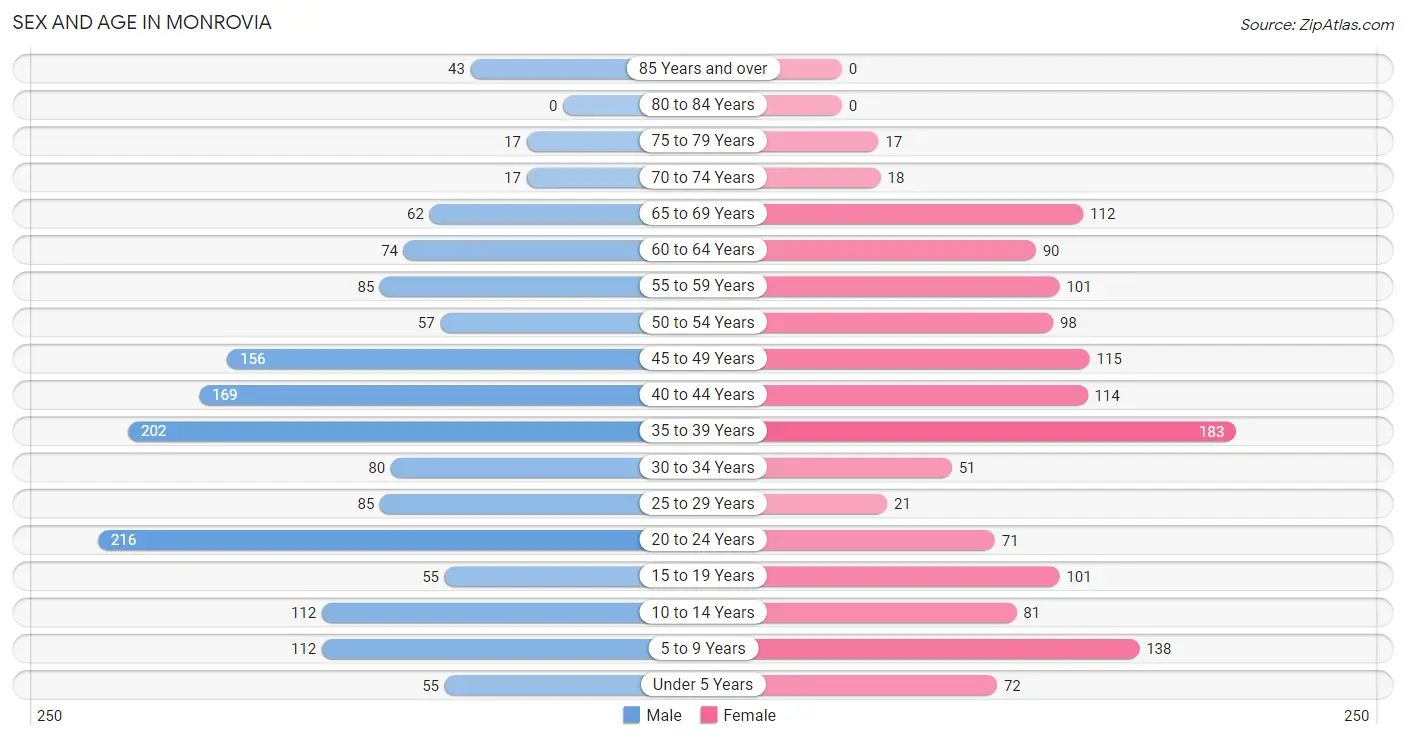
The most populous age groups in Monrovia are 20 to 24 Years (216 | 13.5%) for men and 35 to 39 Years (183 | 13.2%) for women.
| Age Bracket | Male | Female |
| Under 5 Years | 55 (3.4%) | 72 (5.2%) |
| 5 to 9 Years | 112 (7.0%) | 138 (10.0%) |
| 10 to 14 Years | 112 (7.0%) | 81 (5.9%) |
| 15 to 19 Years | 55 (3.4%) | 101 (7.3%) |
| 20 to 24 Years | 216 (13.5%) | 71 (5.1%) |
| 25 to 29 Years | 85 (5.3%) | 21 (1.5%) |
| 30 to 34 Years | 80 (5.0%) | 51 (3.7%) |
| 35 to 39 Years | 202 (12.7%) | 183 (13.2%) |
| 40 to 44 Years | 169 (10.6%) | 114 (8.2%) |
| 45 to 49 Years | 156 (9.8%) | 115 (8.3%) |
| 50 to 54 Years | 57 (3.6%) | 98 (7.1%) |
| 55 to 59 Years | 85 (5.3%) | 101 (7.3%) |
| 60 to 64 Years | 74 (4.6%) | 90 (6.5%) |
| 65 to 69 Years | 62 (3.9%) | 112 (8.1%) |
| 70 to 74 Years | 17 (1.1%) | 18 (1.3%) |
| 75 to 79 Years | 17 (1.1%) | 17 (1.2%) |
| 80 to 84 Years | 0 (0.0%) | 0 (0.0%) |
| 85 Years and over | 43 (2.7%) | 0 (0.0%) |
| Total | 1,597 (100.0%) | 1,383 (100.0%) |
Families and Households in Monrovia
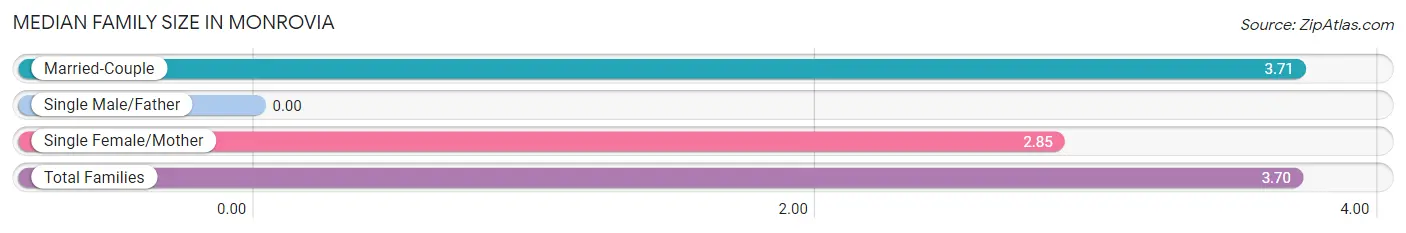
Median Family Size in Monrovia
| Family Type | # Families | Family Size |
| Married-Couple | 747 (98.3%) | 3.71 |
| Single Male/Father | 0 (0.0%) | - |
| Single Female/Mother | 13 (1.7%) | 2.85 |
| Total Families | 760 (100.0%) | 3.70 |
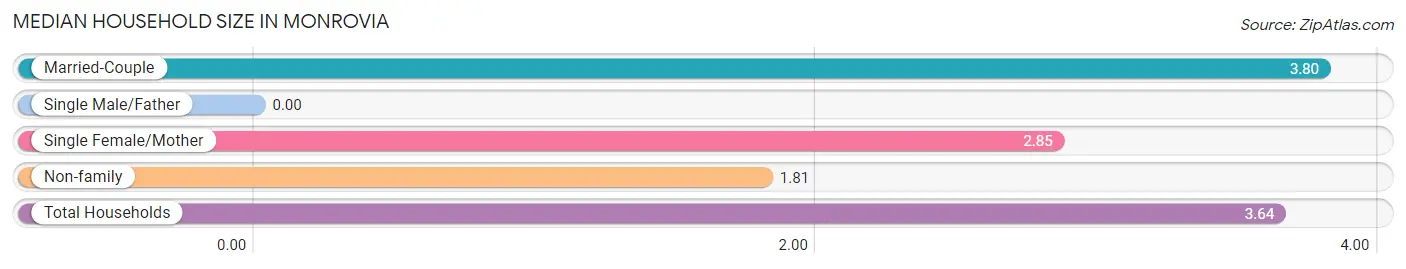
Median Household Size in Monrovia
| Household Type | # Households | Household Size |
| Married-Couple | 747 (91.3%) | 3.80 |
| Single Male/Father | 0 (0.0%) | - |
| Single Female/Mother | 13 (1.6%) | 2.85 |
| Non-family | 58 (7.1%) | 1.81 |
| Total Households | 818 (100.0%) | 3.64 |
Household Size by Marriage Status in Monrovia
Out of a total of 818 households in Monrovia, 760 (92.9%) are family households, while 58 (7.1%) are nonfamily households. The most numerous type of family households are 4-person households, comprising 309, and the most common type of nonfamily households are 2-person households, comprising 42.
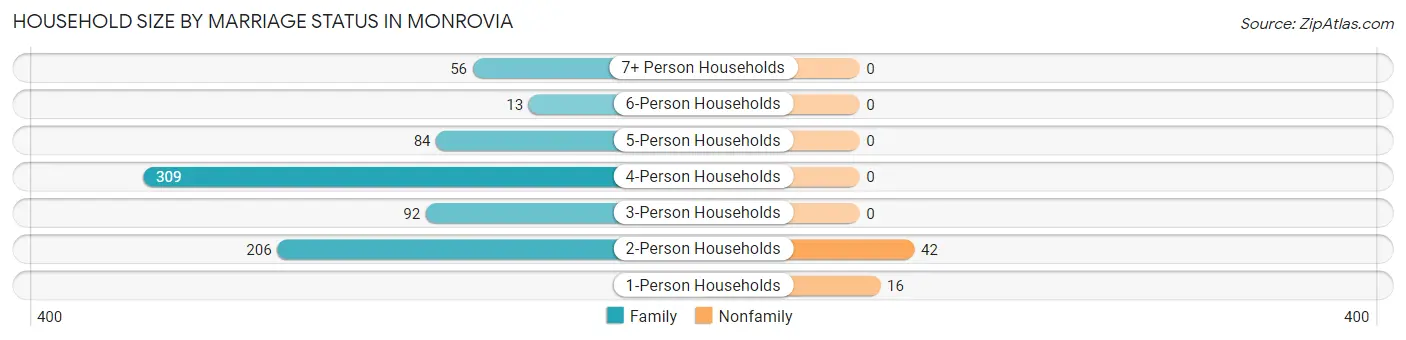
| Household Size | Family Households | Nonfamily Households |
| 1-Person Households | - | 16 (2.0%) |
| 2-Person Households | 206 (25.2%) | 42 (5.1%) |
| 3-Person Households | 92 (11.3%) | 0 (0.0%) |
| 4-Person Households | 309 (37.8%) | 0 (0.0%) |
| 5-Person Households | 84 (10.3%) | 0 (0.0%) |
| 6-Person Households | 13 (1.6%) | 0 (0.0%) |
| 7+ Person Households | 56 (6.9%) | 0 (0.0%) |
| Total | 760 (92.9%) | 58 (7.1%) |
Female Fertility in Monrovia
Fertility by Age in Monrovia
Average fertility rate in Monrovia is 63.0 births per 1,000 women. Women in the age bracket of 35 to 50 years have the highest fertility rate with 76.0 births per 1,000 women. Women in the age bracket of 35 to 50 years acount for 79.5% of all women with births.
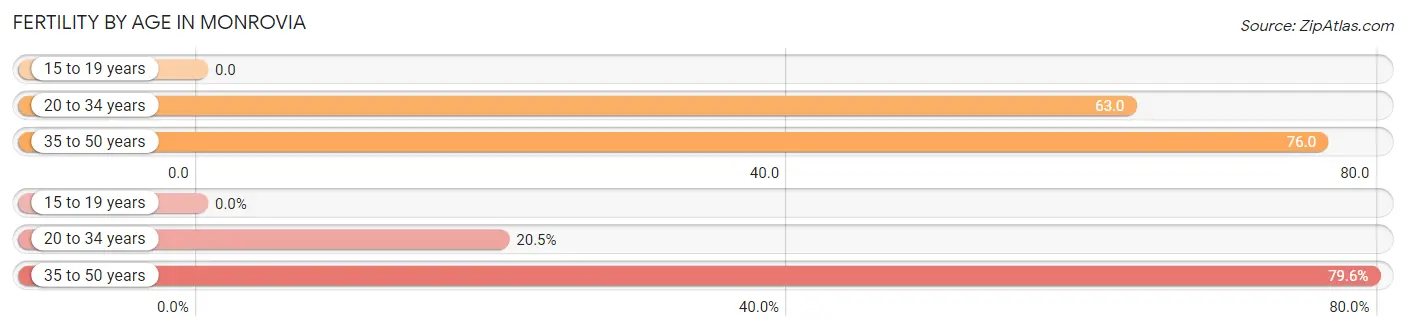
| Age Bracket | Women with Births | Births / 1,000 Women |
| 15 to 19 years | 0 (0.0%) | 0.0 |
| 20 to 34 years | 9 (20.4%) | 63.0 |
| 35 to 50 years | 35 (79.5%) | 76.0 |
| Total | 44 (100.0%) | 63.0 |
Fertility by Age by Marriage Status in Monrovia
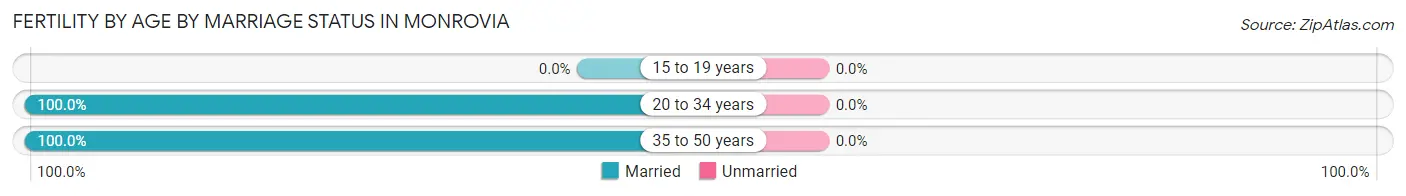
| Age Bracket | Married | Unmarried |
| 15 to 19 years | 0 (0.0%) | 0 (0.0%) |
| 20 to 34 years | 9 (100.0%) | 0 (0.0%) |
| 35 to 50 years | 35 (100.0%) | 0 (0.0%) |
| Total | 44 (100.0%) | 0 (0.0%) |
Fertility by Education in Monrovia
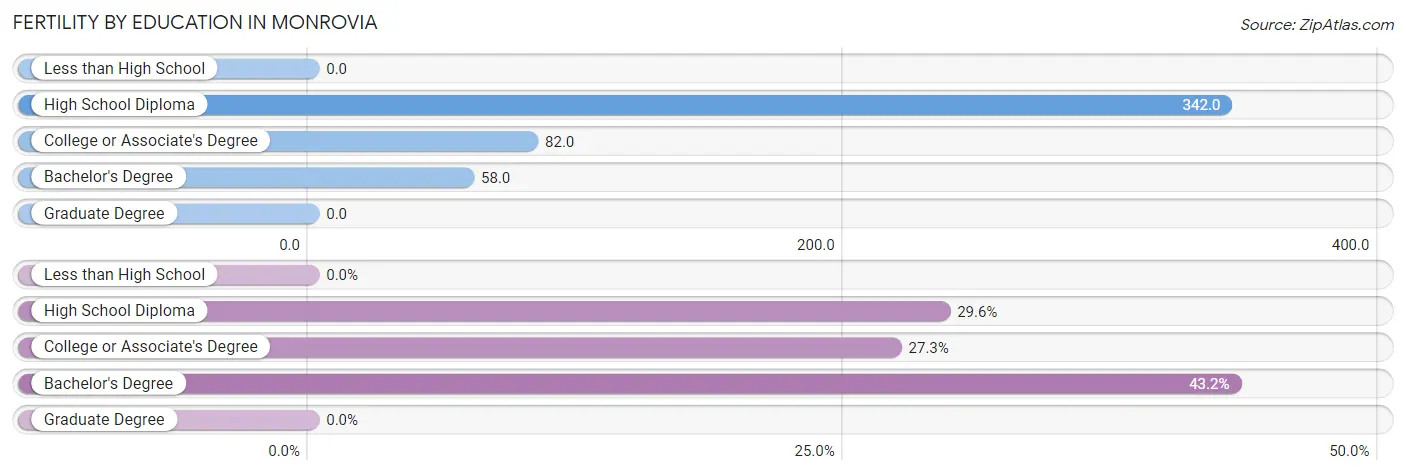
| Educational Attainment | Women with Births | Births / 1,000 Women |
| Less than High School | 0 (0.0%) | 0.0 |
| High School Diploma | 13 (29.5%) | 342.0 |
| College or Associate's Degree | 12 (27.3%) | 82.0 |
| Bachelor's Degree | 19 (43.2%) | 58.0 |
| Graduate Degree | 0 (0.0%) | 0.0 |
| Total | 44 (100.0%) | 63.0 |
Fertility by Education by Marriage Status in Monrovia
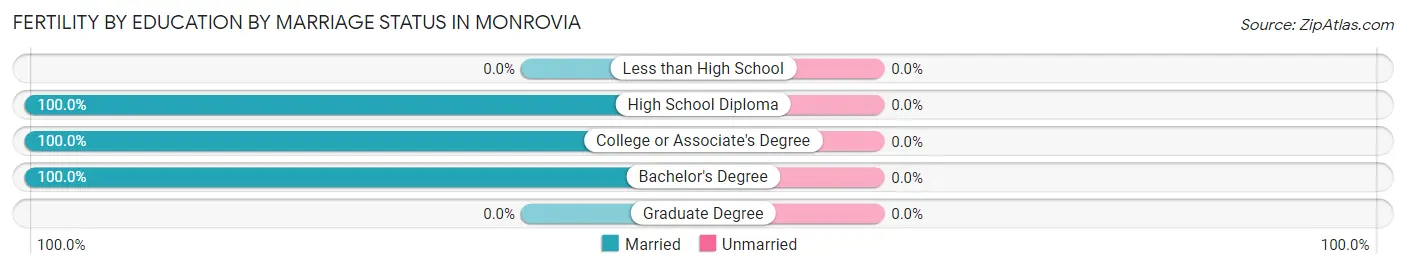
| Educational Attainment | Married | Unmarried |
| Less than High School | 0 (0.0%) | 0 (0.0%) |
| High School Diploma | 13 (100.0%) | 0 (0.0%) |
| College or Associate's Degree | 12 (100.0%) | 0 (0.0%) |
| Bachelor's Degree | 19 (100.0%) | 0 (0.0%) |
| Graduate Degree | 0 (0.0%) | 0 (0.0%) |
| Total | 44 (100.0%) | 0 (0.0%) |
Employment Characteristics in Monrovia
Employment by Class of Employer in Monrovia
Among the 1,957 employed individuals in Monrovia, private company employees (1,243 | 63.5%), federal government employees (315 | 16.1%), and local government employees (126 | 6.4%) make up the most common classes of employment.
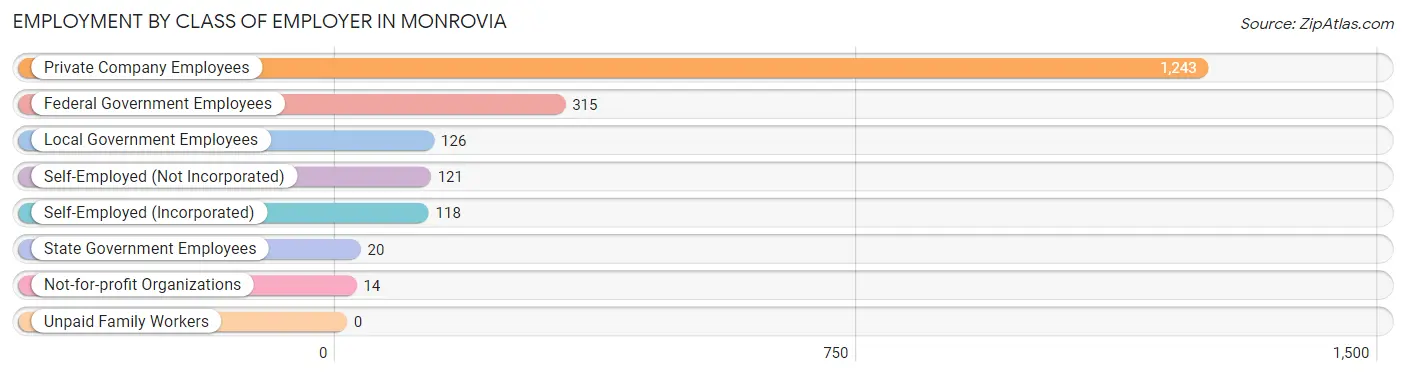
| Employer Class | # Employees | % Employees |
| Private Company Employees | 1,243 | 63.5% |
| Self-Employed (Incorporated) | 118 | 6.0% |
| Self-Employed (Not Incorporated) | 121 | 6.2% |
| Not-for-profit Organizations | 14 | 0.7% |
| Local Government Employees | 126 | 6.4% |
| State Government Employees | 20 | 1.0% |
| Federal Government Employees | 315 | 16.1% |
| Unpaid Family Workers | 0 | 0.0% |
| Total | 1,957 | 100.0% |
Employment Status by Age in Monrovia
According to the labor force statistics for Monrovia, out of the total population over 16 years of age (2,400), 82.4% or 1,978 individuals are in the labor force, with 0.7% or 14 of them unemployed. The age group with the highest labor force participation rate is 55 to 59 years, with 100.0% or 186 individuals in the labor force. Within the labor force, the 45 to 54 years age range has the highest percentage of unemployed individuals, with 3.3% or 13 of them being unemployed.
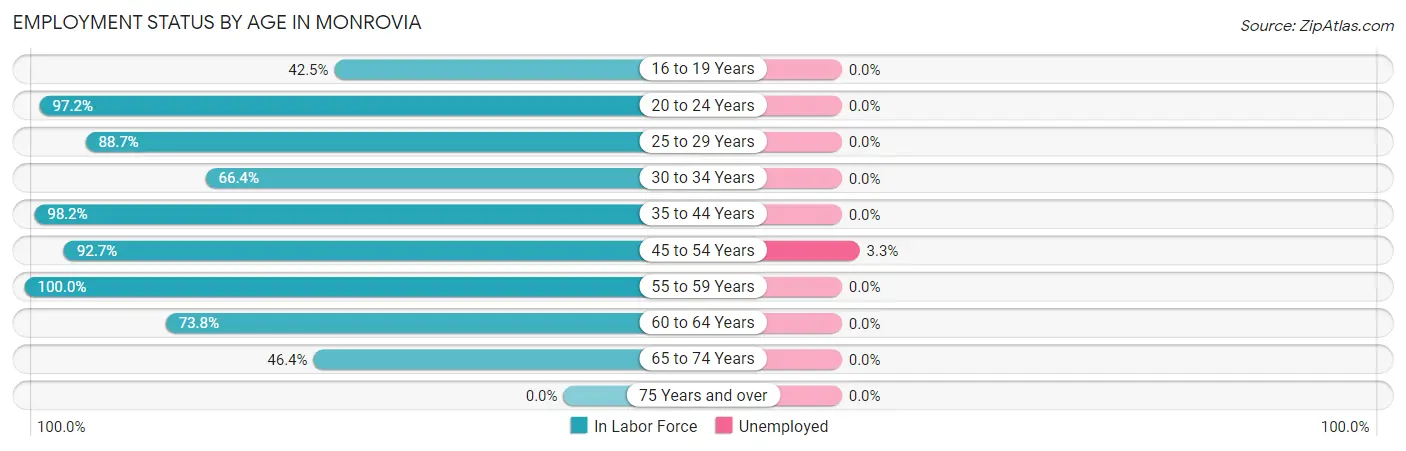
| Age Bracket | In Labor Force | Unemployed |
| 16 to 19 Years | 62 (42.5%) | 0 (0.0%) |
| 20 to 24 Years | 279 (97.2%) | 0 (0.0%) |
| 25 to 29 Years | 94 (88.7%) | 0 (0.0%) |
| 30 to 34 Years | 87 (66.4%) | 0 (0.0%) |
| 35 to 44 Years | 656 (98.2%) | 0 (0.0%) |
| 45 to 54 Years | 395 (92.7%) | 13 (3.3%) |
| 55 to 59 Years | 186 (100.0%) | 0 (0.0%) |
| 60 to 64 Years | 121 (73.8%) | 0 (0.0%) |
| 65 to 74 Years | 97 (46.4%) | 0 (0.0%) |
| 75 Years and over | 0 (0.0%) | 0 (0.0%) |
| Total | 1,978 (82.4%) | 14 (0.7%) |
Employment Status by Educational Attainment in Monrovia
According to labor force statistics for Monrovia, 91.6% of individuals (1,540) out of the total population between 25 and 64 years of age (1,681) are in the labor force, with 0.9% or 14 of them being unemployed. The group with the highest labor force participation rate are those with the educational attainment of bachelor's degree or higher, with 92.4% or 1,068 individuals in the labor force. Within the labor force, individuals with high school diploma education have the highest percentage of unemployment, with 9.4% or 13 of them being unemployed.
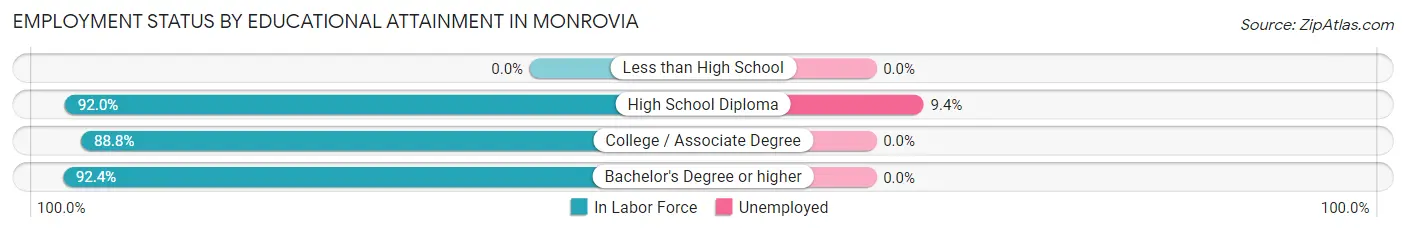
| Educational Attainment | In Labor Force | Unemployed |
| Less than High School | 0 (0.0%) | 0 (0.0%) |
| High School Diploma | 138 (92.0%) | 14 (9.4%) |
| College / Associate Degree | 333 (88.8%) | 0 (0.0%) |
| Bachelor's Degree or higher | 1,068 (92.4%) | 0 (0.0%) |
| Total | 1,540 (91.6%) | 15 (0.9%) |
Employment Occupations by Sex in Monrovia
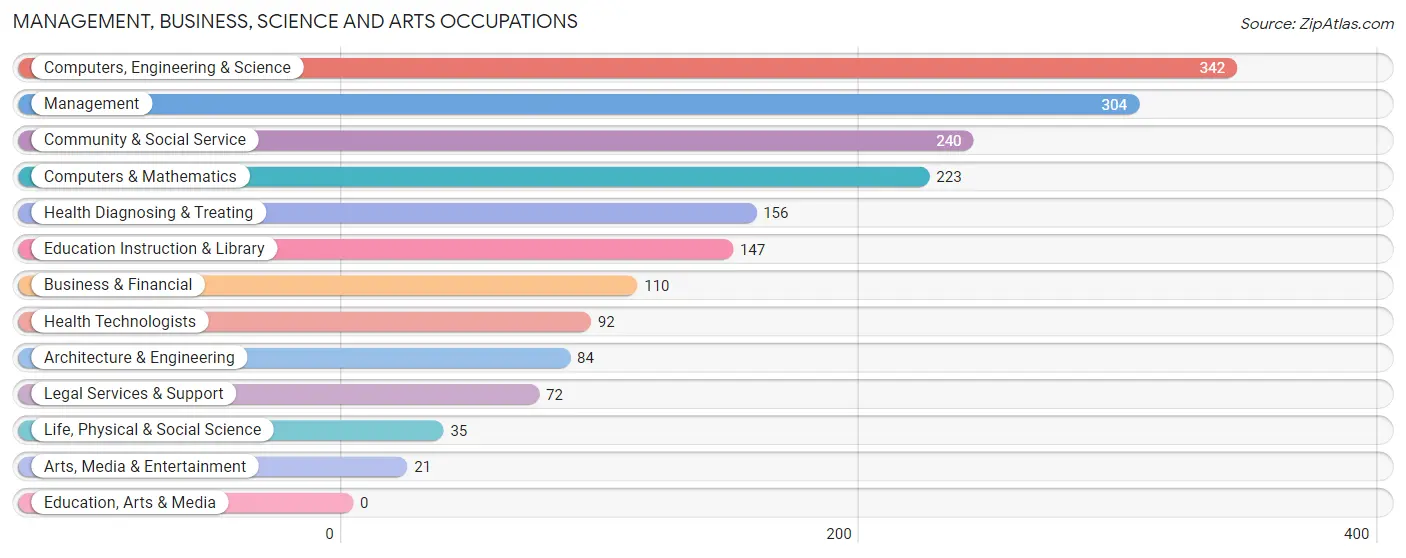
Management, Business, Science and Arts Occupations
The most common Management, Business, Science and Arts occupations in Monrovia are Computers, Engineering & Science (342 | 17.7%), Management (304 | 15.7%), Community & Social Service (240 | 12.4%), Computers & Mathematics (223 | 11.6%), and Health Diagnosing & Treating (156 | 8.1%).
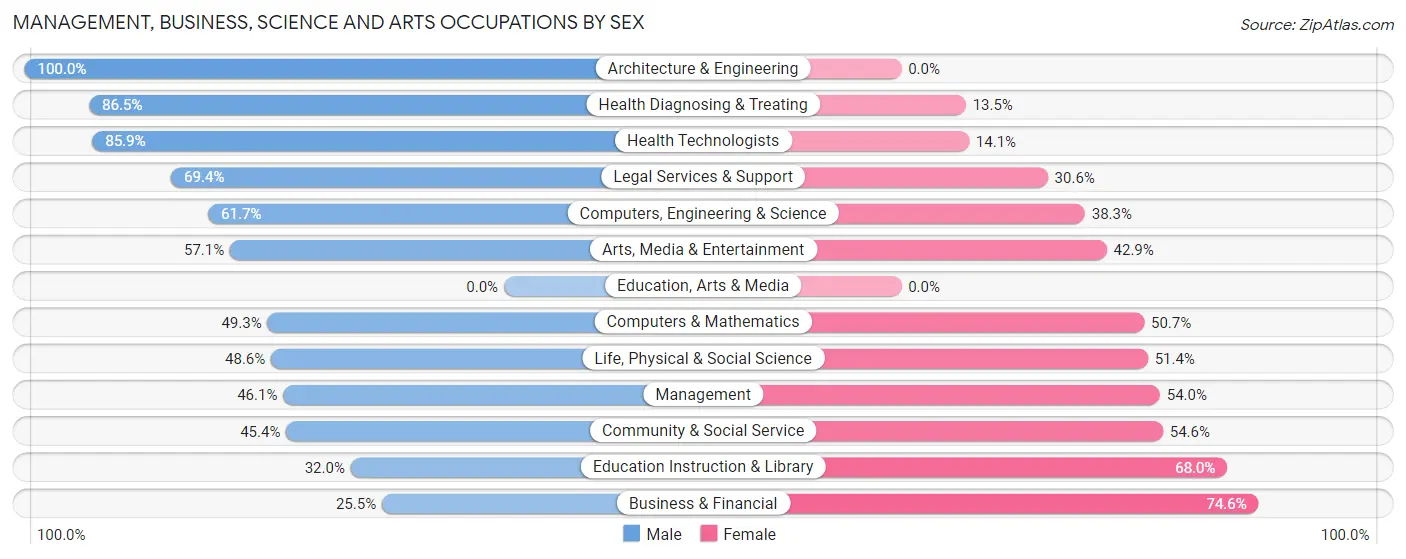
Management, Business, Science and Arts Occupations by Sex
Within the Management, Business, Science and Arts occupations in Monrovia, the most male-oriented occupations are Architecture & Engineering (100.0%), Health Diagnosing & Treating (86.5%), and Health Technologists (85.9%), while the most female-oriented occupations are Business & Financial (74.6%), Education Instruction & Library (68.0%), and Community & Social Service (54.6%).
| Occupation | Male | Female |
| Management | 140 (46.1%) | 164 (53.9%) |
| Business & Financial | 28 (25.5%) | 82 (74.6%) |
| Computers, Engineering & Science | 211 (61.7%) | 131 (38.3%) |
| Computers & Mathematics | 110 (49.3%) | 113 (50.7%) |
| Architecture & Engineering | 84 (100.0%) | 0 (0.0%) |
| Life, Physical & Social Science | 17 (48.6%) | 18 (51.4%) |
| Community & Social Service | 109 (45.4%) | 131 (54.6%) |
| Education, Arts & Media | 0 (0.0%) | 0 (0.0%) |
| Legal Services & Support | 50 (69.4%) | 22 (30.6%) |
| Education Instruction & Library | 47 (32.0%) | 100 (68.0%) |
| Arts, Media & Entertainment | 12 (57.1%) | 9 (42.9%) |
| Health Diagnosing & Treating | 135 (86.5%) | 21 (13.5%) |
| Health Technologists | 79 (85.9%) | 13 (14.1%) |
| Total (Category) | 623 (54.1%) | 529 (45.9%) |
| Total (Overall) | 1,144 (59.2%) | 787 (40.8%) |
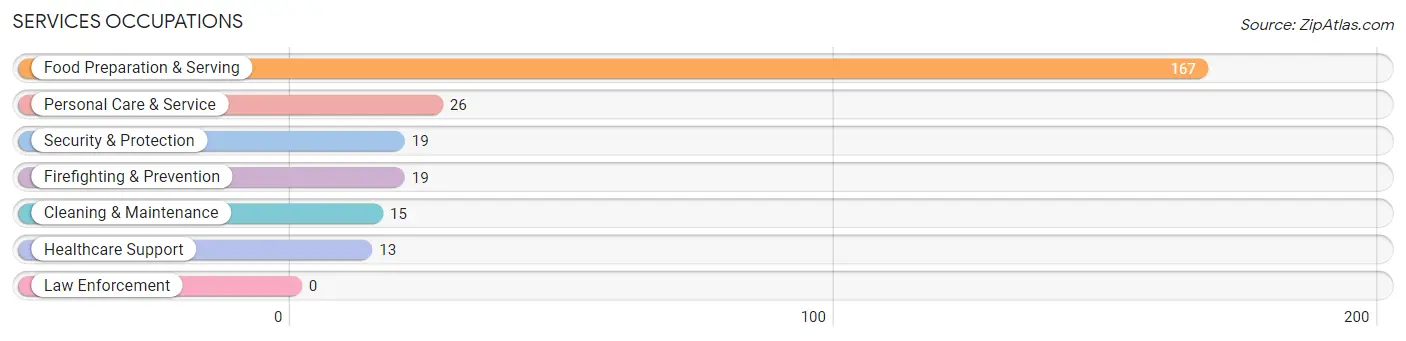
Services Occupations
The most common Services occupations in Monrovia are Food Preparation & Serving (167 | 8.6%), Personal Care & Service (26 | 1.3%), Security & Protection (19 | 1.0%), Firefighting & Prevention (19 | 1.0%), and Cleaning & Maintenance (15 | 0.8%).
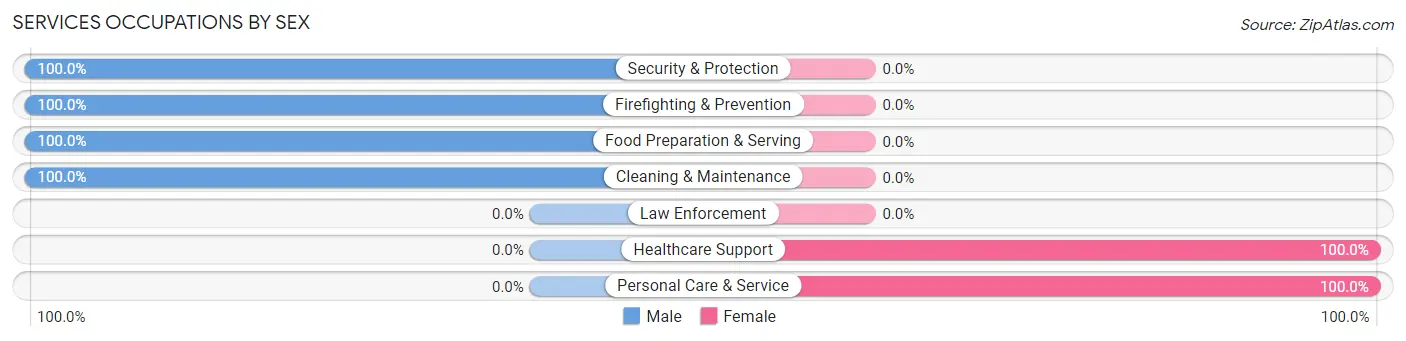
Services Occupations by Sex
Within the Services occupations in Monrovia, the most male-oriented occupations are Security & Protection (100.0%), Firefighting & Prevention (100.0%), and Food Preparation & Serving (100.0%), while the most female-oriented occupations are Healthcare Support (100.0%), and Personal Care & Service (100.0%).
| Occupation | Male | Female |
| Healthcare Support | 0 (0.0%) | 13 (100.0%) |
| Security & Protection | 19 (100.0%) | 0 (0.0%) |
| Firefighting & Prevention | 19 (100.0%) | 0 (0.0%) |
| Law Enforcement | 0 (0.0%) | 0 (0.0%) |
| Food Preparation & Serving | 167 (100.0%) | 0 (0.0%) |
| Cleaning & Maintenance | 15 (100.0%) | 0 (0.0%) |
| Personal Care & Service | 0 (0.0%) | 26 (100.0%) |
| Total (Category) | 201 (83.8%) | 39 (16.3%) |
| Total (Overall) | 1,144 (59.2%) | 787 (40.8%) |
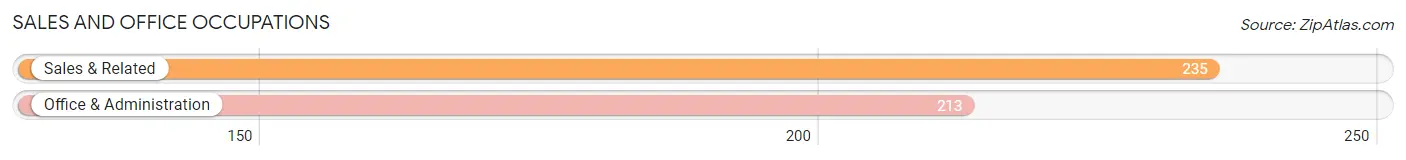
Sales and Office Occupations
The most common Sales and Office occupations in Monrovia are Sales & Related (235 | 12.2%), and Office & Administration (213 | 11.0%).
Sales and Office Occupations by Sex
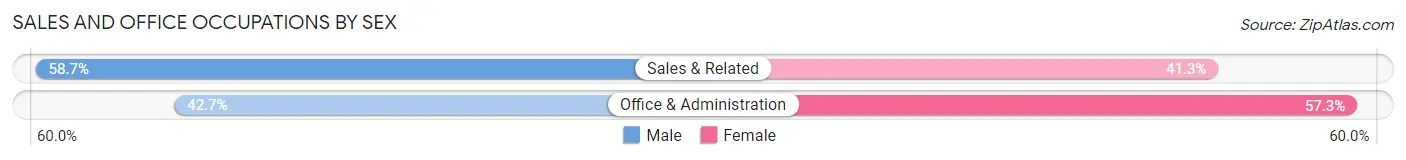
| Occupation | Male | Female |
| Sales & Related | 138 (58.7%) | 97 (41.3%) |
| Office & Administration | 91 (42.7%) | 122 (57.3%) |
| Total (Category) | 229 (51.1%) | 219 (48.9%) |
| Total (Overall) | 1,144 (59.2%) | 787 (40.8%) |
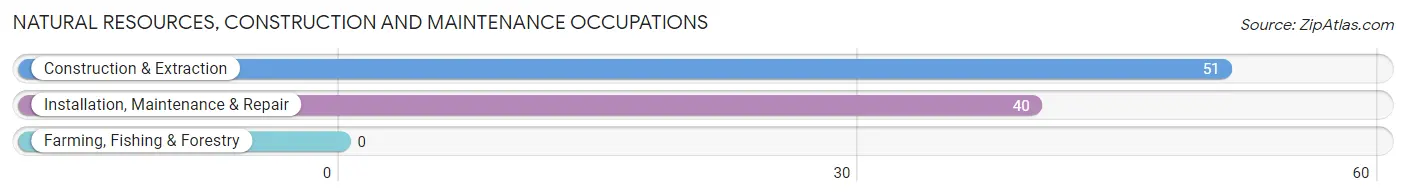
Natural Resources, Construction and Maintenance Occupations
The most common Natural Resources, Construction and Maintenance occupations in Monrovia are Construction & Extraction (51 | 2.6%), and Installation, Maintenance & Repair (40 | 2.1%).
Natural Resources, Construction and Maintenance Occupations by Sex
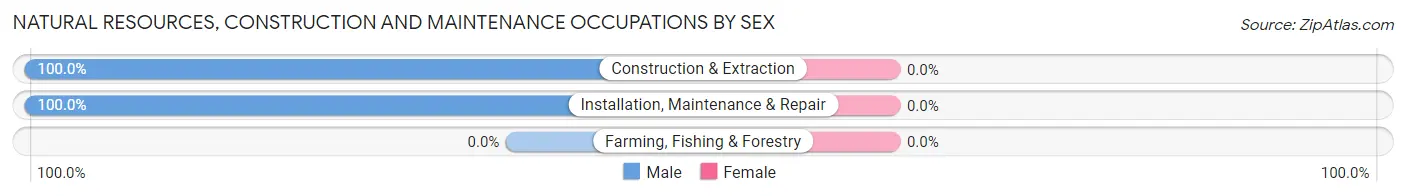
| Occupation | Male | Female |
| Farming, Fishing & Forestry | 0 (0.0%) | 0 (0.0%) |
| Construction & Extraction | 51 (100.0%) | 0 (0.0%) |
| Installation, Maintenance & Repair | 40 (100.0%) | 0 (0.0%) |
| Total (Category) | 91 (100.0%) | 0 (0.0%) |
| Total (Overall) | 1,144 (59.2%) | 787 (40.8%) |
Production, Transportation and Moving Occupations
Production, Transportation and Moving Occupations by Sex
| Occupation | Male | Female |
| Production | 0 (0.0%) | 0 (0.0%) |
| Transportation | 0 (0.0%) | 0 (0.0%) |
| Material Moving | 0 (0.0%) | 0 (0.0%) |
| Total (Category) | 0 (0.0%) | 0 (0.0%) |
| Total (Overall) | 1,144 (59.2%) | 787 (40.8%) |
Employment Industries by Sex in Monrovia
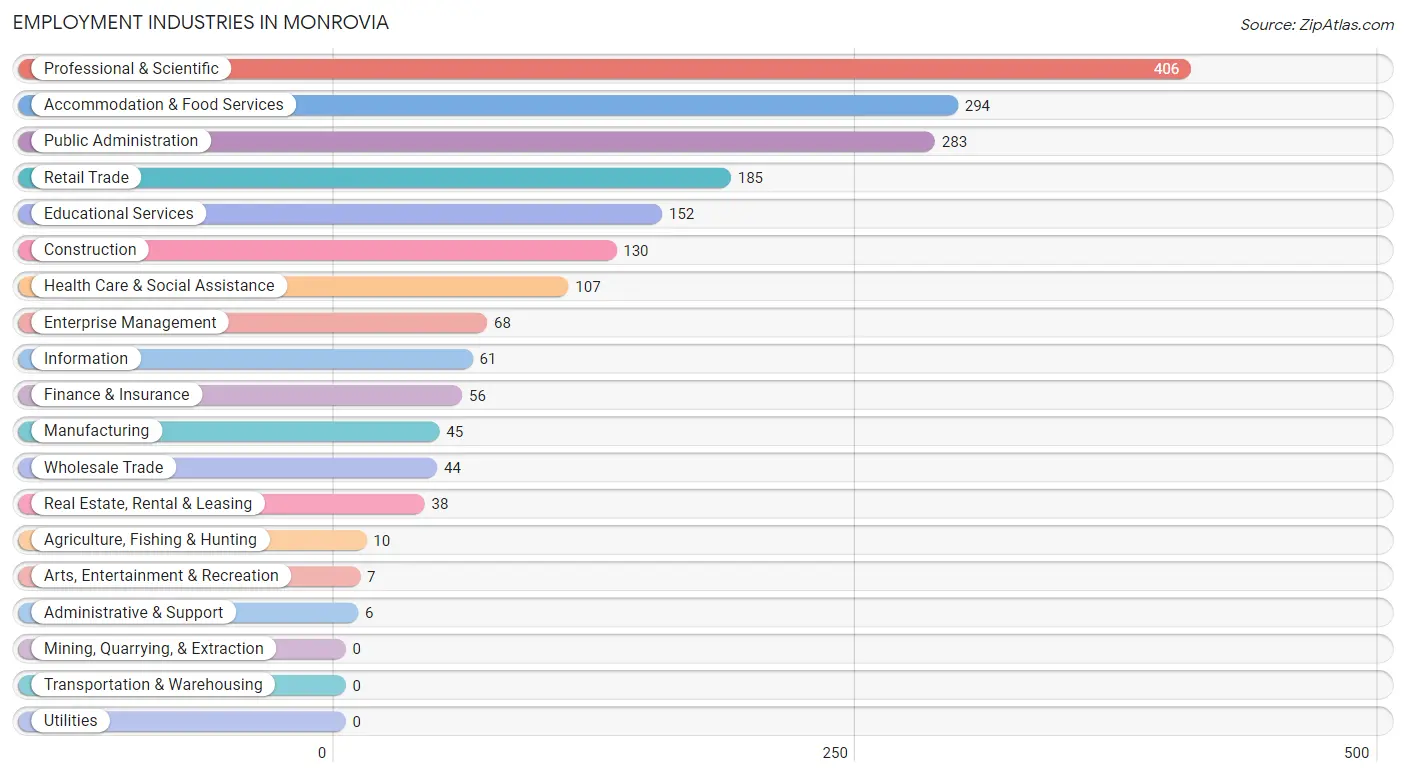
Employment Industries in Monrovia
The major employment industries in Monrovia include Professional & Scientific (406 | 21.0%), Accommodation & Food Services (294 | 15.2%), Public Administration (283 | 14.7%), Retail Trade (185 | 9.6%), and Educational Services (152 | 7.9%).
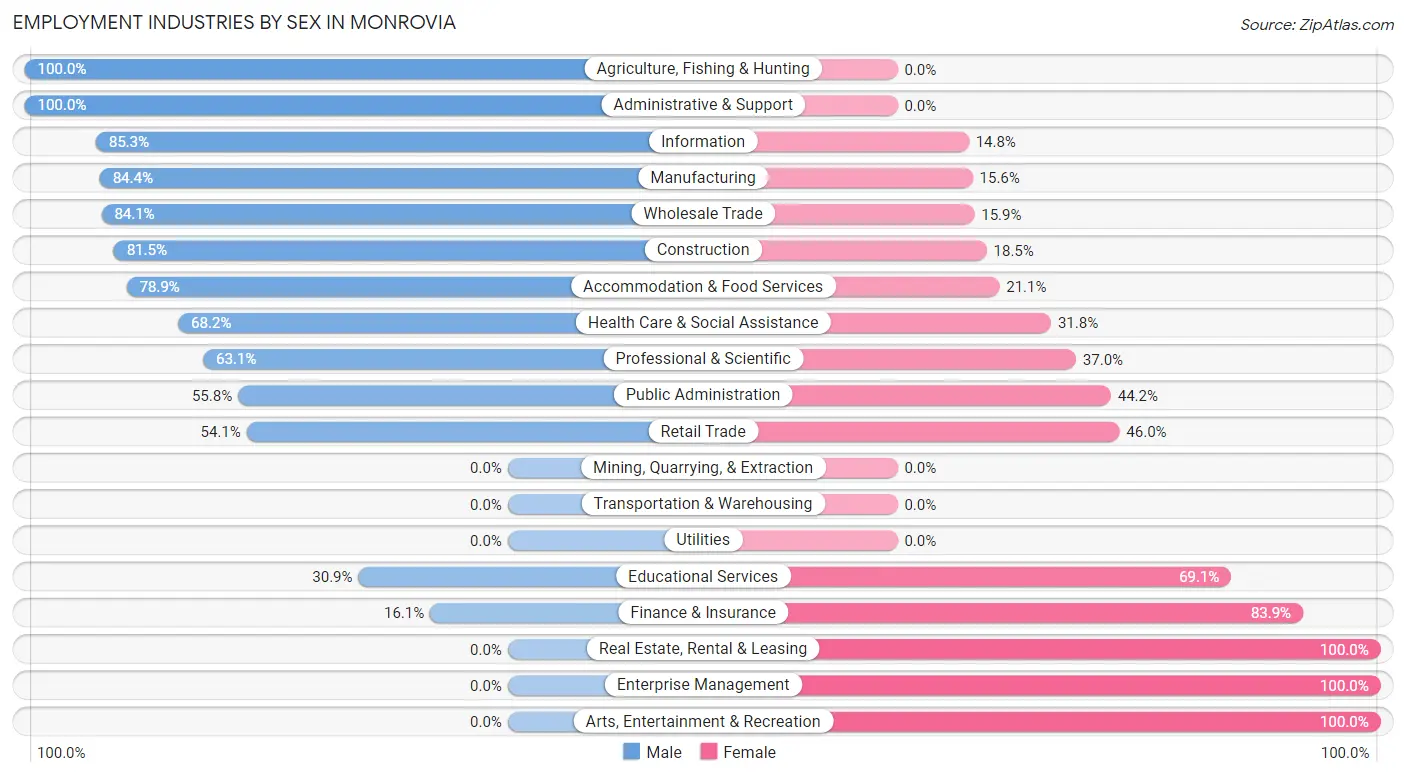
Employment Industries by Sex in Monrovia
The Monrovia industries that see more men than women are Agriculture, Fishing & Hunting (100.0%), Administrative & Support (100.0%), and Information (85.3%), whereas the industries that tend to have a higher number of women are Real Estate, Rental & Leasing (100.0%), Enterprise Management (100.0%), and Arts, Entertainment & Recreation (100.0%).
| Industry | Male | Female |
| Agriculture, Fishing & Hunting | 10 (100.0%) | 0 (0.0%) |
| Mining, Quarrying, & Extraction | 0 (0.0%) | 0 (0.0%) |
| Construction | 106 (81.5%) | 24 (18.5%) |
| Manufacturing | 38 (84.4%) | 7 (15.6%) |
| Wholesale Trade | 37 (84.1%) | 7 (15.9%) |
| Retail Trade | 100 (54.0%) | 85 (46.0%) |
| Transportation & Warehousing | 0 (0.0%) | 0 (0.0%) |
| Utilities | 0 (0.0%) | 0 (0.0%) |
| Information | 52 (85.3%) | 9 (14.7%) |
| Finance & Insurance | 9 (16.1%) | 47 (83.9%) |
| Real Estate, Rental & Leasing | 0 (0.0%) | 38 (100.0%) |
| Professional & Scientific | 256 (63.0%) | 150 (36.9%) |
| Enterprise Management | 0 (0.0%) | 68 (100.0%) |
| Administrative & Support | 6 (100.0%) | 0 (0.0%) |
| Educational Services | 47 (30.9%) | 105 (69.1%) |
| Health Care & Social Assistance | 73 (68.2%) | 34 (31.8%) |
| Arts, Entertainment & Recreation | 0 (0.0%) | 7 (100.0%) |
| Accommodation & Food Services | 232 (78.9%) | 62 (21.1%) |
| Public Administration | 158 (55.8%) | 125 (44.2%) |
| Total | 1,144 (59.2%) | 787 (40.8%) |
Education in Monrovia
School Enrollment in Monrovia
The most common levels of schooling among the 974 students in Monrovia are college / undergraduate (320 | 32.9%), elementary school (197 | 20.2%), and middle school (137 | 14.1%).
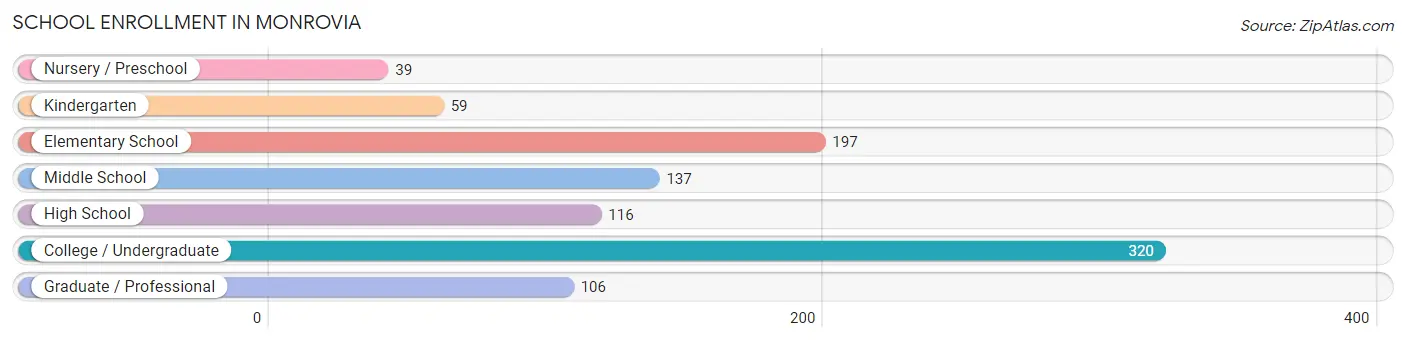
| School Level | # Students | % Students |
| Nursery / Preschool | 39 | 4.0% |
| Kindergarten | 59 | 6.1% |
| Elementary School | 197 | 20.2% |
| Middle School | 137 | 14.1% |
| High School | 116 | 11.9% |
| College / Undergraduate | 320 | 32.9% |
| Graduate / Professional | 106 | 10.9% |
| Total | 974 | 100.0% |
School Enrollment by Age by Funding Source in Monrovia
Out of a total of 974 students who are enrolled in schools in Monrovia, 22 (2.3%) attend a private institution, while the remaining 952 (97.7%) are enrolled in public schools. The age group of 3 to 4 year olds has the highest likelihood of being enrolled in private schools, with 8 (20.5% in the age bracket) enrolled. Conversely, the age group of 5 to 9 year old has the lowest likelihood of being enrolled in a private school, with 222 (100.0% in the age bracket) attending a public institution.
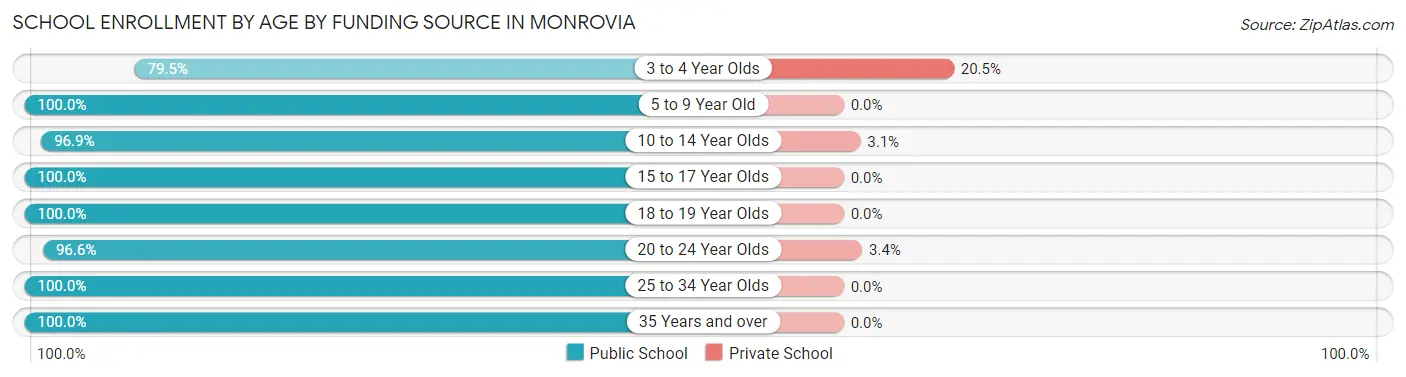
| Age Bracket | Public School | Private School |
| 3 to 4 Year Olds | 31 (79.5%) | 8 (20.5%) |
| 5 to 9 Year Old | 222 (100.0%) | 0 (0.0%) |
| 10 to 14 Year Olds | 187 (96.9%) | 6 (3.1%) |
| 15 to 17 Year Olds | 94 (100.0%) | 0 (0.0%) |
| 18 to 19 Year Olds | 62 (100.0%) | 0 (0.0%) |
| 20 to 24 Year Olds | 225 (96.6%) | 8 (3.4%) |
| 25 to 34 Year Olds | 12 (100.0%) | 0 (0.0%) |
| 35 Years and over | 119 (100.0%) | 0 (0.0%) |
| Total | 952 (97.7%) | 22 (2.3%) |
Educational Attainment by Field of Study in Monrovia
Business (257 | 18.8%), engineering (235 | 17.2%), science & technology (197 | 14.4%), social sciences (134 | 9.8%), and computers & mathematics (131 | 9.6%) are the most common fields of study among 1,364 individuals in Monrovia who have obtained a bachelor's degree or higher.
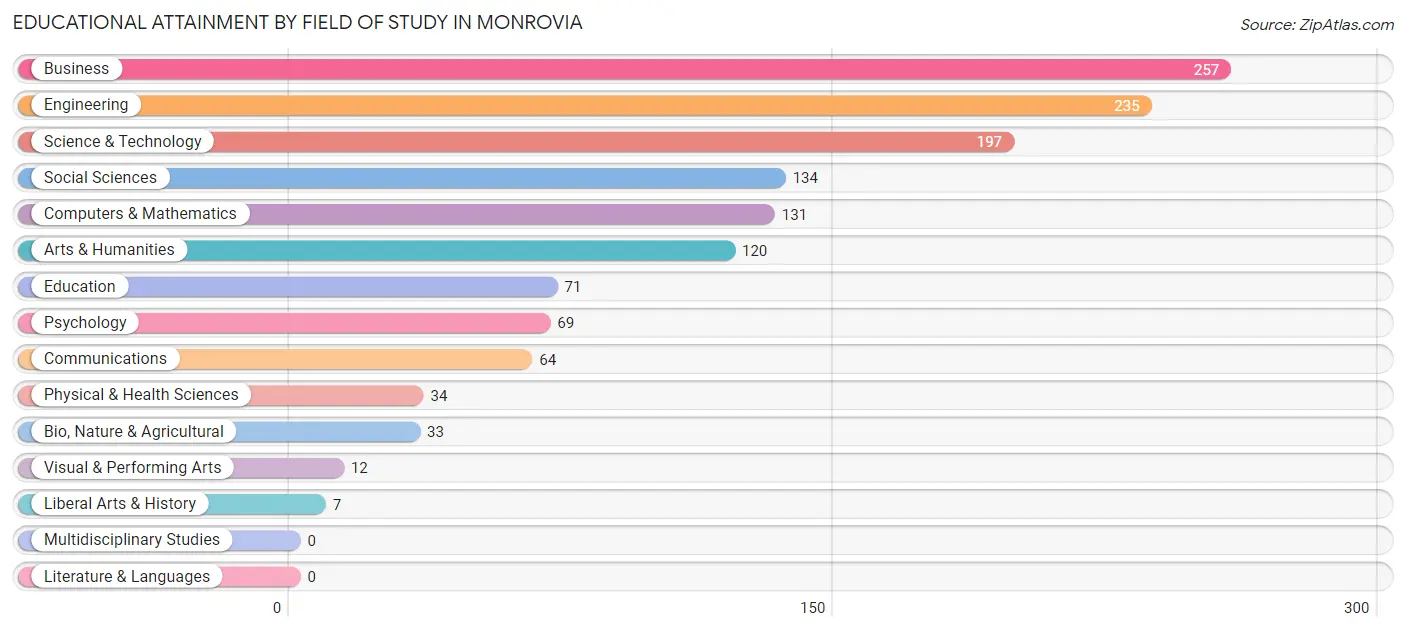
| Field of Study | # Graduates | % Graduates |
| Computers & Mathematics | 131 | 9.6% |
| Bio, Nature & Agricultural | 33 | 2.4% |
| Physical & Health Sciences | 34 | 2.5% |
| Psychology | 69 | 5.1% |
| Social Sciences | 134 | 9.8% |
| Engineering | 235 | 17.2% |
| Multidisciplinary Studies | 0 | 0.0% |
| Science & Technology | 197 | 14.4% |
| Business | 257 | 18.8% |
| Education | 71 | 5.2% |
| Literature & Languages | 0 | 0.0% |
| Liberal Arts & History | 7 | 0.5% |
| Visual & Performing Arts | 12 | 0.9% |
| Communications | 64 | 4.7% |
| Arts & Humanities | 120 | 8.8% |
| Total | 1,364 | 100.0% |
Transportation & Commute in Monrovia
Vehicle Availability by Sex in Monrovia
The most prevalent vehicle ownership categories in Monrovia are males with 5 or more vehicles (494, accounting for 42.0%) and females with 5 or more vehicles (233, making up 63.3%).
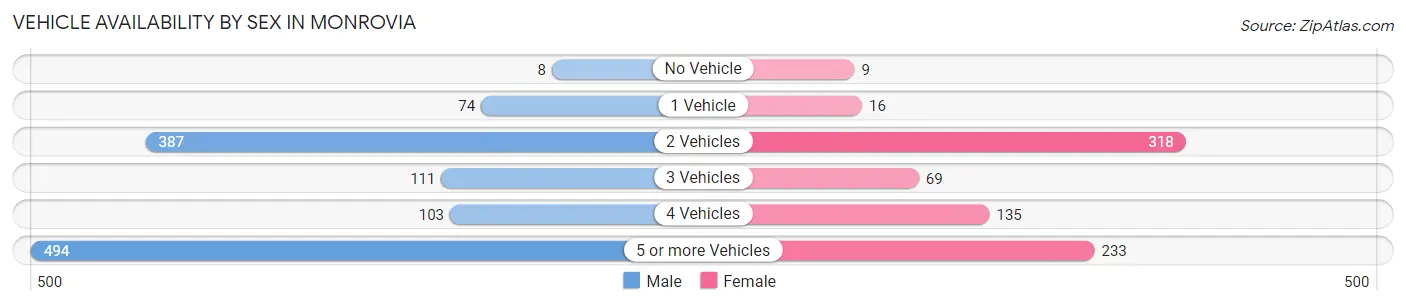
| Vehicles Available | Male | Female |
| No Vehicle | 8 (0.7%) | 9 (1.1%) |
| 1 Vehicle | 74 (6.3%) | 16 (2.1%) |
| 2 Vehicles | 387 (32.9%) | 318 (40.8%) |
| 3 Vehicles | 111 (9.4%) | 69 (8.8%) |
| 4 Vehicles | 103 (8.7%) | 135 (17.3%) |
| 5 or more Vehicles | 494 (42.0%) | 233 (29.9%) |
| Total | 1,177 (100.0%) | 780 (100.0%) |
Commute Time in Monrovia
The most frequently occuring commute durations in Monrovia are 60 to 89 minutes (414 commuters, 28.9%), 45 to 59 minutes (229 commuters, 16.0%), and 20 to 24 minutes (197 commuters, 13.7%).
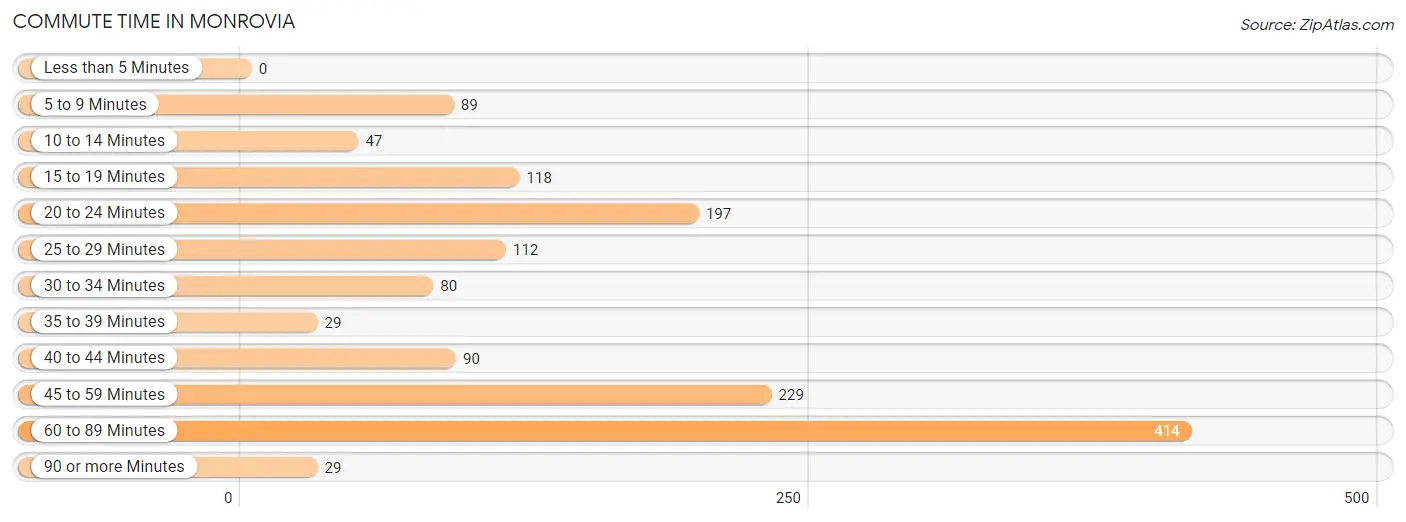
| Commute Time | # Commuters | % Commuters |
| Less than 5 Minutes | 0 | 0.0% |
| 5 to 9 Minutes | 89 | 6.2% |
| 10 to 14 Minutes | 47 | 3.3% |
| 15 to 19 Minutes | 118 | 8.2% |
| 20 to 24 Minutes | 197 | 13.7% |
| 25 to 29 Minutes | 112 | 7.8% |
| 30 to 34 Minutes | 80 | 5.6% |
| 35 to 39 Minutes | 29 | 2.0% |
| 40 to 44 Minutes | 90 | 6.3% |
| 45 to 59 Minutes | 229 | 16.0% |
| 60 to 89 Minutes | 414 | 28.9% |
| 90 or more Minutes | 29 | 2.0% |
Commute Time by Sex in Monrovia
The most common commute times in Monrovia are 60 to 89 minutes (314 commuters, 33.4%) for males and 45 to 59 minutes (173 commuters, 34.9%) for females.
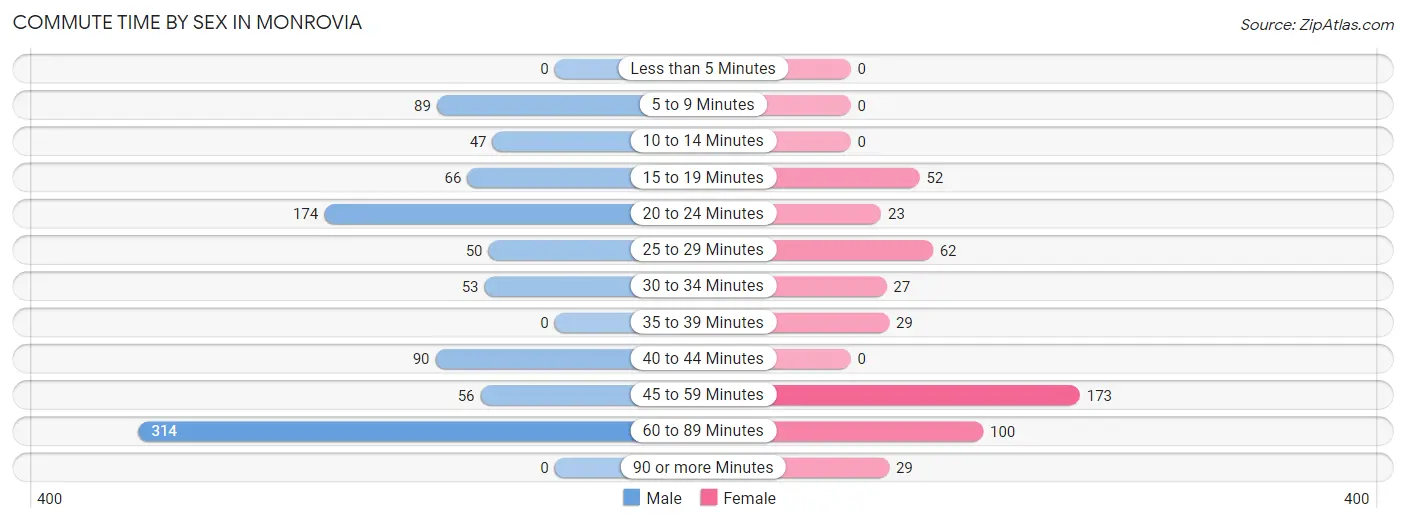
| Commute Time | Male | Female |
| Less than 5 Minutes | 0 (0.0%) | 0 (0.0%) |
| 5 to 9 Minutes | 89 (9.5%) | 0 (0.0%) |
| 10 to 14 Minutes | 47 (5.0%) | 0 (0.0%) |
| 15 to 19 Minutes | 66 (7.0%) | 52 (10.5%) |
| 20 to 24 Minutes | 174 (18.5%) | 23 (4.6%) |
| 25 to 29 Minutes | 50 (5.3%) | 62 (12.5%) |
| 30 to 34 Minutes | 53 (5.6%) | 27 (5.4%) |
| 35 to 39 Minutes | 0 (0.0%) | 29 (5.9%) |
| 40 to 44 Minutes | 90 (9.6%) | 0 (0.0%) |
| 45 to 59 Minutes | 56 (6.0%) | 173 (34.9%) |
| 60 to 89 Minutes | 314 (33.4%) | 100 (20.2%) |
| 90 or more Minutes | 0 (0.0%) | 29 (5.9%) |
Time of Departure to Work by Sex in Monrovia
The most frequent times of departure to work in Monrovia are 6:00 AM to 6:29 AM (231, 24.6%) for males and 7:00 AM to 7:29 AM (114, 23.0%) for females.
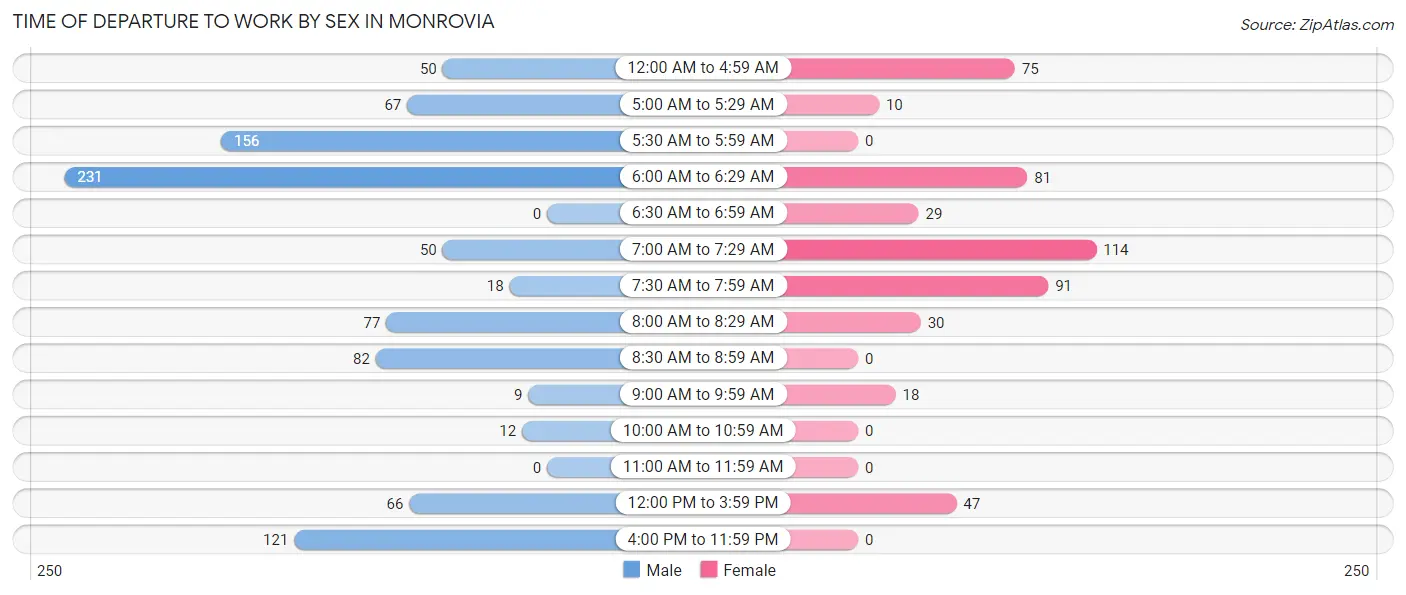
| Time of Departure | Male | Female |
| 12:00 AM to 4:59 AM | 50 (5.3%) | 75 (15.1%) |
| 5:00 AM to 5:29 AM | 67 (7.1%) | 10 (2.0%) |
| 5:30 AM to 5:59 AM | 156 (16.6%) | 0 (0.0%) |
| 6:00 AM to 6:29 AM | 231 (24.6%) | 81 (16.4%) |
| 6:30 AM to 6:59 AM | 0 (0.0%) | 29 (5.9%) |
| 7:00 AM to 7:29 AM | 50 (5.3%) | 114 (23.0%) |
| 7:30 AM to 7:59 AM | 18 (1.9%) | 91 (18.4%) |
| 8:00 AM to 8:29 AM | 77 (8.2%) | 30 (6.1%) |
| 8:30 AM to 8:59 AM | 82 (8.7%) | 0 (0.0%) |
| 9:00 AM to 9:59 AM | 9 (1.0%) | 18 (3.6%) |
| 10:00 AM to 10:59 AM | 12 (1.3%) | 0 (0.0%) |
| 11:00 AM to 11:59 AM | 0 (0.0%) | 0 (0.0%) |
| 12:00 PM to 3:59 PM | 66 (7.0%) | 47 (9.5%) |
| 4:00 PM to 11:59 PM | 121 (12.9%) | 0 (0.0%) |
| Total | 939 (100.0%) | 495 (100.0%) |
Housing Occupancy in Monrovia
Occupancy by Ownership in Monrovia
Of the total 818 dwellings in Monrovia, owner-occupied units account for 818 (100.0%), while renter-occupied units make up 0 (0.0%).
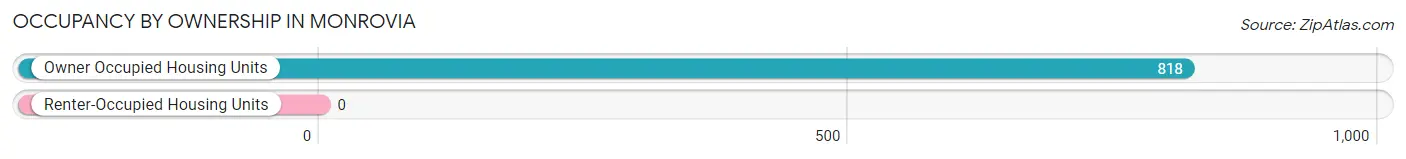
| Occupancy | # Housing Units | % Housing Units |
| Owner Occupied Housing Units | 818 | 100.0% |
| Renter-Occupied Housing Units | 0 | 0.0% |
| Total Occupied Housing Units | 818 | 100.0% |
Occupancy by Household Size in Monrovia
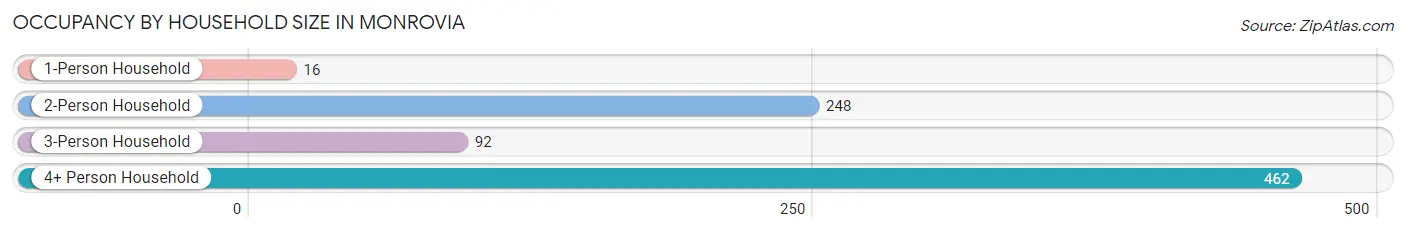
| Household Size | # Housing Units | % Housing Units |
| 1-Person Household | 16 | 2.0% |
| 2-Person Household | 248 | 30.3% |
| 3-Person Household | 92 | 11.3% |
| 4+ Person Household | 462 | 56.5% |
| Total Housing Units | 818 | 100.0% |
Occupancy by Ownership by Household Size in Monrovia
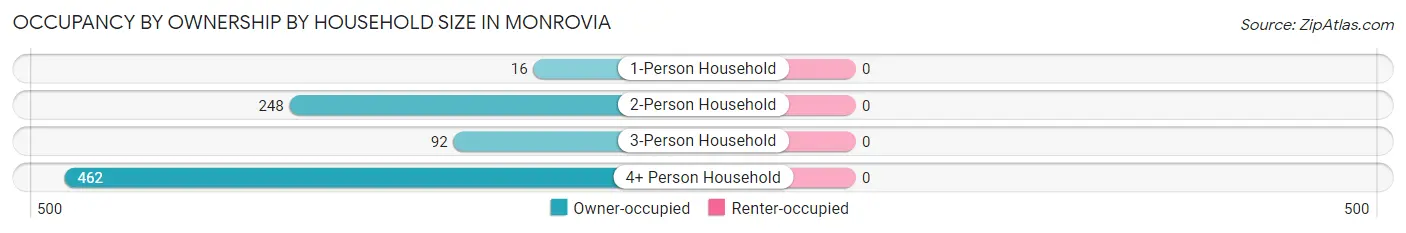
| Household Size | Owner-occupied | Renter-occupied |
| 1-Person Household | 16 (100.0%) | 0 (0.0%) |
| 2-Person Household | 248 (100.0%) | 0 (0.0%) |
| 3-Person Household | 92 (100.0%) | 0 (0.0%) |
| 4+ Person Household | 462 (100.0%) | 0 (0.0%) |
| Total Housing Units | 818 (100.0%) | 0 (0.0%) |
Occupancy by Educational Attainment in Monrovia
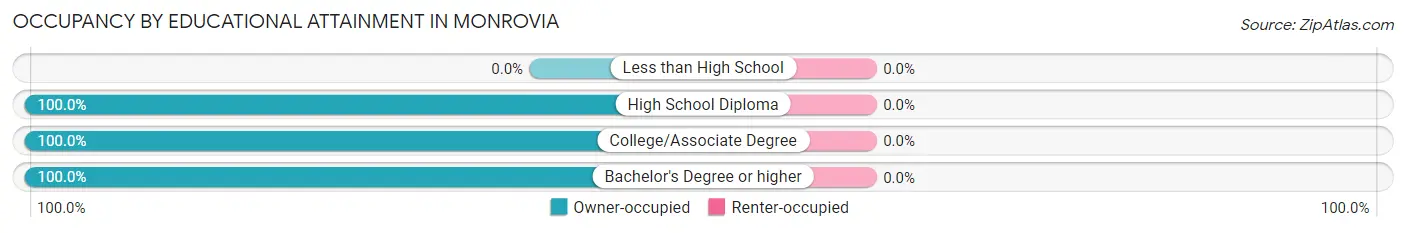
| Household Size | Owner-occupied | Renter-occupied |
| Less than High School | 0 (0.0%) | 0 (0.0%) |
| High School Diploma | 44 (100.0%) | 0 (0.0%) |
| College/Associate Degree | 160 (100.0%) | 0 (0.0%) |
| Bachelor's Degree or higher | 614 (100.0%) | 0 (0.0%) |
Occupancy by Age of Householder in Monrovia
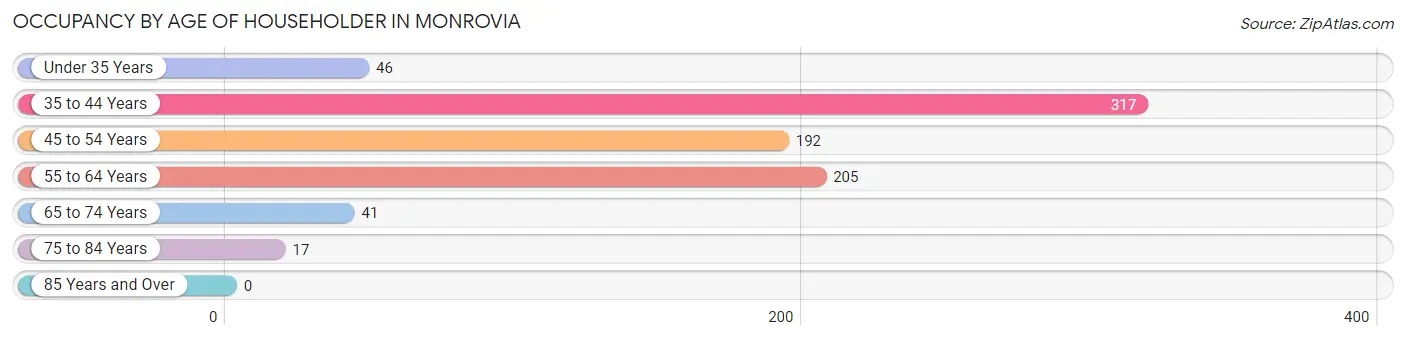
| Age Bracket | # Households | % Households |
| Under 35 Years | 46 | 5.6% |
| 35 to 44 Years | 317 | 38.8% |
| 45 to 54 Years | 192 | 23.5% |
| 55 to 64 Years | 205 | 25.1% |
| 65 to 74 Years | 41 | 5.0% |
| 75 to 84 Years | 17 | 2.1% |
| 85 Years and Over | 0 | 0.0% |
| Total | 818 | 100.0% |
Housing Finances in Monrovia
Median Income by Occupancy in Monrovia
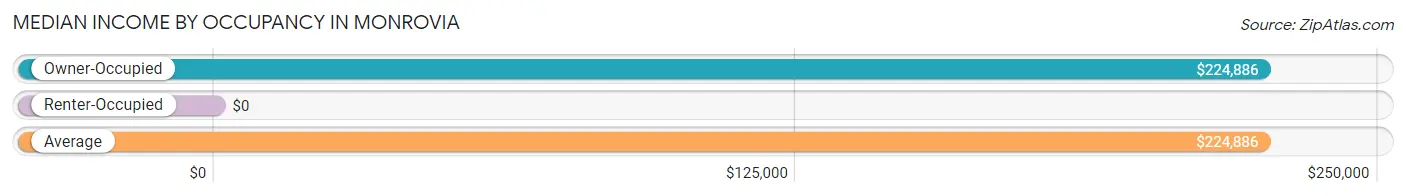
| Occupancy Type | # Households | Median Income |
| Owner-Occupied | 818 (100.0%) | $224,886 |
| Renter-Occupied | 0 (0.0%) | $0 |
| Average | 818 (100.0%) | $224,886 |
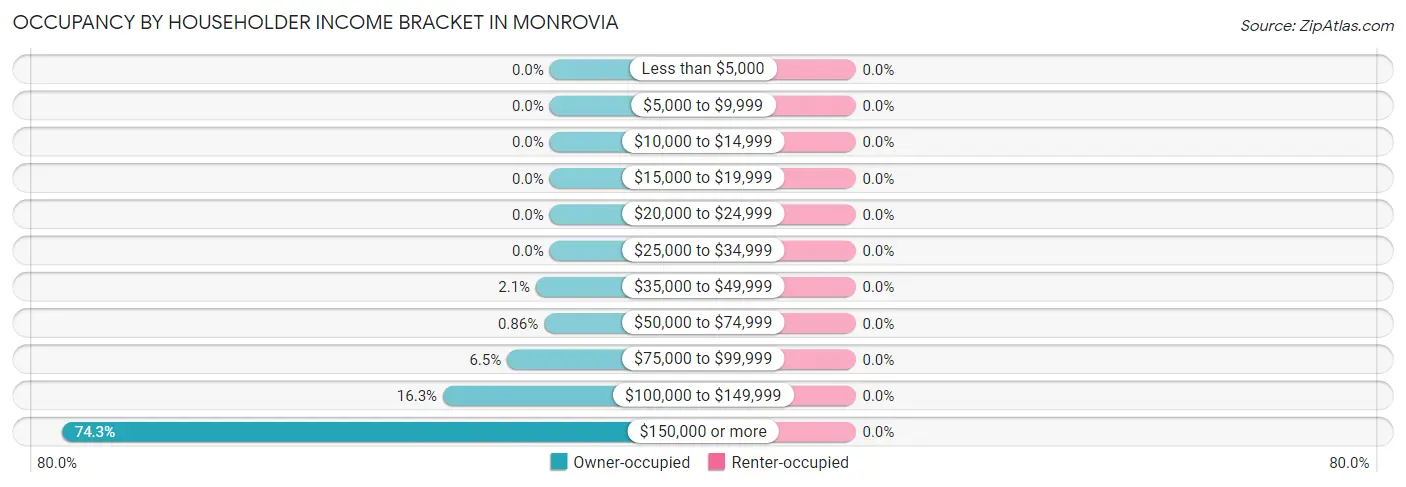
Occupancy by Householder Income Bracket in Monrovia
| Income Bracket | Owner-occupied | Renter-occupied |
| Less than $5,000 | 0 (0.0%) | 0 (0.0%) |
| $5,000 to $9,999 | 0 (0.0%) | 0 (0.0%) |
| $10,000 to $14,999 | 0 (0.0%) | 0 (0.0%) |
| $15,000 to $19,999 | 0 (0.0%) | 0 (0.0%) |
| $20,000 to $24,999 | 0 (0.0%) | 0 (0.0%) |
| $25,000 to $34,999 | 0 (0.0%) | 0 (0.0%) |
| $35,000 to $49,999 | 17 (2.1%) | 0 (0.0%) |
| $50,000 to $74,999 | 7 (0.9%) | 0 (0.0%) |
| $75,000 to $99,999 | 53 (6.5%) | 0 (0.0%) |
| $100,000 to $149,999 | 133 (16.3%) | 0 (0.0%) |
| $150,000 or more | 608 (74.3%) | 0 (0.0%) |
| Total | 818 (100.0%) | 0 (0.0%) |
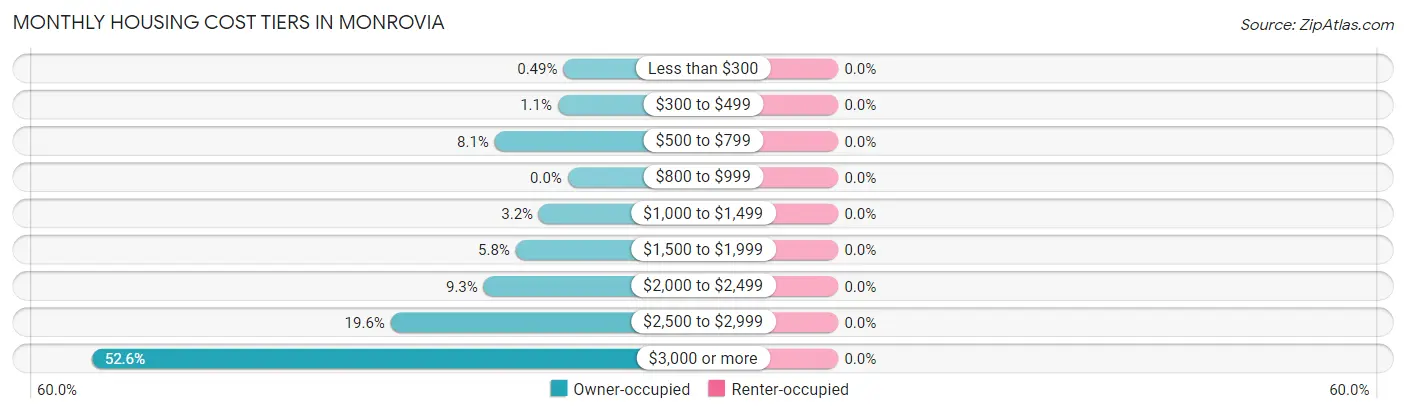
Monthly Housing Cost Tiers in Monrovia
| Monthly Cost | Owner-occupied | Renter-occupied |
| Less than $300 | 4 (0.5%) | 0 (0.0%) |
| $300 to $499 | 9 (1.1%) | 0 (0.0%) |
| $500 to $799 | 66 (8.1%) | 0 (0.0%) |
| $800 to $999 | 0 (0.0%) | 0 (0.0%) |
| $1,000 to $1,499 | 26 (3.2%) | 0 (0.0%) |
| $1,500 to $1,999 | 47 (5.8%) | 0 (0.0%) |
| $2,000 to $2,499 | 76 (9.3%) | 0 (0.0%) |
| $2,500 to $2,999 | 160 (19.6%) | 0 (0.0%) |
| $3,000 or more | 430 (52.6%) | 0 (0.0%) |
| Total | 818 (100.0%) | 0 (0.0%) |
Physical Housing Characteristics in Monrovia
Housing Structures in Monrovia
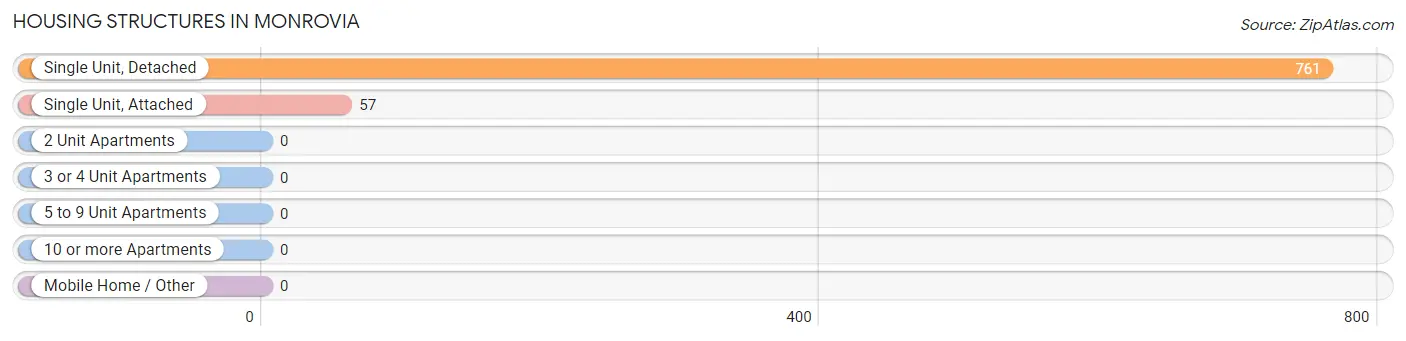
| Structure Type | # Housing Units | % Housing Units |
| Single Unit, Detached | 761 | 93.0% |
| Single Unit, Attached | 57 | 7.0% |
| 2 Unit Apartments | 0 | 0.0% |
| 3 or 4 Unit Apartments | 0 | 0.0% |
| 5 to 9 Unit Apartments | 0 | 0.0% |
| 10 or more Apartments | 0 | 0.0% |
| Mobile Home / Other | 0 | 0.0% |
| Total | 818 | 100.0% |
Housing Structures by Occupancy in Monrovia
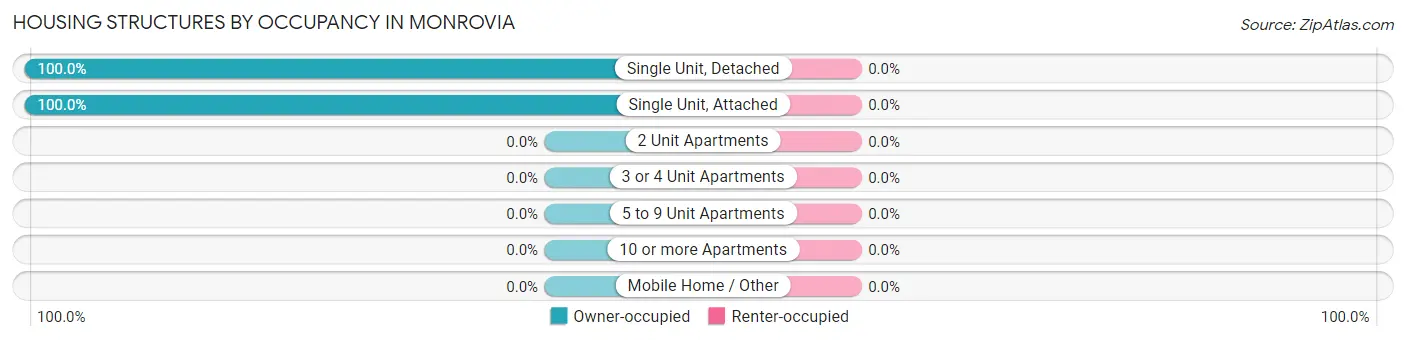
| Structure Type | Owner-occupied | Renter-occupied |
| Single Unit, Detached | 761 (100.0%) | 0 (0.0%) |
| Single Unit, Attached | 57 (100.0%) | 0 (0.0%) |
| 2 Unit Apartments | 0 (0.0%) | 0 (0.0%) |
| 3 or 4 Unit Apartments | 0 (0.0%) | 0 (0.0%) |
| 5 to 9 Unit Apartments | 0 (0.0%) | 0 (0.0%) |
| 10 or more Apartments | 0 (0.0%) | 0 (0.0%) |
| Mobile Home / Other | 0 (0.0%) | 0 (0.0%) |
| Total | 818 (100.0%) | 0 (0.0%) |
Housing Structures by Number of Rooms in Monrovia
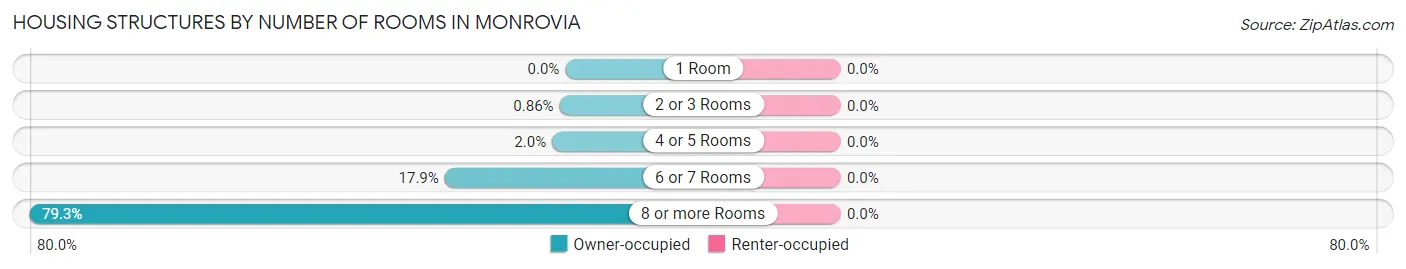
| Number of Rooms | Owner-occupied | Renter-occupied |
| 1 Room | 0 (0.0%) | 0 (0.0%) |
| 2 or 3 Rooms | 7 (0.9%) | 0 (0.0%) |
| 4 or 5 Rooms | 16 (2.0%) | 0 (0.0%) |
| 6 or 7 Rooms | 146 (17.8%) | 0 (0.0%) |
| 8 or more Rooms | 649 (79.3%) | 0 (0.0%) |
| Total | 818 (100.0%) | 0 (0.0%) |
Housing Structure by Heating Type in Monrovia
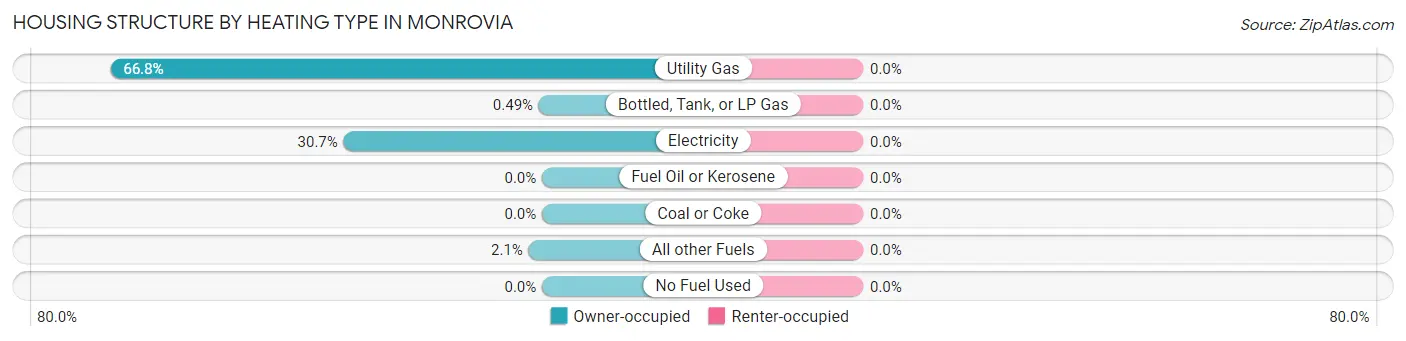
| Heating Type | Owner-occupied | Renter-occupied |
| Utility Gas | 546 (66.7%) | 0 (0.0%) |
| Bottled, Tank, or LP Gas | 4 (0.5%) | 0 (0.0%) |
| Electricity | 251 (30.7%) | 0 (0.0%) |
| Fuel Oil or Kerosene | 0 (0.0%) | 0 (0.0%) |
| Coal or Coke | 0 (0.0%) | 0 (0.0%) |
| All other Fuels | 17 (2.1%) | 0 (0.0%) |
| No Fuel Used | 0 (0.0%) | 0 (0.0%) |
| Total | 818 (100.0%) | 0 (0.0%) |
Household Vehicle Usage in Monrovia
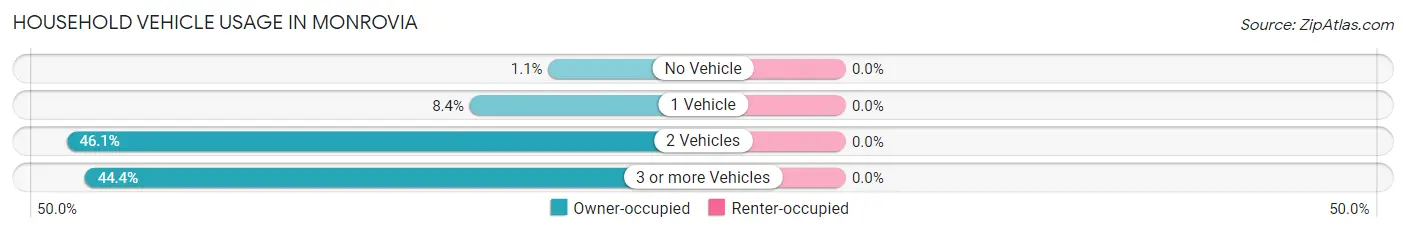
| Vehicles per Household | Owner-occupied | Renter-occupied |
| No Vehicle | 9 (1.1%) | 0 (0.0%) |
| 1 Vehicle | 69 (8.4%) | 0 (0.0%) |
| 2 Vehicles | 377 (46.1%) | 0 (0.0%) |
| 3 or more Vehicles | 363 (44.4%) | 0 (0.0%) |
| Total | 818 (100.0%) | 0 (0.0%) |
Real Estate & Mortgages in Monrovia
Real Estate and Mortgage Overview in Monrovia
| Characteristic | Without Mortgage | With Mortgage |
| Housing Units | 111 | 707 |
| Median Property Value | $552,100 | $664,600 |
| Median Household Income | $156,806 | $533 |
| Monthly Housing Costs | - | - |
| Real Estate Taxes | - | - |
Property Value by Mortgage Status in Monrovia
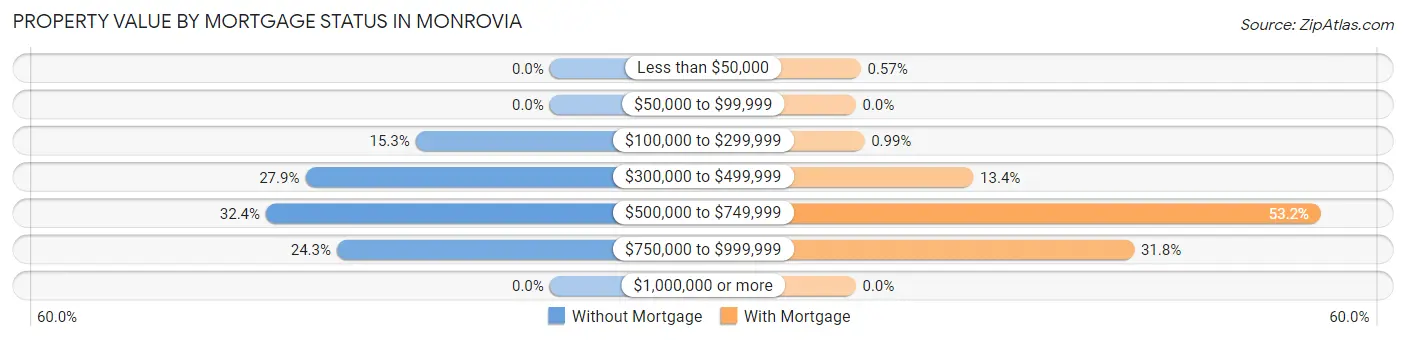
| Property Value | Without Mortgage | With Mortgage |
| Less than $50,000 | 0 (0.0%) | 4 (0.6%) |
| $50,000 to $99,999 | 0 (0.0%) | 0 (0.0%) |
| $100,000 to $299,999 | 17 (15.3%) | 7 (1.0%) |
| $300,000 to $499,999 | 31 (27.9%) | 95 (13.4%) |
| $500,000 to $749,999 | 36 (32.4%) | 376 (53.2%) |
| $750,000 to $999,999 | 27 (24.3%) | 225 (31.8%) |
| $1,000,000 or more | 0 (0.0%) | 0 (0.0%) |
| Total | 111 (100.0%) | 707 (100.0%) |
Household Income by Mortgage Status in Monrovia
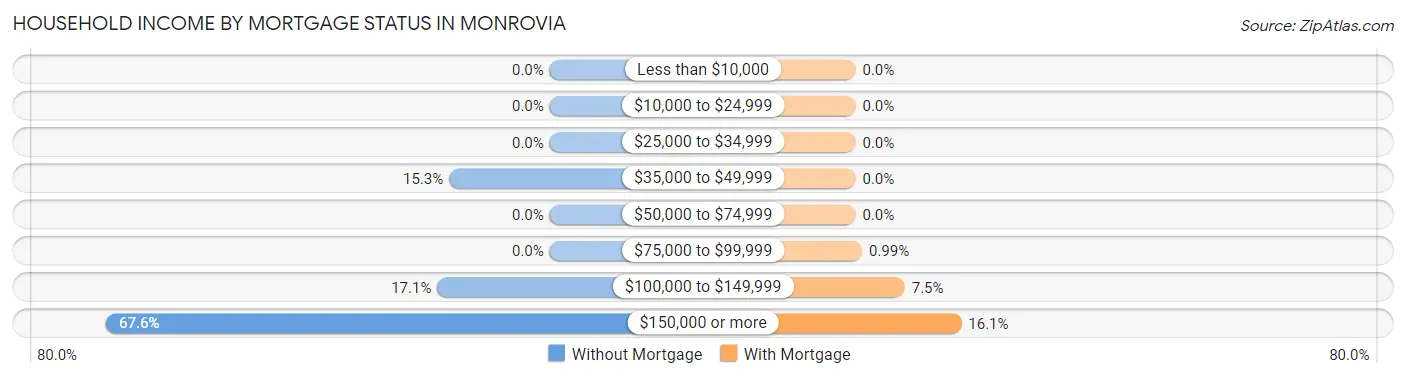
| Household Income | Without Mortgage | With Mortgage |
| Less than $10,000 | 0 (0.0%) | 0 (0.0%) |
| $10,000 to $24,999 | 0 (0.0%) | 0 (0.0%) |
| $25,000 to $34,999 | 0 (0.0%) | 0 (0.0%) |
| $35,000 to $49,999 | 17 (15.3%) | 0 (0.0%) |
| $50,000 to $74,999 | 0 (0.0%) | 0 (0.0%) |
| $75,000 to $99,999 | 0 (0.0%) | 7 (1.0%) |
| $100,000 to $149,999 | 19 (17.1%) | 53 (7.5%) |
| $150,000 or more | 75 (67.6%) | 114 (16.1%) |
| Total | 111 (100.0%) | 707 (100.0%) |
Property Value to Household Income Ratio in Monrovia
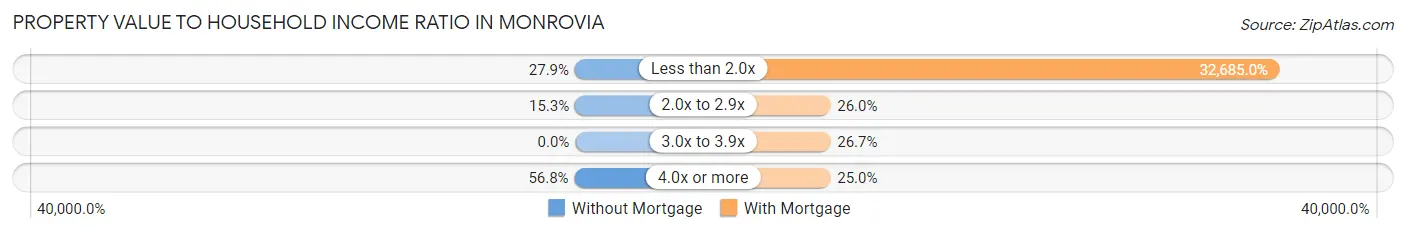
| Value-to-Income Ratio | Without Mortgage | With Mortgage |
| Less than 2.0x | 31 (27.9%) | 231,083 (32,685.0%) |
| 2.0x to 2.9x | 17 (15.3%) | 184 (26.0%) |
| 3.0x to 3.9x | 0 (0.0%) | 189 (26.7%) |
| 4.0x or more | 63 (56.8%) | 177 (25.0%) |
| Total | 111 (100.0%) | 707 (100.0%) |
Real Estate Taxes by Mortgage Status in Monrovia
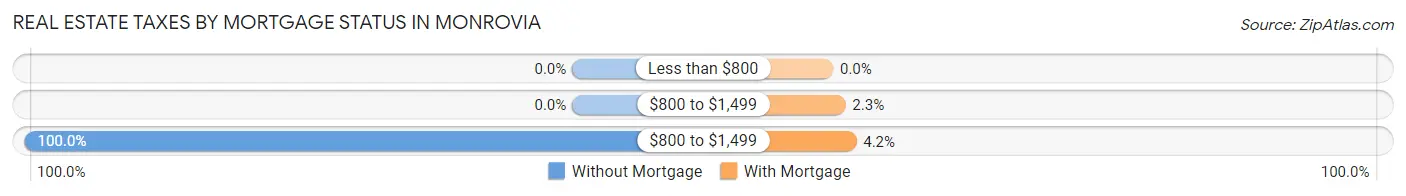
| Property Taxes | Without Mortgage | With Mortgage |
| Less than $800 | 0 (0.0%) | 0 (0.0%) |
| $800 to $1,499 | 0 (0.0%) | 16 (2.3%) |
| $800 to $1,499 | 111 (100.0%) | 30 (4.2%) |
| Total | 111 (100.0%) | 707 (100.0%) |
Health & Disability in Monrovia
Health Insurance Coverage by Age in Monrovia
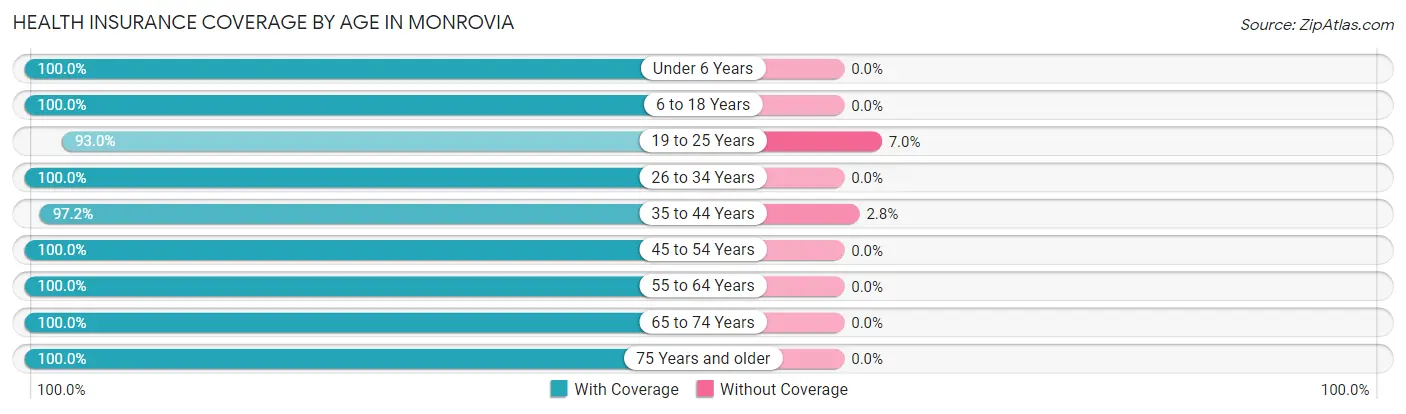
| Age Bracket | With Coverage | Without Coverage |
| Under 6 Years | 205 (100.0%) | 0 (0.0%) |
| 6 to 18 Years | 521 (100.0%) | 0 (0.0%) |
| 19 to 25 Years | 320 (93.0%) | 24 (7.0%) |
| 26 to 34 Years | 180 (100.0%) | 0 (0.0%) |
| 35 to 44 Years | 617 (97.2%) | 18 (2.8%) |
| 45 to 54 Years | 426 (100.0%) | 0 (0.0%) |
| 55 to 64 Years | 350 (100.0%) | 0 (0.0%) |
| 65 to 74 Years | 209 (100.0%) | 0 (0.0%) |
| 75 Years and older | 77 (100.0%) | 0 (0.0%) |
| Total | 2,905 (98.6%) | 42 (1.4%) |
Health Insurance Coverage by Citizenship Status in Monrovia
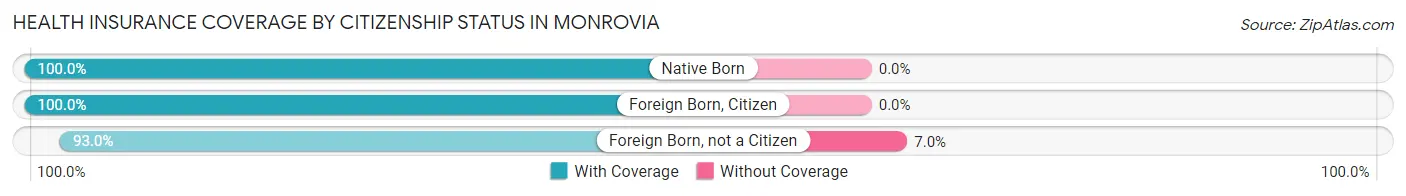
| Citizenship Status | With Coverage | Without Coverage |
| Native Born | 205 (100.0%) | 0 (0.0%) |
| Foreign Born, Citizen | 521 (100.0%) | 0 (0.0%) |
| Foreign Born, not a Citizen | 320 (93.0%) | 24 (7.0%) |
Health Insurance Coverage by Household Income in Monrovia
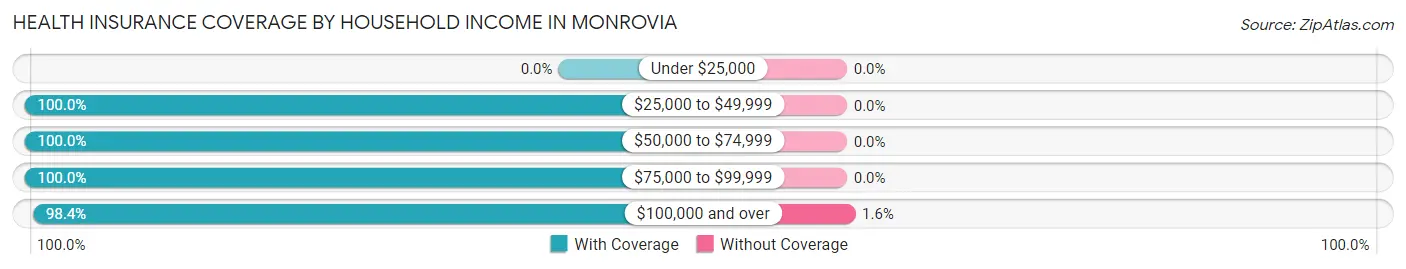
| Household Income | With Coverage | Without Coverage |
| Under $25,000 | 0 (0.0%) | 0 (0.0%) |
| $25,000 to $49,999 | 34 (100.0%) | 0 (0.0%) |
| $50,000 to $74,999 | 16 (100.0%) | 0 (0.0%) |
| $75,000 to $99,999 | 202 (100.0%) | 0 (0.0%) |
| $100,000 and over | 2,653 (98.4%) | 42 (1.6%) |
Public vs Private Health Insurance Coverage by Age in Monrovia
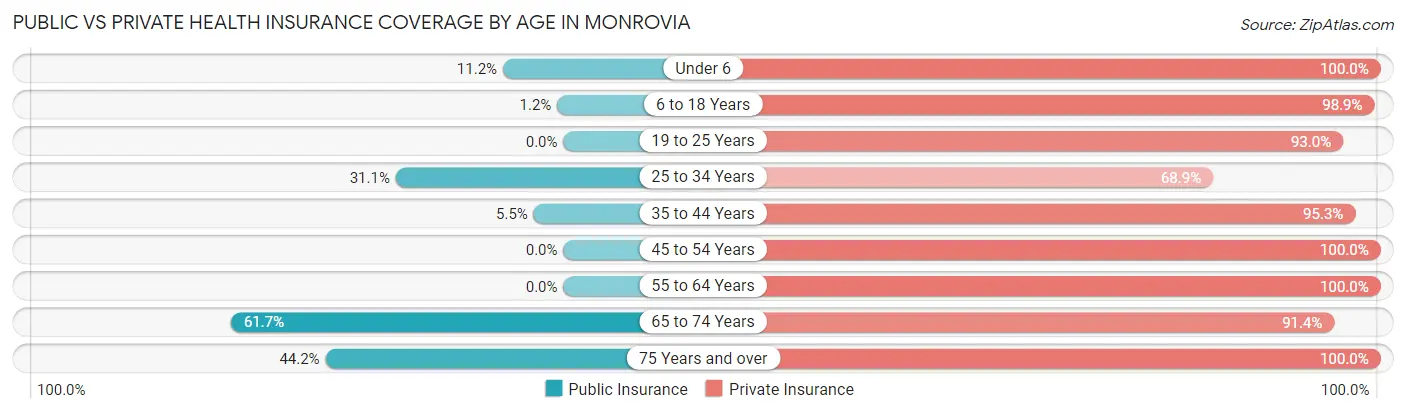
| Age Bracket | Public Insurance | Private Insurance |
| Under 6 | 23 (11.2%) | 205 (100.0%) |
| 6 to 18 Years | 6 (1.1%) | 515 (98.9%) |
| 19 to 25 Years | 0 (0.0%) | 320 (93.0%) |
| 25 to 34 Years | 56 (31.1%) | 124 (68.9%) |
| 35 to 44 Years | 35 (5.5%) | 605 (95.3%) |
| 45 to 54 Years | 0 (0.0%) | 426 (100.0%) |
| 55 to 64 Years | 0 (0.0%) | 350 (100.0%) |
| 65 to 74 Years | 129 (61.7%) | 191 (91.4%) |
| 75 Years and over | 34 (44.2%) | 77 (100.0%) |
| Total | 283 (9.6%) | 2,813 (95.5%) |
Disability Status by Sex by Age in Monrovia
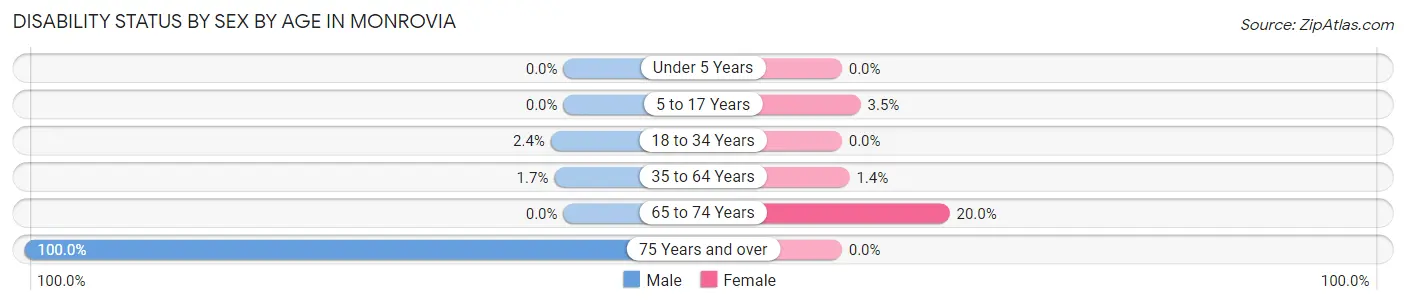
| Age Bracket | Male | Female |
| Under 5 Years | 0 (0.0%) | 0 (0.0%) |
| 5 to 17 Years | 0 (0.0%) | 9 (3.5%) |
| 18 to 34 Years | 9 (2.4%) | 0 (0.0%) |
| 35 to 64 Years | 12 (1.7%) | 10 (1.4%) |
| 65 to 74 Years | 0 (0.0%) | 26 (20.0%) |
| 75 Years and over | 60 (100.0%) | 0 (0.0%) |
Disability Class by Sex by Age in Monrovia
Disability Class: Hearing Difficulty
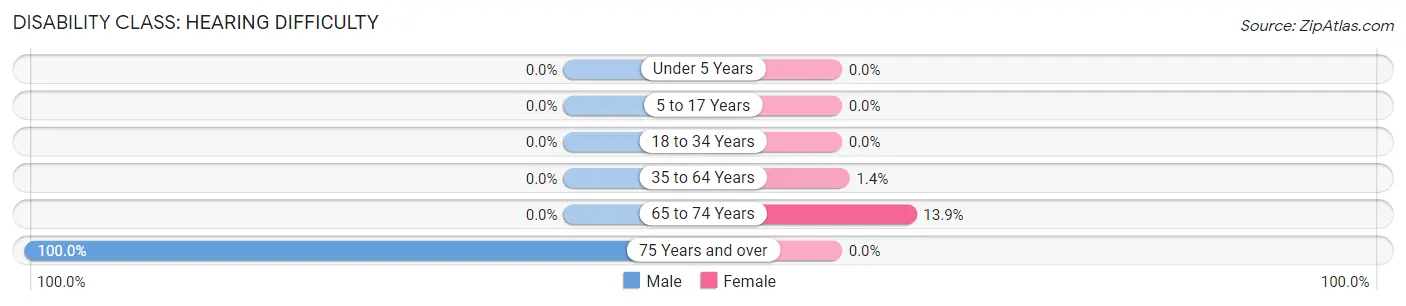
| Age Bracket | Male | Female |
| Under 5 Years | 0 (0.0%) | 0 (0.0%) |
| 5 to 17 Years | 0 (0.0%) | 0 (0.0%) |
| 18 to 34 Years | 0 (0.0%) | 0 (0.0%) |
| 35 to 64 Years | 0 (0.0%) | 10 (1.4%) |
| 65 to 74 Years | 0 (0.0%) | 18 (13.9%) |
| 75 Years and over | 60 (100.0%) | 0 (0.0%) |
Disability Class: Vision Difficulty
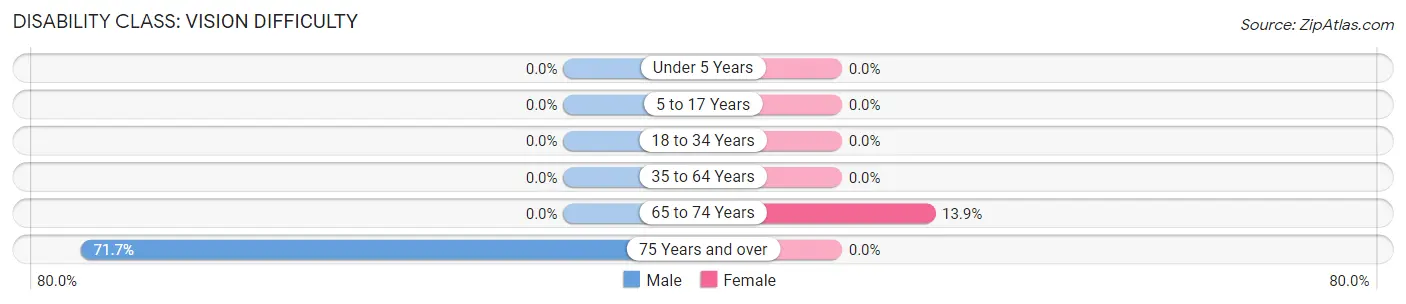
| Age Bracket | Male | Female |
| Under 5 Years | 0 (0.0%) | 0 (0.0%) |
| 5 to 17 Years | 0 (0.0%) | 0 (0.0%) |
| 18 to 34 Years | 0 (0.0%) | 0 (0.0%) |
| 35 to 64 Years | 0 (0.0%) | 0 (0.0%) |
| 65 to 74 Years | 0 (0.0%) | 18 (13.9%) |
| 75 Years and over | 43 (71.7%) | 0 (0.0%) |
Disability Class: Cognitive Difficulty
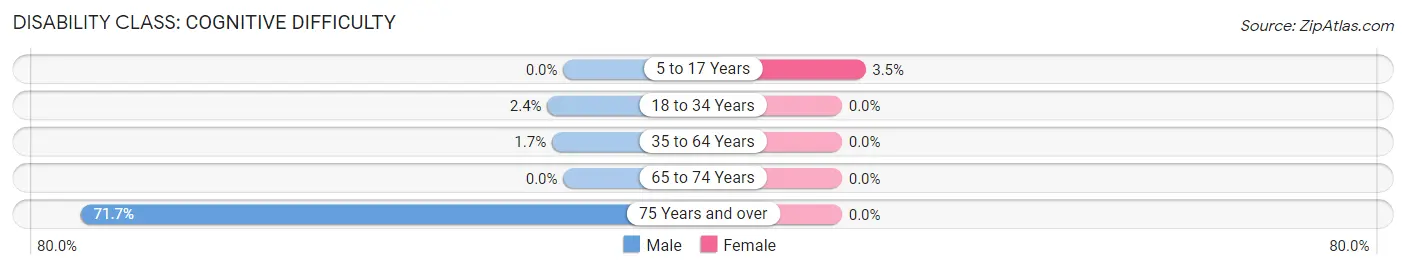
| Age Bracket | Male | Female |
| 5 to 17 Years | 0 (0.0%) | 9 (3.5%) |
| 18 to 34 Years | 9 (2.4%) | 0 (0.0%) |
| 35 to 64 Years | 12 (1.7%) | 0 (0.0%) |
| 65 to 74 Years | 0 (0.0%) | 0 (0.0%) |
| 75 Years and over | 43 (71.7%) | 0 (0.0%) |
Disability Class: Ambulatory Difficulty
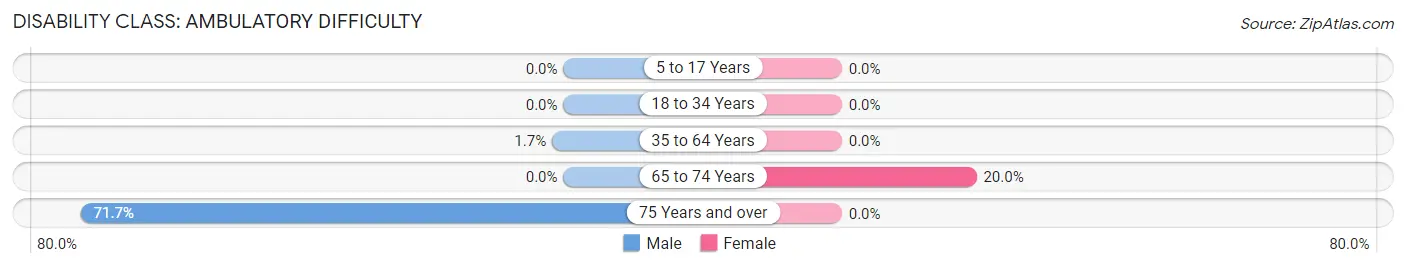
| Age Bracket | Male | Female |
| 5 to 17 Years | 0 (0.0%) | 0 (0.0%) |
| 18 to 34 Years | 0 (0.0%) | 0 (0.0%) |
| 35 to 64 Years | 12 (1.7%) | 0 (0.0%) |
| 65 to 74 Years | 0 (0.0%) | 26 (20.0%) |
| 75 Years and over | 43 (71.7%) | 0 (0.0%) |
Disability Class: Self-Care Difficulty
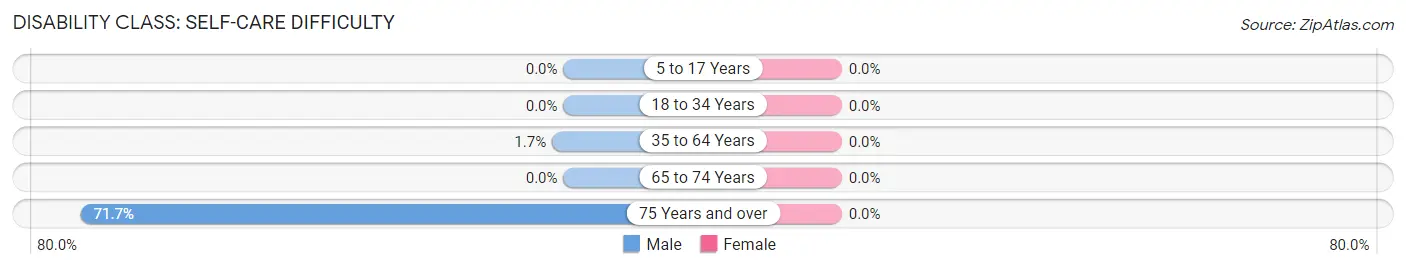
| Age Bracket | Male | Female |
| 5 to 17 Years | 0 (0.0%) | 0 (0.0%) |
| 18 to 34 Years | 0 (0.0%) | 0 (0.0%) |
| 35 to 64 Years | 12 (1.7%) | 0 (0.0%) |
| 65 to 74 Years | 0 (0.0%) | 0 (0.0%) |
| 75 Years and over | 43 (71.7%) | 0 (0.0%) |
Technology Access in Monrovia
Computing Device Access in Monrovia
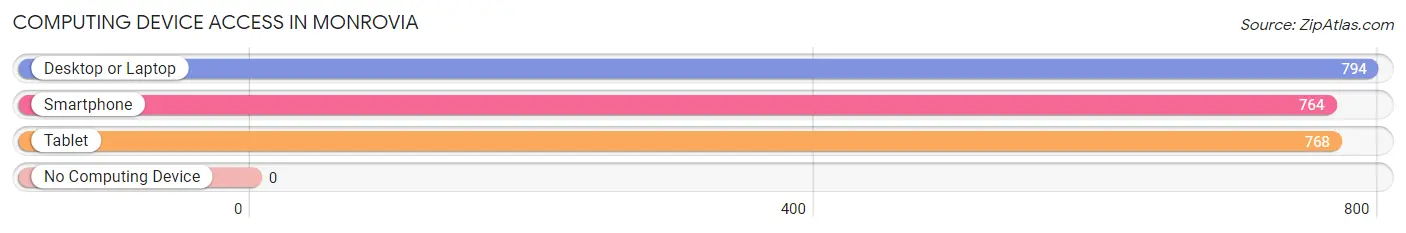
| Device Type | # Households | % Households |
| Desktop or Laptop | 794 | 97.1% |
| Smartphone | 764 | 93.4% |
| Tablet | 768 | 93.9% |
| No Computing Device | 0 | 0.0% |
| Total | 818 | 100.0% |
Internet Access in Monrovia
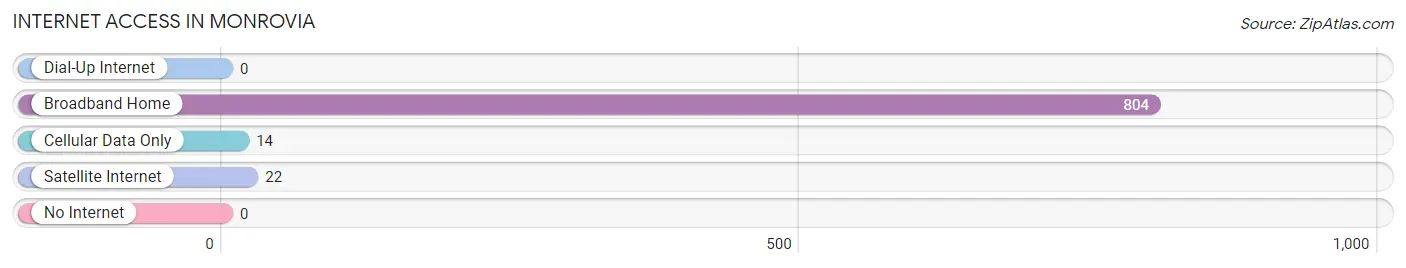
| Internet Type | # Households | % Households |
| Dial-Up Internet | 0 | 0.0% |
| Broadband Home | 804 | 98.3% |
| Cellular Data Only | 14 | 1.7% |
| Satellite Internet | 22 | 2.7% |
| No Internet | 0 | 0.0% |
| Total | 818 | 100.0% |
Monrovia Summary
Monrovia, Maryland is a small town located in Frederick County, Maryland. It is situated in the Catoctin Valley, approximately 25 miles northwest of Washington, D.C. The town was founded in 1812 and is named after James Monroe, the fifth President of the United States. Monrovia is a rural community with a population of approximately 1,500 people.
History
Monrovia was founded in 1812 by a group of settlers from Pennsylvania. The town was named after James Monroe, the fifth President of the United States. The town was originally a farming community and the main crops grown were wheat, corn, and oats. In the late 19th century, the town began to grow and develop as a result of the railroad. The railroad allowed for the transportation of goods and people to and from Monrovia.
In the early 20th century, Monrovia experienced a period of growth and development. The town was incorporated in 1921 and the first mayor was elected in 1922. During this time, the town saw the construction of a number of new buildings, including a post office, a bank, and a hotel.
In the 1950s, Monrovia experienced a period of decline as the railroad industry began to decline. The town was unable to attract new businesses and the population began to decline. In the late 1970s, the town began to experience a period of revitalization as new businesses began to move into the area.
Geography
Monrovia is located in Frederick County, Maryland. The town is situated in the Catoctin Valley, approximately 25 miles northwest of Washington, D.C. The town is located on the banks of the Monocacy River. The town is surrounded by rolling hills and farmland.
The climate in Monrovia is temperate with hot summers and cold winters. The average temperature in the summer is around 80 degrees Fahrenheit and the average temperature in the winter is around 40 degrees Fahrenheit.
Economy
The economy of Monrovia is largely based on agriculture. The town is home to a number of farms that produce a variety of crops, including wheat, corn, and oats. The town is also home to a number of small businesses, including restaurants, retail stores, and service providers.
Demographics
As of the 2010 census, the population of Monrovia was 1,500. The racial makeup of the town was 94.7% White, 1.3% African American, 0.7% Asian, 0.3% Native American, and 2.7% from other races. The median household income was $50,000 and the median family income was $60,000. The town has a poverty rate of 8.3%.
Monrovia is a small, rural town with a population of approximately 1,500 people. The town has a rich history and is home to a number of small businesses. The town is surrounded by rolling hills and farmland and is located on the banks of the Monocacy River. The town has a temperate climate with hot summers and cold winters. The economy of Monrovia is largely based on agriculture and the town is home to a number of small businesses. The population of Monrovia is 94.7% White, 1.3% African American, 0.7% Asian, 0.3% Native American, and 2.7% from other races. The median household income is $50,000 and the median family income is $60,000. The town has a poverty rate of 8.3%.
Common Questions
What is Per Capita Income in Monrovia?
Per Capita income in Monrovia is $68,888.
What is the Median Family Income in Monrovia?
Median Family Income in Monrovia is $224,545.
What is the Median Household income in Monrovia?
Median Household Income in Monrovia is $224,886.
What is Income or Wage Gap in Monrovia?
Income or Wage Gap in Monrovia is 1.0%.
Women in Monrovia earn 99.0 cents for every dollar earned by a man.
What is Inequality or Gini Index in Monrovia?
Inequality or Gini Index in Monrovia is 0.30.
What is the Total Population of Monrovia?
Total Population of Monrovia is 2,980.
What is the Total Male Population of Monrovia?
Total Male Population of Monrovia is 1,597.
What is the Total Female Population of Monrovia?
Total Female Population of Monrovia is 1,383.
What is the Ratio of Males per 100 Females in Monrovia?
There are 115.47 Males per 100 Females in Monrovia.
What is the Ratio of Females per 100 Males in Monrovia?
There are 86.60 Females per 100 Males in Monrovia.
What is the Median Population Age in Monrovia?
Median Population Age in Monrovia is 38.9 Years.
What is the Average Family Size in Monrovia
Average Family Size in Monrovia is 3.7 People.
What is the Average Household Size in Monrovia
Average Household Size in Monrovia is 3.6 People.
How Large is the Labor Force in Monrovia?
There are 1,978 People in the Labor Forcein in Monrovia.
What is the Percentage of People in the Labor Force in Monrovia?
82.4% of People are in the Labor Force in Monrovia.
What is the Unemployment Rate in Monrovia?
Unemployment Rate in Monrovia is 0.7%.