Jessup, MD Map & Demographics
Jessup Map
Jessup Overview
$27,377
PER CAPITA INCOME
$155,250
AVG FAMILY INCOME
$140,561
AVG HOUSEHOLD INCOME
27.9%
WAGE / INCOME GAP [ % ]
72.1¢/ $1
WAGE / INCOME GAP [ $ ]
0.32
INEQUALITY / GINI INDEX
9,602
TOTAL POPULATION
6,975
MALE POPULATION
2,627
FEMALE POPULATION
265.51
MALES / 100 FEMALES
37.66
FEMALES / 100 MALES
36.8
MEDIAN AGE
3.2
AVG FAMILY SIZE
2.5
AVG HOUSEHOLD SIZE
2,686
LABOR FORCE [ PEOPLE ]
30.3%
PERCENT IN LABOR FORCE
4.4%
UNEMPLOYMENT RATE
Jessup Zip Codes
Income in Jessup
Income Overview in Jessup
Per Capita Income in Jessup is $27,377, while median incomes of families and households are $155,250 and $140,561 respectively.
| Characteristic | Number | Measure |
| Per Capita Income | 9,602 | $27,377 |
| Median Family Income | 1,006 | $155,250 |
| Mean Family Income | 1,006 | $155,953 |
| Median Household Income | 1,735 | $140,561 |
| Mean Household Income | 1,735 | $144,935 |
| Income Deficit | 1,006 | $0 |
| Wage / Income Gap (%) | 9,602 | 27.87% |
| Wage / Income Gap ($) | 9,602 | 72.13¢ per $1 |
| Gini / Inequality Index | 9,602 | 0.32 |
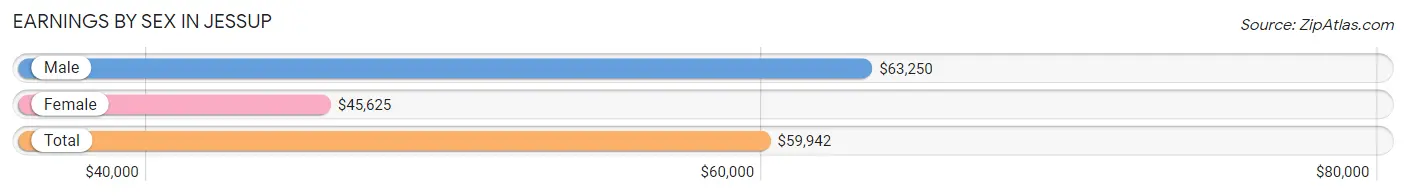
Earnings by Sex in Jessup
Average Earnings in Jessup are $59,942, $63,250 for men and $45,625 for women, a difference of 27.9%.
| Sex | Number | Average Earnings |
| Male | 2,262 (66.1%) | $63,250 |
| Female | 1,158 (33.9%) | $45,625 |
| Total | 3,420 (100.0%) | $59,942 |
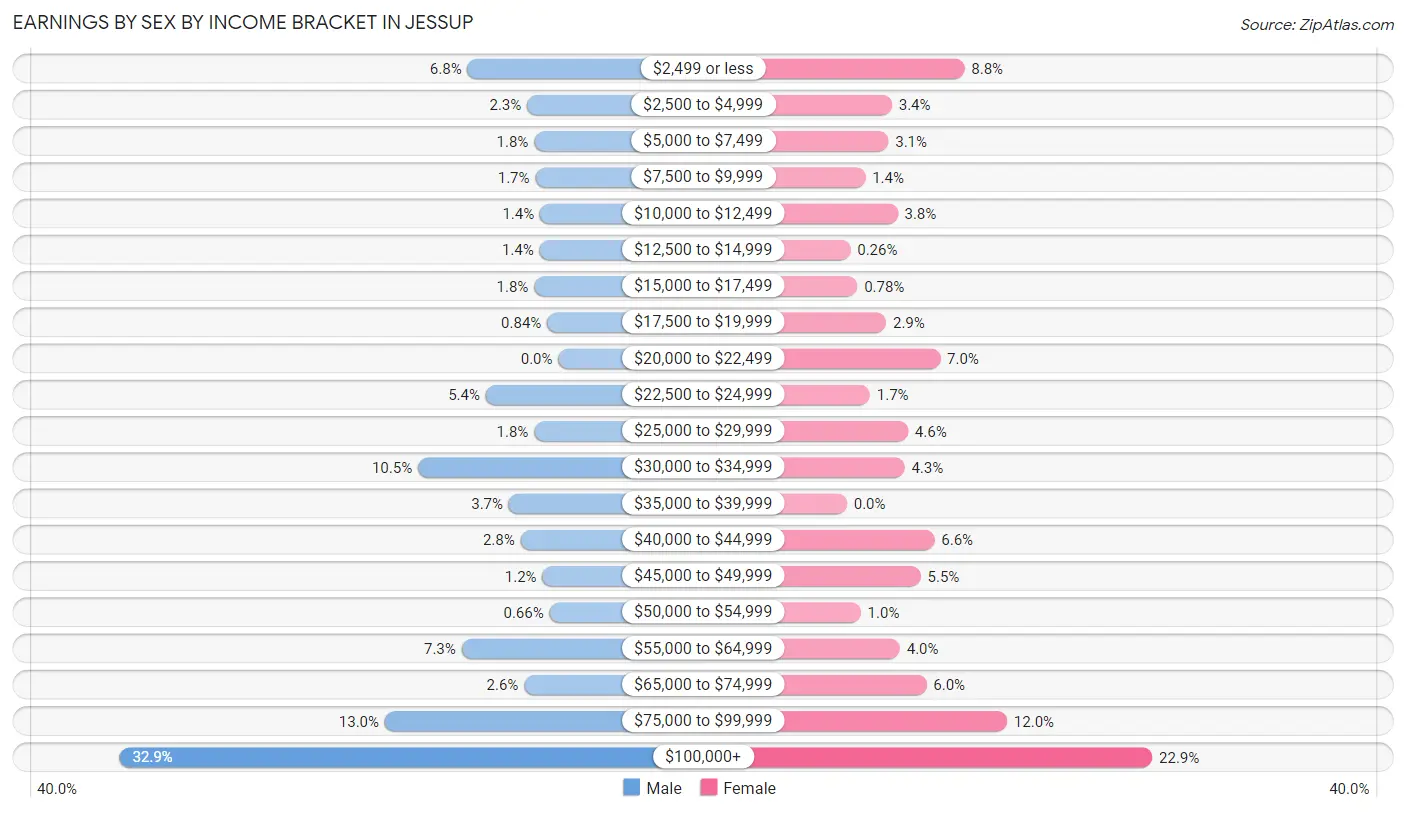
Earnings by Sex by Income Bracket in Jessup
The most common earnings brackets in Jessup are $100,000+ for men (744 | 32.9%) and $100,000+ for women (265 | 22.9%).
| Income | Male | Female |
| $2,499 or less | 154 (6.8%) | 102 (8.8%) |
| $2,500 to $4,999 | 53 (2.3%) | 39 (3.4%) |
| $5,000 to $7,499 | 41 (1.8%) | 36 (3.1%) |
| $7,500 to $9,999 | 39 (1.7%) | 16 (1.4%) |
| $10,000 to $12,499 | 31 (1.4%) | 44 (3.8%) |
| $12,500 to $14,999 | 32 (1.4%) | 3 (0.3%) |
| $15,000 to $17,499 | 41 (1.8%) | 9 (0.8%) |
| $17,500 to $19,999 | 19 (0.8%) | 34 (2.9%) |
| $20,000 to $22,499 | 0 (0.0%) | 81 (7.0%) |
| $22,500 to $24,999 | 123 (5.4%) | 20 (1.7%) |
| $25,000 to $29,999 | 41 (1.8%) | 53 (4.6%) |
| $30,000 to $34,999 | 238 (10.5%) | 50 (4.3%) |
| $35,000 to $39,999 | 84 (3.7%) | 0 (0.0%) |
| $40,000 to $44,999 | 64 (2.8%) | 76 (6.6%) |
| $45,000 to $49,999 | 27 (1.2%) | 64 (5.5%) |
| $50,000 to $54,999 | 15 (0.7%) | 12 (1.0%) |
| $55,000 to $64,999 | 164 (7.2%) | 46 (4.0%) |
| $65,000 to $74,999 | 58 (2.6%) | 69 (6.0%) |
| $75,000 to $99,999 | 294 (13.0%) | 139 (12.0%) |
| $100,000+ | 744 (32.9%) | 265 (22.9%) |
| Total | 2,262 (100.0%) | 1,158 (100.0%) |
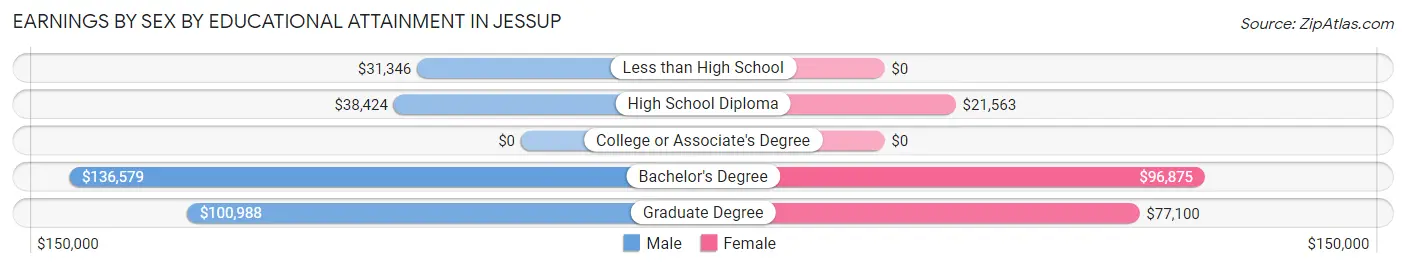
Earnings by Sex by Educational Attainment in Jessup
Average earnings in Jessup are $76,875 for men and $60,658 for women, a difference of 21.1%. Men with an educational attainment of bachelor's degree enjoy the highest average annual earnings of $136,579, while those with less than high school education earn the least with $31,346. Women with an educational attainment of bachelor's degree earn the most with the average annual earnings of $96,875, while those with high school diploma education have the smallest earnings of $21,563.
| Educational Attainment | Male Income | Female Income |
| Less than High School | $31,346 | $0 |
| High School Diploma | $38,424 | $21,563 |
| College or Associate's Degree | - | - |
| Bachelor's Degree | $136,579 | $96,875 |
| Graduate Degree | $100,988 | $77,100 |
| Total | $76,875 | $60,658 |
Family Income in Jessup
Family Income Brackets in Jessup
According to the Jessup family income data, there are 376 families falling into the $200,000+ income range, which is the most common income bracket and makes up 37.4% of all families.
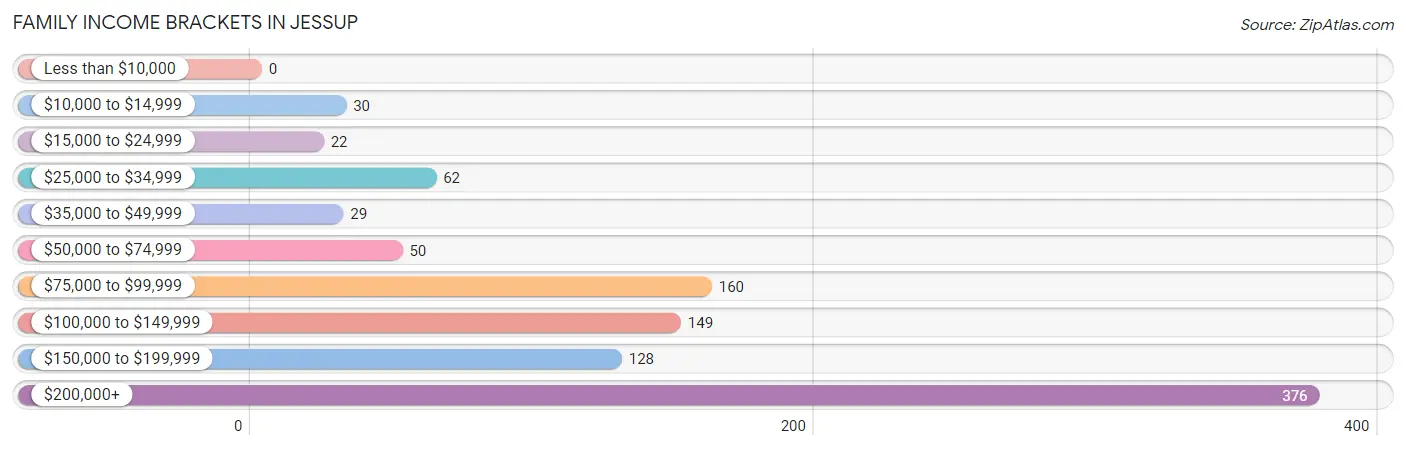
| Income Bracket | # Families | % Families |
| Less than $10,000 | 0 | 0.0% |
| $10,000 to $14,999 | 30 | 3.0% |
| $15,000 to $24,999 | 22 | 2.2% |
| $25,000 to $34,999 | 62 | 6.2% |
| $35,000 to $49,999 | 29 | 2.9% |
| $50,000 to $74,999 | 50 | 5.0% |
| $75,000 to $99,999 | 160 | 15.9% |
| $100,000 to $149,999 | 149 | 14.8% |
| $150,000 to $199,999 | 128 | 12.7% |
| $200,000+ | 376 | 37.4% |
Family Income by Famaliy Size in Jessup
3-person families (385 | 38.3%) account for the highest median family income in Jessup with $223,092 per family, while 3-person families (385 | 38.3%) have the highest median income of $74,364 per family member.
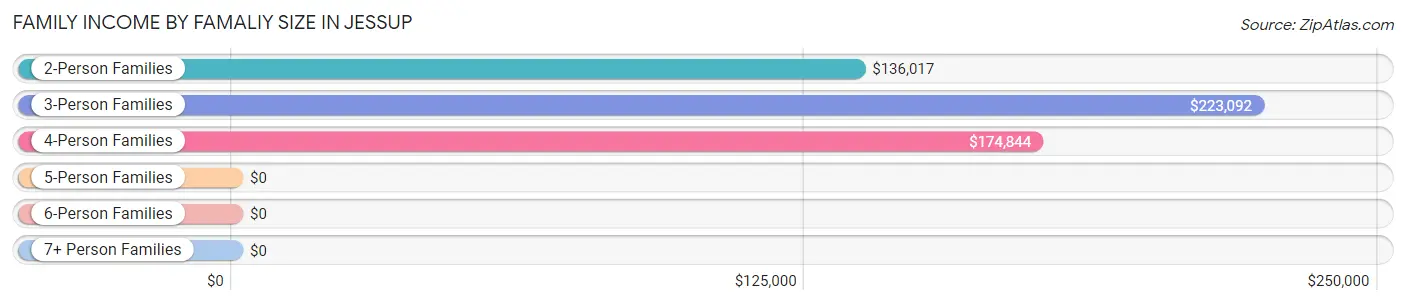
| Income Bracket | # Families | Median Income |
| 2-Person Families | 364 (36.2%) | $136,017 |
| 3-Person Families | 385 (38.3%) | $223,092 |
| 4-Person Families | 139 (13.8%) | $174,844 |
| 5-Person Families | 79 (7.9%) | $0 |
| 6-Person Families | 0 (0.0%) | $0 |
| 7+ Person Families | 39 (3.9%) | $0 |
| Total | 1,006 (100.0%) | $155,250 |
Family Income by Number of Earners in Jessup
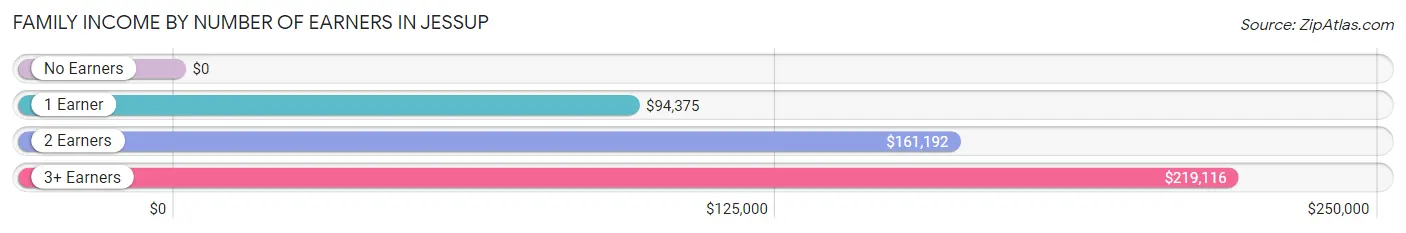
| Number of Earners | # Families | Median Income |
| No Earners | 49 (4.9%) | $0 |
| 1 Earner | 285 (28.3%) | $94,375 |
| 2 Earners | 541 (53.8%) | $161,192 |
| 3+ Earners | 131 (13.0%) | $219,116 |
| Total | 1,006 (100.0%) | $155,250 |
Household Income in Jessup
Household Income Brackets in Jessup
With 446 households falling in the category, the $100,000 to $149,999 income range is the most frequent in Jessup, accounting for 25.7% of all households.
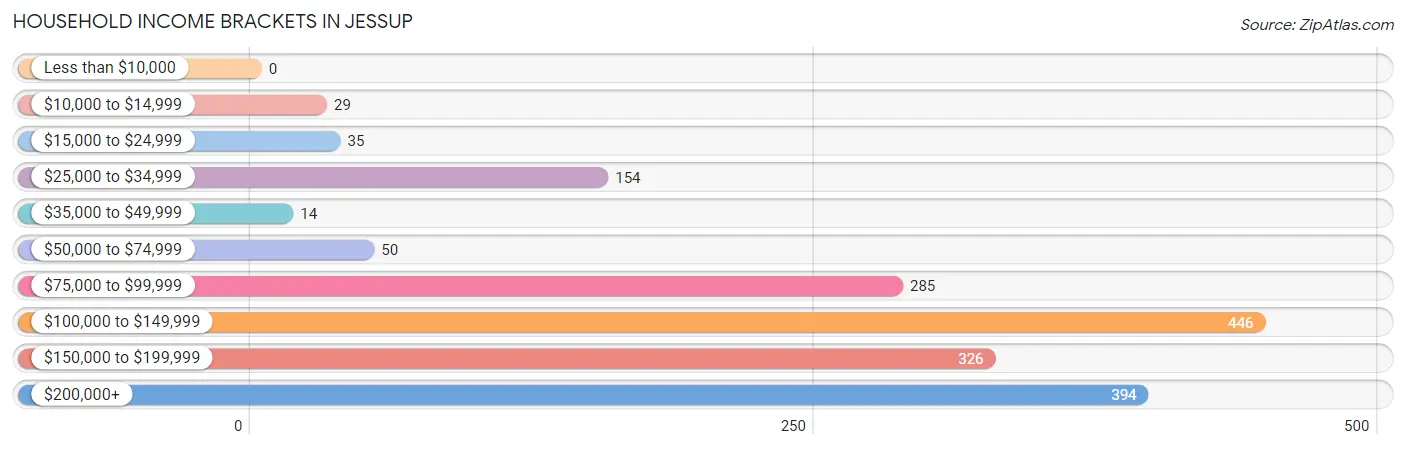
| Income Bracket | # Households | % Households |
| Less than $10,000 | 0 | 0.0% |
| $10,000 to $14,999 | 29 | 1.7% |
| $15,000 to $24,999 | 35 | 2.0% |
| $25,000 to $34,999 | 154 | 8.9% |
| $35,000 to $49,999 | 14 | 0.8% |
| $50,000 to $74,999 | 50 | 2.9% |
| $75,000 to $99,999 | 285 | 16.4% |
| $100,000 to $149,999 | 446 | 25.7% |
| $150,000 to $199,999 | 326 | 18.8% |
| $200,000+ | 394 | 22.7% |
Household Income by Householder Age in Jessup
The median household income in Jessup is $140,561, with the highest median household income of $173,438 found in the 45 to 64 years age bracket for the primary householder. A total of 560 households (32.3%) fall into this category. Meanwhile, the 15 to 24 years age bracket for the primary householder has the lowest median household income of $0, with 131 households (7.5%) in this group.
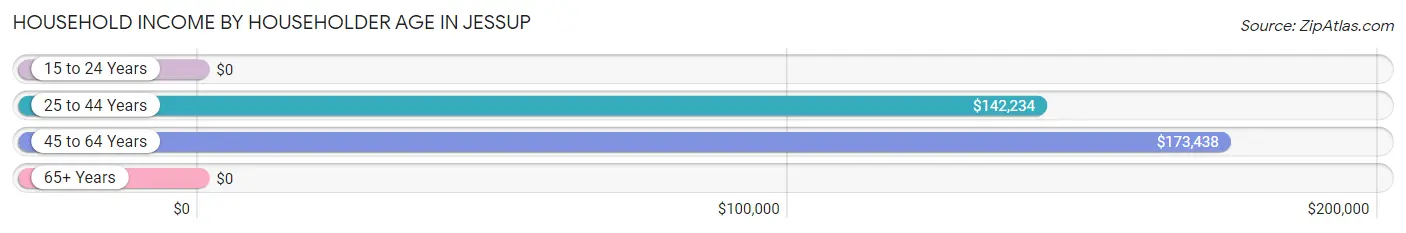
| Income Bracket | # Households | Median Income |
| 15 to 24 Years | 131 (7.5%) | $0 |
| 25 to 44 Years | 827 (47.7%) | $142,234 |
| 45 to 64 Years | 560 (32.3%) | $173,438 |
| 65+ Years | 217 (12.5%) | $0 |
| Total | 1,735 (100.0%) | $140,561 |
Poverty in Jessup
Income Below Poverty by Sex and Age in Jessup
With 2.8% poverty level for males and 6.3% for females among the residents of Jessup, 15 year old males and 18 to 24 year old females are the most vulnerable to poverty, with 13 males (100.0%) and 47 females (21.3%) in their respective age groups living below the poverty level.
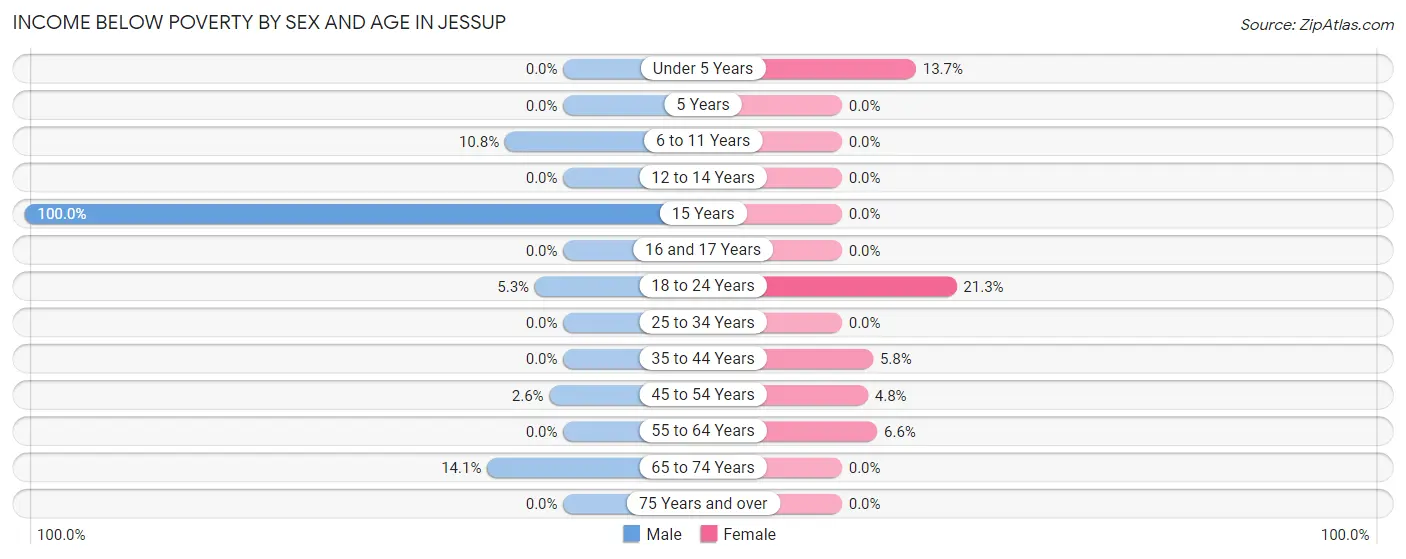
| Age Bracket | Male | Female |
| Under 5 Years | 0 (0.0%) | 36 (13.7%) |
| 5 Years | 0 (0.0%) | 0 (0.0%) |
| 6 to 11 Years | 13 (10.8%) | 0 (0.0%) |
| 12 to 14 Years | 0 (0.0%) | 0 (0.0%) |
| 15 Years | 13 (100.0%) | 0 (0.0%) |
| 16 and 17 Years | 0 (0.0%) | 0 (0.0%) |
| 18 to 24 Years | 15 (5.3%) | 47 (21.3%) |
| 25 to 34 Years | 0 (0.0%) | 0 (0.0%) |
| 35 to 44 Years | 0 (0.0%) | 13 (5.8%) |
| 45 to 54 Years | 11 (2.6%) | 9 (4.8%) |
| 55 to 64 Years | 0 (0.0%) | 19 (6.6%) |
| 65 to 74 Years | 13 (14.1%) | 0 (0.0%) |
| 75 Years and over | 0 (0.0%) | 0 (0.0%) |
| Total | 65 (2.8%) | 124 (6.3%) |
Income Above Poverty by Sex and Age in Jessup
According to the poverty statistics in Jessup, males aged under 5 years and females aged 6 to 11 years are the age groups that are most secure financially, with 100.0% of males and 100.0% of females in these age groups living above the poverty line.
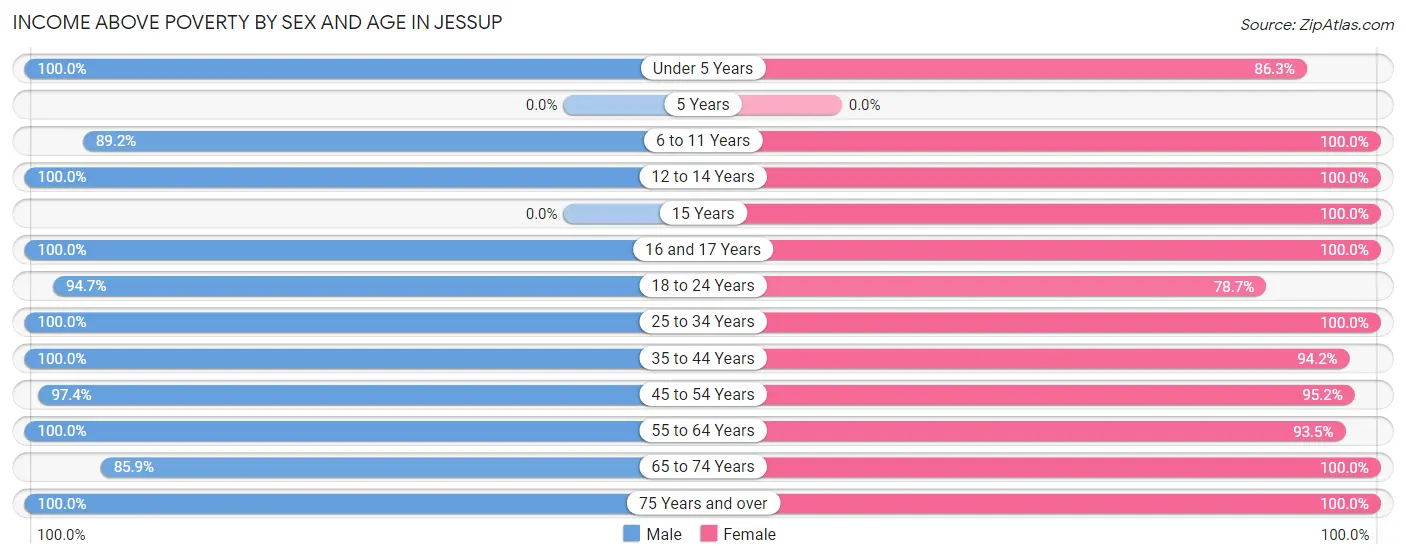
| Age Bracket | Male | Female |
| Under 5 Years | 112 (100.0%) | 226 (86.3%) |
| 5 Years | 0 (0.0%) | 0 (0.0%) |
| 6 to 11 Years | 107 (89.2%) | 102 (100.0%) |
| 12 to 14 Years | 41 (100.0%) | 40 (100.0%) |
| 15 Years | 0 (0.0%) | 6 (100.0%) |
| 16 and 17 Years | 50 (100.0%) | 45 (100.0%) |
| 18 to 24 Years | 269 (94.7%) | 174 (78.7%) |
| 25 to 34 Years | 487 (100.0%) | 371 (100.0%) |
| 35 to 44 Years | 476 (100.0%) | 212 (94.2%) |
| 45 to 54 Years | 416 (97.4%) | 177 (95.2%) |
| 55 to 64 Years | 235 (100.0%) | 271 (93.4%) |
| 65 to 74 Years | 79 (85.9%) | 111 (100.0%) |
| 75 Years and over | 19 (100.0%) | 112 (100.0%) |
| Total | 2,291 (97.2%) | 1,847 (93.7%) |
Income Below Poverty Among Married-Couple Families in Jessup
The poverty statistics for married-couple families in Jessup show that 1.7% or 13 of the total 750 families live below the poverty line. Families with no children have the highest poverty rate of 3.6%, comprising of 13 families. On the other hand, families with 1 or 2 children have the lowest poverty rate of 0.0%, which includes 0 families.
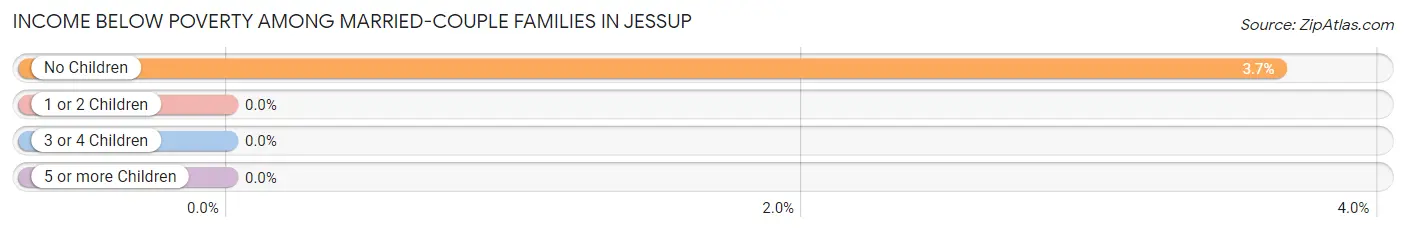
| Children | Above Poverty | Below Poverty |
| No Children | 343 (96.4%) | 13 (3.6%) |
| 1 or 2 Children | 355 (100.0%) | 0 (0.0%) |
| 3 or 4 Children | 39 (100.0%) | 0 (0.0%) |
| 5 or more Children | 0 (0.0%) | 0 (0.0%) |
| Total | 737 (98.3%) | 13 (1.7%) |
Income Below Poverty Among Single-Parent Households in Jessup
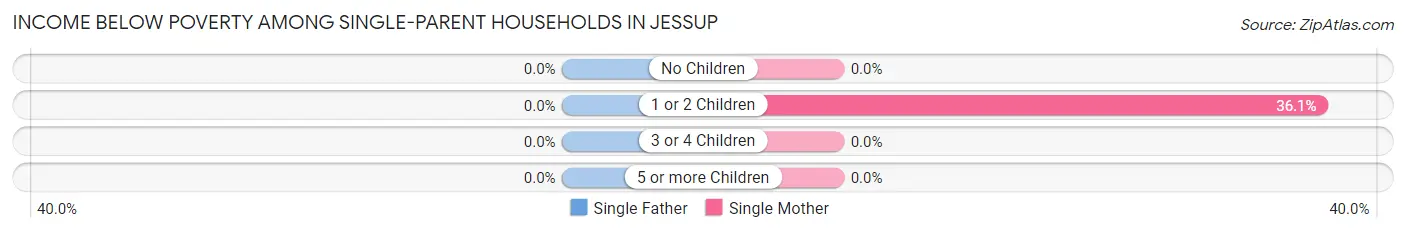
| Children | Single Father | Single Mother |
| No Children | 0 (0.0%) | 0 (0.0%) |
| 1 or 2 Children | 0 (0.0%) | 39 (36.1%) |
| 3 or 4 Children | 0 (0.0%) | 0 (0.0%) |
| 5 or more Children | 0 (0.0%) | 0 (0.0%) |
| Total | 0 (0.0%) | 39 (25.0%) |
Income Below Poverty Among Married-Couple vs Single-Parent Households in Jessup
The poverty data for Jessup shows that 13 of the married-couple family households (1.7%) and 39 of the single-parent households (15.2%) are living below the poverty level. Within the married-couple family households, those with no children have the highest poverty rate, with 13 households (3.6%) falling below the poverty line. Among the single-parent households, those with 1 or 2 children have the highest poverty rate, with 39 household (36.1%) living below poverty.
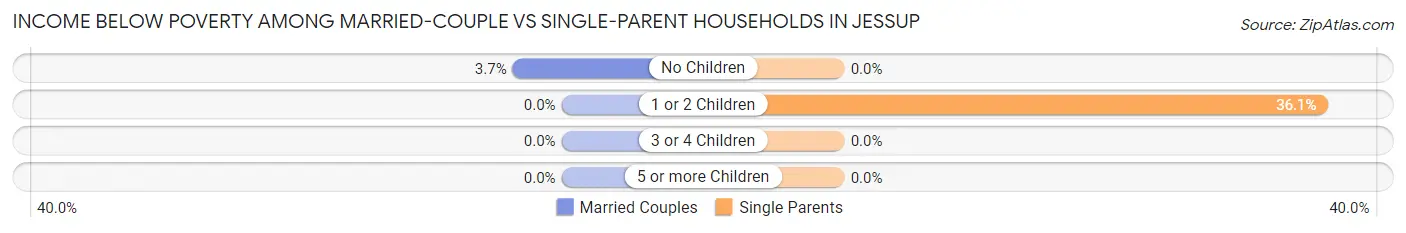
| Children | Married-Couple Families | Single-Parent Households |
| No Children | 13 (3.6%) | 0 (0.0%) |
| 1 or 2 Children | 0 (0.0%) | 39 (36.1%) |
| 3 or 4 Children | 0 (0.0%) | 0 (0.0%) |
| 5 or more Children | 0 (0.0%) | 0 (0.0%) |
| Total | 13 (1.7%) | 39 (15.2%) |
Race in Jessup
The most populous races in Jessup are Black / African American (5,156 | 53.7%), White / Caucasian (3,232 | 33.7%), and Hispanic or Latino (851 | 8.9%).
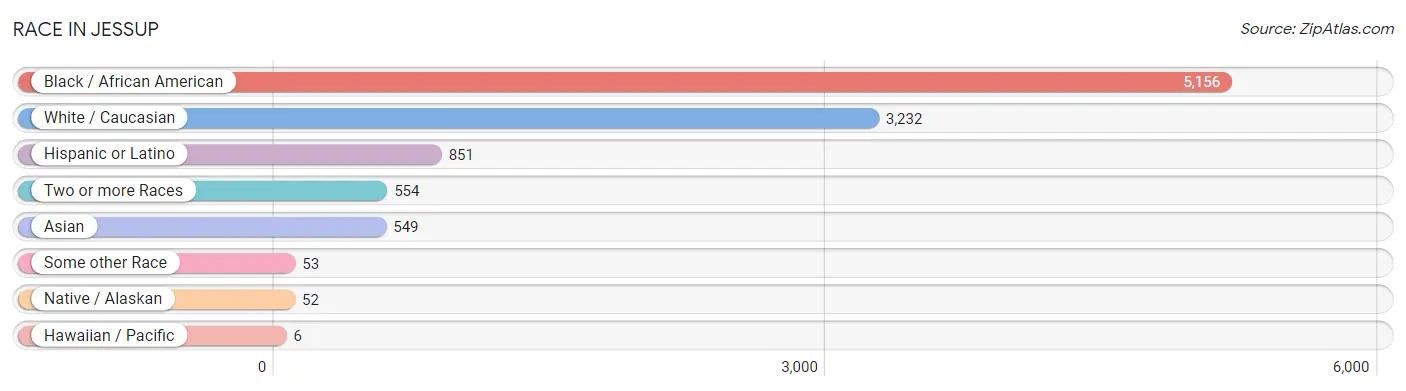
| Race | # Population | % Population |
| Asian | 549 | 5.7% |
| Black / African American | 5,156 | 53.7% |
| Hawaiian / Pacific | 6 | 0.1% |
| Hispanic or Latino | 851 | 8.9% |
| Native / Alaskan | 52 | 0.5% |
| White / Caucasian | 3,232 | 33.7% |
| Two or more Races | 554 | 5.8% |
| Some other Race | 53 | 0.5% |
| Total | 9,602 | 100.0% |
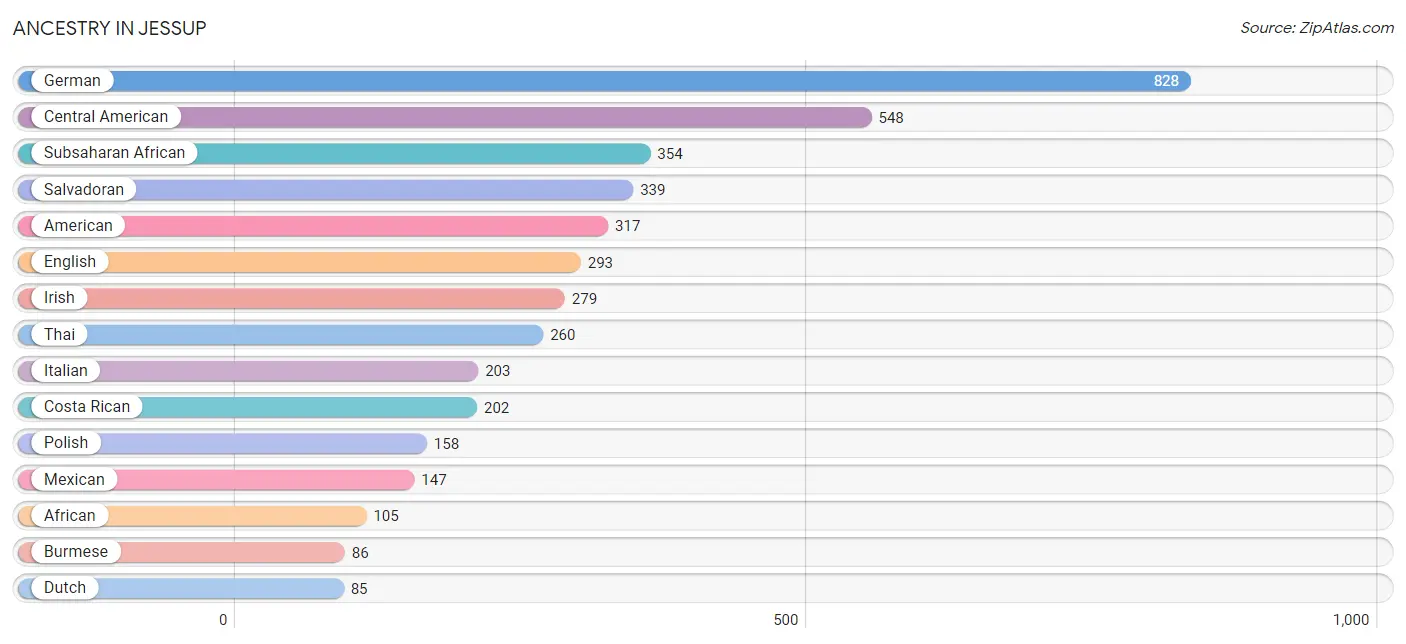
Ancestry in Jessup
The most populous ancestries reported in Jessup are German (828 | 8.6%), Central American (548 | 5.7%), Subsaharan African (354 | 3.7%), Salvadoran (339 | 3.5%), and American (317 | 3.3%), together accounting for 24.8% of all Jessup residents.
| Ancestry | # Population | % Population |
| African | 105 | 1.1% |
| American | 317 | 3.3% |
| Armenian | 6 | 0.1% |
| British | 7 | 0.1% |
| British West Indian | 49 | 0.5% |
| Burmese | 86 | 0.9% |
| Central American | 548 | 5.7% |
| Cherokee | 16 | 0.2% |
| Colombian | 35 | 0.4% |
| Costa Rican | 202 | 2.1% |
| Dutch | 85 | 0.9% |
| Eastern European | 22 | 0.2% |
| Ecuadorian | 11 | 0.1% |
| English | 293 | 3.0% |
| European | 3 | 0.0% |
| Filipino | 16 | 0.2% |
| French | 63 | 0.7% |
| French Canadian | 12 | 0.1% |
| German | 828 | 8.6% |
| Guatemalan | 1 | 0.0% |
| Haitian | 8 | 0.1% |
| Honduran | 6 | 0.1% |
| Hungarian | 17 | 0.2% |
| Iranian | 20 | 0.2% |
| Irish | 279 | 2.9% |
| Italian | 203 | 2.1% |
| Jamaican | 16 | 0.2% |
| Laotian | 16 | 0.2% |
| Lumbee | 20 | 0.2% |
| Mexican | 147 | 1.5% |
| Mexican American Indian | 16 | 0.2% |
| Nigerian | 75 | 0.8% |
| Polish | 158 | 1.7% |
| Puerto Rican | 75 | 0.8% |
| Romanian | 21 | 0.2% |
| Salvadoran | 339 | 3.5% |
| Scandinavian | 78 | 0.8% |
| Scotch-Irish | 3 | 0.0% |
| Scottish | 12 | 0.1% |
| Seminole | 14 | 0.2% |
| Sierra Leonean | 33 | 0.3% |
| South American | 46 | 0.5% |
| Spaniard | 7 | 0.1% |
| Subsaharan African | 354 | 3.7% |
| Swiss | 75 | 0.8% |
| Thai | 260 | 2.7% |
| Tongan | 6 | 0.1% |
| Ugandan | 19 | 0.2% |
| West Indian | 30 | 0.3% | View All 49 Rows |
Immigrants in Jessup
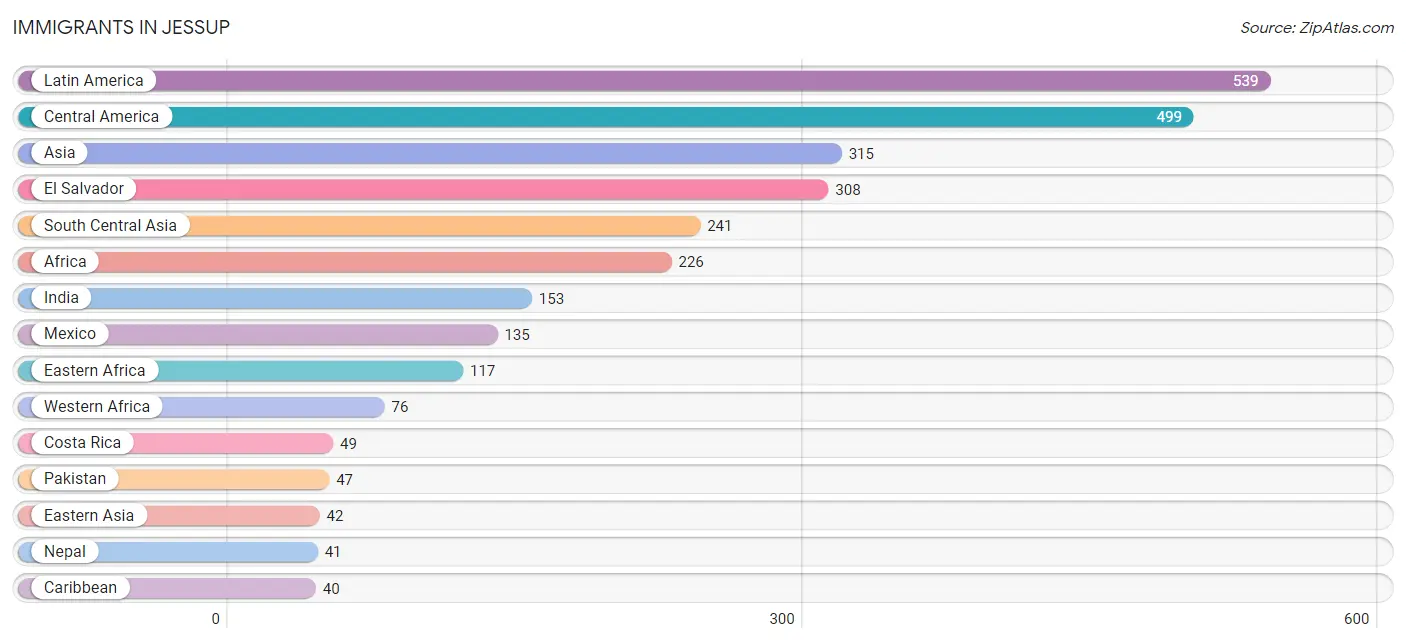
The most numerous immigrant groups reported in Jessup came from Latin America (539 | 5.6%), Central America (499 | 5.2%), Asia (315 | 3.3%), El Salvador (308 | 3.2%), and South Central Asia (241 | 2.5%), together accounting for 19.8% of all Jessup residents.
| Immigration Origin | # Population | % Population |
| Africa | 226 | 2.4% |
| Asia | 315 | 3.3% |
| Cameroon | 33 | 0.3% |
| Caribbean | 40 | 0.4% |
| Central America | 499 | 5.2% |
| China | 16 | 0.2% |
| Costa Rica | 49 | 0.5% |
| Eastern Africa | 117 | 1.2% |
| Eastern Asia | 42 | 0.4% |
| Eastern Europe | 28 | 0.3% |
| El Salvador | 308 | 3.2% |
| Europe | 28 | 0.3% |
| Grenada | 36 | 0.4% |
| Guatemala | 1 | 0.0% |
| Honduras | 6 | 0.1% |
| Hungary | 7 | 0.1% |
| India | 153 | 1.6% |
| Indonesia | 16 | 0.2% |
| Korea | 26 | 0.3% |
| Kuwait | 16 | 0.2% |
| Latin America | 539 | 5.6% |
| Liberia | 13 | 0.1% |
| Mexico | 135 | 1.4% |
| Middle Africa | 33 | 0.3% |
| Nepal | 41 | 0.4% |
| Nigeria | 30 | 0.3% |
| Pakistan | 47 | 0.5% |
| Romania | 21 | 0.2% |
| Sierra Leone | 33 | 0.3% |
| South Central Asia | 241 | 2.5% |
| South Eastern Asia | 16 | 0.2% |
| Taiwan | 16 | 0.2% |
| Trinidad and Tobago | 3 | 0.0% |
| Uganda | 19 | 0.2% |
| Western Africa | 76 | 0.8% |
| Western Asia | 16 | 0.2% | View All 36 Rows |
Sex and Age in Jessup
Sex and Age in Jessup
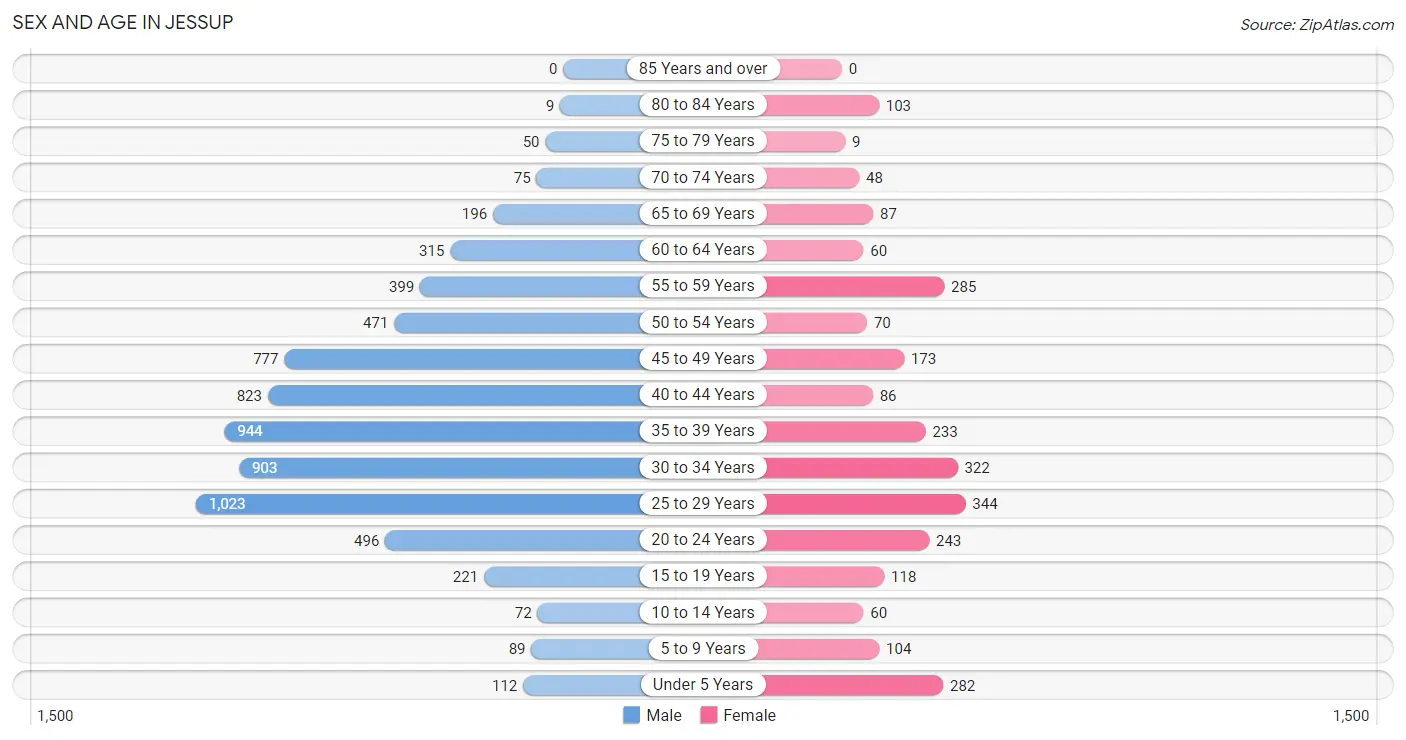
The most populous age groups in Jessup are 25 to 29 Years (1,023 | 14.7%) for men and 25 to 29 Years (344 | 13.1%) for women.
| Age Bracket | Male | Female |
| Under 5 Years | 112 (1.6%) | 282 (10.7%) |
| 5 to 9 Years | 89 (1.3%) | 104 (4.0%) |
| 10 to 14 Years | 72 (1.0%) | 60 (2.3%) |
| 15 to 19 Years | 221 (3.2%) | 118 (4.5%) |
| 20 to 24 Years | 496 (7.1%) | 243 (9.2%) |
| 25 to 29 Years | 1,023 (14.7%) | 344 (13.1%) |
| 30 to 34 Years | 903 (13.0%) | 322 (12.3%) |
| 35 to 39 Years | 944 (13.5%) | 233 (8.9%) |
| 40 to 44 Years | 823 (11.8%) | 86 (3.3%) |
| 45 to 49 Years | 777 (11.1%) | 173 (6.6%) |
| 50 to 54 Years | 471 (6.8%) | 70 (2.7%) |
| 55 to 59 Years | 399 (5.7%) | 285 (10.8%) |
| 60 to 64 Years | 315 (4.5%) | 60 (2.3%) |
| 65 to 69 Years | 196 (2.8%) | 87 (3.3%) |
| 70 to 74 Years | 75 (1.1%) | 48 (1.8%) |
| 75 to 79 Years | 50 (0.7%) | 9 (0.3%) |
| 80 to 84 Years | 9 (0.1%) | 103 (3.9%) |
| 85 Years and over | 0 (0.0%) | 0 (0.0%) |
| Total | 6,975 (100.0%) | 2,627 (100.0%) |
Families and Households in Jessup
Median Family Size in Jessup
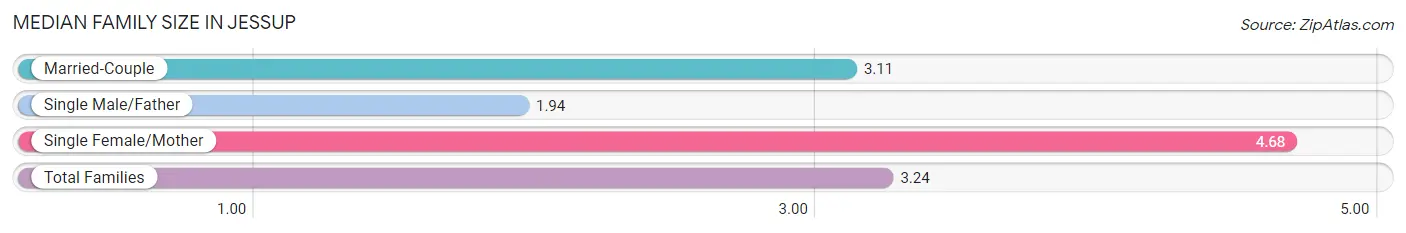
The median family size in Jessup is 3.24 persons per family, with single female/mother families (156 | 15.5%) accounting for the largest median family size of 4.68 persons per family. On the other hand, single male/father families (100 | 9.9%) represent the smallest median family size with 1.94 persons per family.
| Family Type | # Families | Family Size |
| Married-Couple | 750 (74.6%) | 3.11 |
| Single Male/Father | 100 (9.9%) | 1.94 |
| Single Female/Mother | 156 (15.5%) | 4.68 |
| Total Families | 1,006 (100.0%) | 3.24 |
Median Household Size in Jessup
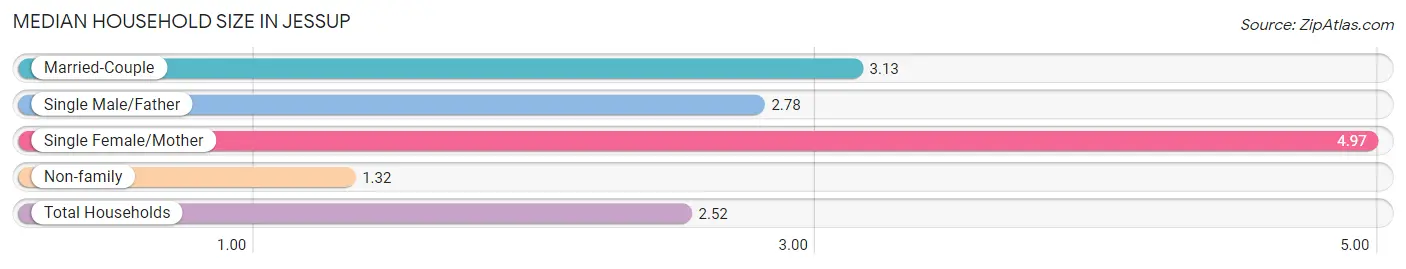
The median household size in Jessup is 2.52 persons per household, with single female/mother households (156 | 9.0%) accounting for the largest median household size of 4.97 persons per household. non-family households (729 | 42.0%) represent the smallest median household size with 1.32 persons per household.
| Household Type | # Households | Household Size |
| Married-Couple | 750 (43.2%) | 3.13 |
| Single Male/Father | 100 (5.8%) | 2.78 |
| Single Female/Mother | 156 (9.0%) | 4.97 |
| Non-family | 729 (42.0%) | 1.32 |
| Total Households | 1,735 (100.0%) | 2.52 |
Household Size by Marriage Status in Jessup
Out of a total of 1,735 households in Jessup, 1,006 (58.0%) are family households, while 729 (42.0%) are nonfamily households. The most numerous type of family households are 3-person households, comprising 409, and the most common type of nonfamily households are 1-person households, comprising 558.
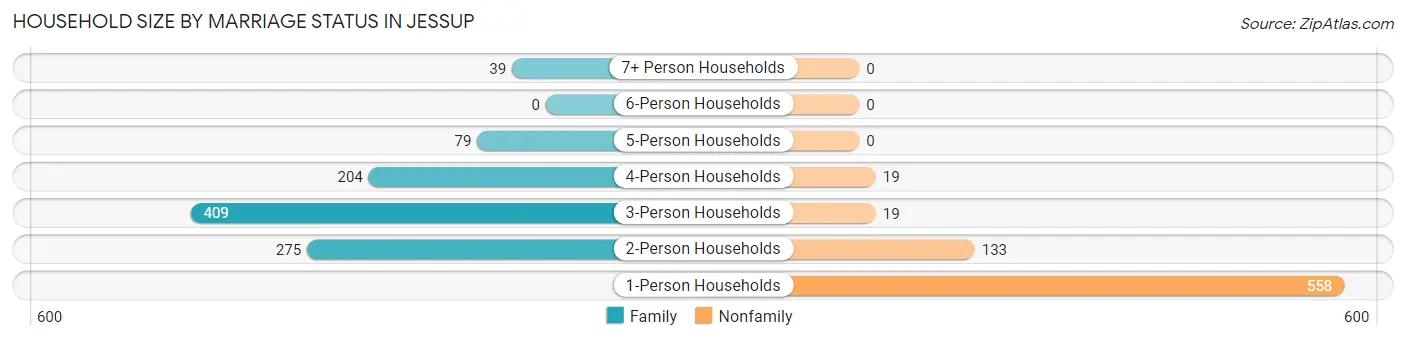
| Household Size | Family Households | Nonfamily Households |
| 1-Person Households | - | 558 (32.2%) |
| 2-Person Households | 275 (15.9%) | 133 (7.7%) |
| 3-Person Households | 409 (23.6%) | 19 (1.1%) |
| 4-Person Households | 204 (11.8%) | 19 (1.1%) |
| 5-Person Households | 79 (4.5%) | 0 (0.0%) |
| 6-Person Households | 0 (0.0%) | 0 (0.0%) |
| 7+ Person Households | 39 (2.2%) | 0 (0.0%) |
| Total | 1,006 (58.0%) | 729 (42.0%) |
Female Fertility in Jessup
Fertility by Age in Jessup
Average fertility rate in Jessup is 80.0 births per 1,000 women. Women in the age bracket of 20 to 34 years have the highest fertility rate with 135.0 births per 1,000 women. Women in the age bracket of 20 to 34 years acount for 100.0% of all women with births.

| Age Bracket | Women with Births | Births / 1,000 Women |
| 15 to 19 years | 0 (0.0%) | 0.0 |
| 20 to 34 years | 123 (100.0%) | 135.0 |
| 35 to 50 years | 0 (0.0%) | 0.0 |
| Total | 123 (100.0%) | 80.0 |
Fertility by Age by Marriage Status in Jessup
85.4% of women with births (123) in Jessup are married. The highest percentage of unmarried women with births falls into 20 to 34 years age bracket with 14.6% of them unmarried at the time of birth, while the lowest percentage of unmarried women with births belong to 20 to 34 years age bracket with 14.6% of them unmarried.
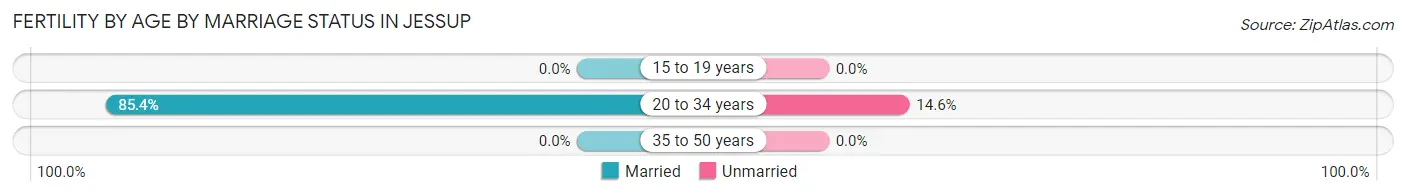
| Age Bracket | Married | Unmarried |
| 15 to 19 years | 0 (0.0%) | 0 (0.0%) |
| 20 to 34 years | 105 (85.4%) | 18 (14.6%) |
| 35 to 50 years | 0 (0.0%) | 0 (0.0%) |
| Total | 105 (85.4%) | 18 (14.6%) |
Fertility by Education in Jessup
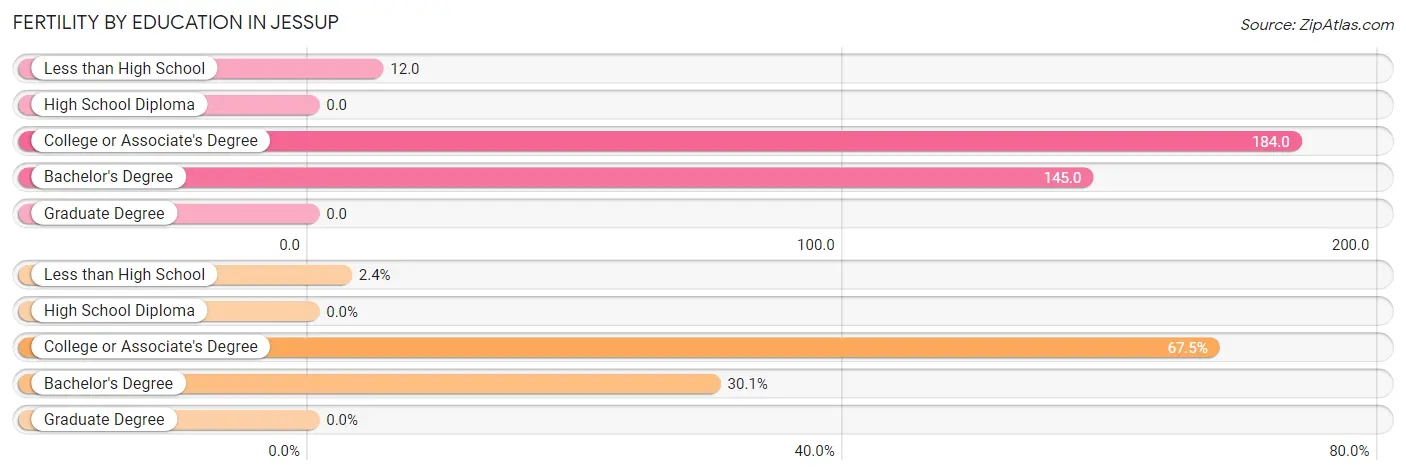
| Educational Attainment | Women with Births | Births / 1,000 Women |
| Less than High School | 3 (2.4%) | 12.0 |
| High School Diploma | 0 (0.0%) | 0.0 |
| College or Associate's Degree | 83 (67.5%) | 184.0 |
| Bachelor's Degree | 37 (30.1%) | 145.0 |
| Graduate Degree | 0 (0.0%) | 0.0 |
| Total | 123 (100.0%) | 80.0 |
Fertility by Education by Marriage Status in Jessup
14.6% of women with births in Jessup are unmarried. Women with the educational attainment of bachelor's degree are most likely to be married with 100.0% of them married at childbirth, while women with the educational attainment of less than high school are least likely to be married with 100.0% of them unmarried at childbirth.
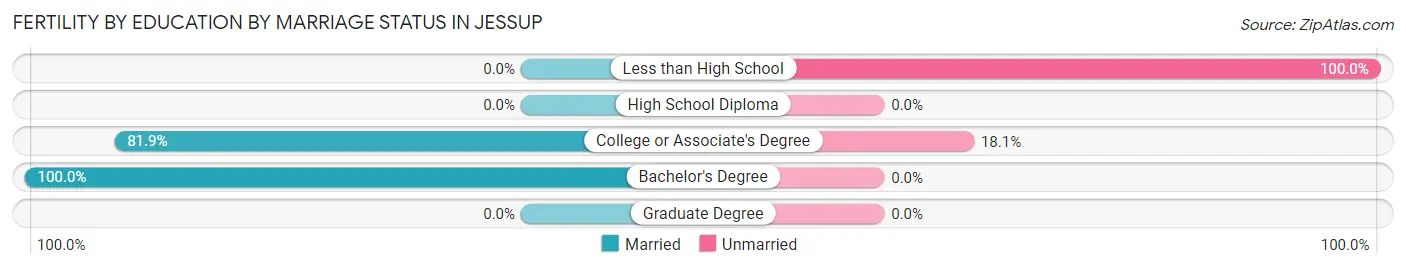
| Educational Attainment | Married | Unmarried |
| Less than High School | 0 (0.0%) | 3 (100.0%) |
| High School Diploma | 0 (0.0%) | 0 (0.0%) |
| College or Associate's Degree | 68 (81.9%) | 15 (18.1%) |
| Bachelor's Degree | 37 (100.0%) | 0 (0.0%) |
| Graduate Degree | 0 (0.0%) | 0 (0.0%) |
| Total | 105 (85.4%) | 18 (14.6%) |
Employment Characteristics in Jessup
Employment by Class of Employer in Jessup
Among the 2,556 employed individuals in Jessup, private company employees (1,451 | 56.8%), federal government employees (626 | 24.5%), and not-for-profit organizations (278 | 10.9%) make up the most common classes of employment.
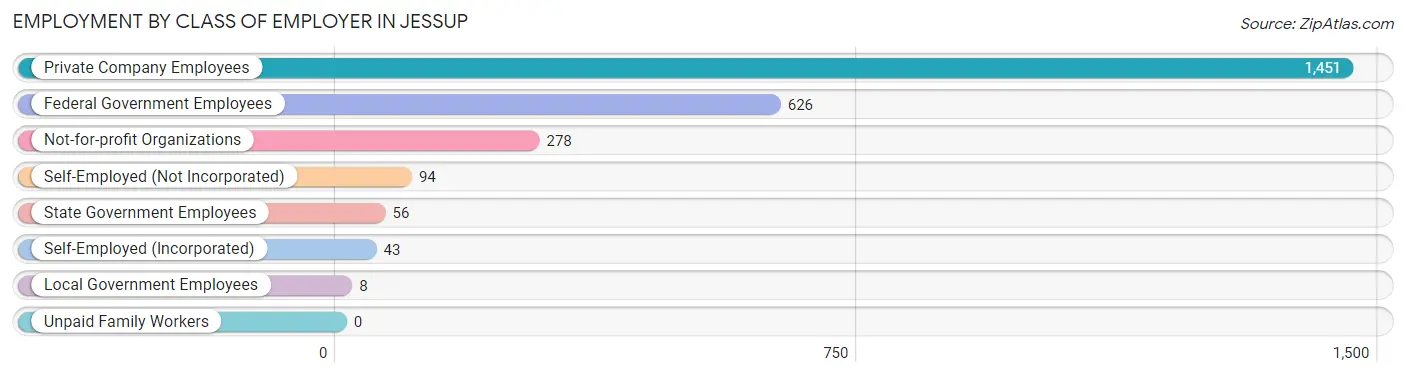
| Employer Class | # Employees | % Employees |
| Private Company Employees | 1,451 | 56.8% |
| Self-Employed (Incorporated) | 43 | 1.7% |
| Self-Employed (Not Incorporated) | 94 | 3.7% |
| Not-for-profit Organizations | 278 | 10.9% |
| Local Government Employees | 8 | 0.3% |
| State Government Employees | 56 | 2.2% |
| Federal Government Employees | 626 | 24.5% |
| Unpaid Family Workers | 0 | 0.0% |
| Total | 2,556 | 100.0% |
Employment Status by Age in Jessup
According to the labor force statistics for Jessup, out of the total population over 16 years of age (8,864), 30.3% or 2,686 individuals are in the labor force, with 4.4% or 118 of them unemployed. The age group with the highest labor force participation rate is 60 to 64 years, with 46.1% or 173 individuals in the labor force. Within the labor force, the 20 to 24 years age range has the highest percentage of unemployed individuals, with 32.5% or 93 of them being unemployed.
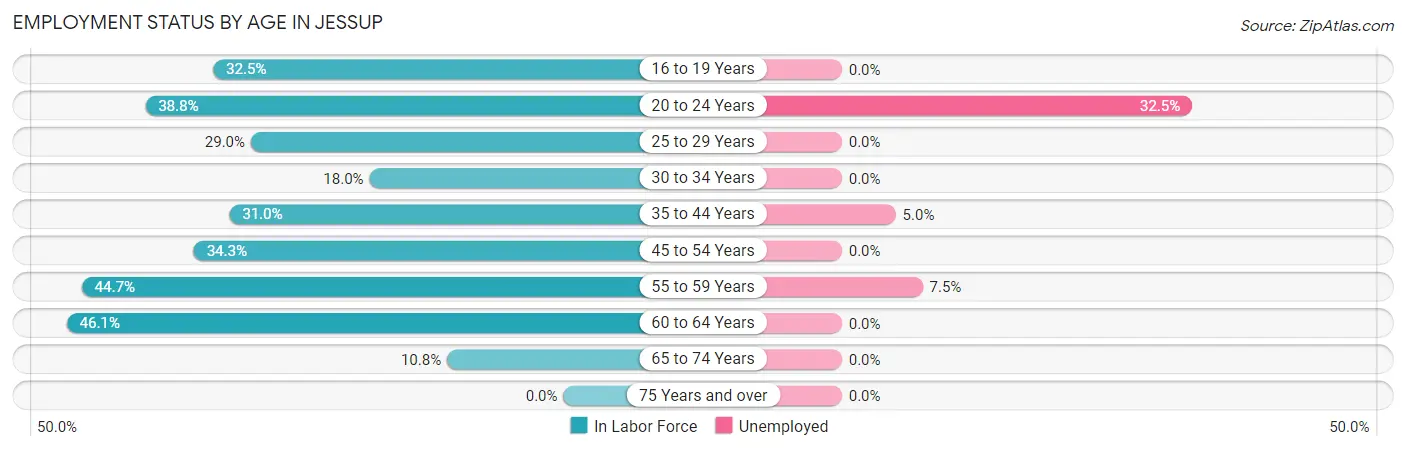
| Age Bracket | In Labor Force | Unemployed |
| 16 to 19 Years | 104 (32.5%) | 0 (0.0%) |
| 20 to 24 Years | 287 (38.8%) | 93 (32.5%) |
| 25 to 29 Years | 396 (29.0%) | 0 (0.0%) |
| 30 to 34 Years | 220 (18.0%) | 0 (0.0%) |
| 35 to 44 Years | 647 (31.0%) | 32 (5.0%) |
| 45 to 54 Years | 511 (34.3%) | 0 (0.0%) |
| 55 to 59 Years | 306 (44.7%) | 23 (7.5%) |
| 60 to 64 Years | 173 (46.1%) | 0 (0.0%) |
| 65 to 74 Years | 44 (10.8%) | 0 (0.0%) |
| 75 Years and over | 0 (0.0%) | 0 (0.0%) |
| Total | 2,686 (30.3%) | 118 (4.4%) |
Employment Status by Educational Attainment in Jessup
According to labor force statistics for Jessup, 31.2% of individuals (2,255) out of the total population between 25 and 64 years of age (7,228) are in the labor force, with 2.5% or 56 of them being unemployed. The group with the highest labor force participation rate are those with the educational attainment of bachelor's degree or higher, with 87.1% or 1,448 individuals in the labor force. Within the labor force, individuals with high school diploma education have the highest percentage of unemployment, with 4.6% or 14 of them being unemployed.
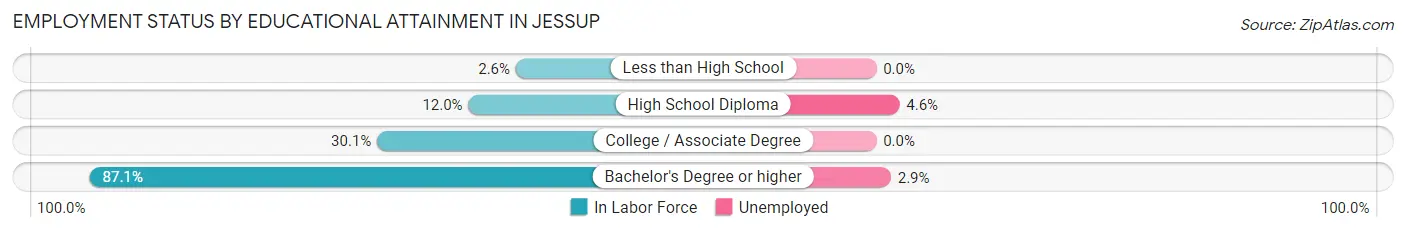
| Educational Attainment | In Labor Force | Unemployed |
| Less than High School | 39 (2.6%) | 0 (0.0%) |
| High School Diploma | 302 (12.0%) | 116 (4.6%) |
| College / Associate Degree | 464 (30.1%) | 0 (0.0%) |
| Bachelor's Degree or higher | 1,448 (87.1%) | 48 (2.9%) |
| Total | 2,255 (31.2%) | 181 (2.5%) |
Employment Occupations by Sex in Jessup
Management, Business, Science and Arts Occupations
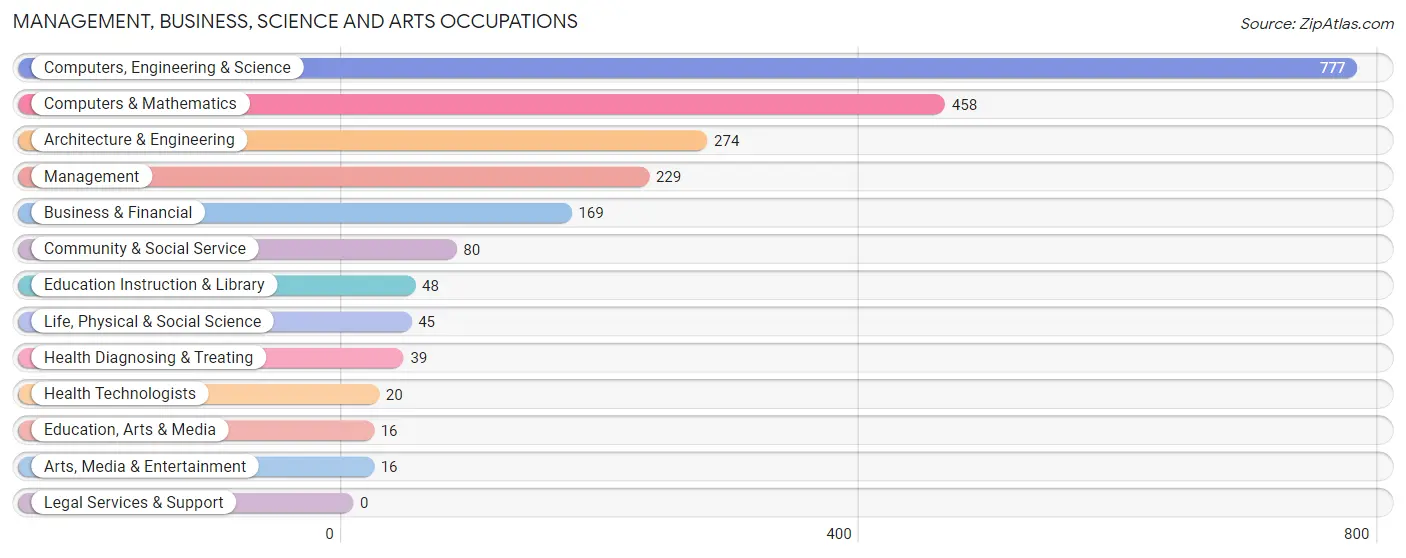
The most common Management, Business, Science and Arts occupations in Jessup are Computers, Engineering & Science (777 | 32.4%), Computers & Mathematics (458 | 19.1%), Architecture & Engineering (274 | 11.4%), Management (229 | 9.6%), and Business & Financial (169 | 7.0%).
Management, Business, Science and Arts Occupations by Sex
Within the Management, Business, Science and Arts occupations in Jessup, the most male-oriented occupations are Computers & Mathematics (100.0%), Life, Physical & Social Science (100.0%), and Computers, Engineering & Science (77.7%), while the most female-oriented occupations are Education, Arts & Media (100.0%), Arts, Media & Entertainment (100.0%), and Health Technologists (100.0%).
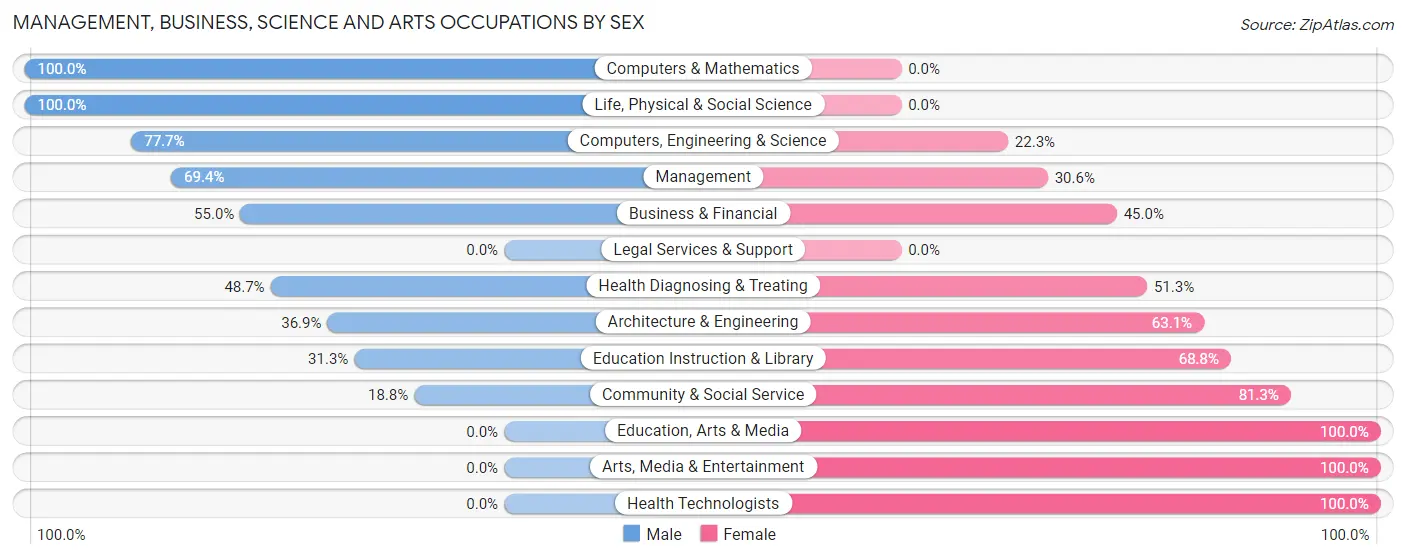
| Occupation | Male | Female |
| Management | 159 (69.4%) | 70 (30.6%) |
| Business & Financial | 93 (55.0%) | 76 (45.0%) |
| Computers, Engineering & Science | 604 (77.7%) | 173 (22.3%) |
| Computers & Mathematics | 458 (100.0%) | 0 (0.0%) |
| Architecture & Engineering | 101 (36.9%) | 173 (63.1%) |
| Life, Physical & Social Science | 45 (100.0%) | 0 (0.0%) |
| Community & Social Service | 15 (18.8%) | 65 (81.2%) |
| Education, Arts & Media | 0 (0.0%) | 16 (100.0%) |
| Legal Services & Support | 0 (0.0%) | 0 (0.0%) |
| Education Instruction & Library | 15 (31.2%) | 33 (68.8%) |
| Arts, Media & Entertainment | 0 (0.0%) | 16 (100.0%) |
| Health Diagnosing & Treating | 19 (48.7%) | 20 (51.3%) |
| Health Technologists | 0 (0.0%) | 20 (100.0%) |
| Total (Category) | 890 (68.8%) | 404 (31.2%) |
| Total (Overall) | 1,524 (63.6%) | 872 (36.4%) |
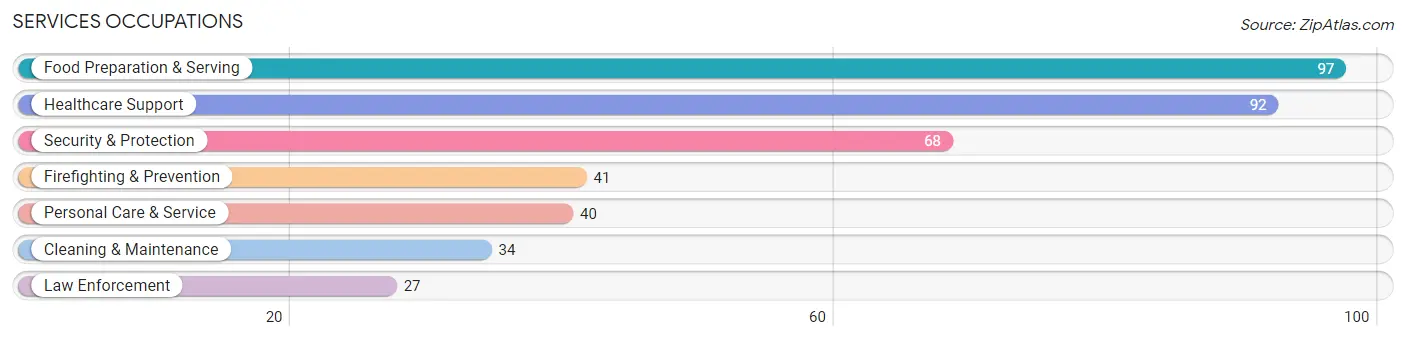
Services Occupations
The most common Services occupations in Jessup are Food Preparation & Serving (97 | 4.1%), Healthcare Support (92 | 3.8%), Security & Protection (68 | 2.8%), Firefighting & Prevention (41 | 1.7%), and Personal Care & Service (40 | 1.7%).
Services Occupations by Sex
Within the Services occupations in Jessup, the most male-oriented occupations are Cleaning & Maintenance (100.0%), Food Preparation & Serving (53.6%), and Personal Care & Service (52.5%), while the most female-oriented occupations are Security & Protection (100.0%), Firefighting & Prevention (100.0%), and Law Enforcement (100.0%).
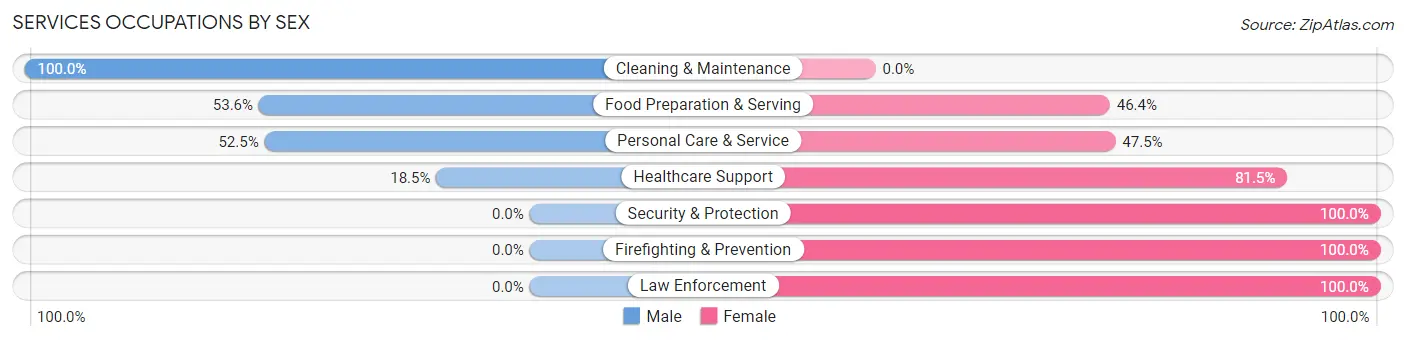
| Occupation | Male | Female |
| Healthcare Support | 17 (18.5%) | 75 (81.5%) |
| Security & Protection | 0 (0.0%) | 68 (100.0%) |
| Firefighting & Prevention | 0 (0.0%) | 41 (100.0%) |
| Law Enforcement | 0 (0.0%) | 27 (100.0%) |
| Food Preparation & Serving | 52 (53.6%) | 45 (46.4%) |
| Cleaning & Maintenance | 34 (100.0%) | 0 (0.0%) |
| Personal Care & Service | 21 (52.5%) | 19 (47.5%) |
| Total (Category) | 124 (37.5%) | 207 (62.5%) |
| Total (Overall) | 1,524 (63.6%) | 872 (36.4%) |
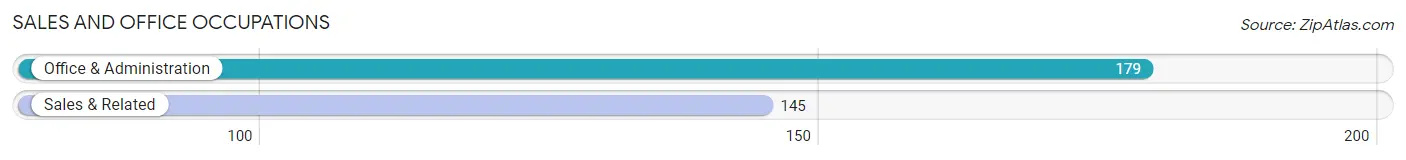
Sales and Office Occupations
The most common Sales and Office occupations in Jessup are Office & Administration (179 | 7.5%), and Sales & Related (145 | 6.0%).
Sales and Office Occupations by Sex
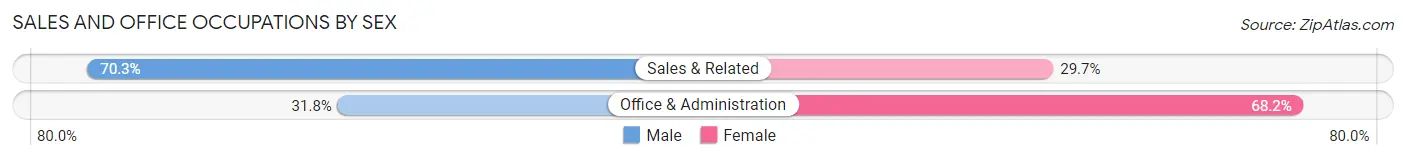
| Occupation | Male | Female |
| Sales & Related | 102 (70.3%) | 43 (29.7%) |
| Office & Administration | 57 (31.8%) | 122 (68.2%) |
| Total (Category) | 159 (49.1%) | 165 (50.9%) |
| Total (Overall) | 1,524 (63.6%) | 872 (36.4%) |
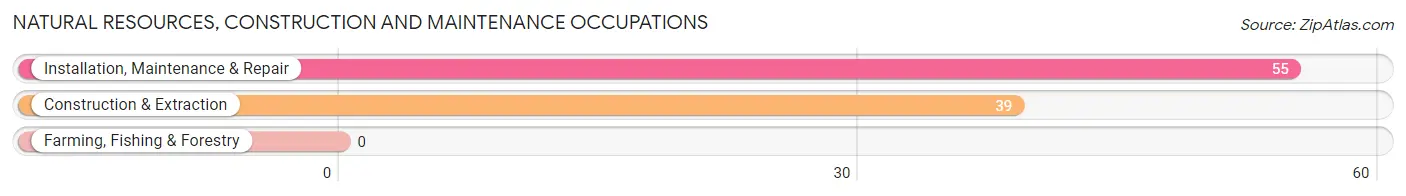
Natural Resources, Construction and Maintenance Occupations
The most common Natural Resources, Construction and Maintenance occupations in Jessup are Installation, Maintenance & Repair (55 | 2.3%), and Construction & Extraction (39 | 1.6%).
Natural Resources, Construction and Maintenance Occupations by Sex
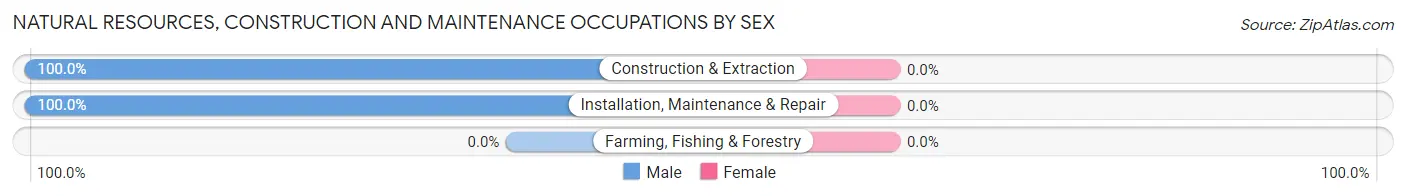
| Occupation | Male | Female |
| Farming, Fishing & Forestry | 0 (0.0%) | 0 (0.0%) |
| Construction & Extraction | 39 (100.0%) | 0 (0.0%) |
| Installation, Maintenance & Repair | 55 (100.0%) | 0 (0.0%) |
| Total (Category) | 94 (100.0%) | 0 (0.0%) |
| Total (Overall) | 1,524 (63.6%) | 872 (36.4%) |
Production, Transportation and Moving Occupations
The most common Production, Transportation and Moving occupations in Jessup are Production (148 | 6.2%), Transportation (148 | 6.2%), and Material Moving (57 | 2.4%).
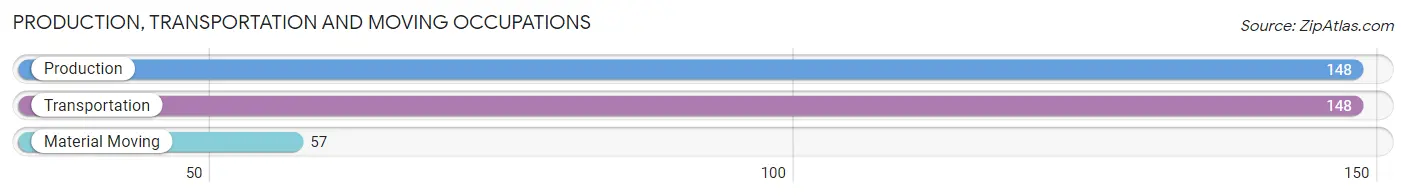
Production, Transportation and Moving Occupations by Sex
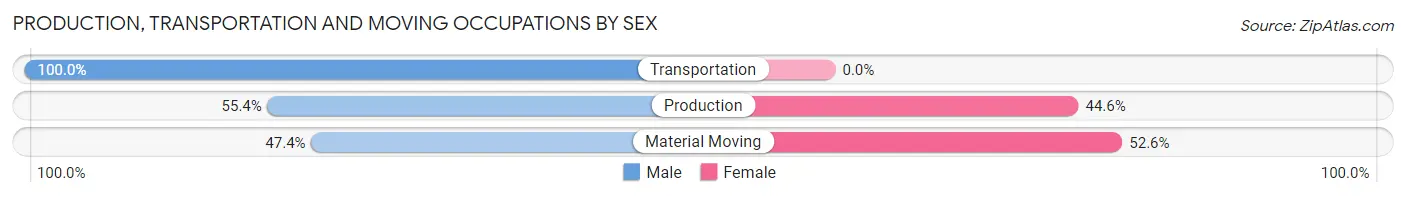
| Occupation | Male | Female |
| Production | 82 (55.4%) | 66 (44.6%) |
| Transportation | 148 (100.0%) | 0 (0.0%) |
| Material Moving | 27 (47.4%) | 30 (52.6%) |
| Total (Category) | 257 (72.8%) | 96 (27.2%) |
| Total (Overall) | 1,524 (63.6%) | 872 (36.4%) |
Employment Industries by Sex in Jessup
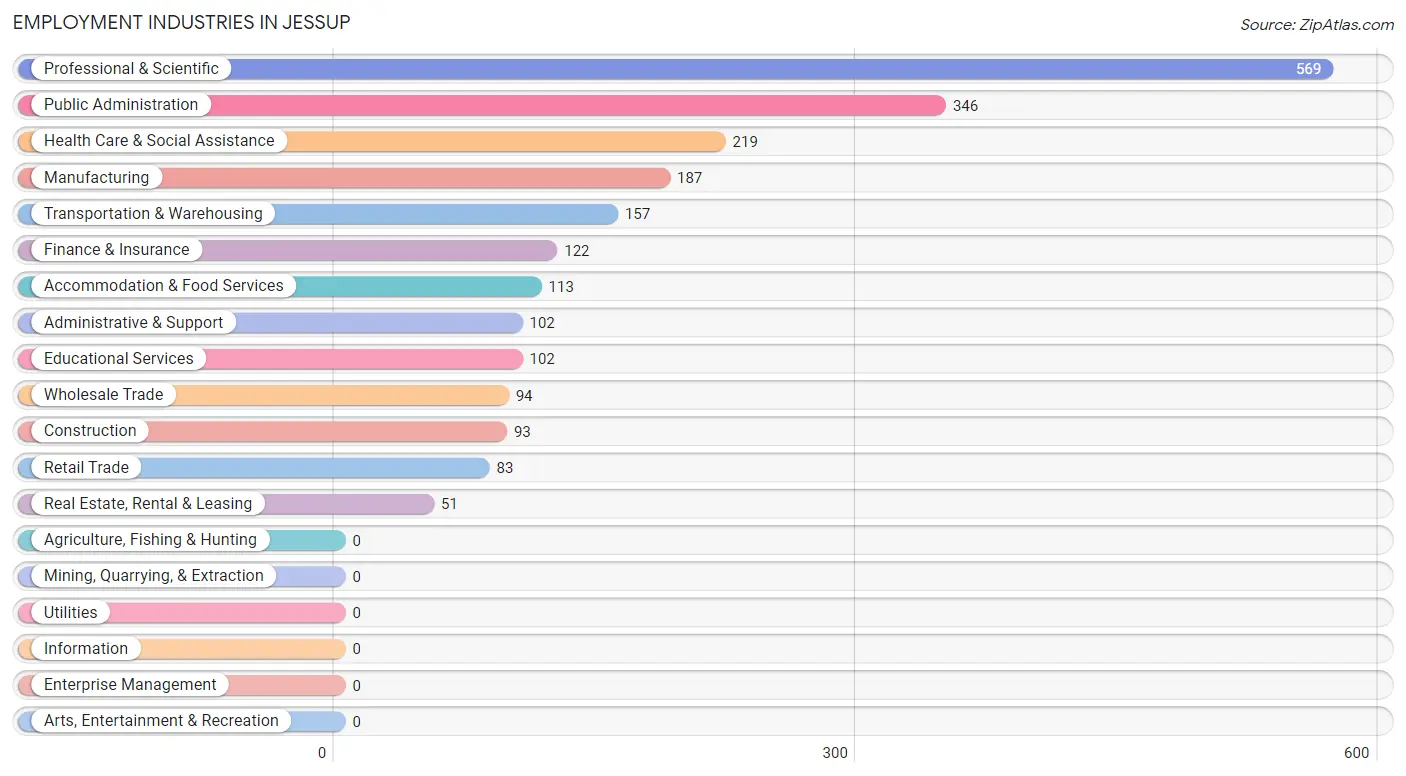
Employment Industries in Jessup
The major employment industries in Jessup include Professional & Scientific (569 | 23.7%), Public Administration (346 | 14.4%), Health Care & Social Assistance (219 | 9.1%), Manufacturing (187 | 7.8%), and Transportation & Warehousing (157 | 6.6%).
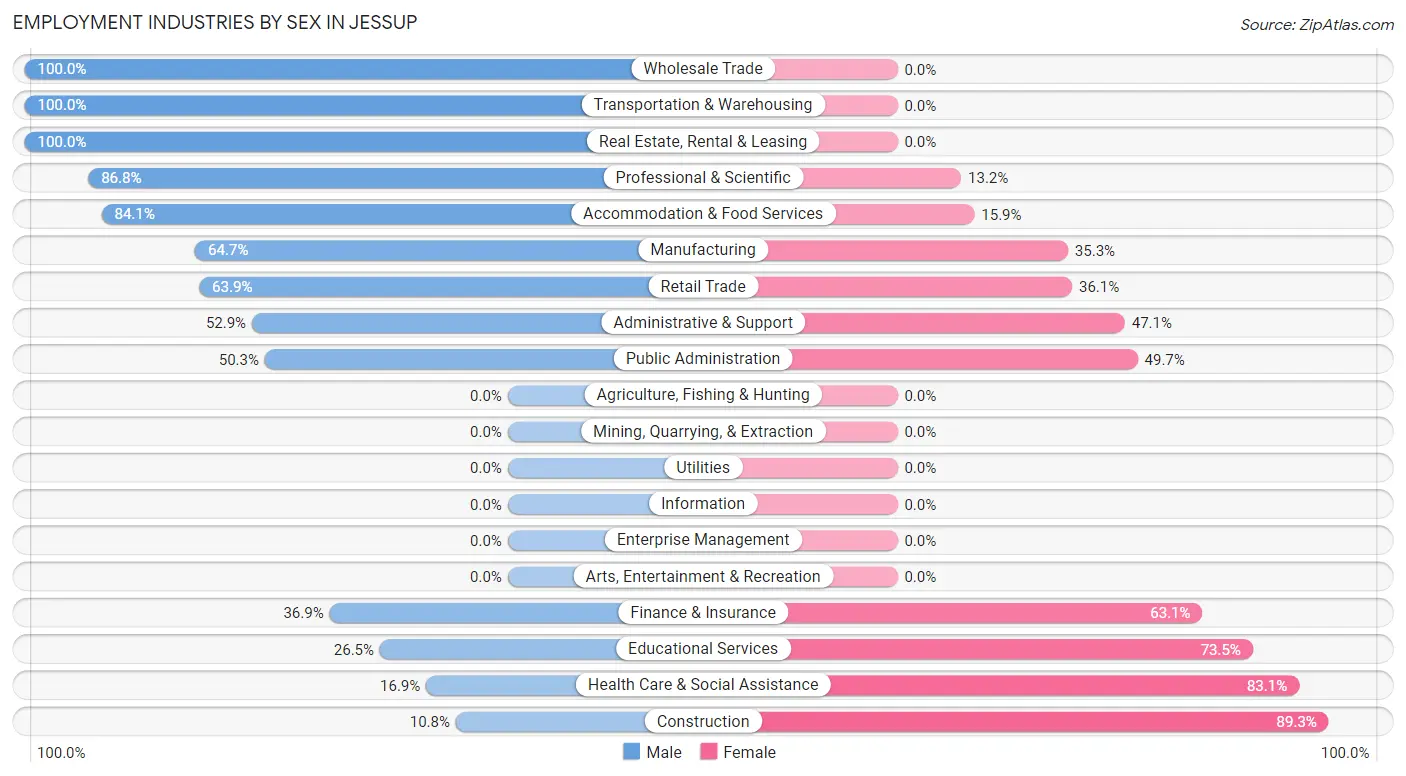
Employment Industries by Sex in Jessup
The Jessup industries that see more men than women are Wholesale Trade (100.0%), Transportation & Warehousing (100.0%), and Real Estate, Rental & Leasing (100.0%), whereas the industries that tend to have a higher number of women are Construction (89.2%), Health Care & Social Assistance (83.1%), and Educational Services (73.5%).
| Industry | Male | Female |
| Agriculture, Fishing & Hunting | 0 (0.0%) | 0 (0.0%) |
| Mining, Quarrying, & Extraction | 0 (0.0%) | 0 (0.0%) |
| Construction | 10 (10.7%) | 83 (89.2%) |
| Manufacturing | 121 (64.7%) | 66 (35.3%) |
| Wholesale Trade | 94 (100.0%) | 0 (0.0%) |
| Retail Trade | 53 (63.9%) | 30 (36.1%) |
| Transportation & Warehousing | 157 (100.0%) | 0 (0.0%) |
| Utilities | 0 (0.0%) | 0 (0.0%) |
| Information | 0 (0.0%) | 0 (0.0%) |
| Finance & Insurance | 45 (36.9%) | 77 (63.1%) |
| Real Estate, Rental & Leasing | 51 (100.0%) | 0 (0.0%) |
| Professional & Scientific | 494 (86.8%) | 75 (13.2%) |
| Enterprise Management | 0 (0.0%) | 0 (0.0%) |
| Administrative & Support | 54 (52.9%) | 48 (47.1%) |
| Educational Services | 27 (26.5%) | 75 (73.5%) |
| Health Care & Social Assistance | 37 (16.9%) | 182 (83.1%) |
| Arts, Entertainment & Recreation | 0 (0.0%) | 0 (0.0%) |
| Accommodation & Food Services | 95 (84.1%) | 18 (15.9%) |
| Public Administration | 174 (50.3%) | 172 (49.7%) |
| Total | 1,524 (63.6%) | 872 (36.4%) |
Education in Jessup
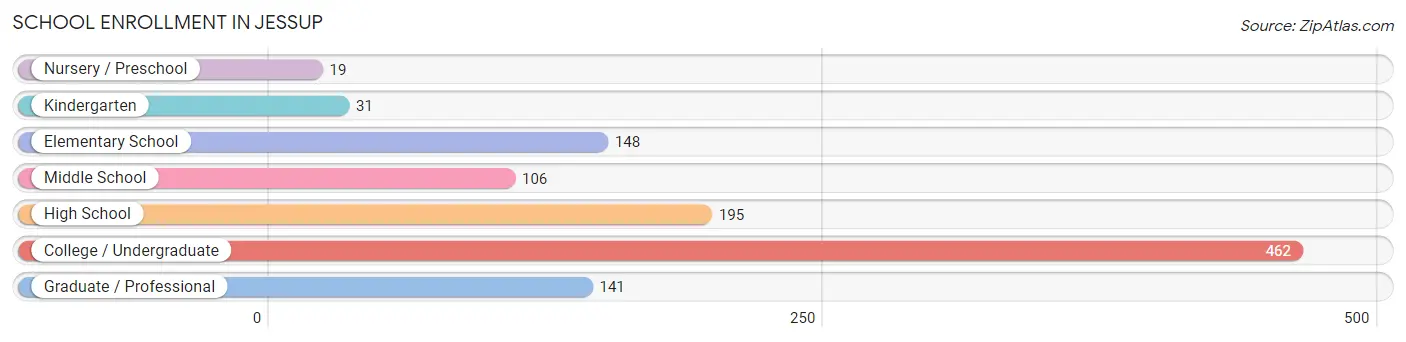
School Enrollment in Jessup
The most common levels of schooling among the 1,102 students in Jessup are college / undergraduate (462 | 41.9%), high school (195 | 17.7%), and elementary school (148 | 13.4%).
| School Level | # Students | % Students |
| Nursery / Preschool | 19 | 1.7% |
| Kindergarten | 31 | 2.8% |
| Elementary School | 148 | 13.4% |
| Middle School | 106 | 9.6% |
| High School | 195 | 17.7% |
| College / Undergraduate | 462 | 41.9% |
| Graduate / Professional | 141 | 12.8% |
| Total | 1,102 | 100.0% |
School Enrollment by Age by Funding Source in Jessup
Out of a total of 1,102 students who are enrolled in schools in Jessup, 91 (8.3%) attend a private institution, while the remaining 1,011 (91.7%) are enrolled in public schools. The age group of 35 years and over has the highest likelihood of being enrolled in private schools, with 38 (24.8% in the age bracket) enrolled. Conversely, the age group of 3 to 4 year olds has the lowest likelihood of being enrolled in a private school, with 19 (100.0% in the age bracket) attending a public institution.
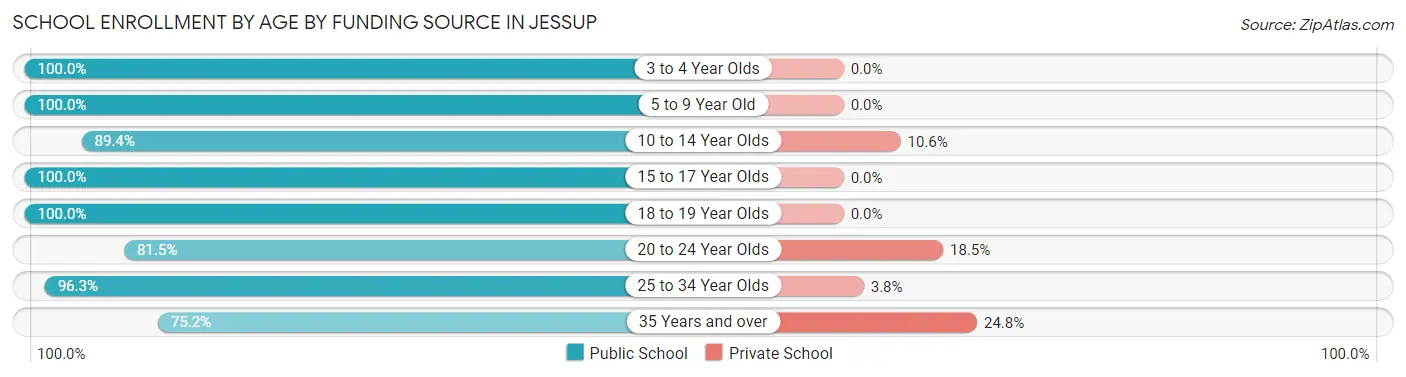
| Age Bracket | Public School | Private School |
| 3 to 4 Year Olds | 19 (100.0%) | 0 (0.0%) |
| 5 to 9 Year Old | 179 (100.0%) | 0 (0.0%) |
| 10 to 14 Year Olds | 118 (89.4%) | 14 (10.6%) |
| 15 to 17 Year Olds | 101 (100.0%) | 0 (0.0%) |
| 18 to 19 Year Olds | 89 (100.0%) | 0 (0.0%) |
| 20 to 24 Year Olds | 132 (81.5%) | 30 (18.5%) |
| 25 to 34 Year Olds | 257 (96.3%) | 10 (3.7%) |
| 35 Years and over | 115 (75.2%) | 38 (24.8%) |
| Total | 1,011 (91.7%) | 91 (8.3%) |
Educational Attainment by Field of Study in Jessup
Computers & mathematics (402 | 21.5%), business (219 | 11.7%), engineering (160 | 8.6%), arts & humanities (157 | 8.4%), and bio, nature & agricultural (142 | 7.6%) are the most common fields of study among 1,870 individuals in Jessup who have obtained a bachelor's degree or higher.
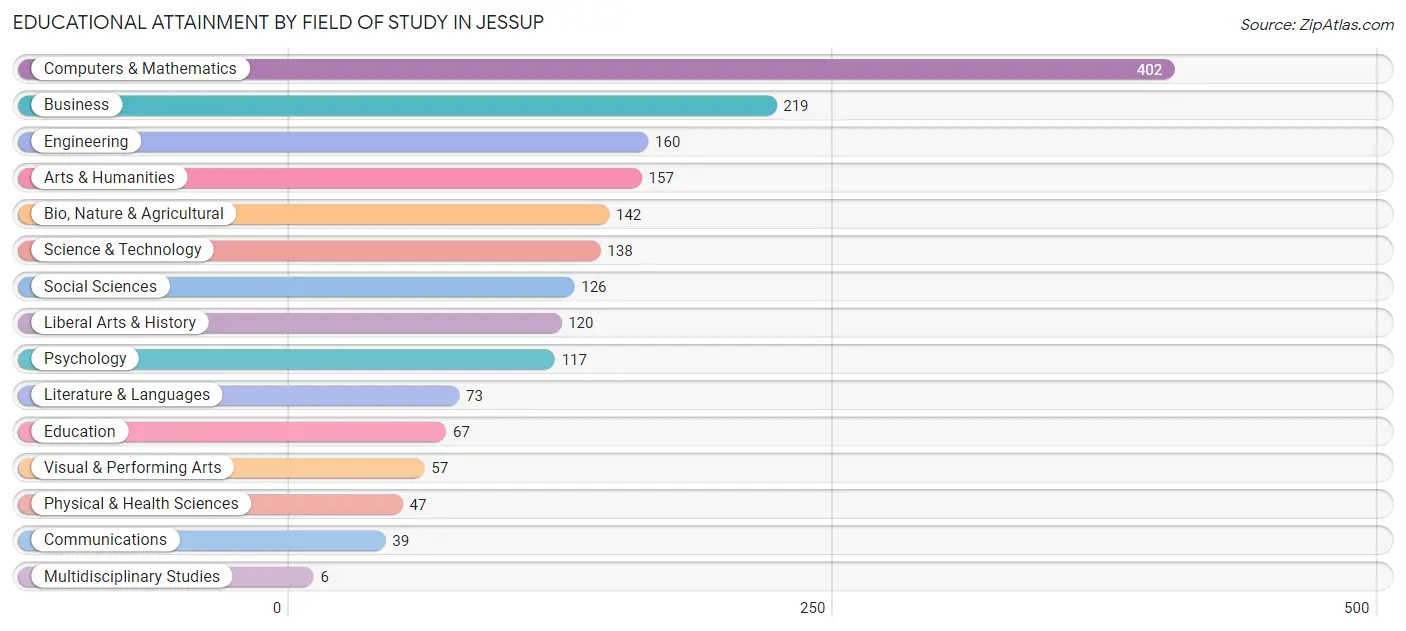
| Field of Study | # Graduates | % Graduates |
| Computers & Mathematics | 402 | 21.5% |
| Bio, Nature & Agricultural | 142 | 7.6% |
| Physical & Health Sciences | 47 | 2.5% |
| Psychology | 117 | 6.3% |
| Social Sciences | 126 | 6.7% |
| Engineering | 160 | 8.6% |
| Multidisciplinary Studies | 6 | 0.3% |
| Science & Technology | 138 | 7.4% |
| Business | 219 | 11.7% |
| Education | 67 | 3.6% |
| Literature & Languages | 73 | 3.9% |
| Liberal Arts & History | 120 | 6.4% |
| Visual & Performing Arts | 57 | 3.0% |
| Communications | 39 | 2.1% |
| Arts & Humanities | 157 | 8.4% |
| Total | 1,870 | 100.0% |
Transportation & Commute in Jessup
Vehicle Availability by Sex in Jessup
The most prevalent vehicle ownership categories in Jessup are males with 2 vehicles (777, accounting for 46.1%) and females with 2 vehicles (434, making up 89.1%).
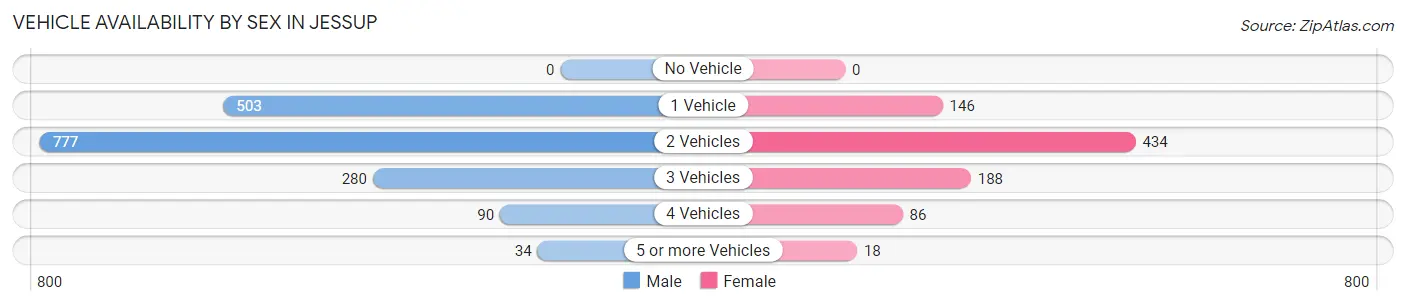
| Vehicles Available | Male | Female |
| No Vehicle | 0 (0.0%) | 0 (0.0%) |
| 1 Vehicle | 503 (29.9%) | 146 (16.7%) |
| 2 Vehicles | 777 (46.1%) | 434 (49.8%) |
| 3 Vehicles | 280 (16.6%) | 188 (21.6%) |
| 4 Vehicles | 90 (5.3%) | 86 (9.9%) |
| 5 or more Vehicles | 34 (2.0%) | 18 (2.1%) |
| Total | 1,684 (100.0%) | 872 (100.0%) |
Commute Time in Jessup
The most frequently occuring commute durations in Jessup are 15 to 19 minutes (538 commuters, 22.4%), 10 to 14 minutes (462 commuters, 19.2%), and 20 to 24 minutes (312 commuters, 13.0%).
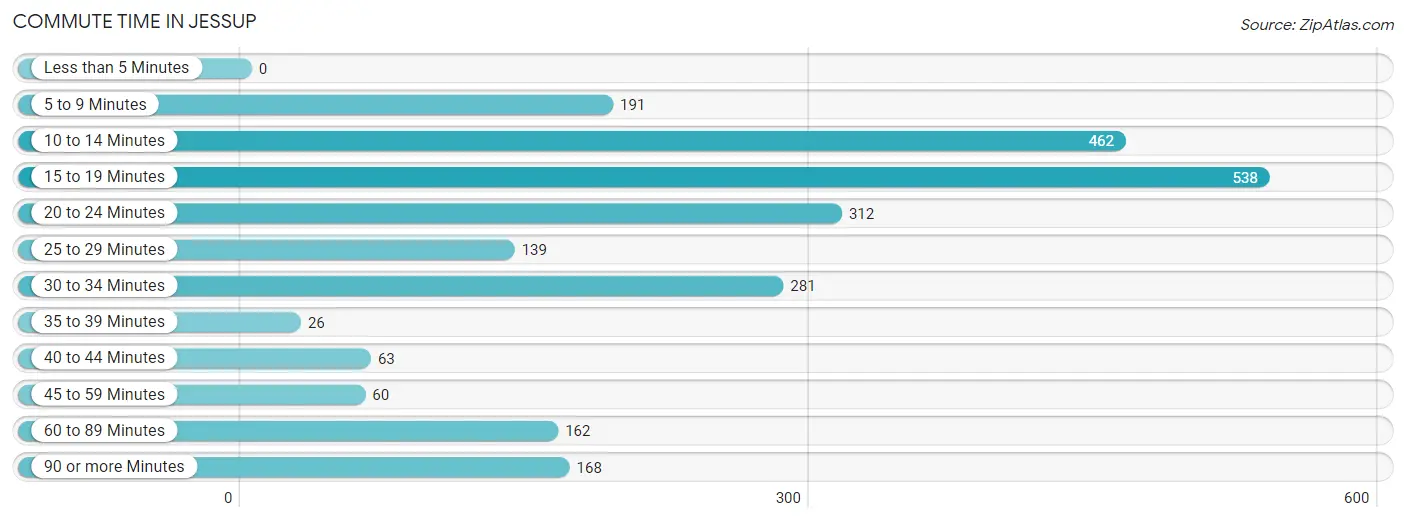
| Commute Time | # Commuters | % Commuters |
| Less than 5 Minutes | 0 | 0.0% |
| 5 to 9 Minutes | 191 | 8.0% |
| 10 to 14 Minutes | 462 | 19.2% |
| 15 to 19 Minutes | 538 | 22.4% |
| 20 to 24 Minutes | 312 | 13.0% |
| 25 to 29 Minutes | 139 | 5.8% |
| 30 to 34 Minutes | 281 | 11.7% |
| 35 to 39 Minutes | 26 | 1.1% |
| 40 to 44 Minutes | 63 | 2.6% |
| 45 to 59 Minutes | 60 | 2.5% |
| 60 to 89 Minutes | 162 | 6.7% |
| 90 or more Minutes | 168 | 7.0% |
Commute Time by Sex in Jessup
The most common commute times in Jessup are 10 to 14 minutes (383 commuters, 23.5%) for males and 30 to 34 minutes (190 commuters, 24.5%) for females.
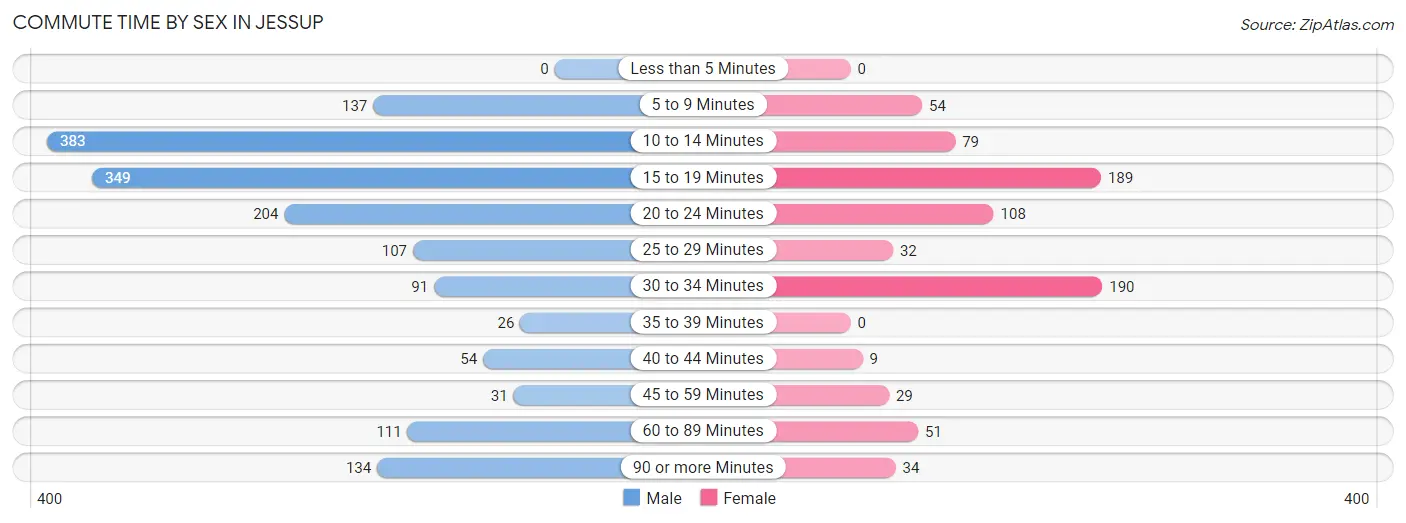
| Commute Time | Male | Female |
| Less than 5 Minutes | 0 (0.0%) | 0 (0.0%) |
| 5 to 9 Minutes | 137 (8.4%) | 54 (7.0%) |
| 10 to 14 Minutes | 383 (23.5%) | 79 (10.2%) |
| 15 to 19 Minutes | 349 (21.4%) | 189 (24.4%) |
| 20 to 24 Minutes | 204 (12.5%) | 108 (13.9%) |
| 25 to 29 Minutes | 107 (6.6%) | 32 (4.1%) |
| 30 to 34 Minutes | 91 (5.6%) | 190 (24.5%) |
| 35 to 39 Minutes | 26 (1.6%) | 0 (0.0%) |
| 40 to 44 Minutes | 54 (3.3%) | 9 (1.2%) |
| 45 to 59 Minutes | 31 (1.9%) | 29 (3.7%) |
| 60 to 89 Minutes | 111 (6.8%) | 51 (6.6%) |
| 90 or more Minutes | 134 (8.2%) | 34 (4.4%) |
Time of Departure to Work by Sex in Jessup
The most frequent times of departure to work in Jessup are 7:00 AM to 7:29 AM (286, 17.6%) for males and 7:30 AM to 7:59 AM (136, 17.5%) for females.
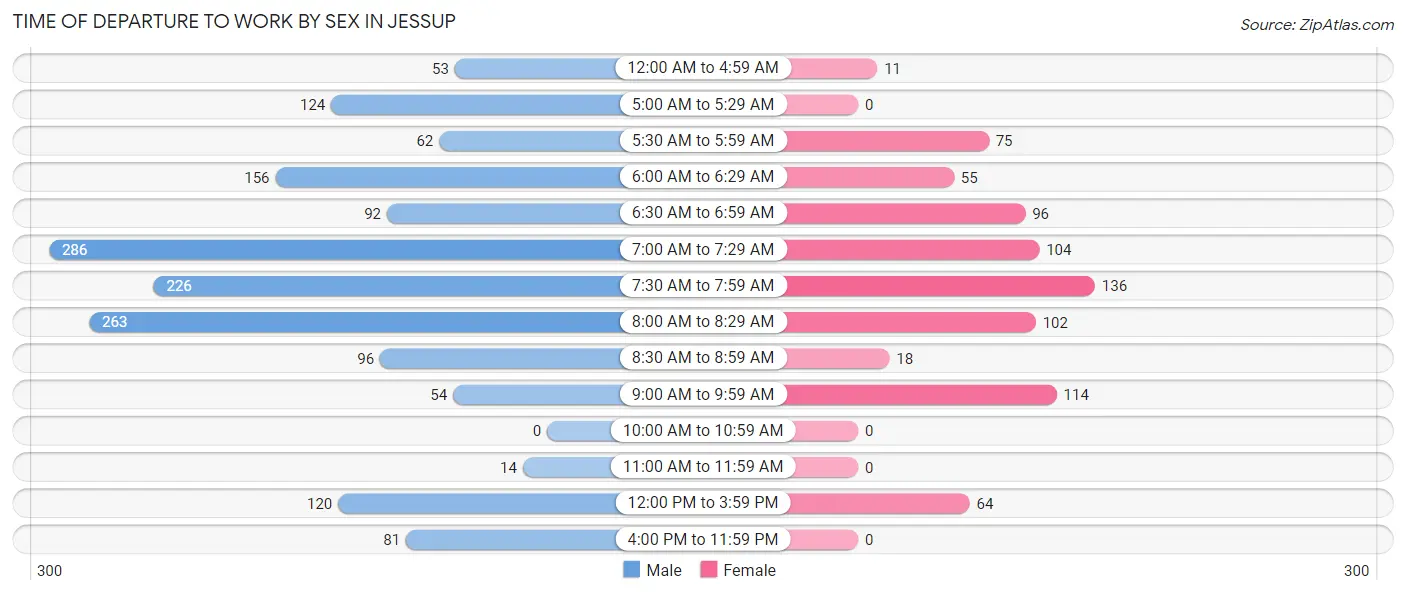
| Time of Departure | Male | Female |
| 12:00 AM to 4:59 AM | 53 (3.3%) | 11 (1.4%) |
| 5:00 AM to 5:29 AM | 124 (7.6%) | 0 (0.0%) |
| 5:30 AM to 5:59 AM | 62 (3.8%) | 75 (9.7%) |
| 6:00 AM to 6:29 AM | 156 (9.6%) | 55 (7.1%) |
| 6:30 AM to 6:59 AM | 92 (5.7%) | 96 (12.4%) |
| 7:00 AM to 7:29 AM | 286 (17.6%) | 104 (13.4%) |
| 7:30 AM to 7:59 AM | 226 (13.9%) | 136 (17.5%) |
| 8:00 AM to 8:29 AM | 263 (16.2%) | 102 (13.2%) |
| 8:30 AM to 8:59 AM | 96 (5.9%) | 18 (2.3%) |
| 9:00 AM to 9:59 AM | 54 (3.3%) | 114 (14.7%) |
| 10:00 AM to 10:59 AM | 0 (0.0%) | 0 (0.0%) |
| 11:00 AM to 11:59 AM | 14 (0.9%) | 0 (0.0%) |
| 12:00 PM to 3:59 PM | 120 (7.4%) | 64 (8.3%) |
| 4:00 PM to 11:59 PM | 81 (5.0%) | 0 (0.0%) |
| Total | 1,627 (100.0%) | 775 (100.0%) |
Housing Occupancy in Jessup
Occupancy by Ownership in Jessup
Of the total 1,735 dwellings in Jessup, owner-occupied units account for 912 (52.6%), while renter-occupied units make up 823 (47.4%).
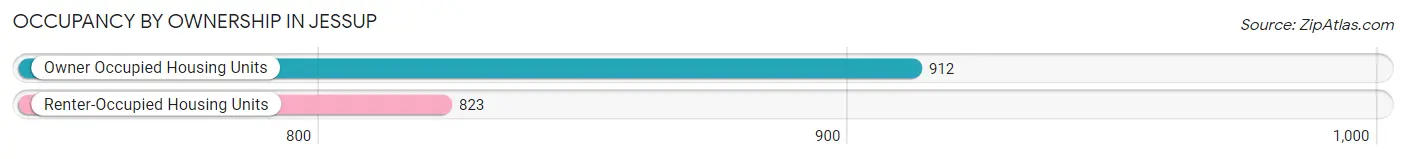
| Occupancy | # Housing Units | % Housing Units |
| Owner Occupied Housing Units | 912 | 52.6% |
| Renter-Occupied Housing Units | 823 | 47.4% |
| Total Occupied Housing Units | 1,735 | 100.0% |
Occupancy by Household Size in Jessup
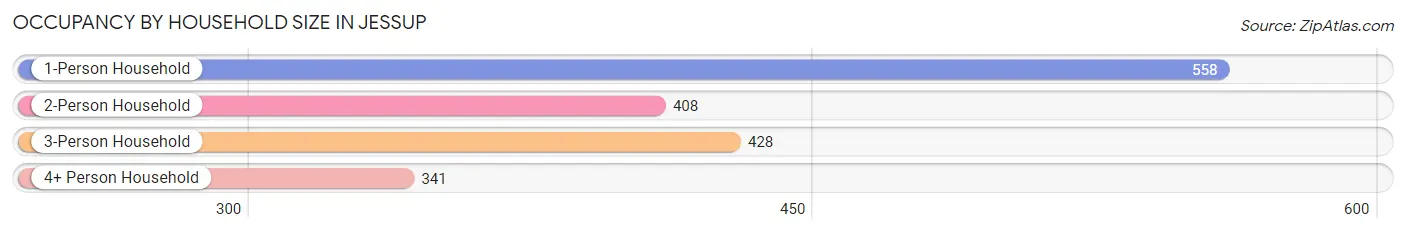
| Household Size | # Housing Units | % Housing Units |
| 1-Person Household | 558 | 32.2% |
| 2-Person Household | 408 | 23.5% |
| 3-Person Household | 428 | 24.7% |
| 4+ Person Household | 341 | 19.7% |
| Total Housing Units | 1,735 | 100.0% |
Occupancy by Ownership by Household Size in Jessup
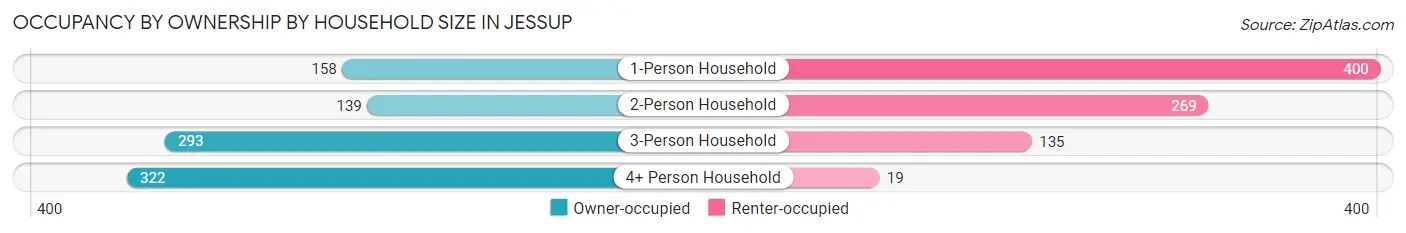
| Household Size | Owner-occupied | Renter-occupied |
| 1-Person Household | 158 (28.3%) | 400 (71.7%) |
| 2-Person Household | 139 (34.1%) | 269 (65.9%) |
| 3-Person Household | 293 (68.5%) | 135 (31.5%) |
| 4+ Person Household | 322 (94.4%) | 19 (5.6%) |
| Total Housing Units | 912 (52.6%) | 823 (47.4%) |
Occupancy by Educational Attainment in Jessup
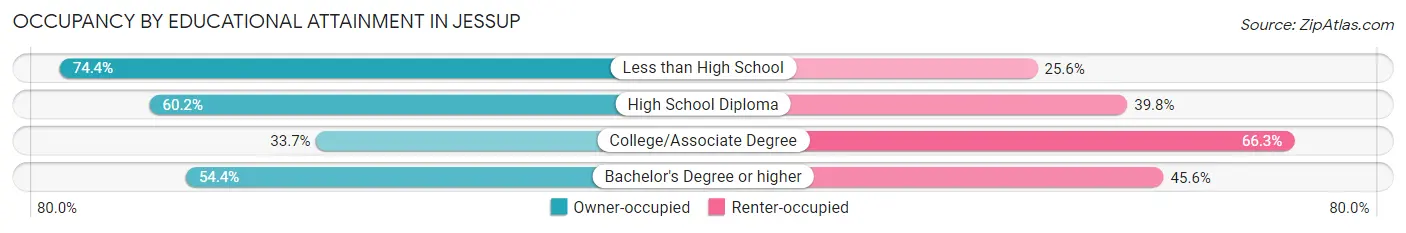
| Household Size | Owner-occupied | Renter-occupied |
| Less than High School | 93 (74.4%) | 32 (25.6%) |
| High School Diploma | 142 (60.2%) | 94 (39.8%) |
| College/Associate Degree | 115 (33.7%) | 226 (66.3%) |
| Bachelor's Degree or higher | 562 (54.4%) | 471 (45.6%) |
Occupancy by Age of Householder in Jessup
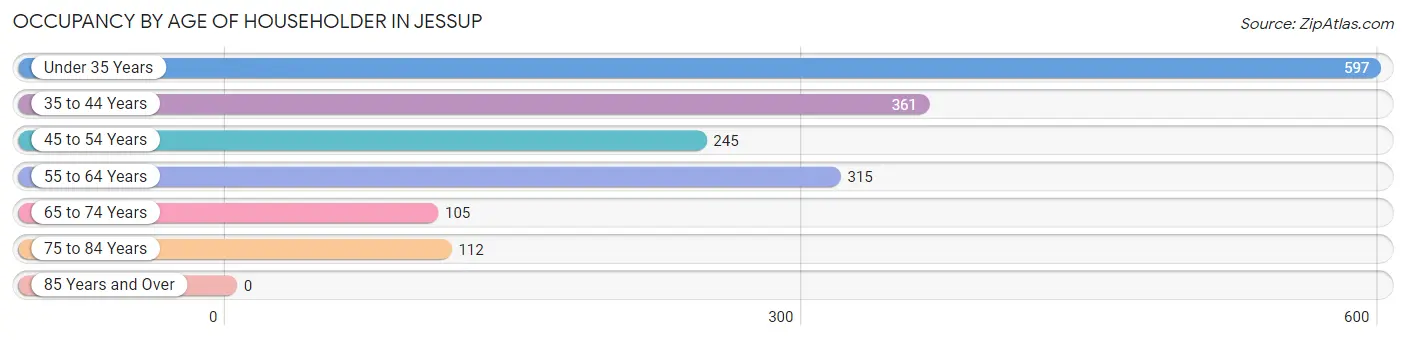
| Age Bracket | # Households | % Households |
| Under 35 Years | 597 | 34.4% |
| 35 to 44 Years | 361 | 20.8% |
| 45 to 54 Years | 245 | 14.1% |
| 55 to 64 Years | 315 | 18.2% |
| 65 to 74 Years | 105 | 6.0% |
| 75 to 84 Years | 112 | 6.5% |
| 85 Years and Over | 0 | 0.0% |
| Total | 1,735 | 100.0% |
Housing Finances in Jessup
Median Income by Occupancy in Jessup
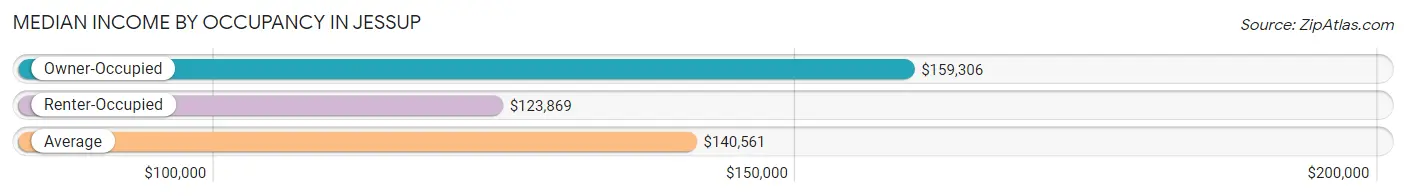
| Occupancy Type | # Households | Median Income |
| Owner-Occupied | 912 (52.6%) | $159,306 |
| Renter-Occupied | 823 (47.4%) | $123,869 |
| Average | 1,735 (100.0%) | $140,561 |
Occupancy by Householder Income Bracket in Jessup
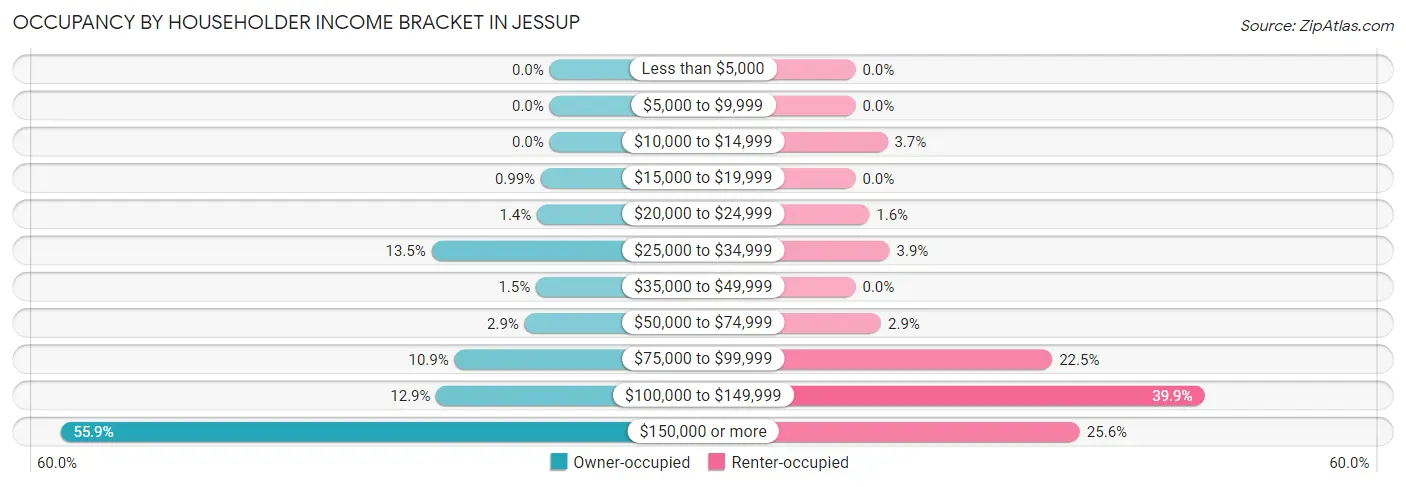
| Income Bracket | Owner-occupied | Renter-occupied |
| Less than $5,000 | 0 (0.0%) | 0 (0.0%) |
| $5,000 to $9,999 | 0 (0.0%) | 0 (0.0%) |
| $10,000 to $14,999 | 0 (0.0%) | 30 (3.6%) |
| $15,000 to $19,999 | 9 (1.0%) | 0 (0.0%) |
| $20,000 to $24,999 | 13 (1.4%) | 13 (1.6%) |
| $25,000 to $34,999 | 123 (13.5%) | 32 (3.9%) |
| $35,000 to $49,999 | 14 (1.5%) | 0 (0.0%) |
| $50,000 to $74,999 | 26 (2.9%) | 24 (2.9%) |
| $75,000 to $99,999 | 99 (10.9%) | 185 (22.5%) |
| $100,000 to $149,999 | 118 (12.9%) | 328 (39.9%) |
| $150,000 or more | 510 (55.9%) | 211 (25.6%) |
| Total | 912 (100.0%) | 823 (100.0%) |
Monthly Housing Cost Tiers in Jessup
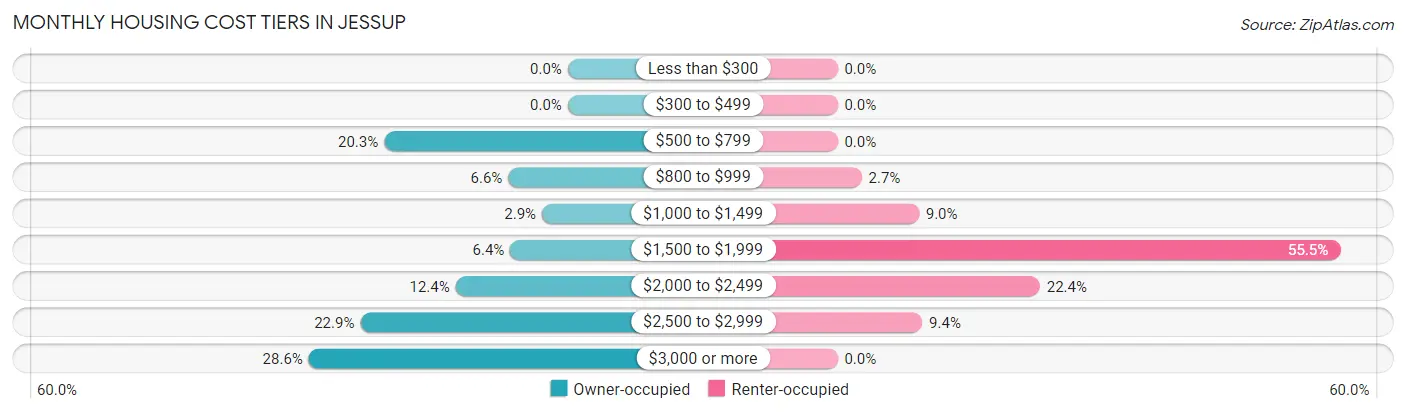
| Monthly Cost | Owner-occupied | Renter-occupied |
| Less than $300 | 0 (0.0%) | 0 (0.0%) |
| $300 to $499 | 0 (0.0%) | 0 (0.0%) |
| $500 to $799 | 185 (20.3%) | 0 (0.0%) |
| $800 to $999 | 60 (6.6%) | 22 (2.7%) |
| $1,000 to $1,499 | 26 (2.9%) | 74 (9.0%) |
| $1,500 to $1,999 | 58 (6.4%) | 457 (55.5%) |
| $2,000 to $2,499 | 113 (12.4%) | 184 (22.4%) |
| $2,500 to $2,999 | 209 (22.9%) | 77 (9.4%) |
| $3,000 or more | 261 (28.6%) | 0 (0.0%) |
| Total | 912 (100.0%) | 823 (100.0%) |
Physical Housing Characteristics in Jessup
Housing Structures in Jessup
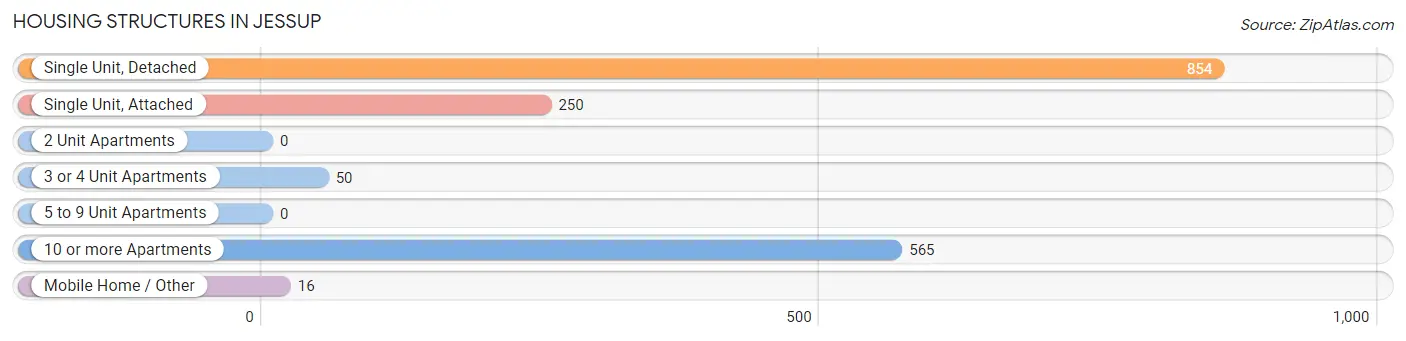
| Structure Type | # Housing Units | % Housing Units |
| Single Unit, Detached | 854 | 49.2% |
| Single Unit, Attached | 250 | 14.4% |
| 2 Unit Apartments | 0 | 0.0% |
| 3 or 4 Unit Apartments | 50 | 2.9% |
| 5 to 9 Unit Apartments | 0 | 0.0% |
| 10 or more Apartments | 565 | 32.6% |
| Mobile Home / Other | 16 | 0.9% |
| Total | 1,735 | 100.0% |
Housing Structures by Occupancy in Jessup
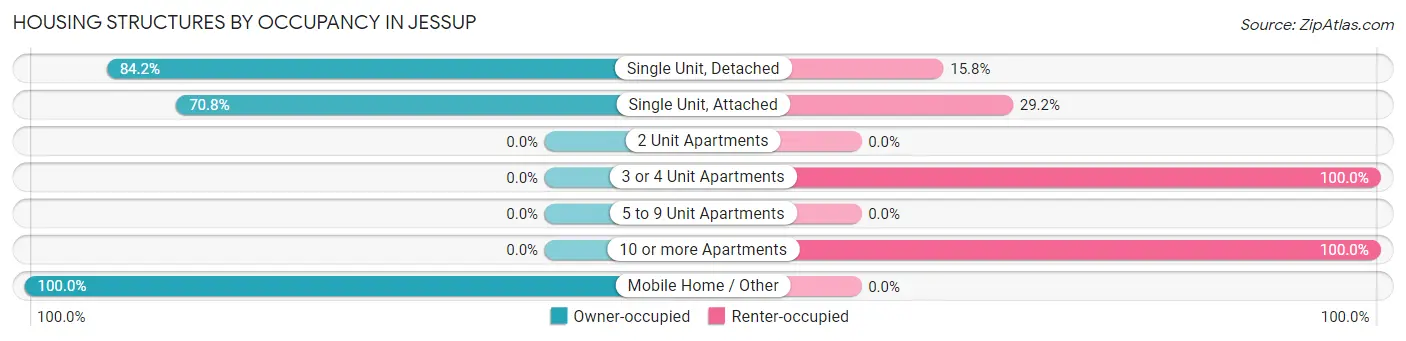
| Structure Type | Owner-occupied | Renter-occupied |
| Single Unit, Detached | 719 (84.2%) | 135 (15.8%) |
| Single Unit, Attached | 177 (70.8%) | 73 (29.2%) |
| 2 Unit Apartments | 0 (0.0%) | 0 (0.0%) |
| 3 or 4 Unit Apartments | 0 (0.0%) | 50 (100.0%) |
| 5 to 9 Unit Apartments | 0 (0.0%) | 0 (0.0%) |
| 10 or more Apartments | 0 (0.0%) | 565 (100.0%) |
| Mobile Home / Other | 16 (100.0%) | 0 (0.0%) |
| Total | 912 (52.6%) | 823 (47.4%) |
Housing Structures by Number of Rooms in Jessup
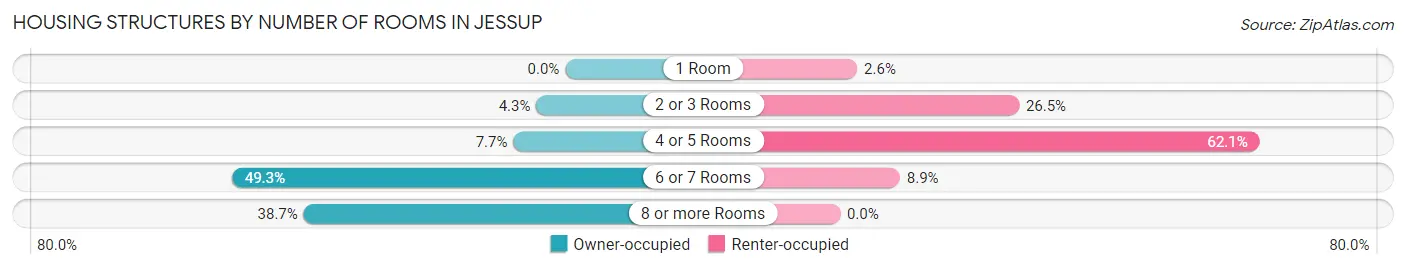
| Number of Rooms | Owner-occupied | Renter-occupied |
| 1 Room | 0 (0.0%) | 21 (2.5%) |
| 2 or 3 Rooms | 39 (4.3%) | 218 (26.5%) |
| 4 or 5 Rooms | 70 (7.7%) | 511 (62.1%) |
| 6 or 7 Rooms | 450 (49.3%) | 73 (8.9%) |
| 8 or more Rooms | 353 (38.7%) | 0 (0.0%) |
| Total | 912 (100.0%) | 823 (100.0%) |
Housing Structure by Heating Type in Jessup
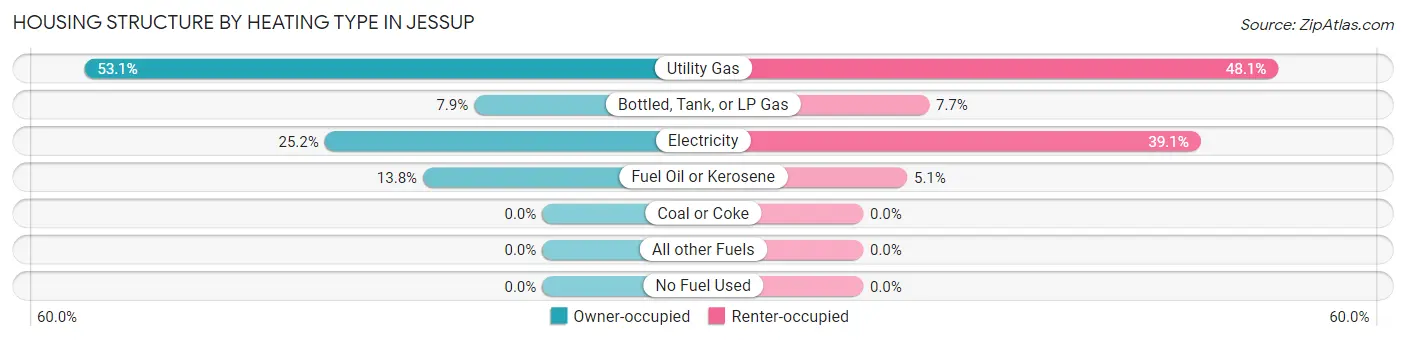
| Heating Type | Owner-occupied | Renter-occupied |
| Utility Gas | 484 (53.1%) | 396 (48.1%) |
| Bottled, Tank, or LP Gas | 72 (7.9%) | 63 (7.6%) |
| Electricity | 230 (25.2%) | 322 (39.1%) |
| Fuel Oil or Kerosene | 126 (13.8%) | 42 (5.1%) |
| Coal or Coke | 0 (0.0%) | 0 (0.0%) |
| All other Fuels | 0 (0.0%) | 0 (0.0%) |
| No Fuel Used | 0 (0.0%) | 0 (0.0%) |
| Total | 912 (100.0%) | 823 (100.0%) |
Household Vehicle Usage in Jessup
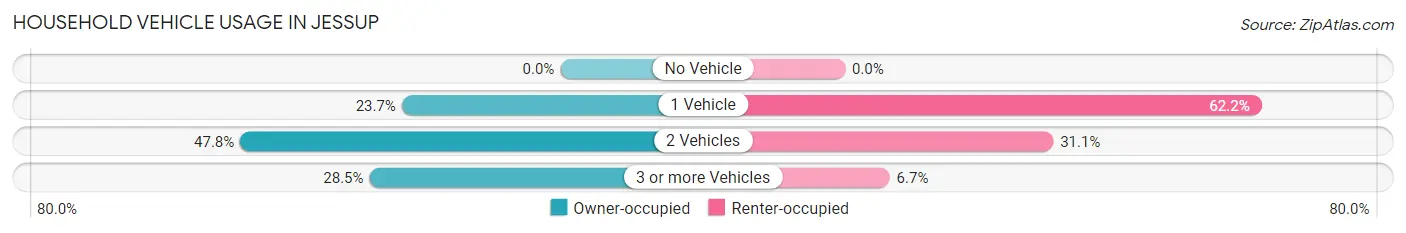
| Vehicles per Household | Owner-occupied | Renter-occupied |
| No Vehicle | 0 (0.0%) | 0 (0.0%) |
| 1 Vehicle | 216 (23.7%) | 512 (62.2%) |
| 2 Vehicles | 436 (47.8%) | 256 (31.1%) |
| 3 or more Vehicles | 260 (28.5%) | 55 (6.7%) |
| Total | 912 (100.0%) | 823 (100.0%) |
Real Estate & Mortgages in Jessup
Real Estate and Mortgage Overview in Jessup
| Characteristic | Without Mortgage | With Mortgage |
| Housing Units | 222 | 690 |
| Median Property Value | $362,900 | $468,500 |
| Median Household Income | - | - |
| Monthly Housing Costs | $584 | $261 |
| Real Estate Taxes | - | - |
Property Value by Mortgage Status in Jessup
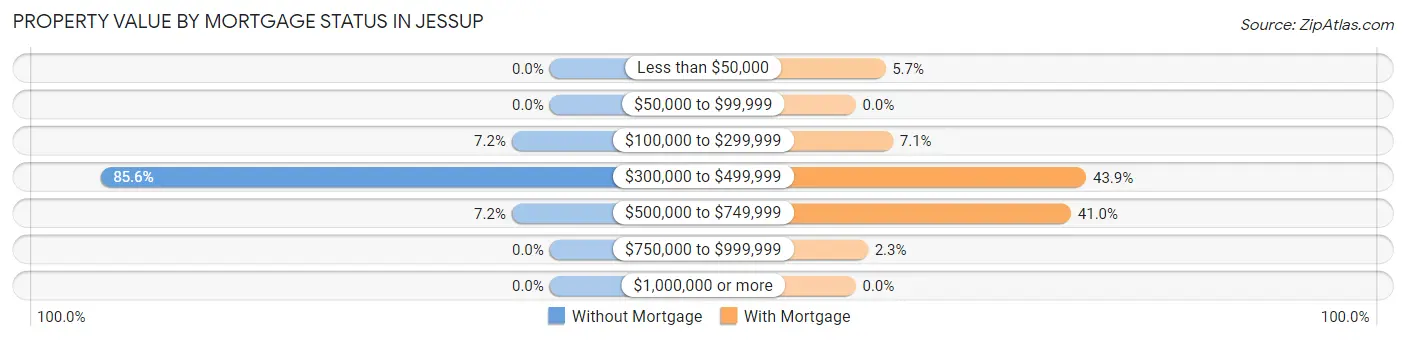
| Property Value | Without Mortgage | With Mortgage |
| Less than $50,000 | 0 (0.0%) | 39 (5.7%) |
| $50,000 to $99,999 | 0 (0.0%) | 0 (0.0%) |
| $100,000 to $299,999 | 16 (7.2%) | 49 (7.1%) |
| $300,000 to $499,999 | 190 (85.6%) | 303 (43.9%) |
| $500,000 to $749,999 | 16 (7.2%) | 283 (41.0%) |
| $750,000 to $999,999 | 0 (0.0%) | 16 (2.3%) |
| $1,000,000 or more | 0 (0.0%) | 0 (0.0%) |
| Total | 222 (100.0%) | 690 (100.0%) |
Household Income by Mortgage Status in Jessup
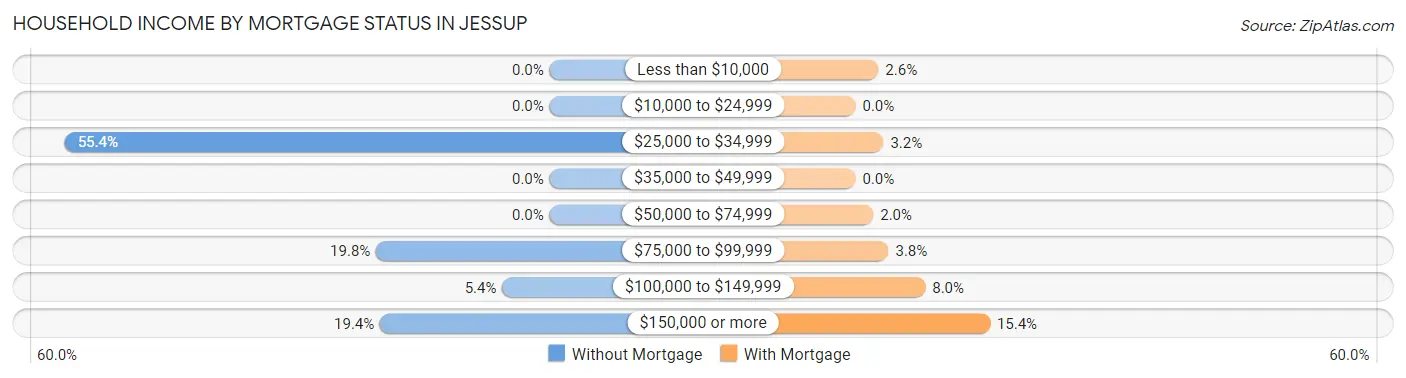
| Household Income | Without Mortgage | With Mortgage |
| Less than $10,000 | 0 (0.0%) | 18 (2.6%) |
| $10,000 to $24,999 | 0 (0.0%) | 0 (0.0%) |
| $25,000 to $34,999 | 123 (55.4%) | 22 (3.2%) |
| $35,000 to $49,999 | 0 (0.0%) | 0 (0.0%) |
| $50,000 to $74,999 | 0 (0.0%) | 14 (2.0%) |
| $75,000 to $99,999 | 44 (19.8%) | 26 (3.8%) |
| $100,000 to $149,999 | 12 (5.4%) | 55 (8.0%) |
| $150,000 or more | 43 (19.4%) | 106 (15.4%) |
| Total | 222 (100.0%) | 690 (100.0%) |
Property Value to Household Income Ratio in Jessup
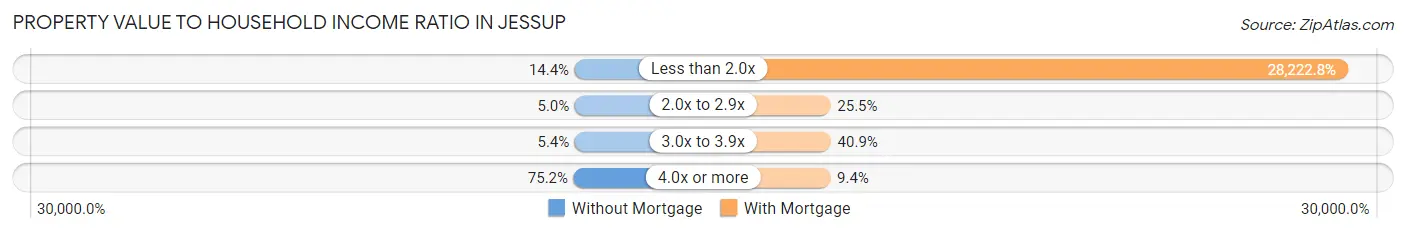
| Value-to-Income Ratio | Without Mortgage | With Mortgage |
| Less than 2.0x | 32 (14.4%) | 194,737 (28,222.8%) |
| 2.0x to 2.9x | 11 (5.0%) | 176 (25.5%) |
| 3.0x to 3.9x | 12 (5.4%) | 282 (40.9%) |
| 4.0x or more | 167 (75.2%) | 65 (9.4%) |
| Total | 222 (100.0%) | 690 (100.0%) |
Real Estate Taxes by Mortgage Status in Jessup
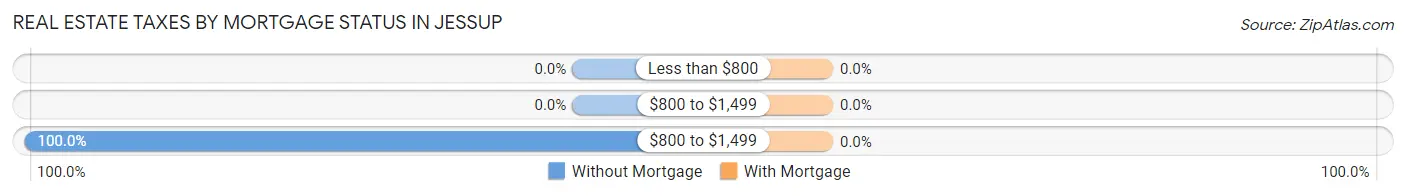
| Property Taxes | Without Mortgage | With Mortgage |
| Less than $800 | 0 (0.0%) | 0 (0.0%) |
| $800 to $1,499 | 0 (0.0%) | 0 (0.0%) |
| $800 to $1,499 | 222 (100.0%) | 0 (0.0%) |
| Total | 222 (100.0%) | 690 (100.0%) |
Health & Disability in Jessup
Health Insurance Coverage by Age in Jessup
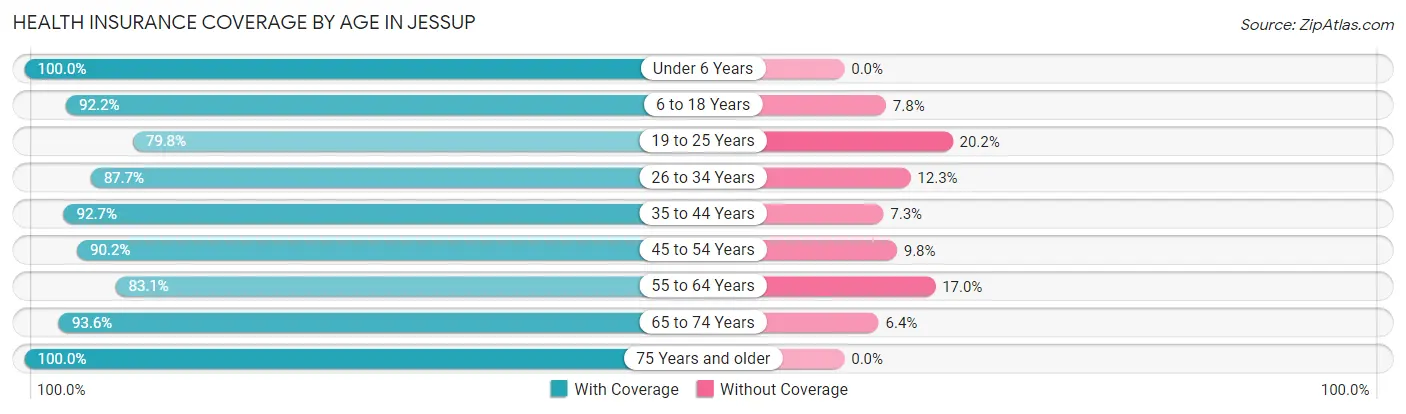
| Age Bracket | With Coverage | Without Coverage |
| Under 6 Years | 394 (100.0%) | 0 (0.0%) |
| 6 to 18 Years | 428 (92.2%) | 36 (7.8%) |
| 19 to 25 Years | 328 (79.8%) | 83 (20.2%) |
| 26 to 34 Years | 654 (87.7%) | 92 (12.3%) |
| 35 to 44 Years | 650 (92.7%) | 51 (7.3%) |
| 45 to 54 Years | 553 (90.2%) | 60 (9.8%) |
| 55 to 64 Years | 436 (83.1%) | 89 (17.0%) |
| 65 to 74 Years | 190 (93.6%) | 13 (6.4%) |
| 75 Years and older | 131 (100.0%) | 0 (0.0%) |
| Total | 3,764 (89.9%) | 424 (10.1%) |
Health Insurance Coverage by Citizenship Status in Jessup
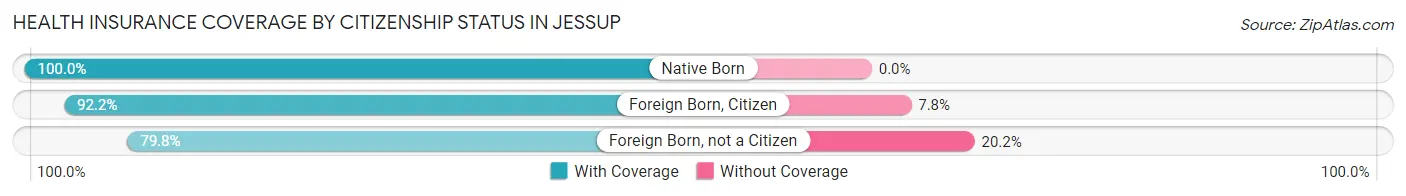
| Citizenship Status | With Coverage | Without Coverage |
| Native Born | 394 (100.0%) | 0 (0.0%) |
| Foreign Born, Citizen | 428 (92.2%) | 36 (7.8%) |
| Foreign Born, not a Citizen | 328 (79.8%) | 83 (20.2%) |
Health Insurance Coverage by Household Income in Jessup
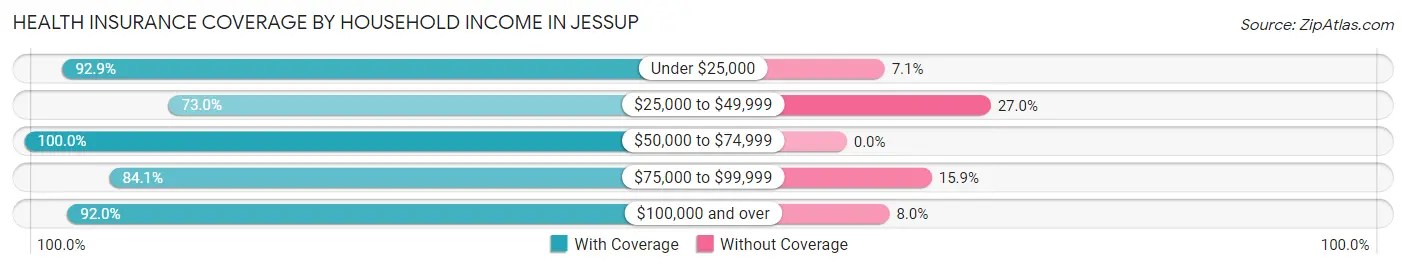
| Household Income | With Coverage | Without Coverage |
| Under $25,000 | 170 (92.9%) | 13 (7.1%) |
| $25,000 to $49,999 | 222 (73.0%) | 82 (27.0%) |
| $50,000 to $74,999 | 218 (100.0%) | 0 (0.0%) |
| $75,000 to $99,999 | 533 (84.1%) | 101 (15.9%) |
| $100,000 and over | 2,621 (92.0%) | 228 (8.0%) |
Public vs Private Health Insurance Coverage by Age in Jessup
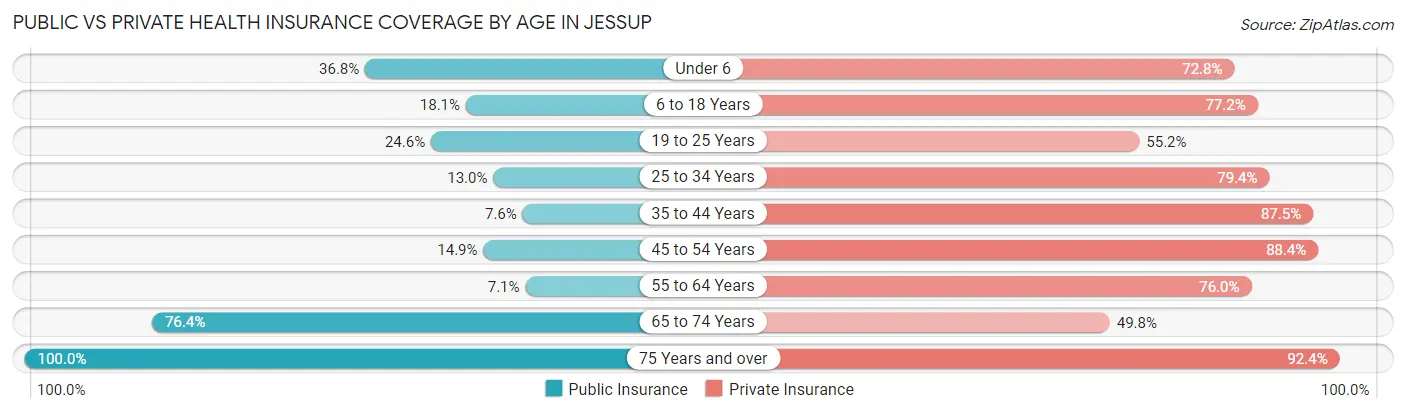
| Age Bracket | Public Insurance | Private Insurance |
| Under 6 | 145 (36.8%) | 287 (72.8%) |
| 6 to 18 Years | 84 (18.1%) | 358 (77.2%) |
| 19 to 25 Years | 101 (24.6%) | 227 (55.2%) |
| 25 to 34 Years | 97 (13.0%) | 592 (79.4%) |
| 35 to 44 Years | 53 (7.6%) | 613 (87.5%) |
| 45 to 54 Years | 91 (14.8%) | 542 (88.4%) |
| 55 to 64 Years | 37 (7.0%) | 399 (76.0%) |
| 65 to 74 Years | 155 (76.3%) | 101 (49.7%) |
| 75 Years and over | 131 (100.0%) | 121 (92.4%) |
| Total | 894 (21.3%) | 3,240 (77.4%) |
Disability Status by Sex by Age in Jessup
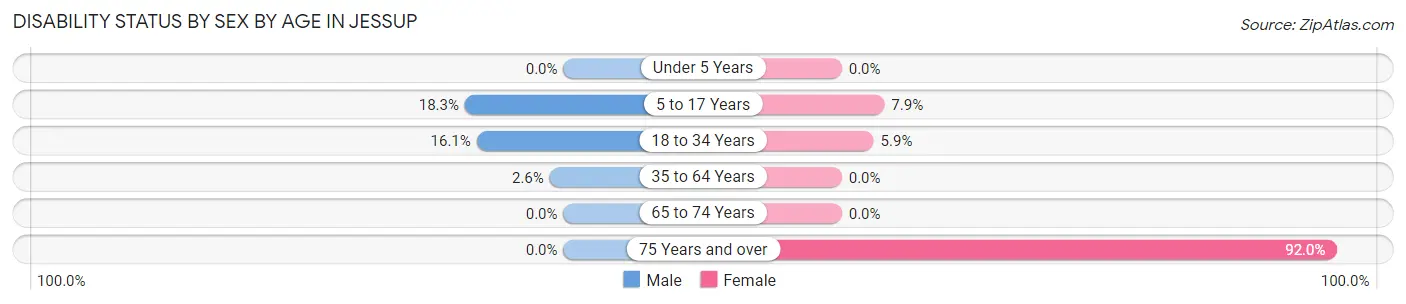
| Age Bracket | Male | Female |
| Under 5 Years | 0 (0.0%) | 0 (0.0%) |
| 5 to 17 Years | 41 (18.3%) | 17 (7.9%) |
| 18 to 34 Years | 95 (16.1%) | 35 (5.9%) |
| 35 to 64 Years | 29 (2.5%) | 0 (0.0%) |
| 65 to 74 Years | 0 (0.0%) | 0 (0.0%) |
| 75 Years and over | 0 (0.0%) | 103 (92.0%) |
Disability Class by Sex by Age in Jessup
Disability Class: Hearing Difficulty
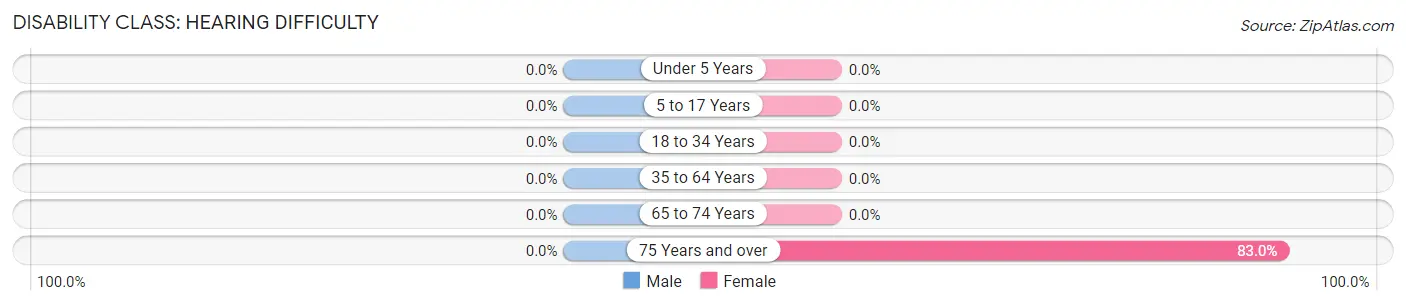
| Age Bracket | Male | Female |
| Under 5 Years | 0 (0.0%) | 0 (0.0%) |
| 5 to 17 Years | 0 (0.0%) | 0 (0.0%) |
| 18 to 34 Years | 0 (0.0%) | 0 (0.0%) |
| 35 to 64 Years | 0 (0.0%) | 0 (0.0%) |
| 65 to 74 Years | 0 (0.0%) | 0 (0.0%) |
| 75 Years and over | 0 (0.0%) | 93 (83.0%) |
Disability Class: Vision Difficulty

| Age Bracket | Male | Female |
| Under 5 Years | 0 (0.0%) | 0 (0.0%) |
| 5 to 17 Years | 41 (18.3%) | 17 (7.9%) |
| 18 to 34 Years | 0 (0.0%) | 0 (0.0%) |
| 35 to 64 Years | 0 (0.0%) | 0 (0.0%) |
| 65 to 74 Years | 0 (0.0%) | 0 (0.0%) |
| 75 Years and over | 0 (0.0%) | 0 (0.0%) |
Disability Class: Cognitive Difficulty
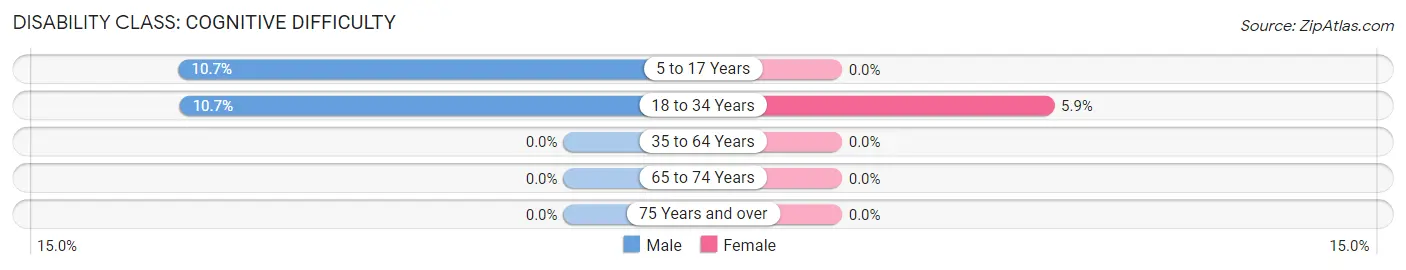
| Age Bracket | Male | Female |
| 5 to 17 Years | 24 (10.7%) | 0 (0.0%) |
| 18 to 34 Years | 63 (10.7%) | 35 (5.9%) |
| 35 to 64 Years | 0 (0.0%) | 0 (0.0%) |
| 65 to 74 Years | 0 (0.0%) | 0 (0.0%) |
| 75 Years and over | 0 (0.0%) | 0 (0.0%) |
Disability Class: Ambulatory Difficulty
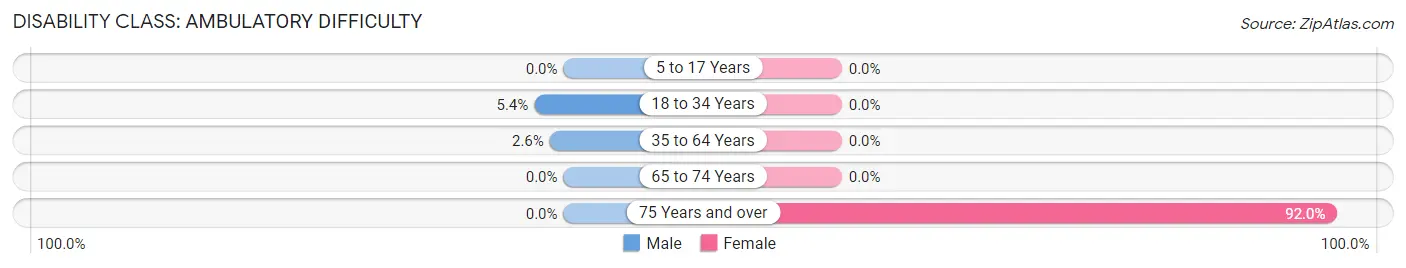
| Age Bracket | Male | Female |
| 5 to 17 Years | 0 (0.0%) | 0 (0.0%) |
| 18 to 34 Years | 32 (5.4%) | 0 (0.0%) |
| 35 to 64 Years | 29 (2.5%) | 0 (0.0%) |
| 65 to 74 Years | 0 (0.0%) | 0 (0.0%) |
| 75 Years and over | 0 (0.0%) | 103 (92.0%) |
Disability Class: Self-Care Difficulty
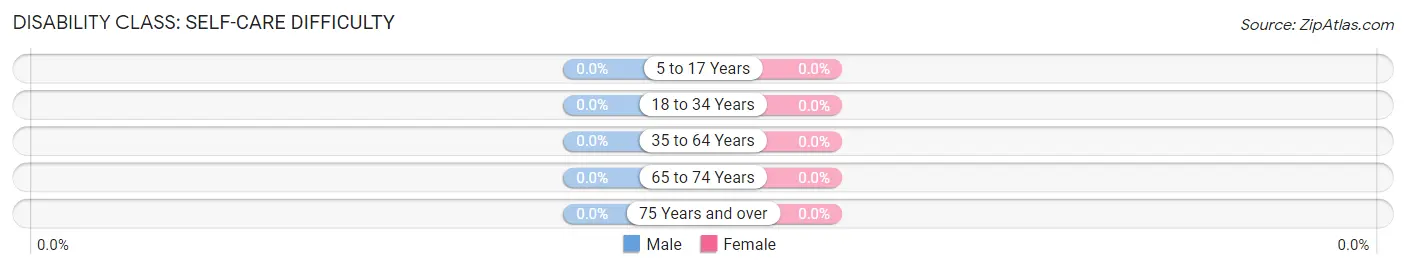
| Age Bracket | Male | Female |
| 5 to 17 Years | 0 (0.0%) | 0 (0.0%) |
| 18 to 34 Years | 0 (0.0%) | 0 (0.0%) |
| 35 to 64 Years | 0 (0.0%) | 0 (0.0%) |
| 65 to 74 Years | 0 (0.0%) | 0 (0.0%) |
| 75 Years and over | 0 (0.0%) | 0 (0.0%) |
Technology Access in Jessup
Computing Device Access in Jessup
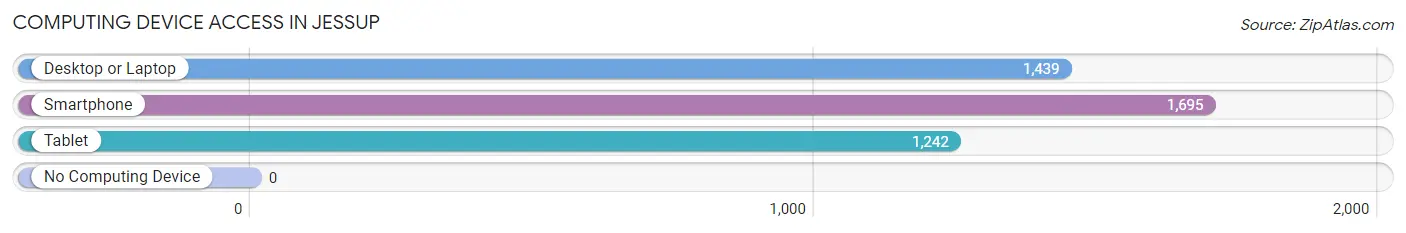
| Device Type | # Households | % Households |
| Desktop or Laptop | 1,439 | 82.9% |
| Smartphone | 1,695 | 97.7% |
| Tablet | 1,242 | 71.6% |
| No Computing Device | 0 | 0.0% |
| Total | 1,735 | 100.0% |
Internet Access in Jessup
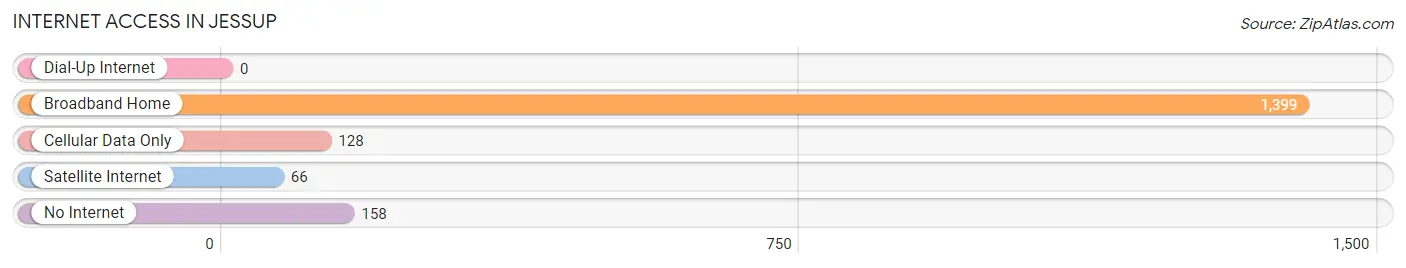
| Internet Type | # Households | % Households |
| Dial-Up Internet | 0 | 0.0% |
| Broadband Home | 1,399 | 80.6% |
| Cellular Data Only | 128 | 7.4% |
| Satellite Internet | 66 | 3.8% |
| No Internet | 158 | 9.1% |
| Total | 1,735 | 100.0% |
Jessup Summary
Jessup, Maryland is a small unincorporated community located in Howard County, Maryland. It is situated between the cities of Columbia and Laurel, and is part of the Baltimore-Washington metropolitan area. The population of Jessup was 8,945 as of the 2010 census.
History
Jessup was first settled in the early 19th century by the Jessup family, who were among the first settlers in the area. The town was named after the family, and was officially incorporated in 1873. The town was originally a farming community, but in the late 19th century, it began to develop into an industrial center. The Baltimore and Ohio Railroad opened a station in Jessup in 1884, and the town soon became a hub for the railroad industry.
In the early 20th century, Jessup began to experience rapid growth as a result of the industrialization of the area. The town was home to several factories, including a paper mill, a brickyard, and a canning factory. The town also had a thriving business district, with several stores and restaurants.
Geography
Jessup is located in Howard County, Maryland, approximately 20 miles south of Baltimore and 25 miles north of Washington, D.C. The town is situated between the cities of Columbia and Laurel, and is part of the Baltimore-Washington metropolitan area. The Patuxent River forms the western boundary of the town, and the Patapsco River forms the eastern boundary.
The town has a total area of 4.2 square miles, all of which is land. The terrain is mostly flat, with some rolling hills. The climate is humid subtropical, with hot, humid summers and mild winters.
Economy
Jessup’s economy is largely based on manufacturing and services. The town is home to several factories, including a paper mill, a brickyard, and a canning factory. The town also has a thriving business district, with several stores and restaurants.
The town is also home to several government agencies, including the Maryland Department of Transportation, the Maryland State Police, and the Maryland National Guard. The town is also home to the Maryland Correctional Institution, a medium-security prison.
Demographics
As of the 2010 census, the population of Jessup was 8,945. The racial makeup of the town was 79.3% White, 13.2% African American, 0.7% Native American, 2.2% Asian, 0.1% Pacific Islander, 1.7% from other races, and 2.8% from two or more races. Hispanic or Latino of any race were 4.3% of the population.
The median income for a household in Jessup was $63,958, and the median income for a family was $76,958. The per capita income for the town was $27,958. About 5.3% of families and 7.2% of the population were below the poverty line, including 8.3% of those under age 18 and 5.2% of those age 65 or over.
Common Questions
What is Per Capita Income in Jessup?
Per Capita income in Jessup is $27,377.
What is the Median Family Income in Jessup?
Median Family Income in Jessup is $155,250.
What is the Median Household income in Jessup?
Median Household Income in Jessup is $140,561.
What is Income or Wage Gap in Jessup?
Income or Wage Gap in Jessup is 27.9%.
Women in Jessup earn 72.1 cents for every dollar earned by a man.
What is Inequality or Gini Index in Jessup?
Inequality or Gini Index in Jessup is 0.32.
What is the Total Population of Jessup?
Total Population of Jessup is 9,602.
What is the Total Male Population of Jessup?
Total Male Population of Jessup is 6,975.
What is the Total Female Population of Jessup?
Total Female Population of Jessup is 2,627.
What is the Ratio of Males per 100 Females in Jessup?
There are 265.51 Males per 100 Females in Jessup.
What is the Ratio of Females per 100 Males in Jessup?
There are 37.66 Females per 100 Males in Jessup.
What is the Median Population Age in Jessup?
Median Population Age in Jessup is 36.8 Years.
What is the Average Family Size in Jessup
Average Family Size in Jessup is 3.2 People.
What is the Average Household Size in Jessup
Average Household Size in Jessup is 2.5 People.
How Large is the Labor Force in Jessup?
There are 2,686 People in the Labor Forcein in Jessup.
What is the Percentage of People in the Labor Force in Jessup?
30.3% of People are in the Labor Force in Jessup.
What is the Unemployment Rate in Jessup?
Unemployment Rate in Jessup is 4.4%.