Zip Codes with the Highest Percentage of Population Employed in Computer, Engineering & Science in Maryland
RELATED REPORTS & OPTIONS
Computer, Engineering & Science
Maryland
Compare Zip Codes
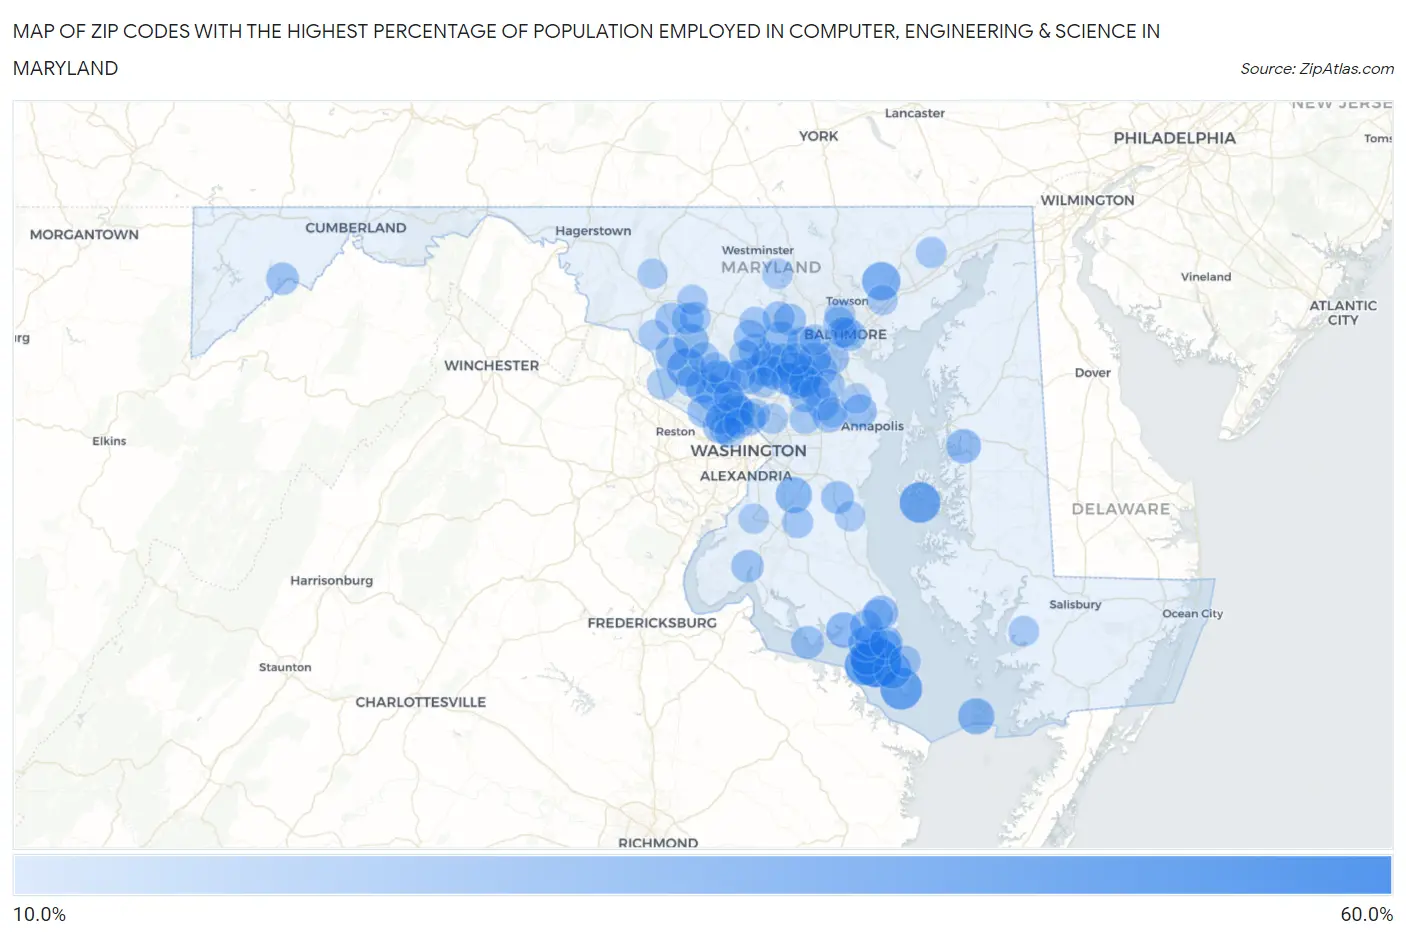
Map of Zip Codes with the Highest Percentage of Population Employed in Computer, Engineering & Science in Maryland
10.0%
60.0%
Zip Codes with the Highest Percentage of Population Employed in Computer, Engineering & Science in Maryland
| Zip Code | % Employed | vs State | vs National | |
| 1. | 20630 | 54.8% | 10.7%(+44.1)#1 | 6.8%(+48.1)#26 |
| 2. | 20687 | 37.7% | 10.7%(+27.0)#2 | 6.8%(+30.9)#102 |
| 3. | 21652 | 35.2% | 10.7%(+24.5)#3 | 6.8%(+28.4)#130 |
| 4. | 20690 | 34.8% | 10.7%(+24.1)#4 | 6.8%(+28.0)#134 |
| 5. | 21051 | 30.0% | 10.7%(+19.3)#5 | 6.8%(+23.2)#177 |
| 6. | 20841 | 29.5% | 10.7%(+18.8)#6 | 6.8%(+22.7)#182 |
| 7. | 20763 | 29.0% | 10.7%(+18.3)#7 | 6.8%(+22.2)#188 |
| 8. | 20684 | 28.2% | 10.7%(+17.5)#8 | 6.8%(+21.4)#204 |
| 9. | 20623 | 25.5% | 10.7%(+14.9)#9 | 6.8%(+18.8)#263 |
| 10. | 21824 | 25.5% | 10.7%(+14.9)#10 | 6.8%(+18.8)#265 |
| 11. | 20667 | 24.7% | 10.7%(+14.0)#11 | 6.8%(+17.9)#283 |
| 12. | 20692 | 24.6% | 10.7%(+13.9)#12 | 6.8%(+17.8)#287 |
| 13. | 20860 | 24.3% | 10.7%(+13.6)#13 | 6.8%(+17.5)#292 |
| 14. | 20620 | 24.1% | 10.7%(+13.4)#14 | 6.8%(+17.4)#297 |
| 15. | 20794 | 23.9% | 10.7%(+13.3)#15 | 6.8%(+17.2)#301 |
| 16. | 20777 | 23.9% | 10.7%(+13.2)#16 | 6.8%(+17.2)#302 |
| 17. | 20650 | 23.7% | 10.7%(+13.1)#17 | 6.8%(+17.0)#314 |
| 18. | 20850 | 23.3% | 10.7%(+12.6)#18 | 6.8%(+16.5)#334 |
| 19. | 21029 | 23.2% | 10.7%(+12.5)#19 | 6.8%(+16.4)#336 |
| 20. | 20871 | 23.0% | 10.7%(+12.3)#20 | 6.8%(+16.2)#347 |
| 21. | 21042 | 22.8% | 10.7%(+12.1)#21 | 6.8%(+16.0)#359 |
| 22. | 20814 | 22.2% | 10.7%(+11.5)#22 | 6.8%(+15.5)#379 |
| 23. | 20852 | 22.2% | 10.7%(+11.5)#23 | 6.8%(+15.4)#381 |
| 24. | 21679 | 21.6% | 10.7%(+10.9)#24 | 6.8%(+14.9)#402 |
| 25. | 20878 | 21.3% | 10.7%(+10.6)#25 | 6.8%(+14.5)#425 |
| 26. | 20896 | 21.2% | 10.7%(+10.5)#26 | 6.8%(+14.4)#428 |
| 27. | 20880 | 21.2% | 10.7%(+10.5)#27 | 6.8%(+14.4)#429 |
| 28. | 20818 | 21.0% | 10.7%(+10.3)#28 | 6.8%(+14.2)#439 |
| 29. | 21043 | 20.9% | 10.7%(+10.2)#29 | 6.8%(+14.2)#445 |
| 30. | 21076 | 20.6% | 10.7%(+9.93)#30 | 6.8%(+13.8)#465 |
| 31. | 20838 | 20.5% | 10.7%(+9.84)#31 | 6.8%(+13.7)#478 |
| 32. | 20910 | 20.1% | 10.7%(+9.44)#32 | 6.8%(+13.3)#499 |
| 33. | 21405 | 20.0% | 10.7%(+9.32)#33 | 6.8%(+13.2)#507 |
| 34. | 20629 | 19.9% | 10.7%(+9.23)#34 | 6.8%(+13.1)#522 |
| 35. | 21044 | 19.6% | 10.7%(+8.92)#35 | 6.8%(+12.8)#544 |
| 36. | 20759 | 19.6% | 10.7%(+8.89)#36 | 6.8%(+12.8)#547 |
| 37. | 21046 | 19.1% | 10.7%(+8.47)#37 | 6.8%(+12.4)#580 |
| 38. | 20634 | 18.9% | 10.7%(+8.21)#38 | 6.8%(+12.1)#599 |
| 39. | 21090 | 18.6% | 10.7%(+7.88)#39 | 6.8%(+11.8)#631 |
| 40. | 20626 | 18.5% | 10.7%(+7.80)#40 | 6.8%(+11.7)#635 |
| 41. | 21113 | 18.4% | 10.7%(+7.69)#41 | 6.8%(+11.6)#641 |
| 42. | 20619 | 18.2% | 10.7%(+7.57)#42 | 6.8%(+11.5)#656 |
| 43. | 20754 | 18.2% | 10.7%(+7.55)#43 | 6.8%(+11.5)#657 |
| 44. | 21075 | 18.0% | 10.7%(+7.34)#44 | 6.8%(+11.2)#681 |
| 45. | 20653 | 18.0% | 10.7%(+7.28)#45 | 6.8%(+11.2)#685 |
| 46. | 20854 | 17.9% | 10.7%(+7.20)#46 | 6.8%(+11.1)#695 |
| 47. | 21036 | 17.8% | 10.7%(+7.17)#47 | 6.8%(+11.1)#699 |
| 48. | 20677 | 17.8% | 10.7%(+7.09)#48 | 6.8%(+11.0)#714 |
| 49. | 21523 | 17.7% | 10.7%(+7.07)#49 | 6.8%(+11.0)#720 |
| 50. | 21738 | 17.6% | 10.7%(+6.95)#50 | 6.8%(+10.9)#734 |
| 51. | 20855 | 17.6% | 10.7%(+6.89)#51 | 6.8%(+10.8)#744 |
| 52. | 20723 | 17.5% | 10.7%(+6.82)#52 | 6.8%(+10.7)#752 |
| 53. | 21163 | 17.3% | 10.7%(+6.63)#53 | 6.8%(+10.5)#776 |
| 54. | 20895 | 17.3% | 10.7%(+6.60)#54 | 6.8%(+10.5)#782 |
| 55. | 21104 | 17.0% | 10.7%(+6.32)#55 | 6.8%(+10.2)#813 |
| 56. | 21704 | 16.6% | 10.7%(+5.97)#56 | 6.8%(+9.88)#867 |
| 57. | 20724 | 16.5% | 10.7%(+5.86)#57 | 6.8%(+9.77)#879 |
| 58. | 21231 | 16.5% | 10.7%(+5.80)#58 | 6.8%(+9.71)#887 |
| 59. | 21754 | 16.5% | 10.7%(+5.79)#59 | 6.8%(+9.70)#891 |
| 60. | 21114 | 16.1% | 10.7%(+5.41)#60 | 6.8%(+9.32)#944 |
| 61. | 20701 | 15.9% | 10.7%(+5.27)#61 | 6.8%(+9.18)#966 |
| 62. | 21144 | 15.9% | 10.7%(+5.24)#62 | 6.8%(+9.15)#975 |
| 63. | 21045 | 15.4% | 10.7%(+4.76)#63 | 6.8%(+8.67)#1,039 |
| 64. | 20812 | 15.3% | 10.7%(+4.65)#64 | 6.8%(+8.56)#1,067 |
| 65. | 21770 | 15.2% | 10.7%(+4.53)#65 | 6.8%(+8.44)#1,088 |
| 66. | 20688 | 15.2% | 10.7%(+4.51)#66 | 6.8%(+8.43)#1,093 |
| 67. | 21723 | 15.1% | 10.7%(+4.47)#67 | 6.8%(+8.38)#1,097 |
| 68. | 20817 | 15.1% | 10.7%(+4.43)#68 | 6.8%(+8.34)#1,105 |
| 69. | 20628 | 15.1% | 10.7%(+4.39)#69 | 6.8%(+8.30)#1,113 |
| 70. | 20613 | 14.9% | 10.7%(+4.17)#70 | 6.8%(+8.09)#1,144 |
| 71. | 20874 | 14.8% | 10.7%(+4.13)#71 | 6.8%(+8.04)#1,150 |
| 72. | 20876 | 14.7% | 10.7%(+4.03)#72 | 6.8%(+7.95)#1,172 |
| 73. | 20837 | 14.6% | 10.7%(+3.89)#73 | 6.8%(+7.80)#1,206 |
| 74. | 21228 | 14.4% | 10.7%(+3.75)#74 | 6.8%(+7.66)#1,237 |
| 75. | 20832 | 14.4% | 10.7%(+3.73)#75 | 6.8%(+7.64)#1,243 |
| 76. | 21202 | 14.3% | 10.7%(+3.60)#76 | 6.8%(+7.51)#1,275 |
| 77. | 21028 | 14.1% | 10.7%(+3.44)#77 | 6.8%(+7.35)#1,308 |
| 78. | 20720 | 14.1% | 10.7%(+3.43)#78 | 6.8%(+7.34)#1,310 |
| 79. | 21211 | 14.0% | 10.7%(+3.35)#79 | 6.8%(+7.27)#1,327 |
| 80. | 21201 | 14.0% | 10.7%(+3.28)#80 | 6.8%(+7.19)#1,349 |
| 81. | 20833 | 13.8% | 10.7%(+3.11)#81 | 6.8%(+7.02)#1,410 |
| 82. | 21210 | 13.8% | 10.7%(+3.10)#82 | 6.8%(+7.01)#1,411 |
| 83. | 20755 | 13.7% | 10.7%(+3.04)#83 | 6.8%(+6.95)#1,428 |
| 84. | 21865 | 13.6% | 10.7%(+2.96)#84 | 6.8%(+6.87)#1,446 |
| 85. | 21710 | 13.6% | 10.7%(+2.95)#85 | 6.8%(+6.87)#1,449 |
| 86. | 21048 | 13.6% | 10.7%(+2.92)#86 | 6.8%(+6.83)#1,452 |
| 87. | 20740 | 13.4% | 10.7%(+2.77)#87 | 6.8%(+6.68)#1,496 |
| 88. | 21774 | 13.3% | 10.7%(+2.67)#88 | 6.8%(+6.58)#1,517 |
| 89. | 21054 | 13.3% | 10.7%(+2.64)#89 | 6.8%(+6.55)#1,535 |
| 90. | 20816 | 13.3% | 10.7%(+2.59)#90 | 6.8%(+6.50)#1,552 |
| 91. | 21128 | 13.1% | 10.7%(+2.43)#91 | 6.8%(+6.34)#1,601 |
| 92. | 21146 | 13.1% | 10.7%(+2.39)#92 | 6.8%(+6.30)#1,627 |
| 93. | 20868 | 13.0% | 10.7%(+2.35)#93 | 6.8%(+6.26)#1,641 |
| 94. | 20851 | 13.0% | 10.7%(+2.30)#94 | 6.8%(+6.21)#1,653 |
| 95. | 20607 | 12.9% | 10.7%(+2.23)#95 | 6.8%(+6.14)#1,675 |
| 96. | 20815 | 12.9% | 10.7%(+2.20)#96 | 6.8%(+6.11)#1,685 |
| 97. | 20689 | 12.8% | 10.7%(+2.11)#97 | 6.8%(+6.02)#1,717 |
| 98. | 20879 | 12.7% | 10.7%(+2.07)#98 | 6.8%(+5.98)#1,726 |
| 99. | 20901 | 12.7% | 10.7%(+2.01)#99 | 6.8%(+5.92)#1,752 |
| 100. | 21702 | 12.7% | 10.7%(+1.99)#100 | 6.8%(+5.90)#1,761 |
Common Questions
What are the Top 10 Zip Codes with the Highest Percentage of Population Employed in Computer, Engineering & Science in Maryland?
Top 10 Zip Codes with the Highest Percentage of Population Employed in Computer, Engineering & Science in Maryland are:
What zip code has the Highest Percentage of Population Employed in Computer, Engineering & Science in Maryland?
20630 has the Highest Percentage of Population Employed in Computer, Engineering & Science in Maryland with 54.8%.
What is the Percentage of Population Employed in Computer, Engineering & Science in the State of Maryland?
Percentage of Population Employed in Computer, Engineering & Science in Maryland is 10.7%.
What is the Percentage of Population Employed in Computer, Engineering & Science in the United States?
Percentage of Population Employed in Computer, Engineering & Science in the United States is 6.8%.