Flintstone, MD Map & Demographics
Flintstone Map
Flintstone Overview
$14,032
PER CAPITA INCOME
$60,469
AVG FAMILY INCOME
$60,469
AVG HOUSEHOLD INCOME
0.40
INEQUALITY / GINI INDEX
183
TOTAL POPULATION
121
MALE POPULATION
62
FEMALE POPULATION
195.16
MALES / 100 FEMALES
51.24
FEMALES / 100 MALES
18.0
MEDIAN AGE
4.2
AVG FAMILY SIZE
4.2
AVG HOUSEHOLD SIZE
40
LABOR FORCE [ PEOPLE ]
33.1%
PERCENT IN LABOR FORCE
Flintstone Zip Codes
Flintstone Area Codes
Income in Flintstone
Income Overview in Flintstone
Per Capita Income in Flintstone is $14,032, while median incomes of families and households are $60,469 and $60,469 respectively.
| Characteristic | Number | Measure |
| Per Capita Income | 183 | $14,032 |
| Median Family Income | 44 | $60,469 |
| Mean Family Income | 44 | $63,561 |
| Median Household Income | 44 | $60,469 |
| Mean Household Income | 44 | $63,561 |
| Income Deficit | 44 | $0 |
| Wage / Income Gap (%) | 183 | 0.00% |
| Wage / Income Gap ($) | 183 | 100.00¢ per $1 |
| Gini / Inequality Index | 183 | 0.40 |
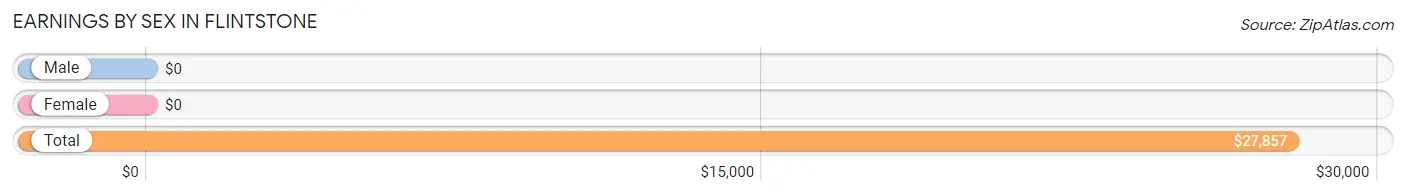
Earnings by Sex in Flintstone
| Sex | Number | Average Earnings |
| Male | 8 (20.0%) | $0 |
| Female | 32 (80.0%) | $0 |
| Total | 40 (100.0%) | $27,857 |
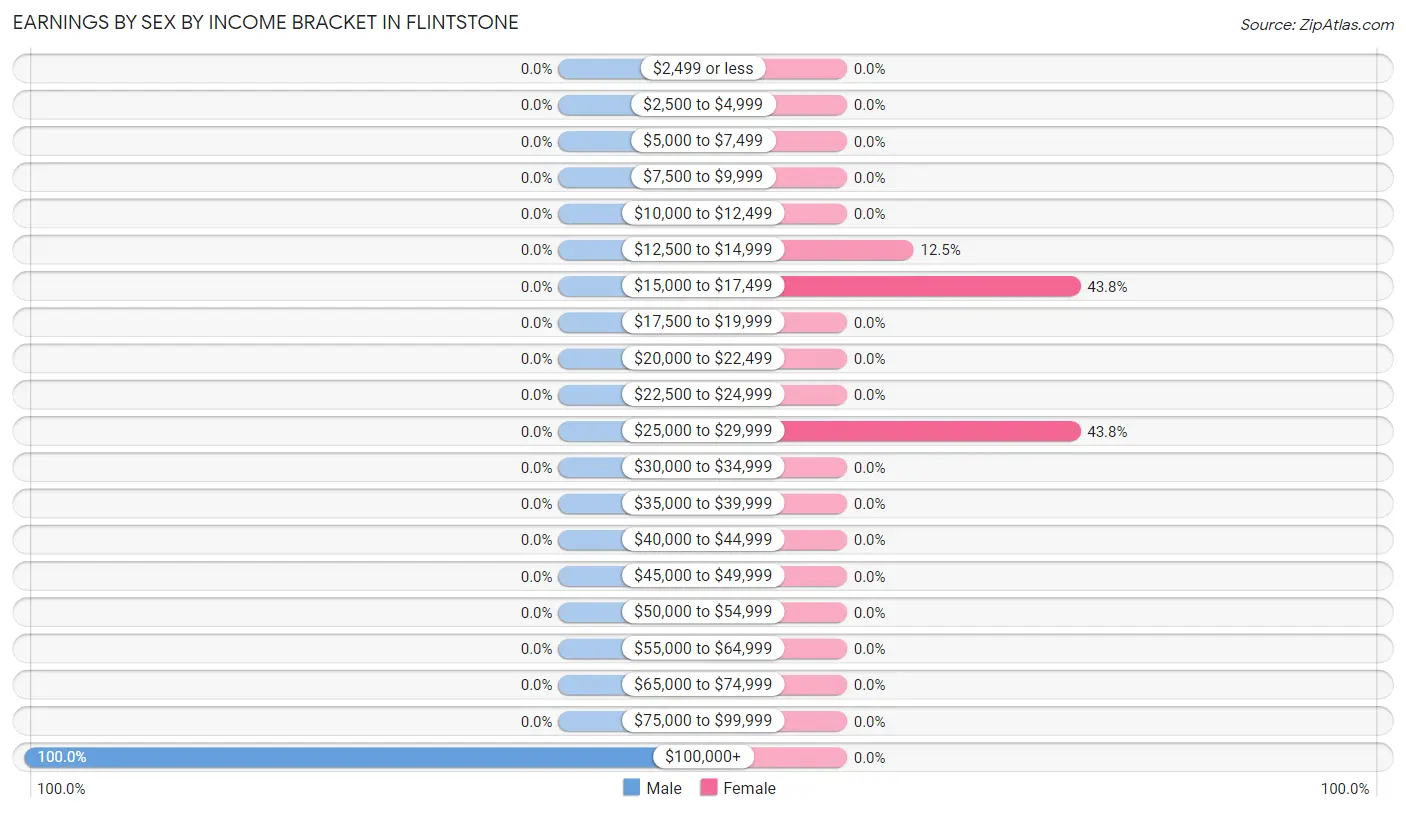
Earnings by Sex by Income Bracket in Flintstone
The most common earnings brackets in Flintstone are $100,000+ for men (8 | 100.0%) and $15,000 to $17,499 for women (14 | 43.8%).
| Income | Male | Female |
| $2,499 or less | 0 (0.0%) | 0 (0.0%) |
| $2,500 to $4,999 | 0 (0.0%) | 0 (0.0%) |
| $5,000 to $7,499 | 0 (0.0%) | 0 (0.0%) |
| $7,500 to $9,999 | 0 (0.0%) | 0 (0.0%) |
| $10,000 to $12,499 | 0 (0.0%) | 0 (0.0%) |
| $12,500 to $14,999 | 0 (0.0%) | 4 (12.5%) |
| $15,000 to $17,499 | 0 (0.0%) | 14 (43.8%) |
| $17,500 to $19,999 | 0 (0.0%) | 0 (0.0%) |
| $20,000 to $22,499 | 0 (0.0%) | 0 (0.0%) |
| $22,500 to $24,999 | 0 (0.0%) | 0 (0.0%) |
| $25,000 to $29,999 | 0 (0.0%) | 14 (43.8%) |
| $30,000 to $34,999 | 0 (0.0%) | 0 (0.0%) |
| $35,000 to $39,999 | 0 (0.0%) | 0 (0.0%) |
| $40,000 to $44,999 | 0 (0.0%) | 0 (0.0%) |
| $45,000 to $49,999 | 0 (0.0%) | 0 (0.0%) |
| $50,000 to $54,999 | 0 (0.0%) | 0 (0.0%) |
| $55,000 to $64,999 | 0 (0.0%) | 0 (0.0%) |
| $65,000 to $74,999 | 0 (0.0%) | 0 (0.0%) |
| $75,000 to $99,999 | 0 (0.0%) | 0 (0.0%) |
| $100,000+ | 8 (100.0%) | 0 (0.0%) |
| Total | 8 (100.0%) | 32 (100.0%) |
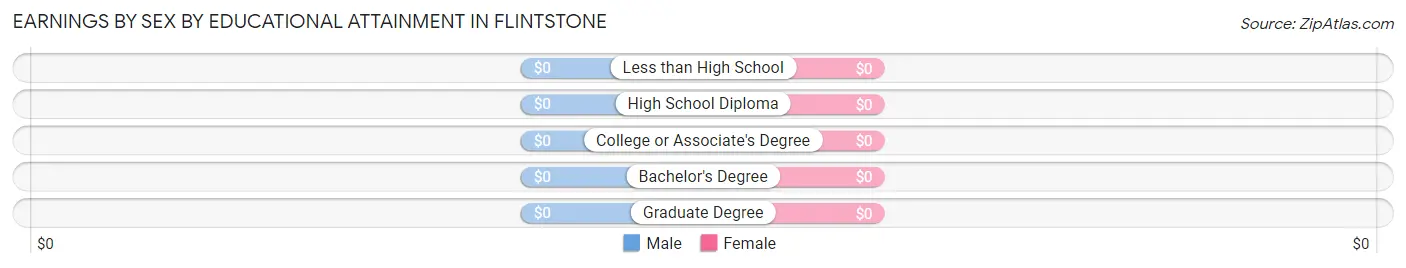
Earnings by Sex by Educational Attainment in Flintstone
| Educational Attainment | Male Income | Female Income |
| Less than High School | - | - |
| High School Diploma | - | - |
| College or Associate's Degree | - | - |
| Bachelor's Degree | - | - |
| Graduate Degree | - | - |
| Total | - | - |
Family Income in Flintstone
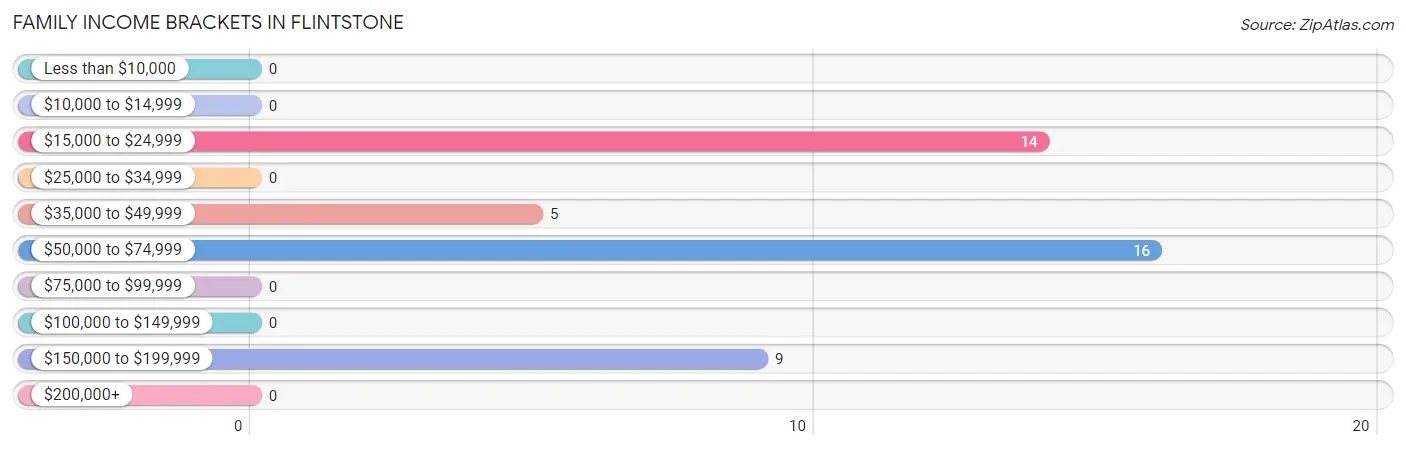
Family Income Brackets in Flintstone
According to the Flintstone family income data, there are 16 families falling into the $50,000 to $74,999 income range, which is the most common income bracket and makes up 36.4% of all families.
| Income Bracket | # Families | % Families |
| Less than $10,000 | 0 | 0.0% |
| $10,000 to $14,999 | 0 | 0.0% |
| $15,000 to $24,999 | 14 | 31.8% |
| $25,000 to $34,999 | 0 | 0.0% |
| $35,000 to $49,999 | 5 | 11.4% |
| $50,000 to $74,999 | 16 | 36.4% |
| $75,000 to $99,999 | 0 | 0.0% |
| $100,000 to $149,999 | 0 | 0.0% |
| $150,000 to $199,999 | 9 | 20.5% |
| $200,000+ | 0 | 0.0% |
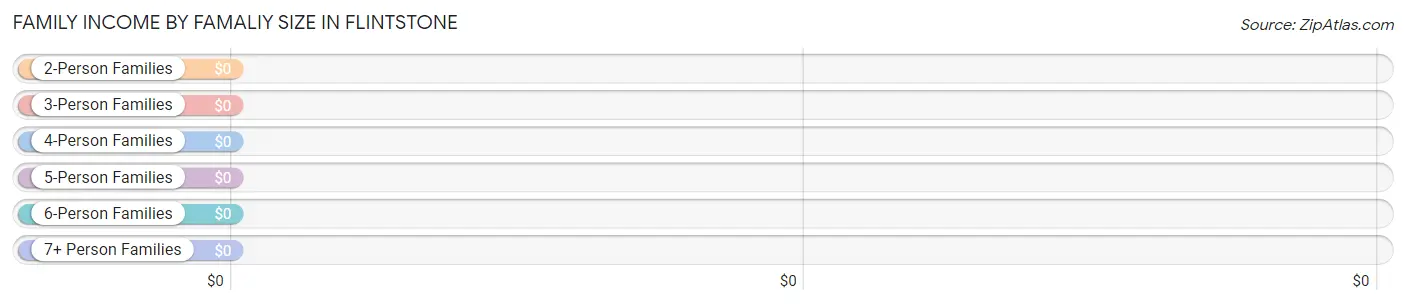
Family Income by Famaliy Size in Flintstone
| Income Bracket | # Families | Median Income |
| 2-Person Families | 5 (11.4%) | $0 |
| 3-Person Families | 0 (0.0%) | $0 |
| 4-Person Families | 25 (56.8%) | $0 |
| 5-Person Families | 0 (0.0%) | $0 |
| 6-Person Families | 14 (31.8%) | $0 |
| 7+ Person Families | 0 (0.0%) | $0 |
| Total | 44 (100.0%) | $60,469 |
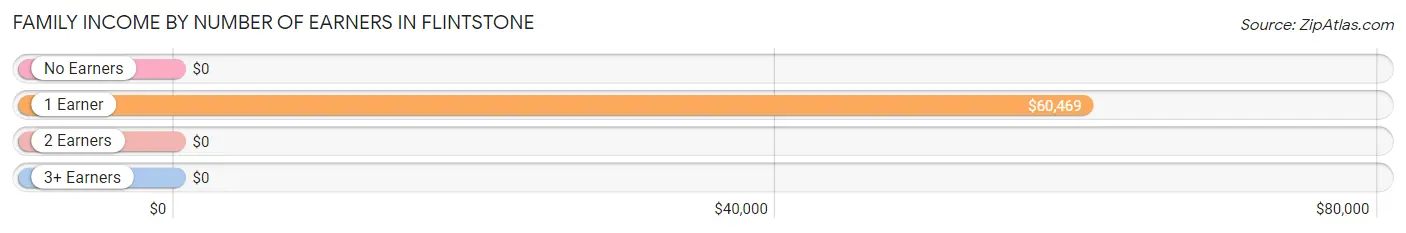
Family Income by Number of Earners in Flintstone
| Number of Earners | # Families | Median Income |
| No Earners | 0 (0.0%) | $0 |
| 1 Earner | 44 (100.0%) | $60,469 |
| 2 Earners | 0 (0.0%) | $0 |
| 3+ Earners | 0 (0.0%) | $0 |
| Total | 44 (100.0%) | $60,469 |
Household Income in Flintstone
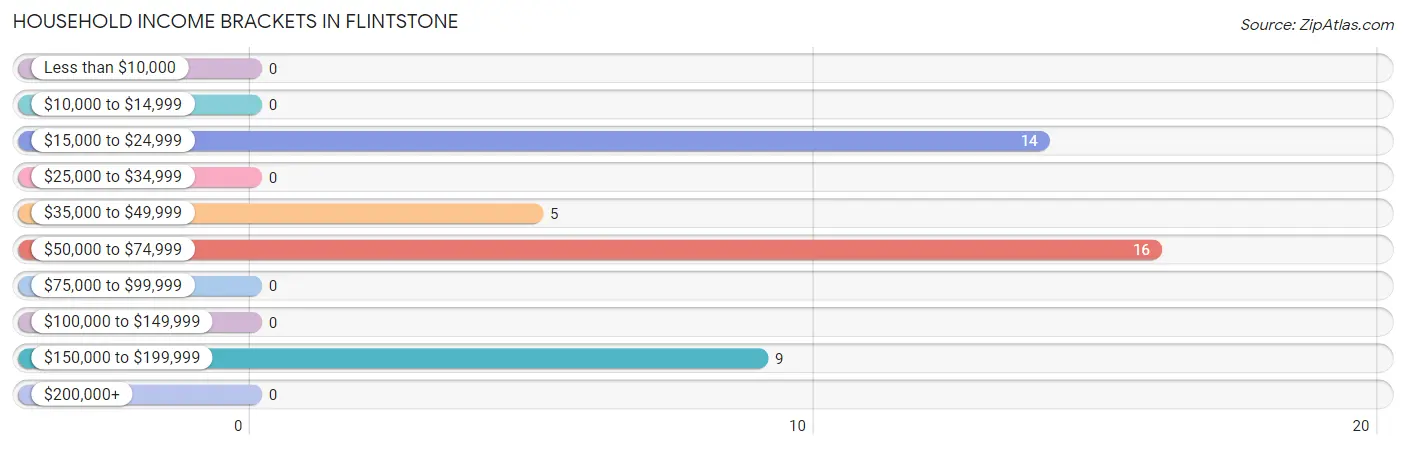
Household Income Brackets in Flintstone
With 16 households falling in the category, the $50,000 to $74,999 income range is the most frequent in Flintstone, accounting for 36.4% of all households.
| Income Bracket | # Households | % Households |
| Less than $10,000 | 0 | 0.0% |
| $10,000 to $14,999 | 0 | 0.0% |
| $15,000 to $24,999 | 14 | 31.8% |
| $25,000 to $34,999 | 0 | 0.0% |
| $35,000 to $49,999 | 5 | 11.4% |
| $50,000 to $74,999 | 16 | 36.4% |
| $75,000 to $99,999 | 0 | 0.0% |
| $100,000 to $149,999 | 0 | 0.0% |
| $150,000 to $199,999 | 9 | 20.5% |
| $200,000+ | 0 | 0.0% |
Household Income by Householder Age in Flintstone
| Income Bracket | # Households | Median Income |
| 15 to 24 Years | 0 (0.0%) | $0 |
| 25 to 44 Years | 25 (56.8%) | $0 |
| 45 to 64 Years | 19 (43.2%) | $0 |
| 65+ Years | 0 (0.0%) | $0 |
| Total | 44 (100.0%) | $60,469 |
Poverty in Flintstone
Income Below Poverty by Sex and Age in Flintstone
With 43.8% poverty level for males and 43.5% for females among the residents of Flintstone, 12 to 14 year old males and 16 and 17 year old females are the most vulnerable to poverty, with 15 males (100.0%) and 13 females (100.0%) in their respective age groups living below the poverty level.
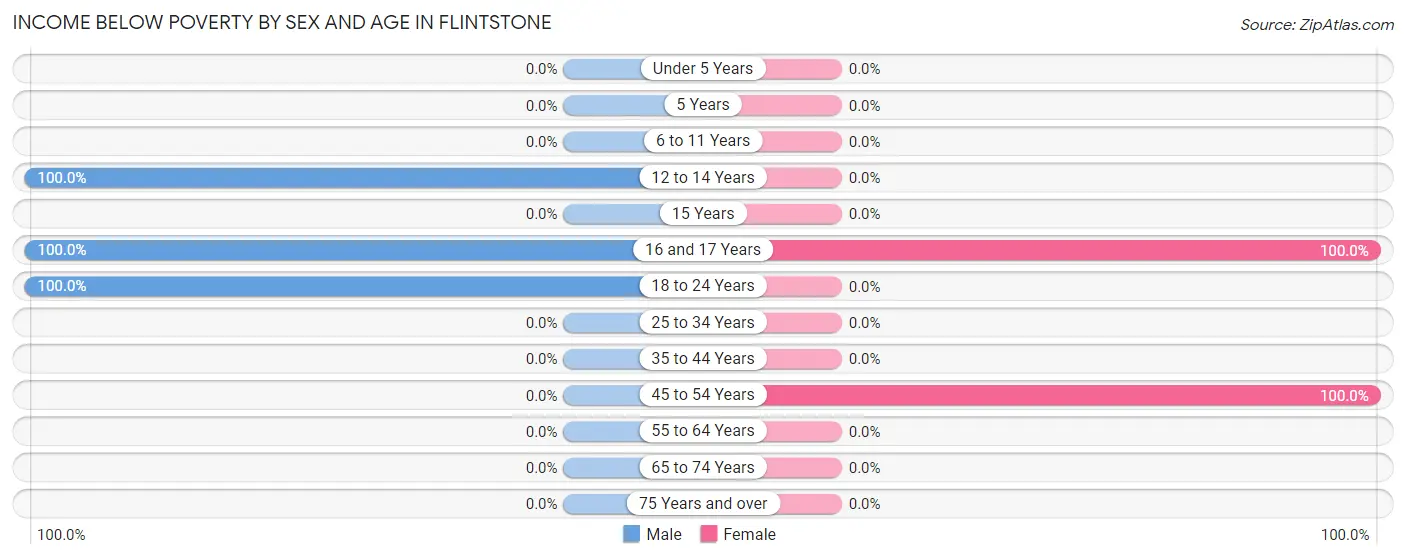
| Age Bracket | Male | Female |
| Under 5 Years | 0 (0.0%) | 0 (0.0%) |
| 5 Years | 0 (0.0%) | 0 (0.0%) |
| 6 to 11 Years | 0 (0.0%) | 0 (0.0%) |
| 12 to 14 Years | 15 (100.0%) | 0 (0.0%) |
| 15 Years | 0 (0.0%) | 0 (0.0%) |
| 16 and 17 Years | 16 (100.0%) | 13 (100.0%) |
| 18 to 24 Years | 22 (100.0%) | 0 (0.0%) |
| 25 to 34 Years | 0 (0.0%) | 0 (0.0%) |
| 35 to 44 Years | 0 (0.0%) | 0 (0.0%) |
| 45 to 54 Years | 0 (0.0%) | 14 (100.0%) |
| 55 to 64 Years | 0 (0.0%) | 0 (0.0%) |
| 65 to 74 Years | 0 (0.0%) | 0 (0.0%) |
| 75 Years and over | 0 (0.0%) | 0 (0.0%) |
| Total | 53 (43.8%) | 27 (43.5%) |
Income Above Poverty by Sex and Age in Flintstone
According to the poverty statistics in Flintstone, males aged under 5 years and females aged under 5 years are the age groups that are most secure financially, with 100.0% of males and 100.0% of females in these age groups living above the poverty line.
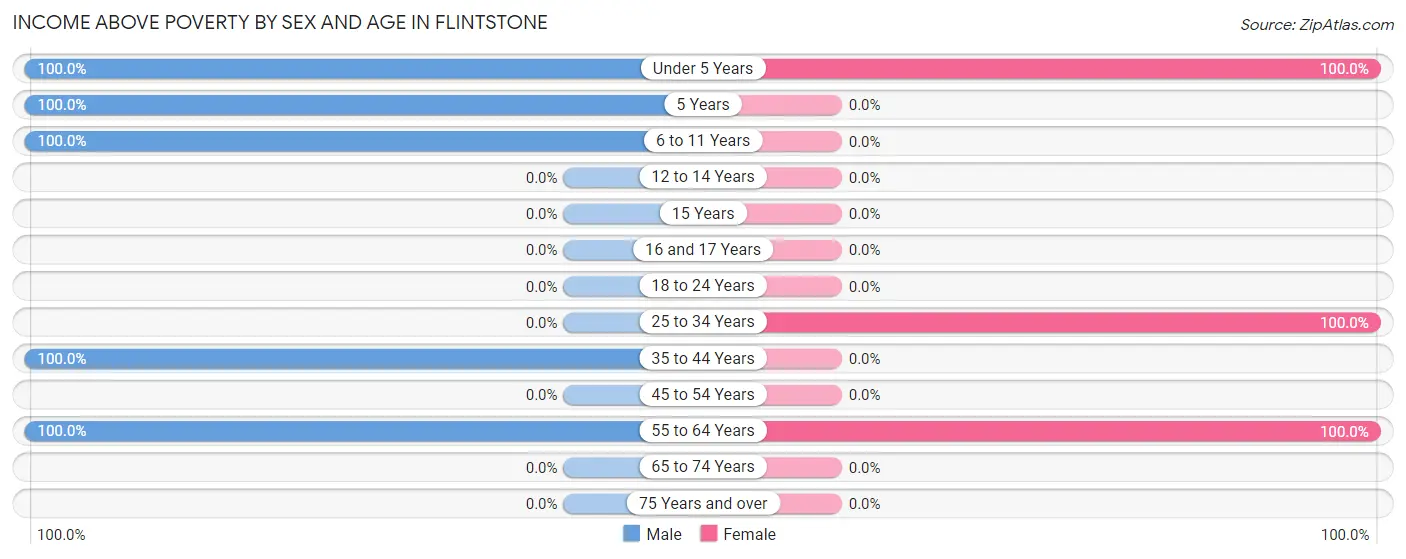
| Age Bracket | Male | Female |
| Under 5 Years | 12 (100.0%) | 8 (100.0%) |
| 5 Years | 9 (100.0%) | 0 (0.0%) |
| 6 to 11 Years | 18 (100.0%) | 0 (0.0%) |
| 12 to 14 Years | 0 (0.0%) | 0 (0.0%) |
| 15 Years | 0 (0.0%) | 0 (0.0%) |
| 16 and 17 Years | 0 (0.0%) | 0 (0.0%) |
| 18 to 24 Years | 0 (0.0%) | 0 (0.0%) |
| 25 to 34 Years | 0 (0.0%) | 23 (100.0%) |
| 35 to 44 Years | 24 (100.0%) | 0 (0.0%) |
| 45 to 54 Years | 0 (0.0%) | 0 (0.0%) |
| 55 to 64 Years | 5 (100.0%) | 4 (100.0%) |
| 65 to 74 Years | 0 (0.0%) | 0 (0.0%) |
| 75 Years and over | 0 (0.0%) | 0 (0.0%) |
| Total | 68 (56.2%) | 35 (56.5%) |
Income Below Poverty Among Married-Couple Families in Flintstone
| Children | Above Poverty | Below Poverty |
| No Children | 5 (100.0%) | 0 (0.0%) |
| 1 or 2 Children | 25 (100.0%) | 0 (0.0%) |
| 3 or 4 Children | 0 (0.0%) | 0 (0.0%) |
| 5 or more Children | 0 (0.0%) | 0 (0.0%) |
| Total | 30 (100.0%) | 0 (0.0%) |
Income Below Poverty Among Single-Parent Households in Flintstone
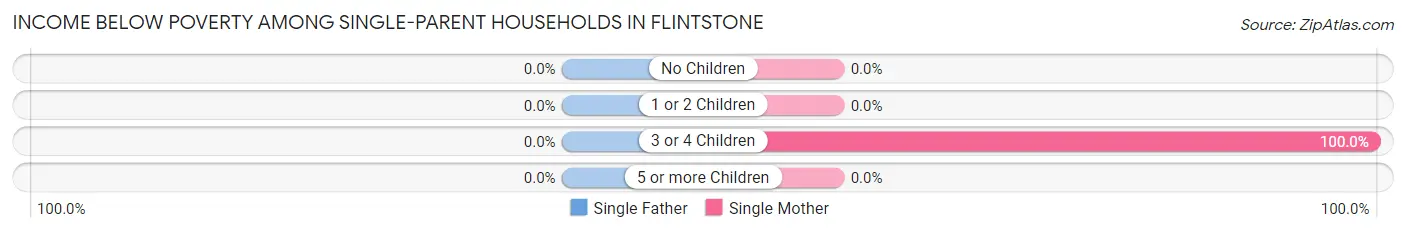
| Children | Single Father | Single Mother |
| No Children | 0 (0.0%) | 0 (0.0%) |
| 1 or 2 Children | 0 (0.0%) | 0 (0.0%) |
| 3 or 4 Children | 0 (0.0%) | 14 (100.0%) |
| 5 or more Children | 0 (0.0%) | 0 (0.0%) |
| Total | 0 (0.0%) | 14 (100.0%) |
Income Below Poverty Among Married-Couple vs Single-Parent Households in Flintstone
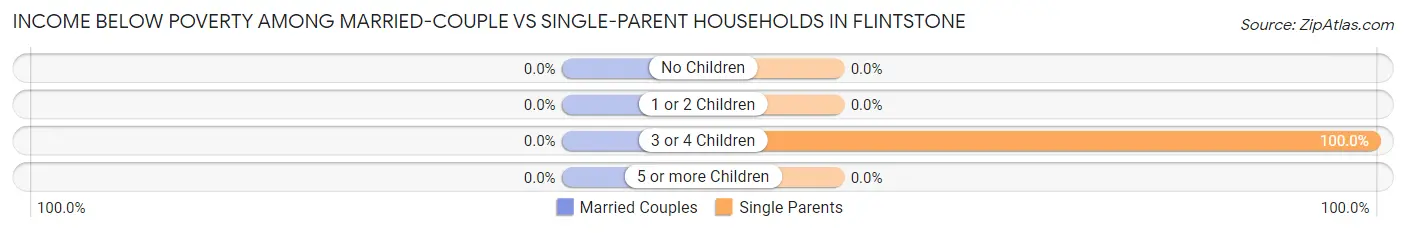
| Children | Married-Couple Families | Single-Parent Households |
| No Children | 0 (0.0%) | 0 (0.0%) |
| 1 or 2 Children | 0 (0.0%) | 0 (0.0%) |
| 3 or 4 Children | 0 (0.0%) | 14 (100.0%) |
| 5 or more Children | 0 (0.0%) | 0 (0.0%) |
| Total | 0 (0.0%) | 14 (100.0%) |
Race in Flintstone
The most populous races in Flintstone are , and White / Caucasian (183 | 100.0%).
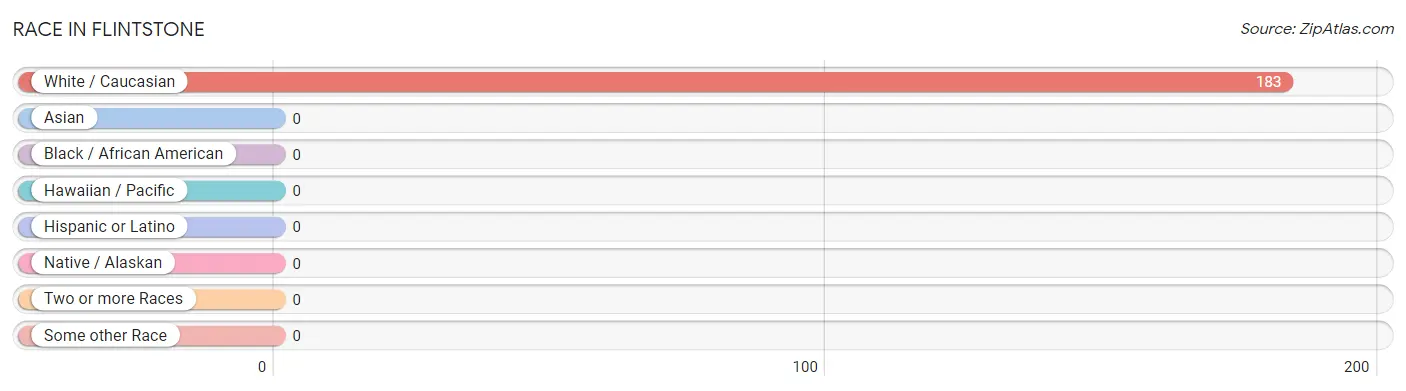
| Race | # Population | % Population |
| Asian | 0 | 0.0% |
| Black / African American | 0 | 0.0% |
| Hawaiian / Pacific | 0 | 0.0% |
| Hispanic or Latino | 0 | 0.0% |
| Native / Alaskan | 0 | 0.0% |
| White / Caucasian | 183 | 100.0% |
| Two or more Races | 0 | 0.0% |
| Some other Race | 0 | 0.0% |
| Total | 183 | 100.0% |
Ancestry in Flintstone
The most populous ancestries reported in Flintstone are German (83 | 45.4%), Irish (20 | 10.9%), Italian (18 | 9.8%), English (16 | 8.7%), and Polish (16 | 8.7%), together accounting for 83.6% of all Flintstone residents.
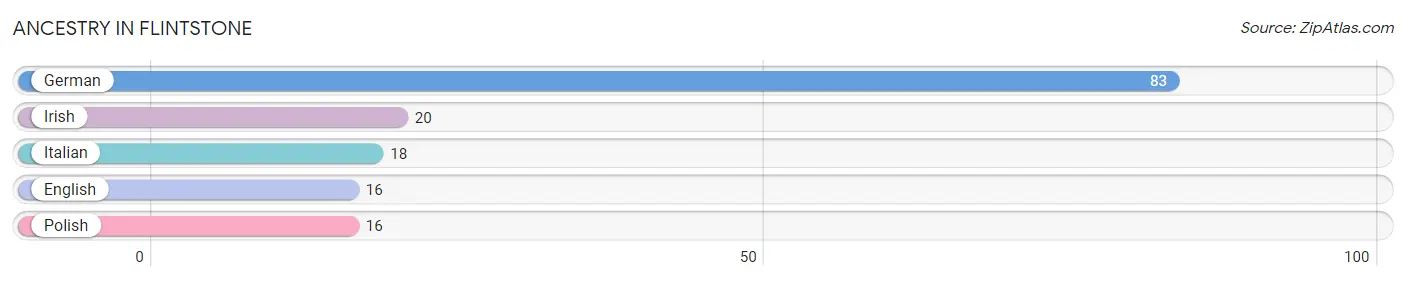
| Ancestry | # Population | % Population |
| English | 16 | 8.7% |
| German | 83 | 45.4% |
| Irish | 20 | 10.9% |
| Italian | 18 | 9.8% |
| Polish | 16 | 8.7% | View All 5 Rows |
Immigrants in Flintstone

| Immigration Origin | # Population | % Population | View All 0 Rows |
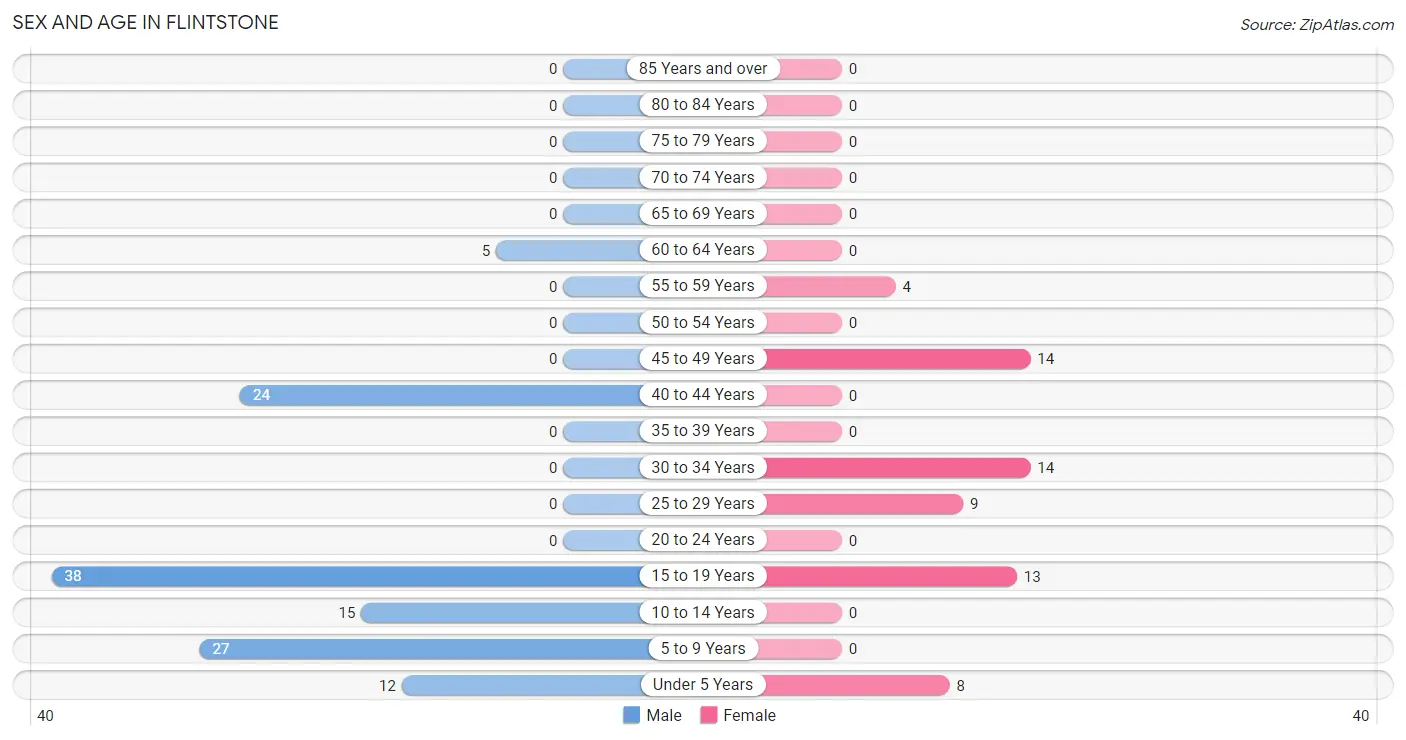
Sex and Age in Flintstone
Sex and Age in Flintstone
The most populous age groups in Flintstone are 15 to 19 Years (38 | 31.4%) for men and 30 to 34 Years (14 | 22.6%) for women.
| Age Bracket | Male | Female |
| Under 5 Years | 12 (9.9%) | 8 (12.9%) |
| 5 to 9 Years | 27 (22.3%) | 0 (0.0%) |
| 10 to 14 Years | 15 (12.4%) | 0 (0.0%) |
| 15 to 19 Years | 38 (31.4%) | 13 (21.0%) |
| 20 to 24 Years | 0 (0.0%) | 0 (0.0%) |
| 25 to 29 Years | 0 (0.0%) | 9 (14.5%) |
| 30 to 34 Years | 0 (0.0%) | 14 (22.6%) |
| 35 to 39 Years | 0 (0.0%) | 0 (0.0%) |
| 40 to 44 Years | 24 (19.8%) | 0 (0.0%) |
| 45 to 49 Years | 0 (0.0%) | 14 (22.6%) |
| 50 to 54 Years | 0 (0.0%) | 0 (0.0%) |
| 55 to 59 Years | 0 (0.0%) | 4 (6.5%) |
| 60 to 64 Years | 5 (4.1%) | 0 (0.0%) |
| 65 to 69 Years | 0 (0.0%) | 0 (0.0%) |
| 70 to 74 Years | 0 (0.0%) | 0 (0.0%) |
| 75 to 79 Years | 0 (0.0%) | 0 (0.0%) |
| 80 to 84 Years | 0 (0.0%) | 0 (0.0%) |
| 85 Years and over | 0 (0.0%) | 0 (0.0%) |
| Total | 121 (100.0%) | 62 (100.0%) |
Families and Households in Flintstone
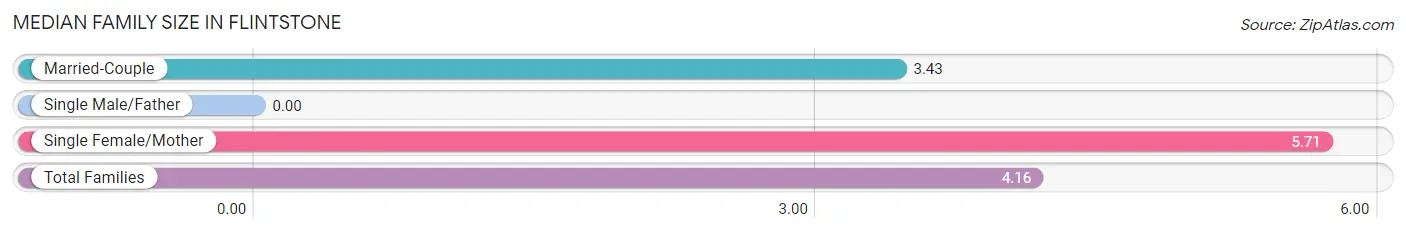
Median Family Size in Flintstone
| Family Type | # Families | Family Size |
| Married-Couple | 30 (68.2%) | 3.43 |
| Single Male/Father | 0 (0.0%) | - |
| Single Female/Mother | 14 (31.8%) | 5.71 |
| Total Families | 44 (100.0%) | 4.16 |
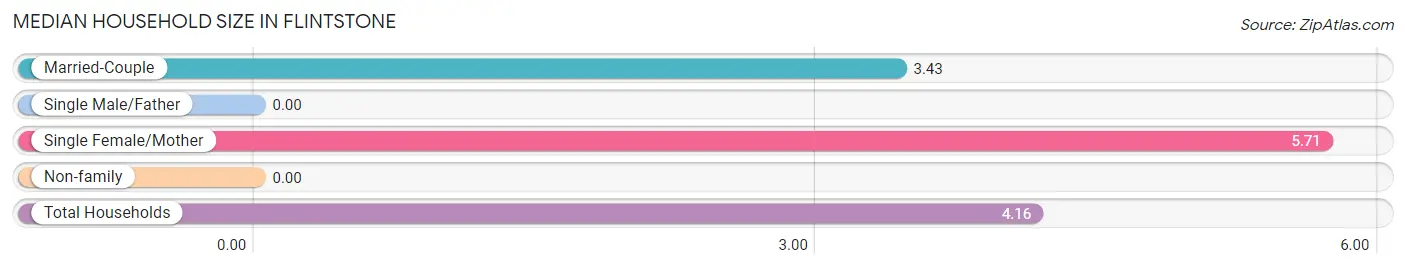
Median Household Size in Flintstone
| Household Type | # Households | Household Size |
| Married-Couple | 30 (68.2%) | 3.43 |
| Single Male/Father | 0 (0.0%) | - |
| Single Female/Mother | 14 (31.8%) | 5.71 |
| Non-family | 0 (0.0%) | - |
| Total Households | 44 (100.0%) | 4.16 |
Household Size by Marriage Status in Flintstone
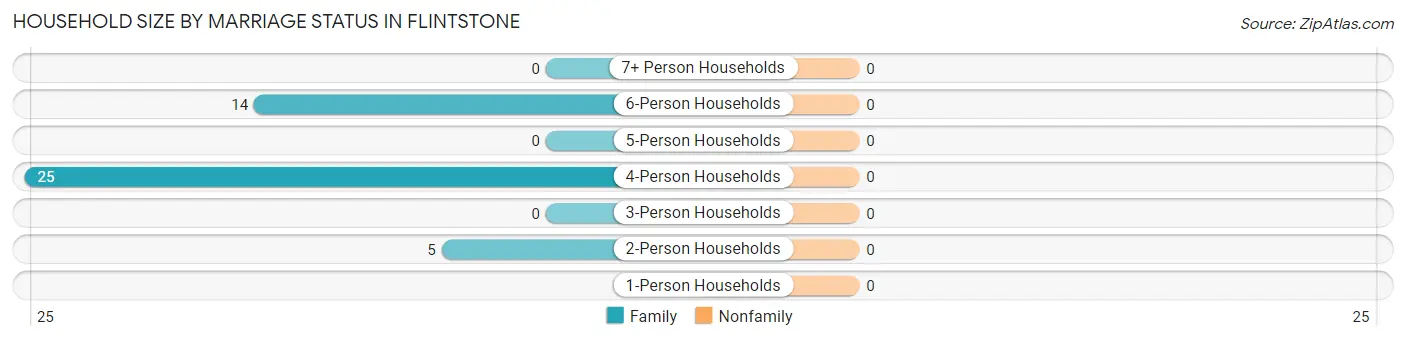
| Household Size | Family Households | Nonfamily Households |
| 1-Person Households | - | 0 (0.0%) |
| 2-Person Households | 5 (11.4%) | 0 (0.0%) |
| 3-Person Households | 0 (0.0%) | 0 (0.0%) |
| 4-Person Households | 25 (56.8%) | 0 (0.0%) |
| 5-Person Households | 0 (0.0%) | 0 (0.0%) |
| 6-Person Households | 14 (31.8%) | 0 (0.0%) |
| 7+ Person Households | 0 (0.0%) | 0 (0.0%) |
| Total | 44 (100.0%) | 0 (0.0%) |
Female Fertility in Flintstone
Fertility by Age in Flintstone
Average fertility rate in Flintstone is 280.0 births per 1,000 women. Women in the age bracket of 20 to 34 years have the highest fertility rate with 609.0 births per 1,000 women. Women in the age bracket of 20 to 34 years acount for 100.0% of all women with births.
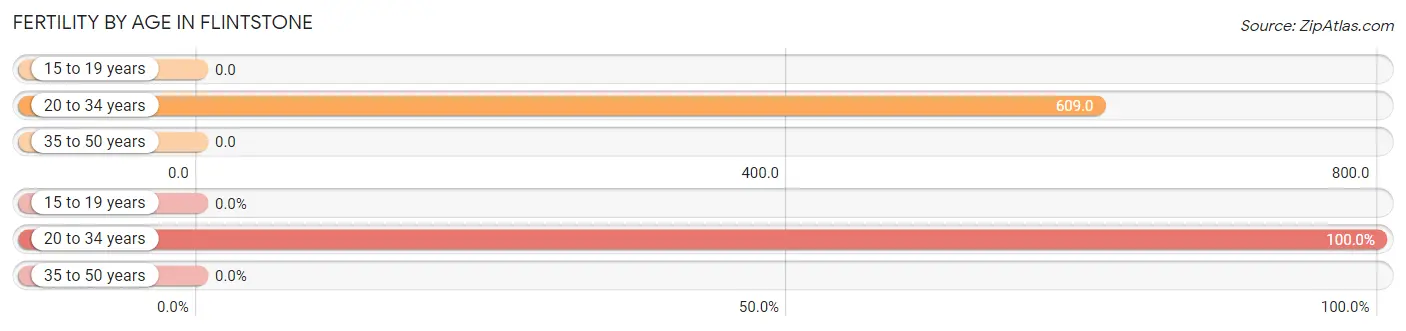
| Age Bracket | Women with Births | Births / 1,000 Women |
| 15 to 19 years | 0 (0.0%) | 0.0 |
| 20 to 34 years | 14 (100.0%) | 609.0 |
| 35 to 50 years | 0 (0.0%) | 0.0 |
| Total | 14 (100.0%) | 280.0 |
Fertility by Age by Marriage Status in Flintstone
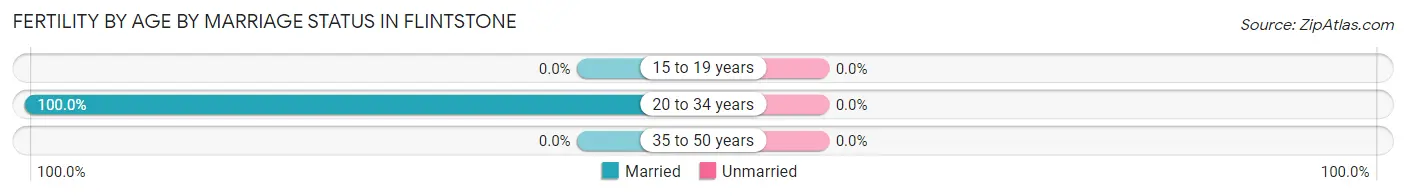
| Age Bracket | Married | Unmarried |
| 15 to 19 years | 0 (0.0%) | 0 (0.0%) |
| 20 to 34 years | 14 (100.0%) | 0 (0.0%) |
| 35 to 50 years | 0 (0.0%) | 0 (0.0%) |
| Total | 14 (100.0%) | 0 (0.0%) |
Fertility by Education in Flintstone
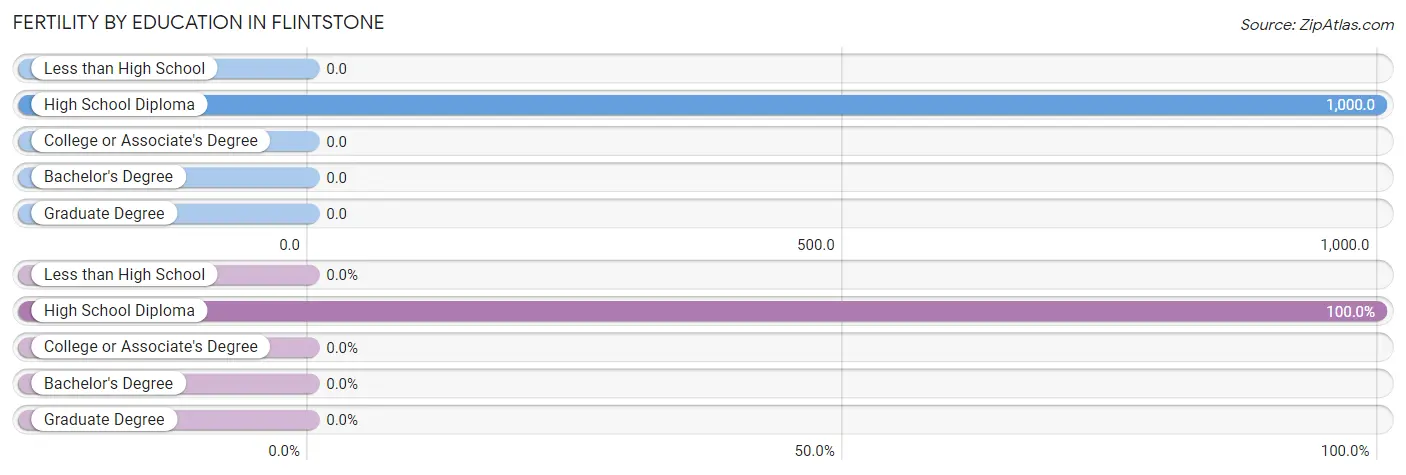
| Educational Attainment | Women with Births | Births / 1,000 Women |
| Less than High School | 0 (0.0%) | 0.0 |
| High School Diploma | 14 (100.0%) | 1,000.0 |
| College or Associate's Degree | 0 (0.0%) | 0.0 |
| Bachelor's Degree | 0 (0.0%) | 0.0 |
| Graduate Degree | 0 (0.0%) | 0.0 |
| Total | 14 (100.0%) | 280.0 |
Fertility by Education by Marriage Status in Flintstone
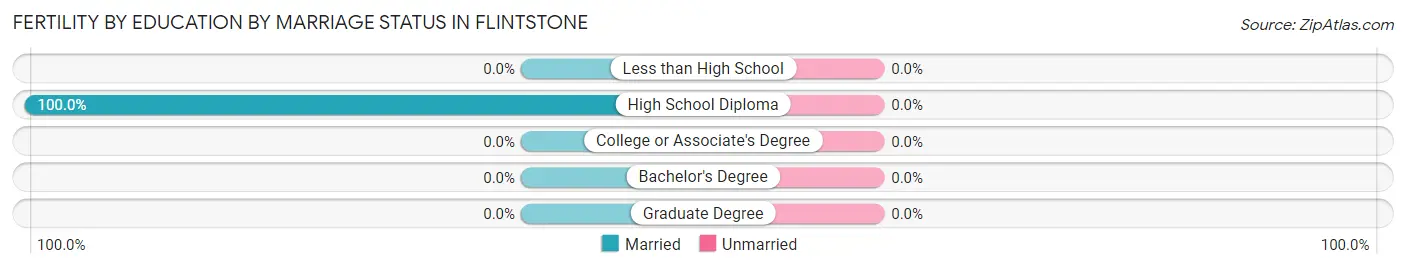
| Educational Attainment | Married | Unmarried |
| Less than High School | 0 (0.0%) | 0 (0.0%) |
| High School Diploma | 14 (100.0%) | 0 (0.0%) |
| College or Associate's Degree | 0 (0.0%) | 0 (0.0%) |
| Bachelor's Degree | 0 (0.0%) | 0 (0.0%) |
| Graduate Degree | 0 (0.0%) | 0 (0.0%) |
| Total | 14 (100.0%) | 0 (0.0%) |
Employment Characteristics in Flintstone
Employment by Class of Employer in Flintstone
Among the 40 employed individuals in Flintstone, private company employees (26 | 65.0%), and not-for-profit organizations (14 | 35.0%) make up the most common classes of employment.
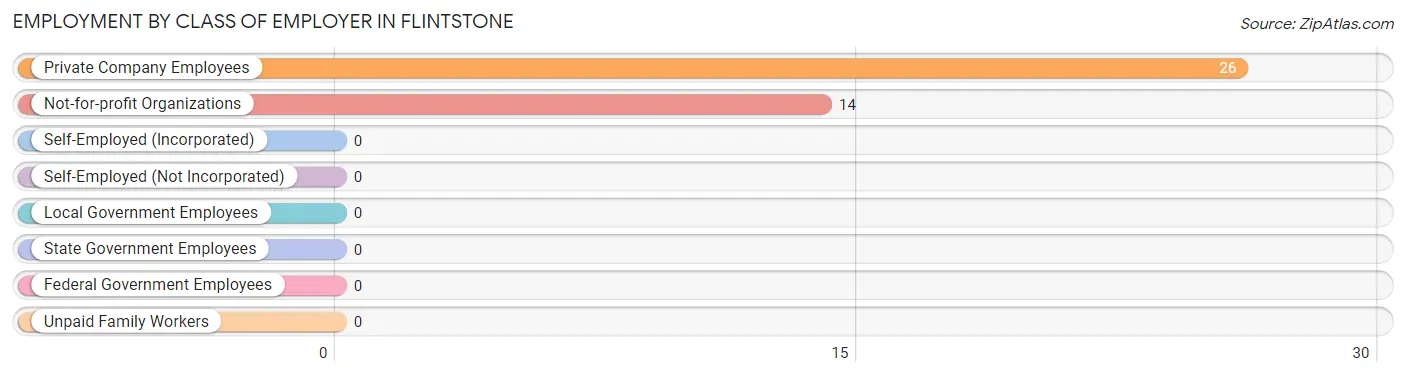
| Employer Class | # Employees | % Employees |
| Private Company Employees | 26 | 65.0% |
| Self-Employed (Incorporated) | 0 | 0.0% |
| Self-Employed (Not Incorporated) | 0 | 0.0% |
| Not-for-profit Organizations | 14 | 35.0% |
| Local Government Employees | 0 | 0.0% |
| State Government Employees | 0 | 0.0% |
| Federal Government Employees | 0 | 0.0% |
| Unpaid Family Workers | 0 | 0.0% |
| Total | 40 | 100.0% |
Employment Status by Age in Flintstone
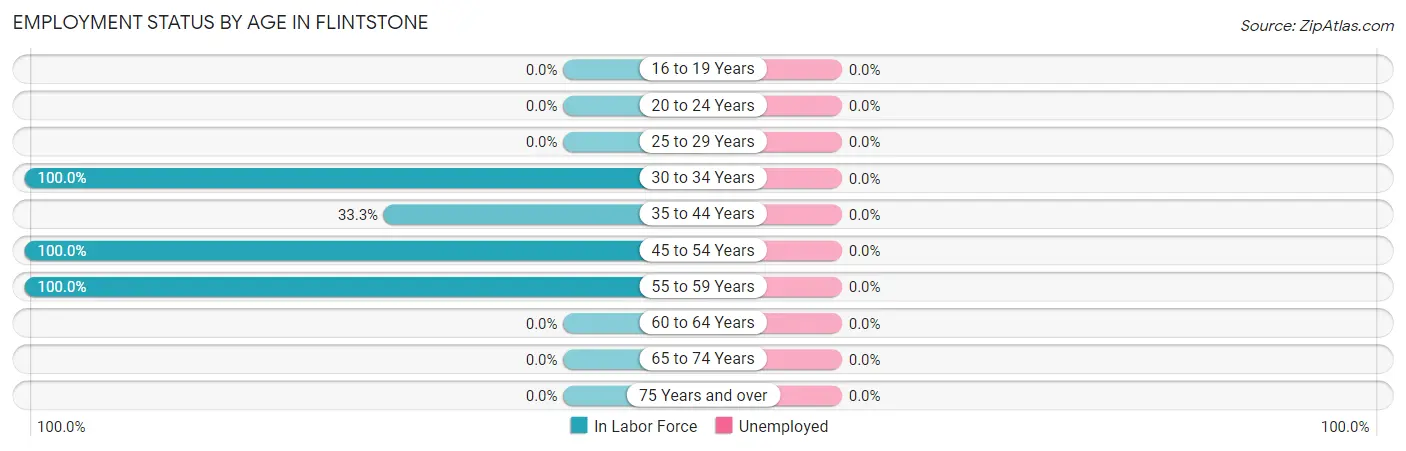
| Age Bracket | In Labor Force | Unemployed |
| 16 to 19 Years | 0 (0.0%) | 0 (0.0%) |
| 20 to 24 Years | 0 (0.0%) | 0 (0.0%) |
| 25 to 29 Years | 0 (0.0%) | 0 (0.0%) |
| 30 to 34 Years | 14 (100.0%) | 0 (0.0%) |
| 35 to 44 Years | 8 (33.3%) | 0 (0.0%) |
| 45 to 54 Years | 14 (100.0%) | 0 (0.0%) |
| 55 to 59 Years | 4 (100.0%) | 0 (0.0%) |
| 60 to 64 Years | 0 (0.0%) | 0 (0.0%) |
| 65 to 74 Years | 0 (0.0%) | 0 (0.0%) |
| 75 Years and over | 0 (0.0%) | 0 (0.0%) |
| Total | 40 (33.1%) | 0 (0.0%) |
Employment Status by Educational Attainment in Flintstone
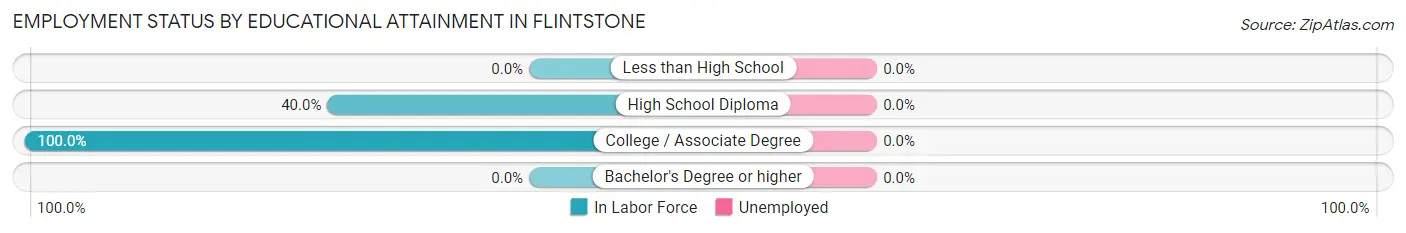
| Educational Attainment | In Labor Force | Unemployed |
| Less than High School | 0 (0.0%) | 0 (0.0%) |
| High School Diploma | 14 (40.0%) | 0 (0.0%) |
| College / Associate Degree | 26 (100.0%) | 0 (0.0%) |
| Bachelor's Degree or higher | 0 (0.0%) | 0 (0.0%) |
| Total | 40 (57.1%) | 0 (0.0%) |
Employment Occupations by Sex in Flintstone
Management, Business, Science and Arts Occupations
The most common Management, Business, Science and Arts occupations in Flintstone are Computers, Engineering & Science (8 | 20.0%), and Architecture & Engineering (8 | 20.0%).
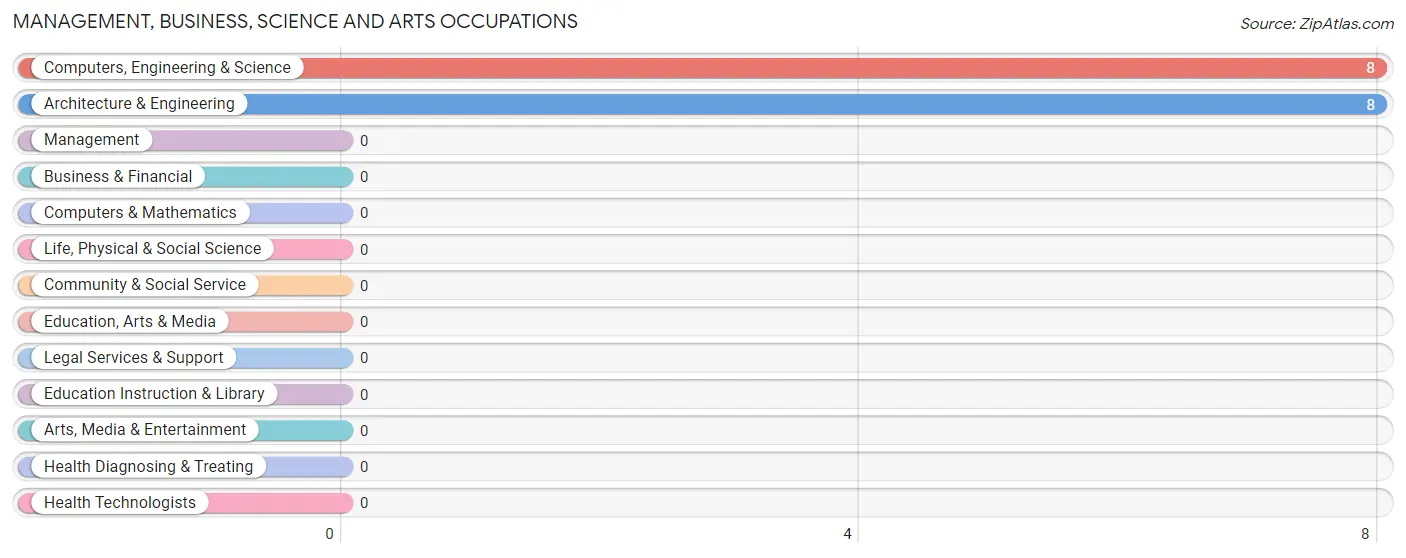
Management, Business, Science and Arts Occupations by Sex
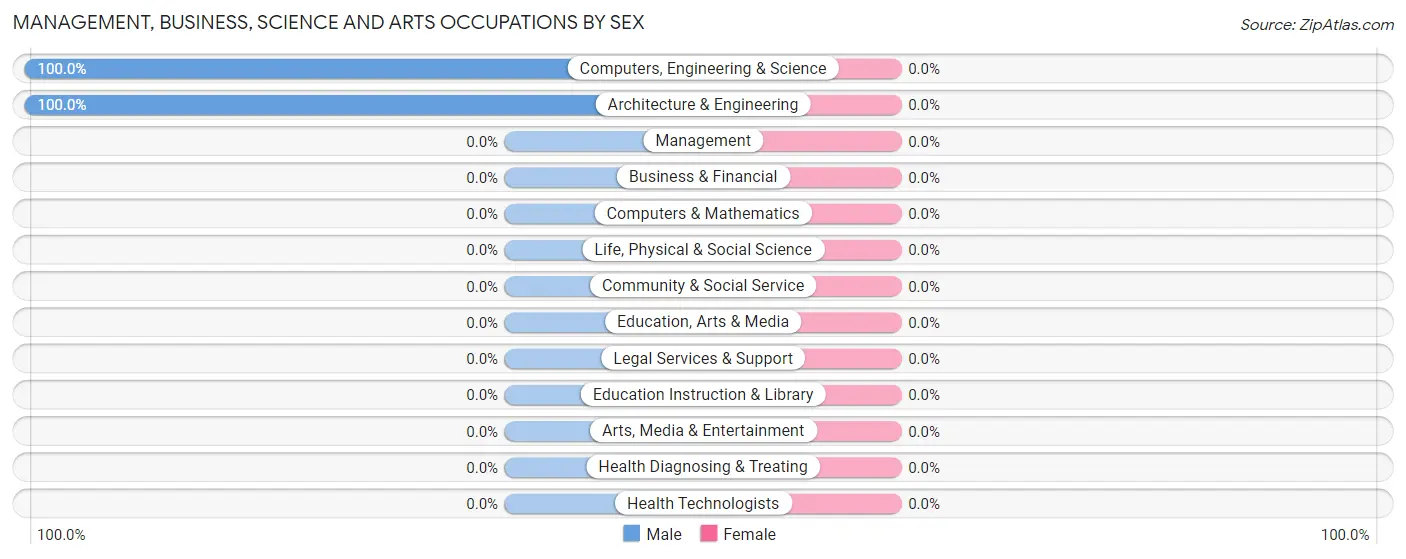
| Occupation | Male | Female |
| Management | 0 (0.0%) | 0 (0.0%) |
| Business & Financial | 0 (0.0%) | 0 (0.0%) |
| Computers, Engineering & Science | 8 (100.0%) | 0 (0.0%) |
| Computers & Mathematics | 0 (0.0%) | 0 (0.0%) |
| Architecture & Engineering | 8 (100.0%) | 0 (0.0%) |
| Life, Physical & Social Science | 0 (0.0%) | 0 (0.0%) |
| Community & Social Service | 0 (0.0%) | 0 (0.0%) |
| Education, Arts & Media | 0 (0.0%) | 0 (0.0%) |
| Legal Services & Support | 0 (0.0%) | 0 (0.0%) |
| Education Instruction & Library | 0 (0.0%) | 0 (0.0%) |
| Arts, Media & Entertainment | 0 (0.0%) | 0 (0.0%) |
| Health Diagnosing & Treating | 0 (0.0%) | 0 (0.0%) |
| Health Technologists | 0 (0.0%) | 0 (0.0%) |
| Total (Category) | 8 (100.0%) | 0 (0.0%) |
| Total (Overall) | 8 (20.0%) | 32 (80.0%) |
Services Occupations
The most common Services occupations in Flintstone are , and Healthcare Support (14 | 35.0%).
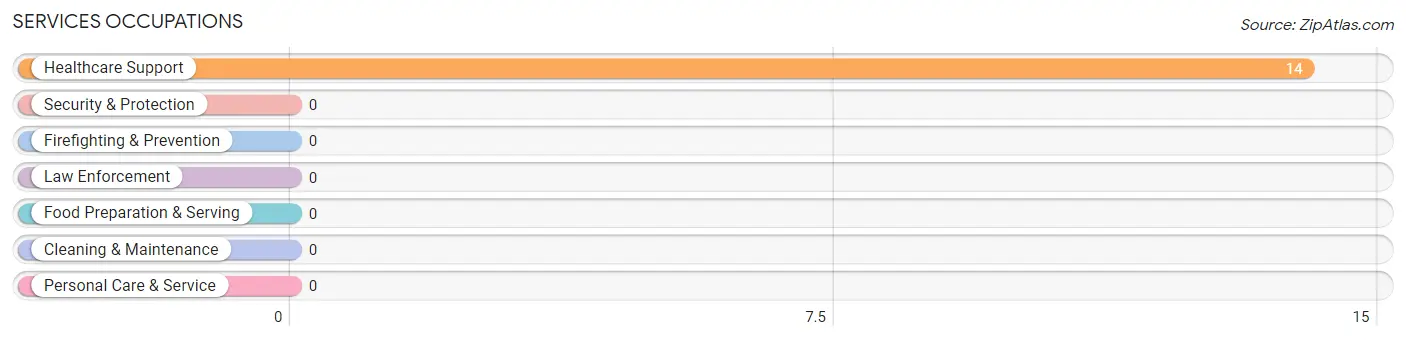
Services Occupations by Sex
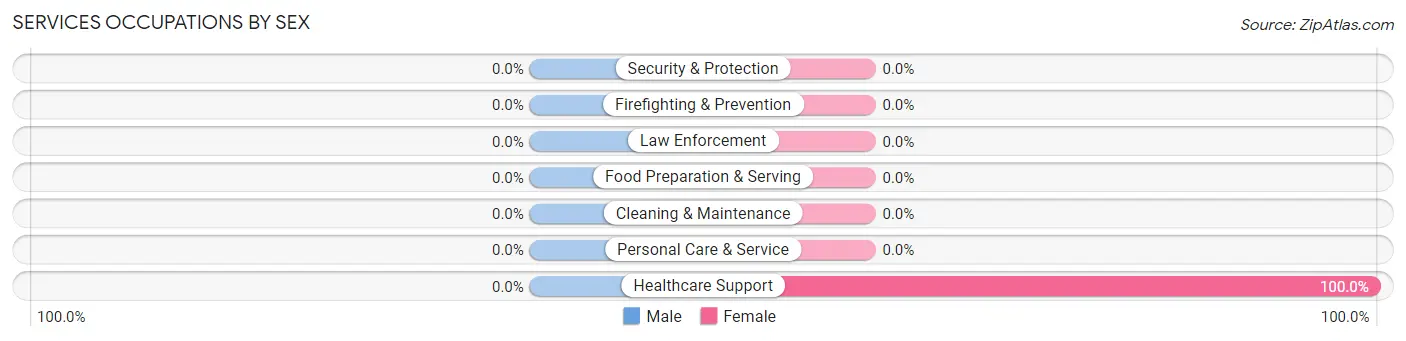
| Occupation | Male | Female |
| Healthcare Support | 0 (0.0%) | 14 (100.0%) |
| Security & Protection | 0 (0.0%) | 0 (0.0%) |
| Firefighting & Prevention | 0 (0.0%) | 0 (0.0%) |
| Law Enforcement | 0 (0.0%) | 0 (0.0%) |
| Food Preparation & Serving | 0 (0.0%) | 0 (0.0%) |
| Cleaning & Maintenance | 0 (0.0%) | 0 (0.0%) |
| Personal Care & Service | 0 (0.0%) | 0 (0.0%) |
| Total (Category) | 0 (0.0%) | 14 (100.0%) |
| Total (Overall) | 8 (20.0%) | 32 (80.0%) |
Sales and Office Occupations
The most common Sales and Office occupations in Flintstone are Sales & Related (14 | 35.0%), and Office & Administration (4 | 10.0%).
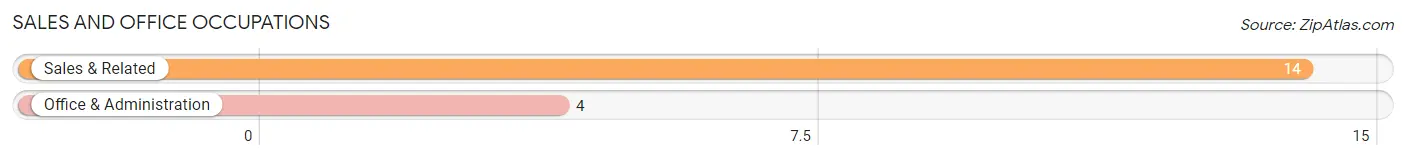
Sales and Office Occupations by Sex
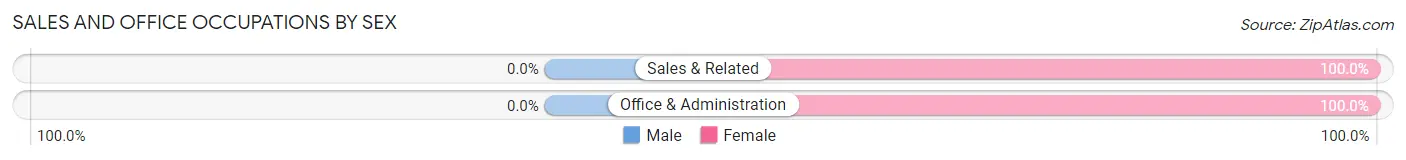
| Occupation | Male | Female |
| Sales & Related | 0 (0.0%) | 14 (100.0%) |
| Office & Administration | 0 (0.0%) | 4 (100.0%) |
| Total (Category) | 0 (0.0%) | 18 (100.0%) |
| Total (Overall) | 8 (20.0%) | 32 (80.0%) |
Natural Resources, Construction and Maintenance Occupations
Natural Resources, Construction and Maintenance Occupations by Sex
| Occupation | Male | Female |
| Farming, Fishing & Forestry | 0 (0.0%) | 0 (0.0%) |
| Construction & Extraction | 0 (0.0%) | 0 (0.0%) |
| Installation, Maintenance & Repair | 0 (0.0%) | 0 (0.0%) |
| Total (Category) | 0 (0.0%) | 0 (0.0%) |
| Total (Overall) | 8 (20.0%) | 32 (80.0%) |
Production, Transportation and Moving Occupations
Production, Transportation and Moving Occupations by Sex
| Occupation | Male | Female |
| Production | 0 (0.0%) | 0 (0.0%) |
| Transportation | 0 (0.0%) | 0 (0.0%) |
| Material Moving | 0 (0.0%) | 0 (0.0%) |
| Total (Category) | 0 (0.0%) | 0 (0.0%) |
| Total (Overall) | 8 (20.0%) | 32 (80.0%) |
Employment Industries by Sex in Flintstone
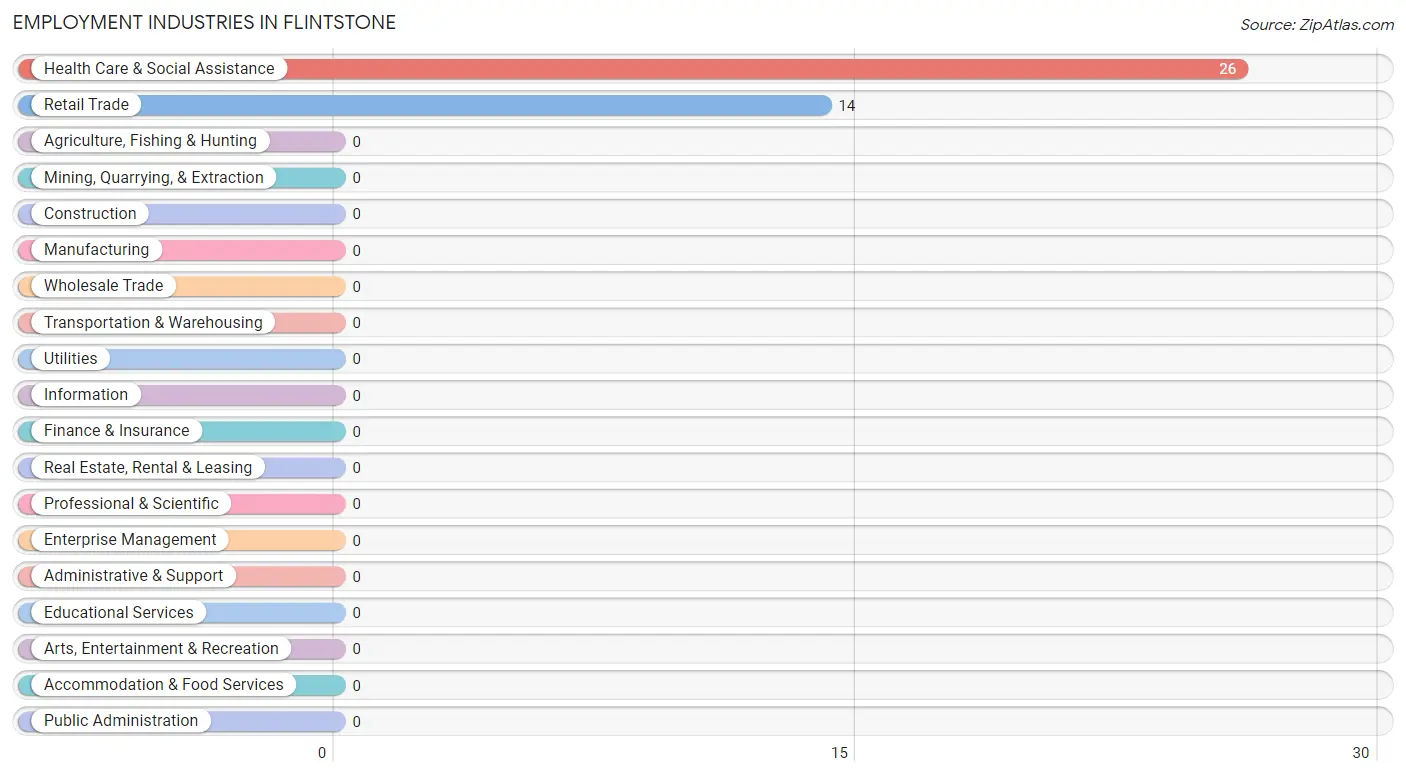
Employment Industries in Flintstone
The major employment industries in Flintstone include Health Care & Social Assistance (26 | 65.0%), and Retail Trade (14 | 35.0%).
Employment Industries by Sex in Flintstone
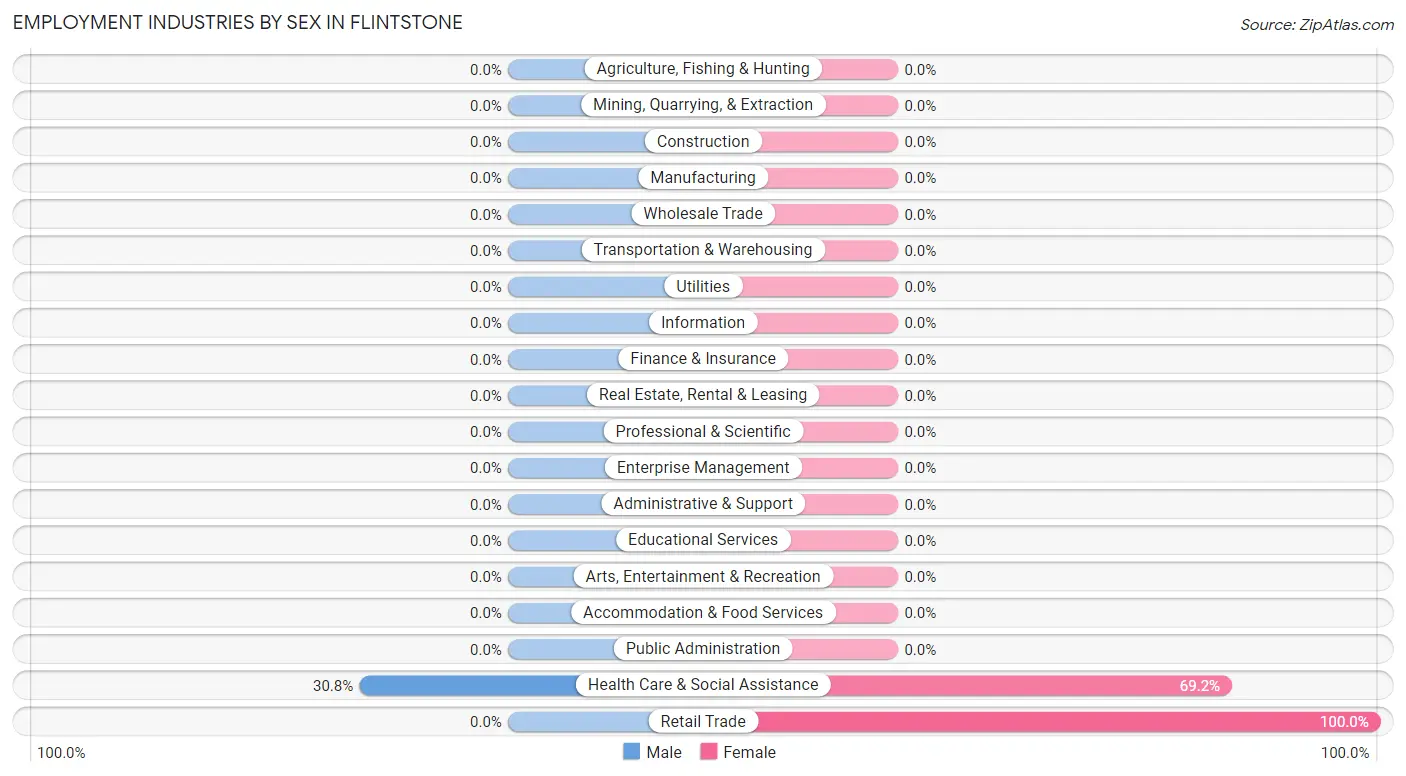
| Industry | Male | Female |
| Agriculture, Fishing & Hunting | 0 (0.0%) | 0 (0.0%) |
| Mining, Quarrying, & Extraction | 0 (0.0%) | 0 (0.0%) |
| Construction | 0 (0.0%) | 0 (0.0%) |
| Manufacturing | 0 (0.0%) | 0 (0.0%) |
| Wholesale Trade | 0 (0.0%) | 0 (0.0%) |
| Retail Trade | 0 (0.0%) | 14 (100.0%) |
| Transportation & Warehousing | 0 (0.0%) | 0 (0.0%) |
| Utilities | 0 (0.0%) | 0 (0.0%) |
| Information | 0 (0.0%) | 0 (0.0%) |
| Finance & Insurance | 0 (0.0%) | 0 (0.0%) |
| Real Estate, Rental & Leasing | 0 (0.0%) | 0 (0.0%) |
| Professional & Scientific | 0 (0.0%) | 0 (0.0%) |
| Enterprise Management | 0 (0.0%) | 0 (0.0%) |
| Administrative & Support | 0 (0.0%) | 0 (0.0%) |
| Educational Services | 0 (0.0%) | 0 (0.0%) |
| Health Care & Social Assistance | 8 (30.8%) | 18 (69.2%) |
| Arts, Entertainment & Recreation | 0 (0.0%) | 0 (0.0%) |
| Accommodation & Food Services | 0 (0.0%) | 0 (0.0%) |
| Public Administration | 0 (0.0%) | 0 (0.0%) |
| Total | 8 (20.0%) | 32 (80.0%) |
Education in Flintstone
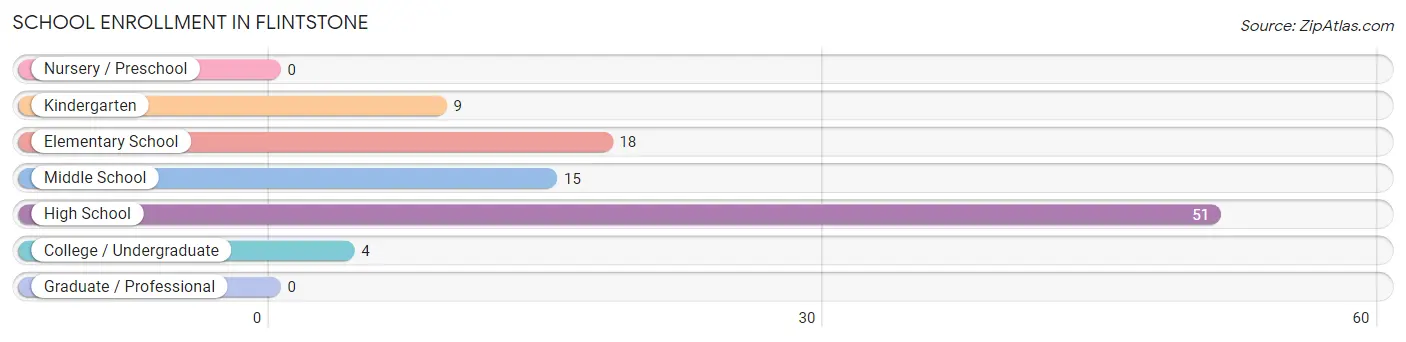
School Enrollment in Flintstone
The most common levels of schooling among the 97 students in Flintstone are high school (51 | 52.6%), elementary school (18 | 18.6%), and middle school (15 | 15.5%).
| School Level | # Students | % Students |
| Nursery / Preschool | 0 | 0.0% |
| Kindergarten | 9 | 9.3% |
| Elementary School | 18 | 18.6% |
| Middle School | 15 | 15.5% |
| High School | 51 | 52.6% |
| College / Undergraduate | 4 | 4.1% |
| Graduate / Professional | 0 | 0.0% |
| Total | 97 | 100.0% |
School Enrollment by Age by Funding Source in Flintstone
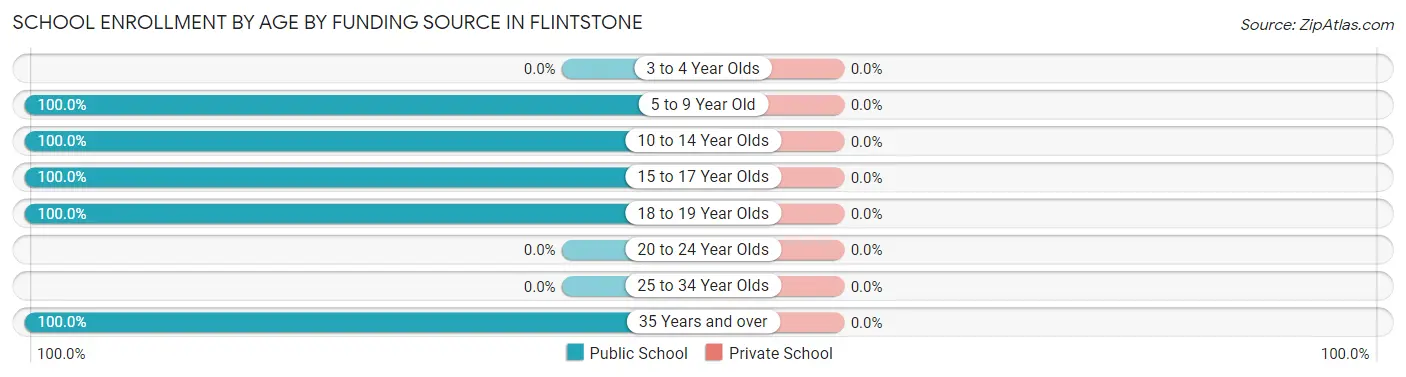
| Age Bracket | Public School | Private School |
| 3 to 4 Year Olds | 0 (0.0%) | 0 (0.0%) |
| 5 to 9 Year Old | 27 (100.0%) | 0 (0.0%) |
| 10 to 14 Year Olds | 15 (100.0%) | 0 (0.0%) |
| 15 to 17 Year Olds | 29 (100.0%) | 0 (0.0%) |
| 18 to 19 Year Olds | 22 (100.0%) | 0 (0.0%) |
| 20 to 24 Year Olds | 0 (0.0%) | 0 (0.0%) |
| 25 to 34 Year Olds | 0 (0.0%) | 0 (0.0%) |
| 35 Years and over | 4 (100.0%) | 0 (0.0%) |
| Total | 97 (100.0%) | 0 (0.0%) |
Educational Attainment by Field of Study in Flintstone
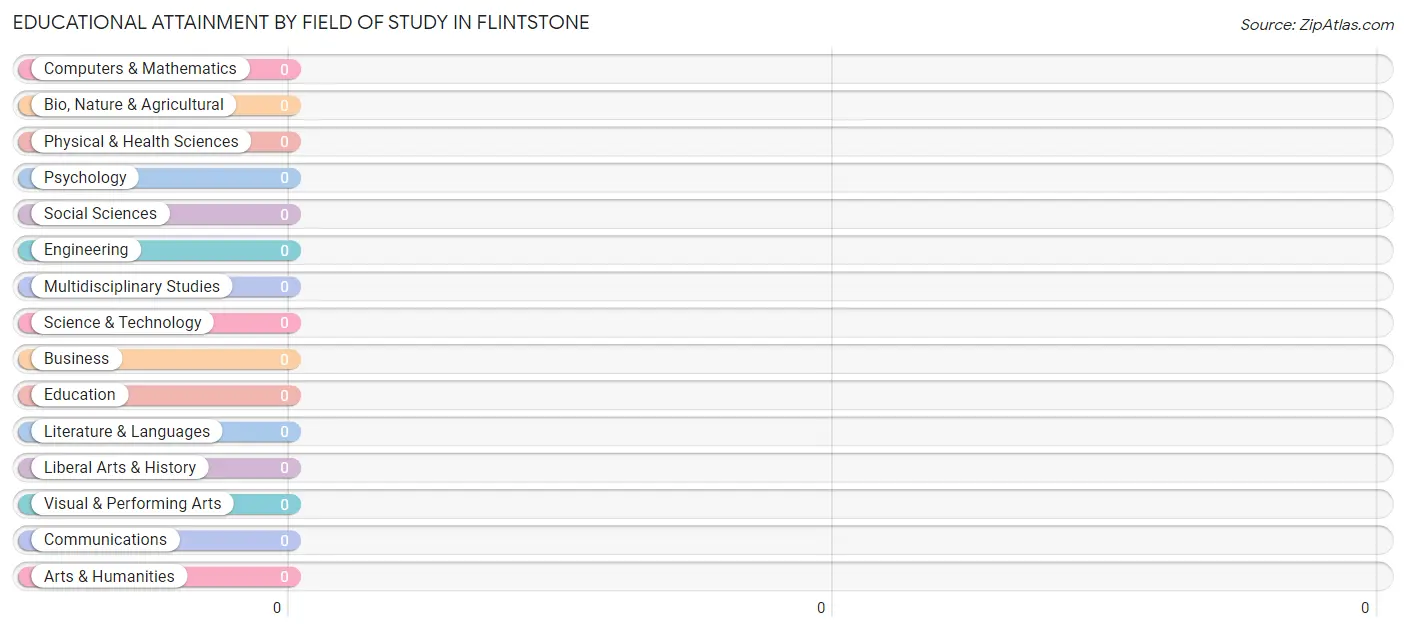
| Field of Study | # Graduates | % Graduates |
| Computers & Mathematics | 0 | 0.0% |
| Bio, Nature & Agricultural | 0 | 0.0% |
| Physical & Health Sciences | 0 | 0.0% |
| Psychology | 0 | 0.0% |
| Social Sciences | 0 | 0.0% |
| Engineering | 0 | 0.0% |
| Multidisciplinary Studies | 0 | 0.0% |
| Science & Technology | 0 | 0.0% |
| Business | 0 | 0.0% |
| Education | 0 | 0.0% |
| Literature & Languages | 0 | 0.0% |
| Liberal Arts & History | 0 | 0.0% |
| Visual & Performing Arts | 0 | 0.0% |
| Communications | 0 | 0.0% |
| Arts & Humanities | 0 | 0.0% |
| Total | 0 | 0.0% |
Transportation & Commute in Flintstone
Vehicle Availability by Sex in Flintstone
The most prevalent vehicle ownership categories in Flintstone are males with 2 vehicles (8, accounting for 100.0%) and females with 2 vehicles (4, making up 25.0%).
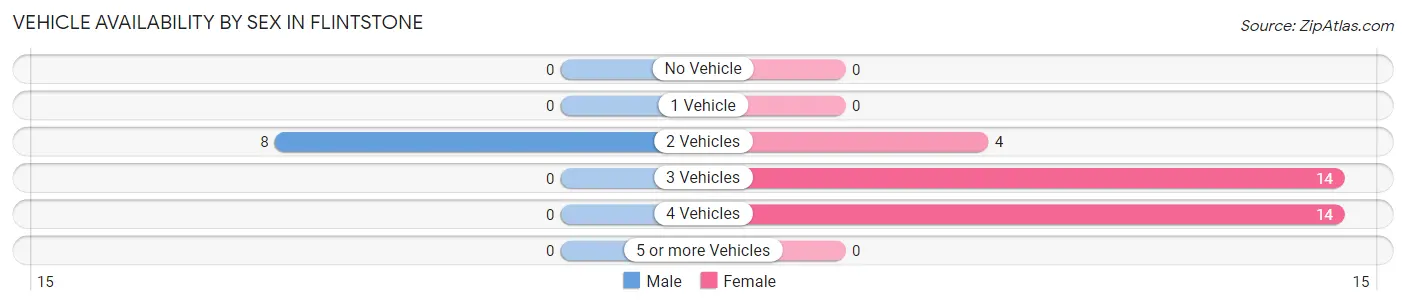
| Vehicles Available | Male | Female |
| No Vehicle | 0 (0.0%) | 0 (0.0%) |
| 1 Vehicle | 0 (0.0%) | 0 (0.0%) |
| 2 Vehicles | 8 (100.0%) | 4 (12.5%) |
| 3 Vehicles | 0 (0.0%) | 14 (43.8%) |
| 4 Vehicles | 0 (0.0%) | 14 (43.8%) |
| 5 or more Vehicles | 0 (0.0%) | 0 (0.0%) |
| Total | 8 (100.0%) | 32 (100.0%) |
Commute Time in Flintstone
The most frequently occuring commute durations in Flintstone are less than 5 minutes (14 commuters, 43.8%), 10 to 14 minutes (14 commuters, 43.8%), and 15 to 19 minutes (4 commuters, 12.5%).
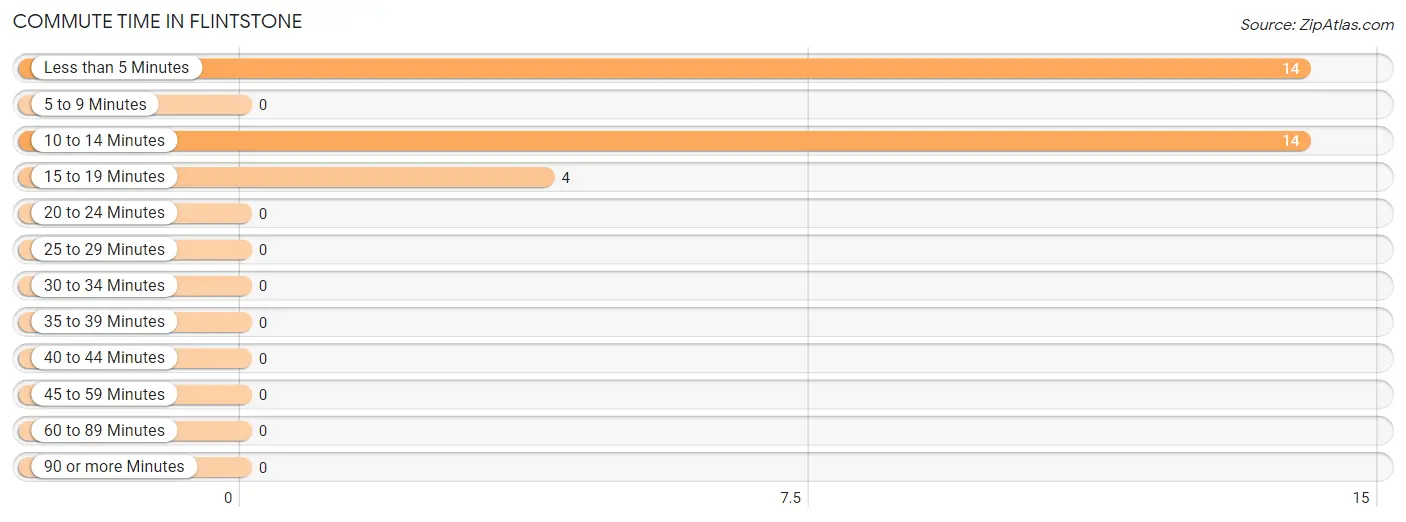
| Commute Time | # Commuters | % Commuters |
| Less than 5 Minutes | 14 | 43.8% |
| 5 to 9 Minutes | 0 | 0.0% |
| 10 to 14 Minutes | 14 | 43.8% |
| 15 to 19 Minutes | 4 | 12.5% |
| 20 to 24 Minutes | 0 | 0.0% |
| 25 to 29 Minutes | 0 | 0.0% |
| 30 to 34 Minutes | 0 | 0.0% |
| 35 to 39 Minutes | 0 | 0.0% |
| 40 to 44 Minutes | 0 | 0.0% |
| 45 to 59 Minutes | 0 | 0.0% |
| 60 to 89 Minutes | 0 | 0.0% |
| 90 or more Minutes | 0 | 0.0% |
Commute Time by Sex in Flintstone
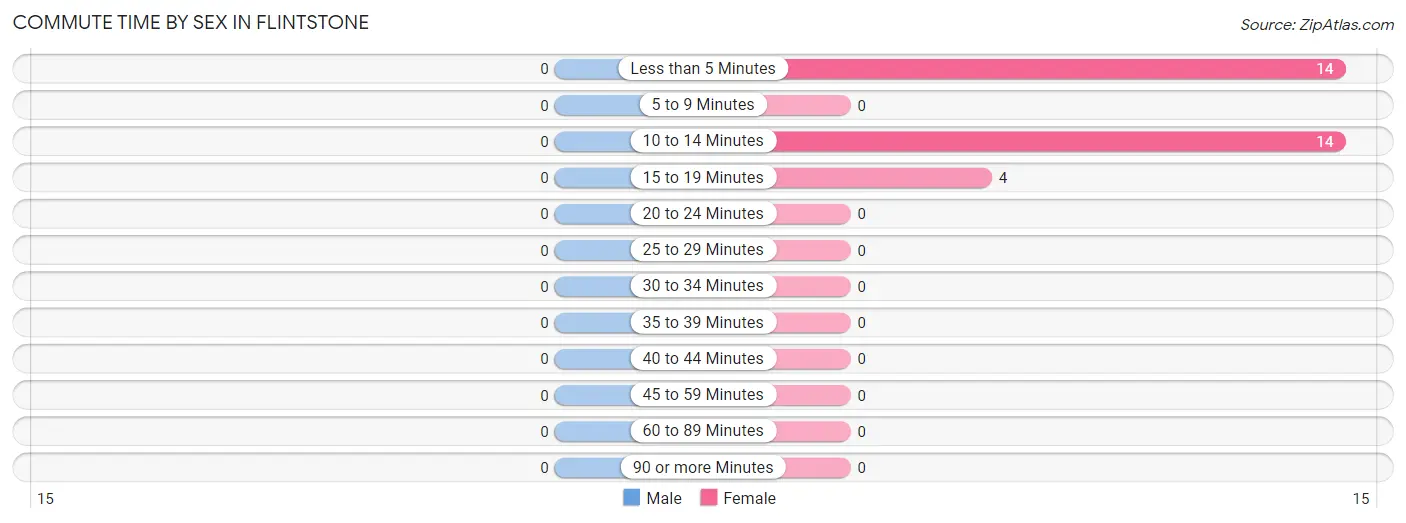
| Commute Time | Male | Female |
| Less than 5 Minutes | 0 (0.0%) | 14 (43.8%) |
| 5 to 9 Minutes | 0 (0.0%) | 0 (0.0%) |
| 10 to 14 Minutes | 0 (0.0%) | 14 (43.8%) |
| 15 to 19 Minutes | 0 (0.0%) | 4 (12.5%) |
| 20 to 24 Minutes | 0 (0.0%) | 0 (0.0%) |
| 25 to 29 Minutes | 0 (0.0%) | 0 (0.0%) |
| 30 to 34 Minutes | 0 (0.0%) | 0 (0.0%) |
| 35 to 39 Minutes | 0 (0.0%) | 0 (0.0%) |
| 40 to 44 Minutes | 0 (0.0%) | 0 (0.0%) |
| 45 to 59 Minutes | 0 (0.0%) | 0 (0.0%) |
| 60 to 89 Minutes | 0 (0.0%) | 0 (0.0%) |
| 90 or more Minutes | 0 (0.0%) | 0 (0.0%) |
Time of Departure to Work by Sex in Flintstone
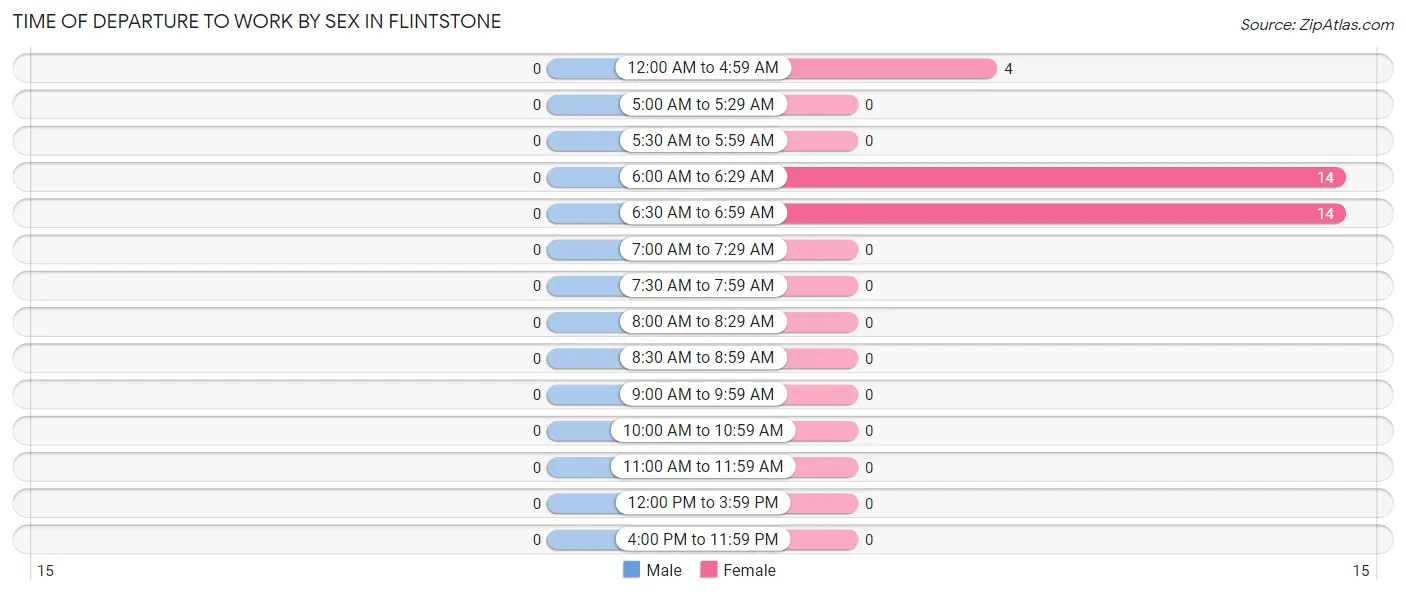
| Time of Departure | Male | Female |
| 12:00 AM to 4:59 AM | 0 (0.0%) | 4 (12.5%) |
| 5:00 AM to 5:29 AM | 0 (0.0%) | 0 (0.0%) |
| 5:30 AM to 5:59 AM | 0 (0.0%) | 0 (0.0%) |
| 6:00 AM to 6:29 AM | 0 (0.0%) | 14 (43.8%) |
| 6:30 AM to 6:59 AM | 0 (0.0%) | 14 (43.8%) |
| 7:00 AM to 7:29 AM | 0 (0.0%) | 0 (0.0%) |
| 7:30 AM to 7:59 AM | 0 (0.0%) | 0 (0.0%) |
| 8:00 AM to 8:29 AM | 0 (0.0%) | 0 (0.0%) |
| 8:30 AM to 8:59 AM | 0 (0.0%) | 0 (0.0%) |
| 9:00 AM to 9:59 AM | 0 (0.0%) | 0 (0.0%) |
| 10:00 AM to 10:59 AM | 0 (0.0%) | 0 (0.0%) |
| 11:00 AM to 11:59 AM | 0 (0.0%) | 0 (0.0%) |
| 12:00 PM to 3:59 PM | 0 (0.0%) | 0 (0.0%) |
| 4:00 PM to 11:59 PM | 0 (0.0%) | 0 (0.0%) |
| Total | 0 (0.0%) | 32 (100.0%) |
Housing Occupancy in Flintstone
Occupancy by Ownership in Flintstone
Of the total 44 dwellings in Flintstone, owner-occupied units account for 5 (11.4%), while renter-occupied units make up 39 (88.6%).
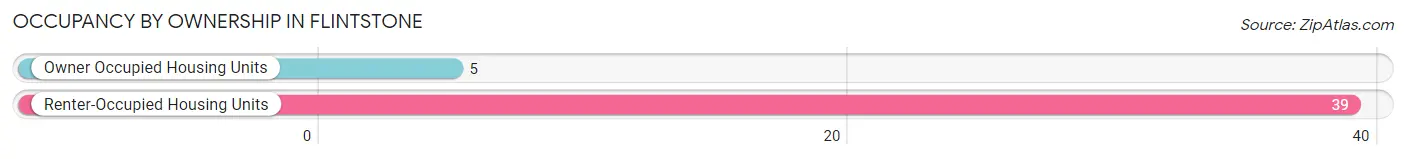
| Occupancy | # Housing Units | % Housing Units |
| Owner Occupied Housing Units | 5 | 11.4% |
| Renter-Occupied Housing Units | 39 | 88.6% |
| Total Occupied Housing Units | 44 | 100.0% |
Occupancy by Household Size in Flintstone
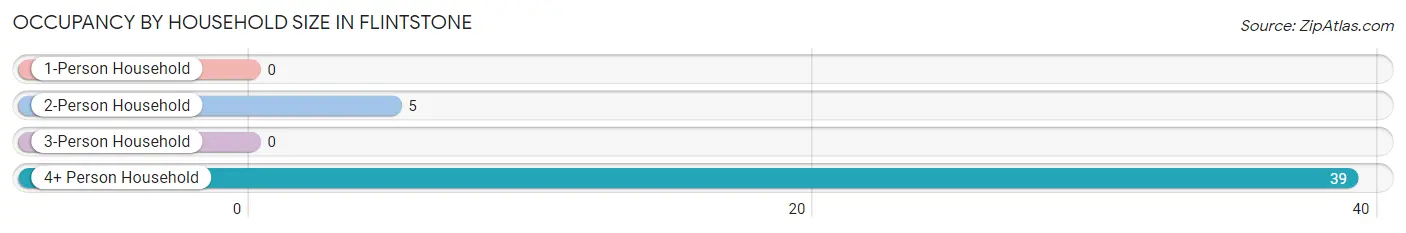
| Household Size | # Housing Units | % Housing Units |
| 1-Person Household | 0 | 0.0% |
| 2-Person Household | 5 | 11.4% |
| 3-Person Household | 0 | 0.0% |
| 4+ Person Household | 39 | 88.6% |
| Total Housing Units | 44 | 100.0% |
Occupancy by Ownership by Household Size in Flintstone
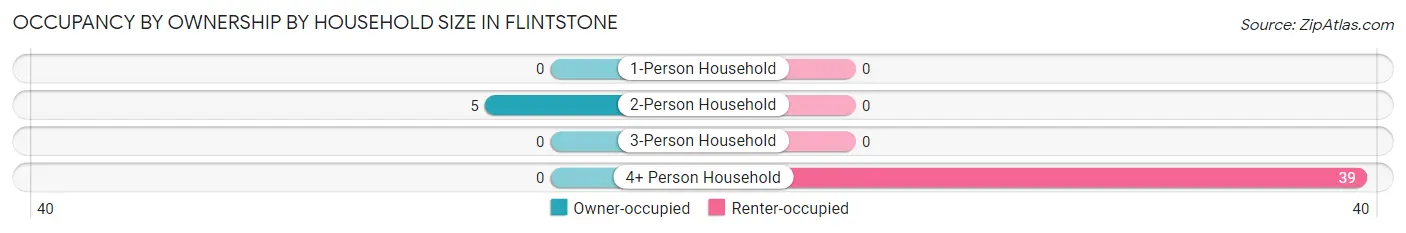
| Household Size | Owner-occupied | Renter-occupied |
| 1-Person Household | 0 (0.0%) | 0 (0.0%) |
| 2-Person Household | 5 (100.0%) | 0 (0.0%) |
| 3-Person Household | 0 (0.0%) | 0 (0.0%) |
| 4+ Person Household | 0 (0.0%) | 39 (100.0%) |
| Total Housing Units | 5 (11.4%) | 39 (88.6%) |
Occupancy by Educational Attainment in Flintstone
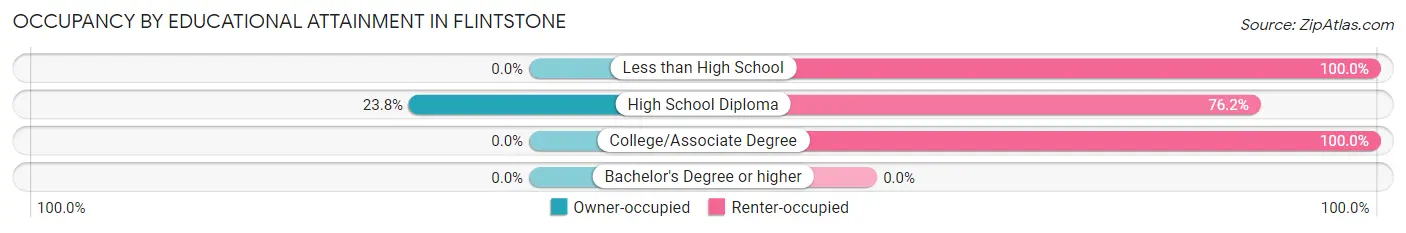
| Household Size | Owner-occupied | Renter-occupied |
| Less than High School | 0 (0.0%) | 9 (100.0%) |
| High School Diploma | 5 (23.8%) | 16 (76.2%) |
| College/Associate Degree | 0 (0.0%) | 14 (100.0%) |
| Bachelor's Degree or higher | 0 (0.0%) | 0 (0.0%) |
Occupancy by Age of Householder in Flintstone
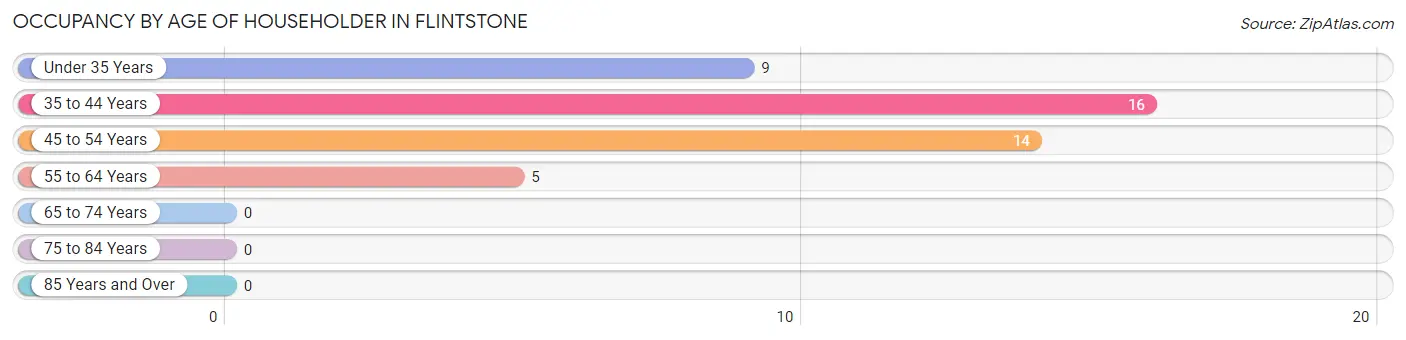
| Age Bracket | # Households | % Households |
| Under 35 Years | 9 | 20.4% |
| 35 to 44 Years | 16 | 36.4% |
| 45 to 54 Years | 14 | 31.8% |
| 55 to 64 Years | 5 | 11.4% |
| 65 to 74 Years | 0 | 0.0% |
| 75 to 84 Years | 0 | 0.0% |
| 85 Years and Over | 0 | 0.0% |
| Total | 44 | 100.0% |
Housing Finances in Flintstone
Median Income by Occupancy in Flintstone
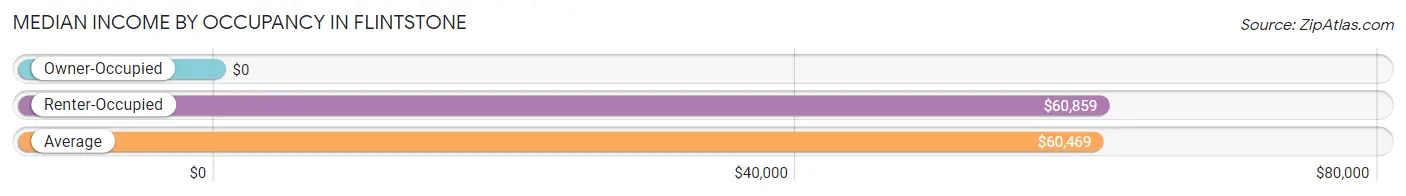
| Occupancy Type | # Households | Median Income |
| Owner-Occupied | 5 (11.4%) | $0 |
| Renter-Occupied | 39 (88.6%) | $60,859 |
| Average | 44 (100.0%) | $60,469 |
Occupancy by Householder Income Bracket in Flintstone
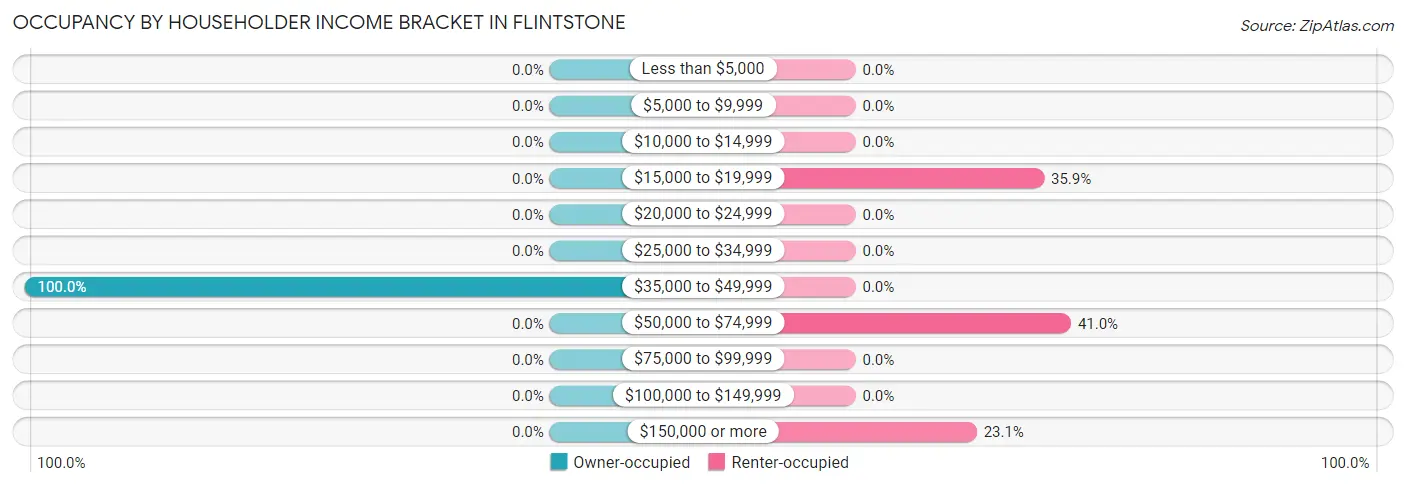
| Income Bracket | Owner-occupied | Renter-occupied |
| Less than $5,000 | 0 (0.0%) | 0 (0.0%) |
| $5,000 to $9,999 | 0 (0.0%) | 0 (0.0%) |
| $10,000 to $14,999 | 0 (0.0%) | 0 (0.0%) |
| $15,000 to $19,999 | 0 (0.0%) | 14 (35.9%) |
| $20,000 to $24,999 | 0 (0.0%) | 0 (0.0%) |
| $25,000 to $34,999 | 0 (0.0%) | 0 (0.0%) |
| $35,000 to $49,999 | 5 (100.0%) | 0 (0.0%) |
| $50,000 to $74,999 | 0 (0.0%) | 16 (41.0%) |
| $75,000 to $99,999 | 0 (0.0%) | 0 (0.0%) |
| $100,000 to $149,999 | 0 (0.0%) | 0 (0.0%) |
| $150,000 or more | 0 (0.0%) | 9 (23.1%) |
| Total | 5 (100.0%) | 39 (100.0%) |
Monthly Housing Cost Tiers in Flintstone
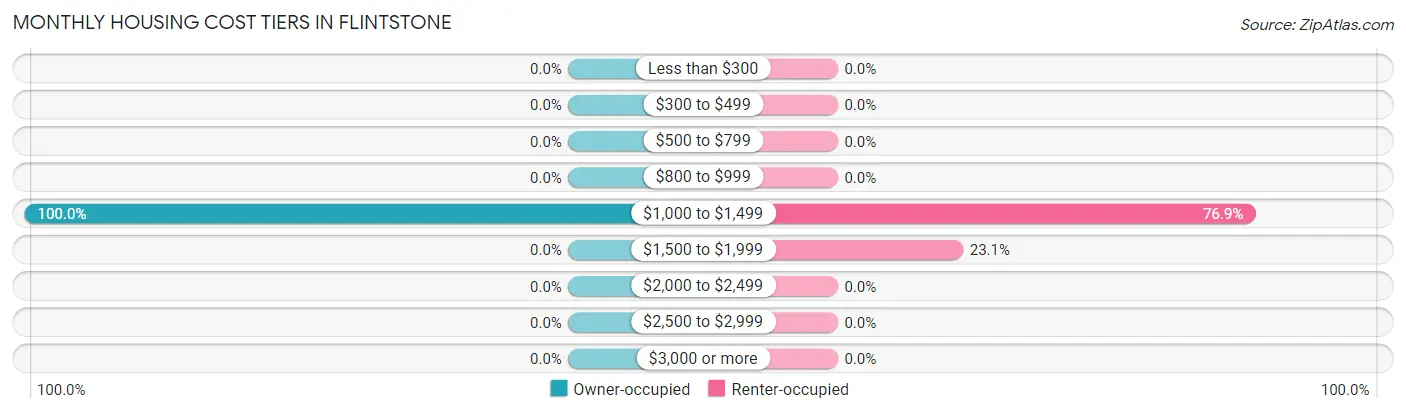
| Monthly Cost | Owner-occupied | Renter-occupied |
| Less than $300 | 0 (0.0%) | 0 (0.0%) |
| $300 to $499 | 0 (0.0%) | 0 (0.0%) |
| $500 to $799 | 0 (0.0%) | 0 (0.0%) |
| $800 to $999 | 0 (0.0%) | 0 (0.0%) |
| $1,000 to $1,499 | 5 (100.0%) | 30 (76.9%) |
| $1,500 to $1,999 | 0 (0.0%) | 9 (23.1%) |
| $2,000 to $2,499 | 0 (0.0%) | 0 (0.0%) |
| $2,500 to $2,999 | 0 (0.0%) | 0 (0.0%) |
| $3,000 or more | 0 (0.0%) | 0 (0.0%) |
| Total | 5 (100.0%) | 39 (100.0%) |
Physical Housing Characteristics in Flintstone
Housing Structures in Flintstone
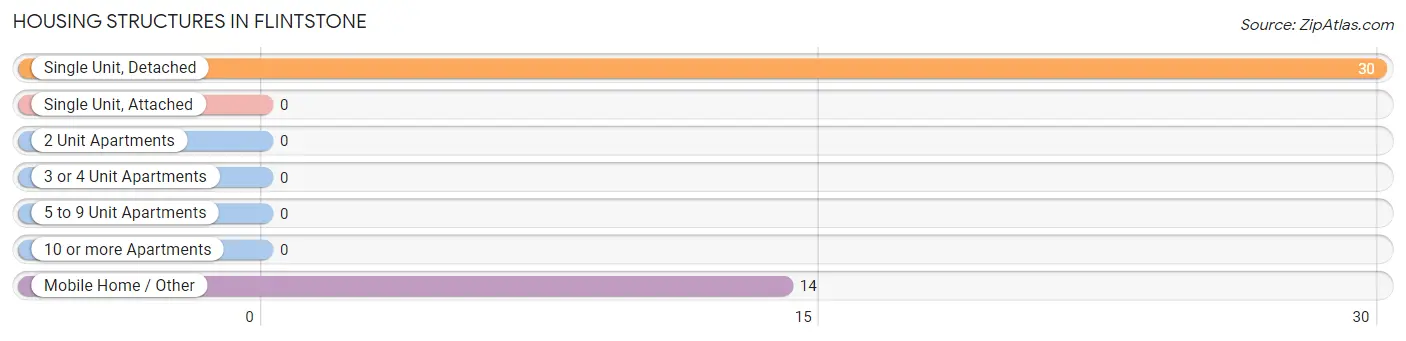
| Structure Type | # Housing Units | % Housing Units |
| Single Unit, Detached | 30 | 68.2% |
| Single Unit, Attached | 0 | 0.0% |
| 2 Unit Apartments | 0 | 0.0% |
| 3 or 4 Unit Apartments | 0 | 0.0% |
| 5 to 9 Unit Apartments | 0 | 0.0% |
| 10 or more Apartments | 0 | 0.0% |
| Mobile Home / Other | 14 | 31.8% |
| Total | 44 | 100.0% |
Housing Structures by Occupancy in Flintstone
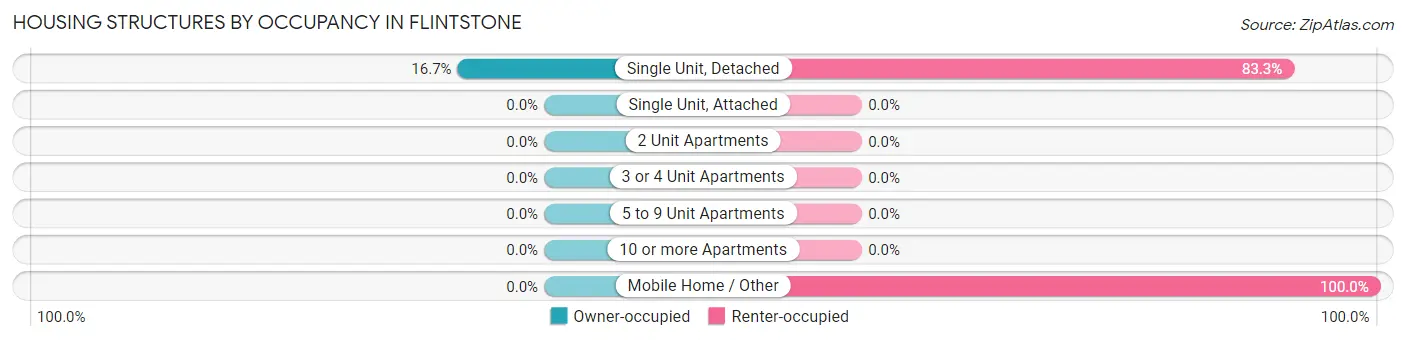
| Structure Type | Owner-occupied | Renter-occupied |
| Single Unit, Detached | 5 (16.7%) | 25 (83.3%) |
| Single Unit, Attached | 0 (0.0%) | 0 (0.0%) |
| 2 Unit Apartments | 0 (0.0%) | 0 (0.0%) |
| 3 or 4 Unit Apartments | 0 (0.0%) | 0 (0.0%) |
| 5 to 9 Unit Apartments | 0 (0.0%) | 0 (0.0%) |
| 10 or more Apartments | 0 (0.0%) | 0 (0.0%) |
| Mobile Home / Other | 0 (0.0%) | 14 (100.0%) |
| Total | 5 (11.4%) | 39 (88.6%) |
Housing Structures by Number of Rooms in Flintstone
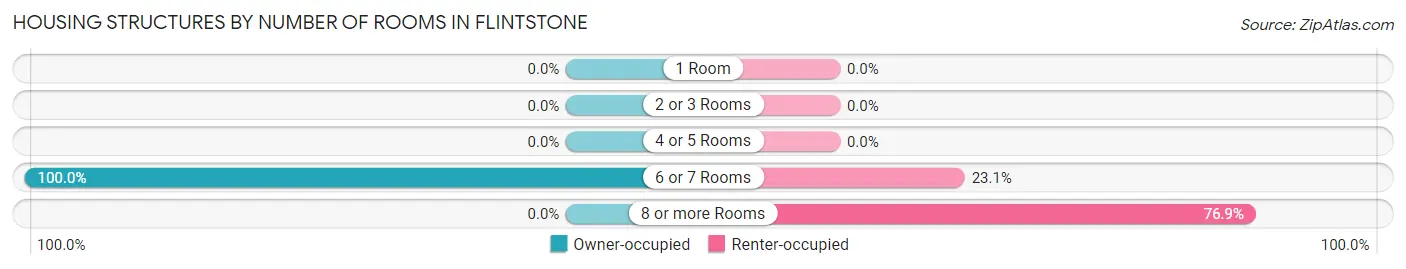
| Number of Rooms | Owner-occupied | Renter-occupied |
| 1 Room | 0 (0.0%) | 0 (0.0%) |
| 2 or 3 Rooms | 0 (0.0%) | 0 (0.0%) |
| 4 or 5 Rooms | 0 (0.0%) | 0 (0.0%) |
| 6 or 7 Rooms | 5 (100.0%) | 9 (23.1%) |
| 8 or more Rooms | 0 (0.0%) | 30 (76.9%) |
| Total | 5 (100.0%) | 39 (100.0%) |
Housing Structure by Heating Type in Flintstone
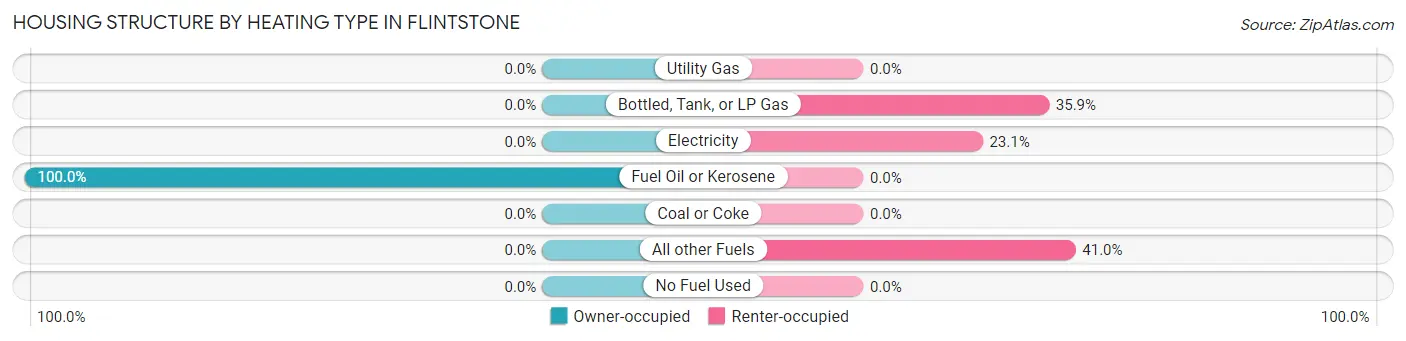
| Heating Type | Owner-occupied | Renter-occupied |
| Utility Gas | 0 (0.0%) | 0 (0.0%) |
| Bottled, Tank, or LP Gas | 0 (0.0%) | 14 (35.9%) |
| Electricity | 0 (0.0%) | 9 (23.1%) |
| Fuel Oil or Kerosene | 5 (100.0%) | 0 (0.0%) |
| Coal or Coke | 0 (0.0%) | 0 (0.0%) |
| All other Fuels | 0 (0.0%) | 16 (41.0%) |
| No Fuel Used | 0 (0.0%) | 0 (0.0%) |
| Total | 5 (100.0%) | 39 (100.0%) |
Household Vehicle Usage in Flintstone
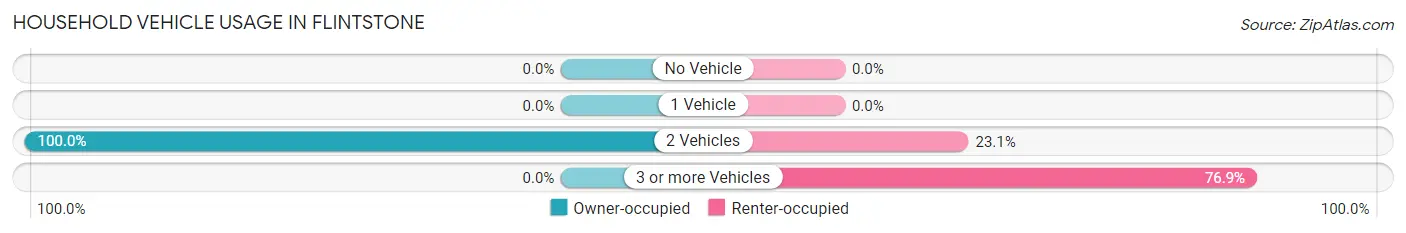
| Vehicles per Household | Owner-occupied | Renter-occupied |
| No Vehicle | 0 (0.0%) | 0 (0.0%) |
| 1 Vehicle | 0 (0.0%) | 0 (0.0%) |
| 2 Vehicles | 5 (100.0%) | 9 (23.1%) |
| 3 or more Vehicles | 0 (0.0%) | 30 (76.9%) |
| Total | 5 (100.0%) | 39 (100.0%) |
Real Estate & Mortgages in Flintstone
Real Estate and Mortgage Overview in Flintstone
| Characteristic | Without Mortgage | With Mortgage |
| Housing Units | 0 | 5 |
| Median Property Value | - | - |
| Median Household Income | - | - |
| Monthly Housing Costs | - | - |
| Real Estate Taxes | - | - |
Property Value by Mortgage Status in Flintstone
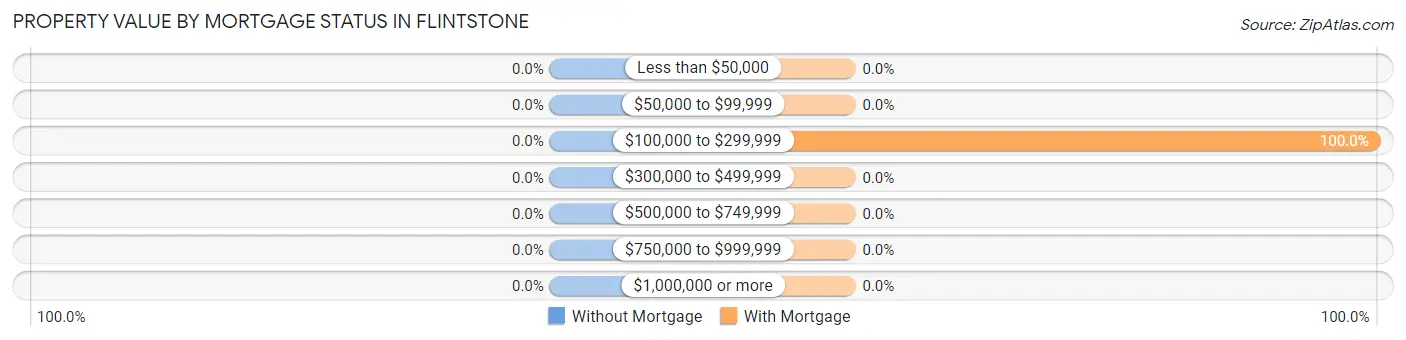
| Property Value | Without Mortgage | With Mortgage |
| Less than $50,000 | 0 (0.0%) | 0 (0.0%) |
| $50,000 to $99,999 | 0 (0.0%) | 0 (0.0%) |
| $100,000 to $299,999 | 0 (0.0%) | 5 (100.0%) |
| $300,000 to $499,999 | 0 (0.0%) | 0 (0.0%) |
| $500,000 to $749,999 | 0 (0.0%) | 0 (0.0%) |
| $750,000 to $999,999 | 0 (0.0%) | 0 (0.0%) |
| $1,000,000 or more | 0 (0.0%) | 0 (0.0%) |
| Total | 0 (0.0%) | 5 (100.0%) |
Household Income by Mortgage Status in Flintstone
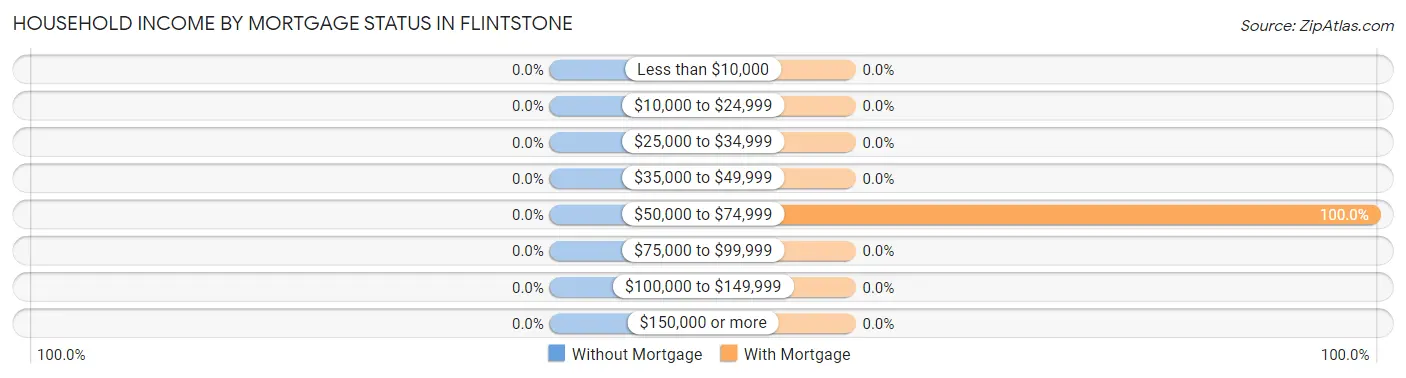
| Household Income | Without Mortgage | With Mortgage |
| Less than $10,000 | 0 (0.0%) | 0 (0.0%) |
| $10,000 to $24,999 | 0 (0.0%) | 0 (0.0%) |
| $25,000 to $34,999 | 0 (0.0%) | 0 (0.0%) |
| $35,000 to $49,999 | 0 (0.0%) | 0 (0.0%) |
| $50,000 to $74,999 | 0 (0.0%) | 5 (100.0%) |
| $75,000 to $99,999 | 0 (0.0%) | 0 (0.0%) |
| $100,000 to $149,999 | 0 (0.0%) | 0 (0.0%) |
| $150,000 or more | 0 (0.0%) | 0 (0.0%) |
| Total | 0 (0.0%) | 5 (100.0%) |
Property Value to Household Income Ratio in Flintstone
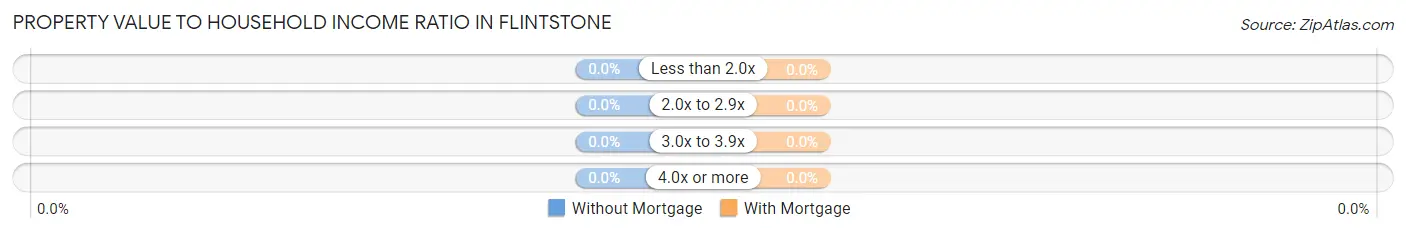
| Value-to-Income Ratio | Without Mortgage | With Mortgage |
| Less than 2.0x | 0 (0.0%) | 0 (0.0%) |
| 2.0x to 2.9x | 0 (0.0%) | 0 (0.0%) |
| 3.0x to 3.9x | 0 (0.0%) | 0 (0.0%) |
| 4.0x or more | 0 (0.0%) | 0 (0.0%) |
| Total | 0 (0.0%) | 5 (100.0%) |
Real Estate Taxes by Mortgage Status in Flintstone
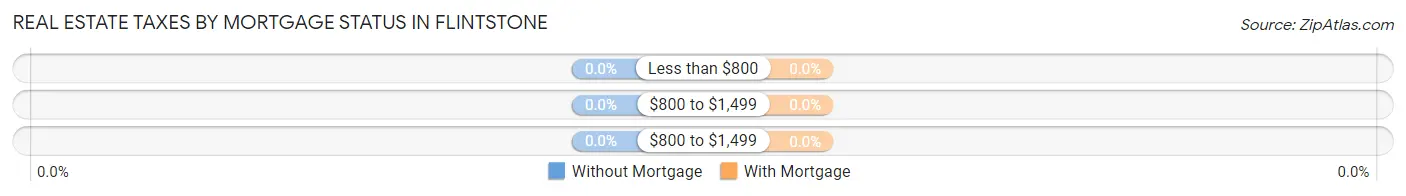
| Property Taxes | Without Mortgage | With Mortgage |
| Less than $800 | 0 (0.0%) | 0 (0.0%) |
| $800 to $1,499 | 0 (0.0%) | 0 (0.0%) |
| $800 to $1,499 | 0 (0.0%) | 0 (0.0%) |
| Total | 0 (0.0%) | 5 (100.0%) |
Health & Disability in Flintstone
Health Insurance Coverage by Age in Flintstone
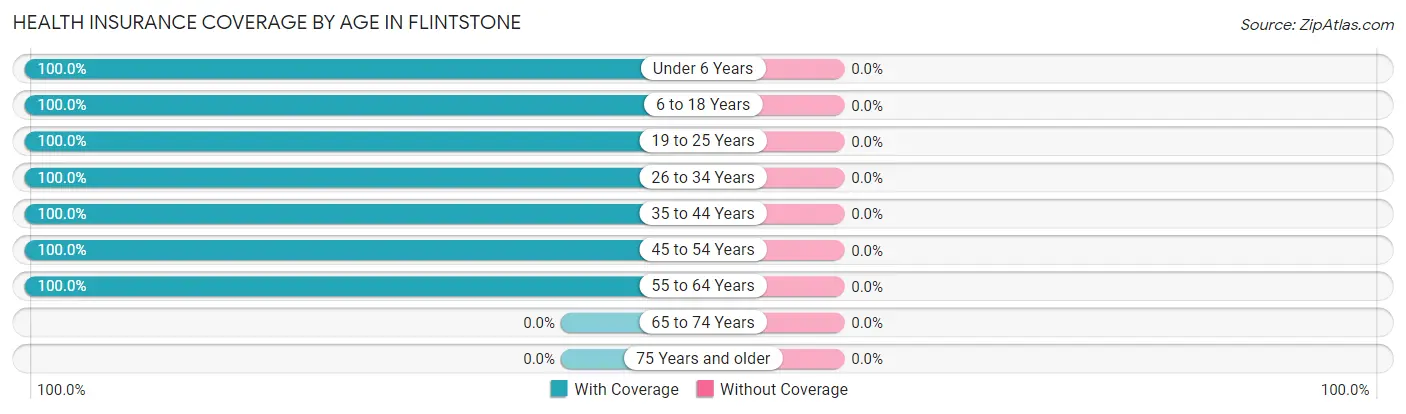
| Age Bracket | With Coverage | Without Coverage |
| Under 6 Years | 29 (100.0%) | 0 (0.0%) |
| 6 to 18 Years | 84 (100.0%) | 0 (0.0%) |
| 19 to 25 Years | 9 (100.0%) | 0 (0.0%) |
| 26 to 34 Years | 14 (100.0%) | 0 (0.0%) |
| 35 to 44 Years | 24 (100.0%) | 0 (0.0%) |
| 45 to 54 Years | 14 (100.0%) | 0 (0.0%) |
| 55 to 64 Years | 9 (100.0%) | 0 (0.0%) |
| 65 to 74 Years | 0 (0.0%) | 0 (0.0%) |
| 75 Years and older | 0 (0.0%) | 0 (0.0%) |
| Total | 183 (100.0%) | 0 (0.0%) |
Health Insurance Coverage by Citizenship Status in Flintstone
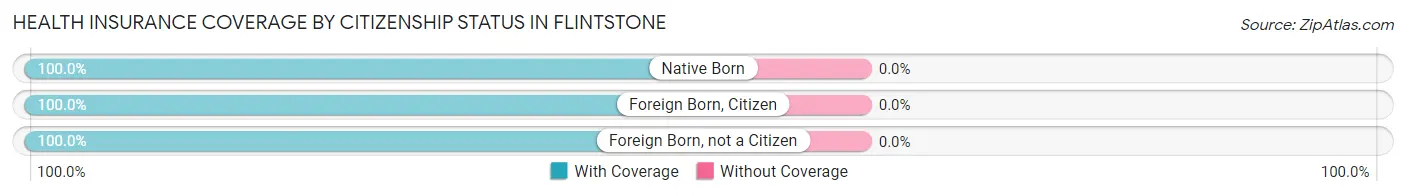
| Citizenship Status | With Coverage | Without Coverage |
| Native Born | 29 (100.0%) | 0 (0.0%) |
| Foreign Born, Citizen | 84 (100.0%) | 0 (0.0%) |
| Foreign Born, not a Citizen | 9 (100.0%) | 0 (0.0%) |
Health Insurance Coverage by Household Income in Flintstone
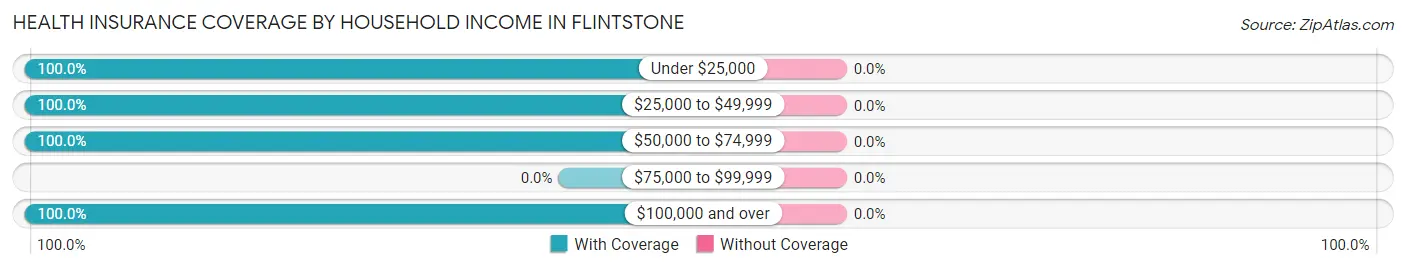
| Household Income | With Coverage | Without Coverage |
| Under $25,000 | 80 (100.0%) | 0 (0.0%) |
| $25,000 to $49,999 | 9 (100.0%) | 0 (0.0%) |
| $50,000 to $74,999 | 60 (100.0%) | 0 (0.0%) |
| $75,000 to $99,999 | 0 (0.0%) | 0 (0.0%) |
| $100,000 and over | 34 (100.0%) | 0 (0.0%) |
Public vs Private Health Insurance Coverage by Age in Flintstone
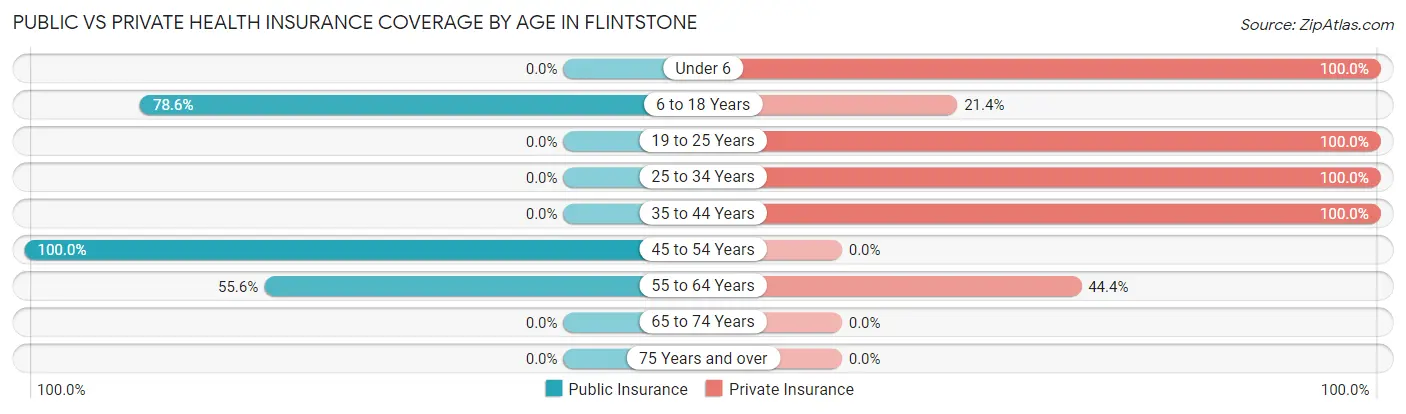
| Age Bracket | Public Insurance | Private Insurance |
| Under 6 | 0 (0.0%) | 29 (100.0%) |
| 6 to 18 Years | 66 (78.6%) | 18 (21.4%) |
| 19 to 25 Years | 0 (0.0%) | 9 (100.0%) |
| 25 to 34 Years | 0 (0.0%) | 14 (100.0%) |
| 35 to 44 Years | 0 (0.0%) | 24 (100.0%) |
| 45 to 54 Years | 14 (100.0%) | 0 (0.0%) |
| 55 to 64 Years | 5 (55.6%) | 4 (44.4%) |
| 65 to 74 Years | 0 (0.0%) | 0 (0.0%) |
| 75 Years and over | 0 (0.0%) | 0 (0.0%) |
| Total | 85 (46.5%) | 98 (53.5%) |
Disability Status by Sex by Age in Flintstone
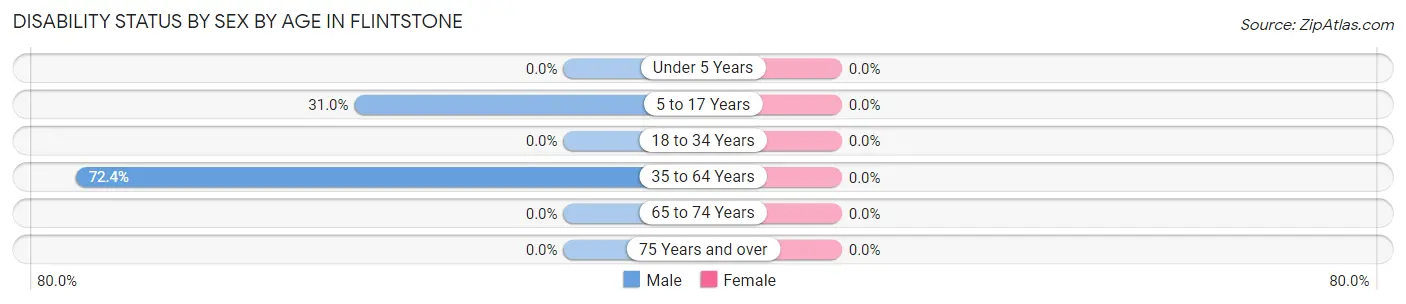
| Age Bracket | Male | Female |
| Under 5 Years | 0 (0.0%) | 0 (0.0%) |
| 5 to 17 Years | 18 (31.0%) | 0 (0.0%) |
| 18 to 34 Years | 0 (0.0%) | 0 (0.0%) |
| 35 to 64 Years | 21 (72.4%) | 0 (0.0%) |
| 65 to 74 Years | 0 (0.0%) | 0 (0.0%) |
| 75 Years and over | 0 (0.0%) | 0 (0.0%) |
Disability Class by Sex by Age in Flintstone
Disability Class: Hearing Difficulty
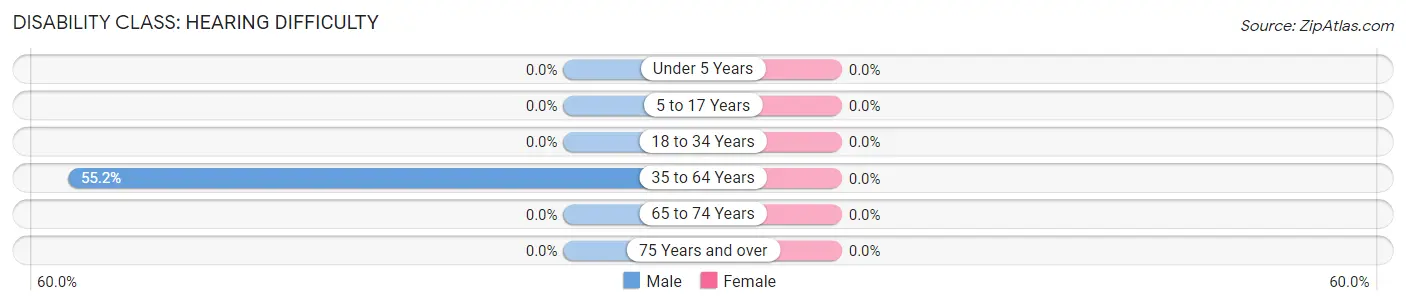
| Age Bracket | Male | Female |
| Under 5 Years | 0 (0.0%) | 0 (0.0%) |
| 5 to 17 Years | 0 (0.0%) | 0 (0.0%) |
| 18 to 34 Years | 0 (0.0%) | 0 (0.0%) |
| 35 to 64 Years | 16 (55.2%) | 0 (0.0%) |
| 65 to 74 Years | 0 (0.0%) | 0 (0.0%) |
| 75 Years and over | 0 (0.0%) | 0 (0.0%) |
Disability Class: Vision Difficulty
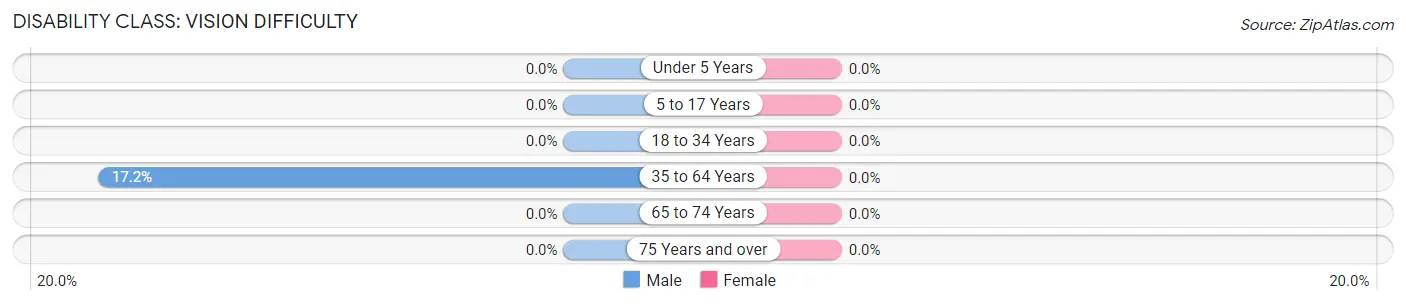
| Age Bracket | Male | Female |
| Under 5 Years | 0 (0.0%) | 0 (0.0%) |
| 5 to 17 Years | 0 (0.0%) | 0 (0.0%) |
| 18 to 34 Years | 0 (0.0%) | 0 (0.0%) |
| 35 to 64 Years | 5 (17.2%) | 0 (0.0%) |
| 65 to 74 Years | 0 (0.0%) | 0 (0.0%) |
| 75 Years and over | 0 (0.0%) | 0 (0.0%) |
Disability Class: Cognitive Difficulty
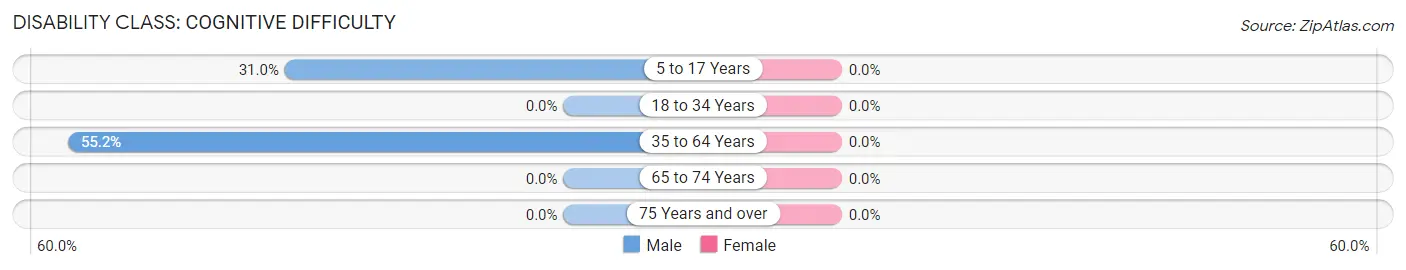
| Age Bracket | Male | Female |
| 5 to 17 Years | 18 (31.0%) | 0 (0.0%) |
| 18 to 34 Years | 0 (0.0%) | 0 (0.0%) |
| 35 to 64 Years | 16 (55.2%) | 0 (0.0%) |
| 65 to 74 Years | 0 (0.0%) | 0 (0.0%) |
| 75 Years and over | 0 (0.0%) | 0 (0.0%) |
Disability Class: Ambulatory Difficulty
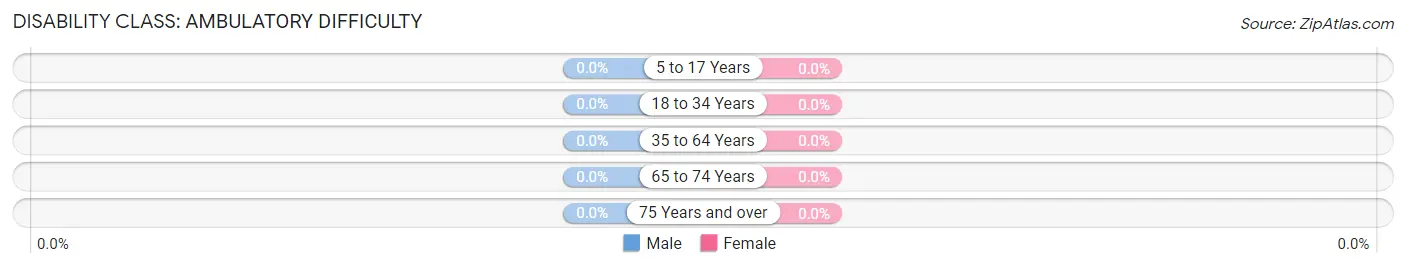
| Age Bracket | Male | Female |
| 5 to 17 Years | 0 (0.0%) | 0 (0.0%) |
| 18 to 34 Years | 0 (0.0%) | 0 (0.0%) |
| 35 to 64 Years | 0 (0.0%) | 0 (0.0%) |
| 65 to 74 Years | 0 (0.0%) | 0 (0.0%) |
| 75 Years and over | 0 (0.0%) | 0 (0.0%) |
Disability Class: Self-Care Difficulty
| Age Bracket | Male | Female |
| 5 to 17 Years | 0 (0.0%) | 0 (0.0%) |
| 18 to 34 Years | 0 (0.0%) | 0 (0.0%) |
| 35 to 64 Years | 0 (0.0%) | 0 (0.0%) |
| 65 to 74 Years | 0 (0.0%) | 0 (0.0%) |
| 75 Years and over | 0 (0.0%) | 0 (0.0%) |
Technology Access in Flintstone
Computing Device Access in Flintstone
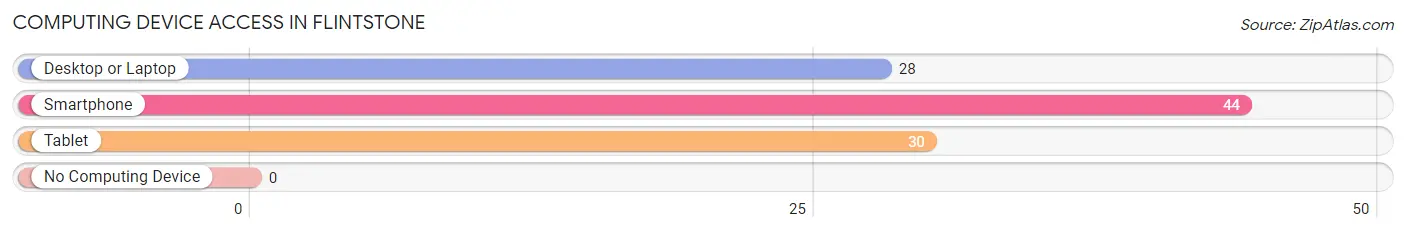
| Device Type | # Households | % Households |
| Desktop or Laptop | 28 | 63.6% |
| Smartphone | 44 | 100.0% |
| Tablet | 30 | 68.2% |
| No Computing Device | 0 | 0.0% |
| Total | 44 | 100.0% |
Internet Access in Flintstone
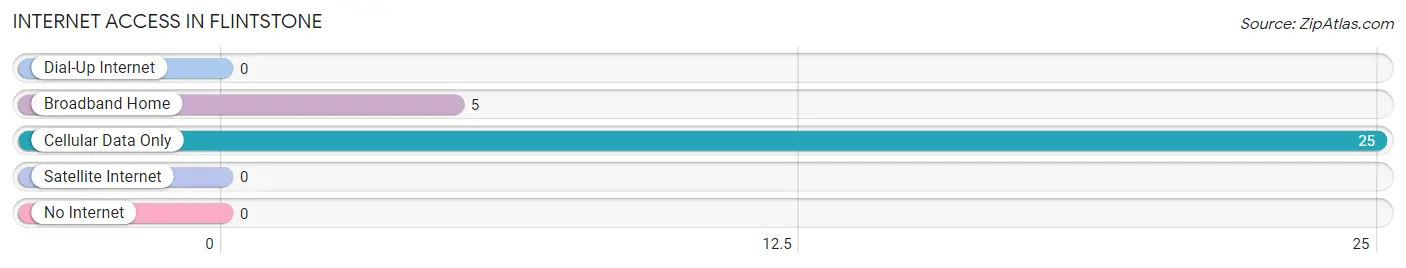
| Internet Type | # Households | % Households |
| Dial-Up Internet | 0 | 0.0% |
| Broadband Home | 5 | 11.4% |
| Cellular Data Only | 25 | 56.8% |
| Satellite Internet | 0 | 0.0% |
| No Internet | 0 | 0.0% |
| Total | 44 | 100.0% |
Flintstone Summary
Flintstone, Maryland is a small town located in Allegany County, Maryland. It is situated in the Appalachian Mountains, approximately two hours west of Baltimore. The town has a population of approximately 1,500 people and is known for its rural charm and small-town atmosphere.
History
Flintstone was founded in 1790 by a group of settlers from Pennsylvania. The town was named after the nearby Flintstone Creek, which was named for the flint stones that were found in the area. The town was originally a farming community, and the settlers grew corn, wheat, and other crops. In the early 19th century, the town began to grow and develop, and by the mid-1800s, it had become a thriving community.
In the late 19th century, the town began to experience a decline in population due to the decline of the local farming industry. However, in the early 20th century, the town experienced a resurgence in population due to the development of the nearby coal industry. The town was also home to a number of small businesses, including a general store, a blacksmith, and a sawmill.
Geography
Flintstone is located in the Appalachian Mountains, approximately two hours west of Baltimore. The town is situated in a valley, surrounded by rolling hills and mountains. The town is located near the Potomac River, which provides a source of recreation for the town’s residents. The town is also located near the Chesapeake and Ohio Canal, which was once used to transport goods and people between the East Coast and the Midwest.
Economy
The economy of Flintstone is largely based on tourism and agriculture. The town is home to a number of small businesses, including restaurants, shops, and bed and breakfasts. The town is also home to a number of farms, which produce a variety of crops, including corn, wheat, and hay. The town is also home to a number of small manufacturing businesses, which produce a variety of products, including furniture, clothing, and tools.
Demographics
As of the 2010 census, the population of Flintstone was 1,500 people. The town is predominantly white, with approximately 95% of the population being Caucasian. The town also has a small African American population, with approximately 4% of the population being African American. The town also has a small Hispanic population, with approximately 1% of the population being Hispanic. The median household income in Flintstone is approximately $45,000, and the median home value is approximately $150,000.
Common Questions
What is Per Capita Income in Flintstone?
Per Capita income in Flintstone is $14,032.
What is the Median Family Income in Flintstone?
Median Family Income in Flintstone is $60,469.
What is the Median Household income in Flintstone?
Median Household Income in Flintstone is $60,469.
What is Inequality or Gini Index in Flintstone?
Inequality or Gini Index in Flintstone is 0.40.
What is the Total Population of Flintstone?
Total Population of Flintstone is 183.
What is the Total Male Population of Flintstone?
Total Male Population of Flintstone is 121.
What is the Total Female Population of Flintstone?
Total Female Population of Flintstone is 62.
What is the Ratio of Males per 100 Females in Flintstone?
There are 195.16 Males per 100 Females in Flintstone.
What is the Ratio of Females per 100 Males in Flintstone?
There are 51.24 Females per 100 Males in Flintstone.
What is the Median Population Age in Flintstone?
Median Population Age in Flintstone is 18.0 Years.
What is the Average Family Size in Flintstone
Average Family Size in Flintstone is 4.2 People.
What is the Average Household Size in Flintstone
Average Household Size in Flintstone is 4.2 People.
How Large is the Labor Force in Flintstone?
There are 40 People in the Labor Forcein in Flintstone.
What is the Percentage of People in the Labor Force in Flintstone?
33.1% of People are in the Labor Force in Flintstone.