Smith Island, MD Map & Demographics
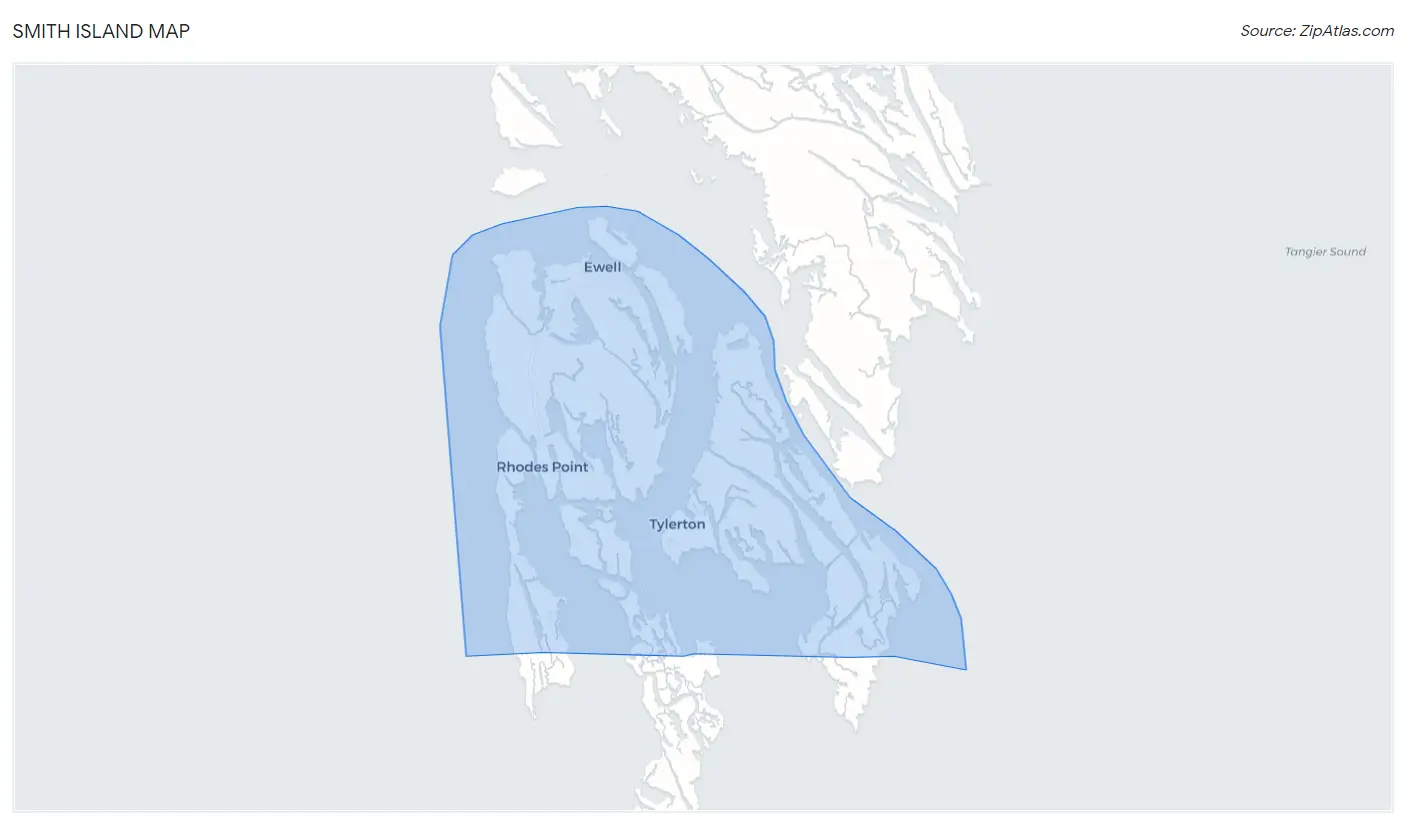
Smith Island Map
Smith Island Overview
$42,910
PER CAPITA INCOME
$84,273
AVG FAMILY INCOME
$82,878
AVG HOUSEHOLD INCOME
0.28
INEQUALITY / GINI INDEX
357
TOTAL POPULATION
184
MALE POPULATION
173
FEMALE POPULATION
106.36
MALES / 100 FEMALES
94.02
FEMALES / 100 MALES
55.0
MEDIAN AGE
2.3
AVG FAMILY SIZE
1.9
AVG HOUSEHOLD SIZE
169
LABOR FORCE [ PEOPLE ]
56.7%
PERCENT IN LABOR FORCE
8.3%
UNEMPLOYMENT RATE
Income in Smith Island
Income Overview in Smith Island
Per Capita Income in Smith Island is $42,910, while median incomes of families and households are $84,273 and $82,878 respectively.
| Characteristic | Number | Measure |
| Per Capita Income | 357 | $42,910 |
| Median Family Income | 135 | $84,273 |
| Mean Family Income | 135 | $93,200 |
| Median Household Income | 183 | $82,878 |
| Mean Household Income | 183 | $86,227 |
| Income Deficit | 135 | $0 |
| Wage / Income Gap (%) | 357 | 0.00% |
| Wage / Income Gap ($) | 357 | 100.00¢ per $1 |
| Gini / Inequality Index | 357 | 0.28 |
Earnings by Sex in Smith Island
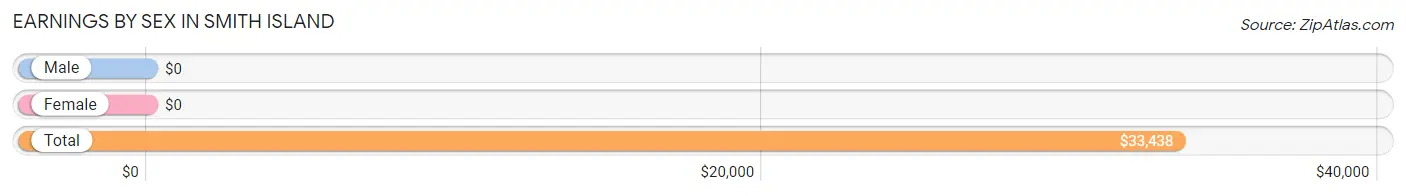
| Sex | Number | Average Earnings |
| Male | 147 (81.2%) | $0 |
| Female | 34 (18.8%) | $0 |
| Total | 181 (100.0%) | $33,438 |
Earnings by Sex by Income Bracket in Smith Island
The most common earnings brackets in Smith Island are $75,000 to $99,999 for men (41 | 27.9%) and $2,499 or less for women (14 | 41.2%).
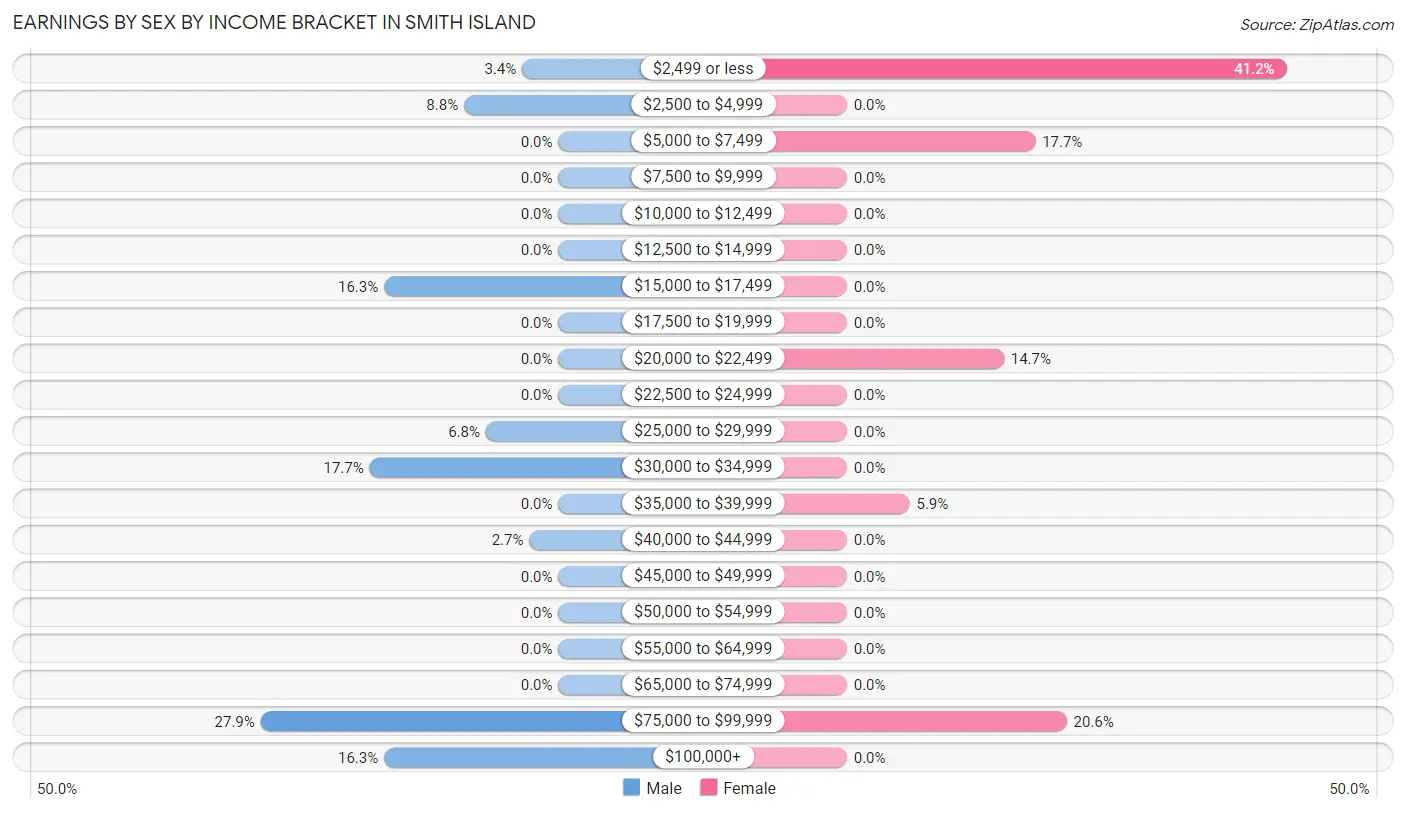
| Income | Male | Female |
| $2,499 or less | 5 (3.4%) | 14 (41.2%) |
| $2,500 to $4,999 | 13 (8.8%) | 0 (0.0%) |
| $5,000 to $7,499 | 0 (0.0%) | 6 (17.6%) |
| $7,500 to $9,999 | 0 (0.0%) | 0 (0.0%) |
| $10,000 to $12,499 | 0 (0.0%) | 0 (0.0%) |
| $12,500 to $14,999 | 0 (0.0%) | 0 (0.0%) |
| $15,000 to $17,499 | 24 (16.3%) | 0 (0.0%) |
| $17,500 to $19,999 | 0 (0.0%) | 0 (0.0%) |
| $20,000 to $22,499 | 0 (0.0%) | 5 (14.7%) |
| $22,500 to $24,999 | 0 (0.0%) | 0 (0.0%) |
| $25,000 to $29,999 | 10 (6.8%) | 0 (0.0%) |
| $30,000 to $34,999 | 26 (17.7%) | 0 (0.0%) |
| $35,000 to $39,999 | 0 (0.0%) | 2 (5.9%) |
| $40,000 to $44,999 | 4 (2.7%) | 0 (0.0%) |
| $45,000 to $49,999 | 0 (0.0%) | 0 (0.0%) |
| $50,000 to $54,999 | 0 (0.0%) | 0 (0.0%) |
| $55,000 to $64,999 | 0 (0.0%) | 0 (0.0%) |
| $65,000 to $74,999 | 0 (0.0%) | 0 (0.0%) |
| $75,000 to $99,999 | 41 (27.9%) | 7 (20.6%) |
| $100,000+ | 24 (16.3%) | 0 (0.0%) |
| Total | 147 (100.0%) | 34 (100.0%) |
Earnings by Sex by Educational Attainment in Smith Island
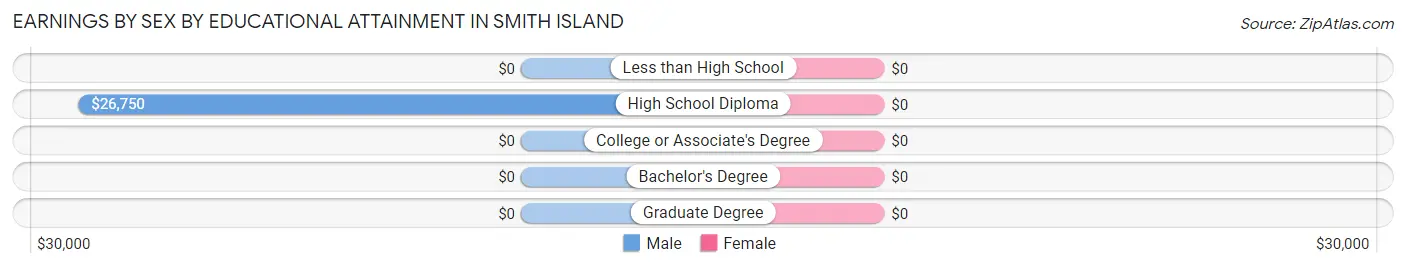
| Educational Attainment | Male Income | Female Income |
| Less than High School | - | - |
| High School Diploma | $26,750 | $0 |
| College or Associate's Degree | - | - |
| Bachelor's Degree | - | - |
| Graduate Degree | - | - |
| Total | - | - |
Family Income in Smith Island
Family Income Brackets in Smith Island
According to the Smith Island family income data, there are 57 families falling into the $75,000 to $99,999 income range, which is the most common income bracket and makes up 42.2% of all families.
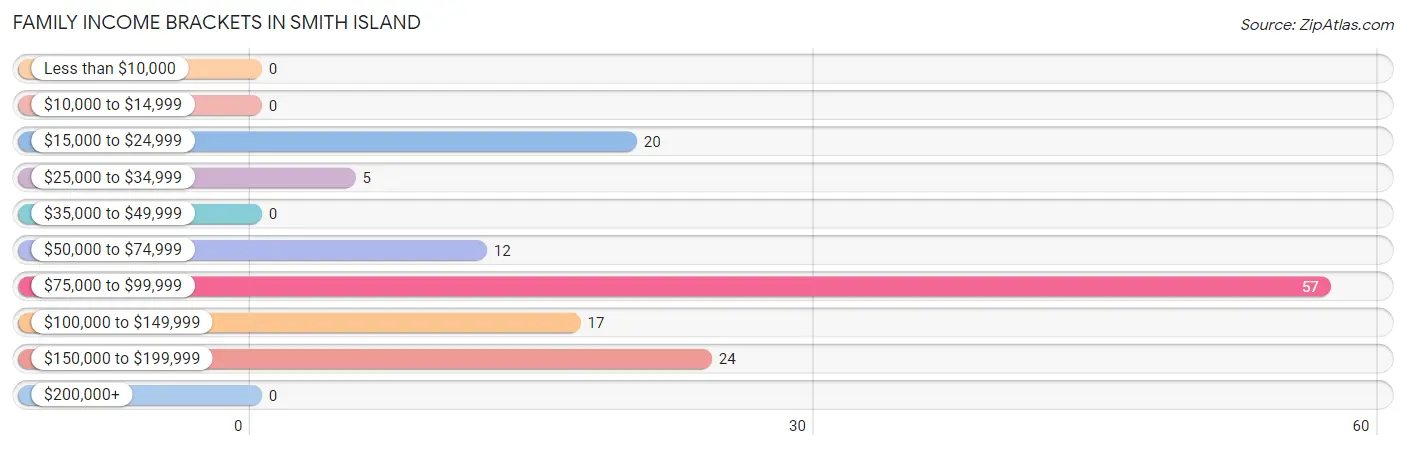
| Income Bracket | # Families | % Families |
| Less than $10,000 | 0 | 0.0% |
| $10,000 to $14,999 | 0 | 0.0% |
| $15,000 to $24,999 | 20 | 14.8% |
| $25,000 to $34,999 | 5 | 3.7% |
| $35,000 to $49,999 | 0 | 0.0% |
| $50,000 to $74,999 | 12 | 8.9% |
| $75,000 to $99,999 | 57 | 42.2% |
| $100,000 to $149,999 | 17 | 12.6% |
| $150,000 to $199,999 | 24 | 17.8% |
| $200,000+ | 0 | 0.0% |
Family Income by Famaliy Size in Smith Island
2-person families (99 | 73.3%) account for the highest median family income in Smith Island with $83,517 per family, while 2-person families (99 | 73.3%) have the highest median income of $41,758 per family member.
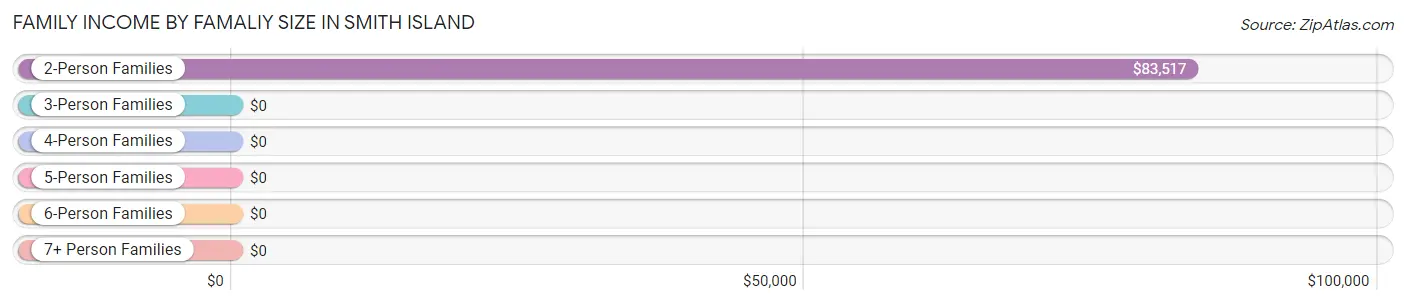
| Income Bracket | # Families | Median Income |
| 2-Person Families | 99 (73.3%) | $83,517 |
| 3-Person Families | 12 (8.9%) | $0 |
| 4-Person Families | 24 (17.8%) | $0 |
| 5-Person Families | 0 (0.0%) | $0 |
| 6-Person Families | 0 (0.0%) | $0 |
| 7+ Person Families | 0 (0.0%) | $0 |
| Total | 135 (100.0%) | $84,273 |
Family Income by Number of Earners in Smith Island
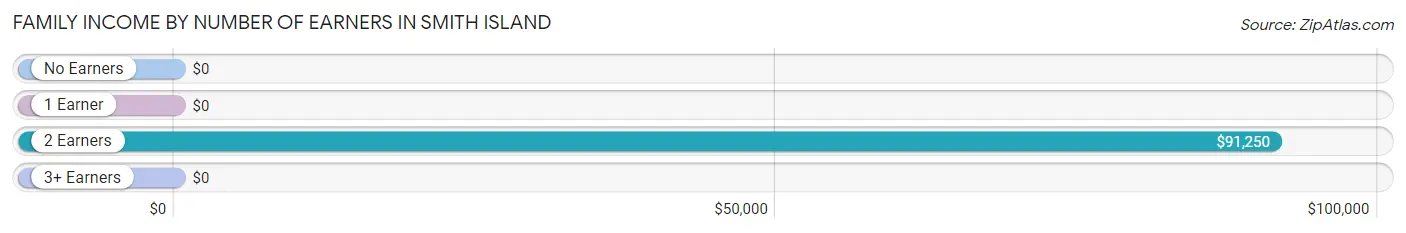
| Number of Earners | # Families | Median Income |
| No Earners | 48 (35.6%) | $0 |
| 1 Earner | 54 (40.0%) | $0 |
| 2 Earners | 28 (20.7%) | $91,250 |
| 3+ Earners | 5 (3.7%) | $0 |
| Total | 135 (100.0%) | $84,273 |
Household Income in Smith Island
Household Income Brackets in Smith Island
With 81 households falling in the category, the $75,000 to $99,999 income range is the most frequent in Smith Island, accounting for 44.3% of all households.
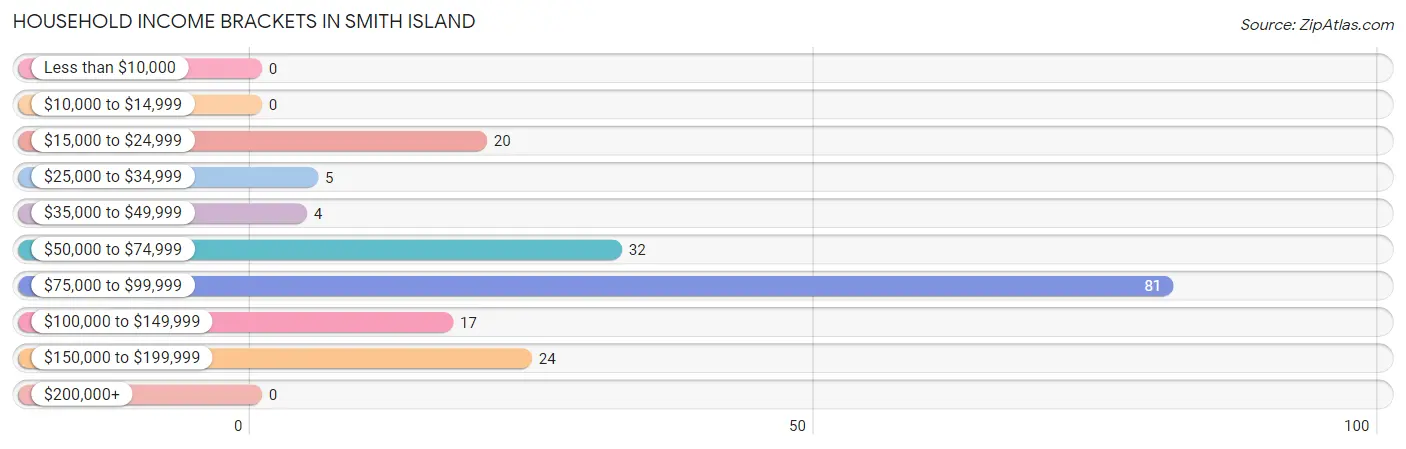
| Income Bracket | # Households | % Households |
| Less than $10,000 | 0 | 0.0% |
| $10,000 to $14,999 | 0 | 0.0% |
| $15,000 to $24,999 | 20 | 10.9% |
| $25,000 to $34,999 | 5 | 2.7% |
| $35,000 to $49,999 | 4 | 2.2% |
| $50,000 to $74,999 | 32 | 17.5% |
| $75,000 to $99,999 | 81 | 44.3% |
| $100,000 to $149,999 | 17 | 9.3% |
| $150,000 to $199,999 | 24 | 13.1% |
| $200,000+ | 0 | 0.0% |
Household Income by Householder Age in Smith Island
The median household income in Smith Island is $82,878, with the highest median household income of $84,099 found in the 65+ years age bracket for the primary householder. A total of 79 households (43.2%) fall into this category.
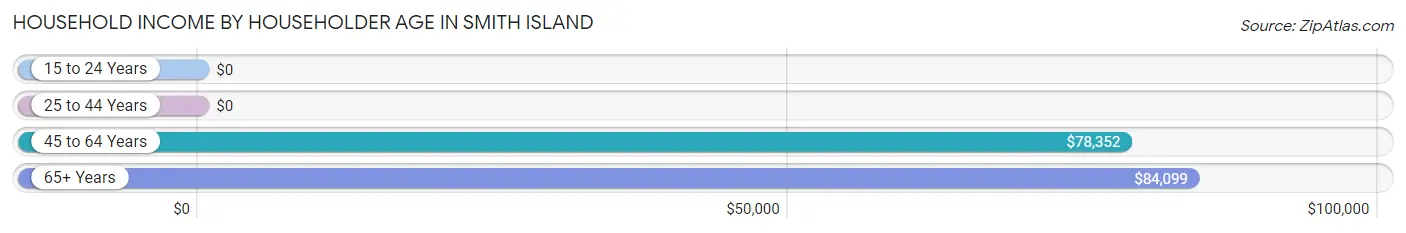
| Income Bracket | # Households | Median Income |
| 15 to 24 Years | 0 (0.0%) | $0 |
| 25 to 44 Years | 27 (14.7%) | $0 |
| 45 to 64 Years | 77 (42.1%) | $78,352 |
| 65+ Years | 79 (43.2%) | $84,099 |
| Total | 183 (100.0%) | $82,878 |
Poverty in Smith Island
Income Below Poverty by Sex and Age in Smith Island
With 12.0% poverty level for males and 8.7% for females among the residents of Smith Island, 45 to 54 year old males and 65 to 74 year old females are the most vulnerable to poverty, with 20 males (34.5%) and 15 females (20.8%) in their respective age groups living below the poverty level.
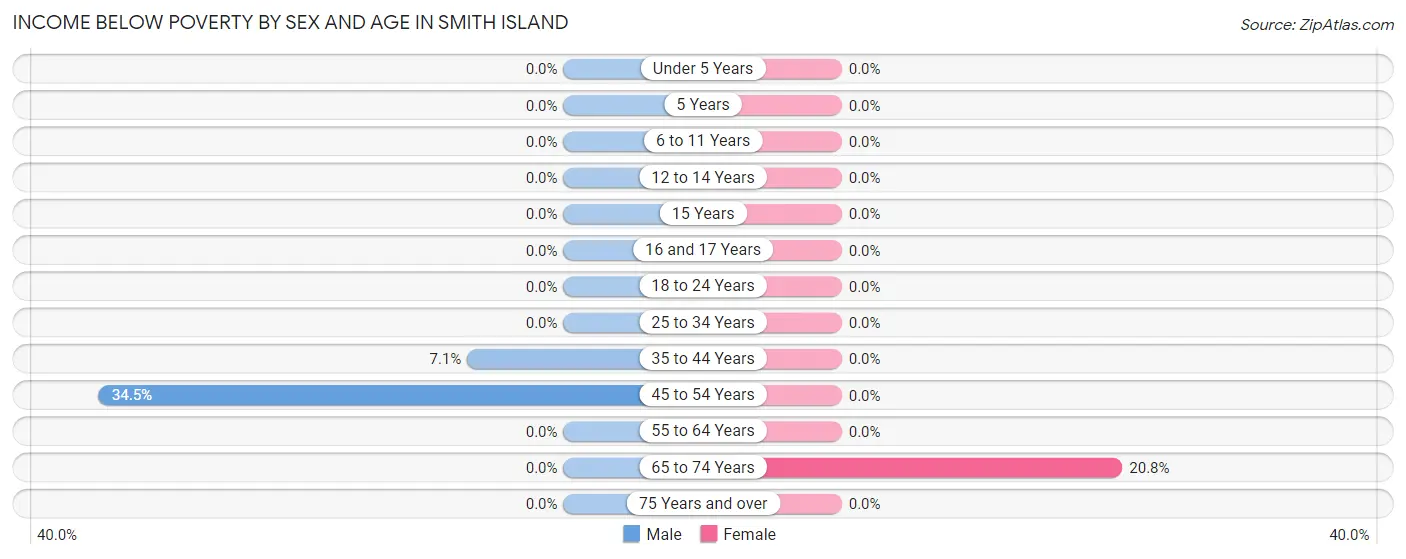
| Age Bracket | Male | Female |
| Under 5 Years | 0 (0.0%) | 0 (0.0%) |
| 5 Years | 0 (0.0%) | 0 (0.0%) |
| 6 to 11 Years | 0 (0.0%) | 0 (0.0%) |
| 12 to 14 Years | 0 (0.0%) | 0 (0.0%) |
| 15 Years | 0 (0.0%) | 0 (0.0%) |
| 16 and 17 Years | 0 (0.0%) | 0 (0.0%) |
| 18 to 24 Years | 0 (0.0%) | 0 (0.0%) |
| 25 to 34 Years | 0 (0.0%) | 0 (0.0%) |
| 35 to 44 Years | 2 (7.1%) | 0 (0.0%) |
| 45 to 54 Years | 20 (34.5%) | 0 (0.0%) |
| 55 to 64 Years | 0 (0.0%) | 0 (0.0%) |
| 65 to 74 Years | 0 (0.0%) | 15 (20.8%) |
| 75 Years and over | 0 (0.0%) | 0 (0.0%) |
| Total | 22 (12.0%) | 15 (8.7%) |
Income Above Poverty by Sex and Age in Smith Island
According to the poverty statistics in Smith Island, males aged 12 to 14 years and females aged 6 to 11 years are the age groups that are most secure financially, with 100.0% of males and 100.0% of females in these age groups living above the poverty line.
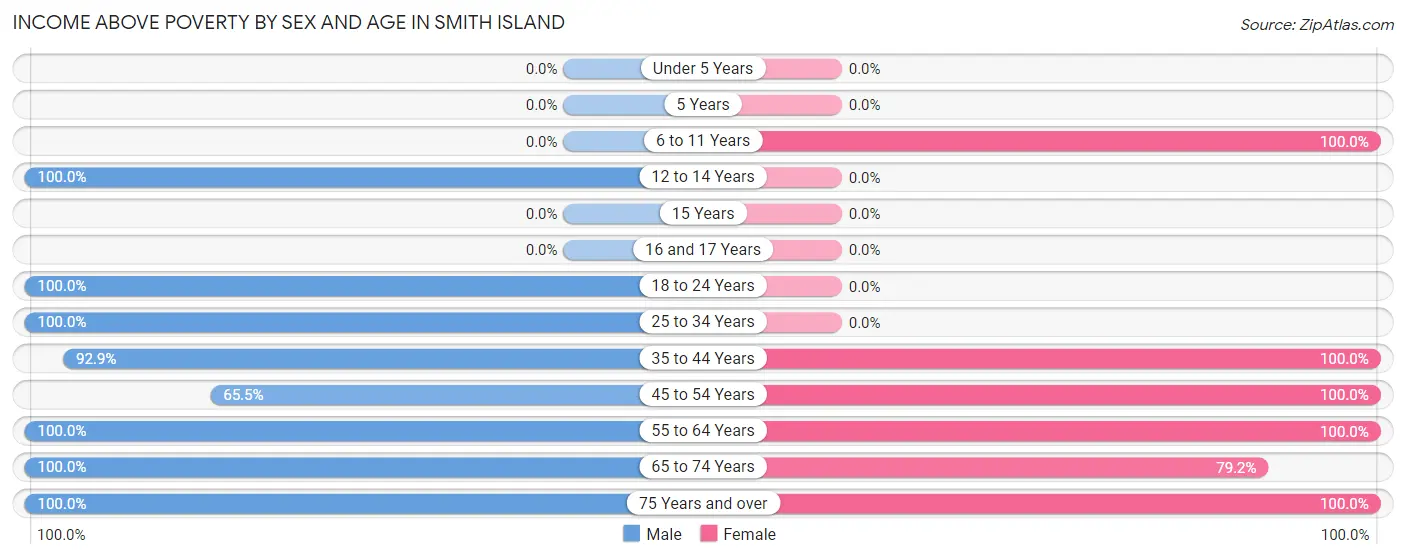
| Age Bracket | Male | Female |
| Under 5 Years | 0 (0.0%) | 0 (0.0%) |
| 5 Years | 0 (0.0%) | 0 (0.0%) |
| 6 to 11 Years | 0 (0.0%) | 55 (100.0%) |
| 12 to 14 Years | 4 (100.0%) | 0 (0.0%) |
| 15 Years | 0 (0.0%) | 0 (0.0%) |
| 16 and 17 Years | 0 (0.0%) | 0 (0.0%) |
| 18 to 24 Years | 7 (100.0%) | 0 (0.0%) |
| 25 to 34 Years | 3 (100.0%) | 0 (0.0%) |
| 35 to 44 Years | 26 (92.9%) | 7 (100.0%) |
| 45 to 54 Years | 38 (65.5%) | 17 (100.0%) |
| 55 to 64 Years | 31 (100.0%) | 20 (100.0%) |
| 65 to 74 Years | 30 (100.0%) | 57 (79.2%) |
| 75 Years and over | 23 (100.0%) | 2 (100.0%) |
| Total | 162 (88.0%) | 158 (91.3%) |
Income Below Poverty Among Married-Couple Families in Smith Island
The poverty statistics for married-couple families in Smith Island show that 15.4% or 20 of the total 130 families live below the poverty line. Families with no children have the highest poverty rate of 20.2%, comprising of 20 families. On the other hand, families with 1 or 2 children have the lowest poverty rate of 0.0%, which includes 0 families.
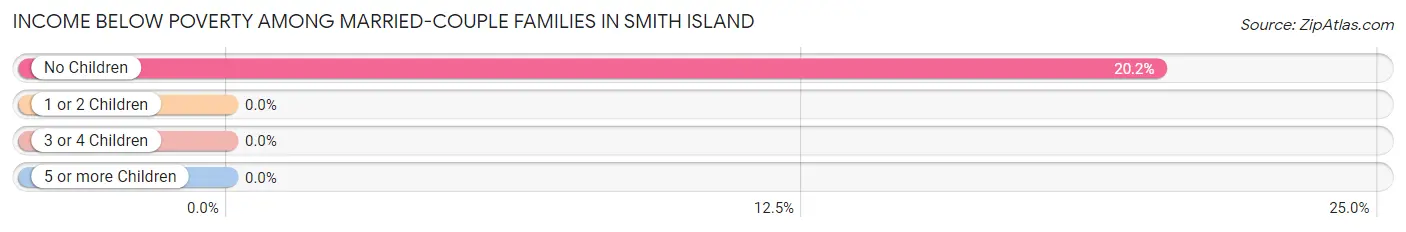
| Children | Above Poverty | Below Poverty |
| No Children | 79 (79.8%) | 20 (20.2%) |
| 1 or 2 Children | 31 (100.0%) | 0 (0.0%) |
| 3 or 4 Children | 0 (0.0%) | 0 (0.0%) |
| 5 or more Children | 0 (0.0%) | 0 (0.0%) |
| Total | 110 (84.6%) | 20 (15.4%) |
Income Below Poverty Among Single-Parent Households in Smith Island
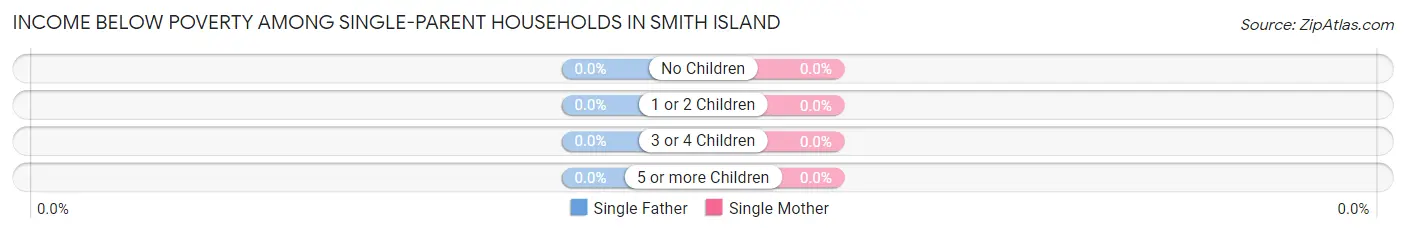
| Children | Single Father | Single Mother |
| No Children | 0 (0.0%) | 0 (0.0%) |
| 1 or 2 Children | 0 (0.0%) | 0 (0.0%) |
| 3 or 4 Children | 0 (0.0%) | 0 (0.0%) |
| 5 or more Children | 0 (0.0%) | 0 (0.0%) |
| Total | 0 (0.0%) | 0 (0.0%) |
Income Below Poverty Among Married-Couple vs Single-Parent Households in Smith Island
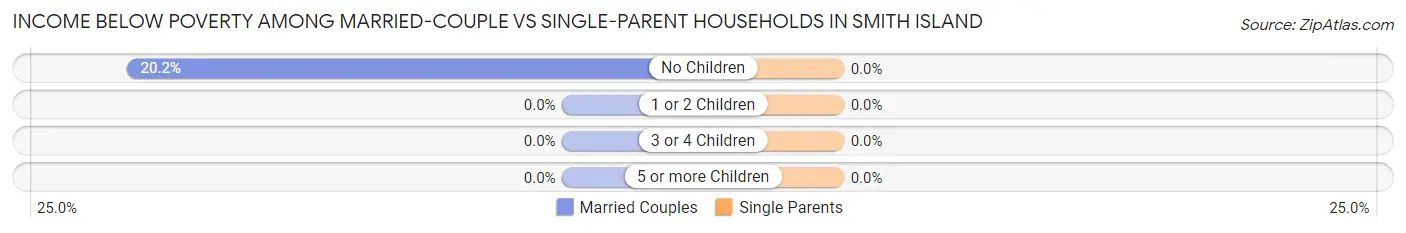
| Children | Married-Couple Families | Single-Parent Households |
| No Children | 20 (20.2%) | 0 (0.0%) |
| 1 or 2 Children | 0 (0.0%) | 0 (0.0%) |
| 3 or 4 Children | 0 (0.0%) | 0 (0.0%) |
| 5 or more Children | 0 (0.0%) | 0 (0.0%) |
| Total | 20 (15.4%) | 0 (0.0%) |
Race in Smith Island
The most populous races in Smith Island are White / Caucasian (352 | 98.6%), Hispanic or Latino (3 | 0.8%), and Some other Race (3 | 0.8%).
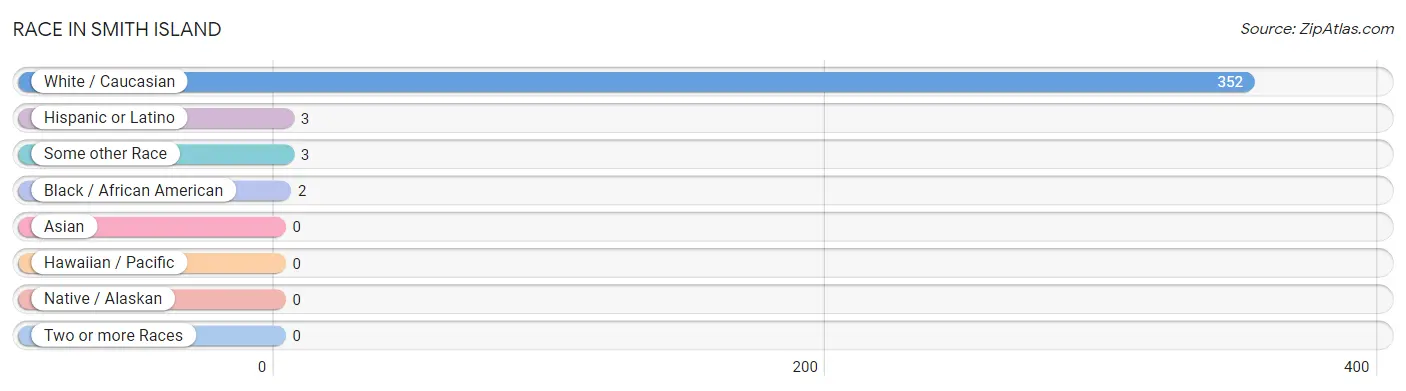
| Race | # Population | % Population |
| Asian | 0 | 0.0% |
| Black / African American | 2 | 0.6% |
| Hawaiian / Pacific | 0 | 0.0% |
| Hispanic or Latino | 3 | 0.8% |
| Native / Alaskan | 0 | 0.0% |
| White / Caucasian | 352 | 98.6% |
| Two or more Races | 0 | 0.0% |
| Some other Race | 3 | 0.8% |
| Total | 357 | 100.0% |
Ancestry in Smith Island
The most populous ancestries reported in Smith Island are American (135 | 37.8%), English (94 | 26.3%), Scottish (14 | 3.9%), German (6 | 1.7%), and Irish (6 | 1.7%), together accounting for 71.4% of all Smith Island residents.
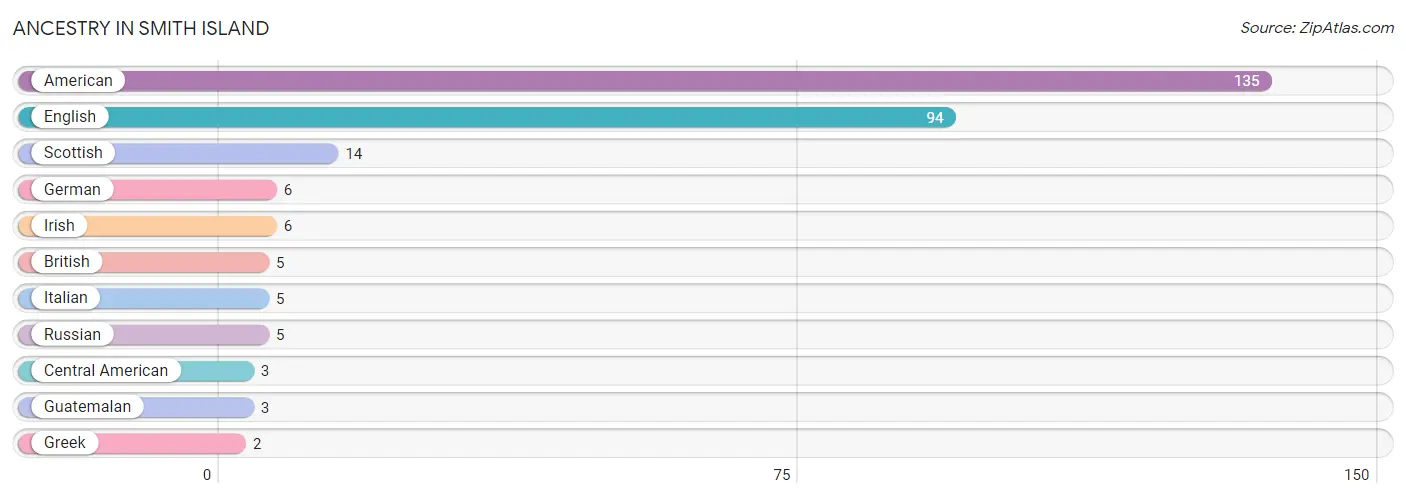
| Ancestry | # Population | % Population |
| American | 135 | 37.8% |
| British | 5 | 1.4% |
| Central American | 3 | 0.8% |
| English | 94 | 26.3% |
| German | 6 | 1.7% |
| Greek | 2 | 0.6% |
| Guatemalan | 3 | 0.8% |
| Irish | 6 | 1.7% |
| Italian | 5 | 1.4% |
| Russian | 5 | 1.4% |
| Scottish | 14 | 3.9% | View All 11 Rows |
Immigrants in Smith Island
The most numerous immigrant groups reported in Smith Island came from Central America (3 | 0.8%), Guatemala (3 | 0.8%), and Latin America (3 | 0.8%), together accounting for 2.5% of all Smith Island residents.
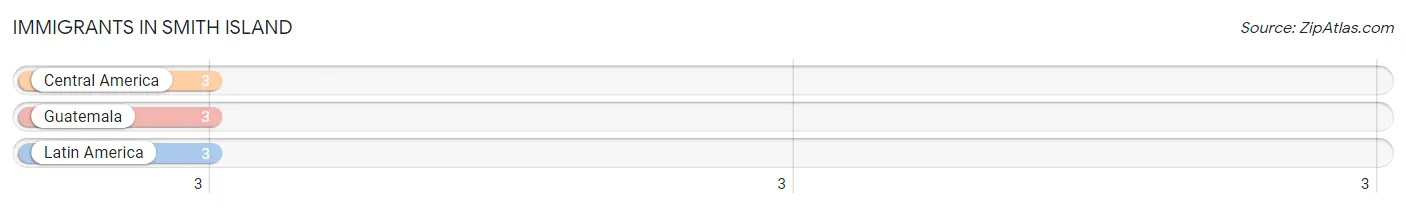
| Immigration Origin | # Population | % Population |
| Central America | 3 | 0.8% |
| Guatemala | 3 | 0.8% |
| Latin America | 3 | 0.8% | View All 3 Rows |
Sex and Age in Smith Island
Sex and Age in Smith Island
The most populous age groups in Smith Island are 50 to 54 Years (54 | 29.3%) for men and 70 to 74 Years (72 | 41.6%) for women.
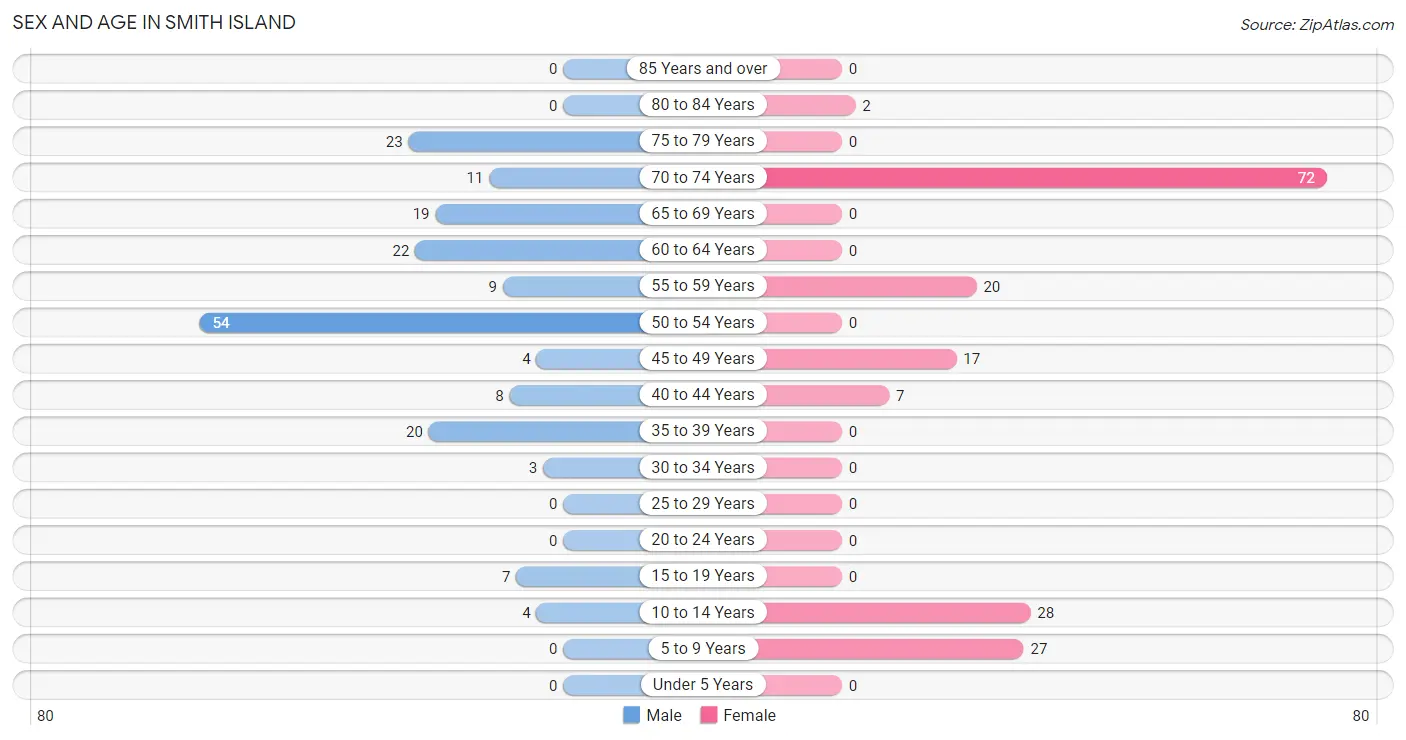
| Age Bracket | Male | Female |
| Under 5 Years | 0 (0.0%) | 0 (0.0%) |
| 5 to 9 Years | 0 (0.0%) | 27 (15.6%) |
| 10 to 14 Years | 4 (2.2%) | 28 (16.2%) |
| 15 to 19 Years | 7 (3.8%) | 0 (0.0%) |
| 20 to 24 Years | 0 (0.0%) | 0 (0.0%) |
| 25 to 29 Years | 0 (0.0%) | 0 (0.0%) |
| 30 to 34 Years | 3 (1.6%) | 0 (0.0%) |
| 35 to 39 Years | 20 (10.9%) | 0 (0.0%) |
| 40 to 44 Years | 8 (4.3%) | 7 (4.1%) |
| 45 to 49 Years | 4 (2.2%) | 17 (9.8%) |
| 50 to 54 Years | 54 (29.3%) | 0 (0.0%) |
| 55 to 59 Years | 9 (4.9%) | 20 (11.6%) |
| 60 to 64 Years | 22 (12.0%) | 0 (0.0%) |
| 65 to 69 Years | 19 (10.3%) | 0 (0.0%) |
| 70 to 74 Years | 11 (6.0%) | 72 (41.6%) |
| 75 to 79 Years | 23 (12.5%) | 0 (0.0%) |
| 80 to 84 Years | 0 (0.0%) | 2 (1.2%) |
| 85 Years and over | 0 (0.0%) | 0 (0.0%) |
| Total | 184 (100.0%) | 173 (100.0%) |
Families and Households in Smith Island
Median Family Size in Smith Island
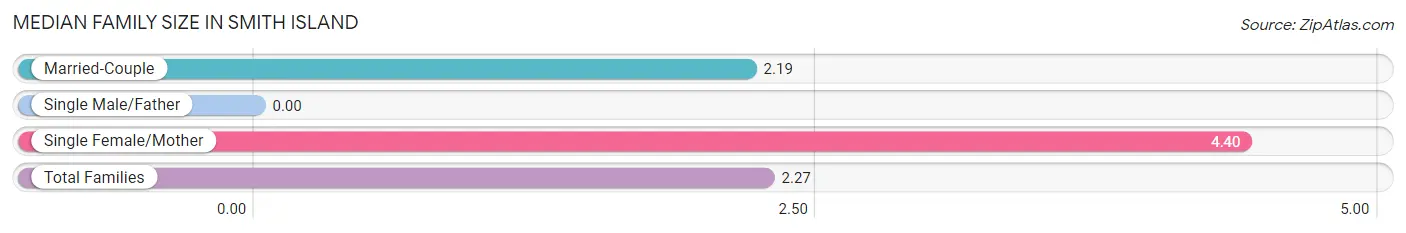
| Family Type | # Families | Family Size |
| Married-Couple | 130 (96.3%) | 2.19 |
| Single Male/Father | 0 (0.0%) | - |
| Single Female/Mother | 5 (3.7%) | 4.40 |
| Total Families | 135 (100.0%) | 2.27 |
Median Household Size in Smith Island
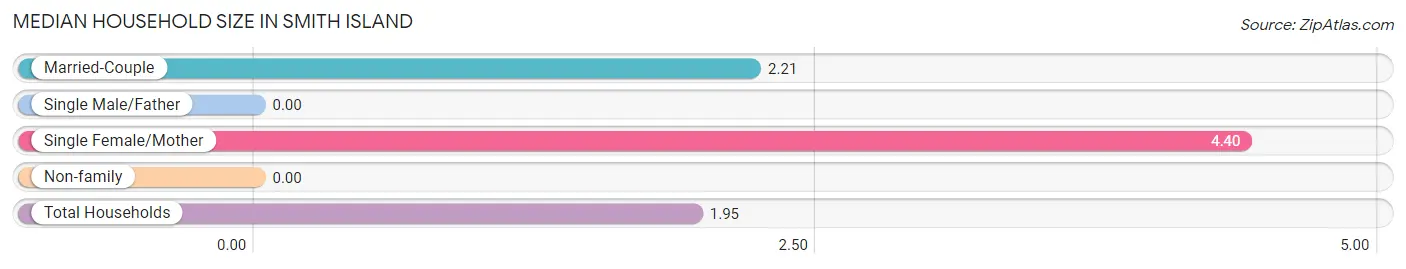
| Household Type | # Households | Household Size |
| Married-Couple | 130 (71.0%) | 2.21 |
| Single Male/Father | 0 (0.0%) | - |
| Single Female/Mother | 5 (2.7%) | 4.40 |
| Non-family | 48 (26.2%) | - |
| Total Households | 183 (100.0%) | 1.95 |
Household Size by Marriage Status in Smith Island
Out of a total of 183 households in Smith Island, 135 (73.8%) are family households, while 48 (26.2%) are nonfamily households. The most numerous type of family households are 2-person households, comprising 94, and the most common type of nonfamily households are 1-person households, comprising 48.
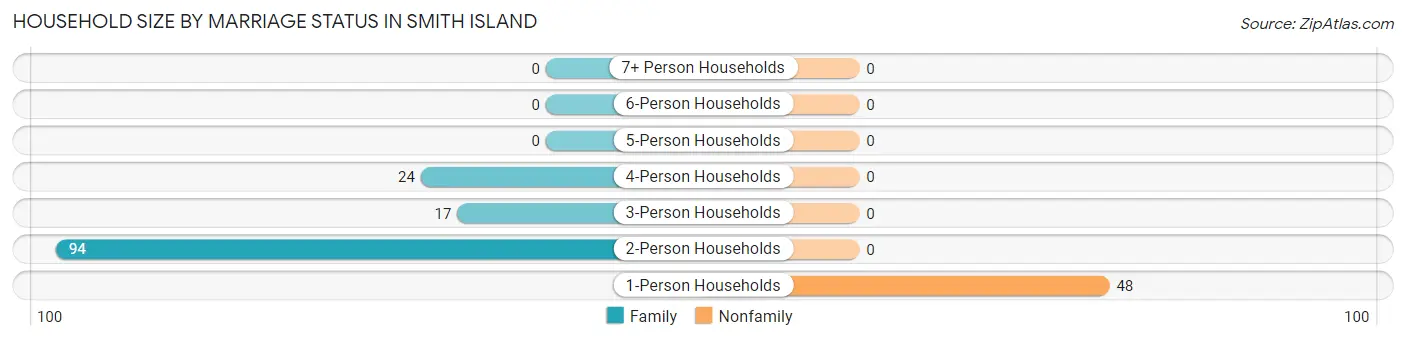
| Household Size | Family Households | Nonfamily Households |
| 1-Person Households | - | 48 (26.2%) |
| 2-Person Households | 94 (51.4%) | 0 (0.0%) |
| 3-Person Households | 17 (9.3%) | 0 (0.0%) |
| 4-Person Households | 24 (13.1%) | 0 (0.0%) |
| 5-Person Households | 0 (0.0%) | 0 (0.0%) |
| 6-Person Households | 0 (0.0%) | 0 (0.0%) |
| 7+ Person Households | 0 (0.0%) | 0 (0.0%) |
| Total | 135 (73.8%) | 48 (26.2%) |
Female Fertility in Smith Island
Fertility by Age in Smith Island
| Age Bracket | Women with Births | Births / 1,000 Women |
| 15 to 19 years | 0 (0.0%) | 0.0 |
| 20 to 34 years | 0 (0.0%) | 0.0 |
| 35 to 50 years | 0 (0.0%) | 0.0 |
| Total | 0 (0.0%) | 0.0 |
Fertility by Age by Marriage Status in Smith Island
| Age Bracket | Married | Unmarried |
| 15 to 19 years | 0 (0.0%) | 0 (0.0%) |
| 20 to 34 years | 0 (0.0%) | 0 (0.0%) |
| 35 to 50 years | 0 (0.0%) | 0 (0.0%) |
| Total | 0 (0.0%) | 0 (0.0%) |
Fertility by Education in Smith Island
| Educational Attainment | Women with Births | Births / 1,000 Women |
| Less than High School | 0 (0.0%) | 0.0 |
| High School Diploma | 0 (0.0%) | 0.0 |
| College or Associate's Degree | 0 (0.0%) | 0.0 |
| Bachelor's Degree | 0 (0.0%) | 0.0 |
| Graduate Degree | 0 (0.0%) | 0.0 |
| Total | 0 (0.0%) | 0.0 |
Fertility by Education by Marriage Status in Smith Island
| Educational Attainment | Married | Unmarried |
| Less than High School | 0 (0.0%) | 0 (0.0%) |
| High School Diploma | 0 (0.0%) | 0 (0.0%) |
| College or Associate's Degree | 0 (0.0%) | 0 (0.0%) |
| Bachelor's Degree | 0 (0.0%) | 0 (0.0%) |
| Graduate Degree | 0 (0.0%) | 0 (0.0%) |
| Total | 0 (0.0%) | 0 (0.0%) |
Employment Characteristics in Smith Island
Employment by Class of Employer in Smith Island
Among the 155 employed individuals in Smith Island, private company employees (99 | 63.9%), self-employed (not incorporated) (46 | 29.7%), and not-for-profit organizations (5 | 3.2%) make up the most common classes of employment.
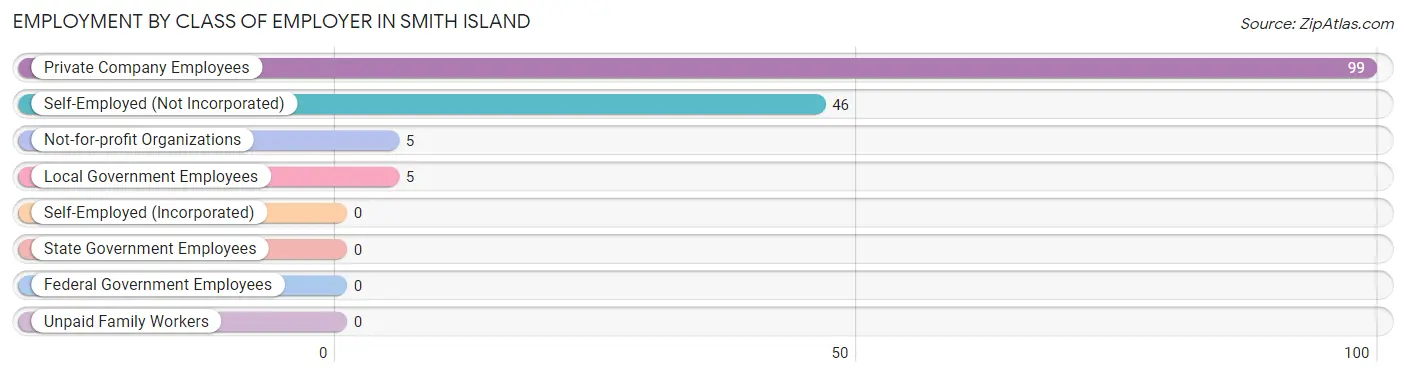
| Employer Class | # Employees | % Employees |
| Private Company Employees | 99 | 63.9% |
| Self-Employed (Incorporated) | 0 | 0.0% |
| Self-Employed (Not Incorporated) | 46 | 29.7% |
| Not-for-profit Organizations | 5 | 3.2% |
| Local Government Employees | 5 | 3.2% |
| State Government Employees | 0 | 0.0% |
| Federal Government Employees | 0 | 0.0% |
| Unpaid Family Workers | 0 | 0.0% |
| Total | 155 | 100.0% |
Employment Status by Age in Smith Island
According to the labor force statistics for Smith Island, out of the total population over 16 years of age (298), 56.7% or 169 individuals are in the labor force, with 8.3% or 14 of them unemployed. The age group with the highest labor force participation rate is 16 to 19 years, with 100.0% or 7 individuals in the labor force. Within the labor force, the 55 to 59 years age range has the highest percentage of unemployed individuals, with 48.3% or 14 of them being unemployed.
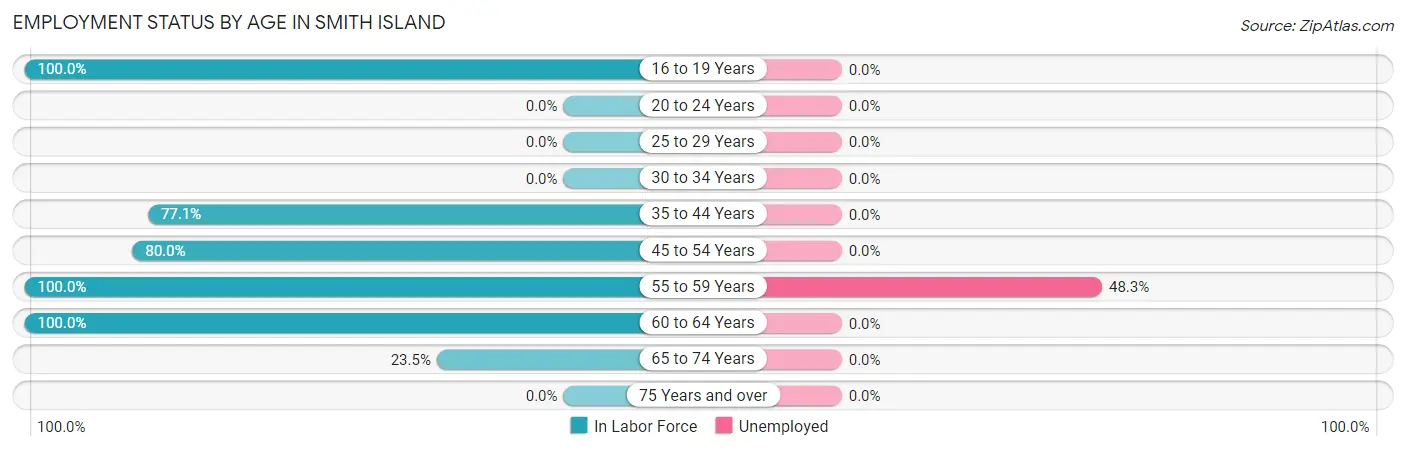
| Age Bracket | In Labor Force | Unemployed |
| 16 to 19 Years | 7 (100.0%) | 0 (0.0%) |
| 20 to 24 Years | 0 (0.0%) | 0 (0.0%) |
| 25 to 29 Years | 0 (0.0%) | 0 (0.0%) |
| 30 to 34 Years | 0 (0.0%) | 0 (0.0%) |
| 35 to 44 Years | 27 (77.1%) | 0 (0.0%) |
| 45 to 54 Years | 60 (80.0%) | 0 (0.0%) |
| 55 to 59 Years | 29 (100.0%) | 14 (48.3%) |
| 60 to 64 Years | 22 (100.0%) | 0 (0.0%) |
| 65 to 74 Years | 24 (23.5%) | 0 (0.0%) |
| 75 Years and over | 0 (0.0%) | 0 (0.0%) |
| Total | 169 (56.7%) | 14 (8.3%) |
Employment Status by Educational Attainment in Smith Island
According to labor force statistics for Smith Island, 84.1% of individuals (138) out of the total population between 25 and 64 years of age (164) are in the labor force, with 10.1% or 14 of them being unemployed. The group with the highest labor force participation rate are those with the educational attainment of less than high school, with 100.0% or 80 individuals in the labor force. Within the labor force, individuals with less than high school education have the highest percentage of unemployment, with 17.5% or 14 of them being unemployed.
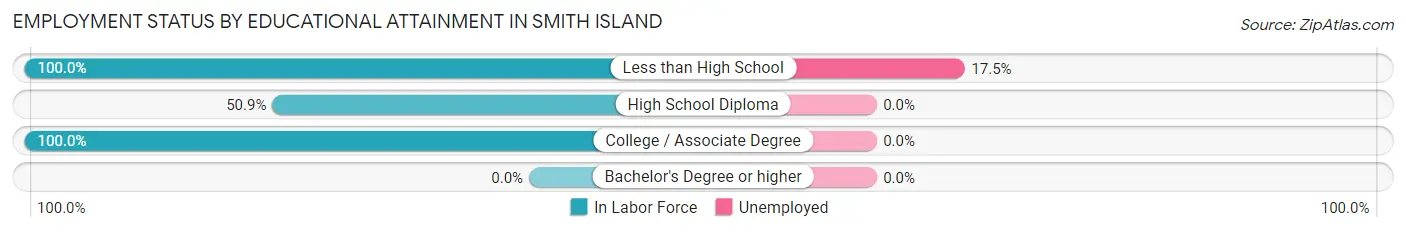
| Educational Attainment | In Labor Force | Unemployed |
| Less than High School | 80 (100.0%) | 14 (17.5%) |
| High School Diploma | 27 (50.9%) | 0 (0.0%) |
| College / Associate Degree | 31 (100.0%) | 0 (0.0%) |
| Bachelor's Degree or higher | 0 (0.0%) | 0 (0.0%) |
| Total | 138 (84.1%) | 17 (10.1%) |
Employment Occupations by Sex in Smith Island
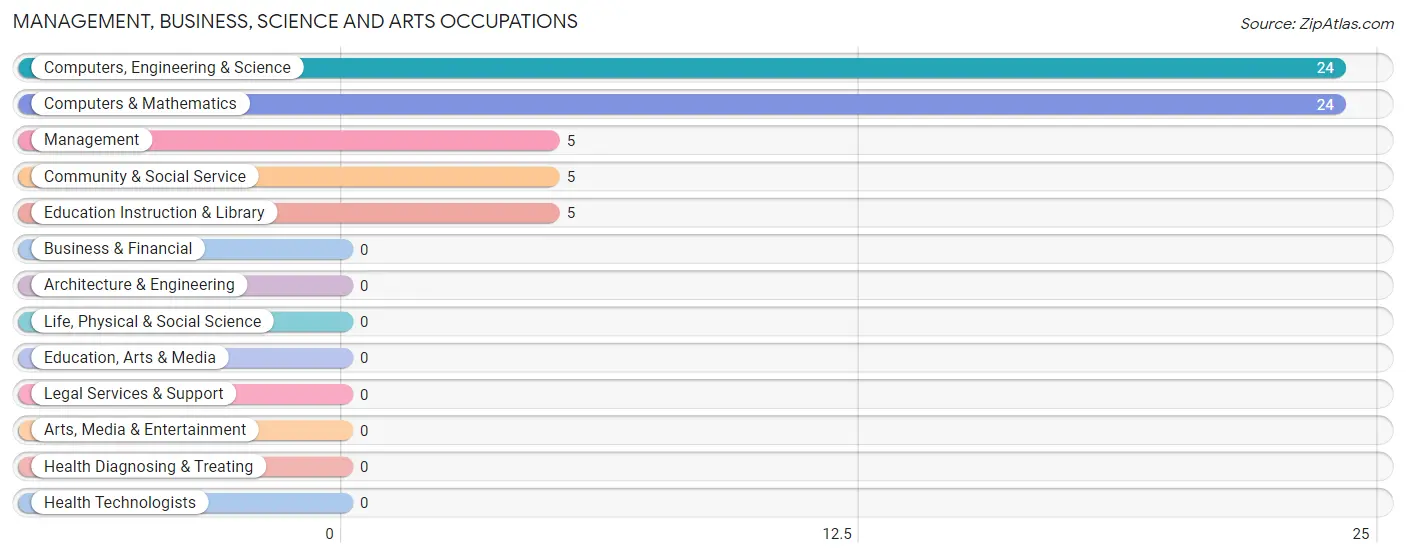
Management, Business, Science and Arts Occupations
The most common Management, Business, Science and Arts occupations in Smith Island are Computers, Engineering & Science (24 | 15.5%), Computers & Mathematics (24 | 15.5%), Management (5 | 3.2%), Community & Social Service (5 | 3.2%), and Education Instruction & Library (5 | 3.2%).
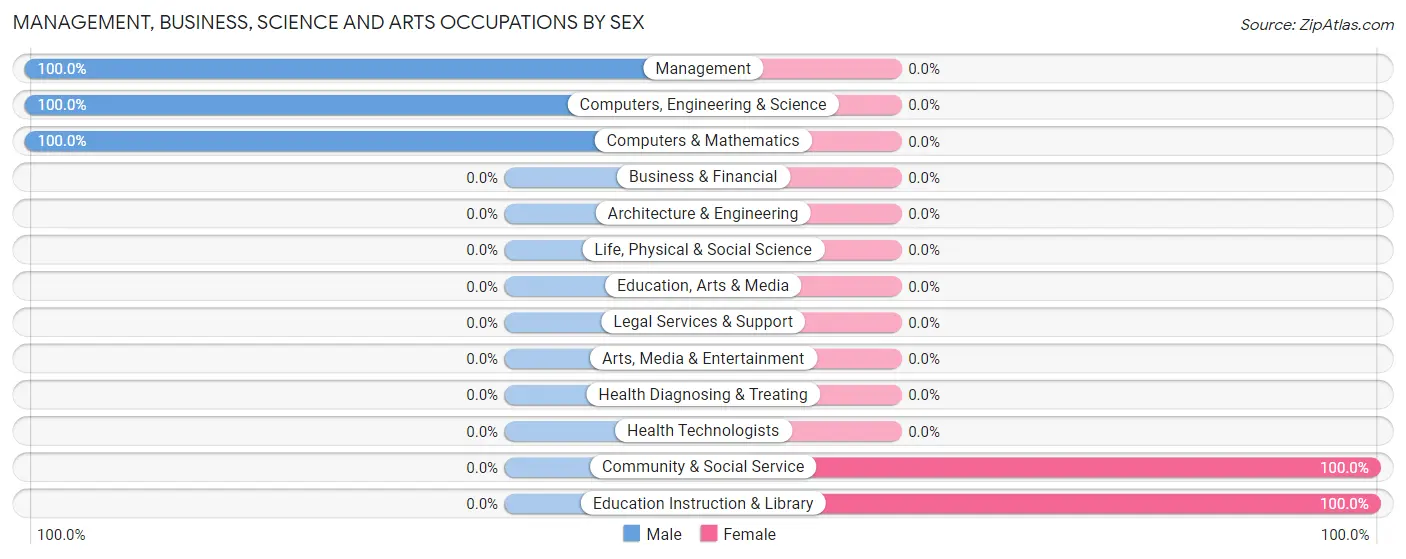
Management, Business, Science and Arts Occupations by Sex
Within the Management, Business, Science and Arts occupations in Smith Island, the most male-oriented occupations are Management (100.0%), Computers, Engineering & Science (100.0%), and Computers & Mathematics (100.0%), while the most female-oriented occupations are Community & Social Service (100.0%), and Education Instruction & Library (100.0%).
| Occupation | Male | Female |
| Management | 5 (100.0%) | 0 (0.0%) |
| Business & Financial | 0 (0.0%) | 0 (0.0%) |
| Computers, Engineering & Science | 24 (100.0%) | 0 (0.0%) |
| Computers & Mathematics | 24 (100.0%) | 0 (0.0%) |
| Architecture & Engineering | 0 (0.0%) | 0 (0.0%) |
| Life, Physical & Social Science | 0 (0.0%) | 0 (0.0%) |
| Community & Social Service | 0 (0.0%) | 5 (100.0%) |
| Education, Arts & Media | 0 (0.0%) | 0 (0.0%) |
| Legal Services & Support | 0 (0.0%) | 0 (0.0%) |
| Education Instruction & Library | 0 (0.0%) | 5 (100.0%) |
| Arts, Media & Entertainment | 0 (0.0%) | 0 (0.0%) |
| Health Diagnosing & Treating | 0 (0.0%) | 0 (0.0%) |
| Health Technologists | 0 (0.0%) | 0 (0.0%) |
| Total (Category) | 29 (85.3%) | 5 (14.7%) |
| Total (Overall) | 135 (87.1%) | 20 (12.9%) |
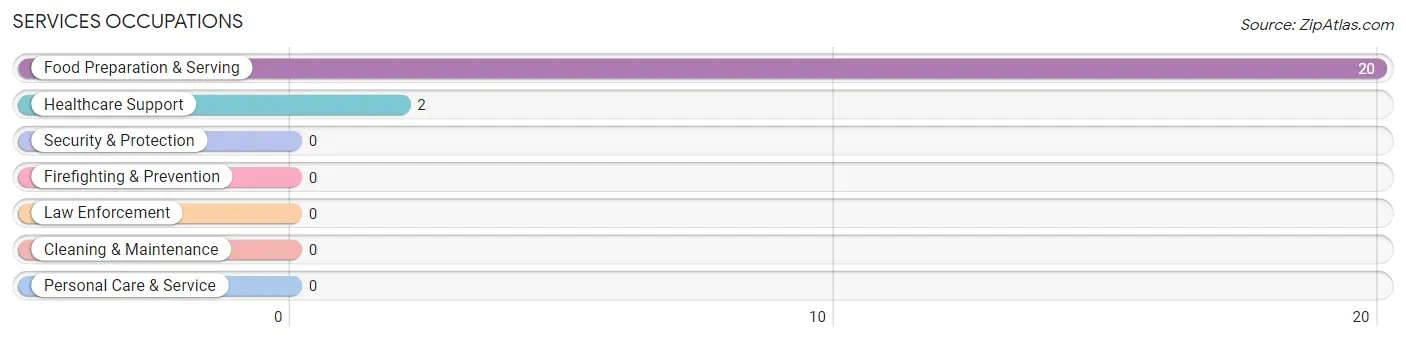
Services Occupations
The most common Services occupations in Smith Island are Food Preparation & Serving (20 | 12.9%), and Healthcare Support (2 | 1.3%).
Services Occupations by Sex
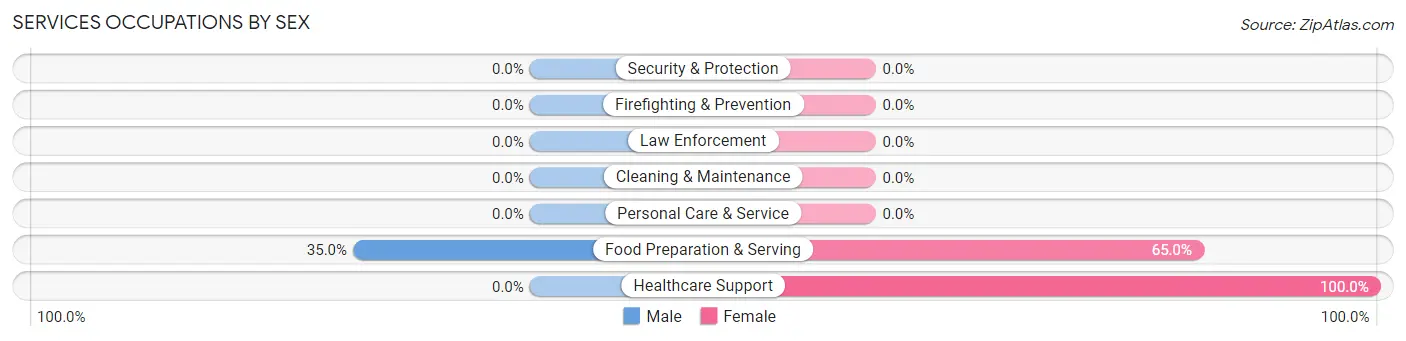
| Occupation | Male | Female |
| Healthcare Support | 0 (0.0%) | 2 (100.0%) |
| Security & Protection | 0 (0.0%) | 0 (0.0%) |
| Firefighting & Prevention | 0 (0.0%) | 0 (0.0%) |
| Law Enforcement | 0 (0.0%) | 0 (0.0%) |
| Food Preparation & Serving | 7 (35.0%) | 13 (65.0%) |
| Cleaning & Maintenance | 0 (0.0%) | 0 (0.0%) |
| Personal Care & Service | 0 (0.0%) | 0 (0.0%) |
| Total (Category) | 7 (31.8%) | 15 (68.2%) |
| Total (Overall) | 135 (87.1%) | 20 (12.9%) |
Sales and Office Occupations
The most common Sales and Office occupations in Smith Island are , and Office & Administration (5 | 3.2%).
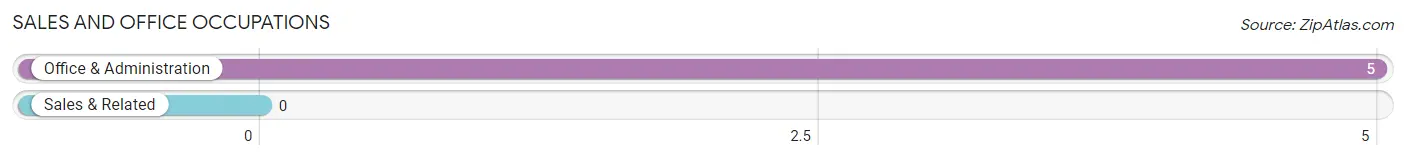
Sales and Office Occupations by Sex
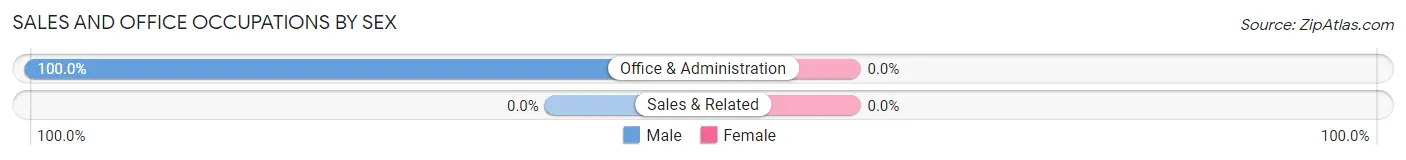
| Occupation | Male | Female |
| Sales & Related | 0 (0.0%) | 0 (0.0%) |
| Office & Administration | 5 (100.0%) | 0 (0.0%) |
| Total (Category) | 5 (100.0%) | 0 (0.0%) |
| Total (Overall) | 135 (87.1%) | 20 (12.9%) |
Natural Resources, Construction and Maintenance Occupations
The most common Natural Resources, Construction and Maintenance occupations in Smith Island are Farming, Fishing & Forestry (52 | 33.6%), and Construction & Extraction (4 | 2.6%).
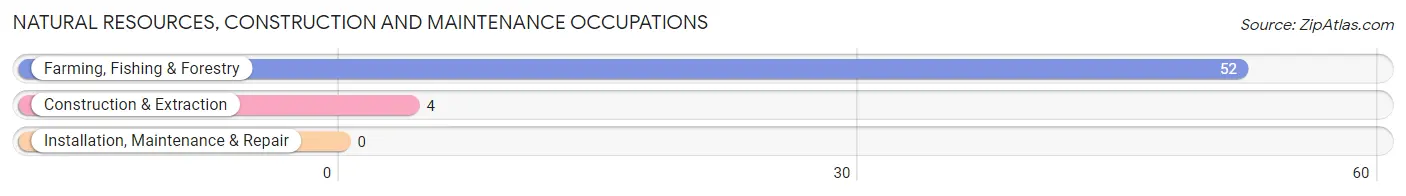
Natural Resources, Construction and Maintenance Occupations by Sex
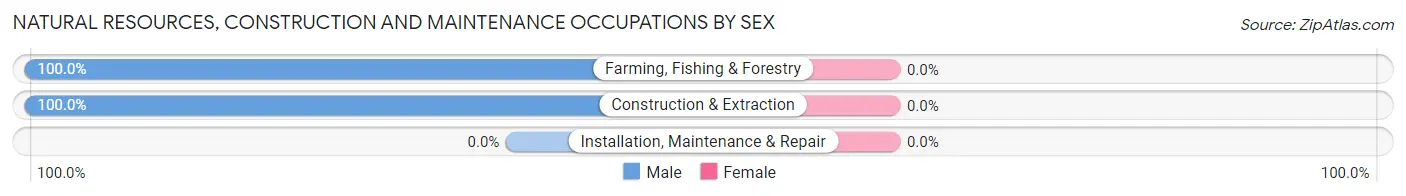
| Occupation | Male | Female |
| Farming, Fishing & Forestry | 52 (100.0%) | 0 (0.0%) |
| Construction & Extraction | 4 (100.0%) | 0 (0.0%) |
| Installation, Maintenance & Repair | 0 (0.0%) | 0 (0.0%) |
| Total (Category) | 56 (100.0%) | 0 (0.0%) |
| Total (Overall) | 135 (87.1%) | 20 (12.9%) |
Production, Transportation and Moving Occupations
The most common Production, Transportation and Moving occupations in Smith Island are , and Transportation (38 | 24.5%).
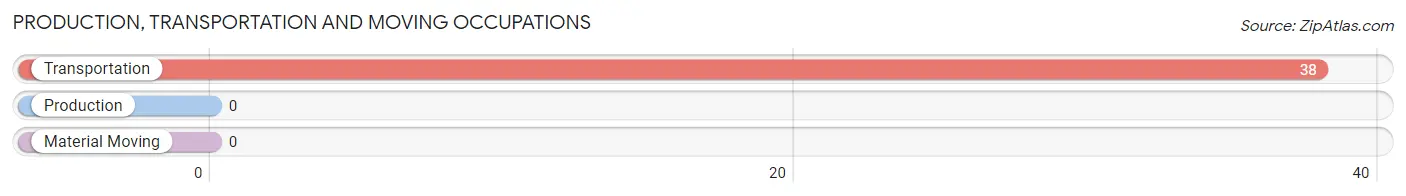
Production, Transportation and Moving Occupations by Sex
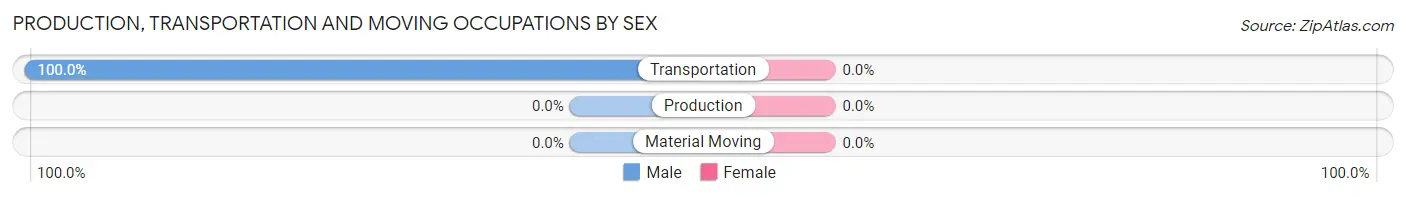
| Occupation | Male | Female |
| Production | 0 (0.0%) | 0 (0.0%) |
| Transportation | 38 (100.0%) | 0 (0.0%) |
| Material Moving | 0 (0.0%) | 0 (0.0%) |
| Total (Category) | 38 (100.0%) | 0 (0.0%) |
| Total (Overall) | 135 (87.1%) | 20 (12.9%) |
Employment Industries by Sex in Smith Island
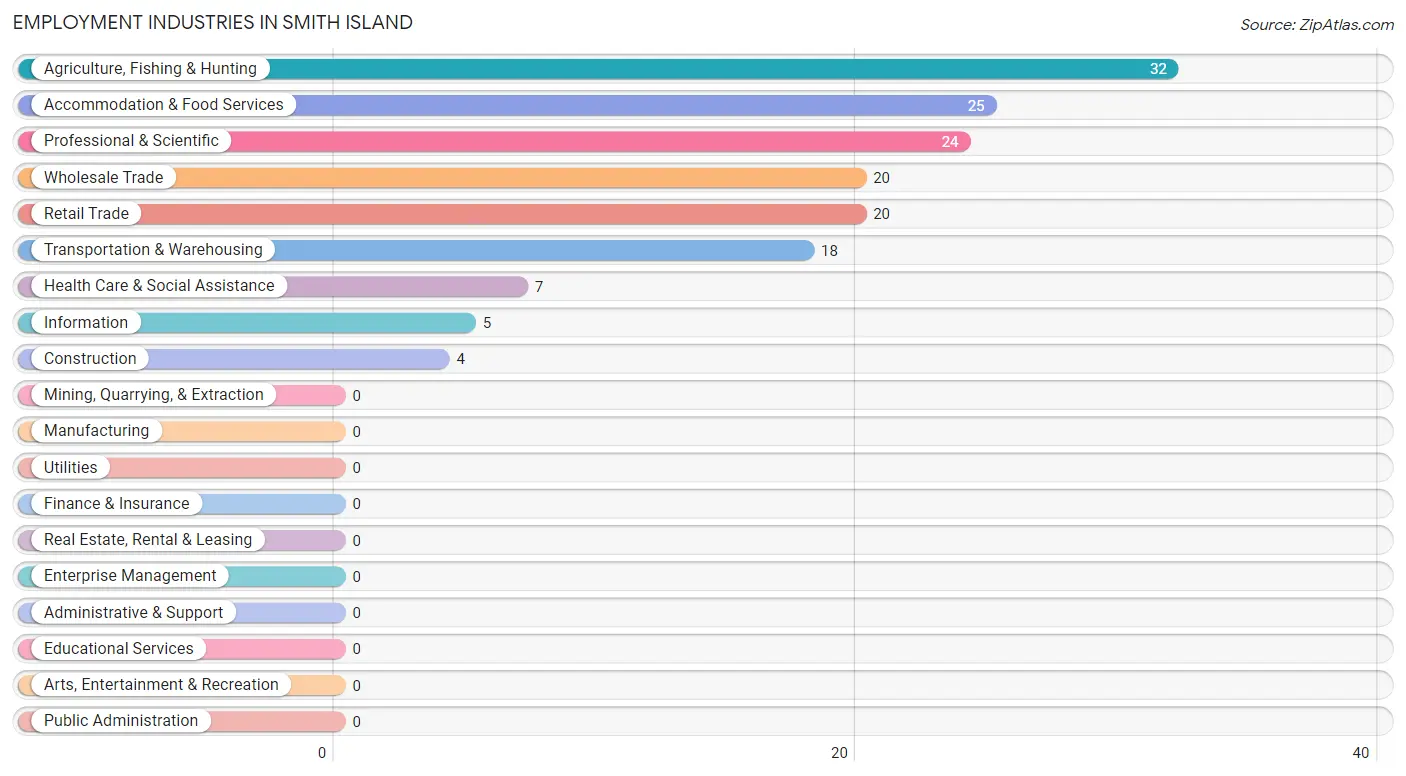
Employment Industries in Smith Island
The major employment industries in Smith Island include Agriculture, Fishing & Hunting (32 | 20.6%), Accommodation & Food Services (25 | 16.1%), Professional & Scientific (24 | 15.5%), Wholesale Trade (20 | 12.9%), and Retail Trade (20 | 12.9%).
Employment Industries by Sex in Smith Island
The Smith Island industries that see more men than women are Agriculture, Fishing & Hunting (100.0%), Construction (100.0%), and Wholesale Trade (100.0%), whereas the industries that tend to have a higher number of women are Information (100.0%), Accommodation & Food Services (52.0%), and Health Care & Social Assistance (28.6%).
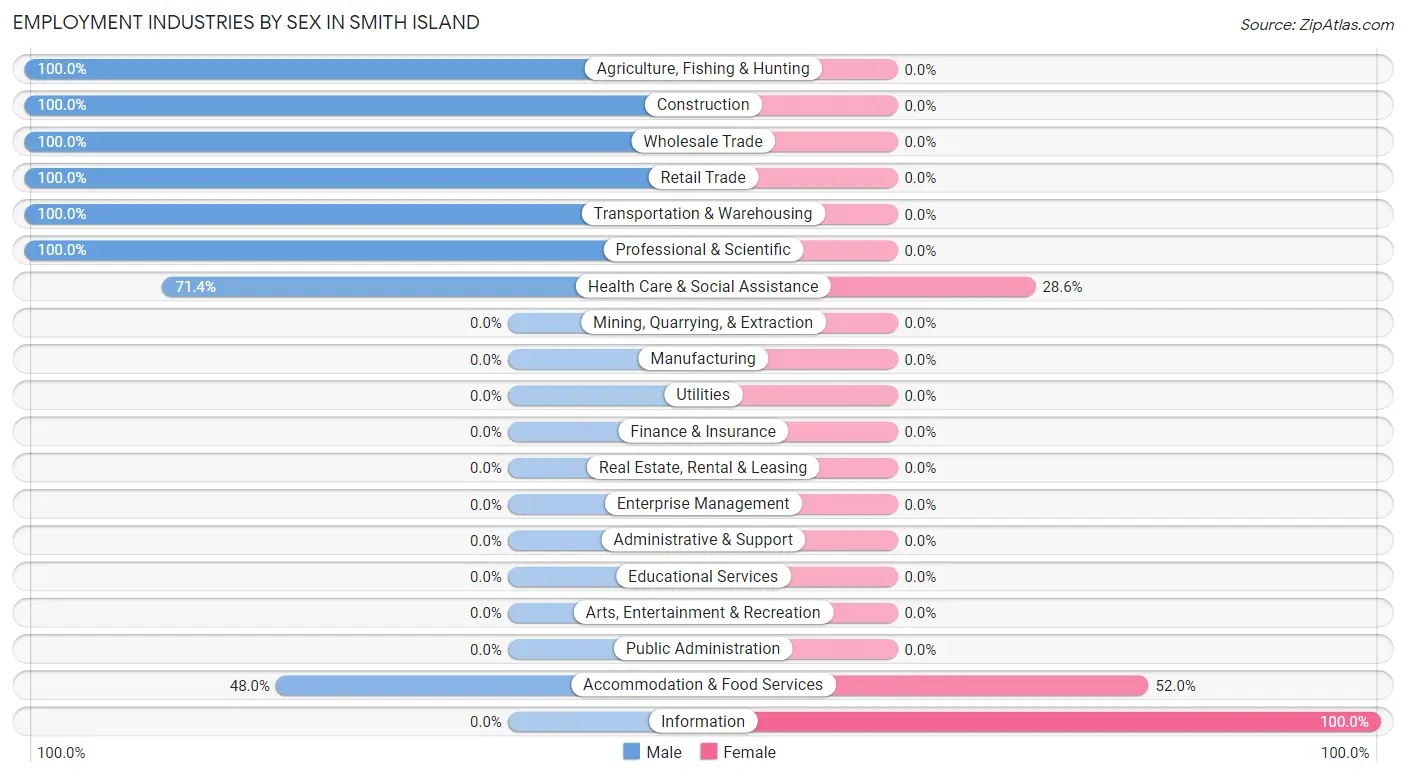
| Industry | Male | Female |
| Agriculture, Fishing & Hunting | 32 (100.0%) | 0 (0.0%) |
| Mining, Quarrying, & Extraction | 0 (0.0%) | 0 (0.0%) |
| Construction | 4 (100.0%) | 0 (0.0%) |
| Manufacturing | 0 (0.0%) | 0 (0.0%) |
| Wholesale Trade | 20 (100.0%) | 0 (0.0%) |
| Retail Trade | 20 (100.0%) | 0 (0.0%) |
| Transportation & Warehousing | 18 (100.0%) | 0 (0.0%) |
| Utilities | 0 (0.0%) | 0 (0.0%) |
| Information | 0 (0.0%) | 5 (100.0%) |
| Finance & Insurance | 0 (0.0%) | 0 (0.0%) |
| Real Estate, Rental & Leasing | 0 (0.0%) | 0 (0.0%) |
| Professional & Scientific | 24 (100.0%) | 0 (0.0%) |
| Enterprise Management | 0 (0.0%) | 0 (0.0%) |
| Administrative & Support | 0 (0.0%) | 0 (0.0%) |
| Educational Services | 0 (0.0%) | 0 (0.0%) |
| Health Care & Social Assistance | 5 (71.4%) | 2 (28.6%) |
| Arts, Entertainment & Recreation | 0 (0.0%) | 0 (0.0%) |
| Accommodation & Food Services | 12 (48.0%) | 13 (52.0%) |
| Public Administration | 0 (0.0%) | 0 (0.0%) |
| Total | 135 (87.1%) | 20 (12.9%) |
Education in Smith Island
School Enrollment in Smith Island
The most common levels of schooling among the 66 students in Smith Island are middle school (32 | 48.5%), elementary school (27 | 40.9%), and high school (7 | 10.6%).
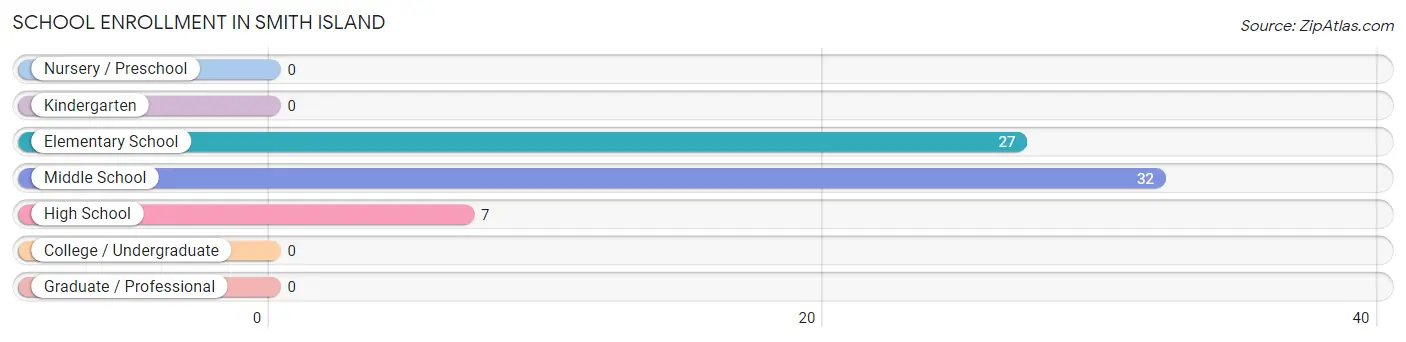
| School Level | # Students | % Students |
| Nursery / Preschool | 0 | 0.0% |
| Kindergarten | 0 | 0.0% |
| Elementary School | 27 | 40.9% |
| Middle School | 32 | 48.5% |
| High School | 7 | 10.6% |
| College / Undergraduate | 0 | 0.0% |
| Graduate / Professional | 0 | 0.0% |
| Total | 66 | 100.0% |
School Enrollment by Age by Funding Source in Smith Island
Out of a total of 66 students who are enrolled in schools in Smith Island, 55 (83.3%) attend a private institution, while the remaining 11 (16.7%) are enrolled in public schools. The age group of 5 to 9 year old has the highest likelihood of being enrolled in private schools, with 27 (100.0% in the age bracket) enrolled. Conversely, the age group of 18 to 19 year olds has the lowest likelihood of being enrolled in a private school, with 7 (100.0% in the age bracket) attending a public institution.
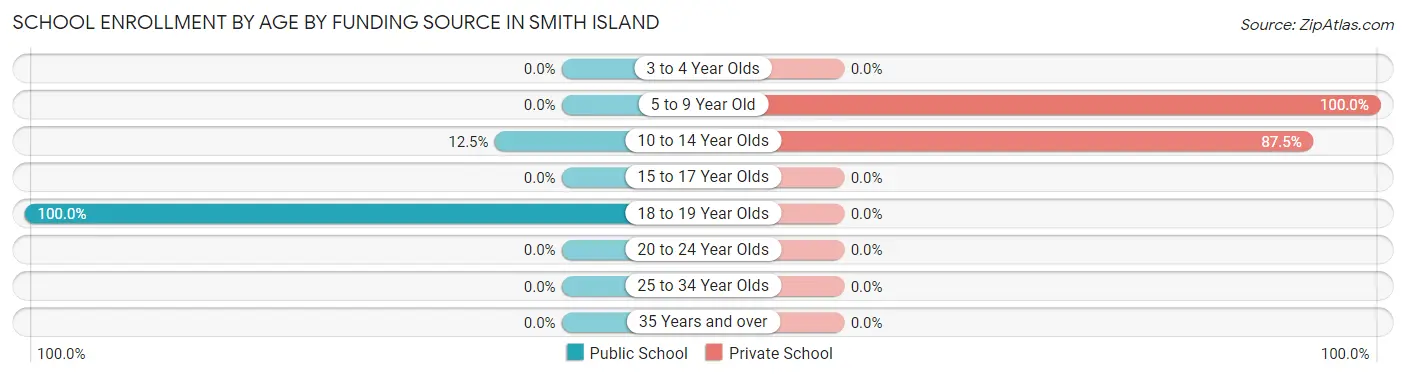
| Age Bracket | Public School | Private School |
| 3 to 4 Year Olds | 0 (0.0%) | 0 (0.0%) |
| 5 to 9 Year Old | 0 (0.0%) | 27 (100.0%) |
| 10 to 14 Year Olds | 4 (12.5%) | 28 (87.5%) |
| 15 to 17 Year Olds | 0 (0.0%) | 0 (0.0%) |
| 18 to 19 Year Olds | 7 (100.0%) | 0 (0.0%) |
| 20 to 24 Year Olds | 0 (0.0%) | 0 (0.0%) |
| 25 to 34 Year Olds | 0 (0.0%) | 0 (0.0%) |
| 35 Years and over | 0 (0.0%) | 0 (0.0%) |
| Total | 11 (16.7%) | 55 (83.3%) |
Educational Attainment by Field of Study in Smith Island
, and education (7 | 100.0%) are the most common fields of study among 7 individuals in Smith Island who have obtained a bachelor's degree or higher.
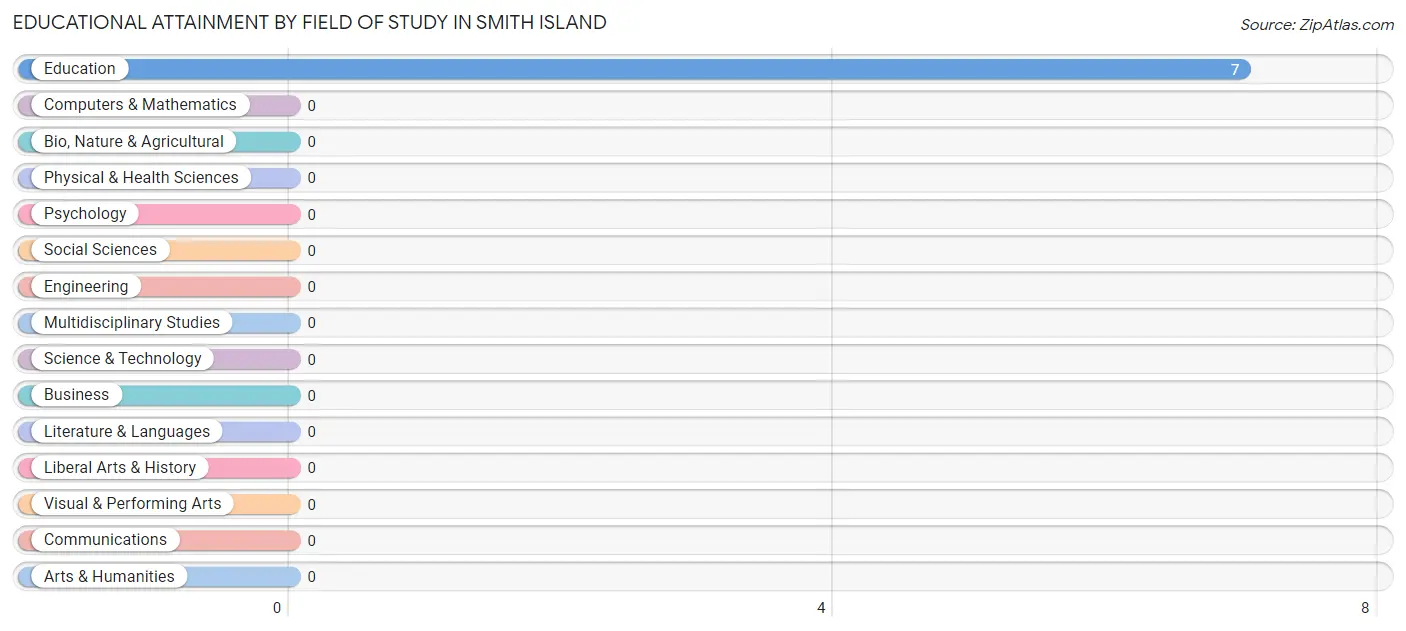
| Field of Study | # Graduates | % Graduates |
| Computers & Mathematics | 0 | 0.0% |
| Bio, Nature & Agricultural | 0 | 0.0% |
| Physical & Health Sciences | 0 | 0.0% |
| Psychology | 0 | 0.0% |
| Social Sciences | 0 | 0.0% |
| Engineering | 0 | 0.0% |
| Multidisciplinary Studies | 0 | 0.0% |
| Science & Technology | 0 | 0.0% |
| Business | 0 | 0.0% |
| Education | 7 | 100.0% |
| Literature & Languages | 0 | 0.0% |
| Liberal Arts & History | 0 | 0.0% |
| Visual & Performing Arts | 0 | 0.0% |
| Communications | 0 | 0.0% |
| Arts & Humanities | 0 | 0.0% |
| Total | 7 | 100.0% |
Transportation & Commute in Smith Island
Vehicle Availability by Sex in Smith Island
The most prevalent vehicle ownership categories in Smith Island are males with 1 vehicle (71, accounting for 52.6%) and females with 1 vehicle (13, making up 355.0%).
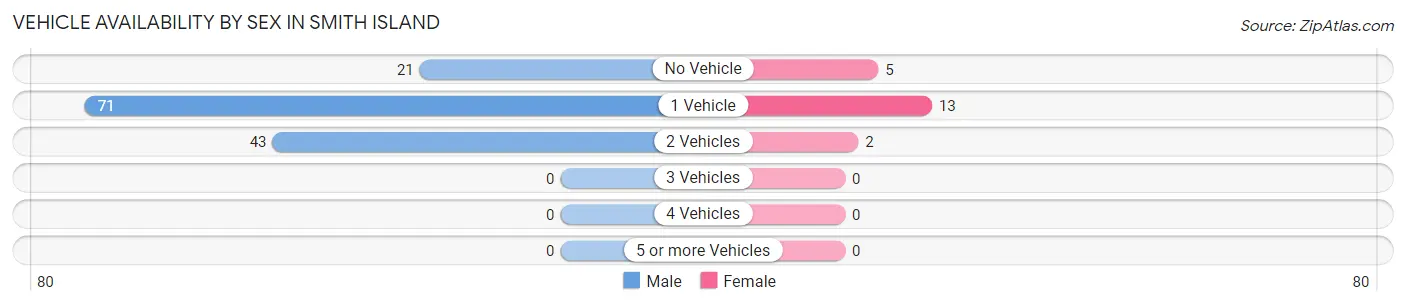
| Vehicles Available | Male | Female |
| No Vehicle | 21 (15.6%) | 5 (25.0%) |
| 1 Vehicle | 71 (52.6%) | 13 (65.0%) |
| 2 Vehicles | 43 (31.9%) | 2 (10.0%) |
| 3 Vehicles | 0 (0.0%) | 0 (0.0%) |
| 4 Vehicles | 0 (0.0%) | 0 (0.0%) |
| 5 or more Vehicles | 0 (0.0%) | 0 (0.0%) |
| Total | 135 (100.0%) | 20 (100.0%) |
Commute Time in Smith Island
The most frequently occuring commute durations in Smith Island are 5 to 9 minutes (48 commuters, 42.9%), 15 to 19 minutes (24 commuters, 21.4%), and 10 to 14 minutes (22 commuters, 19.6%).
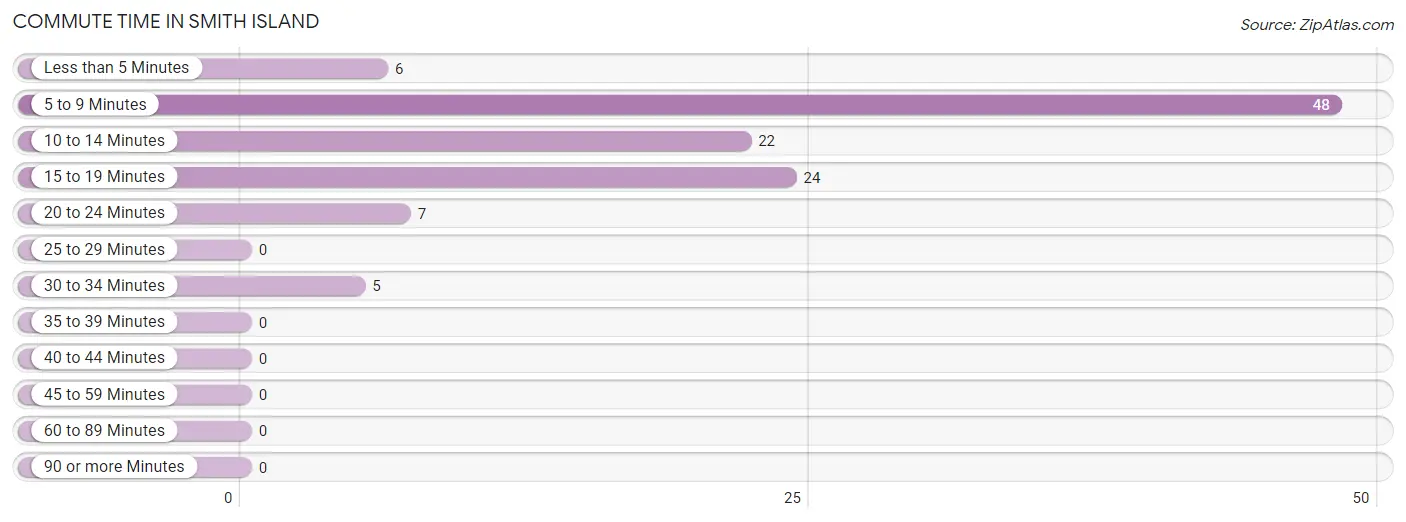
| Commute Time | # Commuters | % Commuters |
| Less than 5 Minutes | 6 | 5.4% |
| 5 to 9 Minutes | 48 | 42.9% |
| 10 to 14 Minutes | 22 | 19.6% |
| 15 to 19 Minutes | 24 | 21.4% |
| 20 to 24 Minutes | 7 | 6.2% |
| 25 to 29 Minutes | 0 | 0.0% |
| 30 to 34 Minutes | 5 | 4.5% |
| 35 to 39 Minutes | 0 | 0.0% |
| 40 to 44 Minutes | 0 | 0.0% |
| 45 to 59 Minutes | 0 | 0.0% |
| 60 to 89 Minutes | 0 | 0.0% |
| 90 or more Minutes | 0 | 0.0% |
Commute Time by Sex in Smith Island
The most common commute times in Smith Island are 5 to 9 minutes (46 commuters, 50.0%) for males and 20 to 24 minutes (7 commuters, 35.0%) for females.
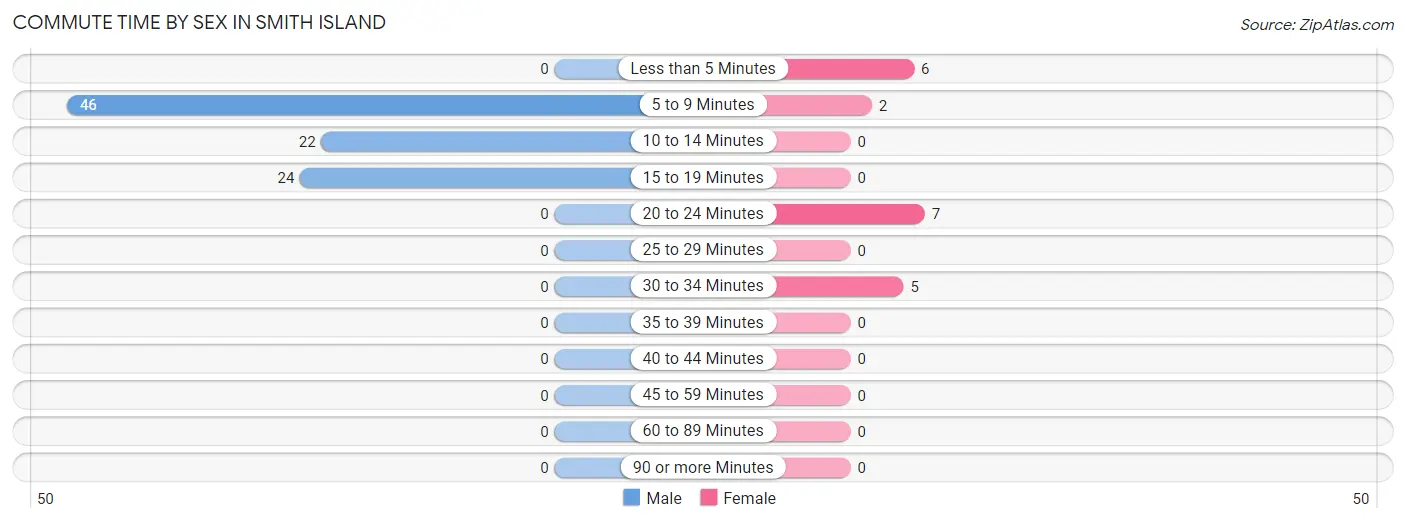
| Commute Time | Male | Female |
| Less than 5 Minutes | 0 (0.0%) | 6 (30.0%) |
| 5 to 9 Minutes | 46 (50.0%) | 2 (10.0%) |
| 10 to 14 Minutes | 22 (23.9%) | 0 (0.0%) |
| 15 to 19 Minutes | 24 (26.1%) | 0 (0.0%) |
| 20 to 24 Minutes | 0 (0.0%) | 7 (35.0%) |
| 25 to 29 Minutes | 0 (0.0%) | 0 (0.0%) |
| 30 to 34 Minutes | 0 (0.0%) | 5 (25.0%) |
| 35 to 39 Minutes | 0 (0.0%) | 0 (0.0%) |
| 40 to 44 Minutes | 0 (0.0%) | 0 (0.0%) |
| 45 to 59 Minutes | 0 (0.0%) | 0 (0.0%) |
| 60 to 89 Minutes | 0 (0.0%) | 0 (0.0%) |
| 90 or more Minutes | 0 (0.0%) | 0 (0.0%) |
Time of Departure to Work by Sex in Smith Island
The most frequent times of departure to work in Smith Island are 12:00 AM to 4:59 AM (22, 23.9%) for males and 10:00 AM to 10:59 AM (13, 65.0%) for females.
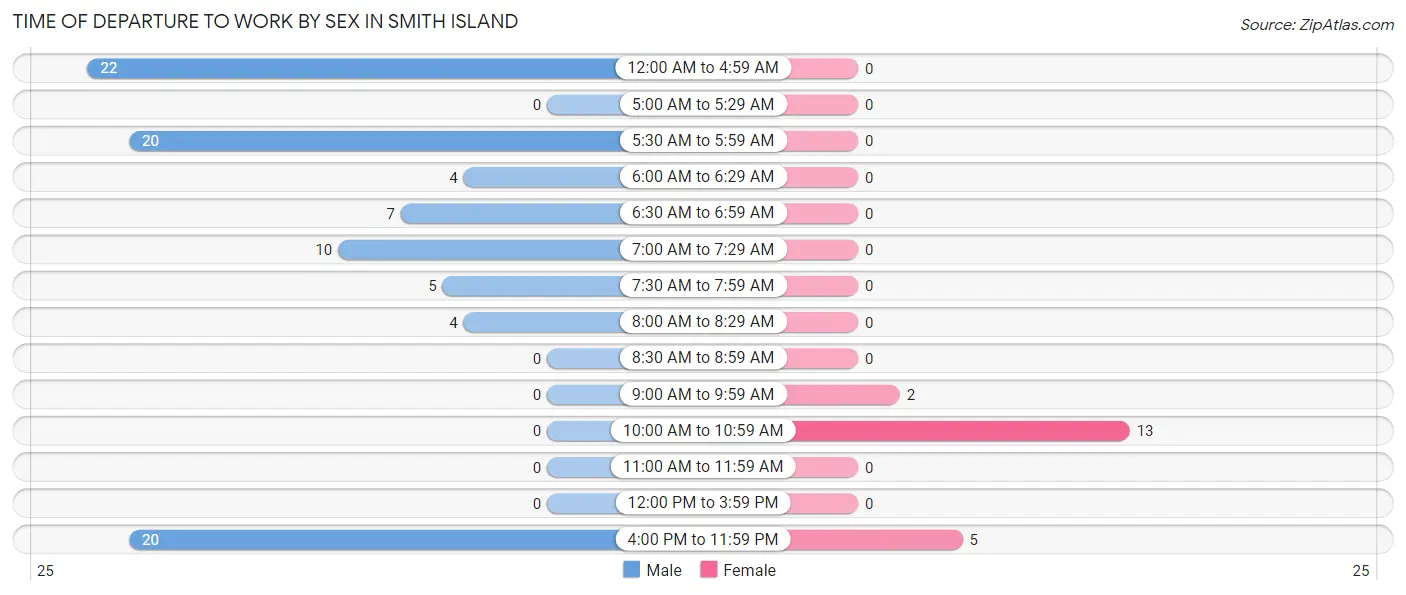
| Time of Departure | Male | Female |
| 12:00 AM to 4:59 AM | 22 (23.9%) | 0 (0.0%) |
| 5:00 AM to 5:29 AM | 0 (0.0%) | 0 (0.0%) |
| 5:30 AM to 5:59 AM | 20 (21.7%) | 0 (0.0%) |
| 6:00 AM to 6:29 AM | 4 (4.3%) | 0 (0.0%) |
| 6:30 AM to 6:59 AM | 7 (7.6%) | 0 (0.0%) |
| 7:00 AM to 7:29 AM | 10 (10.9%) | 0 (0.0%) |
| 7:30 AM to 7:59 AM | 5 (5.4%) | 0 (0.0%) |
| 8:00 AM to 8:29 AM | 4 (4.3%) | 0 (0.0%) |
| 8:30 AM to 8:59 AM | 0 (0.0%) | 0 (0.0%) |
| 9:00 AM to 9:59 AM | 0 (0.0%) | 2 (10.0%) |
| 10:00 AM to 10:59 AM | 0 (0.0%) | 13 (65.0%) |
| 11:00 AM to 11:59 AM | 0 (0.0%) | 0 (0.0%) |
| 12:00 PM to 3:59 PM | 0 (0.0%) | 0 (0.0%) |
| 4:00 PM to 11:59 PM | 20 (21.7%) | 5 (25.0%) |
| Total | 92 (100.0%) | 20 (100.0%) |
Housing Occupancy in Smith Island
Occupancy by Ownership in Smith Island
Of the total 183 dwellings in Smith Island, owner-occupied units account for 163 (89.1%), while renter-occupied units make up 20 (10.9%).
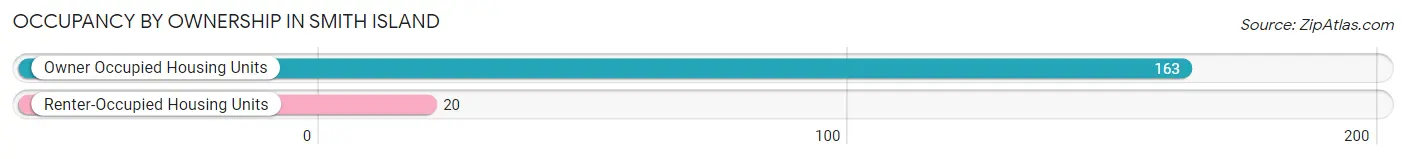
| Occupancy | # Housing Units | % Housing Units |
| Owner Occupied Housing Units | 163 | 89.1% |
| Renter-Occupied Housing Units | 20 | 10.9% |
| Total Occupied Housing Units | 183 | 100.0% |
Occupancy by Household Size in Smith Island
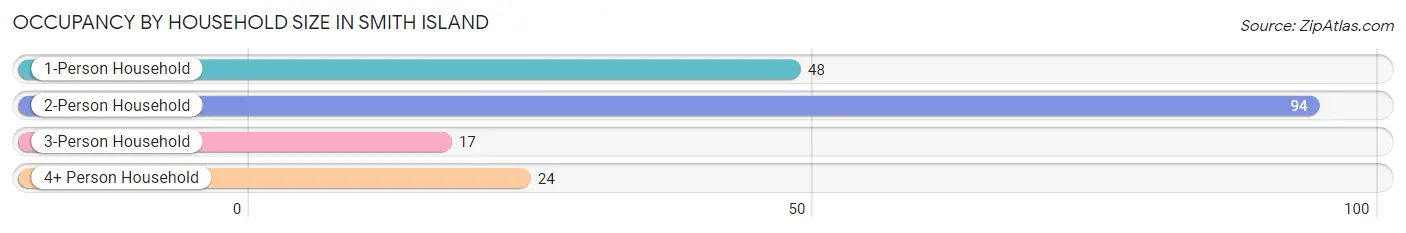
| Household Size | # Housing Units | % Housing Units |
| 1-Person Household | 48 | 26.2% |
| 2-Person Household | 94 | 51.4% |
| 3-Person Household | 17 | 9.3% |
| 4+ Person Household | 24 | 13.1% |
| Total Housing Units | 183 | 100.0% |
Occupancy by Ownership by Household Size in Smith Island
| Household Size | Owner-occupied | Renter-occupied |
| 1-Person Household | 28 (58.3%) | 20 (41.7%) |
| 2-Person Household | 94 (100.0%) | 0 (0.0%) |
| 3-Person Household | 17 (100.0%) | 0 (0.0%) |
| 4+ Person Household | 24 (100.0%) | 0 (0.0%) |
| Total Housing Units | 163 (89.1%) | 20 (10.9%) |
Occupancy by Educational Attainment in Smith Island
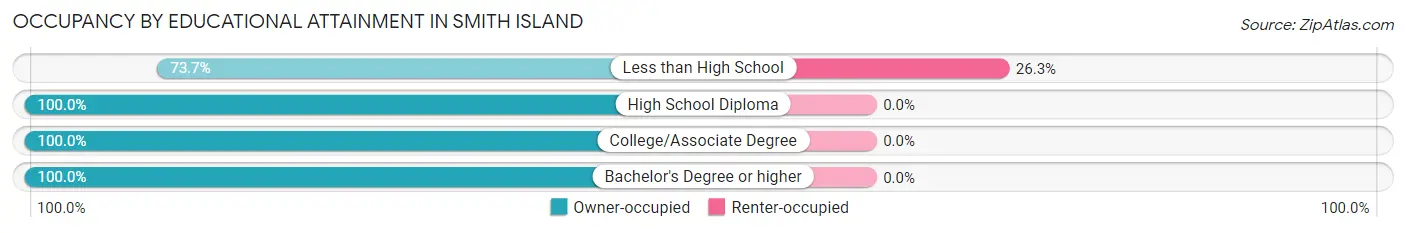
| Household Size | Owner-occupied | Renter-occupied |
| Less than High School | 56 (73.7%) | 20 (26.3%) |
| High School Diploma | 59 (100.0%) | 0 (0.0%) |
| College/Associate Degree | 41 (100.0%) | 0 (0.0%) |
| Bachelor's Degree or higher | 7 (100.0%) | 0 (0.0%) |
Occupancy by Age of Householder in Smith Island
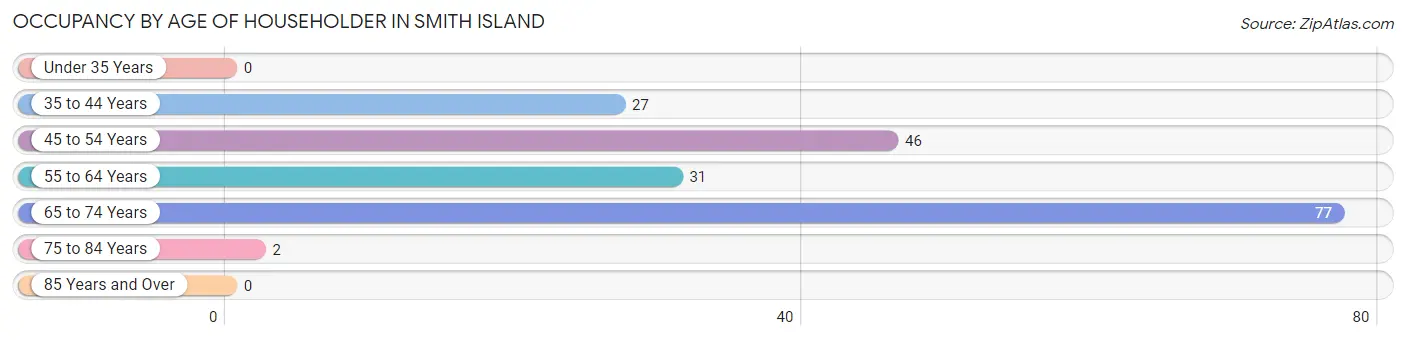
| Age Bracket | # Households | % Households |
| Under 35 Years | 0 | 0.0% |
| 35 to 44 Years | 27 | 14.7% |
| 45 to 54 Years | 46 | 25.1% |
| 55 to 64 Years | 31 | 16.9% |
| 65 to 74 Years | 77 | 42.1% |
| 75 to 84 Years | 2 | 1.1% |
| 85 Years and Over | 0 | 0.0% |
| Total | 183 | 100.0% |
Housing Finances in Smith Island
Median Income by Occupancy in Smith Island
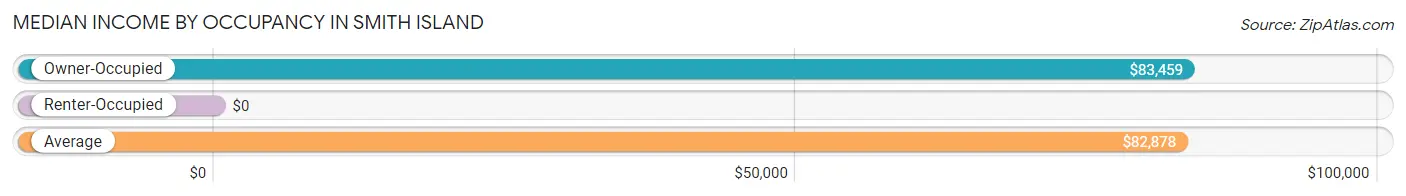
| Occupancy Type | # Households | Median Income |
| Owner-Occupied | 163 (89.1%) | $83,459 |
| Renter-Occupied | 20 (10.9%) | $0 |
| Average | 183 (100.0%) | $82,878 |
Occupancy by Householder Income Bracket in Smith Island
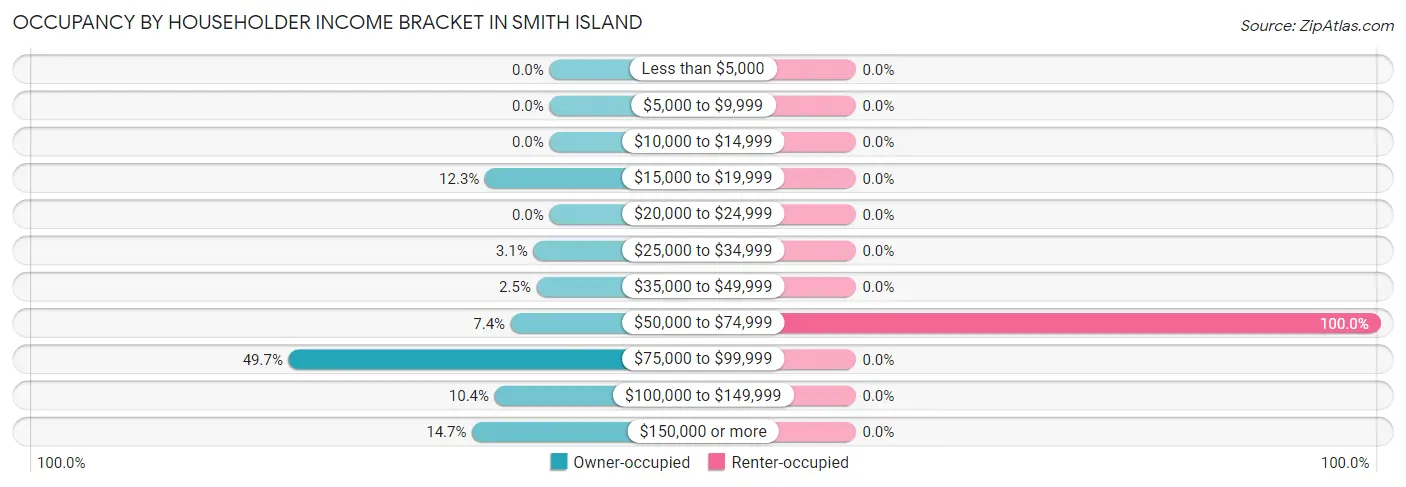
| Income Bracket | Owner-occupied | Renter-occupied |
| Less than $5,000 | 0 (0.0%) | 0 (0.0%) |
| $5,000 to $9,999 | 0 (0.0%) | 0 (0.0%) |
| $10,000 to $14,999 | 0 (0.0%) | 0 (0.0%) |
| $15,000 to $19,999 | 20 (12.3%) | 0 (0.0%) |
| $20,000 to $24,999 | 0 (0.0%) | 0 (0.0%) |
| $25,000 to $34,999 | 5 (3.1%) | 0 (0.0%) |
| $35,000 to $49,999 | 4 (2.5%) | 0 (0.0%) |
| $50,000 to $74,999 | 12 (7.4%) | 20 (100.0%) |
| $75,000 to $99,999 | 81 (49.7%) | 0 (0.0%) |
| $100,000 to $149,999 | 17 (10.4%) | 0 (0.0%) |
| $150,000 or more | 24 (14.7%) | 0 (0.0%) |
| Total | 163 (100.0%) | 20 (100.0%) |
Monthly Housing Cost Tiers in Smith Island
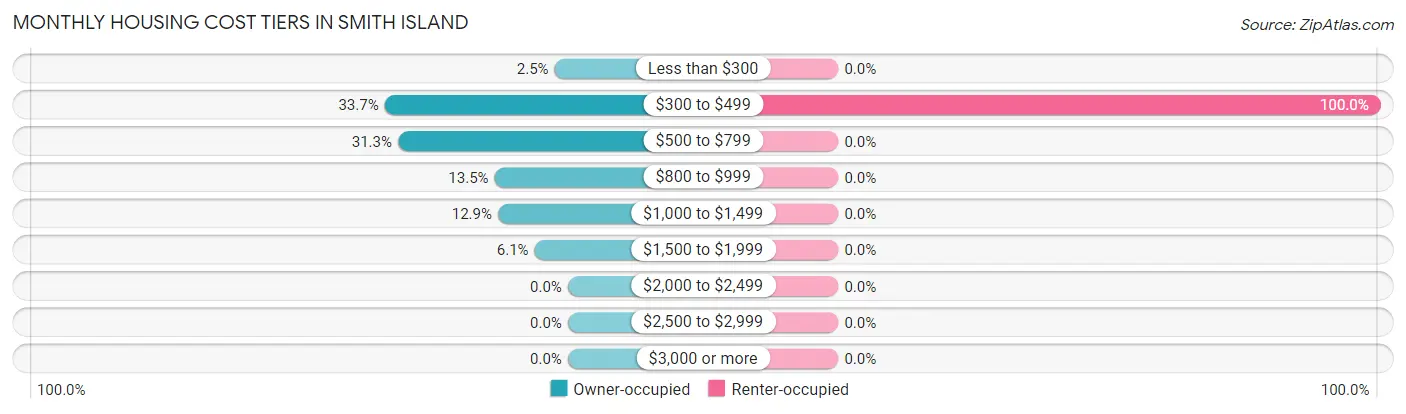
| Monthly Cost | Owner-occupied | Renter-occupied |
| Less than $300 | 4 (2.5%) | 0 (0.0%) |
| $300 to $499 | 55 (33.7%) | 20 (100.0%) |
| $500 to $799 | 51 (31.3%) | 0 (0.0%) |
| $800 to $999 | 22 (13.5%) | 0 (0.0%) |
| $1,000 to $1,499 | 21 (12.9%) | 0 (0.0%) |
| $1,500 to $1,999 | 10 (6.1%) | 0 (0.0%) |
| $2,000 to $2,499 | 0 (0.0%) | 0 (0.0%) |
| $2,500 to $2,999 | 0 (0.0%) | 0 (0.0%) |
| $3,000 or more | 0 (0.0%) | 0 (0.0%) |
| Total | 163 (100.0%) | 20 (100.0%) |
Physical Housing Characteristics in Smith Island
Housing Structures in Smith Island
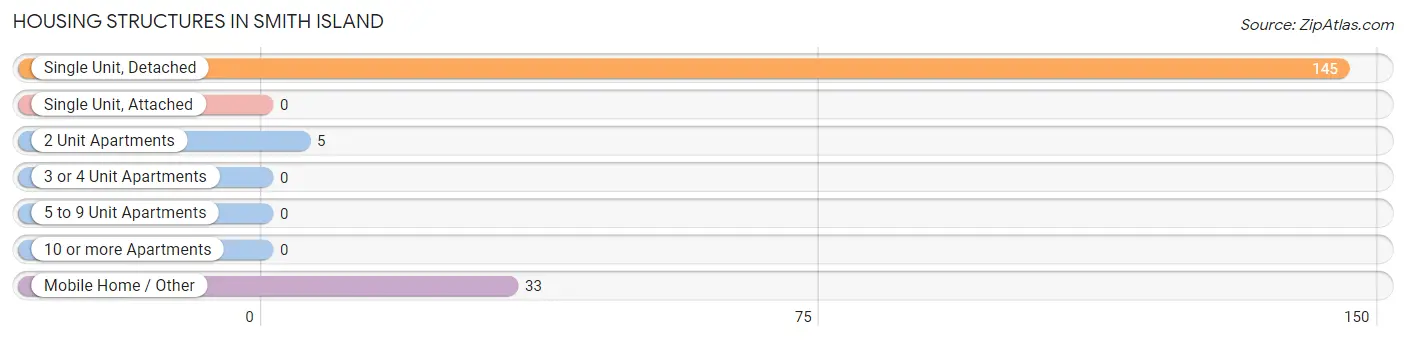
| Structure Type | # Housing Units | % Housing Units |
| Single Unit, Detached | 145 | 79.2% |
| Single Unit, Attached | 0 | 0.0% |
| 2 Unit Apartments | 5 | 2.7% |
| 3 or 4 Unit Apartments | 0 | 0.0% |
| 5 to 9 Unit Apartments | 0 | 0.0% |
| 10 or more Apartments | 0 | 0.0% |
| Mobile Home / Other | 33 | 18.0% |
| Total | 183 | 100.0% |
Housing Structures by Occupancy in Smith Island
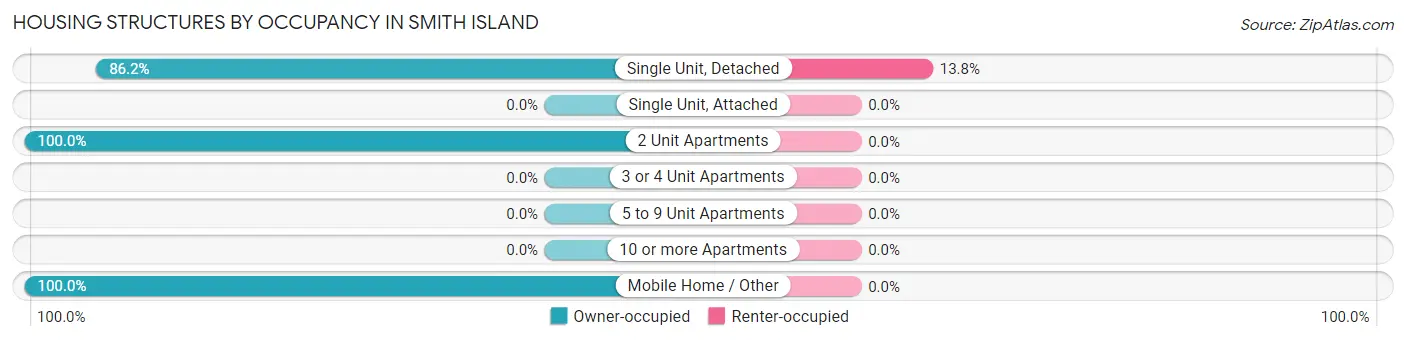
| Structure Type | Owner-occupied | Renter-occupied |
| Single Unit, Detached | 125 (86.2%) | 20 (13.8%) |
| Single Unit, Attached | 0 (0.0%) | 0 (0.0%) |
| 2 Unit Apartments | 5 (100.0%) | 0 (0.0%) |
| 3 or 4 Unit Apartments | 0 (0.0%) | 0 (0.0%) |
| 5 to 9 Unit Apartments | 0 (0.0%) | 0 (0.0%) |
| 10 or more Apartments | 0 (0.0%) | 0 (0.0%) |
| Mobile Home / Other | 33 (100.0%) | 0 (0.0%) |
| Total | 163 (89.1%) | 20 (10.9%) |
Housing Structures by Number of Rooms in Smith Island
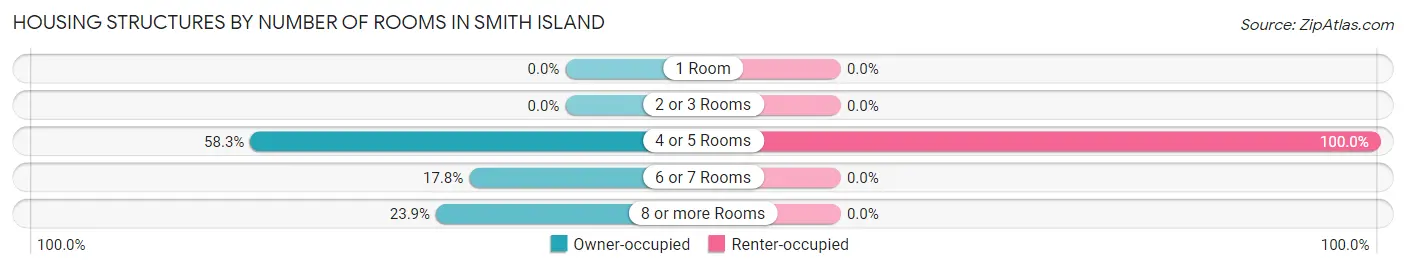
| Number of Rooms | Owner-occupied | Renter-occupied |
| 1 Room | 0 (0.0%) | 0 (0.0%) |
| 2 or 3 Rooms | 0 (0.0%) | 0 (0.0%) |
| 4 or 5 Rooms | 95 (58.3%) | 20 (100.0%) |
| 6 or 7 Rooms | 29 (17.8%) | 0 (0.0%) |
| 8 or more Rooms | 39 (23.9%) | 0 (0.0%) |
| Total | 163 (100.0%) | 20 (100.0%) |
Housing Structure by Heating Type in Smith Island
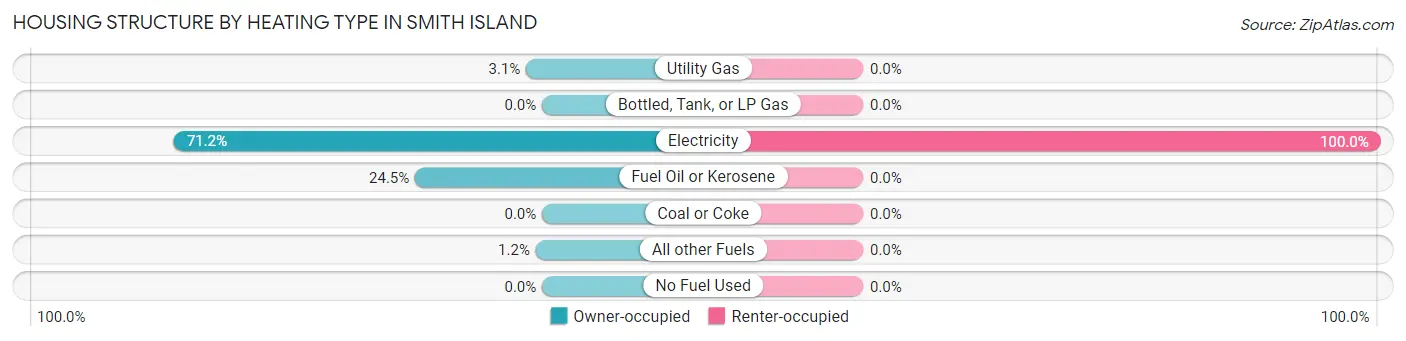
| Heating Type | Owner-occupied | Renter-occupied |
| Utility Gas | 5 (3.1%) | 0 (0.0%) |
| Bottled, Tank, or LP Gas | 0 (0.0%) | 0 (0.0%) |
| Electricity | 116 (71.2%) | 20 (100.0%) |
| Fuel Oil or Kerosene | 40 (24.5%) | 0 (0.0%) |
| Coal or Coke | 0 (0.0%) | 0 (0.0%) |
| All other Fuels | 2 (1.2%) | 0 (0.0%) |
| No Fuel Used | 0 (0.0%) | 0 (0.0%) |
| Total | 163 (100.0%) | 20 (100.0%) |
Household Vehicle Usage in Smith Island
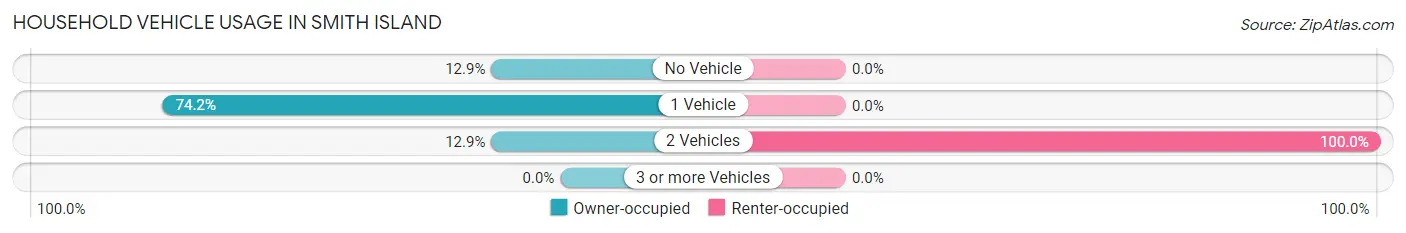
| Vehicles per Household | Owner-occupied | Renter-occupied |
| No Vehicle | 21 (12.9%) | 0 (0.0%) |
| 1 Vehicle | 121 (74.2%) | 0 (0.0%) |
| 2 Vehicles | 21 (12.9%) | 20 (100.0%) |
| 3 or more Vehicles | 0 (0.0%) | 0 (0.0%) |
| Total | 163 (100.0%) | 20 (100.0%) |
Real Estate & Mortgages in Smith Island
Real Estate and Mortgage Overview in Smith Island
| Characteristic | Without Mortgage | With Mortgage |
| Housing Units | 83 | 80 |
| Median Property Value | $104,400 | $116,100 |
| Median Household Income | $82,994 | $24 |
| Monthly Housing Costs | $464 | $0 |
| Real Estate Taxes | $1,215 | $0 |
Property Value by Mortgage Status in Smith Island
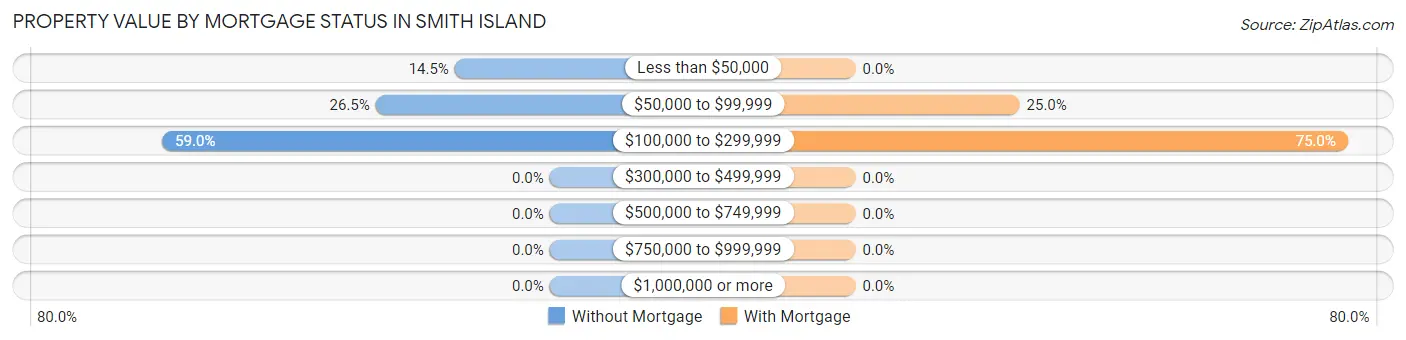
| Property Value | Without Mortgage | With Mortgage |
| Less than $50,000 | 12 (14.5%) | 0 (0.0%) |
| $50,000 to $99,999 | 22 (26.5%) | 20 (25.0%) |
| $100,000 to $299,999 | 49 (59.0%) | 60 (75.0%) |
| $300,000 to $499,999 | 0 (0.0%) | 0 (0.0%) |
| $500,000 to $749,999 | 0 (0.0%) | 0 (0.0%) |
| $750,000 to $999,999 | 0 (0.0%) | 0 (0.0%) |
| $1,000,000 or more | 0 (0.0%) | 0 (0.0%) |
| Total | 83 (100.0%) | 80 (100.0%) |
Household Income by Mortgage Status in Smith Island
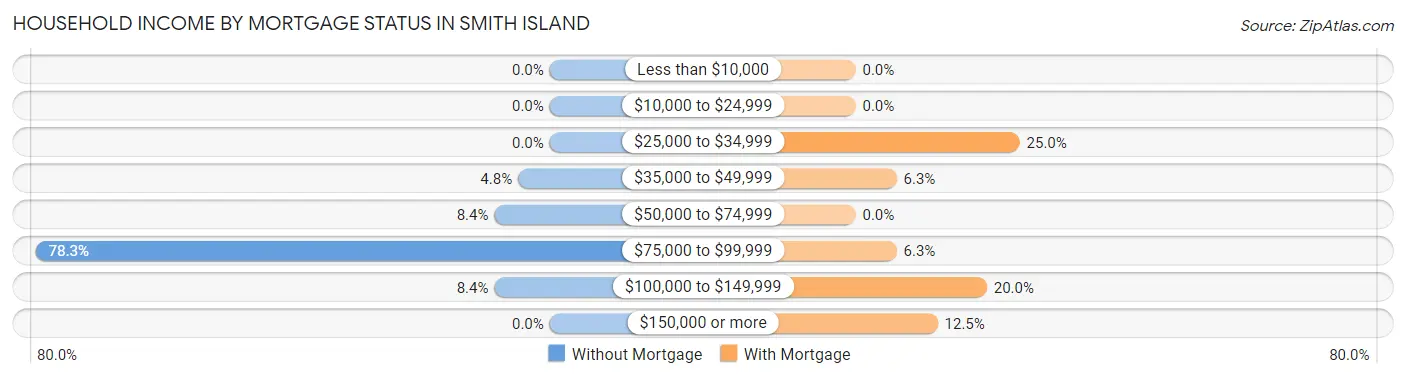
| Household Income | Without Mortgage | With Mortgage |
| Less than $10,000 | 0 (0.0%) | 0 (0.0%) |
| $10,000 to $24,999 | 0 (0.0%) | 0 (0.0%) |
| $25,000 to $34,999 | 0 (0.0%) | 20 (25.0%) |
| $35,000 to $49,999 | 4 (4.8%) | 5 (6.2%) |
| $50,000 to $74,999 | 7 (8.4%) | 0 (0.0%) |
| $75,000 to $99,999 | 65 (78.3%) | 5 (6.2%) |
| $100,000 to $149,999 | 7 (8.4%) | 16 (20.0%) |
| $150,000 or more | 0 (0.0%) | 10 (12.5%) |
| Total | 83 (100.0%) | 80 (100.0%) |
Property Value to Household Income Ratio in Smith Island
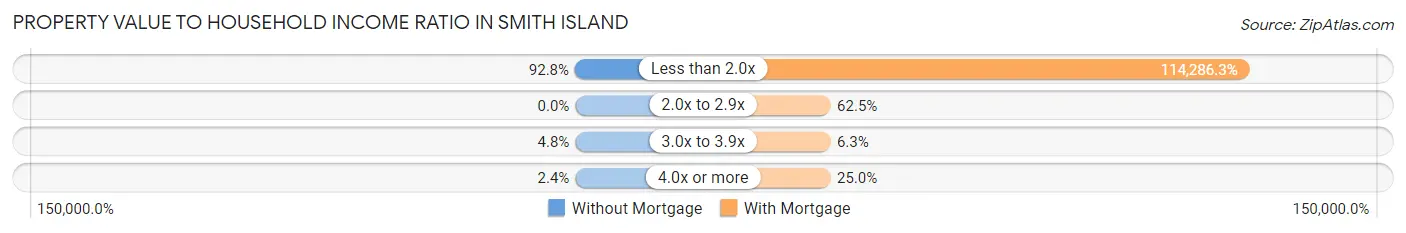
| Value-to-Income Ratio | Without Mortgage | With Mortgage |
| Less than 2.0x | 77 (92.8%) | 91,429 (114,286.2%) |
| 2.0x to 2.9x | 0 (0.0%) | 50 (62.5%) |
| 3.0x to 3.9x | 4 (4.8%) | 5 (6.2%) |
| 4.0x or more | 2 (2.4%) | 20 (25.0%) |
| Total | 83 (100.0%) | 80 (100.0%) |
Real Estate Taxes by Mortgage Status in Smith Island
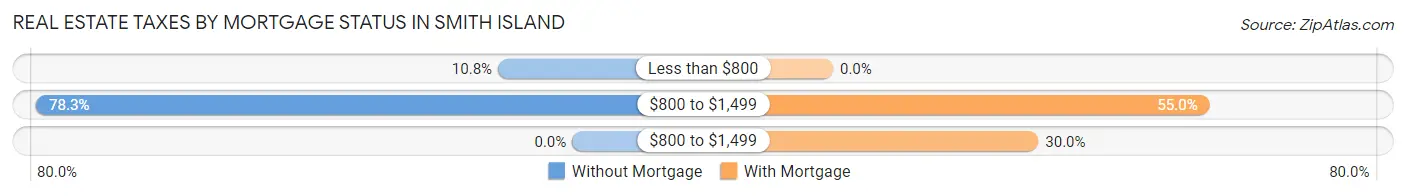
| Property Taxes | Without Mortgage | With Mortgage |
| Less than $800 | 9 (10.8%) | 0 (0.0%) |
| $800 to $1,499 | 65 (78.3%) | 44 (55.0%) |
| $800 to $1,499 | 0 (0.0%) | 24 (30.0%) |
| Total | 83 (100.0%) | 80 (100.0%) |
Health & Disability in Smith Island
Health Insurance Coverage by Age in Smith Island
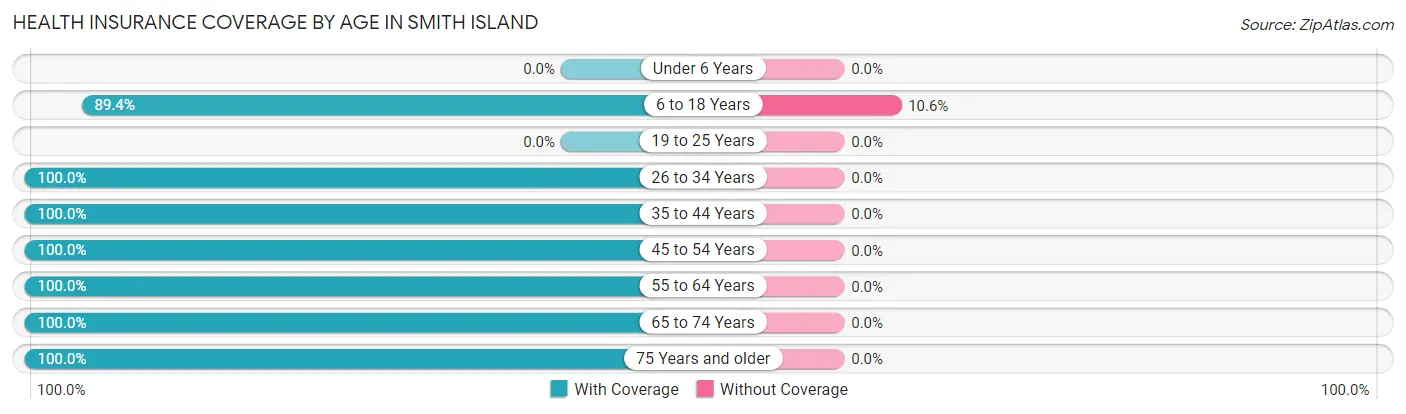
| Age Bracket | With Coverage | Without Coverage |
| Under 6 Years | 0 (0.0%) | 0 (0.0%) |
| 6 to 18 Years | 59 (89.4%) | 7 (10.6%) |
| 19 to 25 Years | 0 (0.0%) | 0 (0.0%) |
| 26 to 34 Years | 3 (100.0%) | 0 (0.0%) |
| 35 to 44 Years | 35 (100.0%) | 0 (0.0%) |
| 45 to 54 Years | 75 (100.0%) | 0 (0.0%) |
| 55 to 64 Years | 51 (100.0%) | 0 (0.0%) |
| 65 to 74 Years | 102 (100.0%) | 0 (0.0%) |
| 75 Years and older | 25 (100.0%) | 0 (0.0%) |
| Total | 350 (98.0%) | 7 (2.0%) |
Health Insurance Coverage by Citizenship Status in Smith Island
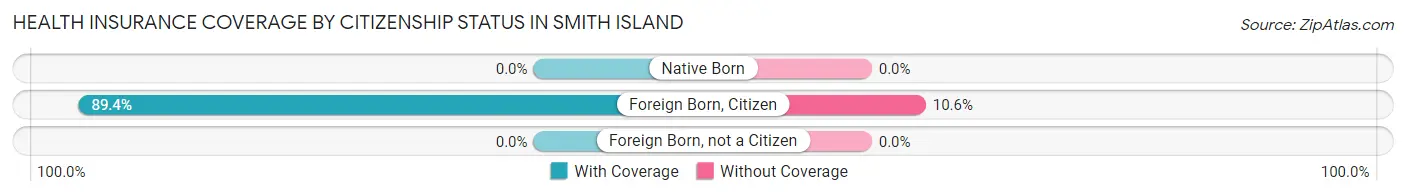
| Citizenship Status | With Coverage | Without Coverage |
| Native Born | 0 (0.0%) | 0 (0.0%) |
| Foreign Born, Citizen | 59 (89.4%) | 7 (10.6%) |
| Foreign Born, not a Citizen | 0 (0.0%) | 0 (0.0%) |
Health Insurance Coverage by Household Income in Smith Island
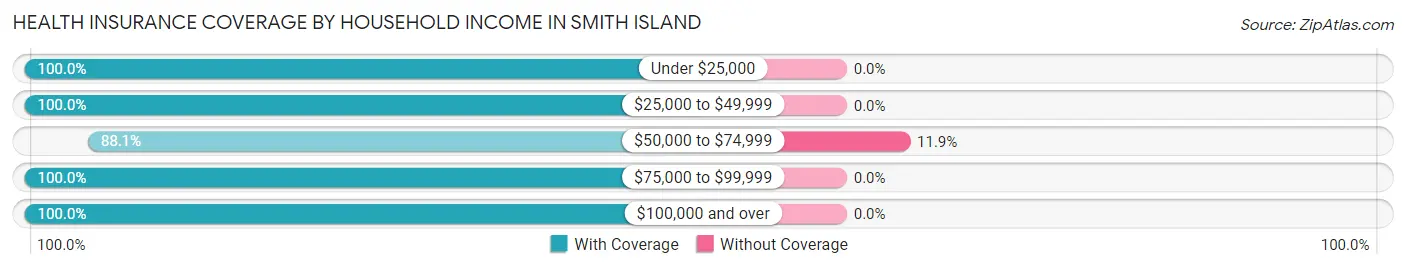
| Household Income | With Coverage | Without Coverage |
| Under $25,000 | 35 (100.0%) | 0 (0.0%) |
| $25,000 to $49,999 | 15 (100.0%) | 0 (0.0%) |
| $50,000 to $74,999 | 52 (88.1%) | 7 (11.9%) |
| $75,000 to $99,999 | 118 (100.0%) | 0 (0.0%) |
| $100,000 and over | 130 (100.0%) | 0 (0.0%) |
Public vs Private Health Insurance Coverage by Age in Smith Island
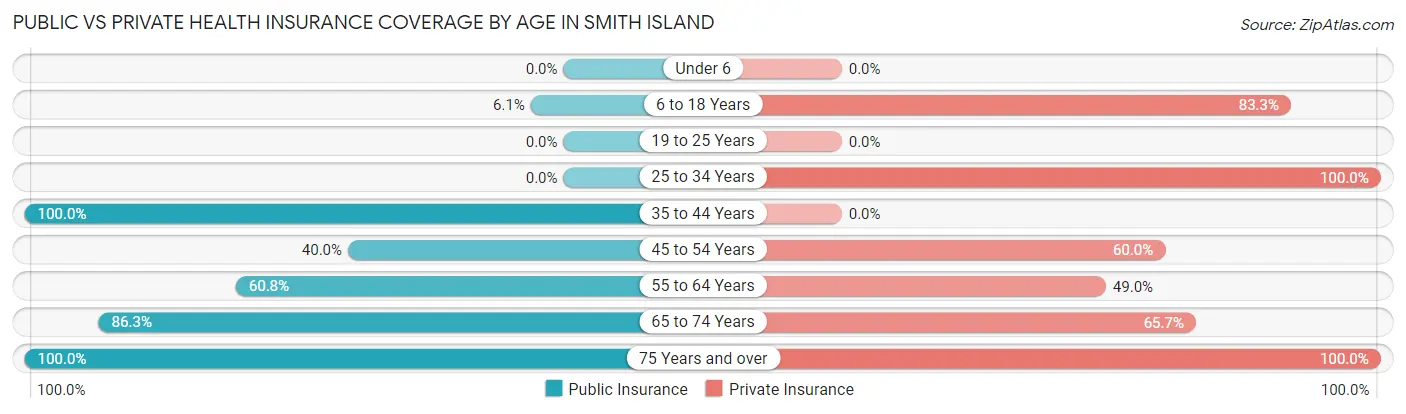
| Age Bracket | Public Insurance | Private Insurance |
| Under 6 | 0 (0.0%) | 0 (0.0%) |
| 6 to 18 Years | 4 (6.1%) | 55 (83.3%) |
| 19 to 25 Years | 0 (0.0%) | 0 (0.0%) |
| 25 to 34 Years | 0 (0.0%) | 3 (100.0%) |
| 35 to 44 Years | 35 (100.0%) | 0 (0.0%) |
| 45 to 54 Years | 30 (40.0%) | 45 (60.0%) |
| 55 to 64 Years | 31 (60.8%) | 25 (49.0%) |
| 65 to 74 Years | 88 (86.3%) | 67 (65.7%) |
| 75 Years and over | 25 (100.0%) | 25 (100.0%) |
| Total | 213 (59.7%) | 220 (61.6%) |
Disability Status by Sex by Age in Smith Island
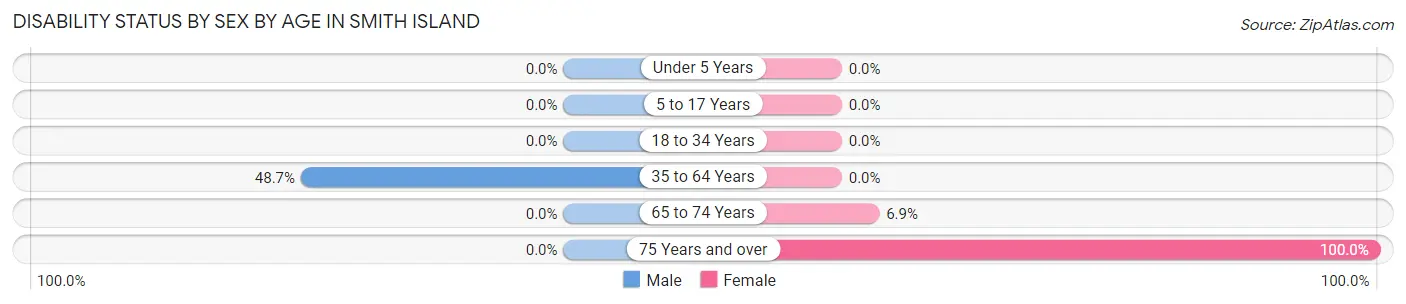
| Age Bracket | Male | Female |
| Under 5 Years | 0 (0.0%) | 0 (0.0%) |
| 5 to 17 Years | 0 (0.0%) | 0 (0.0%) |
| 18 to 34 Years | 0 (0.0%) | 0 (0.0%) |
| 35 to 64 Years | 57 (48.7%) | 0 (0.0%) |
| 65 to 74 Years | 0 (0.0%) | 5 (6.9%) |
| 75 Years and over | 0 (0.0%) | 2 (100.0%) |
Disability Class by Sex by Age in Smith Island
Disability Class: Hearing Difficulty
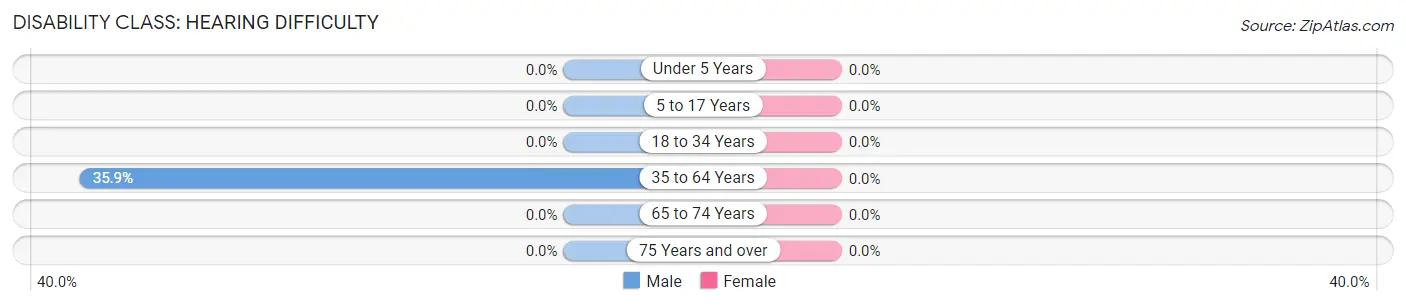
| Age Bracket | Male | Female |
| Under 5 Years | 0 (0.0%) | 0 (0.0%) |
| 5 to 17 Years | 0 (0.0%) | 0 (0.0%) |
| 18 to 34 Years | 0 (0.0%) | 0 (0.0%) |
| 35 to 64 Years | 42 (35.9%) | 0 (0.0%) |
| 65 to 74 Years | 0 (0.0%) | 0 (0.0%) |
| 75 Years and over | 0 (0.0%) | 0 (0.0%) |
Disability Class: Vision Difficulty
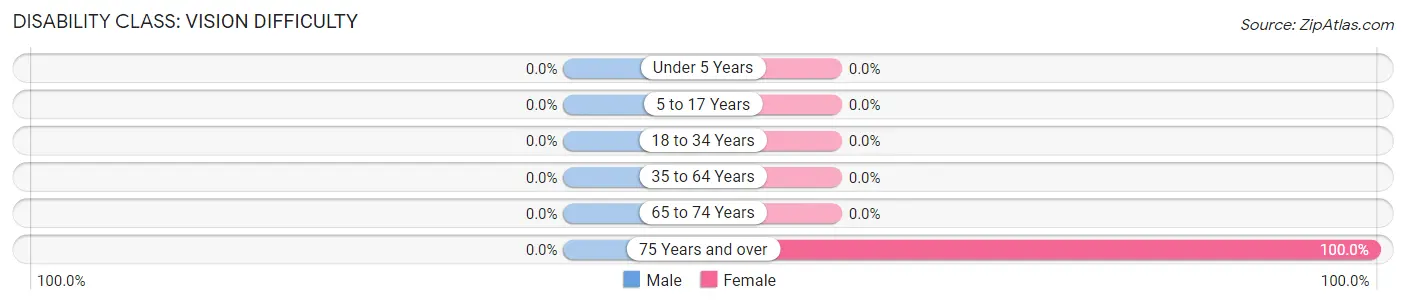
| Age Bracket | Male | Female |
| Under 5 Years | 0 (0.0%) | 0 (0.0%) |
| 5 to 17 Years | 0 (0.0%) | 0 (0.0%) |
| 18 to 34 Years | 0 (0.0%) | 0 (0.0%) |
| 35 to 64 Years | 0 (0.0%) | 0 (0.0%) |
| 65 to 74 Years | 0 (0.0%) | 0 (0.0%) |
| 75 Years and over | 0 (0.0%) | 2 (100.0%) |
Disability Class: Cognitive Difficulty
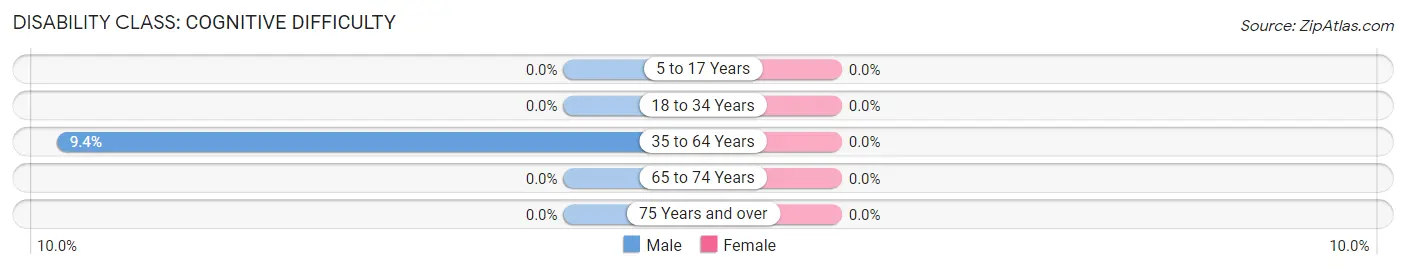
| Age Bracket | Male | Female |
| 5 to 17 Years | 0 (0.0%) | 0 (0.0%) |
| 18 to 34 Years | 0 (0.0%) | 0 (0.0%) |
| 35 to 64 Years | 11 (9.4%) | 0 (0.0%) |
| 65 to 74 Years | 0 (0.0%) | 0 (0.0%) |
| 75 Years and over | 0 (0.0%) | 0 (0.0%) |
Disability Class: Ambulatory Difficulty
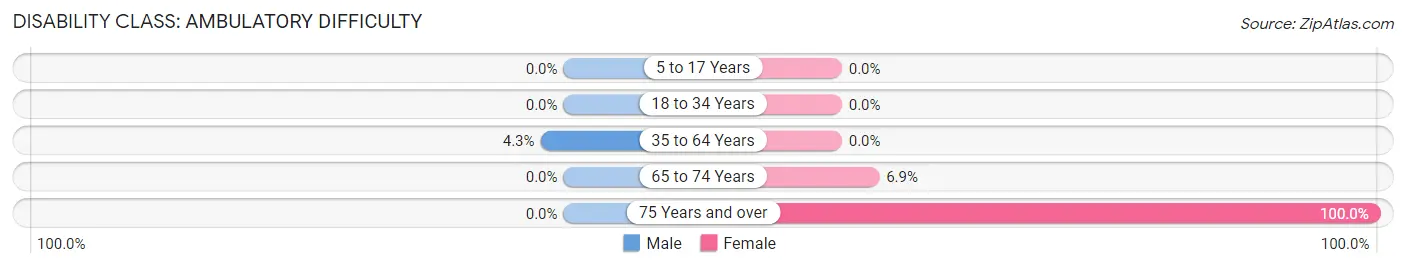
| Age Bracket | Male | Female |
| 5 to 17 Years | 0 (0.0%) | 0 (0.0%) |
| 18 to 34 Years | 0 (0.0%) | 0 (0.0%) |
| 35 to 64 Years | 5 (4.3%) | 0 (0.0%) |
| 65 to 74 Years | 0 (0.0%) | 5 (6.9%) |
| 75 Years and over | 0 (0.0%) | 2 (100.0%) |
Disability Class: Self-Care Difficulty

| Age Bracket | Male | Female |
| 5 to 17 Years | 0 (0.0%) | 0 (0.0%) |
| 18 to 34 Years | 0 (0.0%) | 0 (0.0%) |
| 35 to 64 Years | 5 (4.3%) | 0 (0.0%) |
| 65 to 74 Years | 0 (0.0%) | 0 (0.0%) |
| 75 Years and over | 0 (0.0%) | 2 (100.0%) |
Technology Access in Smith Island
Computing Device Access in Smith Island
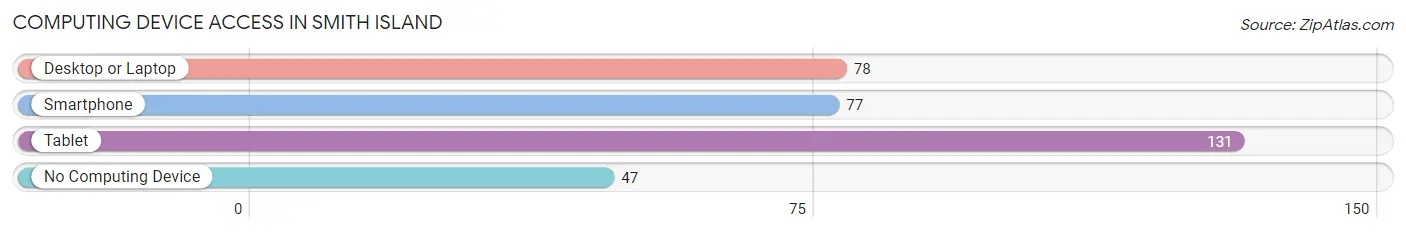
| Device Type | # Households | % Households |
| Desktop or Laptop | 78 | 42.6% |
| Smartphone | 77 | 42.1% |
| Tablet | 131 | 71.6% |
| No Computing Device | 47 | 25.7% |
| Total | 183 | 100.0% |
Internet Access in Smith Island
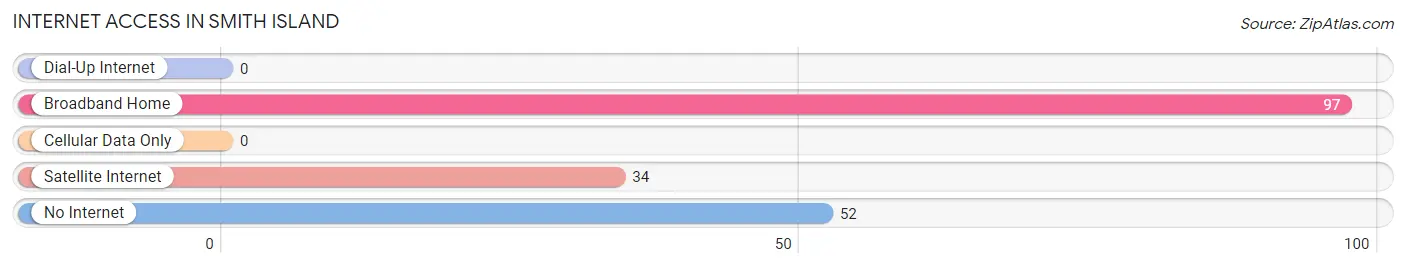
| Internet Type | # Households | % Households |
| Dial-Up Internet | 0 | 0.0% |
| Broadband Home | 97 | 53.0% |
| Cellular Data Only | 0 | 0.0% |
| Satellite Internet | 34 | 18.6% |
| No Internet | 52 | 28.4% |
| Total | 183 | 100.0% |
Smith Island Summary
History
Smith Island is a small island located in the Chesapeake Bay off the coast of Maryland. It is the only inhabited island in the bay and is home to a unique culture and way of life. The island has a long and rich history, dating back to the 1600s when it was first settled by English colonists. The island was named after Captain John Smith, who explored the area in 1608.
The island was originally inhabited by the Pocomoke Indians, who were displaced by the English settlers. The island was used for fishing and farming, and the population grew steadily over the years. In the late 1800s, the island was home to a thriving oyster industry, which provided a livelihood for many of the island’s residents.
In the early 1900s, the island was hit hard by a series of hurricanes and storms, which caused extensive damage to the island’s infrastructure and economy. The island’s population declined as many of the residents moved away in search of better opportunities.
In the 1950s, the island was rediscovered by tourists and became a popular destination for fishing and crabbing. The island’s population began to grow again as more people moved to the island to take advantage of the fishing and crabbing opportunities.
Today, Smith Island is home to a unique culture and way of life. The island’s population is around 300 people, most of whom are descended from the original English settlers. The island is still home to a thriving fishing and crabbing industry, and the island’s residents still rely heavily on the bay for their livelihood.
Geography
Smith Island is located in the Chesapeake Bay off the coast of Maryland. The island is approximately 8 miles long and 2 miles wide, and is made up of three main islands: Ewell, Tylerton, and Rhodes Point. The island is surrounded by shallow waters, making it an ideal spot for fishing and crabbing.
The island is mostly flat, with an average elevation of just 3 feet above sea level. The island is covered in marshland and wetlands, which provide habitat for a variety of wildlife. The island is also home to a variety of birds, including ospreys, herons, and egrets.
The island is accessible by boat, and there is a ferry service that runs between the island and Crisfield, Maryland. The island is also home to a small airport, which is used for private planes and helicopters.
Economy
The economy of Smith Island is largely based on fishing and crabbing. The island’s residents rely heavily on the bay for their livelihood, and the island is home to a thriving fishing and crabbing industry. The island’s residents also make a living by selling seafood to local restaurants and markets.
The island is also home to a small tourism industry, with visitors coming to the island to experience the unique culture and way of life. The island is home to a few small shops and restaurants, which cater to the tourists.
Demographics
The population of Smith Island is around 300 people, most of whom are descended from the original English settlers. The island is predominantly white, with a small African American population. The island’s residents are mostly Protestant, with a small Catholic population.
The island’s residents are mostly employed in the fishing and crabbing industry, and the island’s economy is largely dependent on the bay. The island’s residents are also heavily reliant on the bay for their livelihood, and the island’s economy is largely dependent on the fishing and crabbing industry.
Common Questions
What is Per Capita Income in Smith Island?
Per Capita income in Smith Island is $42,910.
What is the Median Family Income in Smith Island?
Median Family Income in Smith Island is $84,273.
What is the Median Household income in Smith Island?
Median Household Income in Smith Island is $82,878.
What is Inequality or Gini Index in Smith Island?
Inequality or Gini Index in Smith Island is 0.28.
What is the Total Population of Smith Island?
Total Population of Smith Island is 357.
What is the Total Male Population of Smith Island?
Total Male Population of Smith Island is 184.
What is the Total Female Population of Smith Island?
Total Female Population of Smith Island is 173.
What is the Ratio of Males per 100 Females in Smith Island?
There are 106.36 Males per 100 Females in Smith Island.
What is the Ratio of Females per 100 Males in Smith Island?
There are 94.02 Females per 100 Males in Smith Island.
What is the Median Population Age in Smith Island?
Median Population Age in Smith Island is 55.0 Years.
What is the Average Family Size in Smith Island
Average Family Size in Smith Island is 2.3 People.
What is the Average Household Size in Smith Island
Average Household Size in Smith Island is 1.9 People.
How Large is the Labor Force in Smith Island?
There are 169 People in the Labor Forcein in Smith Island.
What is the Percentage of People in the Labor Force in Smith Island?
56.7% of People are in the Labor Force in Smith Island.
What is the Unemployment Rate in Smith Island?
Unemployment Rate in Smith Island is 8.3%.