Butlertown, MD Map & Demographics
Butlertown Map
Butlertown Overview
$36,202
PER CAPITA INCOME
13.6%
WAGE / INCOME GAP [ % ]
86.4¢/ $1
WAGE / INCOME GAP [ $ ]
0.42
INEQUALITY / GINI INDEX
519
TOTAL POPULATION
246
MALE POPULATION
273
FEMALE POPULATION
90.11
MALES / 100 FEMALES
110.98
FEMALES / 100 MALES
46.8
MEDIAN AGE
2.6
AVG FAMILY SIZE
2.3
AVG HOUSEHOLD SIZE
375
LABOR FORCE [ PEOPLE ]
80.1%
PERCENT IN LABOR FORCE
Income in Butlertown
Income Overview in Butlertown
| Characteristic | Number | Measure |
| Per Capita Income | 519 | $36,202 |
| Median Family Income | 160 | $0 |
| Mean Family Income | 160 | $110,859 |
| Median Household Income | 228 | $0 |
| Mean Household Income | 228 | $93,360 |
| Income Deficit | 160 | $0 |
| Wage / Income Gap (%) | 519 | 13.59% |
| Wage / Income Gap ($) | 519 | 86.41¢ per $1 |
| Gini / Inequality Index | 519 | 0.42 |
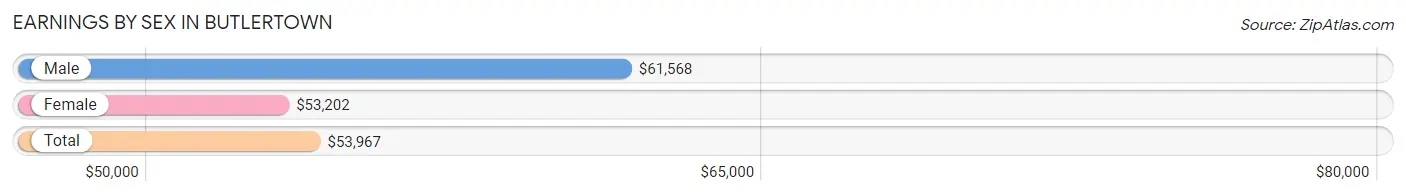
Earnings by Sex in Butlertown
Average Earnings in Butlertown are $53,967, $61,568 for men and $53,202 for women, a difference of 13.6%.
| Sex | Number | Average Earnings |
| Male | 190 (48.5%) | $61,568 |
| Female | 202 (51.5%) | $53,202 |
| Total | 392 (100.0%) | $53,967 |
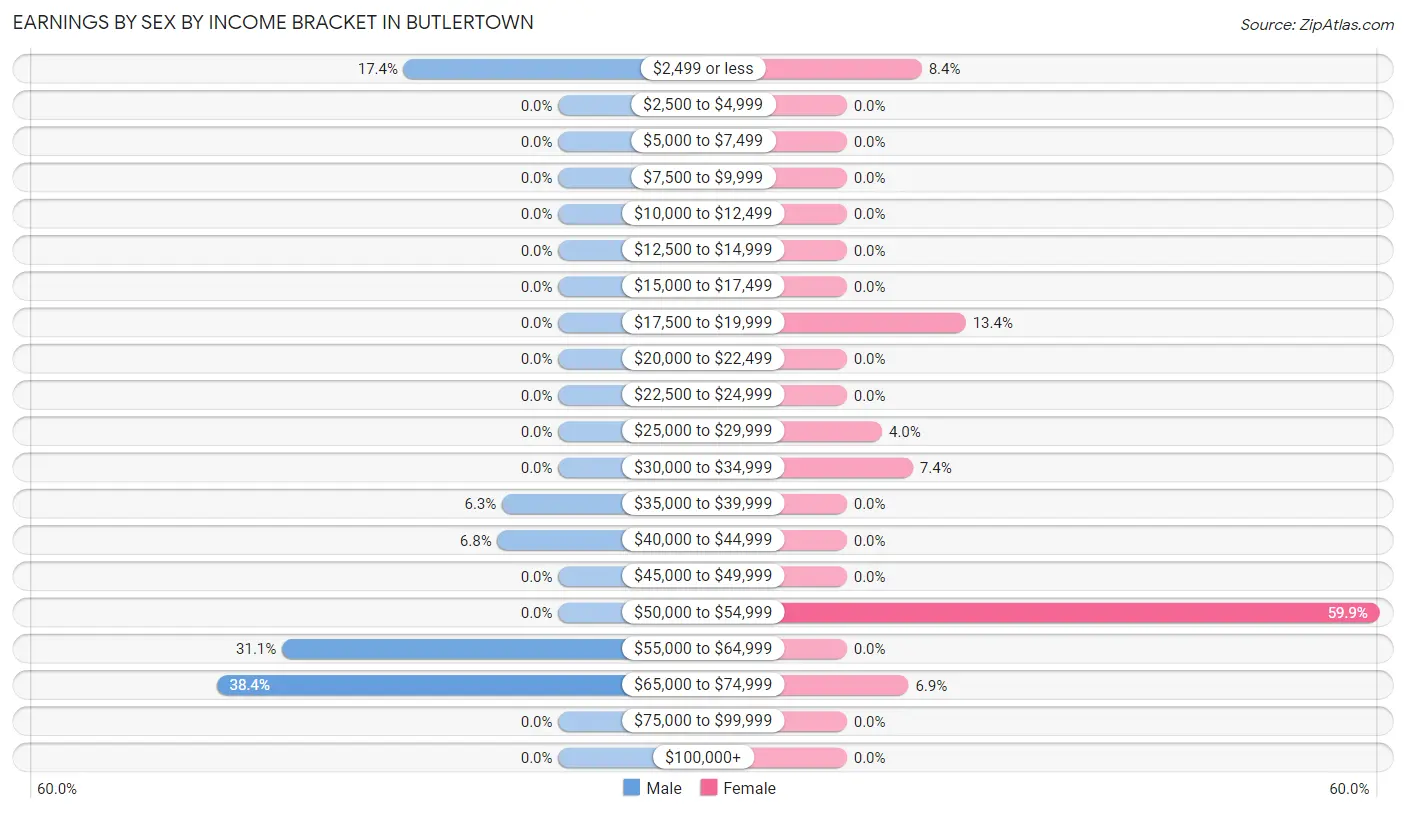
Earnings by Sex by Income Bracket in Butlertown
The most common earnings brackets in Butlertown are $65,000 to $74,999 for men (73 | 38.4%) and $50,000 to $54,999 for women (121 | 59.9%).
| Income | Male | Female |
| $2,499 or less | 33 (17.4%) | 17 (8.4%) |
| $2,500 to $4,999 | 0 (0.0%) | 0 (0.0%) |
| $5,000 to $7,499 | 0 (0.0%) | 0 (0.0%) |
| $7,500 to $9,999 | 0 (0.0%) | 0 (0.0%) |
| $10,000 to $12,499 | 0 (0.0%) | 0 (0.0%) |
| $12,500 to $14,999 | 0 (0.0%) | 0 (0.0%) |
| $15,000 to $17,499 | 0 (0.0%) | 0 (0.0%) |
| $17,500 to $19,999 | 0 (0.0%) | 27 (13.4%) |
| $20,000 to $22,499 | 0 (0.0%) | 0 (0.0%) |
| $22,500 to $24,999 | 0 (0.0%) | 0 (0.0%) |
| $25,000 to $29,999 | 0 (0.0%) | 8 (4.0%) |
| $30,000 to $34,999 | 0 (0.0%) | 15 (7.4%) |
| $35,000 to $39,999 | 12 (6.3%) | 0 (0.0%) |
| $40,000 to $44,999 | 13 (6.8%) | 0 (0.0%) |
| $45,000 to $49,999 | 0 (0.0%) | 0 (0.0%) |
| $50,000 to $54,999 | 0 (0.0%) | 121 (59.9%) |
| $55,000 to $64,999 | 59 (31.0%) | 0 (0.0%) |
| $65,000 to $74,999 | 73 (38.4%) | 14 (6.9%) |
| $75,000 to $99,999 | 0 (0.0%) | 0 (0.0%) |
| $100,000+ | 0 (0.0%) | 0 (0.0%) |
| Total | 190 (100.0%) | 202 (100.0%) |
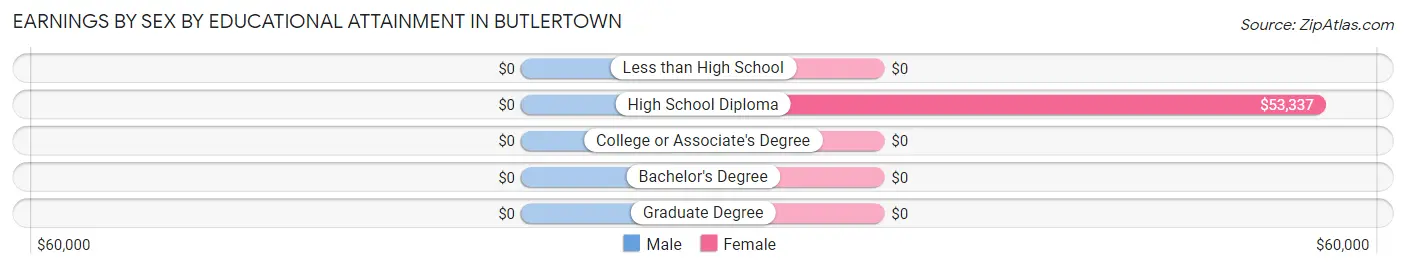
Earnings by Sex by Educational Attainment in Butlertown
| Educational Attainment | Male Income | Female Income |
| Less than High School | - | - |
| High School Diploma | - | - |
| College or Associate's Degree | - | - |
| Bachelor's Degree | - | - |
| Graduate Degree | - | - |
| Total | $61,568 | $53,202 |
Family Income in Butlertown
Family Income Brackets in Butlertown
According to the Butlertown family income data, there are 88 families falling into the $150,000 to $199,999 income range, which is the most common income bracket and makes up 55.0% of all families.
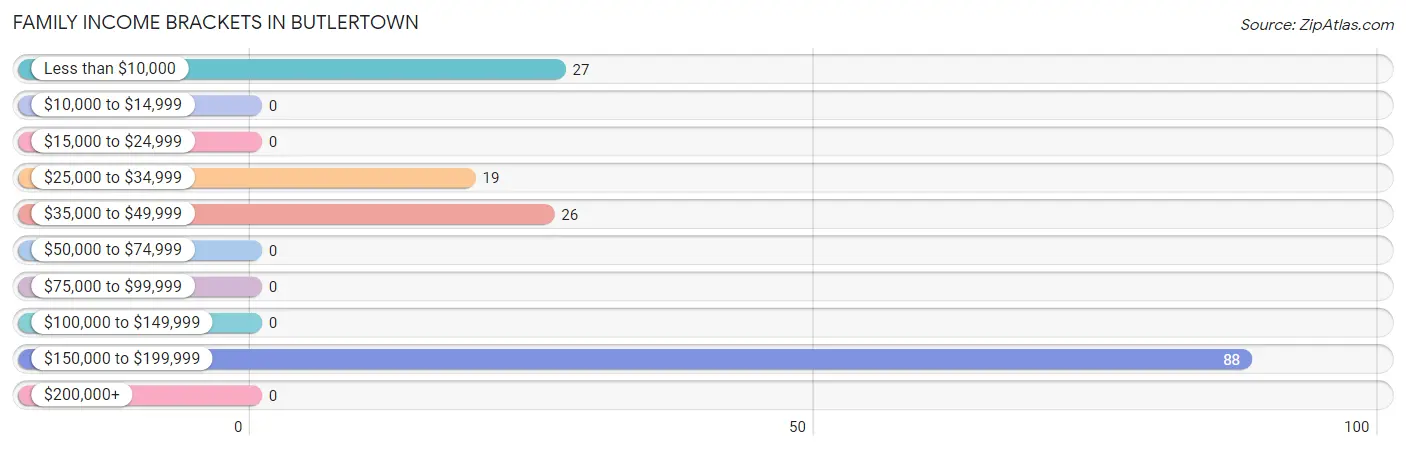
| Income Bracket | # Families | % Families |
| Less than $10,000 | 27 | 16.9% |
| $10,000 to $14,999 | 0 | 0.0% |
| $15,000 to $24,999 | 0 | 0.0% |
| $25,000 to $34,999 | 19 | 11.9% |
| $35,000 to $49,999 | 26 | 16.3% |
| $50,000 to $74,999 | 0 | 0.0% |
| $75,000 to $99,999 | 0 | 0.0% |
| $100,000 to $149,999 | 0 | 0.0% |
| $150,000 to $199,999 | 88 | 55.0% |
| $200,000+ | 0 | 0.0% |
Family Income by Famaliy Size in Butlertown
| Income Bracket | # Families | Median Income |
| 2-Person Families | 27 (16.9%) | $0 |
| 3-Person Families | 133 (83.1%) | $0 |
| 4-Person Families | 0 (0.0%) | $0 |
| 5-Person Families | 0 (0.0%) | $0 |
| 6-Person Families | 0 (0.0%) | $0 |
| 7+ Person Families | 0 (0.0%) | $0 |
| Total | 160 (100.0%) | $0 |
Family Income by Number of Earners in Butlertown
| Number of Earners | # Families | Median Income |
| No Earners | 19 (11.9%) | $0 |
| 1 Earner | 20 (12.5%) | $0 |
| 2 Earners | 33 (20.6%) | $0 |
| 3+ Earners | 88 (55.0%) | $0 |
| Total | 160 (100.0%) | $0 |
Household Income in Butlertown
Household Income Brackets in Butlertown
With 88 households falling in the category, the $150,000 to $199,999 income range is the most frequent in Butlertown, accounting for 38.6% of all households.
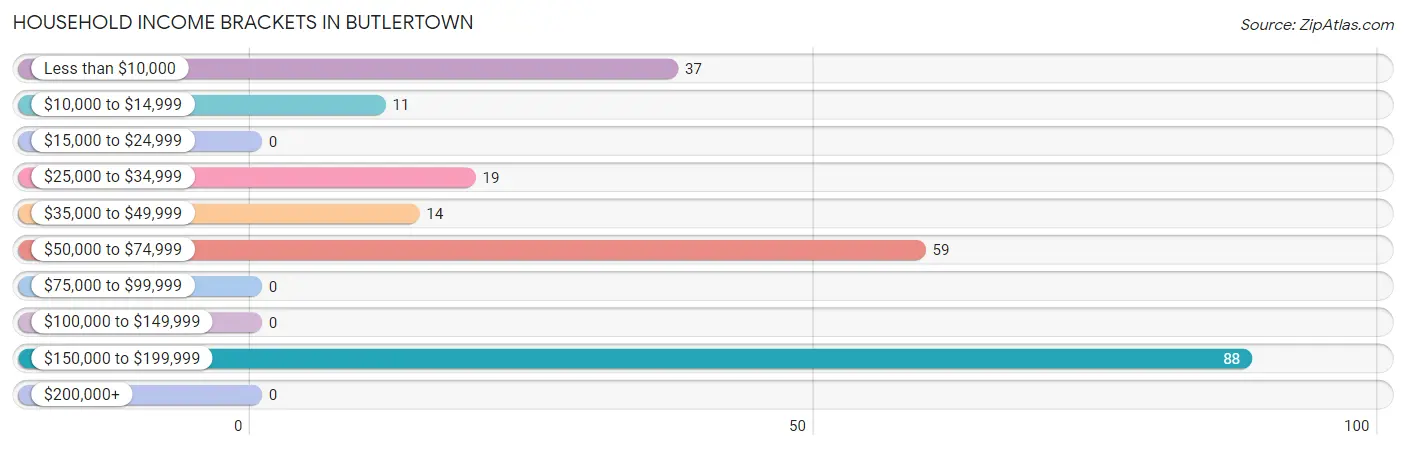
| Income Bracket | # Households | % Households |
| Less than $10,000 | 37 | 16.2% |
| $10,000 to $14,999 | 11 | 4.8% |
| $15,000 to $24,999 | 0 | 0.0% |
| $25,000 to $34,999 | 19 | 8.3% |
| $35,000 to $49,999 | 14 | 6.1% |
| $50,000 to $74,999 | 59 | 25.9% |
| $75,000 to $99,999 | 0 | 0.0% |
| $100,000 to $149,999 | 0 | 0.0% |
| $150,000 to $199,999 | 88 | 38.6% |
| $200,000+ | 0 | 0.0% |
Household Income by Householder Age in Butlertown
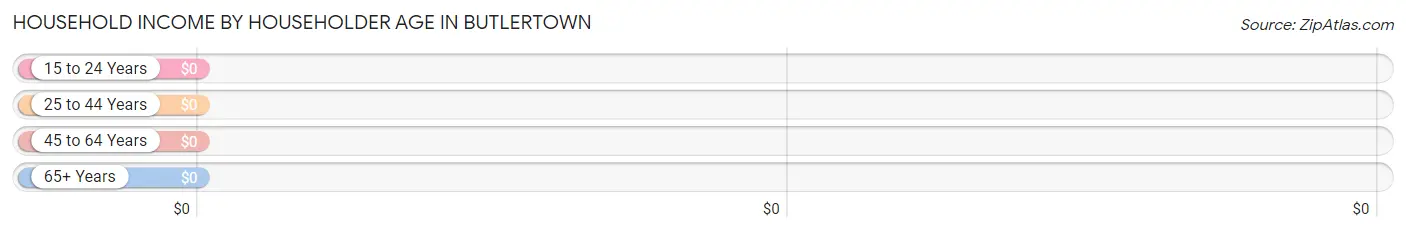
| Income Bracket | # Households | Median Income |
| 15 to 24 Years | 0 (0.0%) | $0 |
| 25 to 44 Years | 27 (11.8%) | $0 |
| 45 to 64 Years | 161 (70.6%) | $0 |
| 65+ Years | 40 (17.5%) | $0 |
| Total | 228 (100.0%) | $0 |
Poverty in Butlertown
Income Below Poverty by Sex and Age in Butlertown
With 21.1% poverty level for males and 17.6% for females among the residents of Butlertown, 55 to 64 year old males and 35 to 44 year old females are the most vulnerable to poverty, with 19 males (59.4%) and 27 females (64.3%) in their respective age groups living below the poverty level.
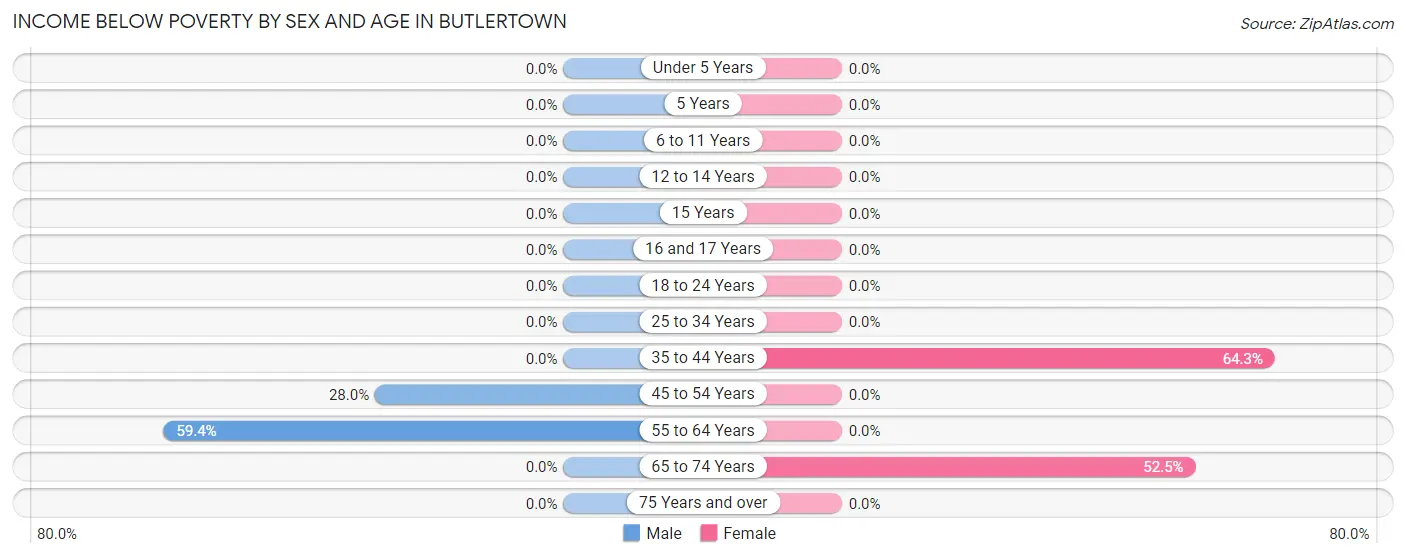
| Age Bracket | Male | Female |
| Under 5 Years | 0 (0.0%) | 0 (0.0%) |
| 5 Years | 0 (0.0%) | 0 (0.0%) |
| 6 to 11 Years | 0 (0.0%) | 0 (0.0%) |
| 12 to 14 Years | 0 (0.0%) | 0 (0.0%) |
| 15 Years | 0 (0.0%) | 0 (0.0%) |
| 16 and 17 Years | 0 (0.0%) | 0 (0.0%) |
| 18 to 24 Years | 0 (0.0%) | 0 (0.0%) |
| 25 to 34 Years | 0 (0.0%) | 0 (0.0%) |
| 35 to 44 Years | 0 (0.0%) | 27 (64.3%) |
| 45 to 54 Years | 33 (28.0%) | 0 (0.0%) |
| 55 to 64 Years | 19 (59.4%) | 0 (0.0%) |
| 65 to 74 Years | 0 (0.0%) | 21 (52.5%) |
| 75 Years and over | 0 (0.0%) | 0 (0.0%) |
| Total | 52 (21.1%) | 48 (17.6%) |
Income Above Poverty by Sex and Age in Butlertown
According to the poverty statistics in Butlertown, males aged 6 to 11 years and females aged 12 to 14 years are the age groups that are most secure financially, with 100.0% of males and 100.0% of females in these age groups living above the poverty line.
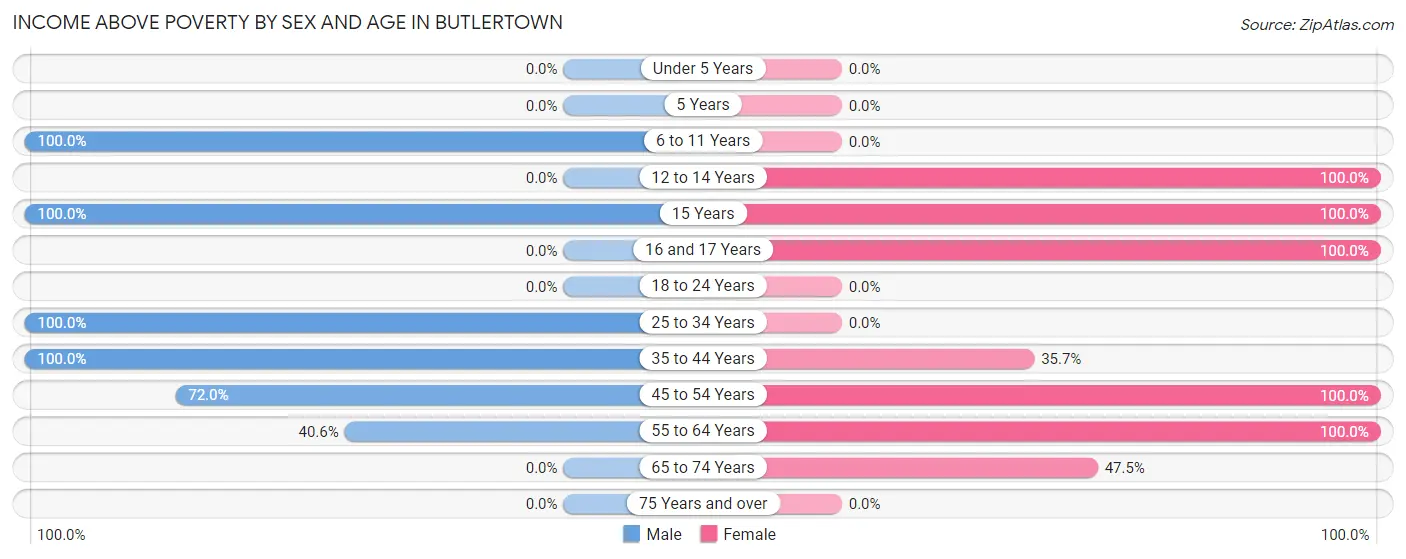
| Age Bracket | Male | Female |
| Under 5 Years | 0 (0.0%) | 0 (0.0%) |
| 5 Years | 0 (0.0%) | 0 (0.0%) |
| 6 to 11 Years | 11 (100.0%) | 0 (0.0%) |
| 12 to 14 Years | 0 (0.0%) | 15 (100.0%) |
| 15 Years | 8 (100.0%) | 17 (100.0%) |
| 16 and 17 Years | 0 (0.0%) | 10 (100.0%) |
| 18 to 24 Years | 0 (0.0%) | 0 (0.0%) |
| 25 to 34 Years | 59 (100.0%) | 0 (0.0%) |
| 35 to 44 Years | 18 (100.0%) | 15 (35.7%) |
| 45 to 54 Years | 85 (72.0%) | 96 (100.0%) |
| 55 to 64 Years | 13 (40.6%) | 53 (100.0%) |
| 65 to 74 Years | 0 (0.0%) | 19 (47.5%) |
| 75 Years and over | 0 (0.0%) | 0 (0.0%) |
| Total | 194 (78.9%) | 225 (82.4%) |
Income Below Poverty Among Married-Couple Families in Butlertown
The poverty statistics for married-couple families in Butlertown show that 22.3% or 27 of the total 121 families live below the poverty line. Families with no children have the highest poverty rate of 23.5%, comprising of 27 families. On the other hand, families with 1 or 2 children have the lowest poverty rate of 0.0%, which includes 0 families.
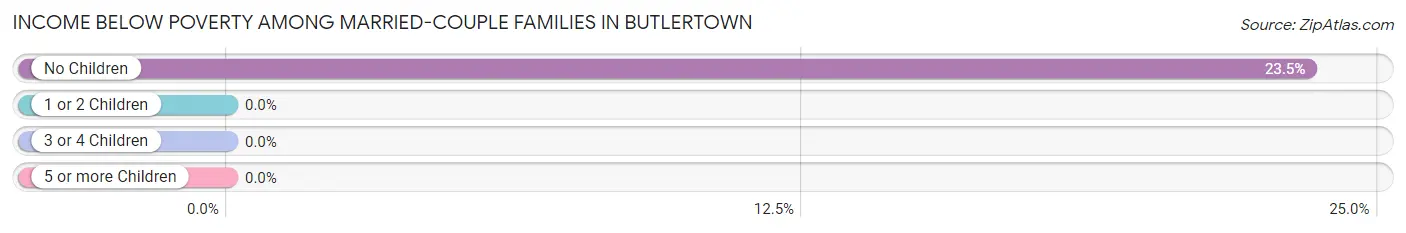
| Children | Above Poverty | Below Poverty |
| No Children | 88 (76.5%) | 27 (23.5%) |
| 1 or 2 Children | 6 (100.0%) | 0 (0.0%) |
| 3 or 4 Children | 0 (0.0%) | 0 (0.0%) |
| 5 or more Children | 0 (0.0%) | 0 (0.0%) |
| Total | 94 (77.7%) | 27 (22.3%) |
Income Below Poverty Among Single-Parent Households in Butlertown
| Children | Single Father | Single Mother |
| No Children | 0 (0.0%) | 0 (0.0%) |
| 1 or 2 Children | 0 (0.0%) | 0 (0.0%) |
| 3 or 4 Children | 0 (0.0%) | 0 (0.0%) |
| 5 or more Children | 0 (0.0%) | 0 (0.0%) |
| Total | 0 (0.0%) | 0 (0.0%) |
Income Below Poverty Among Married-Couple vs Single-Parent Households in Butlertown
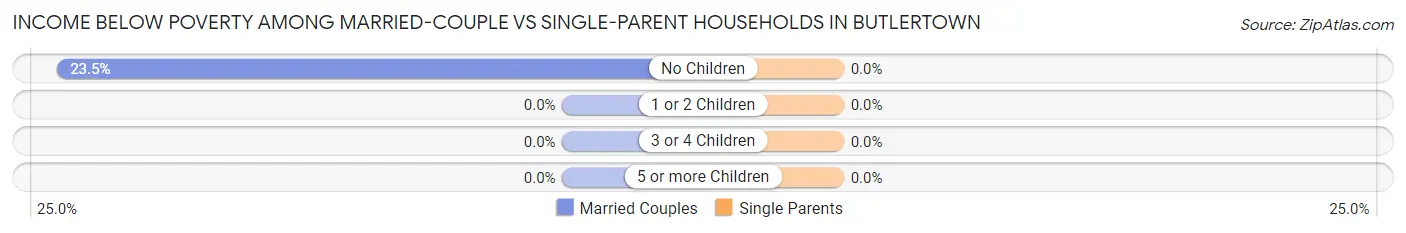
| Children | Married-Couple Families | Single-Parent Households |
| No Children | 27 (23.5%) | 0 (0.0%) |
| 1 or 2 Children | 0 (0.0%) | 0 (0.0%) |
| 3 or 4 Children | 0 (0.0%) | 0 (0.0%) |
| 5 or more Children | 0 (0.0%) | 0 (0.0%) |
| Total | 27 (22.3%) | 0 (0.0%) |
Race in Butlertown
The most populous races in Butlertown are Black / African American (326 | 62.8%), and White / Caucasian (193 | 37.2%).
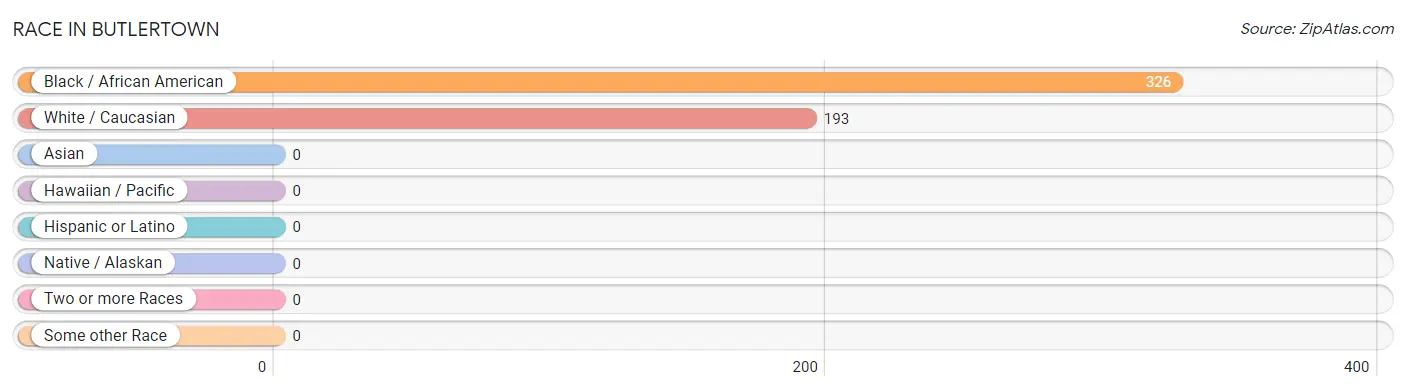
| Race | # Population | % Population |
| Asian | 0 | 0.0% |
| Black / African American | 326 | 62.8% |
| Hawaiian / Pacific | 0 | 0.0% |
| Hispanic or Latino | 0 | 0.0% |
| Native / Alaskan | 0 | 0.0% |
| White / Caucasian | 193 | 37.2% |
| Two or more Races | 0 | 0.0% |
| Some other Race | 0 | 0.0% |
| Total | 519 | 100.0% |
Ancestry in Butlertown
The most populous ancestries reported in Butlertown are Irish (35 | 6.7%), Italian (32 | 6.2%), American (25 | 4.8%), English (14 | 2.7%), and German (10 | 1.9%), together accounting for 22.4% of all Butlertown residents.
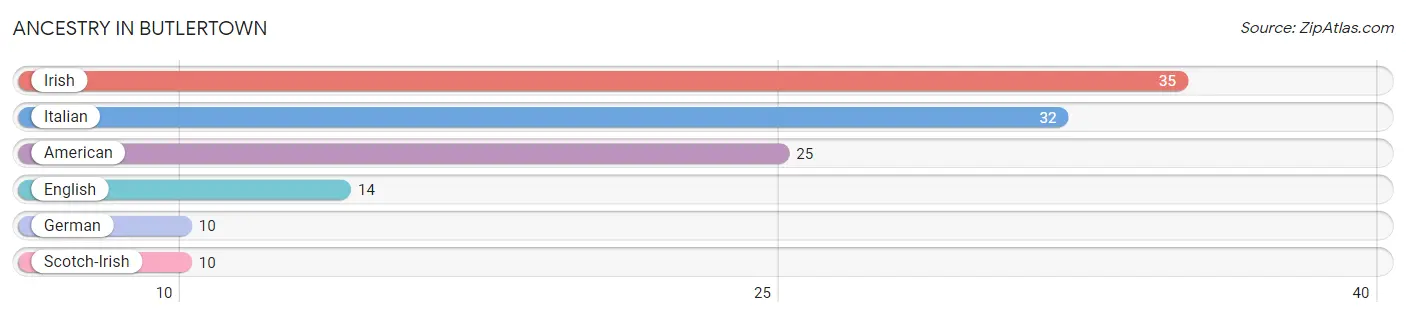
| Ancestry | # Population | % Population |
| American | 25 | 4.8% |
| English | 14 | 2.7% |
| German | 10 | 1.9% |
| Irish | 35 | 6.7% |
| Italian | 32 | 6.2% |
| Scotch-Irish | 10 | 1.9% | View All 6 Rows |
Immigrants in Butlertown

| Immigration Origin | # Population | % Population | View All 0 Rows |
Sex and Age in Butlertown
Sex and Age in Butlertown
The most populous age groups in Butlertown are 45 to 49 Years (85 | 34.5%) for men and 45 to 49 Years (96 | 35.2%) for women.
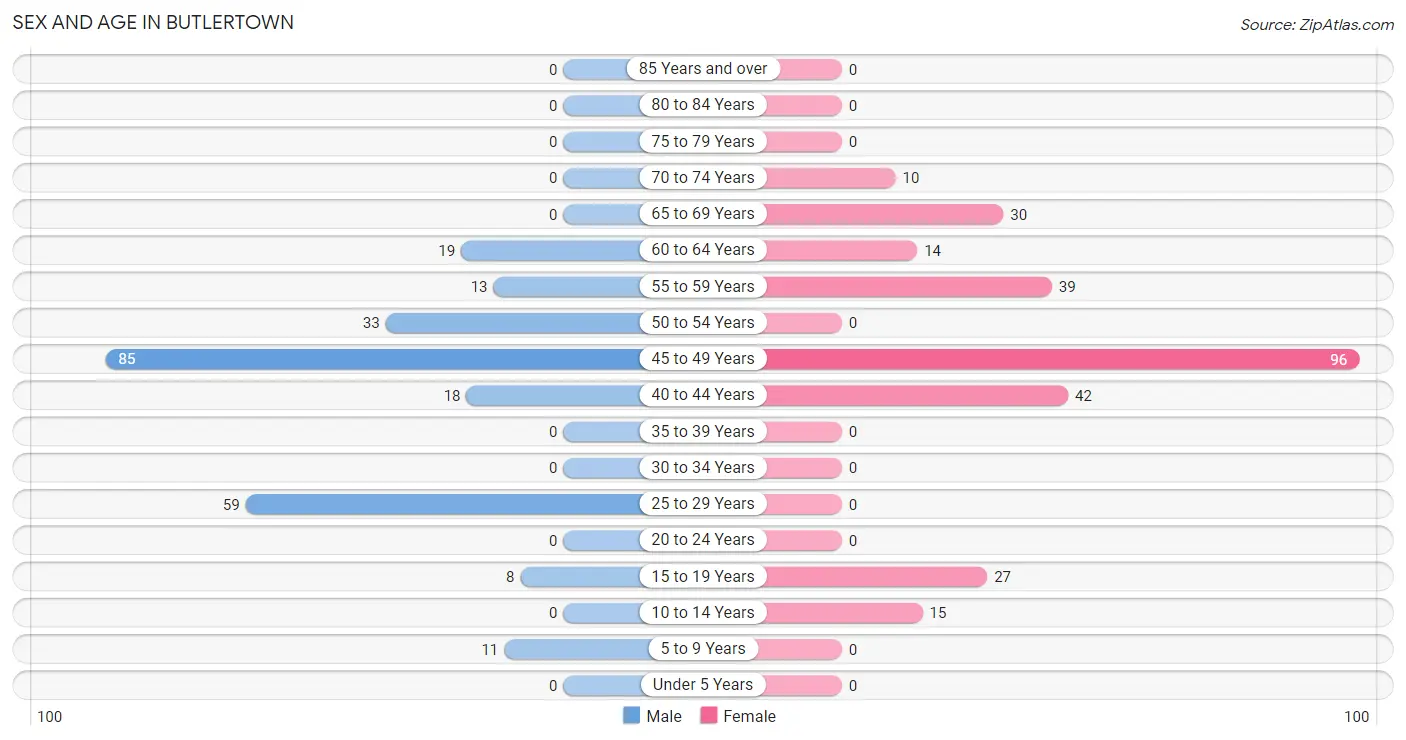
| Age Bracket | Male | Female |
| Under 5 Years | 0 (0.0%) | 0 (0.0%) |
| 5 to 9 Years | 11 (4.5%) | 0 (0.0%) |
| 10 to 14 Years | 0 (0.0%) | 15 (5.5%) |
| 15 to 19 Years | 8 (3.3%) | 27 (9.9%) |
| 20 to 24 Years | 0 (0.0%) | 0 (0.0%) |
| 25 to 29 Years | 59 (24.0%) | 0 (0.0%) |
| 30 to 34 Years | 0 (0.0%) | 0 (0.0%) |
| 35 to 39 Years | 0 (0.0%) | 0 (0.0%) |
| 40 to 44 Years | 18 (7.3%) | 42 (15.4%) |
| 45 to 49 Years | 85 (34.5%) | 96 (35.2%) |
| 50 to 54 Years | 33 (13.4%) | 0 (0.0%) |
| 55 to 59 Years | 13 (5.3%) | 39 (14.3%) |
| 60 to 64 Years | 19 (7.7%) | 14 (5.1%) |
| 65 to 69 Years | 0 (0.0%) | 30 (11.0%) |
| 70 to 74 Years | 0 (0.0%) | 10 (3.7%) |
| 75 to 79 Years | 0 (0.0%) | 0 (0.0%) |
| 80 to 84 Years | 0 (0.0%) | 0 (0.0%) |
| 85 Years and over | 0 (0.0%) | 0 (0.0%) |
| Total | 246 (100.0%) | 273 (100.0%) |
Families and Households in Butlertown
Median Family Size in Butlertown
The median family size in Butlertown is 2.61 persons per family, with single female/mother families (27 | 16.9%) accounting for the largest median family size of 2.96 persons per family. On the other hand, married-couple families (121 | 75.6%) represent the smallest median family size with 2.52 persons per family.
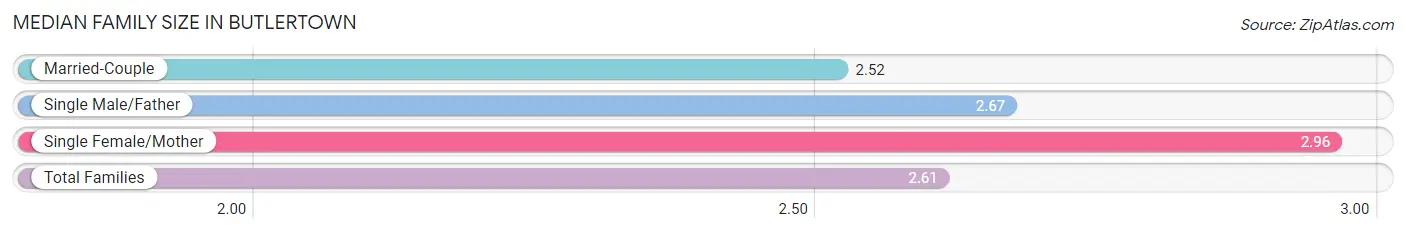
| Family Type | # Families | Family Size |
| Married-Couple | 121 (75.6%) | 2.52 |
| Single Male/Father | 12 (7.5%) | 2.67 |
| Single Female/Mother | 27 (16.9%) | 2.96 |
| Total Families | 160 (100.0%) | 2.61 |
Median Household Size in Butlertown
The median household size in Butlertown is 2.28 persons per household, with single male/father households (12 | 5.3%) accounting for the largest median household size of 3.92 persons per household. non-family households (68 | 29.8%) represent the smallest median household size with 1.28 persons per household.
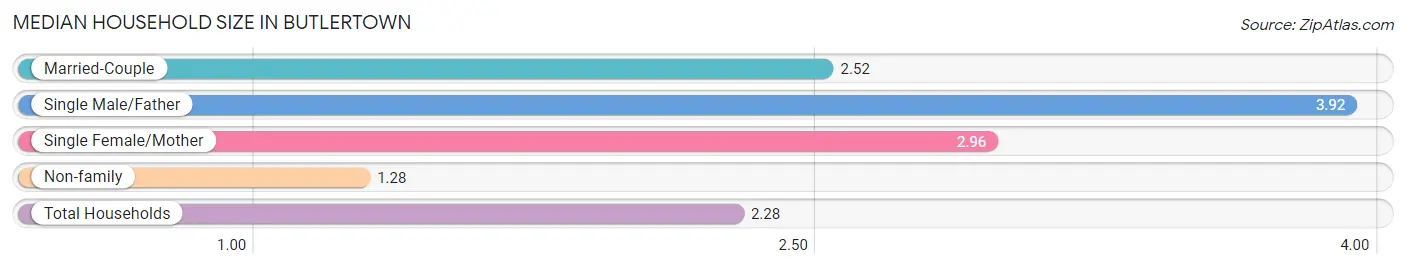
| Household Type | # Households | Household Size |
| Married-Couple | 121 (53.1%) | 2.52 |
| Single Male/Father | 12 (5.3%) | 3.92 |
| Single Female/Mother | 27 (11.8%) | 2.96 |
| Non-family | 68 (29.8%) | 1.28 |
| Total Households | 228 (100.0%) | 2.28 |
Household Size by Marriage Status in Butlertown
Out of a total of 228 households in Butlertown, 160 (70.2%) are family households, while 68 (29.8%) are nonfamily households. The most numerous type of family households are 3-person households, comprising 121, and the most common type of nonfamily households are 1-person households, comprising 35.
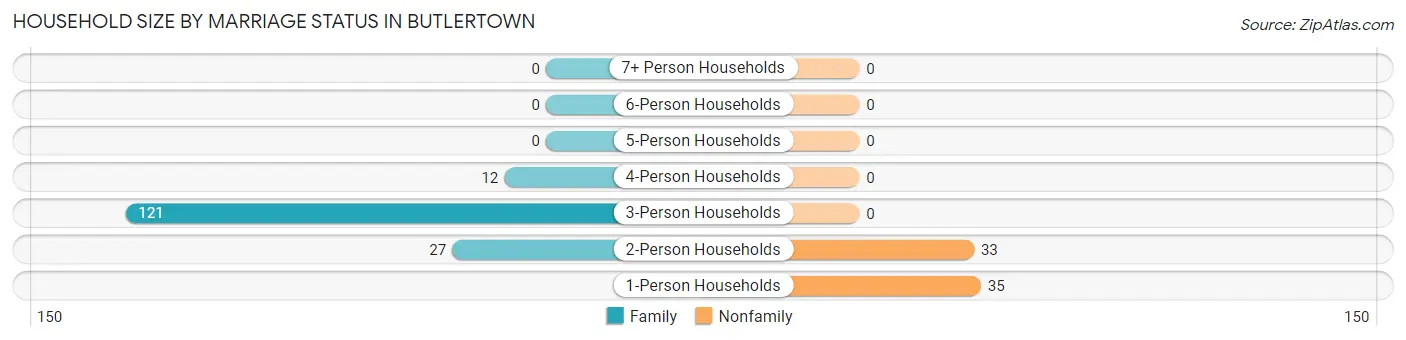
| Household Size | Family Households | Nonfamily Households |
| 1-Person Households | - | 35 (15.3%) |
| 2-Person Households | 27 (11.8%) | 33 (14.5%) |
| 3-Person Households | 121 (53.1%) | 0 (0.0%) |
| 4-Person Households | 12 (5.3%) | 0 (0.0%) |
| 5-Person Households | 0 (0.0%) | 0 (0.0%) |
| 6-Person Households | 0 (0.0%) | 0 (0.0%) |
| 7+ Person Households | 0 (0.0%) | 0 (0.0%) |
| Total | 160 (70.2%) | 68 (29.8%) |
Female Fertility in Butlertown
Fertility by Age in Butlertown
| Age Bracket | Women with Births | Births / 1,000 Women |
| 15 to 19 years | 0 (0.0%) | 0.0 |
| 20 to 34 years | 0 (0.0%) | 0.0 |
| 35 to 50 years | 0 (0.0%) | 0.0 |
| Total | 0 (0.0%) | 0.0 |
Fertility by Age by Marriage Status in Butlertown
| Age Bracket | Married | Unmarried |
| 15 to 19 years | 0 (0.0%) | 0 (0.0%) |
| 20 to 34 years | 0 (0.0%) | 0 (0.0%) |
| 35 to 50 years | 0 (0.0%) | 0 (0.0%) |
| Total | 0 (0.0%) | 0 (0.0%) |
Fertility by Education in Butlertown
| Educational Attainment | Women with Births | Births / 1,000 Women |
| Less than High School | 0 (0.0%) | 0.0 |
| High School Diploma | 0 (0.0%) | 0.0 |
| College or Associate's Degree | 0 (0.0%) | 0.0 |
| Bachelor's Degree | 0 (0.0%) | 0.0 |
| Graduate Degree | 0 (0.0%) | 0.0 |
| Total | 0 (0.0%) | 0.0 |
Fertility by Education by Marriage Status in Butlertown
| Educational Attainment | Married | Unmarried |
| Less than High School | 0 (0.0%) | 0 (0.0%) |
| High School Diploma | 0 (0.0%) | 0 (0.0%) |
| College or Associate's Degree | 0 (0.0%) | 0 (0.0%) |
| Bachelor's Degree | 0 (0.0%) | 0 (0.0%) |
| Graduate Degree | 0 (0.0%) | 0 (0.0%) |
| Total | 0 (0.0%) | 0 (0.0%) |
Employment Characteristics in Butlertown
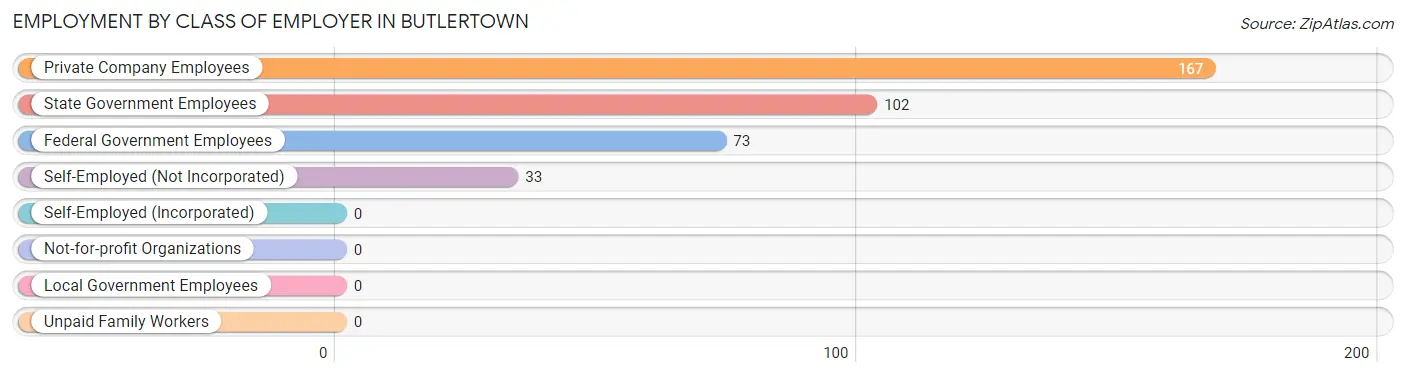
Employment by Class of Employer in Butlertown
Among the 375 employed individuals in Butlertown, private company employees (167 | 44.5%), state government employees (102 | 27.2%), and federal government employees (73 | 19.5%) make up the most common classes of employment.
| Employer Class | # Employees | % Employees |
| Private Company Employees | 167 | 44.5% |
| Self-Employed (Incorporated) | 0 | 0.0% |
| Self-Employed (Not Incorporated) | 33 | 8.8% |
| Not-for-profit Organizations | 0 | 0.0% |
| Local Government Employees | 0 | 0.0% |
| State Government Employees | 102 | 27.2% |
| Federal Government Employees | 73 | 19.5% |
| Unpaid Family Workers | 0 | 0.0% |
| Total | 375 | 100.0% |
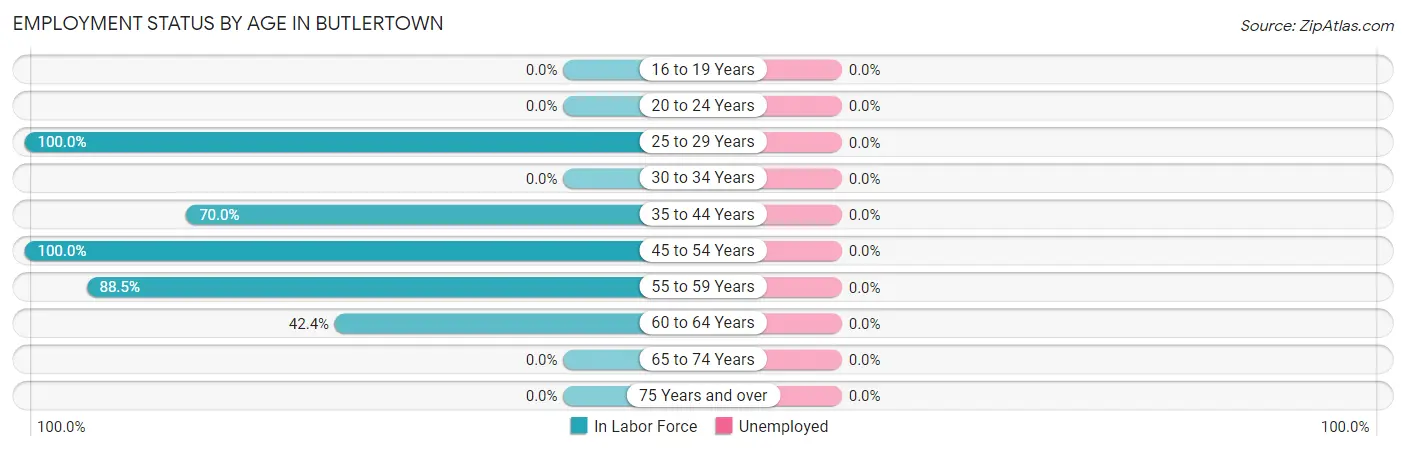
Employment Status by Age in Butlertown
| Age Bracket | In Labor Force | Unemployed |
| 16 to 19 Years | 0 (0.0%) | 0 (0.0%) |
| 20 to 24 Years | 0 (0.0%) | 0 (0.0%) |
| 25 to 29 Years | 59 (100.0%) | 0 (0.0%) |
| 30 to 34 Years | 0 (0.0%) | 0 (0.0%) |
| 35 to 44 Years | 42 (70.0%) | 0 (0.0%) |
| 45 to 54 Years | 214 (100.0%) | 0 (0.0%) |
| 55 to 59 Years | 46 (88.5%) | 0 (0.0%) |
| 60 to 64 Years | 14 (42.4%) | 0 (0.0%) |
| 65 to 74 Years | 0 (0.0%) | 0 (0.0%) |
| 75 Years and over | 0 (0.0%) | 0 (0.0%) |
| Total | 375 (80.1%) | 0 (0.0%) |
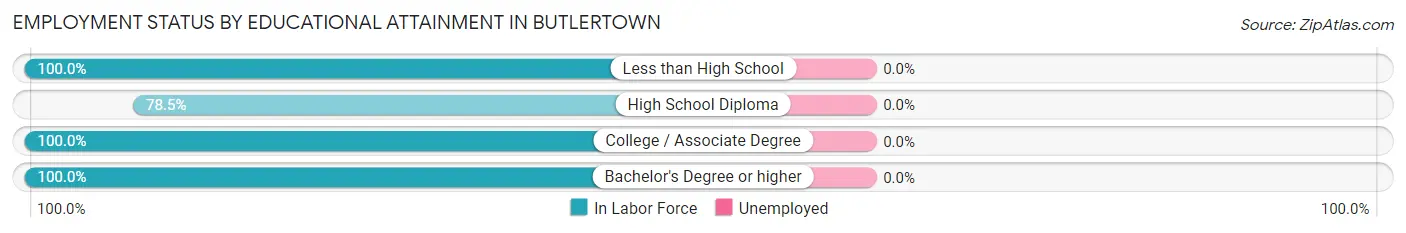
Employment Status by Educational Attainment in Butlertown
| Educational Attainment | In Labor Force | Unemployed |
| Less than High School | 45 (100.0%) | 0 (0.0%) |
| High School Diploma | 157 (78.5%) | 0 (0.0%) |
| College / Associate Degree | 73 (100.0%) | 0 (0.0%) |
| Bachelor's Degree or higher | 100 (100.0%) | 0 (0.0%) |
| Total | 375 (89.7%) | 0 (0.0%) |
Employment Occupations by Sex in Butlertown
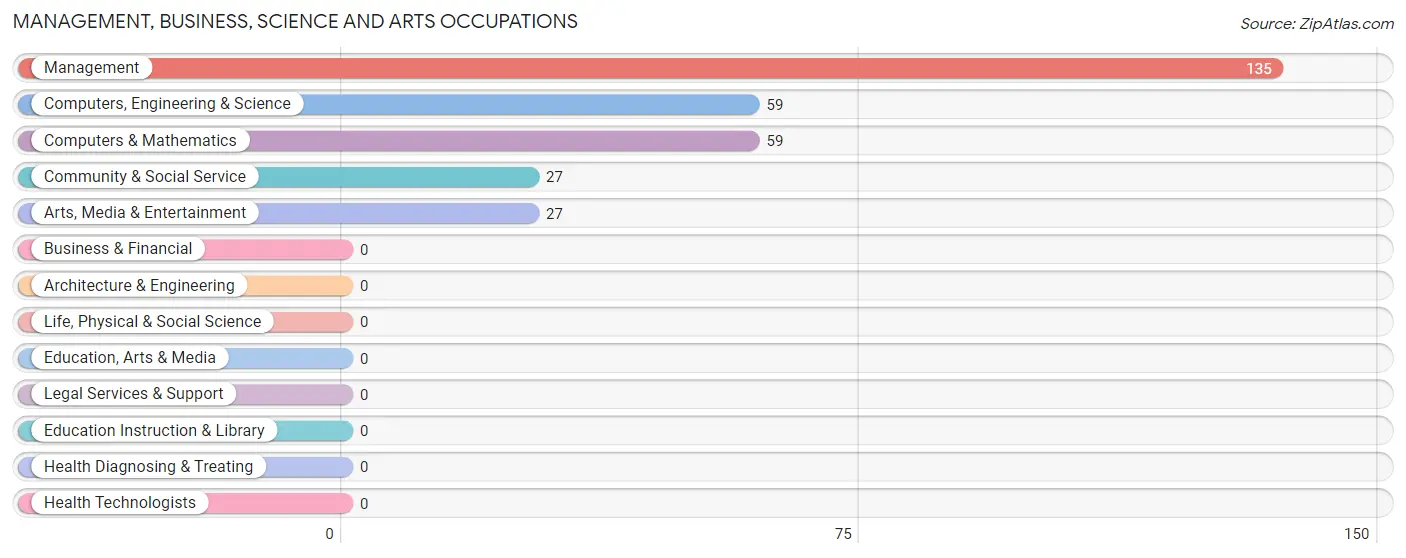
Management, Business, Science and Arts Occupations
The most common Management, Business, Science and Arts occupations in Butlertown are Management (135 | 44.7%), Computers, Engineering & Science (59 | 19.5%), Computers & Mathematics (59 | 19.5%), Community & Social Service (27 | 8.9%), and Arts, Media & Entertainment (27 | 8.9%).
Management, Business, Science and Arts Occupations by Sex
Within the Management, Business, Science and Arts occupations in Butlertown, the most male-oriented occupations are Computers, Engineering & Science (100.0%), Computers & Mathematics (100.0%), and Management (24.4%), while the most female-oriented occupations are Community & Social Service (100.0%), Arts, Media & Entertainment (100.0%), and Management (75.6%).
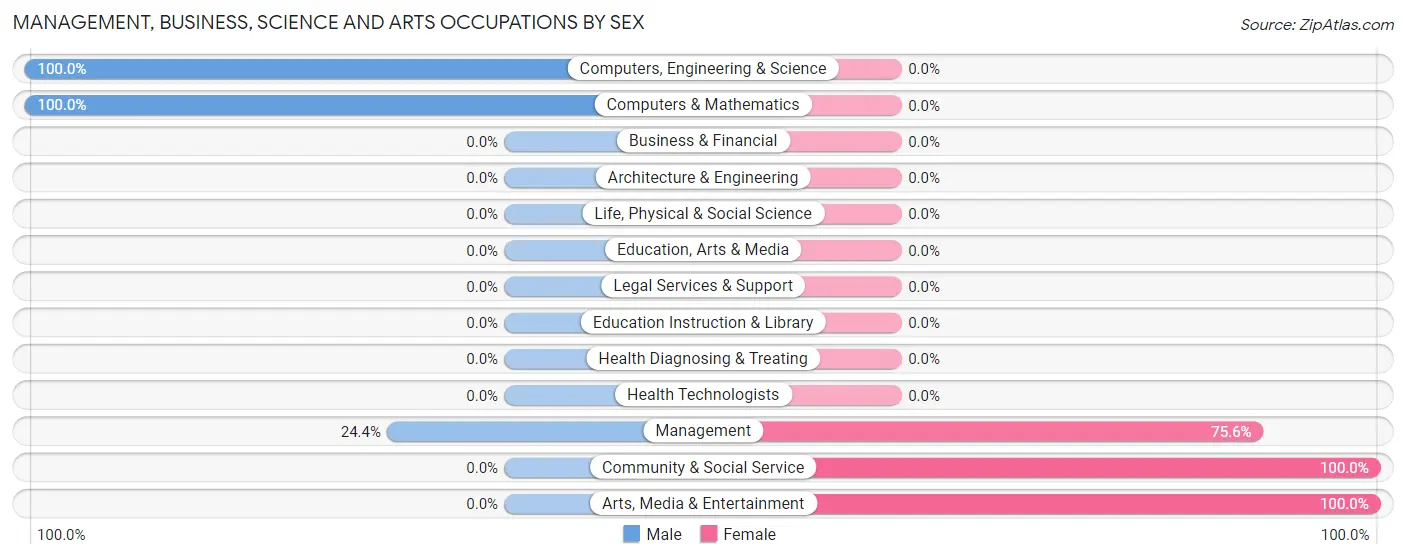
| Occupation | Male | Female |
| Management | 33 (24.4%) | 102 (75.6%) |
| Business & Financial | 0 (0.0%) | 0 (0.0%) |
| Computers, Engineering & Science | 59 (100.0%) | 0 (0.0%) |
| Computers & Mathematics | 59 (100.0%) | 0 (0.0%) |
| Architecture & Engineering | 0 (0.0%) | 0 (0.0%) |
| Life, Physical & Social Science | 0 (0.0%) | 0 (0.0%) |
| Community & Social Service | 0 (0.0%) | 27 (100.0%) |
| Education, Arts & Media | 0 (0.0%) | 0 (0.0%) |
| Legal Services & Support | 0 (0.0%) | 0 (0.0%) |
| Education Instruction & Library | 0 (0.0%) | 0 (0.0%) |
| Arts, Media & Entertainment | 0 (0.0%) | 27 (100.0%) |
| Health Diagnosing & Treating | 0 (0.0%) | 0 (0.0%) |
| Health Technologists | 0 (0.0%) | 0 (0.0%) |
| Total (Category) | 92 (41.6%) | 129 (58.4%) |
| Total (Overall) | 117 (38.7%) | 185 (61.3%) |
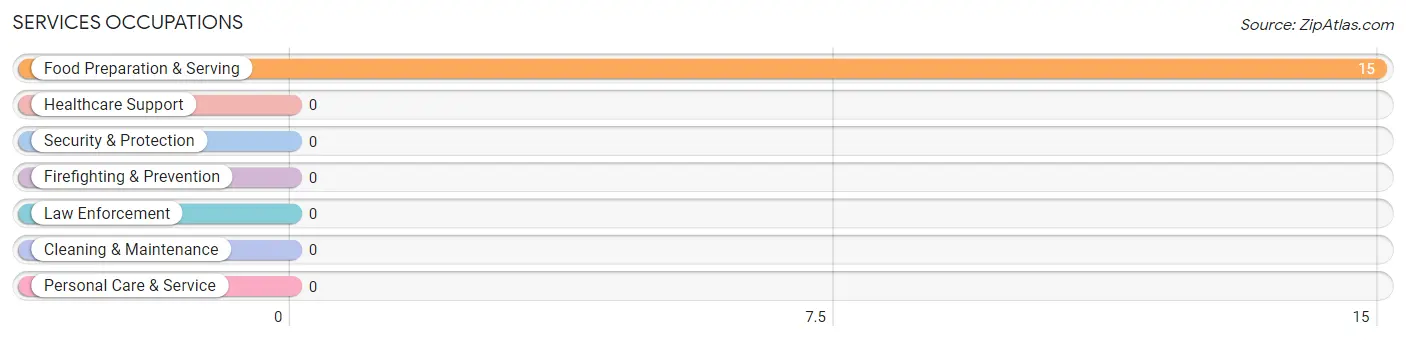
Services Occupations
The most common Services occupations in Butlertown are , and Food Preparation & Serving (15 | 5.0%).
Services Occupations by Sex
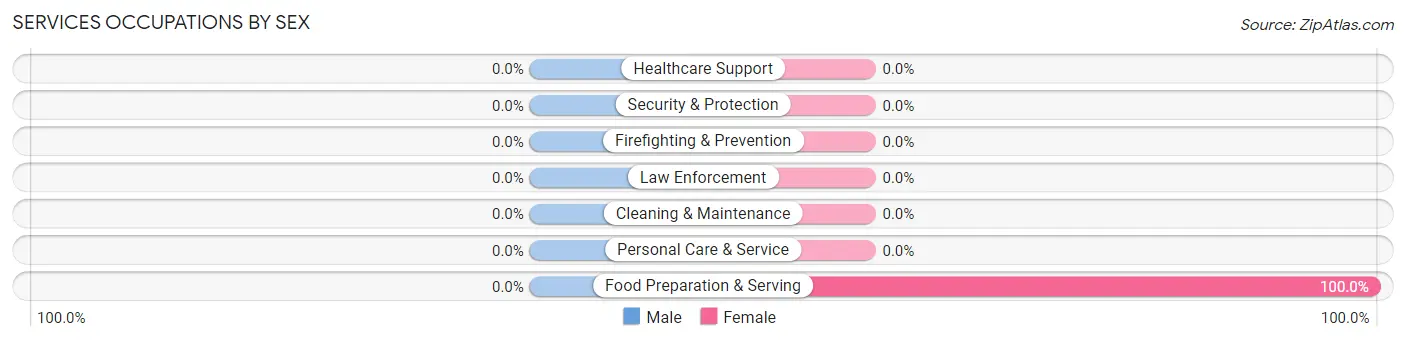
| Occupation | Male | Female |
| Healthcare Support | 0 (0.0%) | 0 (0.0%) |
| Security & Protection | 0 (0.0%) | 0 (0.0%) |
| Firefighting & Prevention | 0 (0.0%) | 0 (0.0%) |
| Law Enforcement | 0 (0.0%) | 0 (0.0%) |
| Food Preparation & Serving | 0 (0.0%) | 15 (100.0%) |
| Cleaning & Maintenance | 0 (0.0%) | 0 (0.0%) |
| Personal Care & Service | 0 (0.0%) | 0 (0.0%) |
| Total (Category) | 0 (0.0%) | 15 (100.0%) |
| Total (Overall) | 117 (38.7%) | 185 (61.3%) |
Sales and Office Occupations
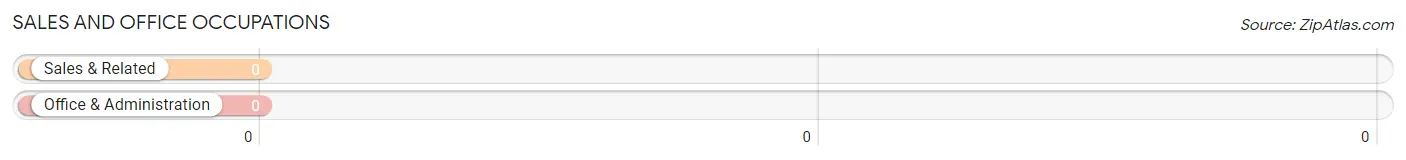
Sales and Office Occupations by Sex
| Occupation | Male | Female |
| Sales & Related | 0 (0.0%) | 0 (0.0%) |
| Office & Administration | 0 (0.0%) | 0 (0.0%) |
| Total (Category) | 0 (0.0%) | 0 (0.0%) |
| Total (Overall) | 117 (38.7%) | 185 (61.3%) |
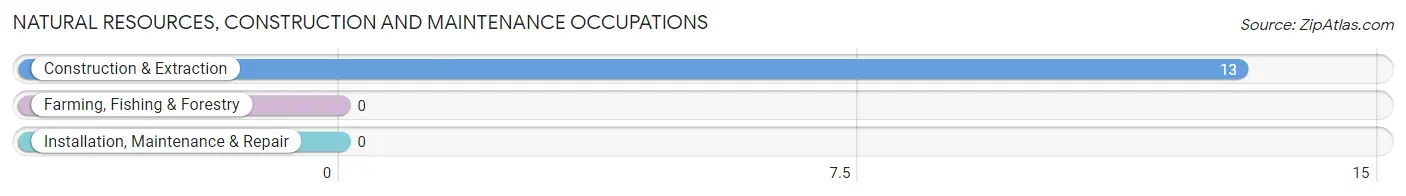
Natural Resources, Construction and Maintenance Occupations
The most common Natural Resources, Construction and Maintenance occupations in Butlertown are , and Construction & Extraction (13 | 4.3%).
Natural Resources, Construction and Maintenance Occupations by Sex
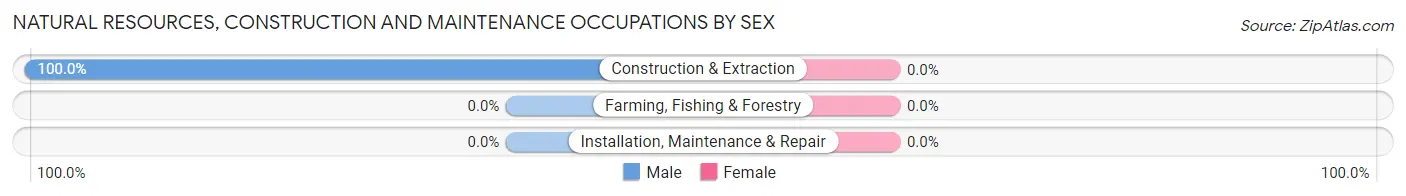
| Occupation | Male | Female |
| Farming, Fishing & Forestry | 0 (0.0%) | 0 (0.0%) |
| Construction & Extraction | 13 (100.0%) | 0 (0.0%) |
| Installation, Maintenance & Repair | 0 (0.0%) | 0 (0.0%) |
| Total (Category) | 13 (100.0%) | 0 (0.0%) |
| Total (Overall) | 117 (38.7%) | 185 (61.3%) |
Production, Transportation and Moving Occupations
The most common Production, Transportation and Moving occupations in Butlertown are Production (41 | 13.6%), and Material Moving (12 | 4.0%).
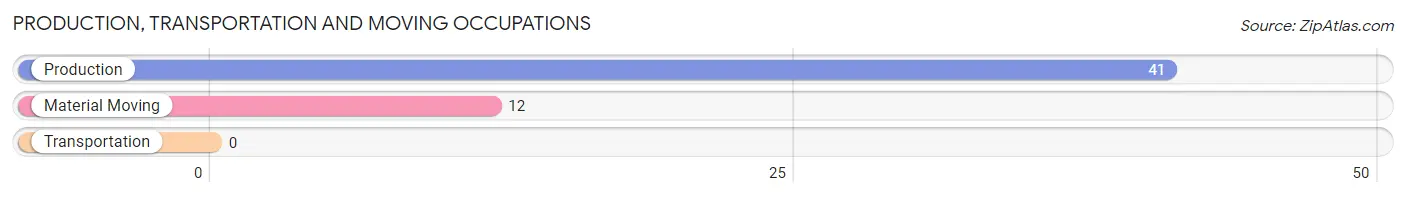
Production, Transportation and Moving Occupations by Sex
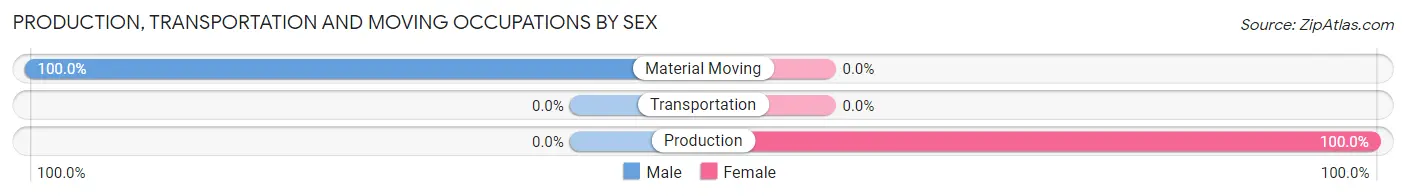
| Occupation | Male | Female |
| Production | 0 (0.0%) | 41 (100.0%) |
| Transportation | 0 (0.0%) | 0 (0.0%) |
| Material Moving | 12 (100.0%) | 0 (0.0%) |
| Total (Category) | 12 (22.6%) | 41 (77.4%) |
| Total (Overall) | 117 (38.7%) | 185 (61.3%) |
Employment Industries by Sex in Butlertown
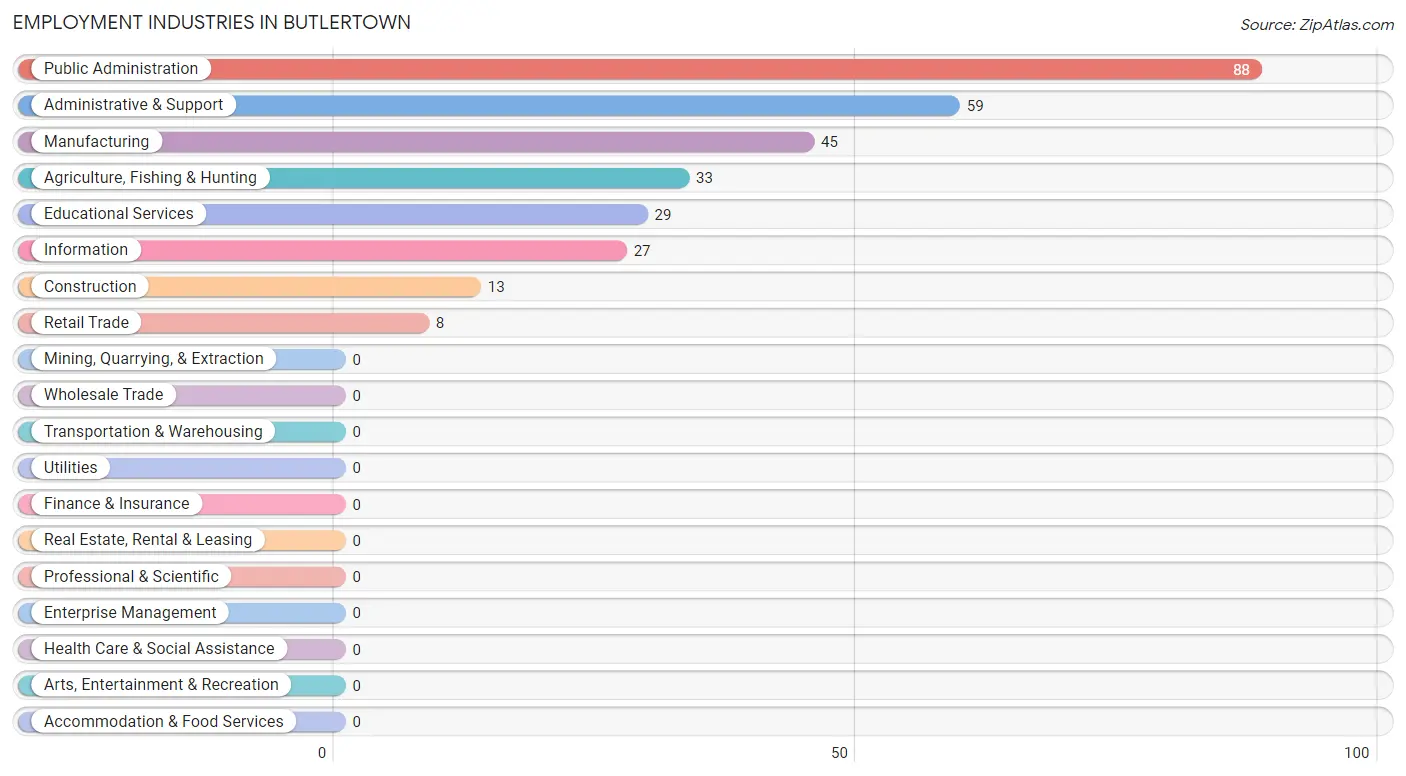
Employment Industries in Butlertown
The major employment industries in Butlertown include Public Administration (88 | 29.1%), Administrative & Support (59 | 19.5%), Manufacturing (45 | 14.9%), Agriculture, Fishing & Hunting (33 | 10.9%), and Educational Services (29 | 9.6%).
Employment Industries by Sex in Butlertown
The Butlertown industries that see more men than women are Agriculture, Fishing & Hunting (100.0%), Construction (100.0%), and Administrative & Support (100.0%), whereas the industries that tend to have a higher number of women are Retail Trade (100.0%), Information (100.0%), and Educational Services (100.0%).
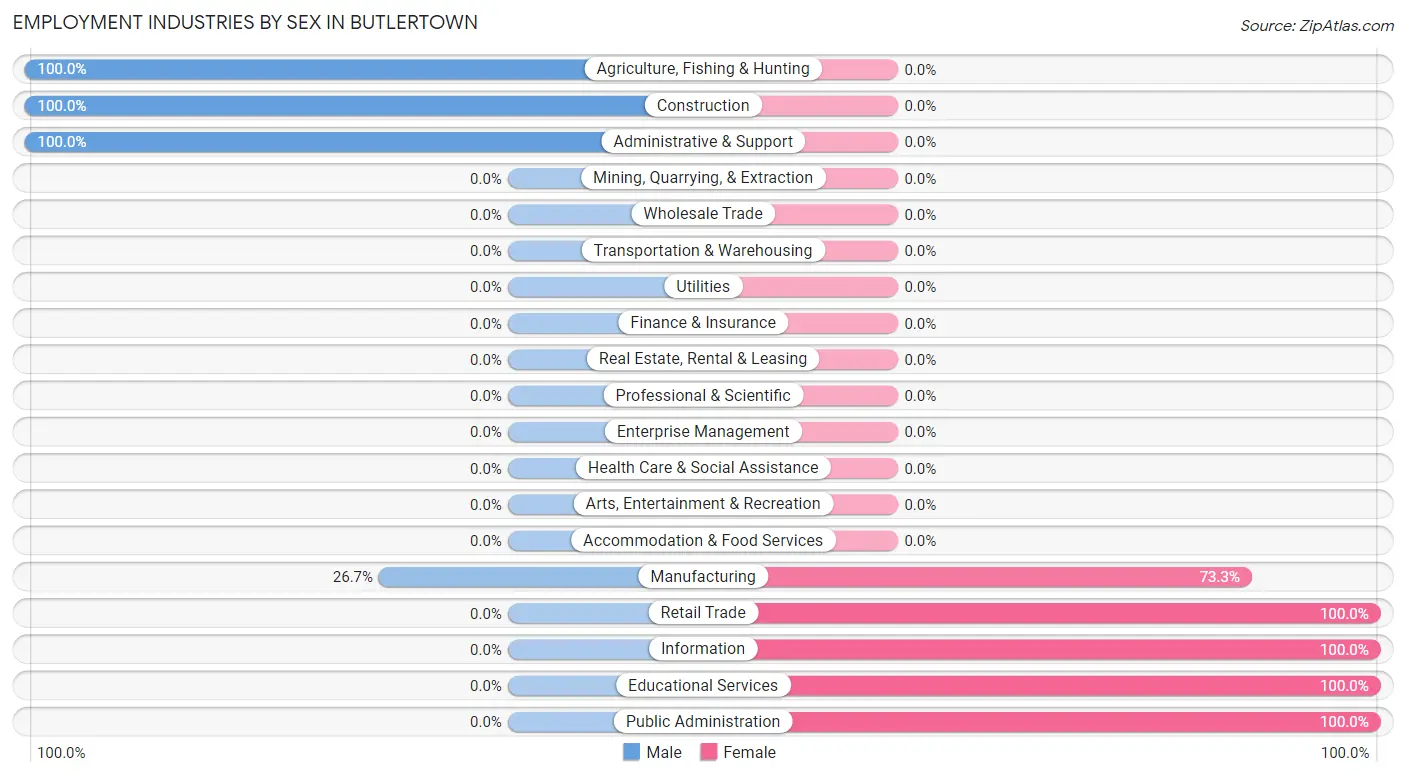
| Industry | Male | Female |
| Agriculture, Fishing & Hunting | 33 (100.0%) | 0 (0.0%) |
| Mining, Quarrying, & Extraction | 0 (0.0%) | 0 (0.0%) |
| Construction | 13 (100.0%) | 0 (0.0%) |
| Manufacturing | 12 (26.7%) | 33 (73.3%) |
| Wholesale Trade | 0 (0.0%) | 0 (0.0%) |
| Retail Trade | 0 (0.0%) | 8 (100.0%) |
| Transportation & Warehousing | 0 (0.0%) | 0 (0.0%) |
| Utilities | 0 (0.0%) | 0 (0.0%) |
| Information | 0 (0.0%) | 27 (100.0%) |
| Finance & Insurance | 0 (0.0%) | 0 (0.0%) |
| Real Estate, Rental & Leasing | 0 (0.0%) | 0 (0.0%) |
| Professional & Scientific | 0 (0.0%) | 0 (0.0%) |
| Enterprise Management | 0 (0.0%) | 0 (0.0%) |
| Administrative & Support | 59 (100.0%) | 0 (0.0%) |
| Educational Services | 0 (0.0%) | 29 (100.0%) |
| Health Care & Social Assistance | 0 (0.0%) | 0 (0.0%) |
| Arts, Entertainment & Recreation | 0 (0.0%) | 0 (0.0%) |
| Accommodation & Food Services | 0 (0.0%) | 0 (0.0%) |
| Public Administration | 0 (0.0%) | 88 (100.0%) |
| Total | 117 (38.7%) | 185 (61.3%) |
Education in Butlertown
School Enrollment in Butlertown
The most common levels of schooling among the 149 students in Butlertown are college / undergraduate (88 | 59.1%), high school (35 | 23.5%), and middle school (15 | 10.1%).
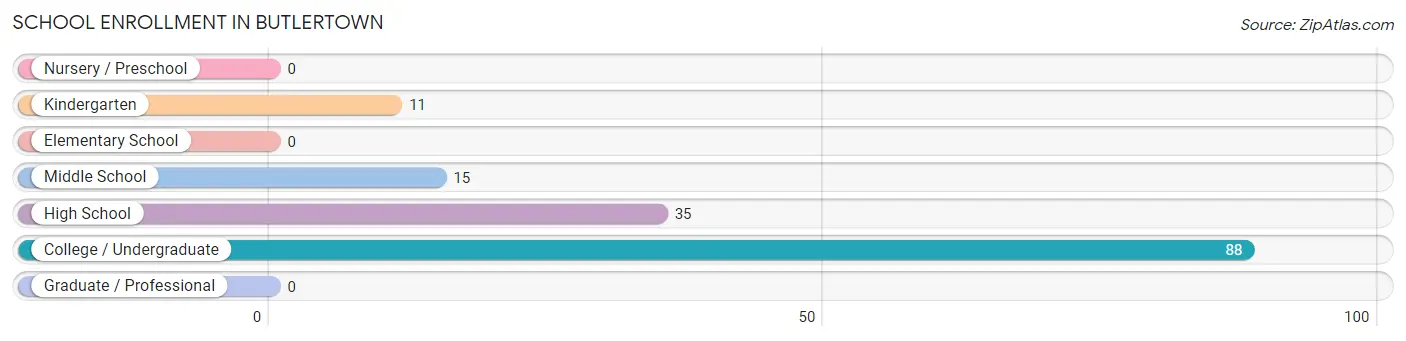
| School Level | # Students | % Students |
| Nursery / Preschool | 0 | 0.0% |
| Kindergarten | 11 | 7.4% |
| Elementary School | 0 | 0.0% |
| Middle School | 15 | 10.1% |
| High School | 35 | 23.5% |
| College / Undergraduate | 88 | 59.1% |
| Graduate / Professional | 0 | 0.0% |
| Total | 149 | 100.0% |
School Enrollment by Age by Funding Source in Butlertown
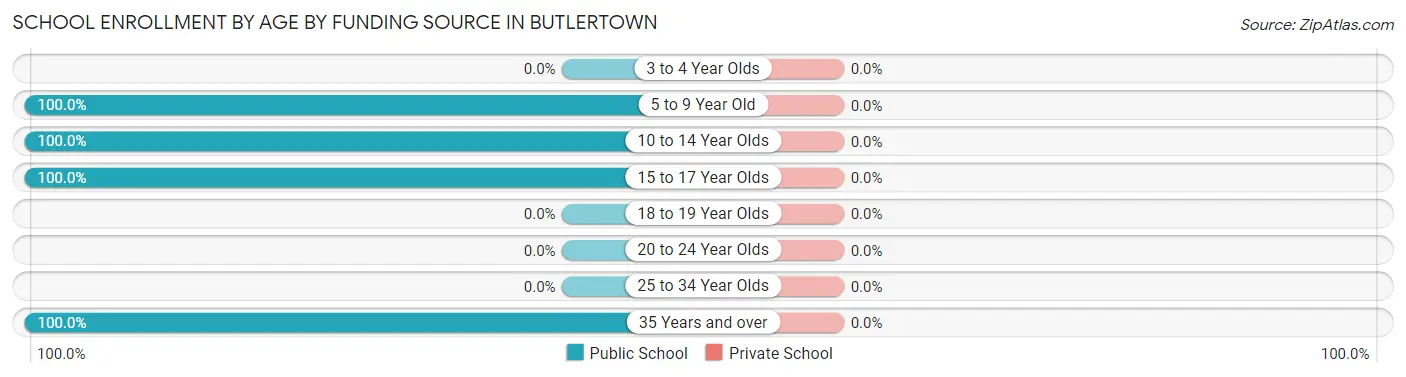
| Age Bracket | Public School | Private School |
| 3 to 4 Year Olds | 0 (0.0%) | 0 (0.0%) |
| 5 to 9 Year Old | 11 (100.0%) | 0 (0.0%) |
| 10 to 14 Year Olds | 15 (100.0%) | 0 (0.0%) |
| 15 to 17 Year Olds | 35 (100.0%) | 0 (0.0%) |
| 18 to 19 Year Olds | 0 (0.0%) | 0 (0.0%) |
| 20 to 24 Year Olds | 0 (0.0%) | 0 (0.0%) |
| 25 to 34 Year Olds | 0 (0.0%) | 0 (0.0%) |
| 35 Years and over | 88 (100.0%) | 0 (0.0%) |
| Total | 149 (100.0%) | 0 (0.0%) |
Educational Attainment by Field of Study in Butlertown
Business (59 | 53.6%), computers & mathematics (27 | 24.5%), liberal arts & history (14 | 12.7%), and arts & humanities (10 | 9.1%) are the most common fields of study among 110 individuals in Butlertown who have obtained a bachelor's degree or higher.
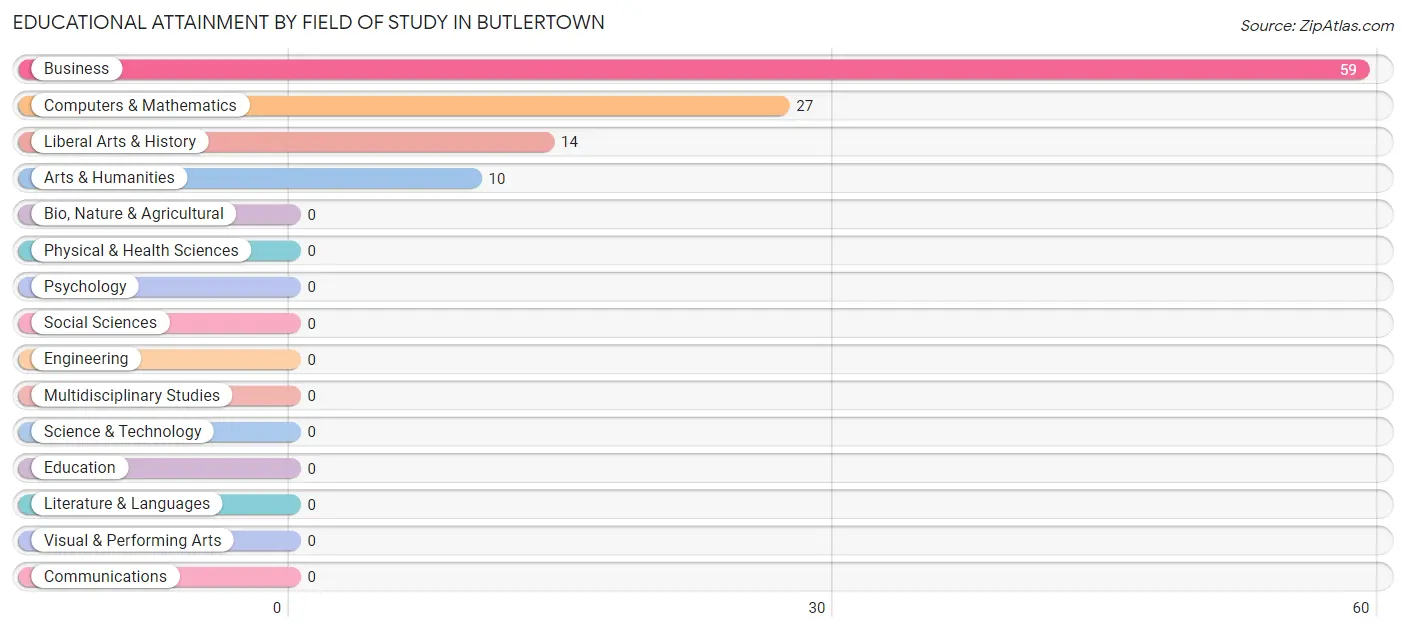
| Field of Study | # Graduates | % Graduates |
| Computers & Mathematics | 27 | 24.5% |
| Bio, Nature & Agricultural | 0 | 0.0% |
| Physical & Health Sciences | 0 | 0.0% |
| Psychology | 0 | 0.0% |
| Social Sciences | 0 | 0.0% |
| Engineering | 0 | 0.0% |
| Multidisciplinary Studies | 0 | 0.0% |
| Science & Technology | 0 | 0.0% |
| Business | 59 | 53.6% |
| Education | 0 | 0.0% |
| Literature & Languages | 0 | 0.0% |
| Liberal Arts & History | 14 | 12.7% |
| Visual & Performing Arts | 0 | 0.0% |
| Communications | 0 | 0.0% |
| Arts & Humanities | 10 | 9.1% |
| Total | 110 | 100.0% |
Transportation & Commute in Butlertown
Vehicle Availability by Sex in Butlertown
The most prevalent vehicle ownership categories in Butlertown are males with 3 vehicles (132, accounting for 69.5%) and females with 3 vehicles (121, making up 71.4%).
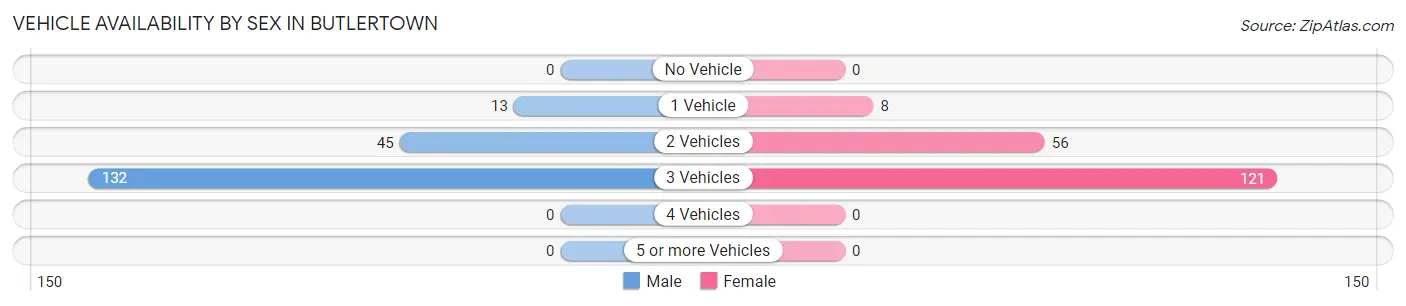
| Vehicles Available | Male | Female |
| No Vehicle | 0 (0.0%) | 0 (0.0%) |
| 1 Vehicle | 13 (6.8%) | 8 (4.3%) |
| 2 Vehicles | 45 (23.7%) | 56 (30.3%) |
| 3 Vehicles | 132 (69.5%) | 121 (65.4%) |
| 4 Vehicles | 0 (0.0%) | 0 (0.0%) |
| 5 or more Vehicles | 0 (0.0%) | 0 (0.0%) |
| Total | 190 (100.0%) | 185 (100.0%) |
Commute Time in Butlertown
The most frequently occuring commute durations in Butlertown are 40 to 44 minutes (102 commuters, 27.2%), 60 to 89 minutes (92 commuters, 24.5%), and 45 to 59 minutes (81 commuters, 21.6%).
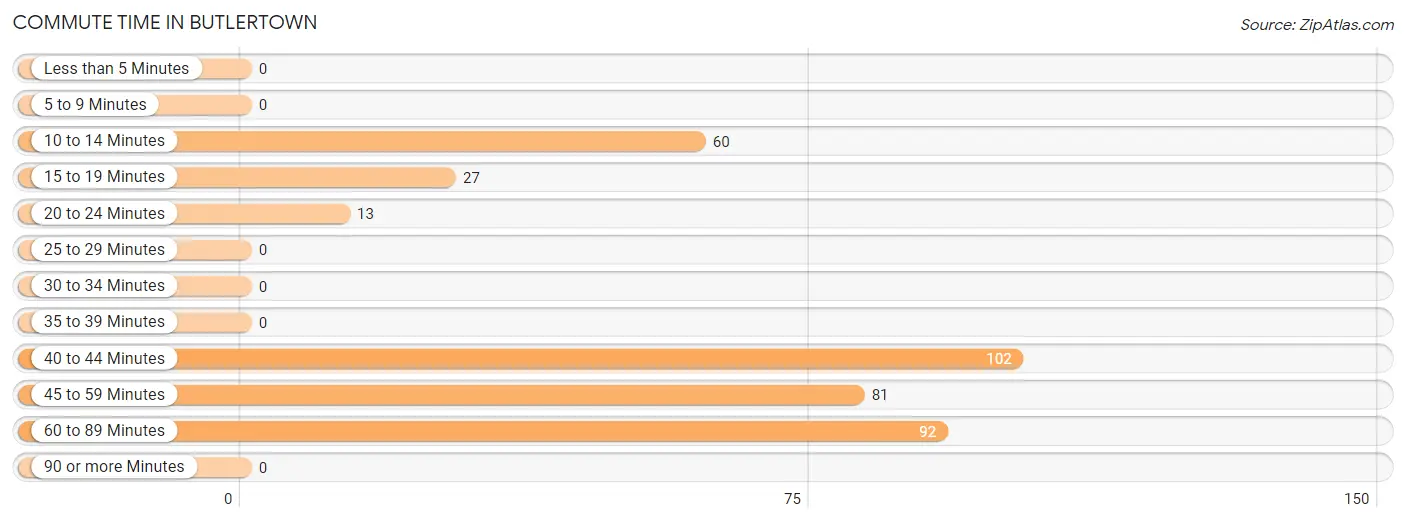
| Commute Time | # Commuters | % Commuters |
| Less than 5 Minutes | 0 | 0.0% |
| 5 to 9 Minutes | 0 | 0.0% |
| 10 to 14 Minutes | 60 | 16.0% |
| 15 to 19 Minutes | 27 | 7.2% |
| 20 to 24 Minutes | 13 | 3.5% |
| 25 to 29 Minutes | 0 | 0.0% |
| 30 to 34 Minutes | 0 | 0.0% |
| 35 to 39 Minutes | 0 | 0.0% |
| 40 to 44 Minutes | 102 | 27.2% |
| 45 to 59 Minutes | 81 | 21.6% |
| 60 to 89 Minutes | 92 | 24.5% |
| 90 or more Minutes | 0 | 0.0% |
Commute Time by Sex in Butlertown
The most common commute times in Butlertown are 60 to 89 minutes (92 commuters, 48.4%) for males and 40 to 44 minutes (102 commuters, 55.1%) for females.
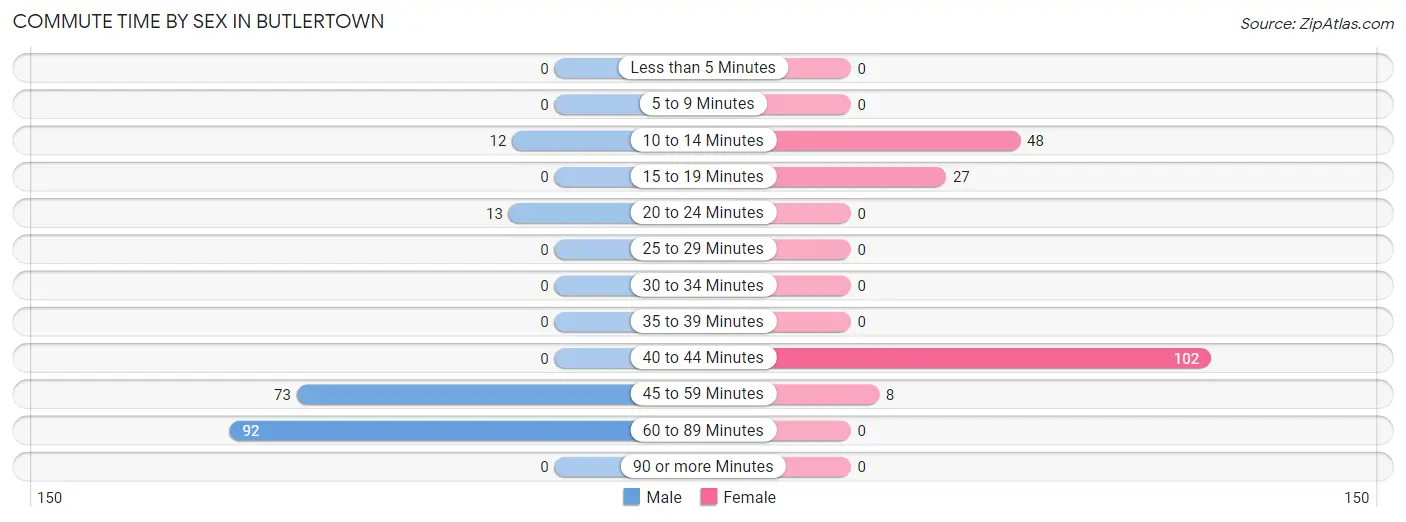
| Commute Time | Male | Female |
| Less than 5 Minutes | 0 (0.0%) | 0 (0.0%) |
| 5 to 9 Minutes | 0 (0.0%) | 0 (0.0%) |
| 10 to 14 Minutes | 12 (6.3%) | 48 (26.0%) |
| 15 to 19 Minutes | 0 (0.0%) | 27 (14.6%) |
| 20 to 24 Minutes | 13 (6.8%) | 0 (0.0%) |
| 25 to 29 Minutes | 0 (0.0%) | 0 (0.0%) |
| 30 to 34 Minutes | 0 (0.0%) | 0 (0.0%) |
| 35 to 39 Minutes | 0 (0.0%) | 0 (0.0%) |
| 40 to 44 Minutes | 0 (0.0%) | 102 (55.1%) |
| 45 to 59 Minutes | 73 (38.4%) | 8 (4.3%) |
| 60 to 89 Minutes | 92 (48.4%) | 0 (0.0%) |
| 90 or more Minutes | 0 (0.0%) | 0 (0.0%) |
Time of Departure to Work by Sex in Butlertown
The most frequent times of departure to work in Butlertown are 6:30 AM to 6:59 AM (86, 45.3%) for males and 7:00 AM to 7:29 AM (121, 65.4%) for females.
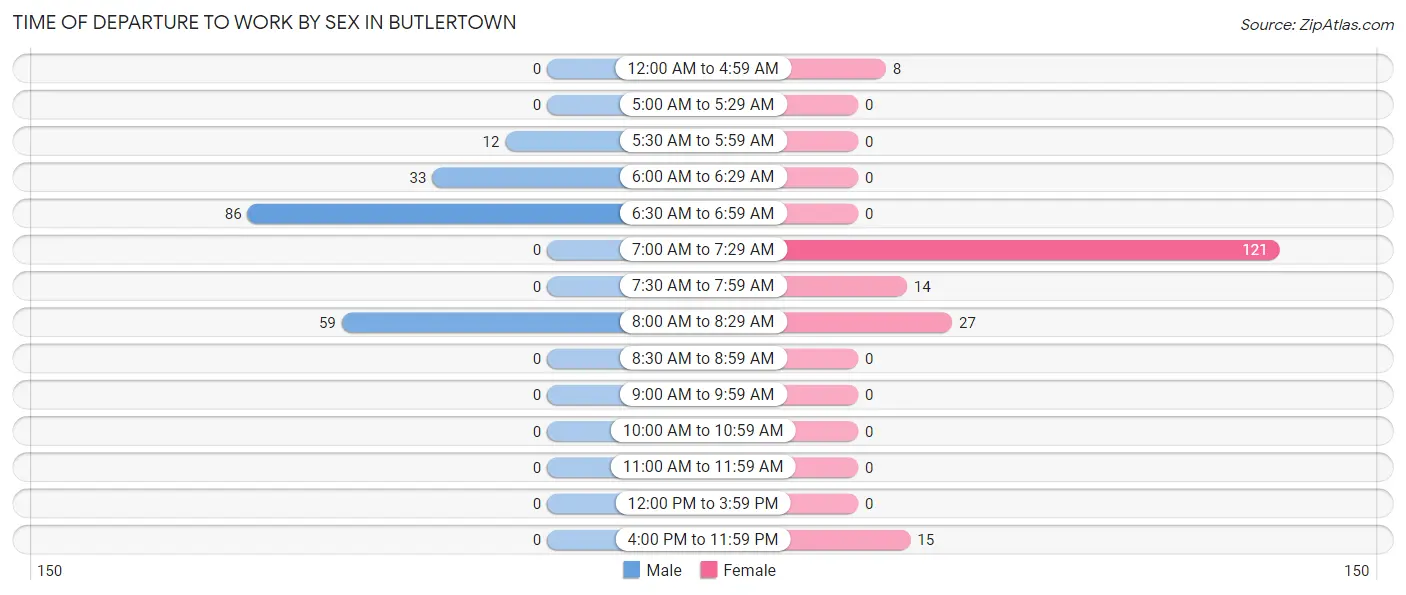
| Time of Departure | Male | Female |
| 12:00 AM to 4:59 AM | 0 (0.0%) | 8 (4.3%) |
| 5:00 AM to 5:29 AM | 0 (0.0%) | 0 (0.0%) |
| 5:30 AM to 5:59 AM | 12 (6.3%) | 0 (0.0%) |
| 6:00 AM to 6:29 AM | 33 (17.4%) | 0 (0.0%) |
| 6:30 AM to 6:59 AM | 86 (45.3%) | 0 (0.0%) |
| 7:00 AM to 7:29 AM | 0 (0.0%) | 121 (65.4%) |
| 7:30 AM to 7:59 AM | 0 (0.0%) | 14 (7.6%) |
| 8:00 AM to 8:29 AM | 59 (31.0%) | 27 (14.6%) |
| 8:30 AM to 8:59 AM | 0 (0.0%) | 0 (0.0%) |
| 9:00 AM to 9:59 AM | 0 (0.0%) | 0 (0.0%) |
| 10:00 AM to 10:59 AM | 0 (0.0%) | 0 (0.0%) |
| 11:00 AM to 11:59 AM | 0 (0.0%) | 0 (0.0%) |
| 12:00 PM to 3:59 PM | 0 (0.0%) | 0 (0.0%) |
| 4:00 PM to 11:59 PM | 0 (0.0%) | 15 (8.1%) |
| Total | 190 (100.0%) | 185 (100.0%) |
Housing Occupancy in Butlertown
Occupancy by Ownership in Butlertown
Of the total 228 dwellings in Butlertown, owner-occupied units account for 217 (95.2%), while renter-occupied units make up 11 (4.8%).
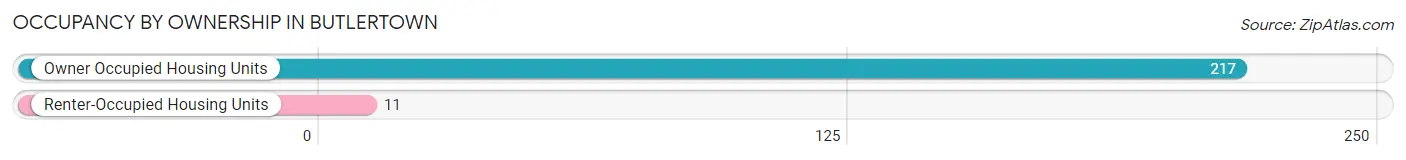
| Occupancy | # Housing Units | % Housing Units |
| Owner Occupied Housing Units | 217 | 95.2% |
| Renter-Occupied Housing Units | 11 | 4.8% |
| Total Occupied Housing Units | 228 | 100.0% |
Occupancy by Household Size in Butlertown
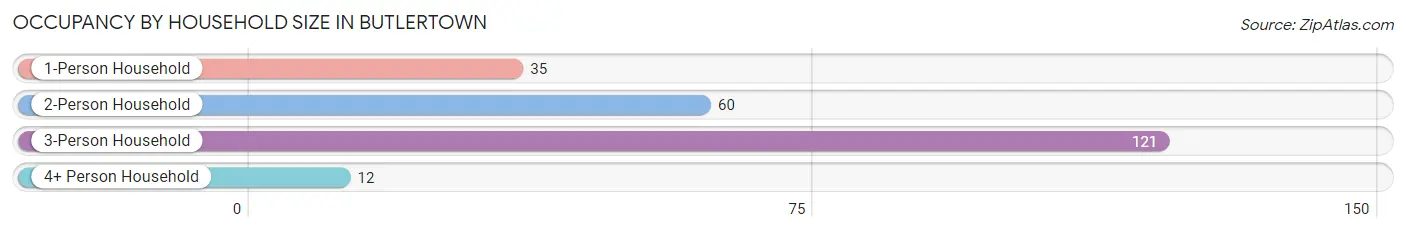
| Household Size | # Housing Units | % Housing Units |
| 1-Person Household | 35 | 15.3% |
| 2-Person Household | 60 | 26.3% |
| 3-Person Household | 121 | 53.1% |
| 4+ Person Household | 12 | 5.3% |
| Total Housing Units | 228 | 100.0% |
Occupancy by Ownership by Household Size in Butlertown
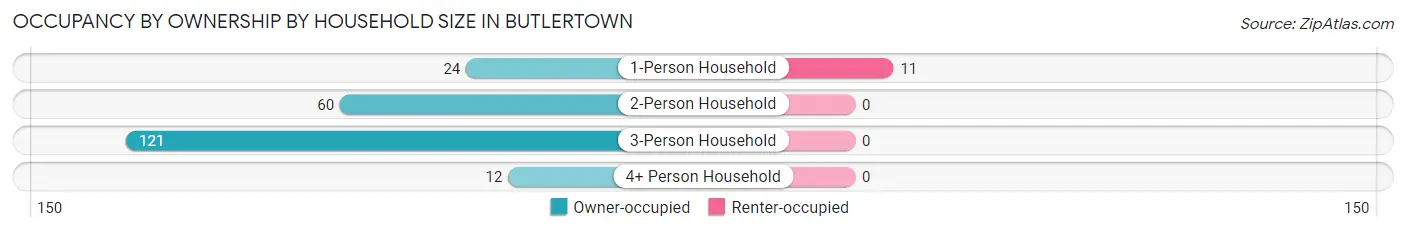
| Household Size | Owner-occupied | Renter-occupied |
| 1-Person Household | 24 (68.6%) | 11 (31.4%) |
| 2-Person Household | 60 (100.0%) | 0 (0.0%) |
| 3-Person Household | 121 (100.0%) | 0 (0.0%) |
| 4+ Person Household | 12 (100.0%) | 0 (0.0%) |
| Total Housing Units | 217 (95.2%) | 11 (4.8%) |
Occupancy by Educational Attainment in Butlertown
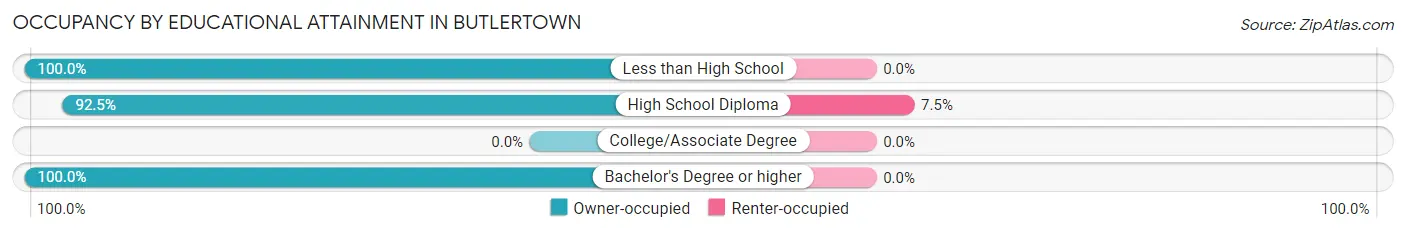
| Household Size | Owner-occupied | Renter-occupied |
| Less than High School | 31 (100.0%) | 0 (0.0%) |
| High School Diploma | 135 (92.5%) | 11 (7.5%) |
| College/Associate Degree | 0 (0.0%) | 0 (0.0%) |
| Bachelor's Degree or higher | 51 (100.0%) | 0 (0.0%) |
Occupancy by Age of Householder in Butlertown
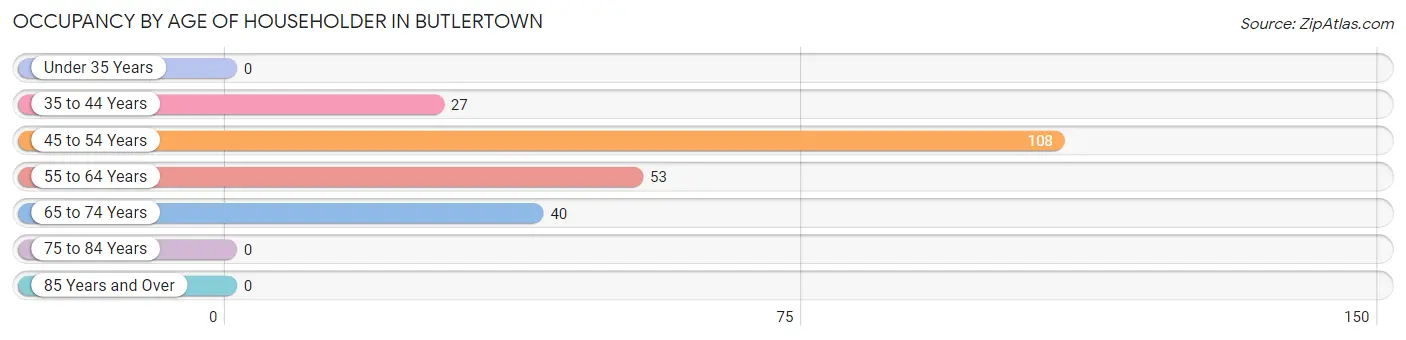
| Age Bracket | # Households | % Households |
| Under 35 Years | 0 | 0.0% |
| 35 to 44 Years | 27 | 11.8% |
| 45 to 54 Years | 108 | 47.4% |
| 55 to 64 Years | 53 | 23.3% |
| 65 to 74 Years | 40 | 17.5% |
| 75 to 84 Years | 0 | 0.0% |
| 85 Years and Over | 0 | 0.0% |
| Total | 228 | 100.0% |
Housing Finances in Butlertown
Median Income by Occupancy in Butlertown
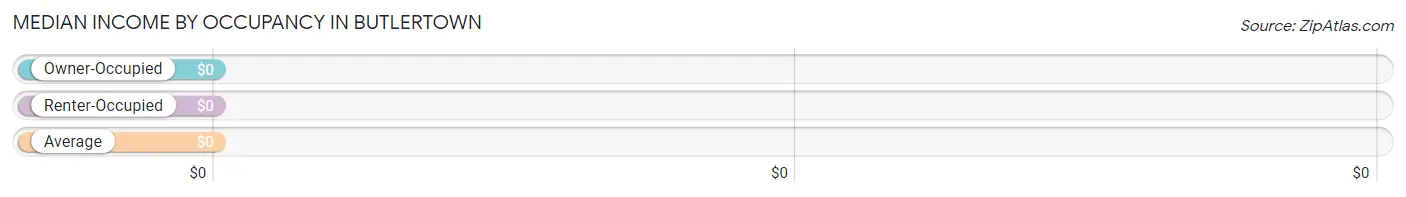
| Occupancy Type | # Households | Median Income |
| Owner-Occupied | 217 (95.2%) | $0 |
| Renter-Occupied | 11 (4.8%) | $0 |
| Average | 228 (100.0%) | $0 |
Occupancy by Householder Income Bracket in Butlertown
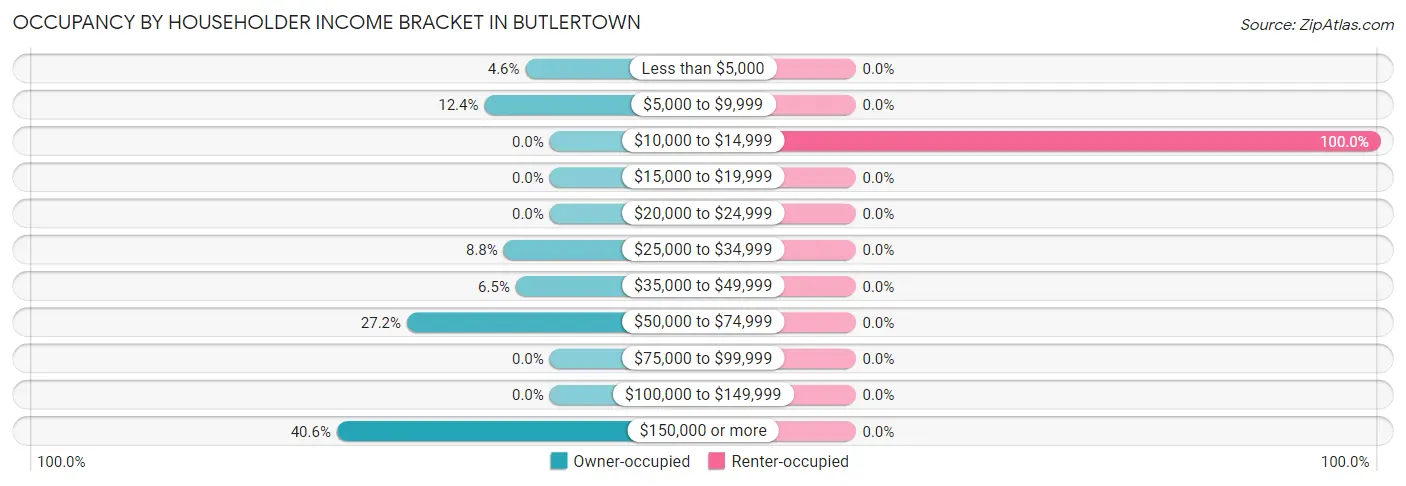
| Income Bracket | Owner-occupied | Renter-occupied |
| Less than $5,000 | 10 (4.6%) | 0 (0.0%) |
| $5,000 to $9,999 | 27 (12.4%) | 0 (0.0%) |
| $10,000 to $14,999 | 0 (0.0%) | 11 (100.0%) |
| $15,000 to $19,999 | 0 (0.0%) | 0 (0.0%) |
| $20,000 to $24,999 | 0 (0.0%) | 0 (0.0%) |
| $25,000 to $34,999 | 19 (8.8%) | 0 (0.0%) |
| $35,000 to $49,999 | 14 (6.5%) | 0 (0.0%) |
| $50,000 to $74,999 | 59 (27.2%) | 0 (0.0%) |
| $75,000 to $99,999 | 0 (0.0%) | 0 (0.0%) |
| $100,000 to $149,999 | 0 (0.0%) | 0 (0.0%) |
| $150,000 or more | 88 (40.6%) | 0 (0.0%) |
| Total | 217 (100.0%) | 11 (100.0%) |
Monthly Housing Cost Tiers in Butlertown
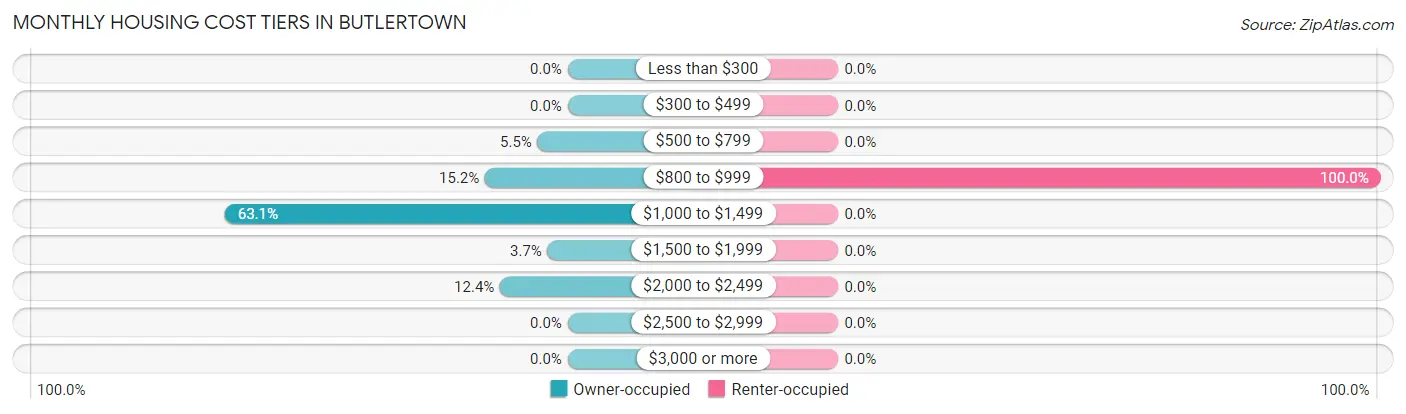
| Monthly Cost | Owner-occupied | Renter-occupied |
| Less than $300 | 0 (0.0%) | 0 (0.0%) |
| $300 to $499 | 0 (0.0%) | 0 (0.0%) |
| $500 to $799 | 12 (5.5%) | 0 (0.0%) |
| $800 to $999 | 33 (15.2%) | 11 (100.0%) |
| $1,000 to $1,499 | 137 (63.1%) | 0 (0.0%) |
| $1,500 to $1,999 | 8 (3.7%) | 0 (0.0%) |
| $2,000 to $2,499 | 27 (12.4%) | 0 (0.0%) |
| $2,500 to $2,999 | 0 (0.0%) | 0 (0.0%) |
| $3,000 or more | 0 (0.0%) | 0 (0.0%) |
| Total | 217 (100.0%) | 11 (100.0%) |
Physical Housing Characteristics in Butlertown
Housing Structures in Butlertown
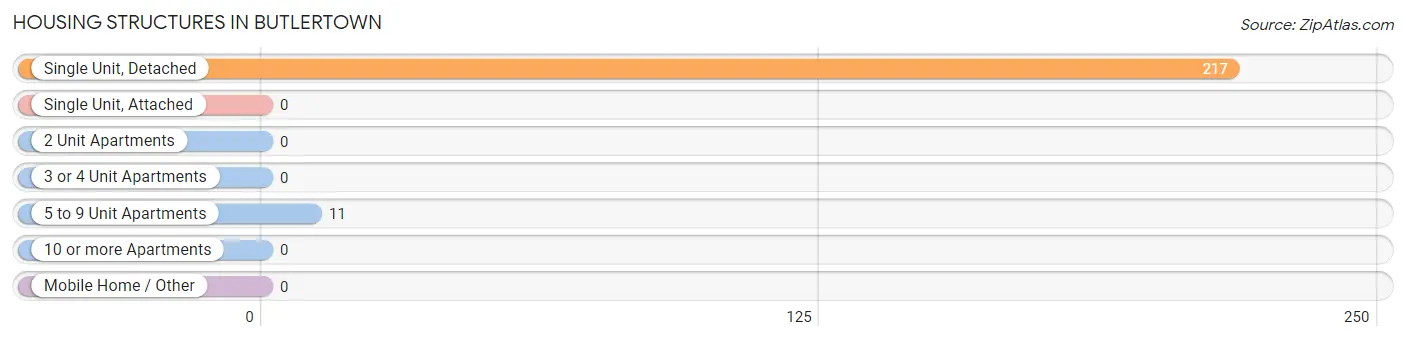
| Structure Type | # Housing Units | % Housing Units |
| Single Unit, Detached | 217 | 95.2% |
| Single Unit, Attached | 0 | 0.0% |
| 2 Unit Apartments | 0 | 0.0% |
| 3 or 4 Unit Apartments | 0 | 0.0% |
| 5 to 9 Unit Apartments | 11 | 4.8% |
| 10 or more Apartments | 0 | 0.0% |
| Mobile Home / Other | 0 | 0.0% |
| Total | 228 | 100.0% |
Housing Structures by Occupancy in Butlertown
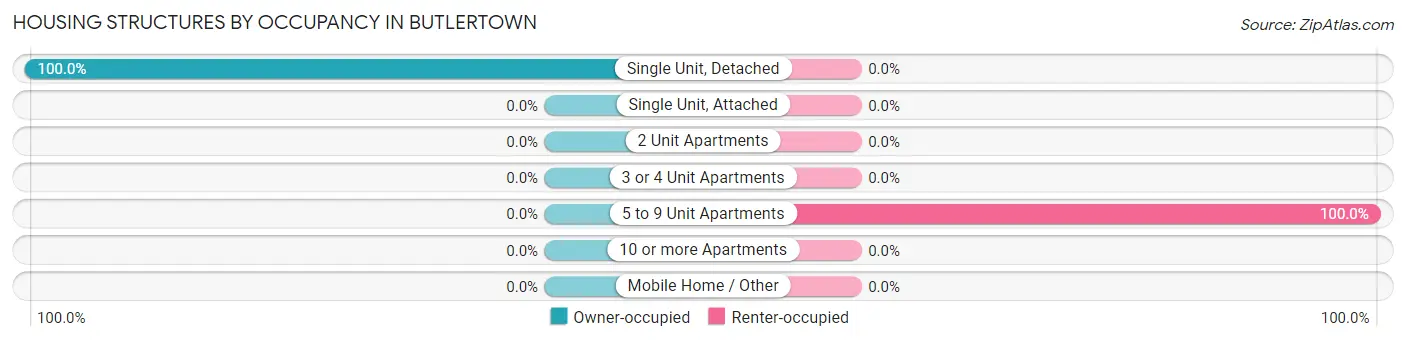
| Structure Type | Owner-occupied | Renter-occupied |
| Single Unit, Detached | 217 (100.0%) | 0 (0.0%) |
| Single Unit, Attached | 0 (0.0%) | 0 (0.0%) |
| 2 Unit Apartments | 0 (0.0%) | 0 (0.0%) |
| 3 or 4 Unit Apartments | 0 (0.0%) | 0 (0.0%) |
| 5 to 9 Unit Apartments | 0 (0.0%) | 11 (100.0%) |
| 10 or more Apartments | 0 (0.0%) | 0 (0.0%) |
| Mobile Home / Other | 0 (0.0%) | 0 (0.0%) |
| Total | 217 (95.2%) | 11 (4.8%) |
Housing Structures by Number of Rooms in Butlertown
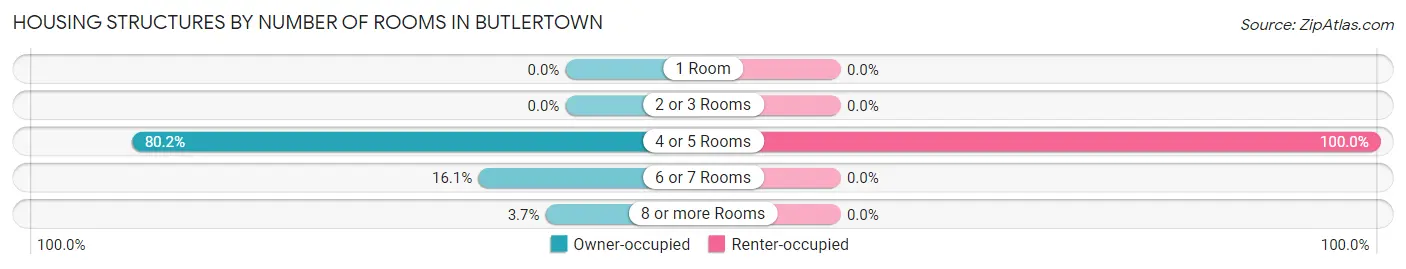
| Number of Rooms | Owner-occupied | Renter-occupied |
| 1 Room | 0 (0.0%) | 0 (0.0%) |
| 2 or 3 Rooms | 0 (0.0%) | 0 (0.0%) |
| 4 or 5 Rooms | 174 (80.2%) | 11 (100.0%) |
| 6 or 7 Rooms | 35 (16.1%) | 0 (0.0%) |
| 8 or more Rooms | 8 (3.7%) | 0 (0.0%) |
| Total | 217 (100.0%) | 11 (100.0%) |
Housing Structure by Heating Type in Butlertown
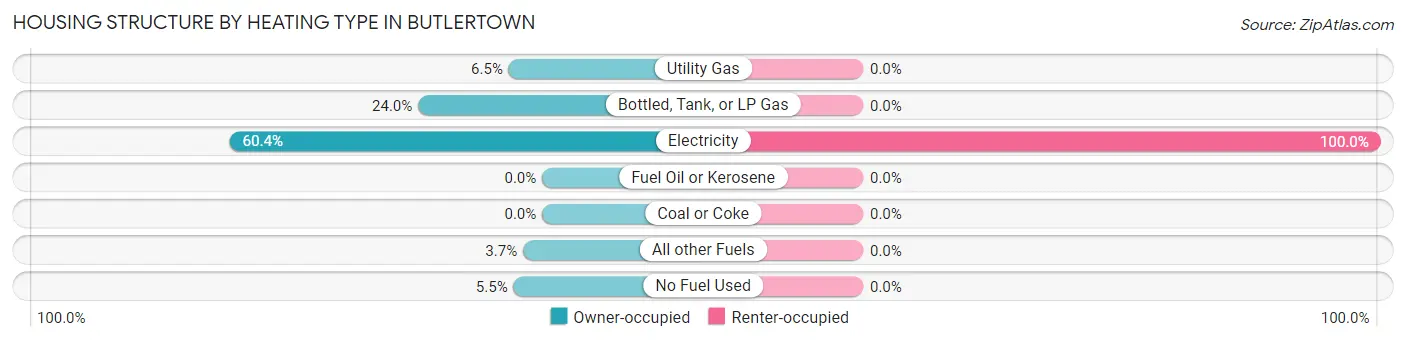
| Heating Type | Owner-occupied | Renter-occupied |
| Utility Gas | 14 (6.5%) | 0 (0.0%) |
| Bottled, Tank, or LP Gas | 52 (24.0%) | 0 (0.0%) |
| Electricity | 131 (60.4%) | 11 (100.0%) |
| Fuel Oil or Kerosene | 0 (0.0%) | 0 (0.0%) |
| Coal or Coke | 0 (0.0%) | 0 (0.0%) |
| All other Fuels | 8 (3.7%) | 0 (0.0%) |
| No Fuel Used | 12 (5.5%) | 0 (0.0%) |
| Total | 217 (100.0%) | 11 (100.0%) |
Household Vehicle Usage in Butlertown
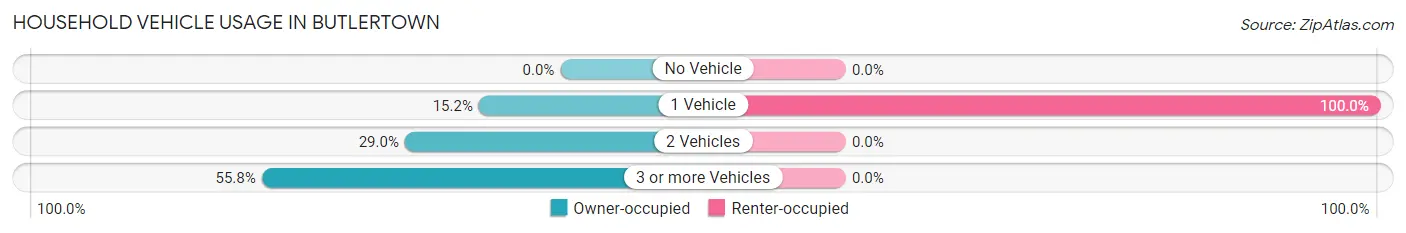
| Vehicles per Household | Owner-occupied | Renter-occupied |
| No Vehicle | 0 (0.0%) | 0 (0.0%) |
| 1 Vehicle | 33 (15.2%) | 11 (100.0%) |
| 2 Vehicles | 63 (29.0%) | 0 (0.0%) |
| 3 or more Vehicles | 121 (55.8%) | 0 (0.0%) |
| Total | 217 (100.0%) | 11 (100.0%) |
Real Estate & Mortgages in Butlertown
Real Estate and Mortgage Overview in Butlertown
| Characteristic | Without Mortgage | With Mortgage |
| Housing Units | 12 | 205 |
| Median Property Value | - | - |
| Median Household Income | - | - |
| Monthly Housing Costs | - | - |
| Real Estate Taxes | - | - |
Property Value by Mortgage Status in Butlertown
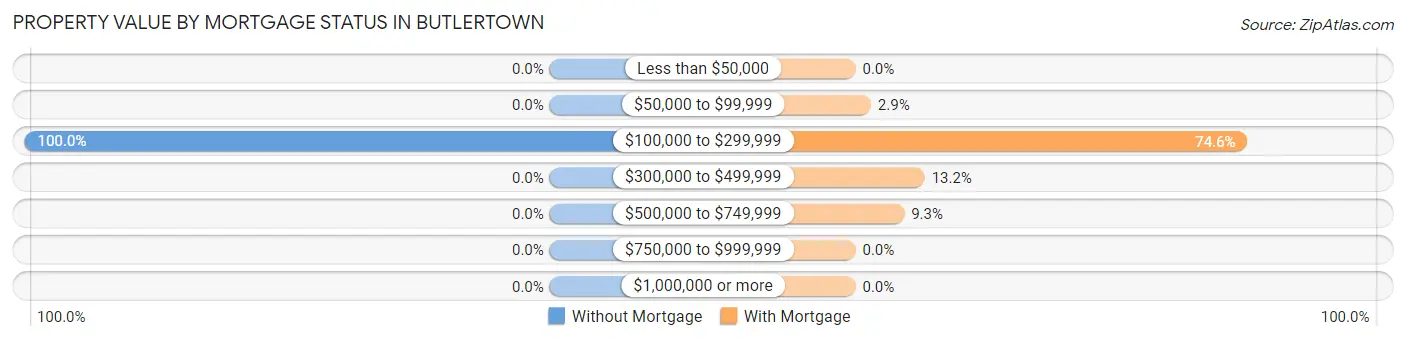
| Property Value | Without Mortgage | With Mortgage |
| Less than $50,000 | 0 (0.0%) | 0 (0.0%) |
| $50,000 to $99,999 | 0 (0.0%) | 6 (2.9%) |
| $100,000 to $299,999 | 12 (100.0%) | 153 (74.6%) |
| $300,000 to $499,999 | 0 (0.0%) | 27 (13.2%) |
| $500,000 to $749,999 | 0 (0.0%) | 19 (9.3%) |
| $750,000 to $999,999 | 0 (0.0%) | 0 (0.0%) |
| $1,000,000 or more | 0 (0.0%) | 0 (0.0%) |
| Total | 12 (100.0%) | 205 (100.0%) |
Household Income by Mortgage Status in Butlertown
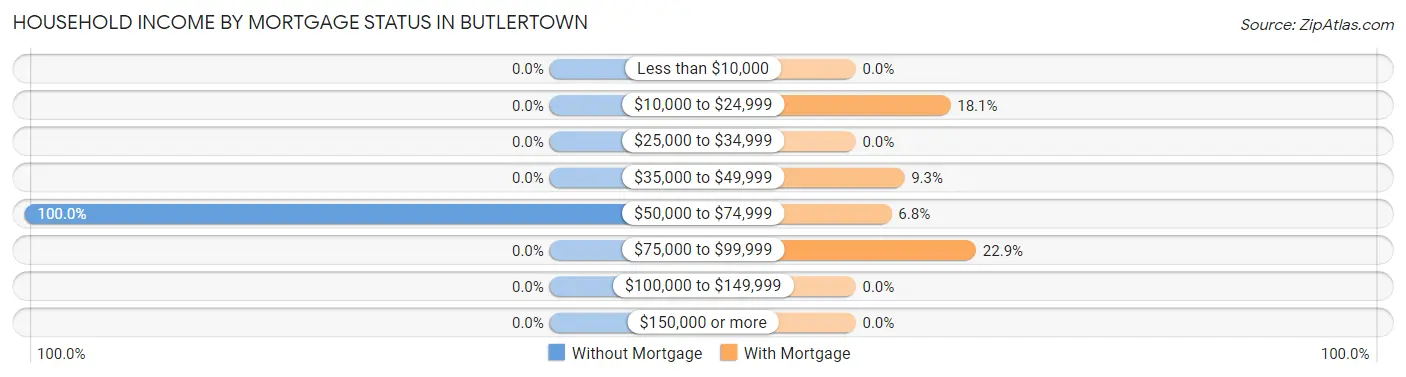
| Household Income | Without Mortgage | With Mortgage |
| Less than $10,000 | 0 (0.0%) | 0 (0.0%) |
| $10,000 to $24,999 | 0 (0.0%) | 37 (18.0%) |
| $25,000 to $34,999 | 0 (0.0%) | 0 (0.0%) |
| $35,000 to $49,999 | 0 (0.0%) | 19 (9.3%) |
| $50,000 to $74,999 | 12 (100.0%) | 14 (6.8%) |
| $75,000 to $99,999 | 0 (0.0%) | 47 (22.9%) |
| $100,000 to $149,999 | 0 (0.0%) | 0 (0.0%) |
| $150,000 or more | 0 (0.0%) | 0 (0.0%) |
| Total | 12 (100.0%) | 205 (100.0%) |
Property Value to Household Income Ratio in Butlertown
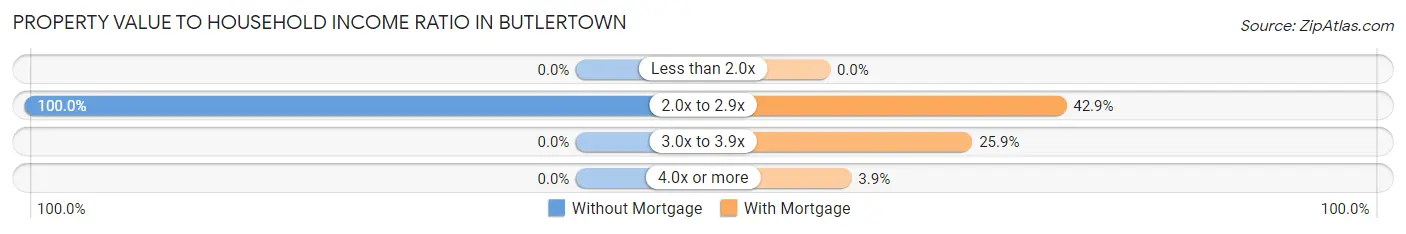
| Value-to-Income Ratio | Without Mortgage | With Mortgage |
| Less than 2.0x | 0 (0.0%) | 0 (0.0%) |
| 2.0x to 2.9x | 12 (100.0%) | 88 (42.9%) |
| 3.0x to 3.9x | 0 (0.0%) | 53 (25.9%) |
| 4.0x or more | 0 (0.0%) | 8 (3.9%) |
| Total | 12 (100.0%) | 205 (100.0%) |
Real Estate Taxes by Mortgage Status in Butlertown
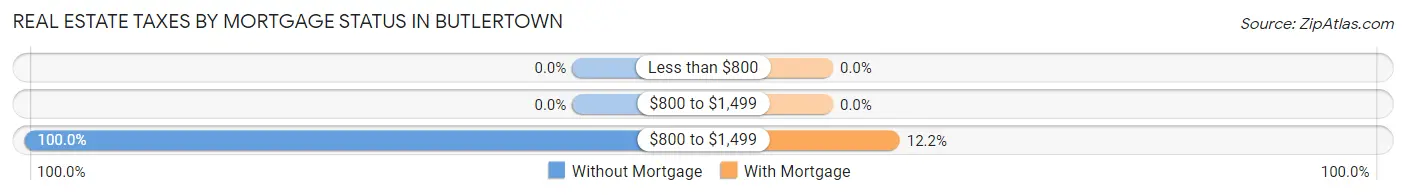
| Property Taxes | Without Mortgage | With Mortgage |
| Less than $800 | 0 (0.0%) | 0 (0.0%) |
| $800 to $1,499 | 0 (0.0%) | 0 (0.0%) |
| $800 to $1,499 | 12 (100.0%) | 25 (12.2%) |
| Total | 12 (100.0%) | 205 (100.0%) |
Health & Disability in Butlertown
Health Insurance Coverage by Age in Butlertown
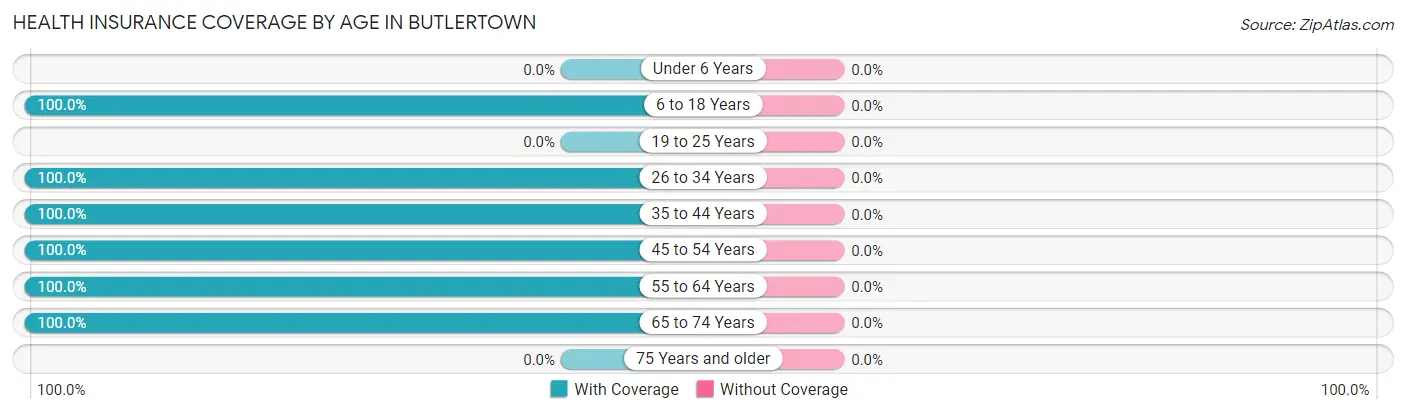
| Age Bracket | With Coverage | Without Coverage |
| Under 6 Years | 0 (0.0%) | 0 (0.0%) |
| 6 to 18 Years | 61 (100.0%) | 0 (0.0%) |
| 19 to 25 Years | 0 (0.0%) | 0 (0.0%) |
| 26 to 34 Years | 59 (100.0%) | 0 (0.0%) |
| 35 to 44 Years | 60 (100.0%) | 0 (0.0%) |
| 45 to 54 Years | 141 (100.0%) | 0 (0.0%) |
| 55 to 64 Years | 85 (100.0%) | 0 (0.0%) |
| 65 to 74 Years | 40 (100.0%) | 0 (0.0%) |
| 75 Years and older | 0 (0.0%) | 0 (0.0%) |
| Total | 446 (100.0%) | 0 (0.0%) |
Health Insurance Coverage by Citizenship Status in Butlertown
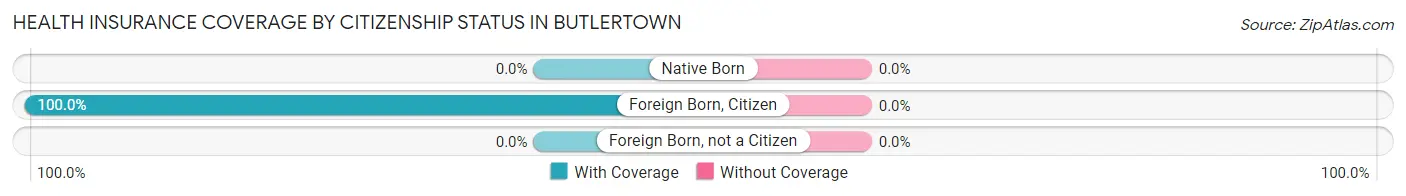
| Citizenship Status | With Coverage | Without Coverage |
| Native Born | 0 (0.0%) | 0 (0.0%) |
| Foreign Born, Citizen | 61 (100.0%) | 0 (0.0%) |
| Foreign Born, not a Citizen | 0 (0.0%) | 0 (0.0%) |
Health Insurance Coverage by Household Income in Butlertown
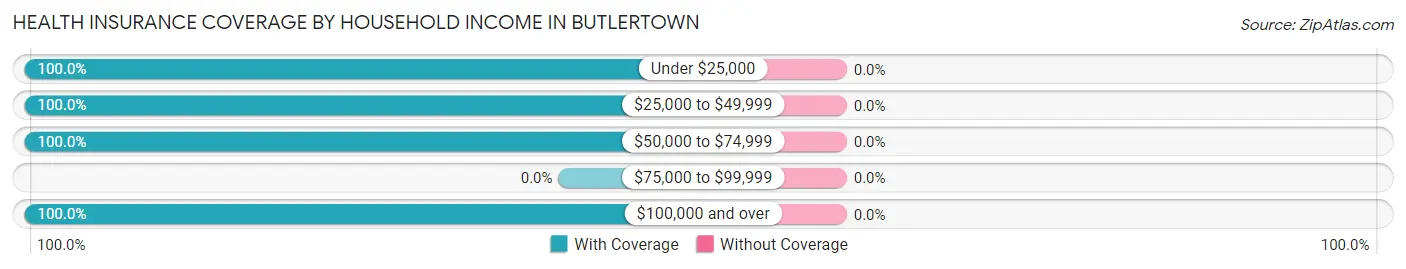
| Household Income | With Coverage | Without Coverage |
| Under $25,000 | 81 (100.0%) | 0 (0.0%) |
| $25,000 to $49,999 | 105 (100.0%) | 0 (0.0%) |
| $50,000 to $74,999 | 113 (100.0%) | 0 (0.0%) |
| $75,000 to $99,999 | 0 (0.0%) | 0 (0.0%) |
| $100,000 and over | 147 (100.0%) | 0 (0.0%) |
Public vs Private Health Insurance Coverage by Age in Butlertown
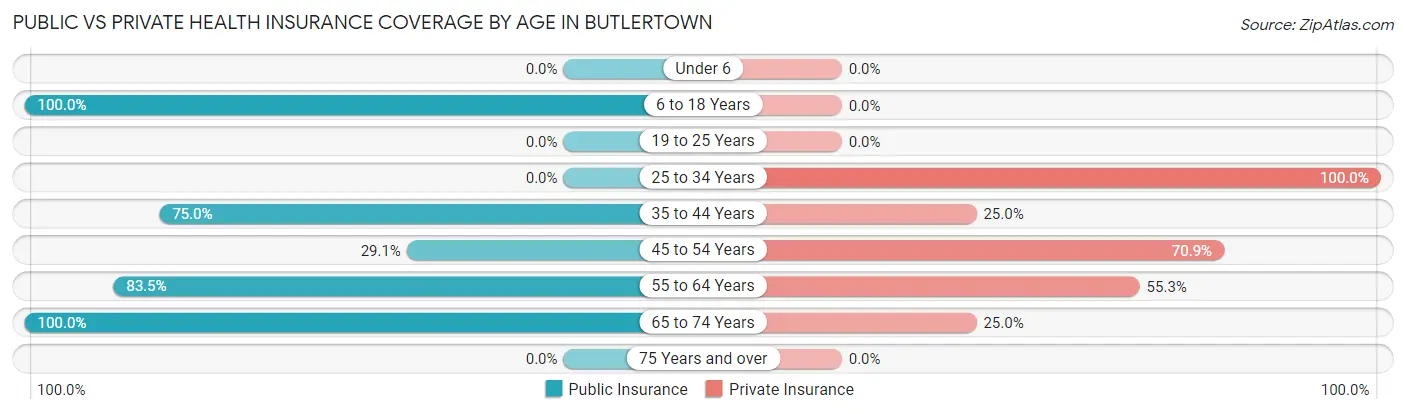
| Age Bracket | Public Insurance | Private Insurance |
| Under 6 | 0 (0.0%) | 0 (0.0%) |
| 6 to 18 Years | 61 (100.0%) | 0 (0.0%) |
| 19 to 25 Years | 0 (0.0%) | 0 (0.0%) |
| 25 to 34 Years | 0 (0.0%) | 59 (100.0%) |
| 35 to 44 Years | 45 (75.0%) | 15 (25.0%) |
| 45 to 54 Years | 41 (29.1%) | 100 (70.9%) |
| 55 to 64 Years | 71 (83.5%) | 47 (55.3%) |
| 65 to 74 Years | 40 (100.0%) | 10 (25.0%) |
| 75 Years and over | 0 (0.0%) | 0 (0.0%) |
| Total | 258 (57.9%) | 231 (51.8%) |
Disability Status by Sex by Age in Butlertown
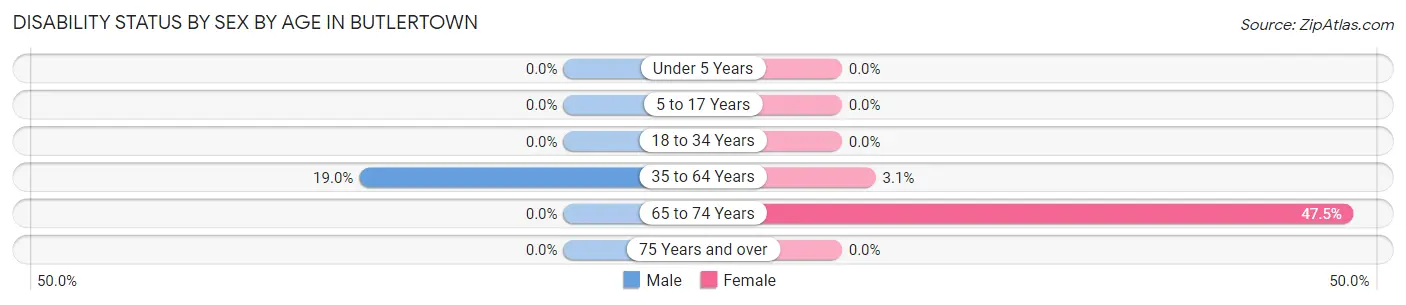
| Age Bracket | Male | Female |
| Under 5 Years | 0 (0.0%) | 0 (0.0%) |
| 5 to 17 Years | 0 (0.0%) | 0 (0.0%) |
| 18 to 34 Years | 0 (0.0%) | 0 (0.0%) |
| 35 to 64 Years | 18 (19.0%) | 6 (3.1%) |
| 65 to 74 Years | 0 (0.0%) | 19 (47.5%) |
| 75 Years and over | 0 (0.0%) | 0 (0.0%) |
Disability Class by Sex by Age in Butlertown
Disability Class: Hearing Difficulty
| Age Bracket | Male | Female |
| Under 5 Years | 0 (0.0%) | 0 (0.0%) |
| 5 to 17 Years | 0 (0.0%) | 0 (0.0%) |
| 18 to 34 Years | 0 (0.0%) | 0 (0.0%) |
| 35 to 64 Years | 0 (0.0%) | 0 (0.0%) |
| 65 to 74 Years | 0 (0.0%) | 0 (0.0%) |
| 75 Years and over | 0 (0.0%) | 0 (0.0%) |
Disability Class: Vision Difficulty
| Age Bracket | Male | Female |
| Under 5 Years | 0 (0.0%) | 0 (0.0%) |
| 5 to 17 Years | 0 (0.0%) | 0 (0.0%) |
| 18 to 34 Years | 0 (0.0%) | 0 (0.0%) |
| 35 to 64 Years | 0 (0.0%) | 0 (0.0%) |
| 65 to 74 Years | 0 (0.0%) | 0 (0.0%) |
| 75 Years and over | 0 (0.0%) | 0 (0.0%) |
Disability Class: Cognitive Difficulty
| Age Bracket | Male | Female |
| 5 to 17 Years | 0 (0.0%) | 0 (0.0%) |
| 18 to 34 Years | 0 (0.0%) | 0 (0.0%) |
| 35 to 64 Years | 0 (0.0%) | 0 (0.0%) |
| 65 to 74 Years | 0 (0.0%) | 0 (0.0%) |
| 75 Years and over | 0 (0.0%) | 0 (0.0%) |
Disability Class: Ambulatory Difficulty
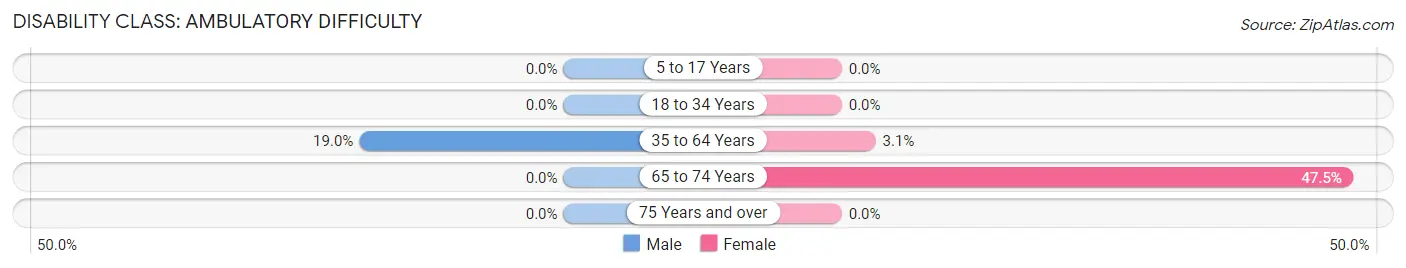
| Age Bracket | Male | Female |
| 5 to 17 Years | 0 (0.0%) | 0 (0.0%) |
| 18 to 34 Years | 0 (0.0%) | 0 (0.0%) |
| 35 to 64 Years | 18 (19.0%) | 6 (3.1%) |
| 65 to 74 Years | 0 (0.0%) | 19 (47.5%) |
| 75 Years and over | 0 (0.0%) | 0 (0.0%) |
Disability Class: Self-Care Difficulty

| Age Bracket | Male | Female |
| 5 to 17 Years | 0 (0.0%) | 0 (0.0%) |
| 18 to 34 Years | 0 (0.0%) | 0 (0.0%) |
| 35 to 64 Years | 0 (0.0%) | 0 (0.0%) |
| 65 to 74 Years | 0 (0.0%) | 0 (0.0%) |
| 75 Years and over | 0 (0.0%) | 0 (0.0%) |
Technology Access in Butlertown
Computing Device Access in Butlertown
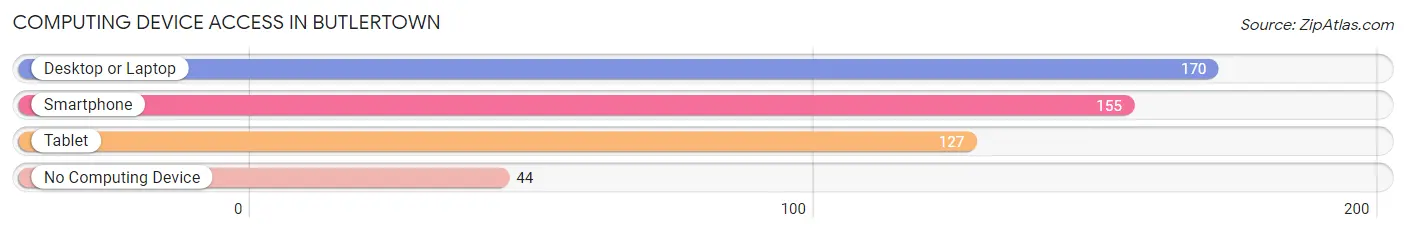
| Device Type | # Households | % Households |
| Desktop or Laptop | 170 | 74.6% |
| Smartphone | 155 | 68.0% |
| Tablet | 127 | 55.7% |
| No Computing Device | 44 | 19.3% |
| Total | 228 | 100.0% |
Internet Access in Butlertown
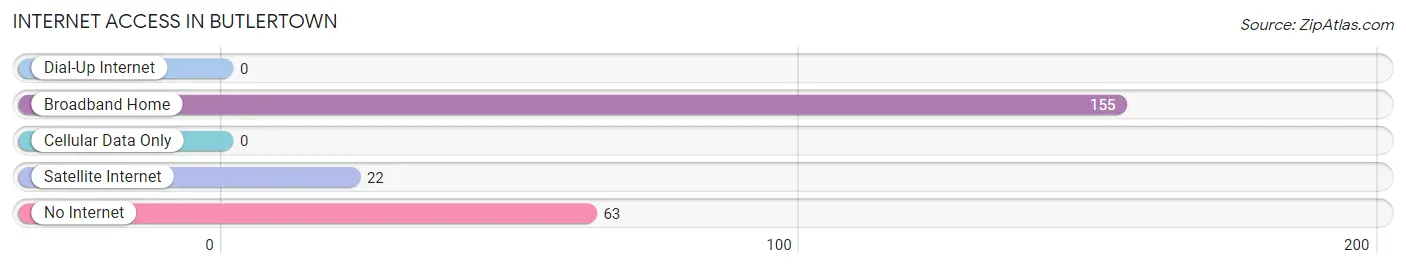
| Internet Type | # Households | % Households |
| Dial-Up Internet | 0 | 0.0% |
| Broadband Home | 155 | 68.0% |
| Cellular Data Only | 0 | 0.0% |
| Satellite Internet | 22 | 9.7% |
| No Internet | 63 | 27.6% |
| Total | 228 | 100.0% |
Butlertown Summary
Butlertown is a small unincorporated community located in St. Mary’s County, Maryland. It is situated on the western shore of the Chesapeake Bay, approximately 25 miles south of Washington, D.C. The community is bordered by the Patuxent River to the north and the Wicomico River to the south.
History
Butlertown was first settled in the early 1700s by the Butler family, who were among the first settlers in the area. The Butlers were farmers and fishermen, and the community was named after them. The community was originally known as Butler’s Town, but the name was eventually shortened to Butlertown.
In the late 1800s, the community began to grow as a result of the oyster industry. The oyster industry was a major source of income for the community, and it was the primary industry until the mid-1900s.
Geography
Butlertown is located in St. Mary’s County, Maryland. It is situated on the western shore of the Chesapeake Bay, approximately 25 miles south of Washington, D.C. The community is bordered by the Patuxent River to the north and the Wicomico River to the south.
The community is located in a rural area, and the landscape is mostly flat. The area is mostly wooded, with some open fields and wetlands. The climate is humid subtropical, with hot, humid summers and mild winters.
Economy
The economy of Butlertown is largely based on agriculture and fishing. The oyster industry is still a major source of income for the community, and there are several oyster farms in the area. The community also has a few small businesses, including a grocery store, a hardware store, and a few restaurants.
Demographics
As of the 2010 census, the population of Butlertown was 1,845. The population is mostly white (94.3%), with a small percentage of African Americans (3.2%) and Hispanics (2.5%). The median household income is $50,000, and the median age is 44.
Conclusion
Butlertown is a small unincorporated community located in St. Mary’s County, Maryland. It is situated on the western shore of the Chesapeake Bay, approximately 25 miles south of Washington, D.C. The community was first settled in the early 1700s by the Butler family, and the economy is largely based on agriculture and fishing. The population is mostly white, with a median household income of $50,000 and a median age of 44.
Common Questions
What is Per Capita Income in Butlertown?
Per Capita income in Butlertown is $36,202.
What is Income or Wage Gap in Butlertown?
Income or Wage Gap in Butlertown is 13.6%.
Women in Butlertown earn 86.4 cents for every dollar earned by a man.
What is Inequality or Gini Index in Butlertown?
Inequality or Gini Index in Butlertown is 0.42.
What is the Total Population of Butlertown?
Total Population of Butlertown is 519.
What is the Total Male Population of Butlertown?
Total Male Population of Butlertown is 246.
What is the Total Female Population of Butlertown?
Total Female Population of Butlertown is 273.
What is the Ratio of Males per 100 Females in Butlertown?
There are 90.11 Males per 100 Females in Butlertown.
What is the Ratio of Females per 100 Males in Butlertown?
There are 110.98 Females per 100 Males in Butlertown.
What is the Median Population Age in Butlertown?
Median Population Age in Butlertown is 46.8 Years.
What is the Average Family Size in Butlertown
Average Family Size in Butlertown is 2.6 People.
What is the Average Household Size in Butlertown
Average Household Size in Butlertown is 2.3 People.
How Large is the Labor Force in Butlertown?
There are 375 People in the Labor Forcein in Butlertown.
What is the Percentage of People in the Labor Force in Butlertown?
80.1% of People are in the Labor Force in Butlertown.