Bier, MD Map & Demographics
Bier Map
Bier Overview
$42,191
PER CAPITA INCOME
$91,375
AVG FAMILY INCOME
$90,875
AVG HOUSEHOLD INCOME
58.6%
WAGE / INCOME GAP [ % ]
41.4¢/ $1
WAGE / INCOME GAP [ $ ]
0.20
INEQUALITY / GINI INDEX
214
TOTAL POPULATION
106
MALE POPULATION
108
FEMALE POPULATION
98.15
MALES / 100 FEMALES
101.89
FEMALES / 100 MALES
29.8
MEDIAN AGE
2.6
AVG FAMILY SIZE
2.3
AVG HOUSEHOLD SIZE
182
LABOR FORCE [ PEOPLE ]
85.0%
PERCENT IN LABOR FORCE
Income in Bier
Income Overview in Bier
Per Capita Income in Bier is $42,191, while median incomes of families and households are $91,375 and $90,875 respectively.
| Characteristic | Number | Measure |
| Per Capita Income | 214 | $42,191 |
| Median Family Income | 76 | $91,375 |
| Mean Family Income | 76 | $97,297 |
| Median Household Income | 92 | $90,875 |
| Mean Household Income | 92 | $93,562 |
| Income Deficit | 76 | $0 |
| Wage / Income Gap (%) | 214 | 58.61% |
| Wage / Income Gap ($) | 214 | 41.39¢ per $1 |
| Gini / Inequality Index | 214 | 0.20 |
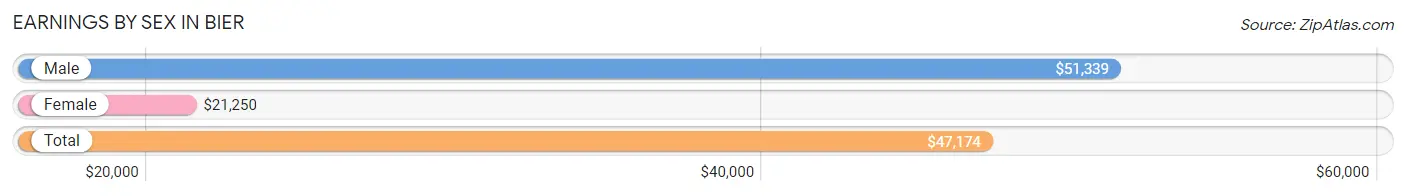
Earnings by Sex in Bier
Average Earnings in Bier are $47,174, $51,339 for men and $21,250 for women, a difference of 58.6%.
| Sex | Number | Average Earnings |
| Male | 106 (58.2%) | $51,339 |
| Female | 76 (41.8%) | $21,250 |
| Total | 182 (100.0%) | $47,174 |
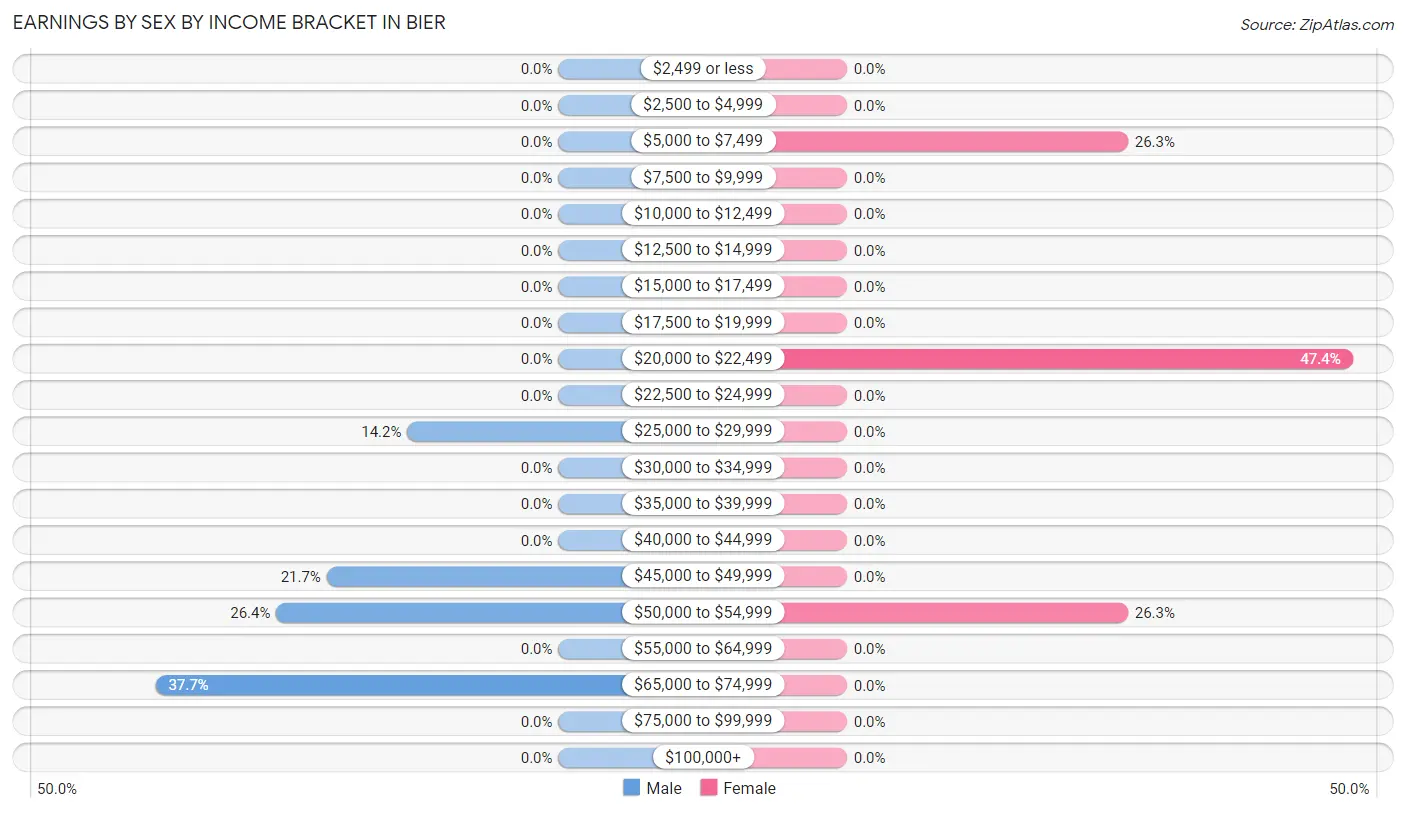
Earnings by Sex by Income Bracket in Bier
The most common earnings brackets in Bier are $65,000 to $74,999 for men (40 | 37.7%) and $20,000 to $22,499 for women (36 | 47.4%).
| Income | Male | Female |
| $2,499 or less | 0 (0.0%) | 0 (0.0%) |
| $2,500 to $4,999 | 0 (0.0%) | 0 (0.0%) |
| $5,000 to $7,499 | 0 (0.0%) | 20 (26.3%) |
| $7,500 to $9,999 | 0 (0.0%) | 0 (0.0%) |
| $10,000 to $12,499 | 0 (0.0%) | 0 (0.0%) |
| $12,500 to $14,999 | 0 (0.0%) | 0 (0.0%) |
| $15,000 to $17,499 | 0 (0.0%) | 0 (0.0%) |
| $17,500 to $19,999 | 0 (0.0%) | 0 (0.0%) |
| $20,000 to $22,499 | 0 (0.0%) | 36 (47.4%) |
| $22,500 to $24,999 | 0 (0.0%) | 0 (0.0%) |
| $25,000 to $29,999 | 15 (14.1%) | 0 (0.0%) |
| $30,000 to $34,999 | 0 (0.0%) | 0 (0.0%) |
| $35,000 to $39,999 | 0 (0.0%) | 0 (0.0%) |
| $40,000 to $44,999 | 0 (0.0%) | 0 (0.0%) |
| $45,000 to $49,999 | 23 (21.7%) | 0 (0.0%) |
| $50,000 to $54,999 | 28 (26.4%) | 20 (26.3%) |
| $55,000 to $64,999 | 0 (0.0%) | 0 (0.0%) |
| $65,000 to $74,999 | 40 (37.7%) | 0 (0.0%) |
| $75,000 to $99,999 | 0 (0.0%) | 0 (0.0%) |
| $100,000+ | 0 (0.0%) | 0 (0.0%) |
| Total | 106 (100.0%) | 76 (100.0%) |
Earnings by Sex by Educational Attainment in Bier
| Educational Attainment | Male Income | Female Income |
| Less than High School | - | - |
| High School Diploma | - | - |
| College or Associate's Degree | - | - |
| Bachelor's Degree | - | - |
| Graduate Degree | - | - |
| Total | $67,563 | $0 |
Family Income in Bier
Family Income Brackets in Bier
According to the Bier family income data, there are 40 families falling into the $75,000 to $99,999 income range, which is the most common income bracket and makes up 52.6% of all families.
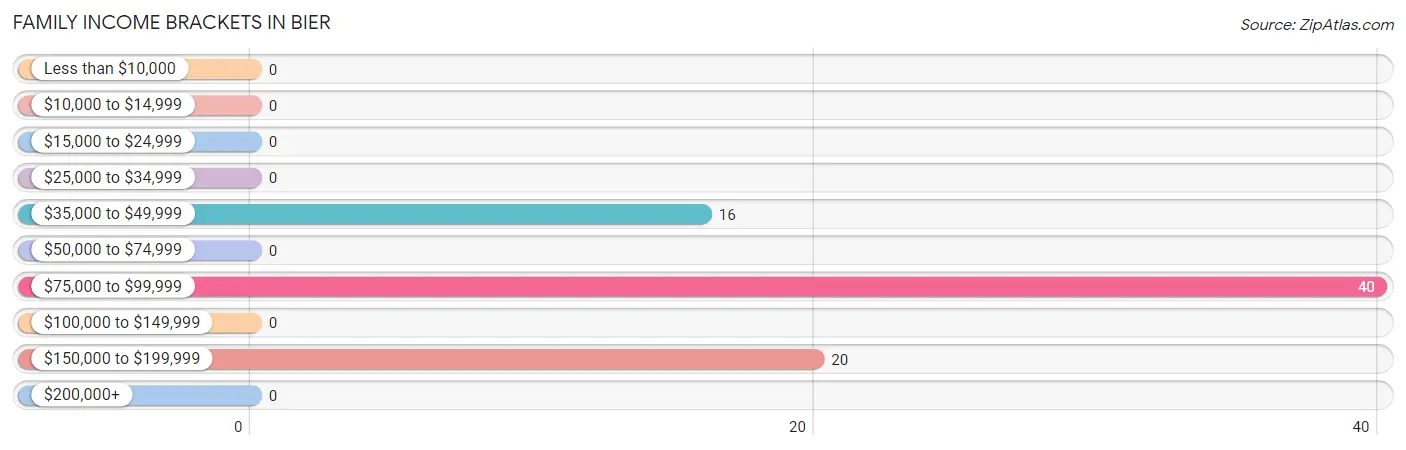
| Income Bracket | # Families | % Families |
| Less than $10,000 | 0 | 0.0% |
| $10,000 to $14,999 | 0 | 0.0% |
| $15,000 to $24,999 | 0 | 0.0% |
| $25,000 to $34,999 | 0 | 0.0% |
| $35,000 to $49,999 | 16 | 21.1% |
| $50,000 to $74,999 | 0 | 0.0% |
| $75,000 to $99,999 | 40 | 52.6% |
| $100,000 to $149,999 | 0 | 0.0% |
| $150,000 to $199,999 | 20 | 26.3% |
| $200,000+ | 0 | 0.0% |
Family Income by Famaliy Size in Bier
| Income Bracket | # Families | Median Income |
| 2-Person Families | 56 (73.7%) | $0 |
| 3-Person Families | 0 (0.0%) | $0 |
| 4-Person Families | 20 (26.3%) | $0 |
| 5-Person Families | 0 (0.0%) | $0 |
| 6-Person Families | 0 (0.0%) | $0 |
| 7+ Person Families | 0 (0.0%) | $0 |
| Total | 76 (100.0%) | $91,375 |
Family Income by Number of Earners in Bier
| Number of Earners | # Families | Median Income |
| No Earners | 0 (0.0%) | $0 |
| 1 Earner | 16 (21.0%) | $0 |
| 2 Earners | 40 (52.6%) | $0 |
| 3+ Earners | 20 (26.3%) | $0 |
| Total | 76 (100.0%) | $91,375 |
Household Income in Bier
Household Income Brackets in Bier
With 56 households falling in the category, the $75,000 to $99,999 income range is the most frequent in Bier, accounting for 60.9% of all households.
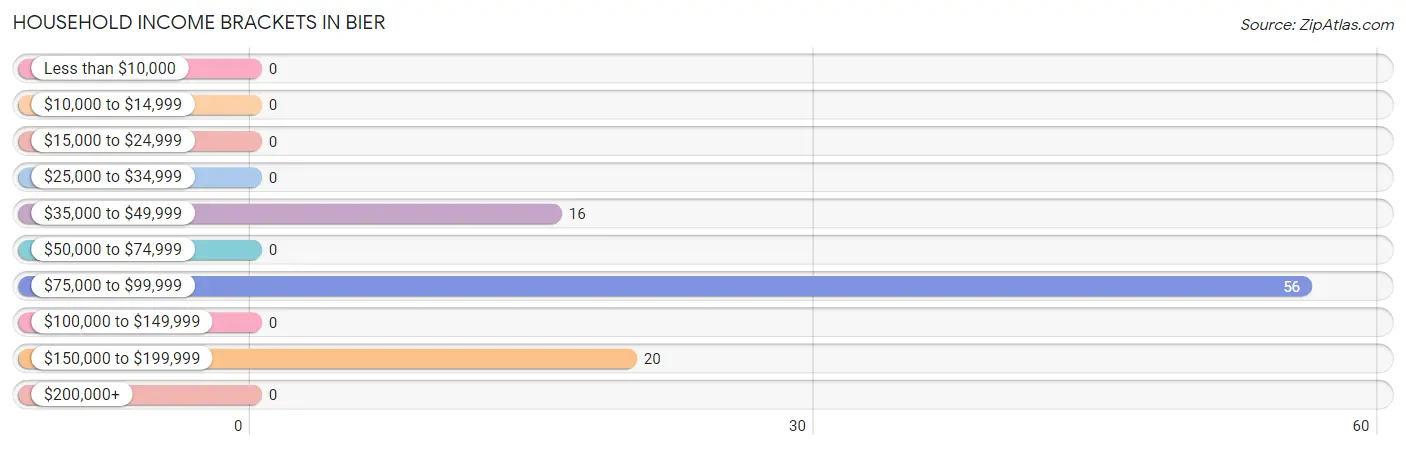
| Income Bracket | # Households | % Households |
| Less than $10,000 | 0 | 0.0% |
| $10,000 to $14,999 | 0 | 0.0% |
| $15,000 to $24,999 | 0 | 0.0% |
| $25,000 to $34,999 | 0 | 0.0% |
| $35,000 to $49,999 | 16 | 17.4% |
| $50,000 to $74,999 | 0 | 0.0% |
| $75,000 to $99,999 | 56 | 60.9% |
| $100,000 to $149,999 | 0 | 0.0% |
| $150,000 to $199,999 | 20 | 21.7% |
| $200,000+ | 0 | 0.0% |
Household Income by Householder Age in Bier
| Income Bracket | # Households | Median Income |
| 15 to 24 Years | 0 (0.0%) | $0 |
| 25 to 44 Years | 40 (43.5%) | $0 |
| 45 to 64 Years | 20 (21.7%) | $0 |
| 65+ Years | 32 (34.8%) | $0 |
| Total | 92 (100.0%) | $90,875 |
Poverty in Bier
Income Below Poverty by Sex and Age in Bier
| Age Bracket | Male | Female |
| Under 5 Years | 0 (0.0%) | 0 (0.0%) |
| 5 Years | 0 (0.0%) | 0 (0.0%) |
| 6 to 11 Years | 0 (0.0%) | 0 (0.0%) |
| 12 to 14 Years | 0 (0.0%) | 0 (0.0%) |
| 15 Years | 0 (0.0%) | 0 (0.0%) |
| 16 and 17 Years | 0 (0.0%) | 0 (0.0%) |
| 18 to 24 Years | 0 (0.0%) | 0 (0.0%) |
| 25 to 34 Years | 0 (0.0%) | 0 (0.0%) |
| 35 to 44 Years | 0 (0.0%) | 0 (0.0%) |
| 45 to 54 Years | 0 (0.0%) | 0 (0.0%) |
| 55 to 64 Years | 0 (0.0%) | 0 (0.0%) |
| 65 to 74 Years | 0 (0.0%) | 0 (0.0%) |
| 75 Years and over | 0 (0.0%) | 0 (0.0%) |
| Total | 0 (0.0%) | 0 (0.0%) |
Income Above Poverty by Sex and Age in Bier
According to the poverty statistics in Bier, males aged 18 to 24 years and females aged 18 to 24 years are the age groups that are most secure financially, with 100.0% of males and 100.0% of females in these age groups living above the poverty line.
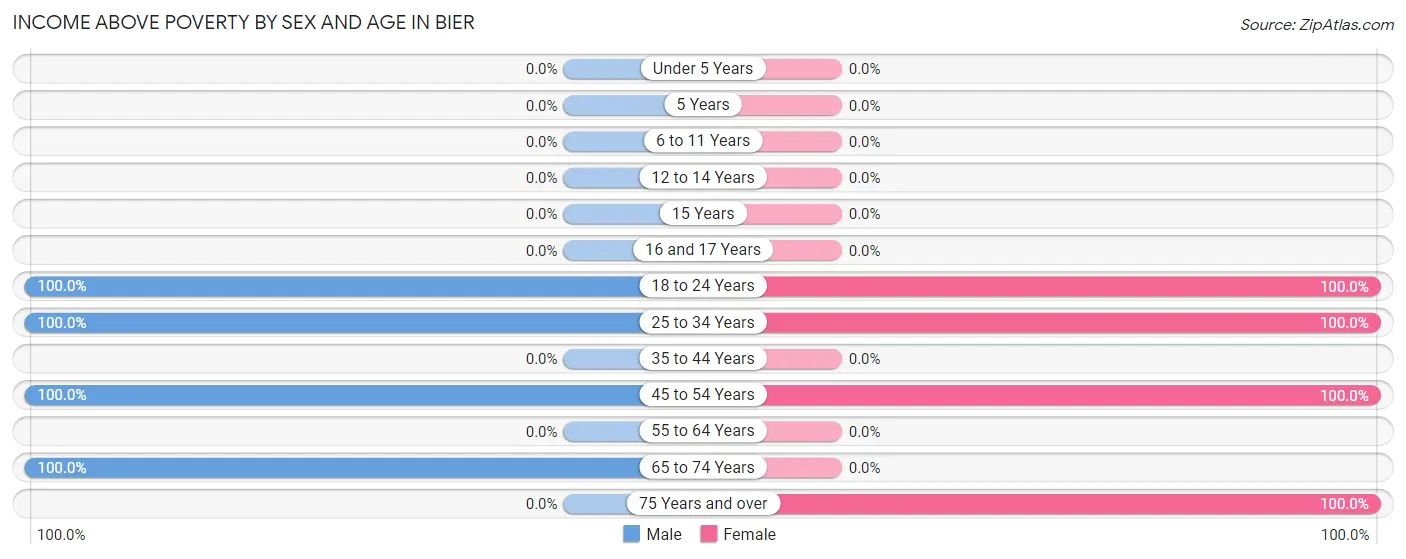
| Age Bracket | Male | Female |
| Under 5 Years | 0 (0.0%) | 0 (0.0%) |
| 5 Years | 0 (0.0%) | 0 (0.0%) |
| 6 to 11 Years | 0 (0.0%) | 0 (0.0%) |
| 12 to 14 Years | 0 (0.0%) | 0 (0.0%) |
| 15 Years | 0 (0.0%) | 0 (0.0%) |
| 16 and 17 Years | 0 (0.0%) | 0 (0.0%) |
| 18 to 24 Years | 28 (100.0%) | 20 (100.0%) |
| 25 to 34 Years | 40 (100.0%) | 36 (100.0%) |
| 35 to 44 Years | 0 (0.0%) | 0 (0.0%) |
| 45 to 54 Years | 23 (100.0%) | 20 (100.0%) |
| 55 to 64 Years | 0 (0.0%) | 0 (0.0%) |
| 65 to 74 Years | 15 (100.0%) | 0 (0.0%) |
| 75 Years and over | 0 (0.0%) | 32 (100.0%) |
| Total | 106 (100.0%) | 108 (100.0%) |
Income Below Poverty Among Married-Couple Families in Bier
| Children | Above Poverty | Below Poverty |
| No Children | 60 (100.0%) | 0 (0.0%) |
| 1 or 2 Children | 0 (0.0%) | 0 (0.0%) |
| 3 or 4 Children | 0 (0.0%) | 0 (0.0%) |
| 5 or more Children | 0 (0.0%) | 0 (0.0%) |
| Total | 60 (100.0%) | 0 (0.0%) |
Income Below Poverty Among Single-Parent Households in Bier
| Children | Single Father | Single Mother |
| No Children | 0 (0.0%) | 0 (0.0%) |
| 1 or 2 Children | 0 (0.0%) | 0 (0.0%) |
| 3 or 4 Children | 0 (0.0%) | 0 (0.0%) |
| 5 or more Children | 0 (0.0%) | 0 (0.0%) |
| Total | 0 (0.0%) | 0 (0.0%) |
Income Below Poverty Among Married-Couple vs Single-Parent Households in Bier
| Children | Married-Couple Families | Single-Parent Households |
| No Children | 0 (0.0%) | 0 (0.0%) |
| 1 or 2 Children | 0 (0.0%) | 0 (0.0%) |
| 3 or 4 Children | 0 (0.0%) | 0 (0.0%) |
| 5 or more Children | 0 (0.0%) | 0 (0.0%) |
| Total | 0 (0.0%) | 0 (0.0%) |
Race in Bier
The most populous races in Bier are , and White / Caucasian (214 | 100.0%).
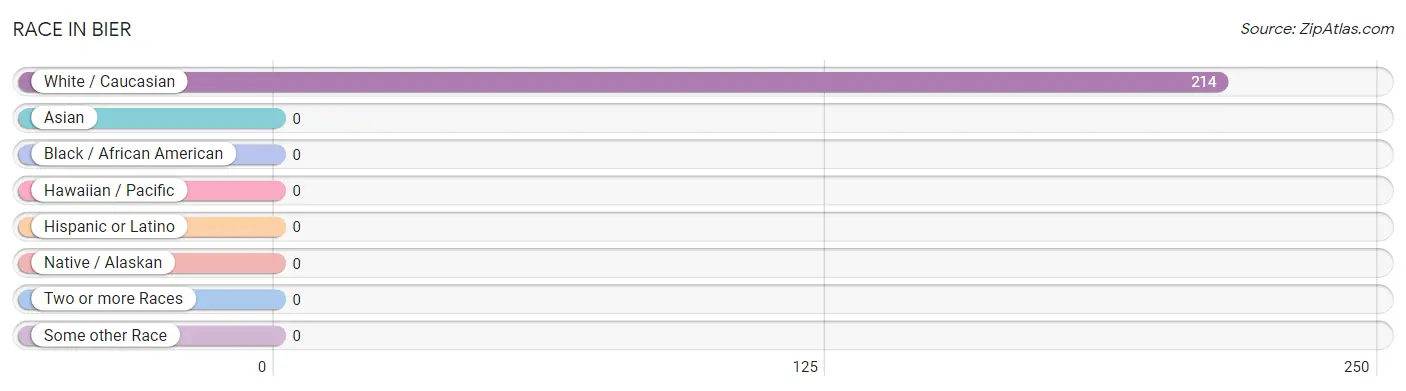
| Race | # Population | % Population |
| Asian | 0 | 0.0% |
| Black / African American | 0 | 0.0% |
| Hawaiian / Pacific | 0 | 0.0% |
| Hispanic or Latino | 0 | 0.0% |
| Native / Alaskan | 0 | 0.0% |
| White / Caucasian | 214 | 100.0% |
| Two or more Races | 0 | 0.0% |
| Some other Race | 0 | 0.0% |
| Total | 214 | 100.0% |
Ancestry in Bier
The most populous ancestries reported in Bier are European (91 | 42.5%), Irish (36 | 16.8%), English (31 | 14.5%), German (23 | 10.7%), and Romanian (16 | 7.5%), together accounting for 92.1% of all Bier residents.
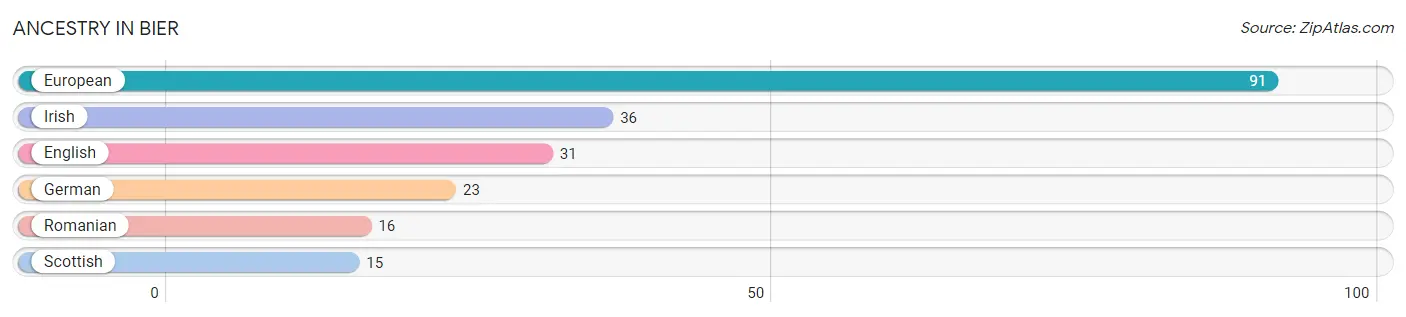
| Ancestry | # Population | % Population |
| English | 31 | 14.5% |
| European | 91 | 42.5% |
| German | 23 | 10.7% |
| Irish | 36 | 16.8% |
| Romanian | 16 | 7.5% |
| Scottish | 15 | 7.0% | View All 6 Rows |
Immigrants in Bier

| Immigration Origin | # Population | % Population | View All 0 Rows |
Sex and Age in Bier
Sex and Age in Bier
The most populous age groups in Bier are 25 to 29 Years (40 | 37.7%) for men and 25 to 29 Years (36 | 33.3%) for women.
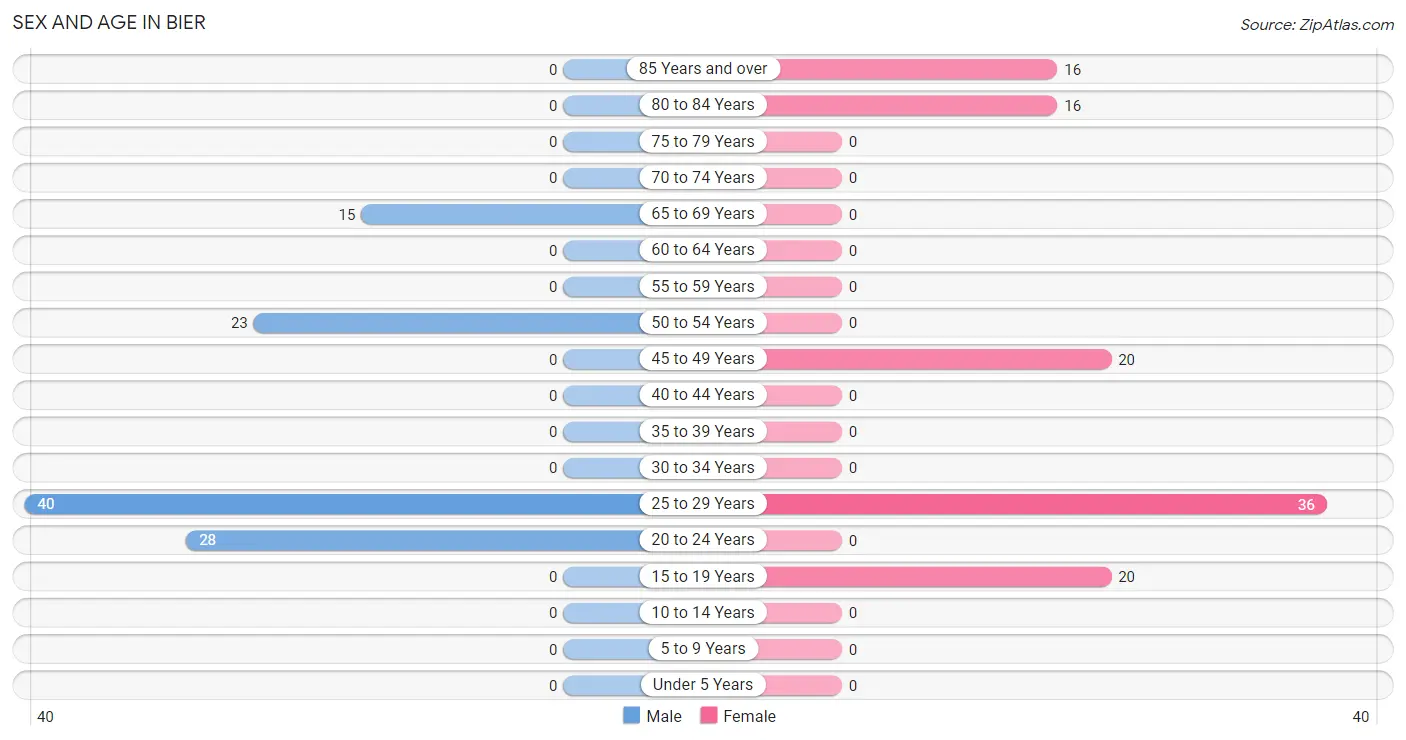
| Age Bracket | Male | Female |
| Under 5 Years | 0 (0.0%) | 0 (0.0%) |
| 5 to 9 Years | 0 (0.0%) | 0 (0.0%) |
| 10 to 14 Years | 0 (0.0%) | 0 (0.0%) |
| 15 to 19 Years | 0 (0.0%) | 20 (18.5%) |
| 20 to 24 Years | 28 (26.4%) | 0 (0.0%) |
| 25 to 29 Years | 40 (37.7%) | 36 (33.3%) |
| 30 to 34 Years | 0 (0.0%) | 0 (0.0%) |
| 35 to 39 Years | 0 (0.0%) | 0 (0.0%) |
| 40 to 44 Years | 0 (0.0%) | 0 (0.0%) |
| 45 to 49 Years | 0 (0.0%) | 20 (18.5%) |
| 50 to 54 Years | 23 (21.7%) | 0 (0.0%) |
| 55 to 59 Years | 0 (0.0%) | 0 (0.0%) |
| 60 to 64 Years | 0 (0.0%) | 0 (0.0%) |
| 65 to 69 Years | 15 (14.1%) | 0 (0.0%) |
| 70 to 74 Years | 0 (0.0%) | 0 (0.0%) |
| 75 to 79 Years | 0 (0.0%) | 0 (0.0%) |
| 80 to 84 Years | 0 (0.0%) | 16 (14.8%) |
| 85 Years and over | 0 (0.0%) | 16 (14.8%) |
| Total | 106 (100.0%) | 108 (100.0%) |
Families and Households in Bier
Median Family Size in Bier
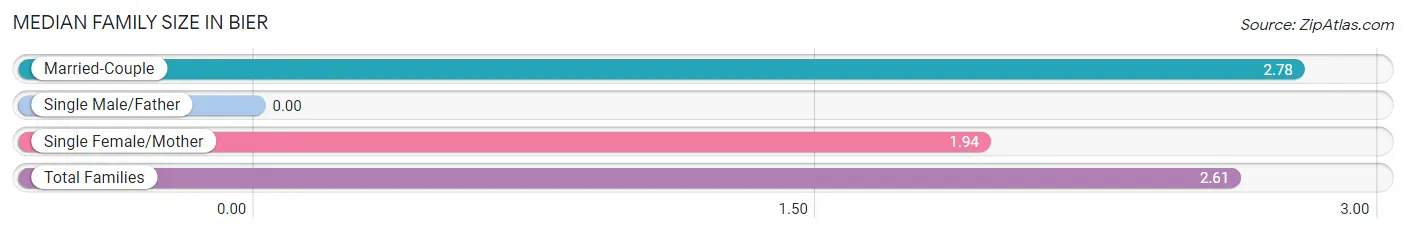
| Family Type | # Families | Family Size |
| Married-Couple | 60 (78.9%) | 2.78 |
| Single Male/Father | 0 (0.0%) | - |
| Single Female/Mother | 16 (21.0%) | 1.94 |
| Total Families | 76 (100.0%) | 2.61 |
Median Household Size in Bier
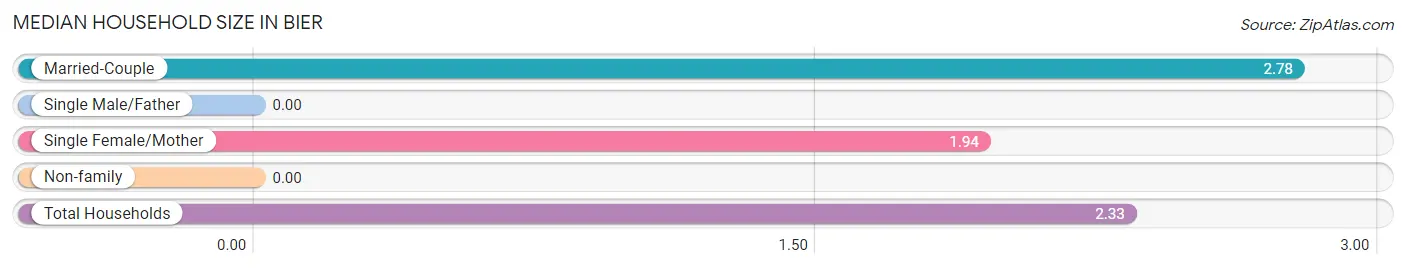
| Household Type | # Households | Household Size |
| Married-Couple | 60 (65.2%) | 2.78 |
| Single Male/Father | 0 (0.0%) | - |
| Single Female/Mother | 16 (17.4%) | 1.94 |
| Non-family | 16 (17.4%) | - |
| Total Households | 92 (100.0%) | 2.33 |
Household Size by Marriage Status in Bier
Out of a total of 92 households in Bier, 76 (82.6%) are family households, while 16 (17.4%) are nonfamily households. The most numerous type of family households are 2-person households, comprising 56, and the most common type of nonfamily households are 1-person households, comprising 16.
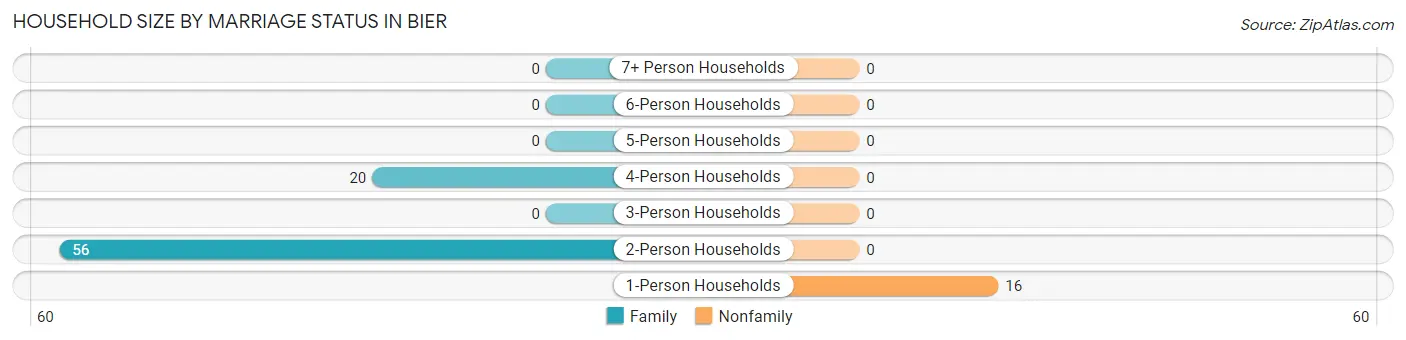
| Household Size | Family Households | Nonfamily Households |
| 1-Person Households | - | 16 (17.4%) |
| 2-Person Households | 56 (60.9%) | 0 (0.0%) |
| 3-Person Households | 0 (0.0%) | 0 (0.0%) |
| 4-Person Households | 20 (21.7%) | 0 (0.0%) |
| 5-Person Households | 0 (0.0%) | 0 (0.0%) |
| 6-Person Households | 0 (0.0%) | 0 (0.0%) |
| 7+ Person Households | 0 (0.0%) | 0 (0.0%) |
| Total | 76 (82.6%) | 16 (17.4%) |
Female Fertility in Bier
Fertility by Age in Bier
| Age Bracket | Women with Births | Births / 1,000 Women |
| 15 to 19 years | 0 (0.0%) | 0.0 |
| 20 to 34 years | 0 (0.0%) | 0.0 |
| 35 to 50 years | 0 (0.0%) | 0.0 |
| Total | 0 (0.0%) | 0.0 |
Fertility by Age by Marriage Status in Bier
| Age Bracket | Married | Unmarried |
| 15 to 19 years | 0 (0.0%) | 0 (0.0%) |
| 20 to 34 years | 0 (0.0%) | 0 (0.0%) |
| 35 to 50 years | 0 (0.0%) | 0 (0.0%) |
| Total | 0 (0.0%) | 0 (0.0%) |
Fertility by Education in Bier
| Educational Attainment | Women with Births | Births / 1,000 Women |
| Less than High School | 0 (0.0%) | 0.0 |
| High School Diploma | 0 (0.0%) | 0.0 |
| College or Associate's Degree | 0 (0.0%) | 0.0 |
| Bachelor's Degree | 0 (0.0%) | 0.0 |
| Graduate Degree | 0 (0.0%) | 0.0 |
| Total | 0 (0.0%) | 0.0 |
Fertility by Education by Marriage Status in Bier
| Educational Attainment | Married | Unmarried |
| Less than High School | 0 (0.0%) | 0 (0.0%) |
| High School Diploma | 0 (0.0%) | 0 (0.0%) |
| College or Associate's Degree | 0 (0.0%) | 0 (0.0%) |
| Bachelor's Degree | 0 (0.0%) | 0 (0.0%) |
| Graduate Degree | 0 (0.0%) | 0 (0.0%) |
| Total | 0 (0.0%) | 0 (0.0%) |
Employment Characteristics in Bier
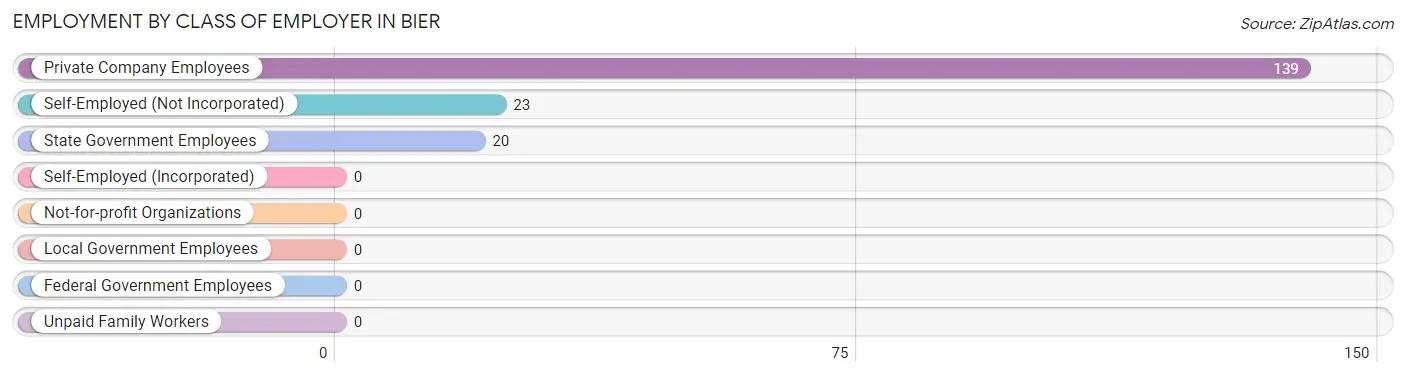
Employment by Class of Employer in Bier
Among the 182 employed individuals in Bier, private company employees (139 | 76.4%), self-employed (not incorporated) (23 | 12.6%), and state government employees (20 | 11.0%) make up the most common classes of employment.
| Employer Class | # Employees | % Employees |
| Private Company Employees | 139 | 76.4% |
| Self-Employed (Incorporated) | 0 | 0.0% |
| Self-Employed (Not Incorporated) | 23 | 12.6% |
| Not-for-profit Organizations | 0 | 0.0% |
| Local Government Employees | 0 | 0.0% |
| State Government Employees | 20 | 11.0% |
| Federal Government Employees | 0 | 0.0% |
| Unpaid Family Workers | 0 | 0.0% |
| Total | 182 | 100.0% |
Employment Status by Age in Bier
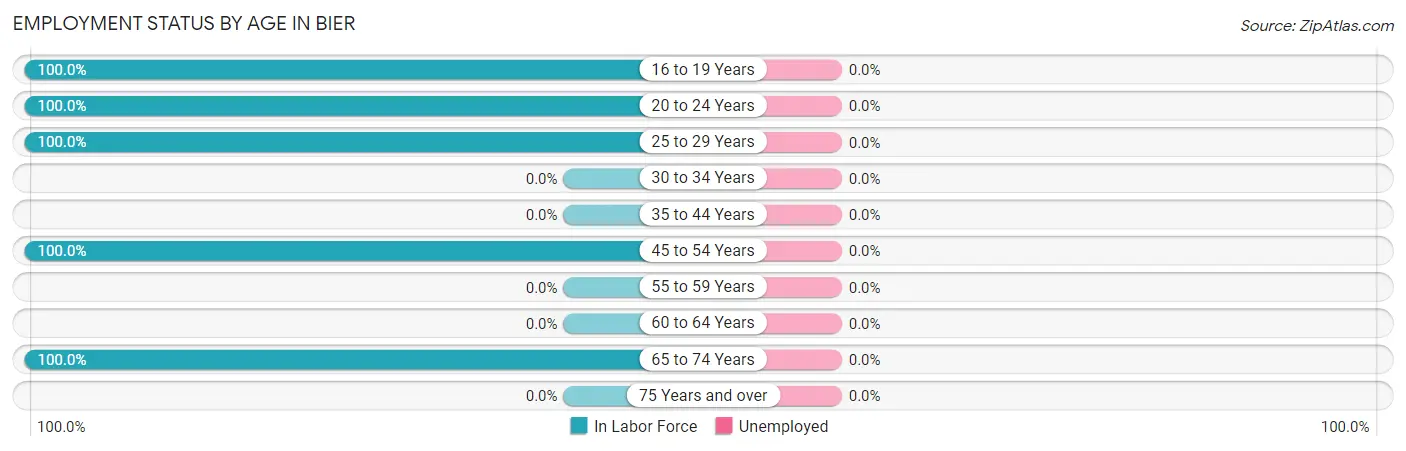
| Age Bracket | In Labor Force | Unemployed |
| 16 to 19 Years | 20 (100.0%) | 0 (0.0%) |
| 20 to 24 Years | 28 (100.0%) | 0 (0.0%) |
| 25 to 29 Years | 76 (100.0%) | 0 (0.0%) |
| 30 to 34 Years | 0 (0.0%) | 0 (0.0%) |
| 35 to 44 Years | 0 (0.0%) | 0 (0.0%) |
| 45 to 54 Years | 43 (100.0%) | 0 (0.0%) |
| 55 to 59 Years | 0 (0.0%) | 0 (0.0%) |
| 60 to 64 Years | 0 (0.0%) | 0 (0.0%) |
| 65 to 74 Years | 15 (100.0%) | 0 (0.0%) |
| 75 Years and over | 0 (0.0%) | 0 (0.0%) |
| Total | 182 (85.0%) | 0 (0.0%) |
Employment Status by Educational Attainment in Bier
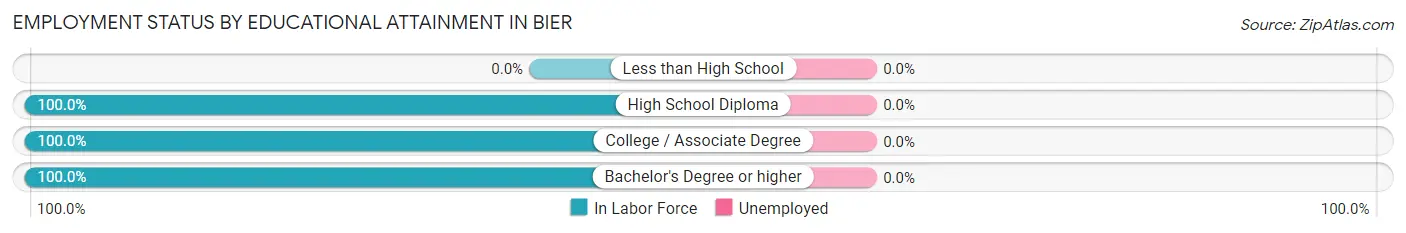
| Educational Attainment | In Labor Force | Unemployed |
| Less than High School | 0 (0.0%) | 0 (0.0%) |
| High School Diploma | 40 (100.0%) | 0 (0.0%) |
| College / Associate Degree | 59 (100.0%) | 0 (0.0%) |
| Bachelor's Degree or higher | 20 (100.0%) | 0 (0.0%) |
| Total | 119 (100.0%) | 0 (0.0%) |
Employment Occupations by Sex in Bier
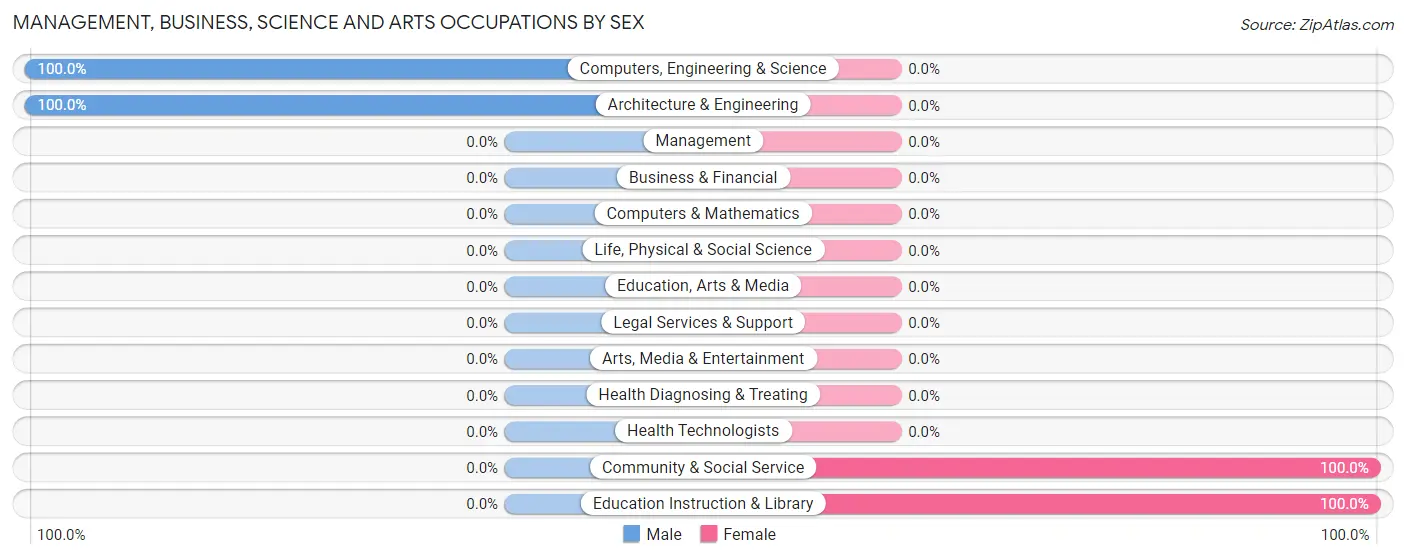
Management, Business, Science and Arts Occupations
The most common Management, Business, Science and Arts occupations in Bier are Computers, Engineering & Science (40 | 22.0%), Architecture & Engineering (40 | 22.0%), Community & Social Service (20 | 11.0%), and Education Instruction & Library (20 | 11.0%).
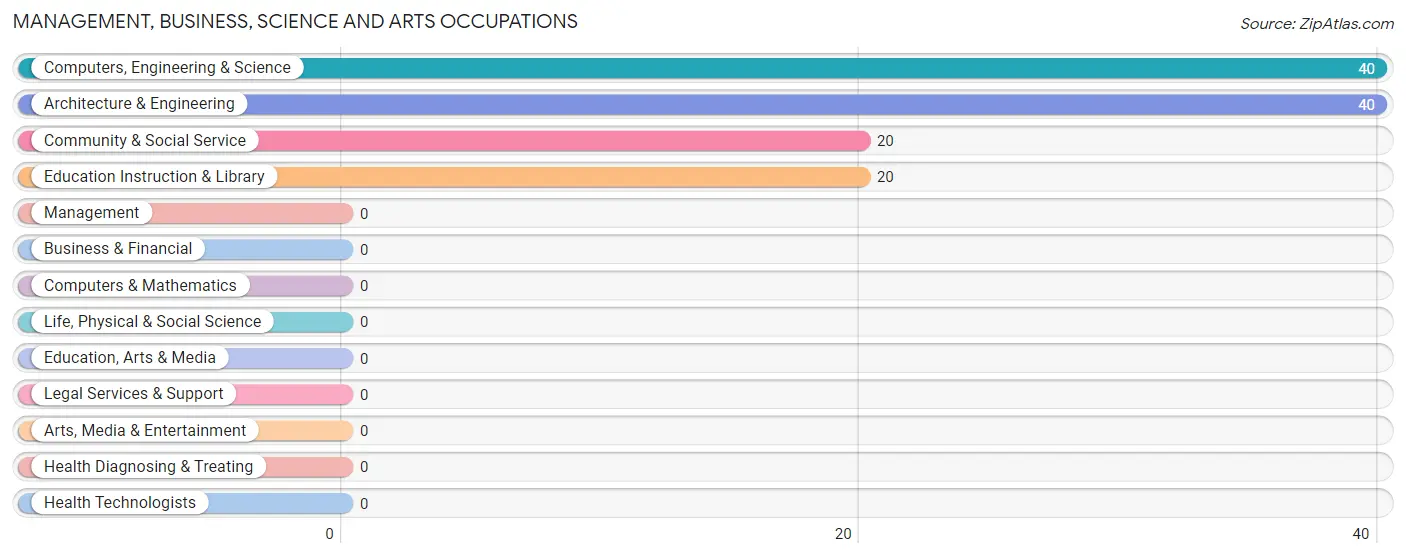
Management, Business, Science and Arts Occupations by Sex
Within the Management, Business, Science and Arts occupations in Bier, the most male-oriented occupations are Computers, Engineering & Science (100.0%), and Architecture & Engineering (100.0%), while the most female-oriented occupations are Community & Social Service (100.0%), and Education Instruction & Library (100.0%).
| Occupation | Male | Female |
| Management | 0 (0.0%) | 0 (0.0%) |
| Business & Financial | 0 (0.0%) | 0 (0.0%) |
| Computers, Engineering & Science | 40 (100.0%) | 0 (0.0%) |
| Computers & Mathematics | 0 (0.0%) | 0 (0.0%) |
| Architecture & Engineering | 40 (100.0%) | 0 (0.0%) |
| Life, Physical & Social Science | 0 (0.0%) | 0 (0.0%) |
| Community & Social Service | 0 (0.0%) | 20 (100.0%) |
| Education, Arts & Media | 0 (0.0%) | 0 (0.0%) |
| Legal Services & Support | 0 (0.0%) | 0 (0.0%) |
| Education Instruction & Library | 0 (0.0%) | 20 (100.0%) |
| Arts, Media & Entertainment | 0 (0.0%) | 0 (0.0%) |
| Health Diagnosing & Treating | 0 (0.0%) | 0 (0.0%) |
| Health Technologists | 0 (0.0%) | 0 (0.0%) |
| Total (Category) | 40 (66.7%) | 20 (33.3%) |
| Total (Overall) | 106 (58.2%) | 76 (41.8%) |
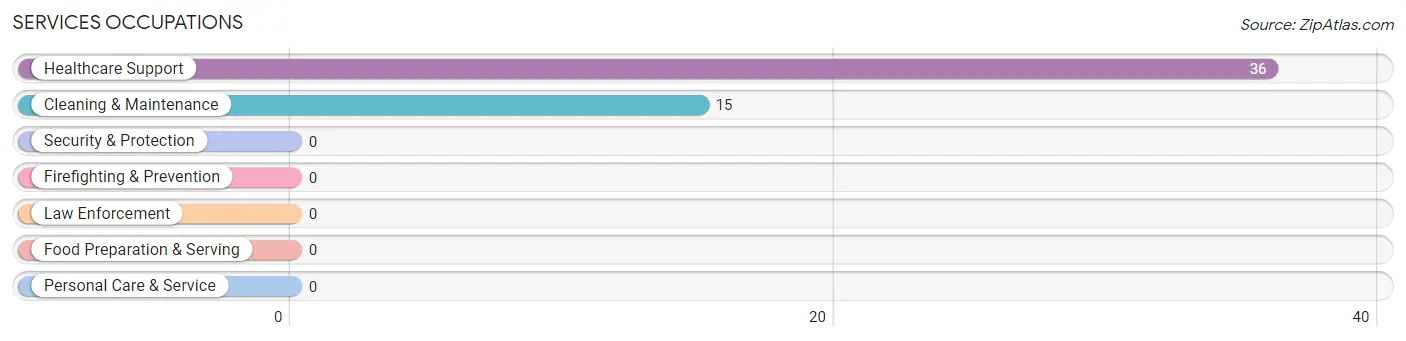
Services Occupations
The most common Services occupations in Bier are Healthcare Support (36 | 19.8%), and Cleaning & Maintenance (15 | 8.2%).
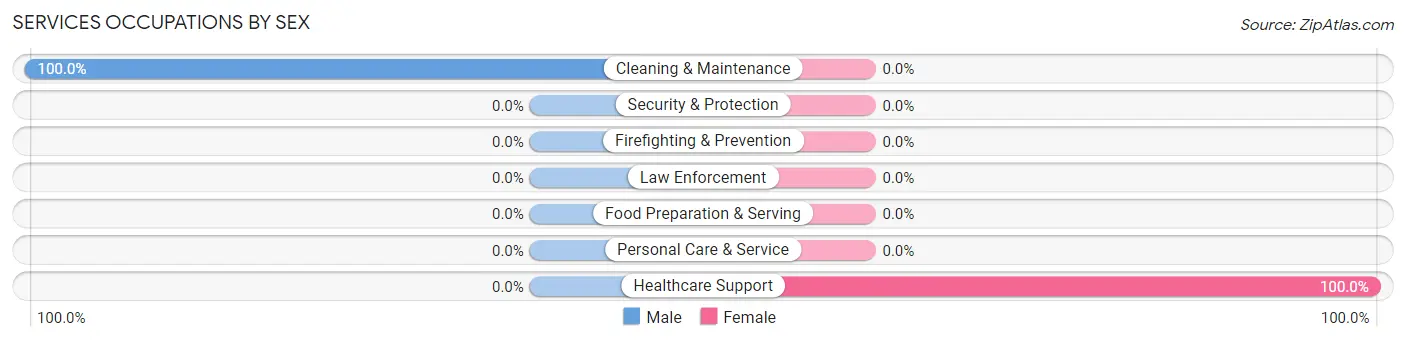
Services Occupations by Sex
| Occupation | Male | Female |
| Healthcare Support | 0 (0.0%) | 36 (100.0%) |
| Security & Protection | 0 (0.0%) | 0 (0.0%) |
| Firefighting & Prevention | 0 (0.0%) | 0 (0.0%) |
| Law Enforcement | 0 (0.0%) | 0 (0.0%) |
| Food Preparation & Serving | 0 (0.0%) | 0 (0.0%) |
| Cleaning & Maintenance | 15 (100.0%) | 0 (0.0%) |
| Personal Care & Service | 0 (0.0%) | 0 (0.0%) |
| Total (Category) | 15 (29.4%) | 36 (70.6%) |
| Total (Overall) | 106 (58.2%) | 76 (41.8%) |
Sales and Office Occupations
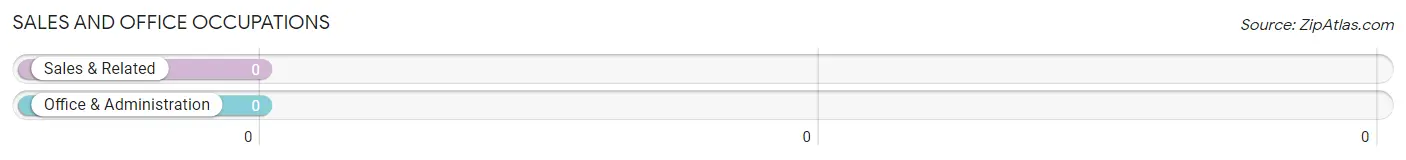
Sales and Office Occupations by Sex
| Occupation | Male | Female |
| Sales & Related | 0 (0.0%) | 0 (0.0%) |
| Office & Administration | 0 (0.0%) | 0 (0.0%) |
| Total (Category) | 0 (0.0%) | 0 (0.0%) |
| Total (Overall) | 106 (58.2%) | 76 (41.8%) |
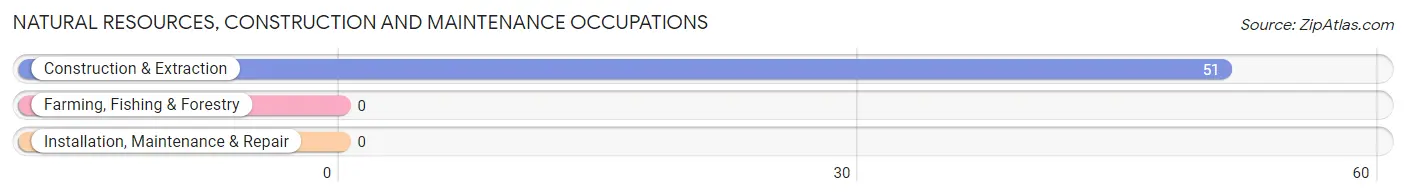
Natural Resources, Construction and Maintenance Occupations
The most common Natural Resources, Construction and Maintenance occupations in Bier are , and Construction & Extraction (51 | 28.0%).
Natural Resources, Construction and Maintenance Occupations by Sex
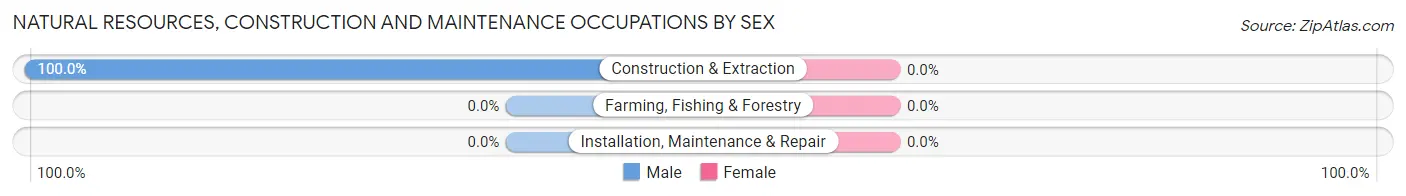
| Occupation | Male | Female |
| Farming, Fishing & Forestry | 0 (0.0%) | 0 (0.0%) |
| Construction & Extraction | 51 (100.0%) | 0 (0.0%) |
| Installation, Maintenance & Repair | 0 (0.0%) | 0 (0.0%) |
| Total (Category) | 51 (100.0%) | 0 (0.0%) |
| Total (Overall) | 106 (58.2%) | 76 (41.8%) |
Production, Transportation and Moving Occupations
The most common Production, Transportation and Moving occupations in Bier are , and Production (20 | 11.0%).
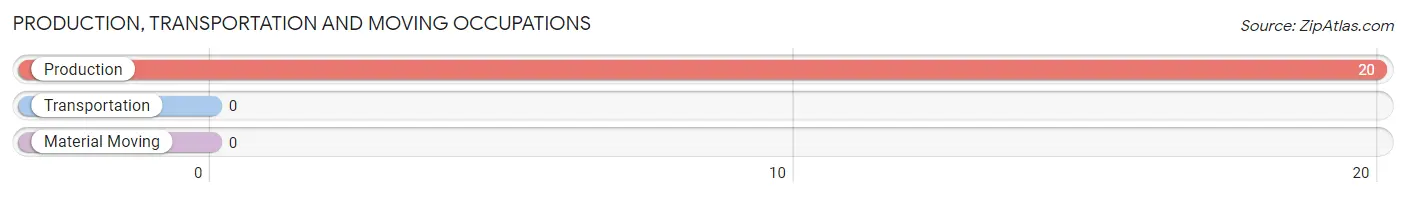
Production, Transportation and Moving Occupations by Sex
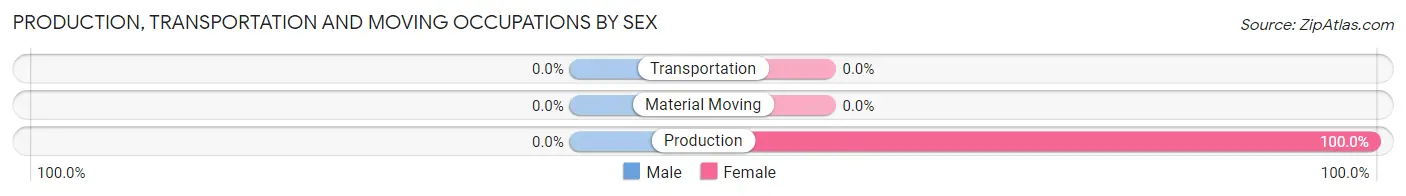
| Occupation | Male | Female |
| Production | 0 (0.0%) | 20 (100.0%) |
| Transportation | 0 (0.0%) | 0 (0.0%) |
| Material Moving | 0 (0.0%) | 0 (0.0%) |
| Total (Category) | 0 (0.0%) | 20 (100.0%) |
| Total (Overall) | 106 (58.2%) | 76 (41.8%) |
Employment Industries by Sex in Bier
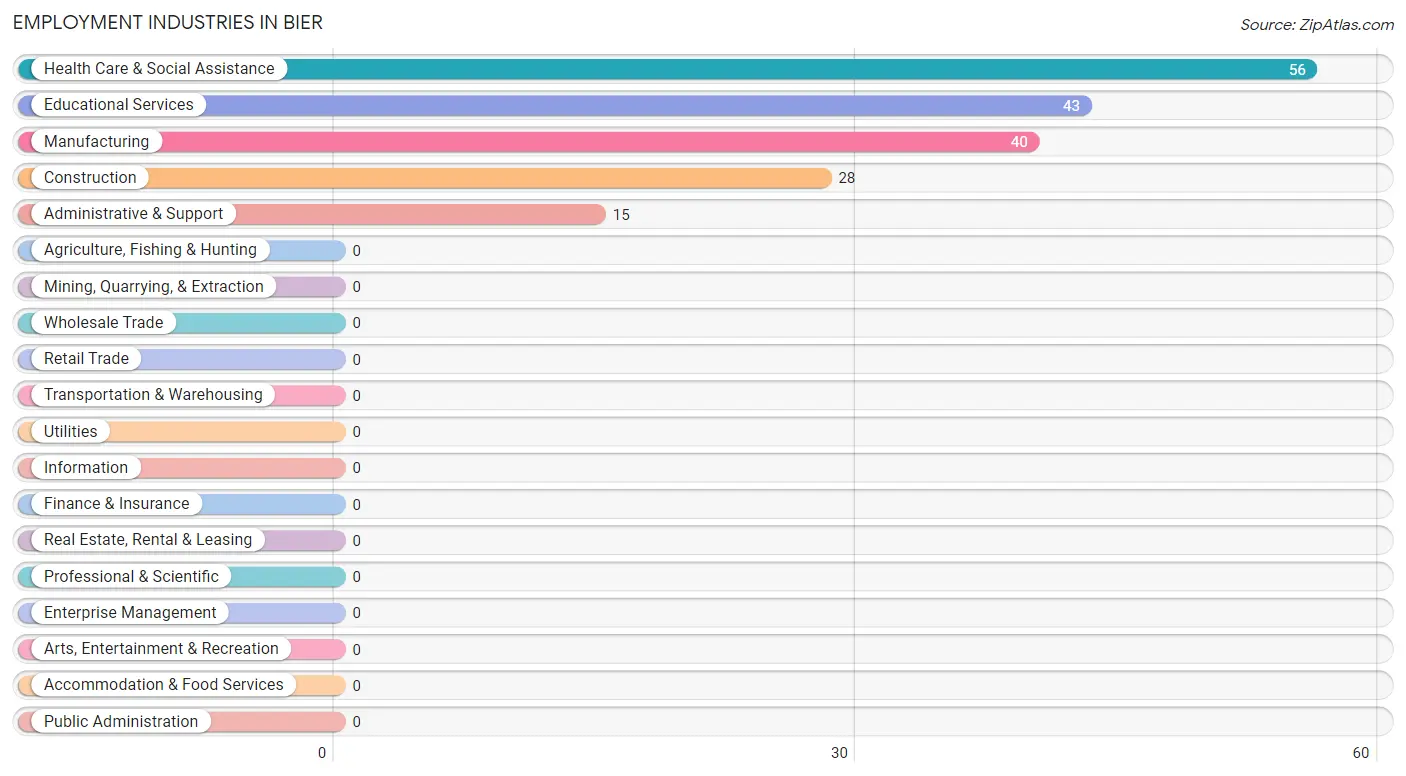
Employment Industries in Bier
The major employment industries in Bier include Health Care & Social Assistance (56 | 30.8%), Educational Services (43 | 23.6%), Manufacturing (40 | 22.0%), Construction (28 | 15.4%), and Administrative & Support (15 | 8.2%).
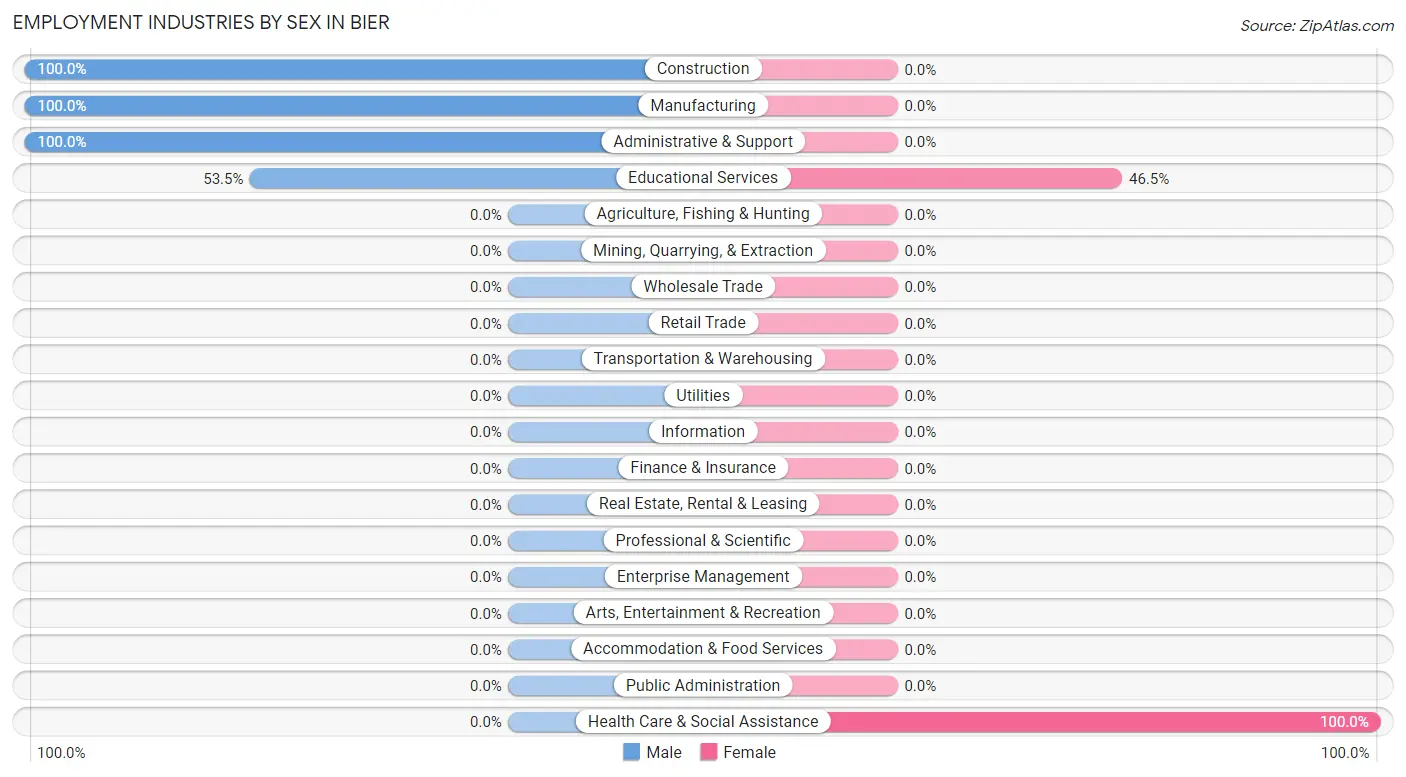
Employment Industries by Sex in Bier
The Bier industries that see more men than women are Construction (100.0%), Manufacturing (100.0%), and Administrative & Support (100.0%), whereas the industries that tend to have a higher number of women are Health Care & Social Assistance (100.0%), and Educational Services (46.5%).
| Industry | Male | Female |
| Agriculture, Fishing & Hunting | 0 (0.0%) | 0 (0.0%) |
| Mining, Quarrying, & Extraction | 0 (0.0%) | 0 (0.0%) |
| Construction | 28 (100.0%) | 0 (0.0%) |
| Manufacturing | 40 (100.0%) | 0 (0.0%) |
| Wholesale Trade | 0 (0.0%) | 0 (0.0%) |
| Retail Trade | 0 (0.0%) | 0 (0.0%) |
| Transportation & Warehousing | 0 (0.0%) | 0 (0.0%) |
| Utilities | 0 (0.0%) | 0 (0.0%) |
| Information | 0 (0.0%) | 0 (0.0%) |
| Finance & Insurance | 0 (0.0%) | 0 (0.0%) |
| Real Estate, Rental & Leasing | 0 (0.0%) | 0 (0.0%) |
| Professional & Scientific | 0 (0.0%) | 0 (0.0%) |
| Enterprise Management | 0 (0.0%) | 0 (0.0%) |
| Administrative & Support | 15 (100.0%) | 0 (0.0%) |
| Educational Services | 23 (53.5%) | 20 (46.5%) |
| Health Care & Social Assistance | 0 (0.0%) | 56 (100.0%) |
| Arts, Entertainment & Recreation | 0 (0.0%) | 0 (0.0%) |
| Accommodation & Food Services | 0 (0.0%) | 0 (0.0%) |
| Public Administration | 0 (0.0%) | 0 (0.0%) |
| Total | 106 (58.2%) | 76 (41.8%) |
Education in Bier
School Enrollment in Bier
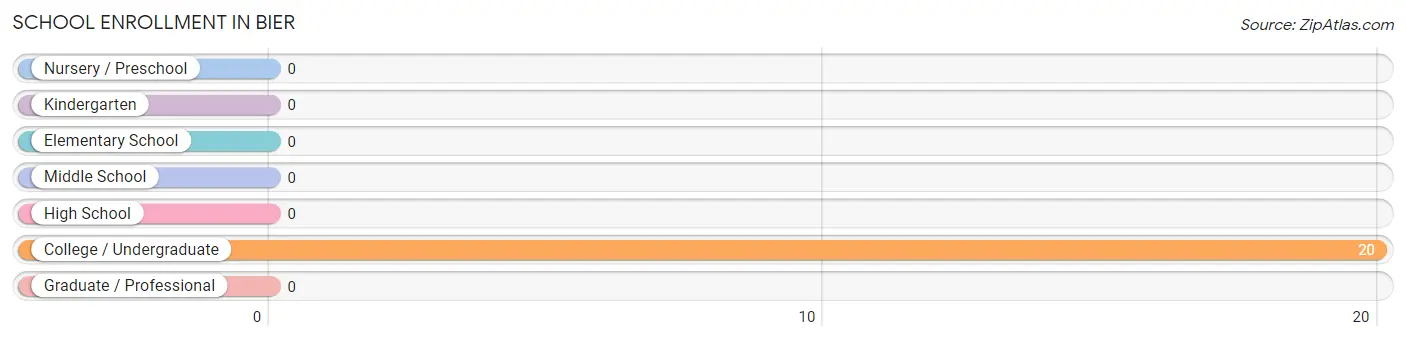
| School Level | # Students | % Students |
| Nursery / Preschool | 0 | 0.0% |
| Kindergarten | 0 | 0.0% |
| Elementary School | 0 | 0.0% |
| Middle School | 0 | 0.0% |
| High School | 0 | 0.0% |
| College / Undergraduate | 20 | 100.0% |
| Graduate / Professional | 0 | 0.0% |
| Total | 20 | 100.0% |
School Enrollment by Age by Funding Source in Bier
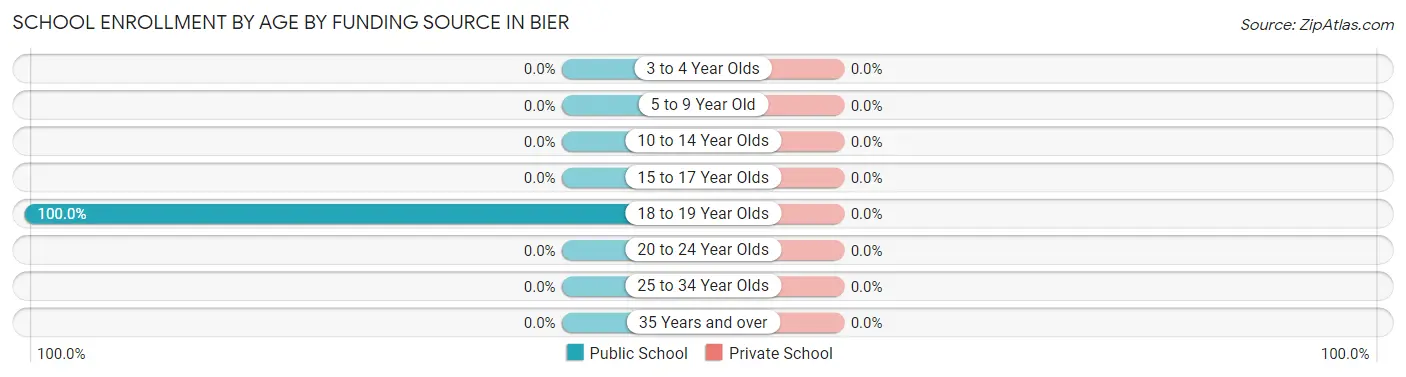
| Age Bracket | Public School | Private School |
| 3 to 4 Year Olds | 0 (0.0%) | 0 (0.0%) |
| 5 to 9 Year Old | 0 (0.0%) | 0 (0.0%) |
| 10 to 14 Year Olds | 0 (0.0%) | 0 (0.0%) |
| 15 to 17 Year Olds | 0 (0.0%) | 0 (0.0%) |
| 18 to 19 Year Olds | 20 (100.0%) | 0 (0.0%) |
| 20 to 24 Year Olds | 0 (0.0%) | 0 (0.0%) |
| 25 to 34 Year Olds | 0 (0.0%) | 0 (0.0%) |
| 35 Years and over | 0 (0.0%) | 0 (0.0%) |
| Total | 20 (100.0%) | 0 (0.0%) |
Educational Attainment by Field of Study in Bier
, and education (36 | 100.0%) are the most common fields of study among 36 individuals in Bier who have obtained a bachelor's degree or higher.
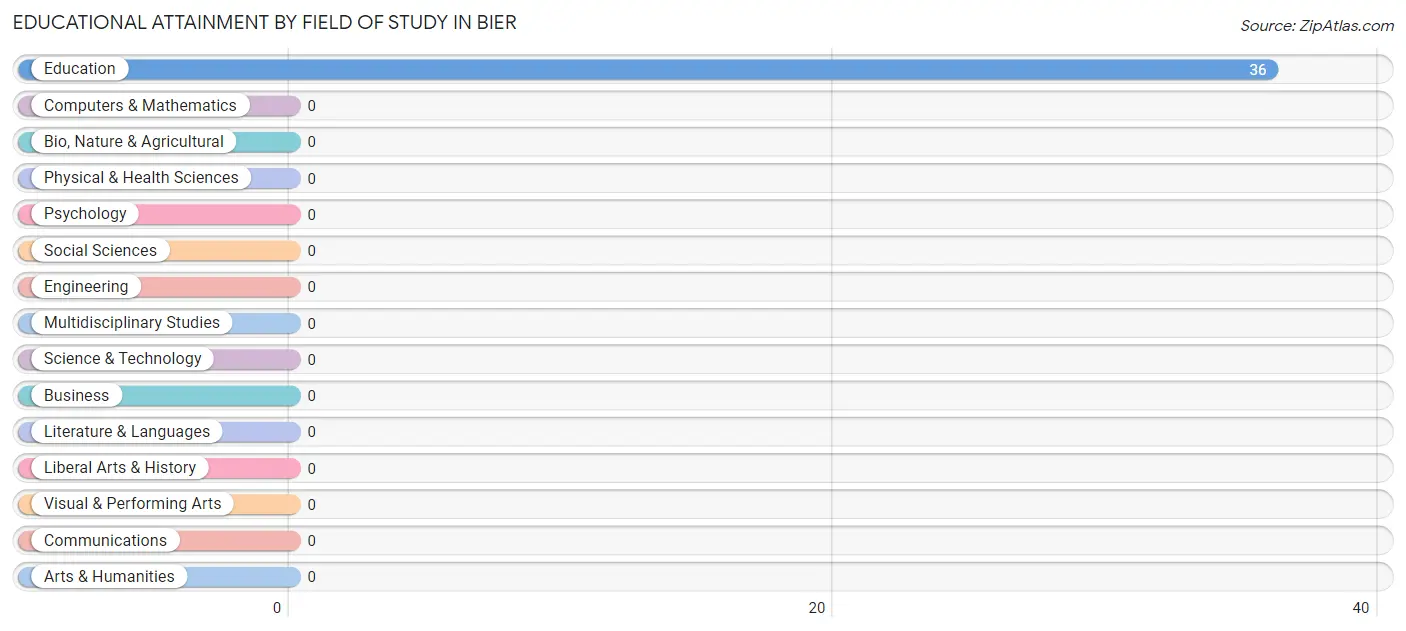
| Field of Study | # Graduates | % Graduates |
| Computers & Mathematics | 0 | 0.0% |
| Bio, Nature & Agricultural | 0 | 0.0% |
| Physical & Health Sciences | 0 | 0.0% |
| Psychology | 0 | 0.0% |
| Social Sciences | 0 | 0.0% |
| Engineering | 0 | 0.0% |
| Multidisciplinary Studies | 0 | 0.0% |
| Science & Technology | 0 | 0.0% |
| Business | 0 | 0.0% |
| Education | 36 | 100.0% |
| Literature & Languages | 0 | 0.0% |
| Liberal Arts & History | 0 | 0.0% |
| Visual & Performing Arts | 0 | 0.0% |
| Communications | 0 | 0.0% |
| Arts & Humanities | 0 | 0.0% |
| Total | 36 | 100.0% |
Transportation & Commute in Bier
Vehicle Availability by Sex in Bier
The most prevalent vehicle ownership categories in Bier are males with 2 vehicles (55, accounting for 51.9%) and females with 2 vehicles (36, making up 72.4%).
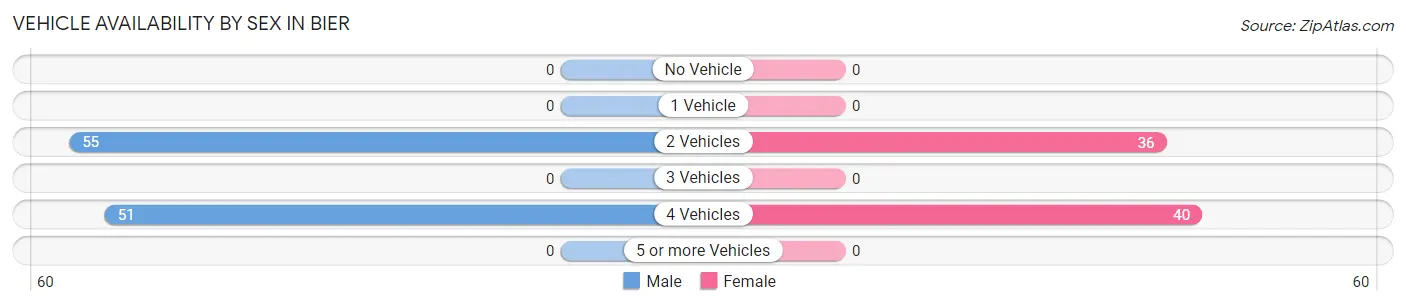
| Vehicles Available | Male | Female |
| No Vehicle | 0 (0.0%) | 0 (0.0%) |
| 1 Vehicle | 0 (0.0%) | 0 (0.0%) |
| 2 Vehicles | 55 (51.9%) | 36 (47.4%) |
| 3 Vehicles | 0 (0.0%) | 0 (0.0%) |
| 4 Vehicles | 51 (48.1%) | 40 (52.6%) |
| 5 or more Vehicles | 0 (0.0%) | 0 (0.0%) |
| Total | 106 (100.0%) | 76 (100.0%) |
Commute Time in Bier
The most frequently occuring commute durations in Bier are 25 to 29 minutes (56 commuters, 30.8%), 45 to 59 minutes (43 commuters, 23.6%), and 5 to 9 minutes (40 commuters, 22.0%).
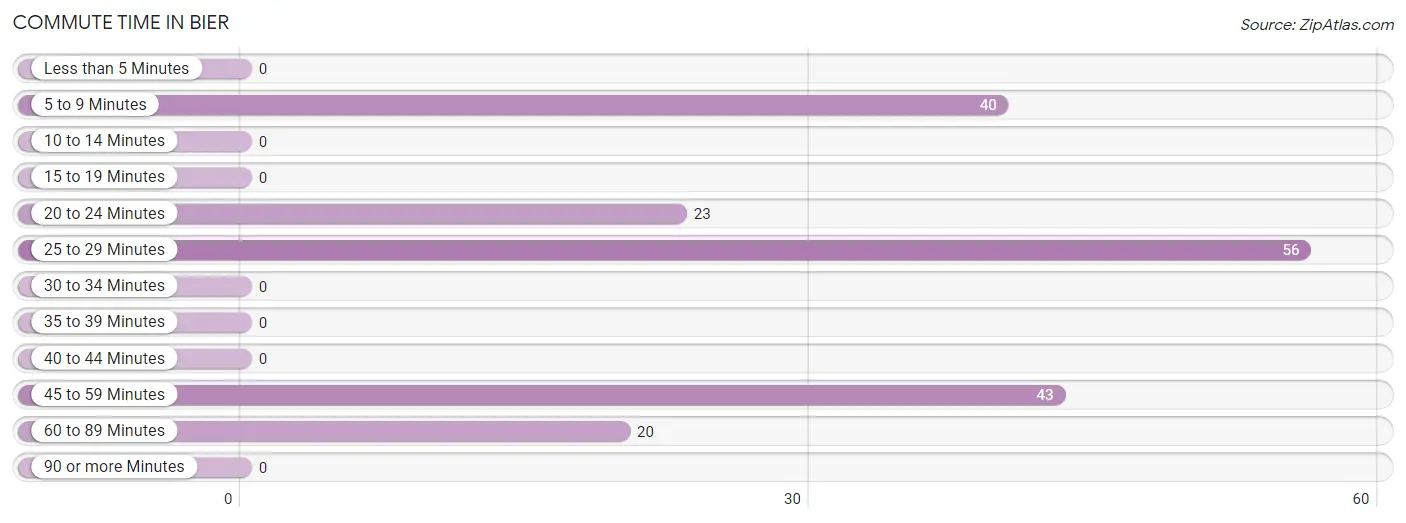
| Commute Time | # Commuters | % Commuters |
| Less than 5 Minutes | 0 | 0.0% |
| 5 to 9 Minutes | 40 | 22.0% |
| 10 to 14 Minutes | 0 | 0.0% |
| 15 to 19 Minutes | 0 | 0.0% |
| 20 to 24 Minutes | 23 | 12.6% |
| 25 to 29 Minutes | 56 | 30.8% |
| 30 to 34 Minutes | 0 | 0.0% |
| 35 to 39 Minutes | 0 | 0.0% |
| 40 to 44 Minutes | 0 | 0.0% |
| 45 to 59 Minutes | 43 | 23.6% |
| 60 to 89 Minutes | 20 | 11.0% |
| 90 or more Minutes | 0 | 0.0% |
Commute Time by Sex in Bier
The most common commute times in Bier are 45 to 59 minutes (43 commuters, 40.6%) for males and 25 to 29 minutes (56 commuters, 73.7%) for females.
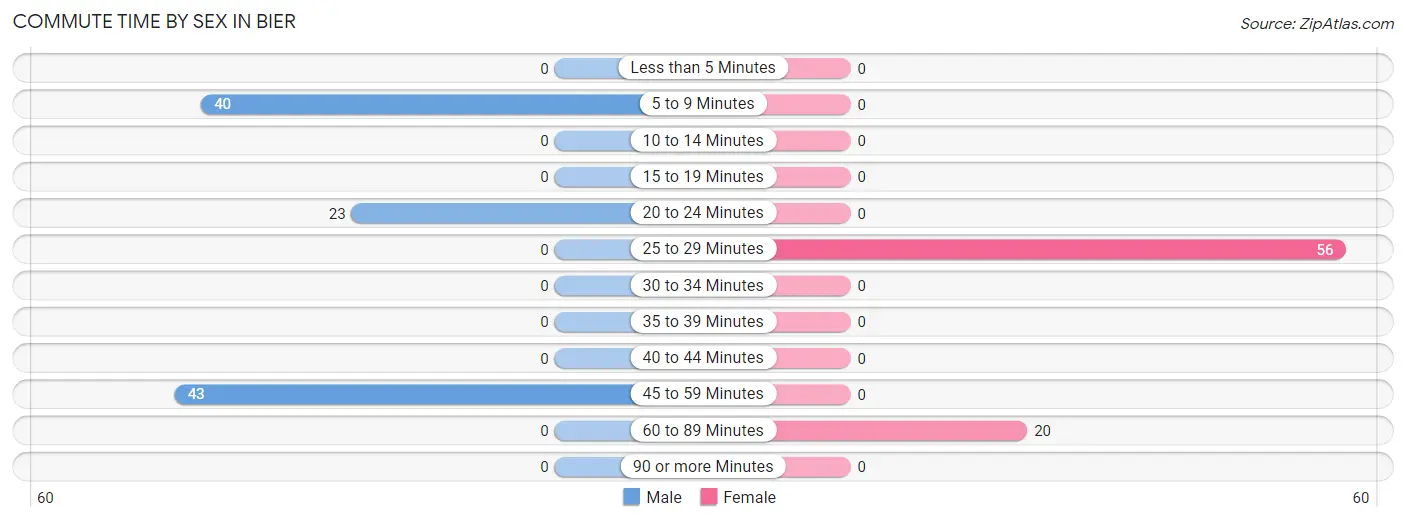
| Commute Time | Male | Female |
| Less than 5 Minutes | 0 (0.0%) | 0 (0.0%) |
| 5 to 9 Minutes | 40 (37.7%) | 0 (0.0%) |
| 10 to 14 Minutes | 0 (0.0%) | 0 (0.0%) |
| 15 to 19 Minutes | 0 (0.0%) | 0 (0.0%) |
| 20 to 24 Minutes | 23 (21.7%) | 0 (0.0%) |
| 25 to 29 Minutes | 0 (0.0%) | 56 (73.7%) |
| 30 to 34 Minutes | 0 (0.0%) | 0 (0.0%) |
| 35 to 39 Minutes | 0 (0.0%) | 0 (0.0%) |
| 40 to 44 Minutes | 0 (0.0%) | 0 (0.0%) |
| 45 to 59 Minutes | 43 (40.6%) | 0 (0.0%) |
| 60 to 89 Minutes | 0 (0.0%) | 20 (26.3%) |
| 90 or more Minutes | 0 (0.0%) | 0 (0.0%) |
Time of Departure to Work by Sex in Bier
The most frequent times of departure to work in Bier are 5:30 AM to 5:59 AM (106, 100.0%) for males and 8:00 AM to 8:29 AM (36, 47.4%) for females.
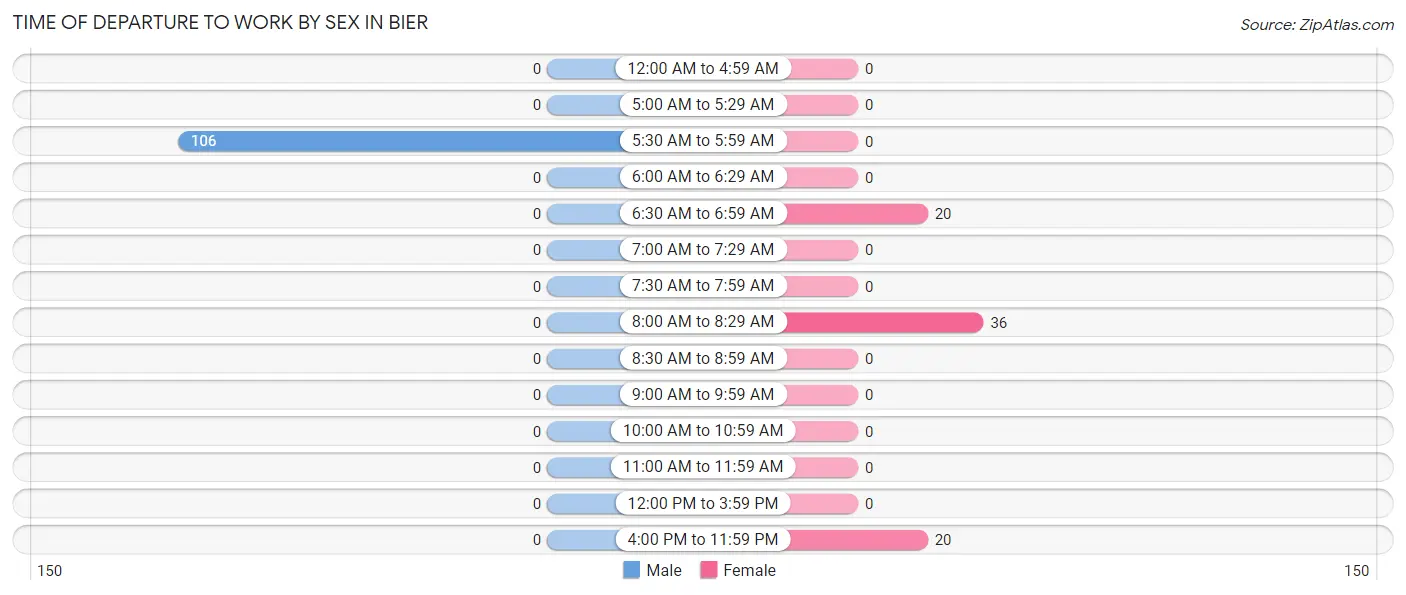
| Time of Departure | Male | Female |
| 12:00 AM to 4:59 AM | 0 (0.0%) | 0 (0.0%) |
| 5:00 AM to 5:29 AM | 0 (0.0%) | 0 (0.0%) |
| 5:30 AM to 5:59 AM | 106 (100.0%) | 0 (0.0%) |
| 6:00 AM to 6:29 AM | 0 (0.0%) | 0 (0.0%) |
| 6:30 AM to 6:59 AM | 0 (0.0%) | 20 (26.3%) |
| 7:00 AM to 7:29 AM | 0 (0.0%) | 0 (0.0%) |
| 7:30 AM to 7:59 AM | 0 (0.0%) | 0 (0.0%) |
| 8:00 AM to 8:29 AM | 0 (0.0%) | 36 (47.4%) |
| 8:30 AM to 8:59 AM | 0 (0.0%) | 0 (0.0%) |
| 9:00 AM to 9:59 AM | 0 (0.0%) | 0 (0.0%) |
| 10:00 AM to 10:59 AM | 0 (0.0%) | 0 (0.0%) |
| 11:00 AM to 11:59 AM | 0 (0.0%) | 0 (0.0%) |
| 12:00 PM to 3:59 PM | 0 (0.0%) | 0 (0.0%) |
| 4:00 PM to 11:59 PM | 0 (0.0%) | 20 (26.3%) |
| Total | 106 (100.0%) | 76 (100.0%) |
Housing Occupancy in Bier
Occupancy by Ownership in Bier
Of the total 92 dwellings in Bier, owner-occupied units account for 92 (100.0%), while renter-occupied units make up 0 (0.0%).
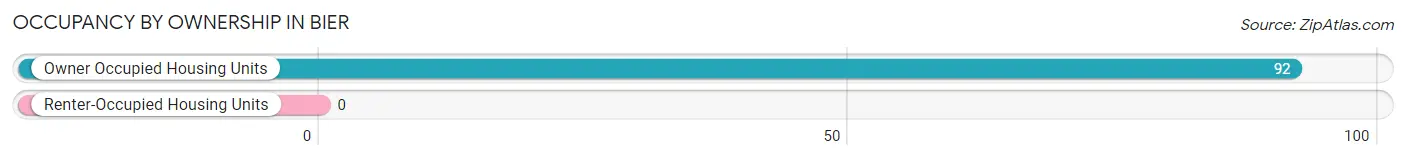
| Occupancy | # Housing Units | % Housing Units |
| Owner Occupied Housing Units | 92 | 100.0% |
| Renter-Occupied Housing Units | 0 | 0.0% |
| Total Occupied Housing Units | 92 | 100.0% |
Occupancy by Household Size in Bier
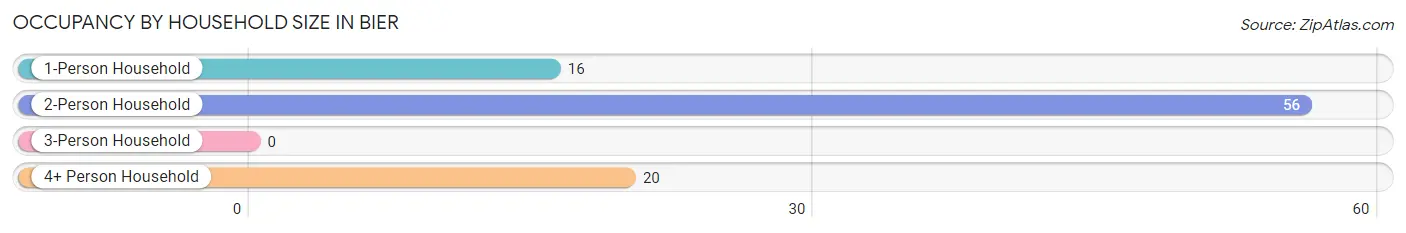
| Household Size | # Housing Units | % Housing Units |
| 1-Person Household | 16 | 17.4% |
| 2-Person Household | 56 | 60.9% |
| 3-Person Household | 0 | 0.0% |
| 4+ Person Household | 20 | 21.7% |
| Total Housing Units | 92 | 100.0% |
Occupancy by Ownership by Household Size in Bier
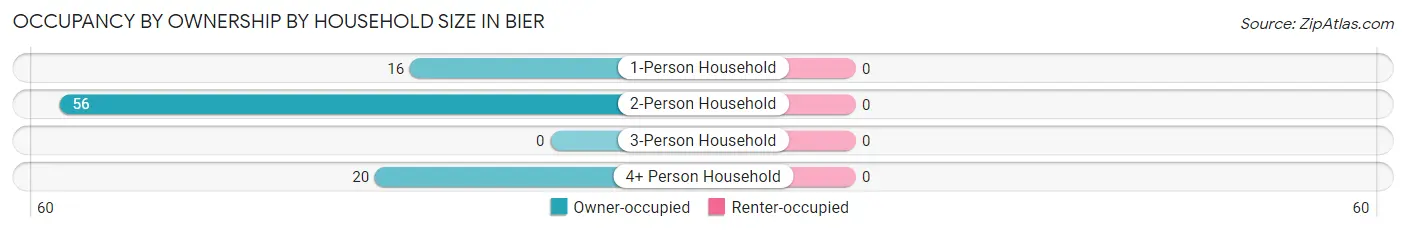
| Household Size | Owner-occupied | Renter-occupied |
| 1-Person Household | 16 (100.0%) | 0 (0.0%) |
| 2-Person Household | 56 (100.0%) | 0 (0.0%) |
| 3-Person Household | 0 (0.0%) | 0 (0.0%) |
| 4+ Person Household | 20 (100.0%) | 0 (0.0%) |
| Total Housing Units | 92 (100.0%) | 0 (0.0%) |
Occupancy by Educational Attainment in Bier
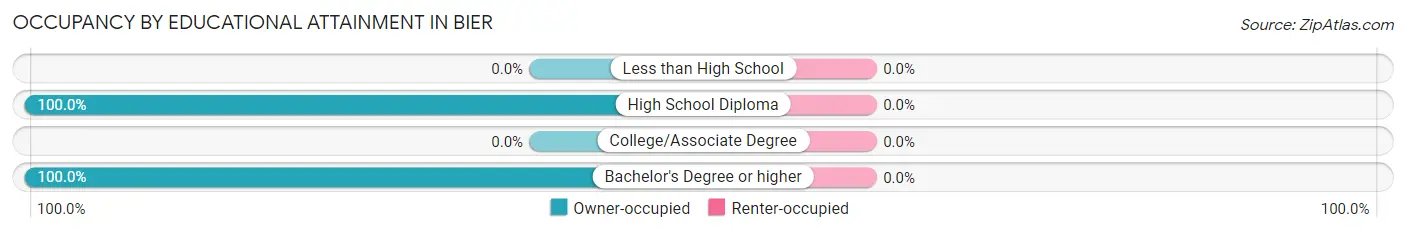
| Household Size | Owner-occupied | Renter-occupied |
| Less than High School | 0 (0.0%) | 0 (0.0%) |
| High School Diploma | 56 (100.0%) | 0 (0.0%) |
| College/Associate Degree | 0 (0.0%) | 0 (0.0%) |
| Bachelor's Degree or higher | 36 (100.0%) | 0 (0.0%) |
Occupancy by Age of Householder in Bier
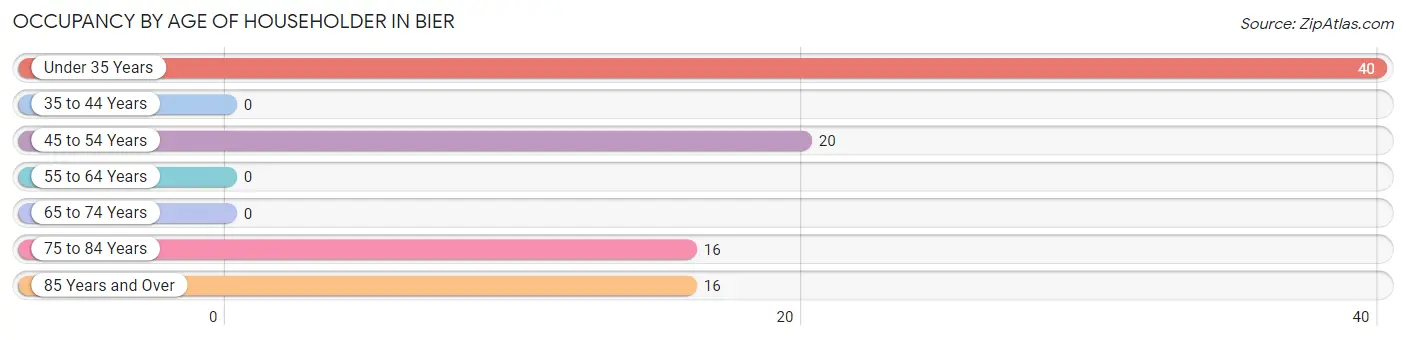
| Age Bracket | # Households | % Households |
| Under 35 Years | 40 | 43.5% |
| 35 to 44 Years | 0 | 0.0% |
| 45 to 54 Years | 20 | 21.7% |
| 55 to 64 Years | 0 | 0.0% |
| 65 to 74 Years | 0 | 0.0% |
| 75 to 84 Years | 16 | 17.4% |
| 85 Years and Over | 16 | 17.4% |
| Total | 92 | 100.0% |
Housing Finances in Bier
Median Income by Occupancy in Bier
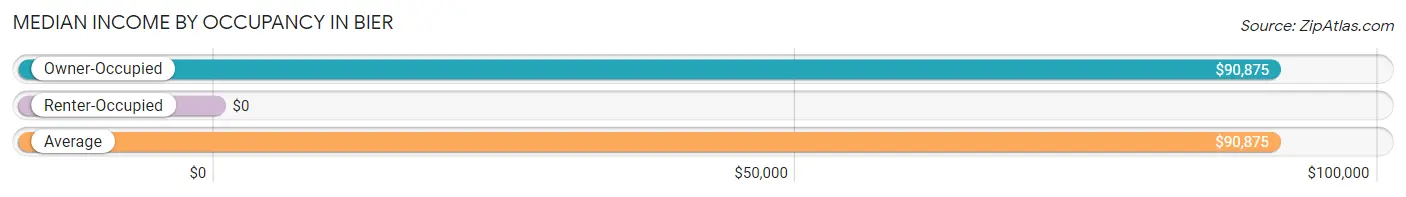
| Occupancy Type | # Households | Median Income |
| Owner-Occupied | 92 (100.0%) | $90,875 |
| Renter-Occupied | 0 (0.0%) | $0 |
| Average | 92 (100.0%) | $90,875 |
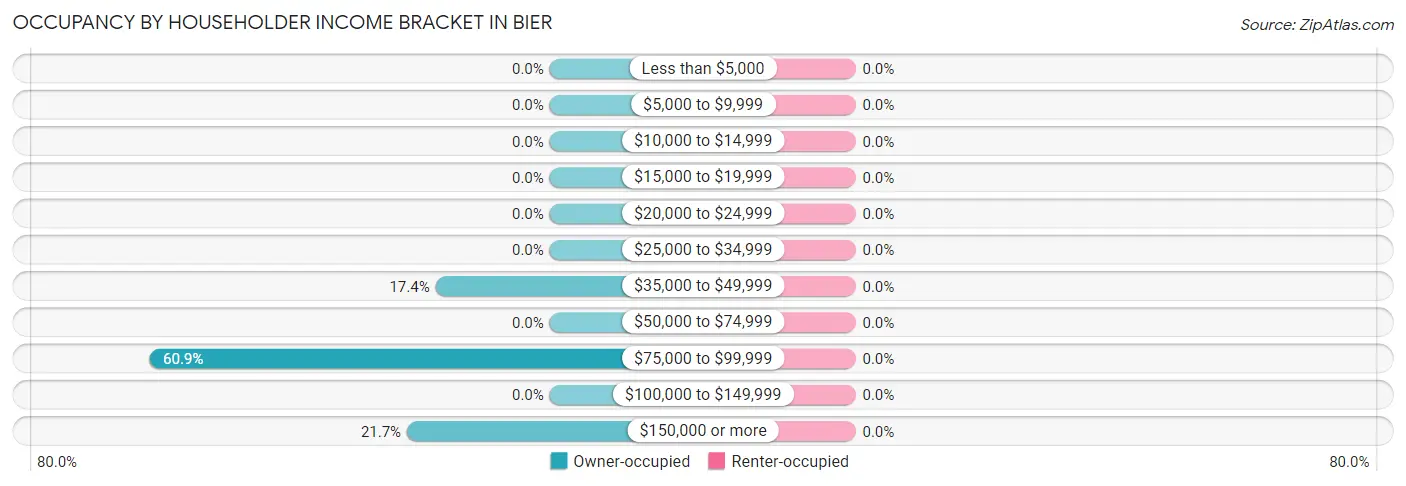
Occupancy by Householder Income Bracket in Bier
| Income Bracket | Owner-occupied | Renter-occupied |
| Less than $5,000 | 0 (0.0%) | 0 (0.0%) |
| $5,000 to $9,999 | 0 (0.0%) | 0 (0.0%) |
| $10,000 to $14,999 | 0 (0.0%) | 0 (0.0%) |
| $15,000 to $19,999 | 0 (0.0%) | 0 (0.0%) |
| $20,000 to $24,999 | 0 (0.0%) | 0 (0.0%) |
| $25,000 to $34,999 | 0 (0.0%) | 0 (0.0%) |
| $35,000 to $49,999 | 16 (17.4%) | 0 (0.0%) |
| $50,000 to $74,999 | 0 (0.0%) | 0 (0.0%) |
| $75,000 to $99,999 | 56 (60.9%) | 0 (0.0%) |
| $100,000 to $149,999 | 0 (0.0%) | 0 (0.0%) |
| $150,000 or more | 20 (21.7%) | 0 (0.0%) |
| Total | 92 (100.0%) | 0 (0.0%) |
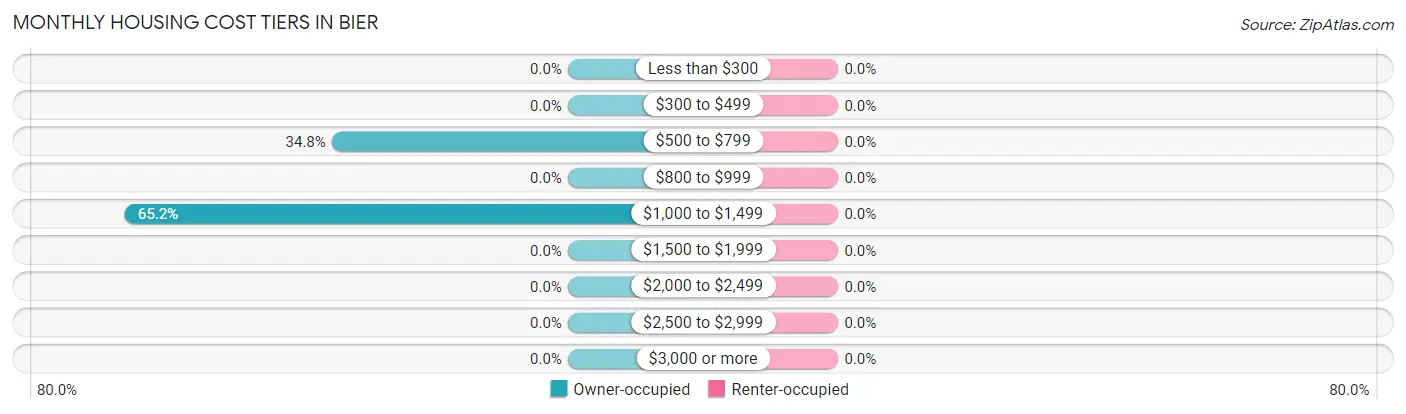
Monthly Housing Cost Tiers in Bier
| Monthly Cost | Owner-occupied | Renter-occupied |
| Less than $300 | 0 (0.0%) | 0 (0.0%) |
| $300 to $499 | 0 (0.0%) | 0 (0.0%) |
| $500 to $799 | 32 (34.8%) | 0 (0.0%) |
| $800 to $999 | 0 (0.0%) | 0 (0.0%) |
| $1,000 to $1,499 | 60 (65.2%) | 0 (0.0%) |
| $1,500 to $1,999 | 0 (0.0%) | 0 (0.0%) |
| $2,000 to $2,499 | 0 (0.0%) | 0 (0.0%) |
| $2,500 to $2,999 | 0 (0.0%) | 0 (0.0%) |
| $3,000 or more | 0 (0.0%) | 0 (0.0%) |
| Total | 92 (100.0%) | 0 (0.0%) |
Physical Housing Characteristics in Bier
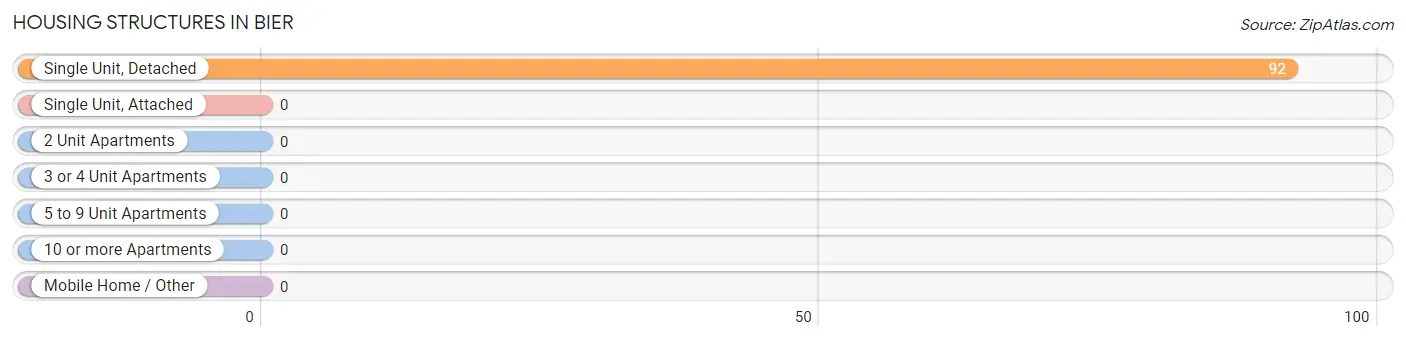
Housing Structures in Bier
| Structure Type | # Housing Units | % Housing Units |
| Single Unit, Detached | 92 | 100.0% |
| Single Unit, Attached | 0 | 0.0% |
| 2 Unit Apartments | 0 | 0.0% |
| 3 or 4 Unit Apartments | 0 | 0.0% |
| 5 to 9 Unit Apartments | 0 | 0.0% |
| 10 or more Apartments | 0 | 0.0% |
| Mobile Home / Other | 0 | 0.0% |
| Total | 92 | 100.0% |
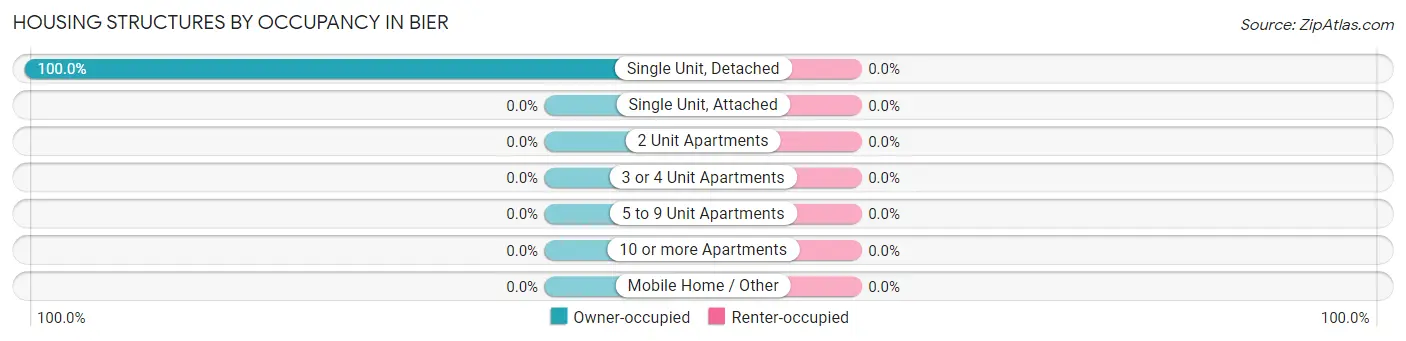
Housing Structures by Occupancy in Bier
| Structure Type | Owner-occupied | Renter-occupied |
| Single Unit, Detached | 92 (100.0%) | 0 (0.0%) |
| Single Unit, Attached | 0 (0.0%) | 0 (0.0%) |
| 2 Unit Apartments | 0 (0.0%) | 0 (0.0%) |
| 3 or 4 Unit Apartments | 0 (0.0%) | 0 (0.0%) |
| 5 to 9 Unit Apartments | 0 (0.0%) | 0 (0.0%) |
| 10 or more Apartments | 0 (0.0%) | 0 (0.0%) |
| Mobile Home / Other | 0 (0.0%) | 0 (0.0%) |
| Total | 92 (100.0%) | 0 (0.0%) |
Housing Structures by Number of Rooms in Bier
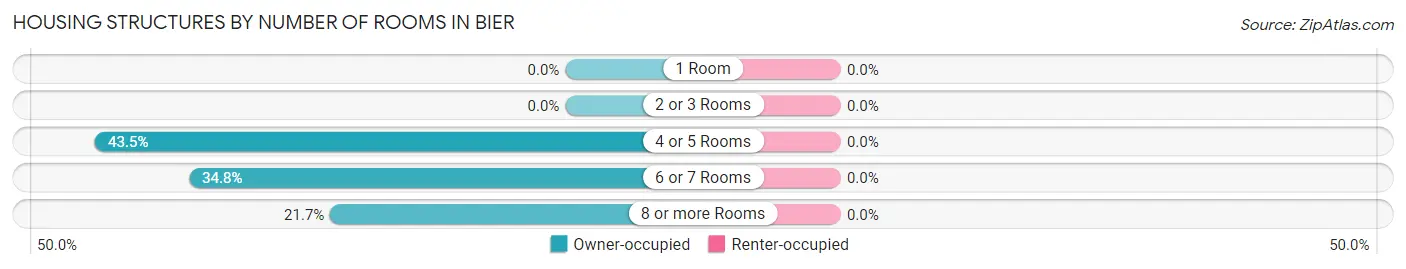
| Number of Rooms | Owner-occupied | Renter-occupied |
| 1 Room | 0 (0.0%) | 0 (0.0%) |
| 2 or 3 Rooms | 0 (0.0%) | 0 (0.0%) |
| 4 or 5 Rooms | 40 (43.5%) | 0 (0.0%) |
| 6 or 7 Rooms | 32 (34.8%) | 0 (0.0%) |
| 8 or more Rooms | 20 (21.7%) | 0 (0.0%) |
| Total | 92 (100.0%) | 0 (0.0%) |
Housing Structure by Heating Type in Bier
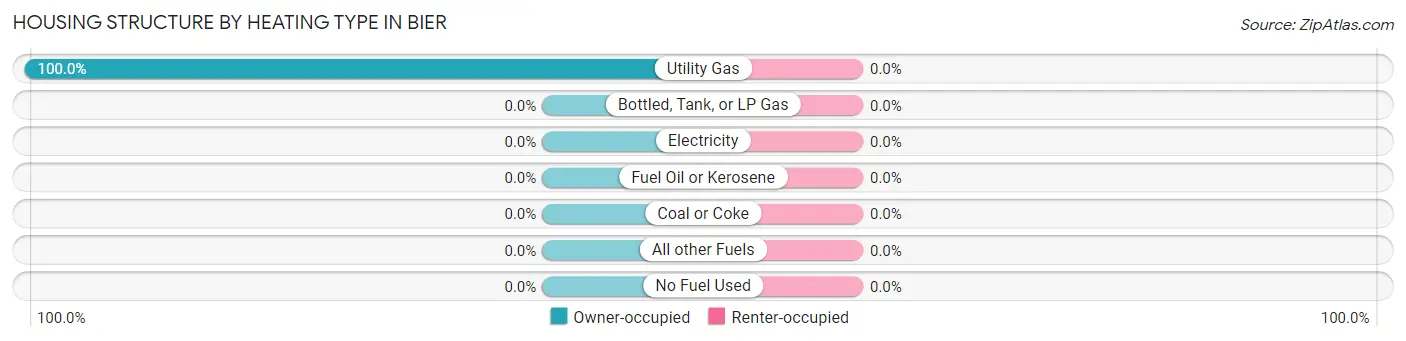
| Heating Type | Owner-occupied | Renter-occupied |
| Utility Gas | 92 (100.0%) | 0 (0.0%) |
| Bottled, Tank, or LP Gas | 0 (0.0%) | 0 (0.0%) |
| Electricity | 0 (0.0%) | 0 (0.0%) |
| Fuel Oil or Kerosene | 0 (0.0%) | 0 (0.0%) |
| Coal or Coke | 0 (0.0%) | 0 (0.0%) |
| All other Fuels | 0 (0.0%) | 0 (0.0%) |
| No Fuel Used | 0 (0.0%) | 0 (0.0%) |
| Total | 92 (100.0%) | 0 (0.0%) |
Household Vehicle Usage in Bier
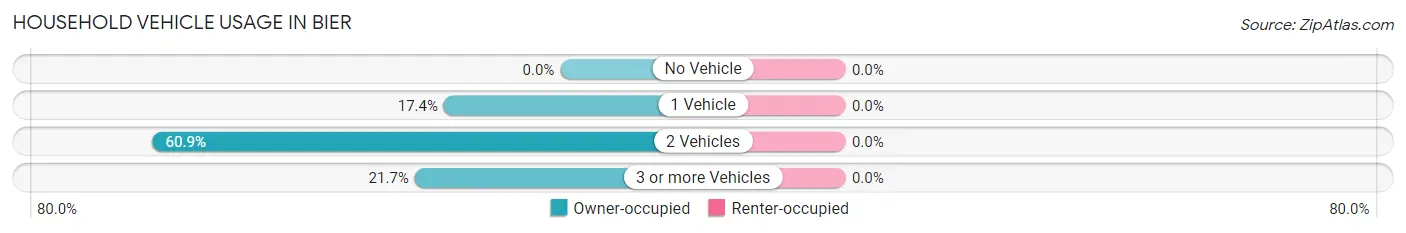
| Vehicles per Household | Owner-occupied | Renter-occupied |
| No Vehicle | 0 (0.0%) | 0 (0.0%) |
| 1 Vehicle | 16 (17.4%) | 0 (0.0%) |
| 2 Vehicles | 56 (60.9%) | 0 (0.0%) |
| 3 or more Vehicles | 20 (21.7%) | 0 (0.0%) |
| Total | 92 (100.0%) | 0 (0.0%) |
Real Estate & Mortgages in Bier
Real Estate and Mortgage Overview in Bier
| Characteristic | Without Mortgage | With Mortgage |
| Housing Units | 32 | 60 |
| Median Property Value | - | - |
| Median Household Income | - | - |
| Monthly Housing Costs | - | - |
| Real Estate Taxes | - | - |
Property Value by Mortgage Status in Bier
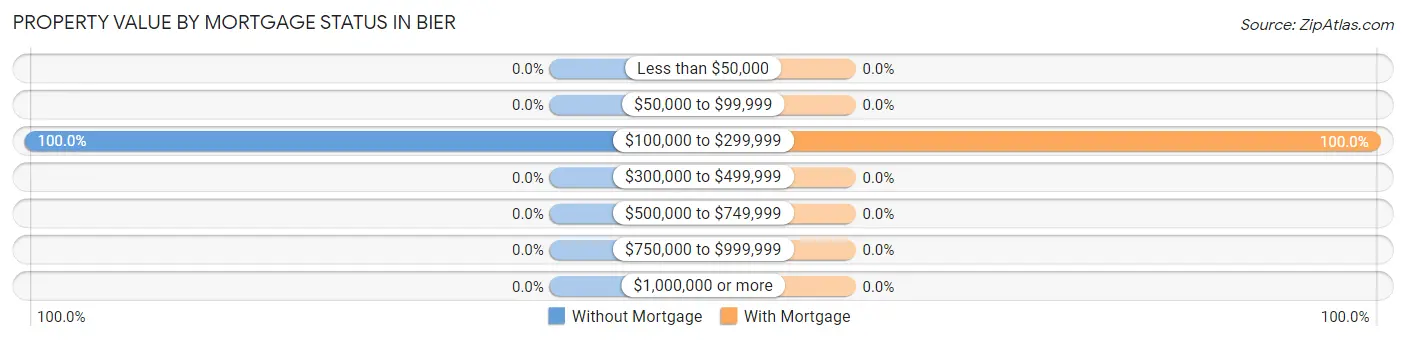
| Property Value | Without Mortgage | With Mortgage |
| Less than $50,000 | 0 (0.0%) | 0 (0.0%) |
| $50,000 to $99,999 | 0 (0.0%) | 0 (0.0%) |
| $100,000 to $299,999 | 32 (100.0%) | 60 (100.0%) |
| $300,000 to $499,999 | 0 (0.0%) | 0 (0.0%) |
| $500,000 to $749,999 | 0 (0.0%) | 0 (0.0%) |
| $750,000 to $999,999 | 0 (0.0%) | 0 (0.0%) |
| $1,000,000 or more | 0 (0.0%) | 0 (0.0%) |
| Total | 32 (100.0%) | 60 (100.0%) |
Household Income by Mortgage Status in Bier
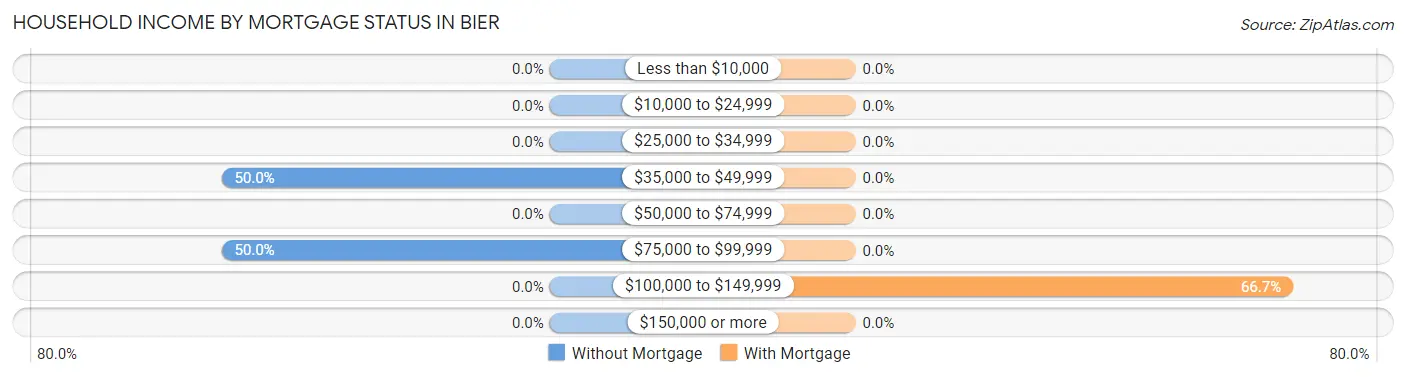
| Household Income | Without Mortgage | With Mortgage |
| Less than $10,000 | 0 (0.0%) | 0 (0.0%) |
| $10,000 to $24,999 | 0 (0.0%) | 0 (0.0%) |
| $25,000 to $34,999 | 0 (0.0%) | 0 (0.0%) |
| $35,000 to $49,999 | 16 (50.0%) | 0 (0.0%) |
| $50,000 to $74,999 | 0 (0.0%) | 0 (0.0%) |
| $75,000 to $99,999 | 16 (50.0%) | 0 (0.0%) |
| $100,000 to $149,999 | 0 (0.0%) | 40 (66.7%) |
| $150,000 or more | 0 (0.0%) | 0 (0.0%) |
| Total | 32 (100.0%) | 60 (100.0%) |
Property Value to Household Income Ratio in Bier
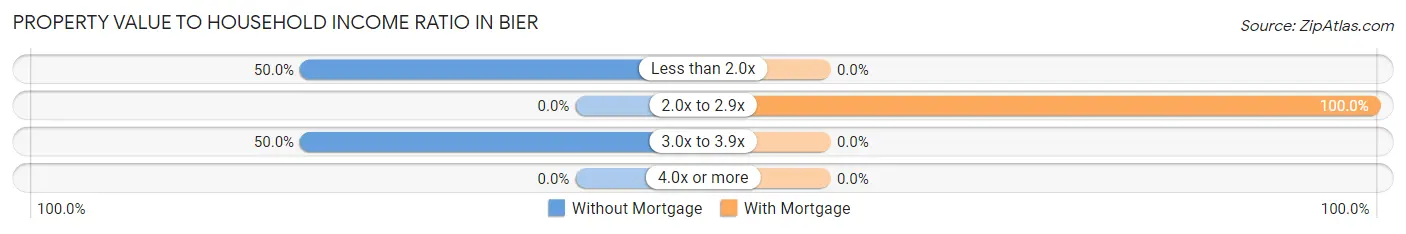
| Value-to-Income Ratio | Without Mortgage | With Mortgage |
| Less than 2.0x | 16 (50.0%) | 0 (0.0%) |
| 2.0x to 2.9x | 0 (0.0%) | 60 (100.0%) |
| 3.0x to 3.9x | 16 (50.0%) | 0 (0.0%) |
| 4.0x or more | 0 (0.0%) | 0 (0.0%) |
| Total | 32 (100.0%) | 60 (100.0%) |
Real Estate Taxes by Mortgage Status in Bier
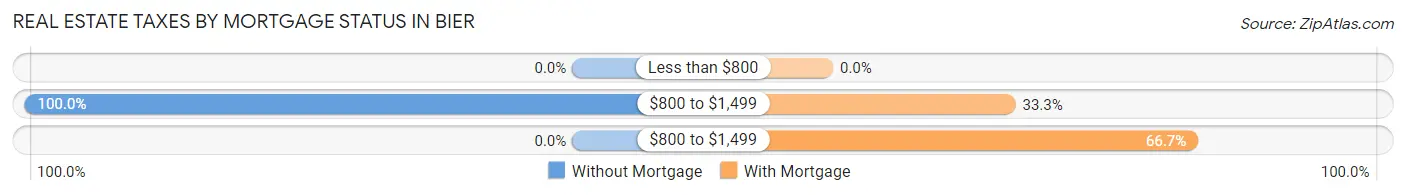
| Property Taxes | Without Mortgage | With Mortgage |
| Less than $800 | 0 (0.0%) | 0 (0.0%) |
| $800 to $1,499 | 32 (100.0%) | 20 (33.3%) |
| $800 to $1,499 | 0 (0.0%) | 40 (66.7%) |
| Total | 32 (100.0%) | 60 (100.0%) |
Health & Disability in Bier
Health Insurance Coverage by Age in Bier
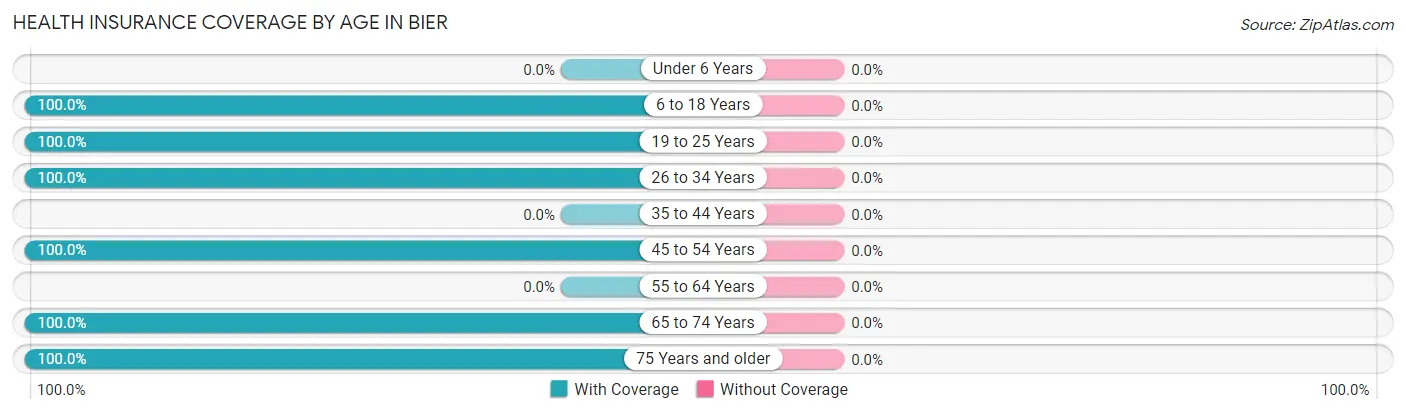
| Age Bracket | With Coverage | Without Coverage |
| Under 6 Years | 0 (0.0%) | 0 (0.0%) |
| 6 to 18 Years | 20 (100.0%) | 0 (0.0%) |
| 19 to 25 Years | 28 (100.0%) | 0 (0.0%) |
| 26 to 34 Years | 76 (100.0%) | 0 (0.0%) |
| 35 to 44 Years | 0 (0.0%) | 0 (0.0%) |
| 45 to 54 Years | 43 (100.0%) | 0 (0.0%) |
| 55 to 64 Years | 0 (0.0%) | 0 (0.0%) |
| 65 to 74 Years | 15 (100.0%) | 0 (0.0%) |
| 75 Years and older | 32 (100.0%) | 0 (0.0%) |
| Total | 214 (100.0%) | 0 (0.0%) |
Health Insurance Coverage by Citizenship Status in Bier
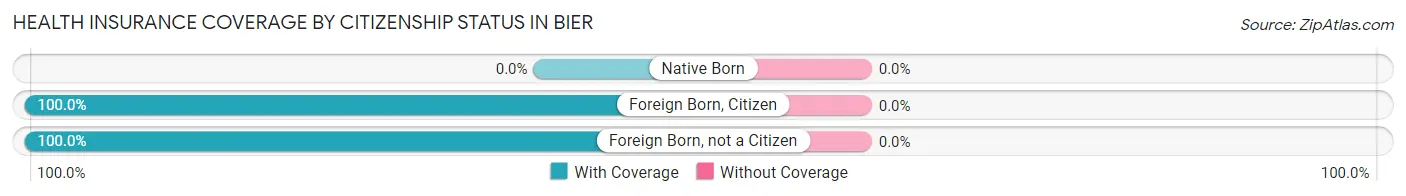
| Citizenship Status | With Coverage | Without Coverage |
| Native Born | 0 (0.0%) | 0 (0.0%) |
| Foreign Born, Citizen | 20 (100.0%) | 0 (0.0%) |
| Foreign Born, not a Citizen | 28 (100.0%) | 0 (0.0%) |
Health Insurance Coverage by Household Income in Bier
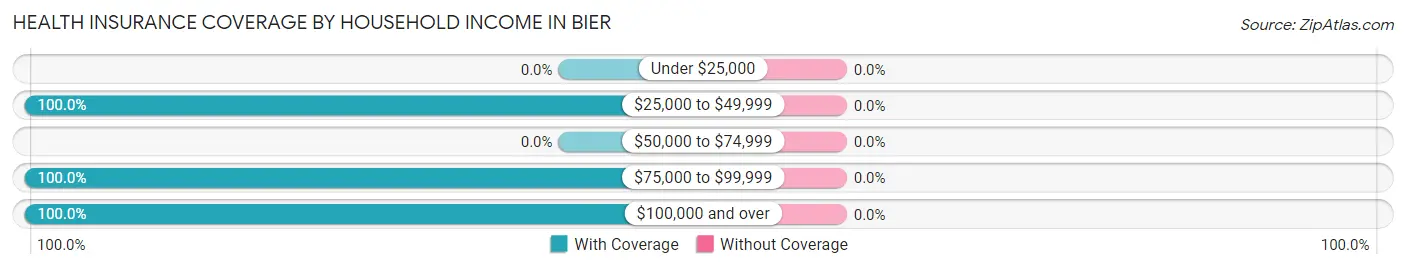
| Household Income | With Coverage | Without Coverage |
| Under $25,000 | 0 (0.0%) | 0 (0.0%) |
| $25,000 to $49,999 | 31 (100.0%) | 0 (0.0%) |
| $50,000 to $74,999 | 0 (0.0%) | 0 (0.0%) |
| $75,000 to $99,999 | 92 (100.0%) | 0 (0.0%) |
| $100,000 and over | 91 (100.0%) | 0 (0.0%) |
Public vs Private Health Insurance Coverage by Age in Bier
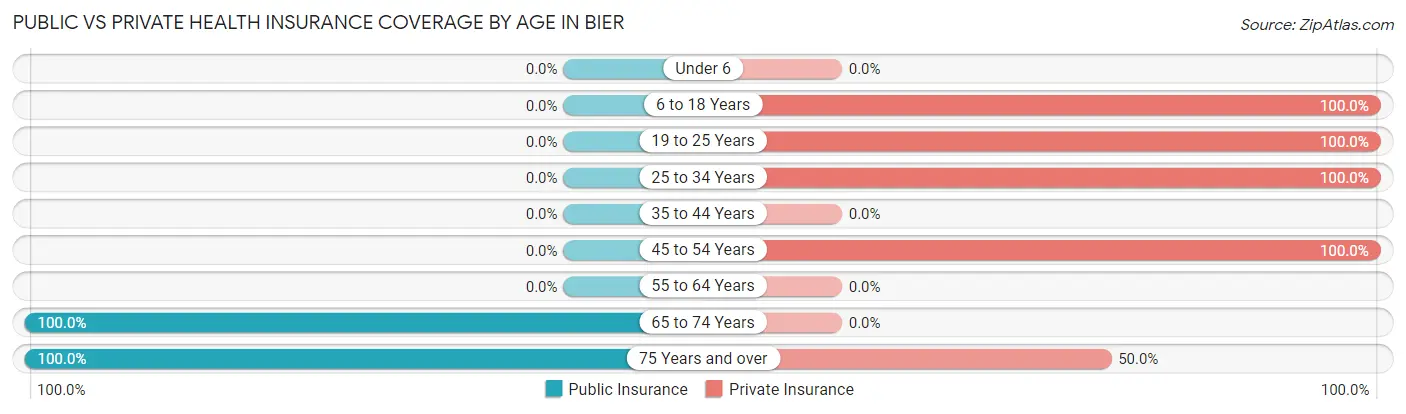
| Age Bracket | Public Insurance | Private Insurance |
| Under 6 | 0 (0.0%) | 0 (0.0%) |
| 6 to 18 Years | 0 (0.0%) | 20 (100.0%) |
| 19 to 25 Years | 0 (0.0%) | 28 (100.0%) |
| 25 to 34 Years | 0 (0.0%) | 76 (100.0%) |
| 35 to 44 Years | 0 (0.0%) | 0 (0.0%) |
| 45 to 54 Years | 0 (0.0%) | 43 (100.0%) |
| 55 to 64 Years | 0 (0.0%) | 0 (0.0%) |
| 65 to 74 Years | 15 (100.0%) | 0 (0.0%) |
| 75 Years and over | 32 (100.0%) | 16 (50.0%) |
| Total | 47 (22.0%) | 183 (85.5%) |
Disability Status by Sex by Age in Bier
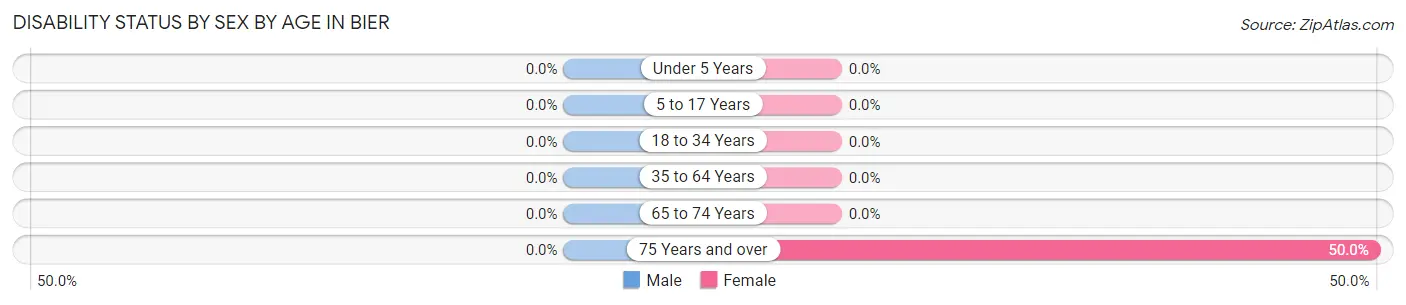
| Age Bracket | Male | Female |
| Under 5 Years | 0 (0.0%) | 0 (0.0%) |
| 5 to 17 Years | 0 (0.0%) | 0 (0.0%) |
| 18 to 34 Years | 0 (0.0%) | 0 (0.0%) |
| 35 to 64 Years | 0 (0.0%) | 0 (0.0%) |
| 65 to 74 Years | 0 (0.0%) | 0 (0.0%) |
| 75 Years and over | 0 (0.0%) | 16 (50.0%) |
Disability Class by Sex by Age in Bier
Disability Class: Hearing Difficulty
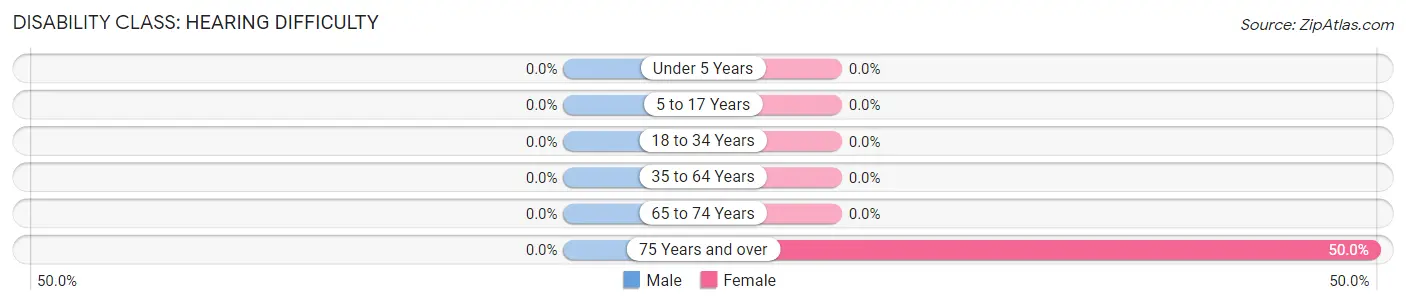
| Age Bracket | Male | Female |
| Under 5 Years | 0 (0.0%) | 0 (0.0%) |
| 5 to 17 Years | 0 (0.0%) | 0 (0.0%) |
| 18 to 34 Years | 0 (0.0%) | 0 (0.0%) |
| 35 to 64 Years | 0 (0.0%) | 0 (0.0%) |
| 65 to 74 Years | 0 (0.0%) | 0 (0.0%) |
| 75 Years and over | 0 (0.0%) | 16 (50.0%) |
Disability Class: Vision Difficulty
| Age Bracket | Male | Female |
| Under 5 Years | 0 (0.0%) | 0 (0.0%) |
| 5 to 17 Years | 0 (0.0%) | 0 (0.0%) |
| 18 to 34 Years | 0 (0.0%) | 0 (0.0%) |
| 35 to 64 Years | 0 (0.0%) | 0 (0.0%) |
| 65 to 74 Years | 0 (0.0%) | 0 (0.0%) |
| 75 Years and over | 0 (0.0%) | 0 (0.0%) |
Disability Class: Cognitive Difficulty

| Age Bracket | Male | Female |
| 5 to 17 Years | 0 (0.0%) | 0 (0.0%) |
| 18 to 34 Years | 0 (0.0%) | 0 (0.0%) |
| 35 to 64 Years | 0 (0.0%) | 0 (0.0%) |
| 65 to 74 Years | 0 (0.0%) | 0 (0.0%) |
| 75 Years and over | 0 (0.0%) | 0 (0.0%) |
Disability Class: Ambulatory Difficulty
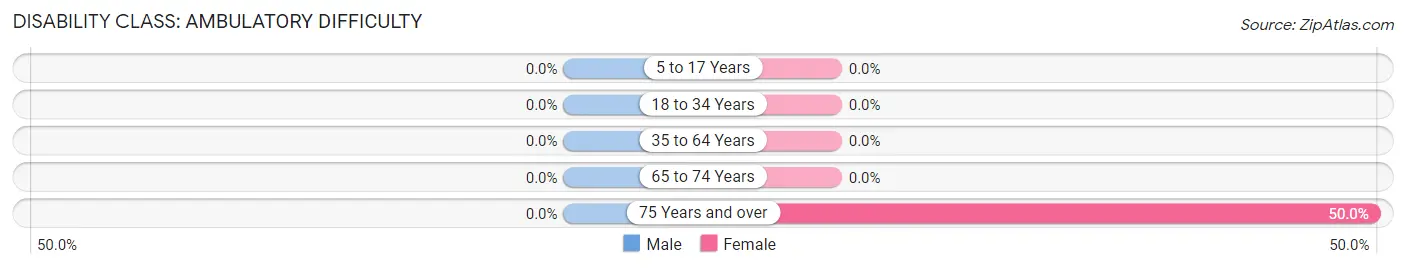
| Age Bracket | Male | Female |
| 5 to 17 Years | 0 (0.0%) | 0 (0.0%) |
| 18 to 34 Years | 0 (0.0%) | 0 (0.0%) |
| 35 to 64 Years | 0 (0.0%) | 0 (0.0%) |
| 65 to 74 Years | 0 (0.0%) | 0 (0.0%) |
| 75 Years and over | 0 (0.0%) | 16 (50.0%) |
Disability Class: Self-Care Difficulty
| Age Bracket | Male | Female |
| 5 to 17 Years | 0 (0.0%) | 0 (0.0%) |
| 18 to 34 Years | 0 (0.0%) | 0 (0.0%) |
| 35 to 64 Years | 0 (0.0%) | 0 (0.0%) |
| 65 to 74 Years | 0 (0.0%) | 0 (0.0%) |
| 75 Years and over | 0 (0.0%) | 0 (0.0%) |
Technology Access in Bier
Computing Device Access in Bier
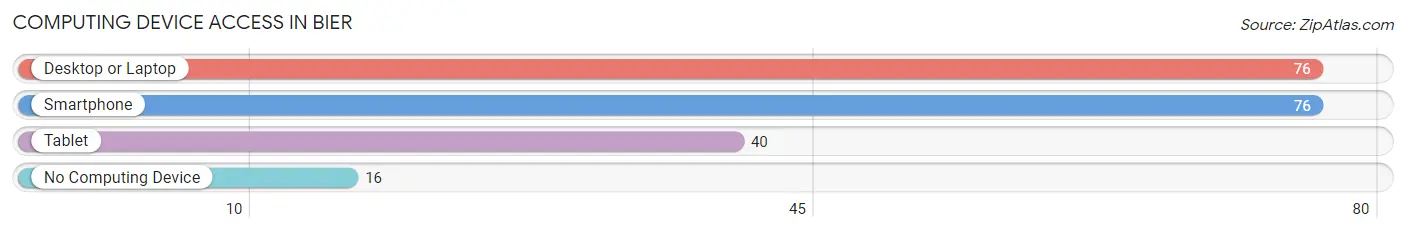
| Device Type | # Households | % Households |
| Desktop or Laptop | 76 | 82.6% |
| Smartphone | 76 | 82.6% |
| Tablet | 40 | 43.5% |
| No Computing Device | 16 | 17.4% |
| Total | 92 | 100.0% |
Internet Access in Bier
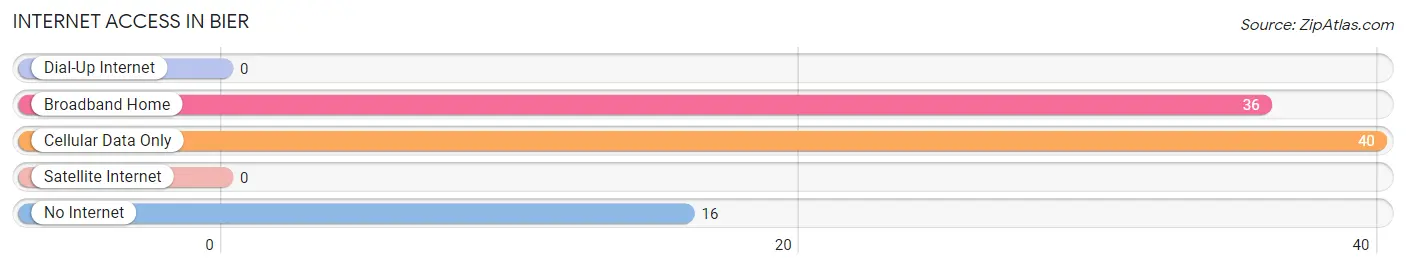
| Internet Type | # Households | % Households |
| Dial-Up Internet | 0 | 0.0% |
| Broadband Home | 36 | 39.1% |
| Cellular Data Only | 40 | 43.5% |
| Satellite Internet | 0 | 0.0% |
| No Internet | 16 | 17.4% |
| Total | 92 | 100.0% |
Bier Summary
The state of Maryland is located in the Mid-Atlantic region of the United States and is bordered by Virginia, West Virginia, Pennsylvania, Delaware, and Washington, D.C. It is the 42nd most populous state in the country, with a population of 6,006,401 as of 2019. Maryland is known for its diverse geography, ranging from the Appalachian Mountains in the west to the Chesapeake Bay and Atlantic Ocean in the east. The state is also home to a variety of industries, including agriculture, manufacturing, and technology.
Geography
Maryland is divided into two distinct geographic regions: the Eastern Shore and the Western Shore. The Eastern Shore is located on the Delmarva Peninsula and is bordered by the Chesapeake Bay and the Atlantic Ocean. It is home to a variety of wildlife, including bald eagles, ospreys, and blue crabs. The Western Shore is located on the mainland and is bordered by Virginia, West Virginia, and Pennsylvania. It is home to the Appalachian Mountains, which are part of the Appalachian Trail.
The state is also home to a variety of rivers, including the Potomac, Patuxent, and Susquehanna. The Chesapeake Bay is the largest estuary in the United States and is home to a variety of fish and other marine life.
History
Maryland was founded in 1634 by English settlers. It was one of the original 13 colonies and was the seventh state to ratify the U.S. Constitution. During the American Revolution, Maryland was a key battleground and was the site of the Battle of Baltimore in 1814.
During the Civil War, Maryland was a border state and was divided between the Union and the Confederacy. After the war, Maryland was the first state to ratify the Thirteenth Amendment, which abolished slavery.
Economy
Maryland has a diverse economy, with a variety of industries including agriculture, manufacturing, technology, and tourism. The state is home to a number of Fortune 500 companies, including Lockheed Martin, Marriott International, and Under Armour.
Agriculture is an important part of the state’s economy, with crops such as corn, soybeans, and wheat being grown in the state. Maryland is also home to a number of manufacturing companies, including General Motors, Procter & Gamble, and McCormick & Company.
The state is also home to a number of technology companies, including Northrop Grumman, Booz Allen Hamilton, and Leidos. Tourism is also an important part of the state’s economy, with attractions such as the National Aquarium, the Baltimore Museum of Art, and the Chesapeake Bay Maritime Museum.
Demographics
As of 2019, the population of Maryland was 6,006,401, making it the 42nd most populous state in the country. The state is home to a variety of ethnic and racial groups, including African Americans, Hispanics, Asians, and Native Americans.
The median household income in Maryland is $80,776, which is higher than the national median of $61,937. The poverty rate in the state is 8.7%, which is lower than the national average of 11.8%.
Conclusion
Maryland is a diverse state with a rich history, varied geography, and a thriving economy. It is home to a variety of industries, including agriculture, manufacturing, and technology. The state is also home to a variety of ethnic and racial groups, with a median household income that is higher than the national average. Maryland is an important part of the Mid-Atlantic region and is an important contributor to the U.S. economy.
Common Questions
What is Per Capita Income in Bier?
Per Capita income in Bier is $42,191.
What is the Median Family Income in Bier?
Median Family Income in Bier is $91,375.
What is the Median Household income in Bier?
Median Household Income in Bier is $90,875.
What is Income or Wage Gap in Bier?
Income or Wage Gap in Bier is 58.6%.
Women in Bier earn 41.4 cents for every dollar earned by a man.
What is Inequality or Gini Index in Bier?
Inequality or Gini Index in Bier is 0.20.
What is the Total Population of Bier?
Total Population of Bier is 214.
What is the Total Male Population of Bier?
Total Male Population of Bier is 106.
What is the Total Female Population of Bier?
Total Female Population of Bier is 108.
What is the Ratio of Males per 100 Females in Bier?
There are 98.15 Males per 100 Females in Bier.
What is the Ratio of Females per 100 Males in Bier?
There are 101.89 Females per 100 Males in Bier.
What is the Median Population Age in Bier?
Median Population Age in Bier is 29.8 Years.
What is the Average Family Size in Bier
Average Family Size in Bier is 2.6 People.
What is the Average Household Size in Bier
Average Household Size in Bier is 2.3 People.
How Large is the Labor Force in Bier?
There are 182 People in the Labor Forcein in Bier.
What is the Percentage of People in the Labor Force in Bier?
85.0% of People are in the Labor Force in Bier.