Zip Codes with the Highest Percentage of Population Employed in Computer, Engineering & Science in Bowie, MD

RELATED REPORTS & OPTIONS

Computer, Engineering & Science
Population
Families and Households
Female Fertility
Female Fertility (Unmarried)
Race (Community Size)
Race (Percentage)
Ancestry (Community Size)
AfricanAmericanArabArgentineanArmenianAustrianBahamianBarbadianBelgianBhutaneseBlackfeetBolivianBritishBritish West IndianBurmeseCanadianCape VerdeanCelticCentral AmericanCentral American IndianCherokeeColombianCosta RicanCroatianCubanCzechDanishDominicanDutchEastern EuropeanEgyptianEnglishEthiopianEuropeanFinnishFrenchFrench CanadianGermanGhanaianGreekGuatemalanGuyaneseHaitianHonduranHungarianIndian (Asian)IranianIrishItalianJamaicanKenyanKoreanLebaneseLiberianLithuanianLumbeeMexicanNigerianNorthern EuropeanNorwegianPalestinianPanamanianPeruvianPolishPortuguesePuerto RicanRussianSalvadoranScandinavianScotch-IrishScottishSenegaleseSierra LeoneanSlovakSouth AfricanSouth AmericanSouth American IndianSpaniardSpanishSri LankanSubsaharan AfricanSwedishSwissThaiTrinidadian and TobagonianU.S. Virgin IslanderUkrainianVenezuelanWelshWest Indian
Ancestry (Percentage)
AfricanAmericanArabArgentineanArmenianAustrianBahamianBarbadianBelgianBhutaneseBlackfeetBolivianBritishBritish West IndianBurmeseCanadianCape VerdeanCelticCentral AmericanCentral American IndianCherokeeColombianCosta RicanCroatianCubanCzechDanishDominicanDutchEastern EuropeanEgyptianEnglishEthiopianEuropeanFinnishFrenchFrench CanadianGermanGhanaianGreekGuatemalanGuyaneseHaitianHonduranHungarianIndian (Asian)IranianIrishItalianJamaicanKenyanKoreanLebaneseLiberianLithuanianLumbeeMexicanNigerianNorthern EuropeanNorwegianPalestinianPanamanianPeruvianPolishPortuguesePuerto RicanRussianSalvadoranScandinavianScotch-IrishScottishSenegaleseSierra LeoneanSlovakSouth AfricanSouth AmericanSouth American IndianSpaniardSpanishSri LankanSubsaharan AfricanSwedishSwissThaiTrinidadian and TobagonianU.S. Virgin IslanderUkrainianVenezuelanWelshWest Indian
Immigrant Origin (Total)
Immigrant Origin (Percentage)
Income
Income (Families)
Income (Households)
Poverty
Poverty (Families)
Unemployment
Employment Occupations
Employment Industries
Employer Class
Commute Time
Commute Means
School Enrollment
Education by Degree Field
Occupancy
Finances
Physical Characteristics
Bowie
Compare Zip Codes
Comparison Subject

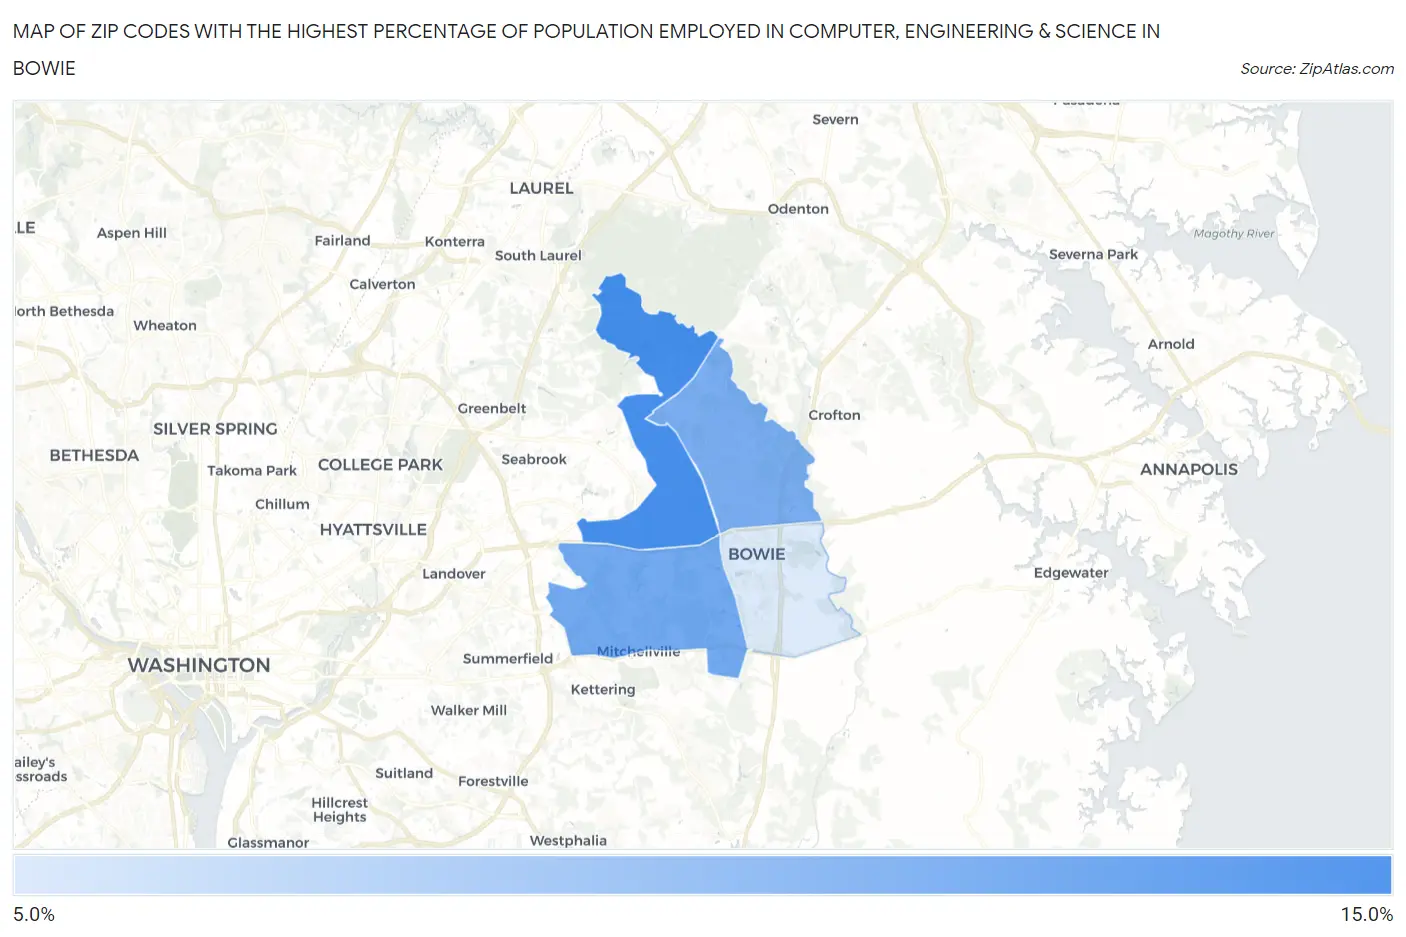
Map of Zip Codes with the Highest Percentage of Population Employed in Computer, Engineering & Science in Bowie

0.0%
15.0%
Zip Codes with the Highest Percentage of Population Employed in Computer, Engineering & Science in Bowie Map

Zip Codes with the Highest Percentage of Population Employed in Computer, Engineering & Science in Bowie, MD

Zip Code % Employed vs State vs National
1.2072014.1%10.7%(+3.43)#786.8%(+7.34)#1,310
2.2072112.4%10.7%(+1.75)#1026.8%(+5.66)#1,853
3.2071512.1%10.7%(+1.46)#1106.8%(+5.37)#1,972
4.207168.3%10.7%(-2.33)#2176.8%(+1.58)#4,788

Common Questions

What are the Top 3 Zip Codes with the Highest Percentage of Population Employed in Computer, Engineering & Science in Bowie, MD?
Top 3 Zip Codes with the Highest Percentage of Population Employed in Computer, Engineering & Science in Bowie, MD are:
#1
14.1%
#2
12.4%
#3
12.1%
What zip code has the Highest Percentage of Population Employed in Computer, Engineering & Science in Bowie, MD?
20720 has the Highest Percentage of Population Employed in Computer, Engineering & Science in Bowie, MD with 14.1%.
What is the Percentage of Population Employed in Computer, Engineering & Science in Bowie, MD?
Percentage of Population Employed in Computer, Engineering & Science in Bowie is 11.4%.
What is the Percentage of Population Employed in Computer, Engineering & Science in Maryland?
Percentage of Population Employed in Computer, Engineering & Science in Maryland is 10.7%.
What is the Percentage of Population Employed in Computer, Engineering & Science in the United States?
Percentage of Population Employed in Computer, Engineering & Science in the United States is 6.8%.