Berwyn Heights, MD Map & Demographics
Berwyn Heights Map
Berwyn Heights Overview
$45,548
PER CAPITA INCOME
$135,756
AVG FAMILY INCOME
$132,625
AVG HOUSEHOLD INCOME
16.8%
WAGE / INCOME GAP [ % ]
83.2¢/ $1
WAGE / INCOME GAP [ $ ]
0.35
INEQUALITY / GINI INDEX
3,312
TOTAL POPULATION
1,837
MALE POPULATION
1,475
FEMALE POPULATION
124.54
MALES / 100 FEMALES
80.29
FEMALES / 100 MALES
34.1
MEDIAN AGE
4.0
AVG FAMILY SIZE
3.4
AVG HOUSEHOLD SIZE
1,760
LABOR FORCE [ PEOPLE ]
70.9%
PERCENT IN LABOR FORCE
4.8%
UNEMPLOYMENT RATE
Income in Berwyn Heights
Income Overview in Berwyn Heights
Per Capita Income in Berwyn Heights is $45,548, while median incomes of families and households are $135,756 and $132,625 respectively.
| Characteristic | Number | Measure |
| Per Capita Income | 3,312 | $45,548 |
| Median Family Income | 634 | $135,756 |
| Mean Family Income | 634 | $154,834 |
| Median Household Income | 960 | $132,625 |
| Mean Household Income | 960 | $151,964 |
| Income Deficit | 634 | $0 |
| Wage / Income Gap (%) | 3,312 | 16.78% |
| Wage / Income Gap ($) | 3,312 | 83.22¢ per $1 |
| Gini / Inequality Index | 3,312 | 0.35 |
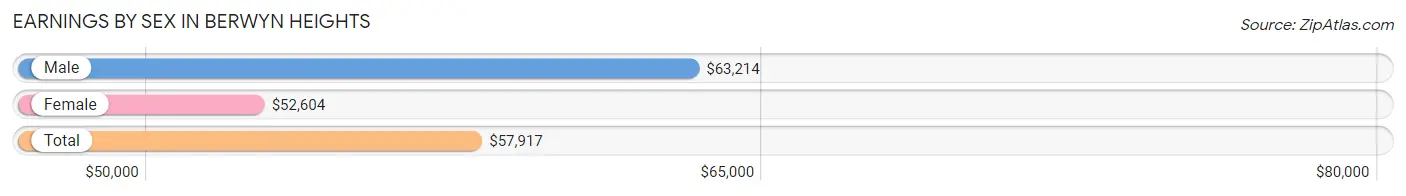
Earnings by Sex in Berwyn Heights
Average Earnings in Berwyn Heights are $57,917, $63,214 for men and $52,604 for women, a difference of 16.8%.
| Sex | Number | Average Earnings |
| Male | 1,164 (63.2%) | $63,214 |
| Female | 678 (36.8%) | $52,604 |
| Total | 1,842 (100.0%) | $57,917 |
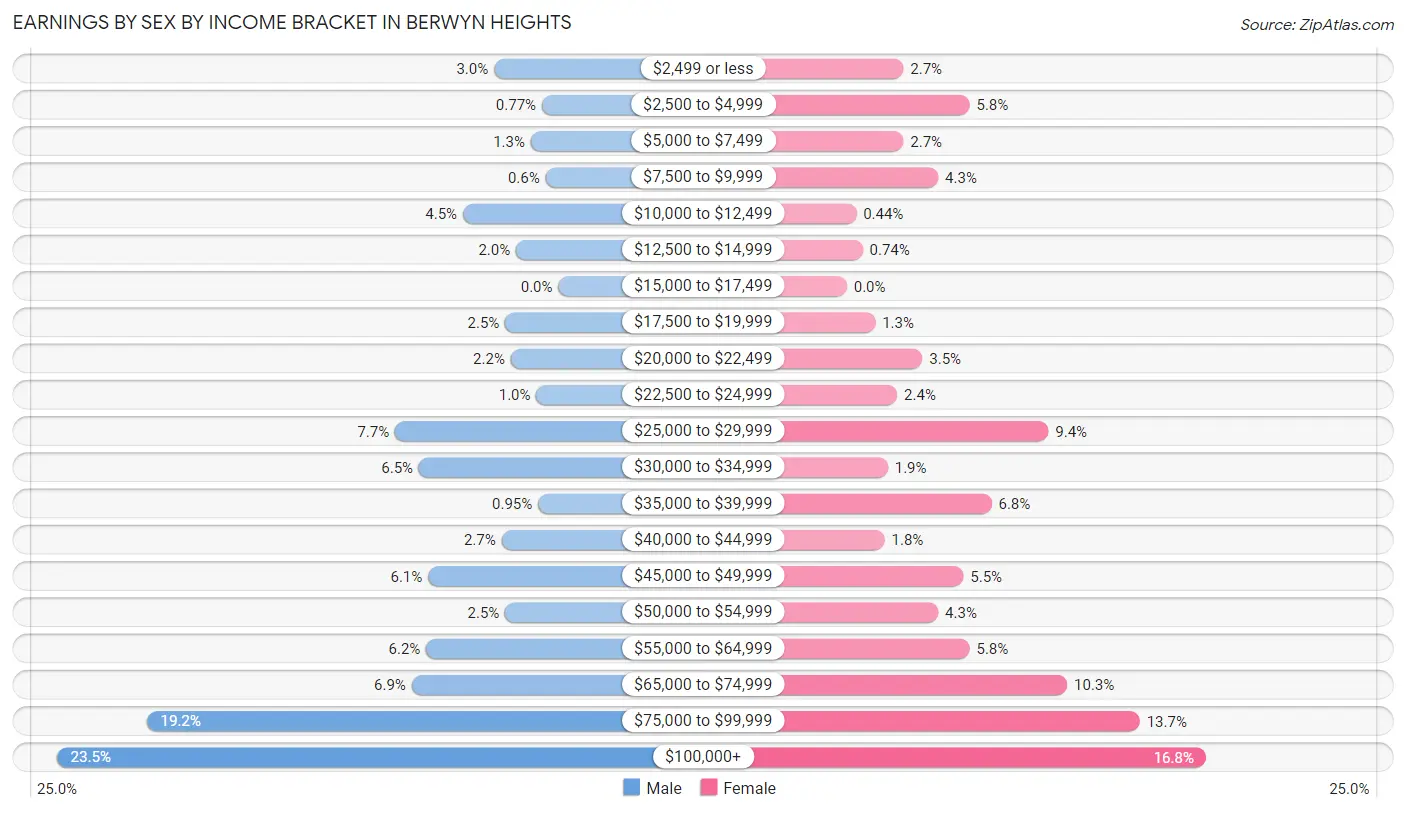
Earnings by Sex by Income Bracket in Berwyn Heights
The most common earnings brackets in Berwyn Heights are $100,000+ for men (273 | 23.4%) and $100,000+ for women (114 | 16.8%).
| Income | Male | Female |
| $2,499 or less | 35 (3.0%) | 18 (2.6%) |
| $2,500 to $4,999 | 9 (0.8%) | 39 (5.8%) |
| $5,000 to $7,499 | 15 (1.3%) | 18 (2.6%) |
| $7,500 to $9,999 | 7 (0.6%) | 29 (4.3%) |
| $10,000 to $12,499 | 52 (4.5%) | 3 (0.4%) |
| $12,500 to $14,999 | 23 (2.0%) | 5 (0.7%) |
| $15,000 to $17,499 | 0 (0.0%) | 0 (0.0%) |
| $17,500 to $19,999 | 29 (2.5%) | 9 (1.3%) |
| $20,000 to $22,499 | 26 (2.2%) | 24 (3.5%) |
| $22,500 to $24,999 | 12 (1.0%) | 16 (2.4%) |
| $25,000 to $29,999 | 89 (7.6%) | 64 (9.4%) |
| $30,000 to $34,999 | 76 (6.5%) | 13 (1.9%) |
| $35,000 to $39,999 | 11 (0.9%) | 46 (6.8%) |
| $40,000 to $44,999 | 31 (2.7%) | 12 (1.8%) |
| $45,000 to $49,999 | 71 (6.1%) | 37 (5.5%) |
| $50,000 to $54,999 | 29 (2.5%) | 29 (4.3%) |
| $55,000 to $64,999 | 72 (6.2%) | 39 (5.8%) |
| $65,000 to $74,999 | 80 (6.9%) | 70 (10.3%) |
| $75,000 to $99,999 | 224 (19.2%) | 93 (13.7%) |
| $100,000+ | 273 (23.4%) | 114 (16.8%) |
| Total | 1,164 (100.0%) | 678 (100.0%) |
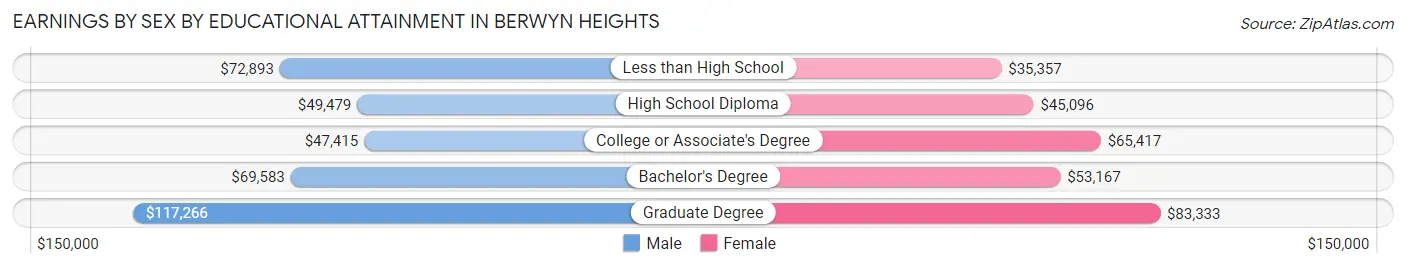
Earnings by Sex by Educational Attainment in Berwyn Heights
Average earnings in Berwyn Heights are $73,903 for men and $58,047 for women, a difference of 21.5%. Men with an educational attainment of graduate degree enjoy the highest average annual earnings of $117,266, while those with college or associate's degree education earn the least with $47,415. Women with an educational attainment of graduate degree earn the most with the average annual earnings of $83,333, while those with less than high school education have the smallest earnings of $35,357.
| Educational Attainment | Male Income | Female Income |
| Less than High School | $72,893 | $35,357 |
| High School Diploma | $49,479 | $45,096 |
| College or Associate's Degree | $47,415 | $65,417 |
| Bachelor's Degree | $69,583 | $53,167 |
| Graduate Degree | $117,266 | $83,333 |
| Total | $73,903 | $58,047 |
Family Income in Berwyn Heights
Family Income Brackets in Berwyn Heights
According to the Berwyn Heights family income data, there are 177 families falling into the $100,000 to $149,999 income range, which is the most common income bracket and makes up 27.9% of all families.
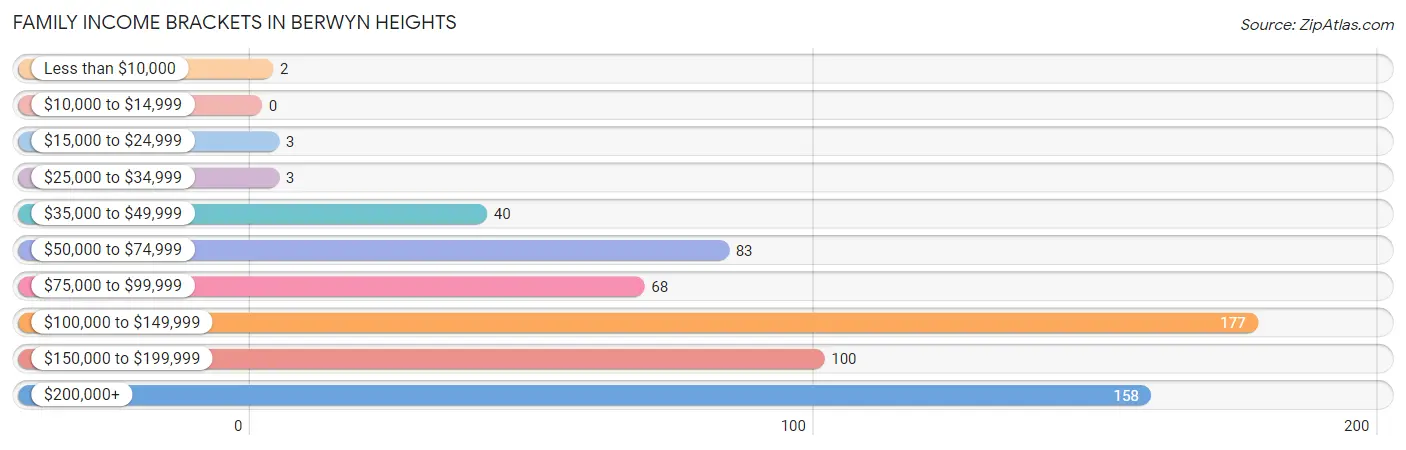
| Income Bracket | # Families | % Families |
| Less than $10,000 | 2 | 0.3% |
| $10,000 to $14,999 | 0 | 0.0% |
| $15,000 to $24,999 | 3 | 0.5% |
| $25,000 to $34,999 | 3 | 0.5% |
| $35,000 to $49,999 | 40 | 6.3% |
| $50,000 to $74,999 | 83 | 13.1% |
| $75,000 to $99,999 | 68 | 10.7% |
| $100,000 to $149,999 | 177 | 27.9% |
| $150,000 to $199,999 | 100 | 15.8% |
| $200,000+ | 158 | 24.9% |
Family Income by Famaliy Size in Berwyn Heights
7+ person families (57 | 9.0%) account for the highest median family income in Berwyn Heights with $174,539 per family, while 2-person families (240 | 37.9%) have the highest median income of $68,125 per family member.
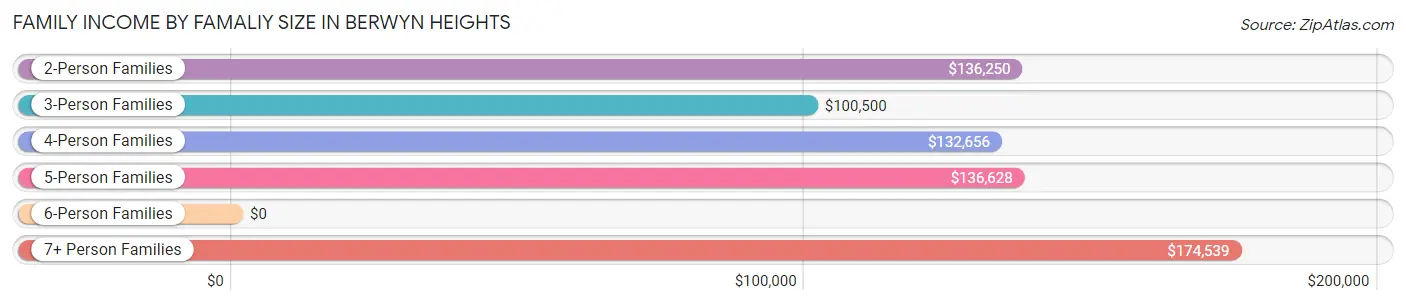
| Income Bracket | # Families | Median Income |
| 2-Person Families | 240 (37.9%) | $136,250 |
| 3-Person Families | 118 (18.6%) | $100,500 |
| 4-Person Families | 57 (9.0%) | $132,656 |
| 5-Person Families | 80 (12.6%) | $136,628 |
| 6-Person Families | 82 (12.9%) | $0 |
| 7+ Person Families | 57 (9.0%) | $174,539 |
| Total | 634 (100.0%) | $135,756 |
Family Income by Number of Earners in Berwyn Heights
The median family income in Berwyn Heights is $135,756, with families comprising 3+ earners (192) having the highest median family income of $174,342, while families with 1 earner (156) have the lowest median family income of $96,136, accounting for 30.3% and 24.6% of families, respectively.
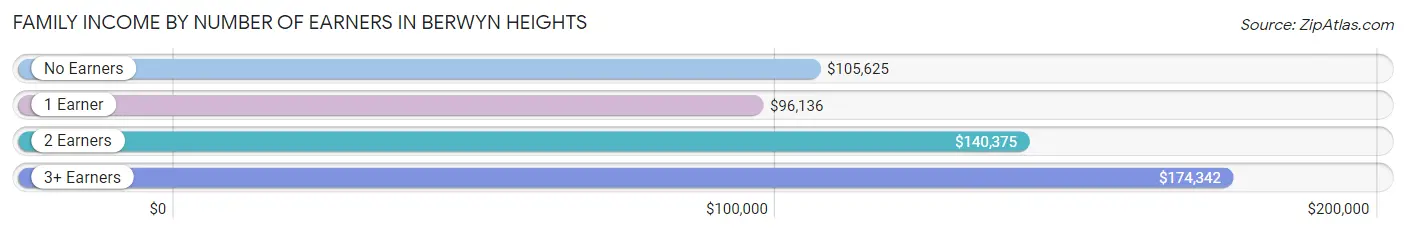
| Number of Earners | # Families | Median Income |
| No Earners | 47 (7.4%) | $105,625 |
| 1 Earner | 156 (24.6%) | $96,136 |
| 2 Earners | 239 (37.7%) | $140,375 |
| 3+ Earners | 192 (30.3%) | $174,342 |
| Total | 634 (100.0%) | $135,756 |
Household Income in Berwyn Heights
Household Income Brackets in Berwyn Heights
With 255 households falling in the category, the $200,000+ income range is the most frequent in Berwyn Heights, accounting for 26.6% of all households.
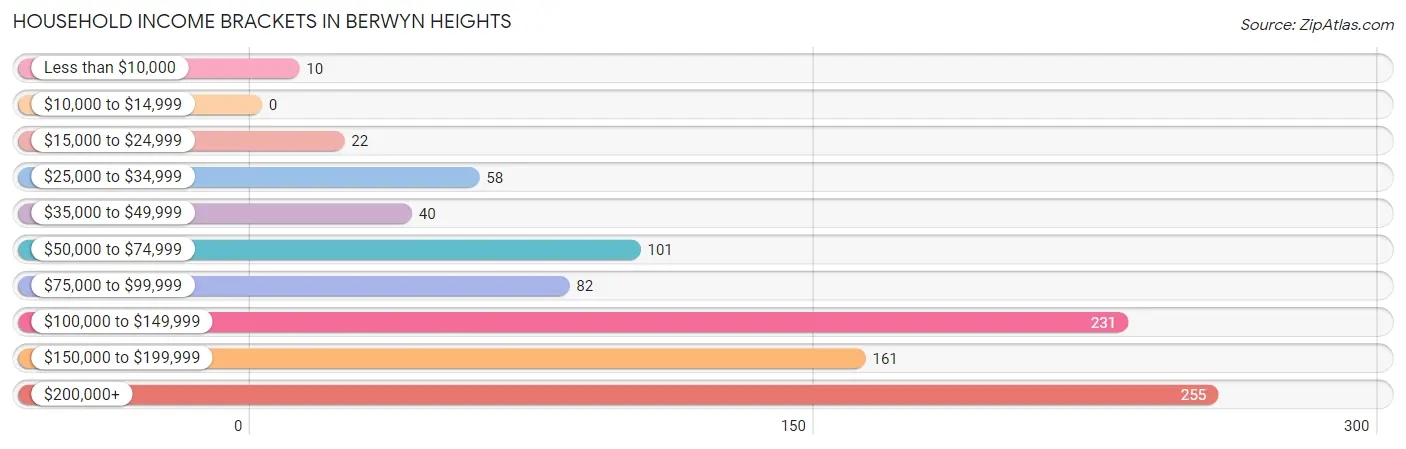
| Income Bracket | # Households | % Households |
| Less than $10,000 | 10 | 1.0% |
| $10,000 to $14,999 | 0 | 0.0% |
| $15,000 to $24,999 | 22 | 2.3% |
| $25,000 to $34,999 | 58 | 6.0% |
| $35,000 to $49,999 | 40 | 4.2% |
| $50,000 to $74,999 | 101 | 10.5% |
| $75,000 to $99,999 | 82 | 8.5% |
| $100,000 to $149,999 | 231 | 24.1% |
| $150,000 to $199,999 | 161 | 16.8% |
| $200,000+ | 255 | 26.6% |
Household Income by Householder Age in Berwyn Heights
The median household income in Berwyn Heights is $132,625, with the highest median household income of $147,708 found in the 45 to 64 years age bracket for the primary householder. A total of 503 households (52.4%) fall into this category. Meanwhile, the 15 to 24 years age bracket for the primary householder has the lowest median household income of $0, with 3 households (0.3%) in this group.
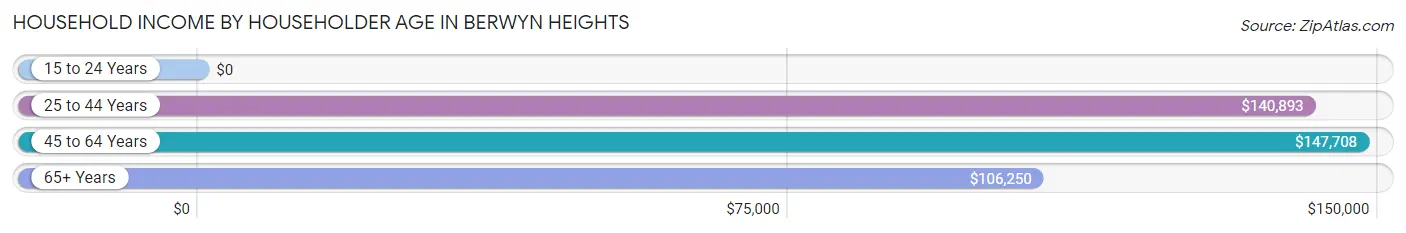
| Income Bracket | # Households | Median Income |
| 15 to 24 Years | 3 (0.3%) | $0 |
| 25 to 44 Years | 244 (25.4%) | $140,893 |
| 45 to 64 Years | 503 (52.4%) | $147,708 |
| 65+ Years | 210 (21.9%) | $106,250 |
| Total | 960 (100.0%) | $132,625 |
Poverty in Berwyn Heights
Income Below Poverty by Sex and Age in Berwyn Heights
With 4.6% poverty level for males and 6.7% for females among the residents of Berwyn Heights, 65 to 74 year old males and 18 to 24 year old females are the most vulnerable to poverty, with 16 males (16.5%) and 29 females (25.9%) in their respective age groups living below the poverty level.
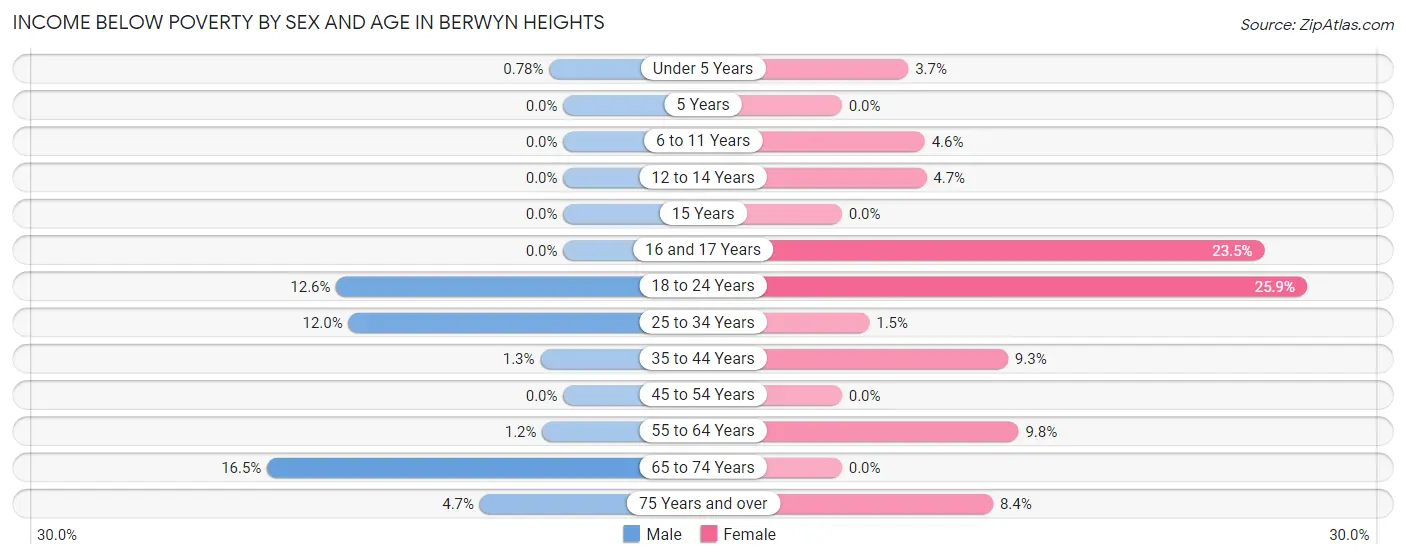
| Age Bracket | Male | Female |
| Under 5 Years | 2 (0.8%) | 4 (3.7%) |
| 5 Years | 0 (0.0%) | 0 (0.0%) |
| 6 to 11 Years | 0 (0.0%) | 6 (4.6%) |
| 12 to 14 Years | 0 (0.0%) | 4 (4.7%) |
| 15 Years | 0 (0.0%) | 0 (0.0%) |
| 16 and 17 Years | 0 (0.0%) | 4 (23.5%) |
| 18 to 24 Years | 22 (12.6%) | 29 (25.9%) |
| 25 to 34 Years | 36 (12.0%) | 4 (1.5%) |
| 35 to 44 Years | 3 (1.3%) | 16 (9.2%) |
| 45 to 54 Years | 0 (0.0%) | 0 (0.0%) |
| 55 to 64 Years | 3 (1.2%) | 24 (9.8%) |
| 65 to 74 Years | 16 (16.5%) | 0 (0.0%) |
| 75 Years and over | 2 (4.6%) | 8 (8.4%) |
| Total | 84 (4.6%) | 99 (6.7%) |
Income Above Poverty by Sex and Age in Berwyn Heights
According to the poverty statistics in Berwyn Heights, males aged 5 years and females aged 5 years are the age groups that are most secure financially, with 100.0% of males and 100.0% of females in these age groups living above the poverty line.
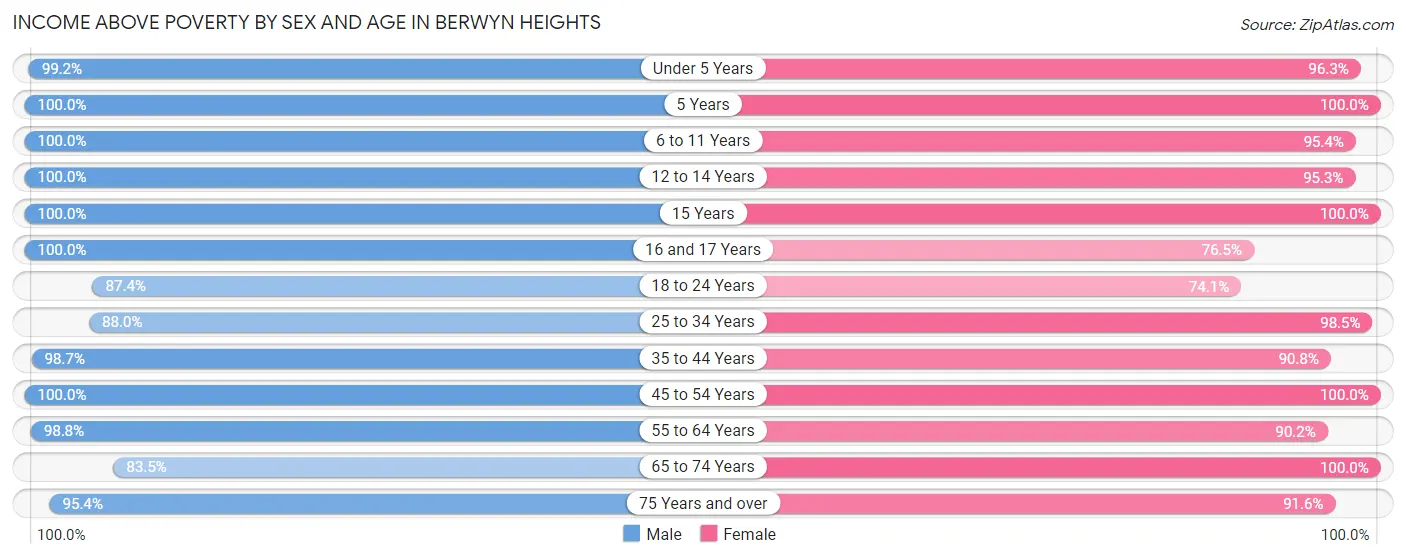
| Age Bracket | Male | Female |
| Under 5 Years | 256 (99.2%) | 104 (96.3%) |
| 5 Years | 49 (100.0%) | 18 (100.0%) |
| 6 to 11 Years | 95 (100.0%) | 124 (95.4%) |
| 12 to 14 Years | 70 (100.0%) | 81 (95.3%) |
| 15 Years | 8 (100.0%) | 9 (100.0%) |
| 16 and 17 Years | 7 (100.0%) | 13 (76.5%) |
| 18 to 24 Years | 152 (87.4%) | 83 (74.1%) |
| 25 to 34 Years | 265 (88.0%) | 257 (98.5%) |
| 35 to 44 Years | 231 (98.7%) | 157 (90.7%) |
| 45 to 54 Years | 244 (100.0%) | 126 (100.0%) |
| 55 to 64 Years | 254 (98.8%) | 220 (90.2%) |
| 65 to 74 Years | 81 (83.5%) | 91 (100.0%) |
| 75 Years and over | 41 (95.4%) | 87 (91.6%) |
| Total | 1,753 (95.4%) | 1,370 (93.3%) |
Income Below Poverty Among Married-Couple Families in Berwyn Heights
The poverty statistics for married-couple families in Berwyn Heights show that 0.7% or 3 of the total 436 families live below the poverty line. Families with 5 or more children have the highest poverty rate of 100.0%, comprising of 3 families. On the other hand, families with no children have the lowest poverty rate of 0.0%, which includes 0 families.
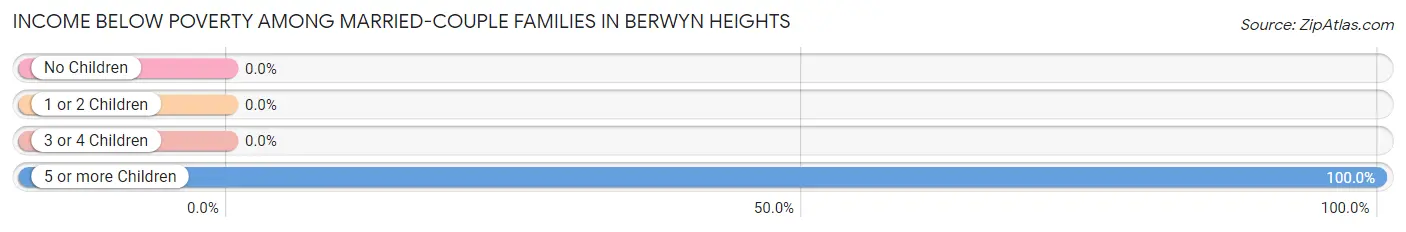
| Children | Above Poverty | Below Poverty |
| No Children | 208 (100.0%) | 0 (0.0%) |
| 1 or 2 Children | 166 (100.0%) | 0 (0.0%) |
| 3 or 4 Children | 59 (100.0%) | 0 (0.0%) |
| 5 or more Children | 0 (0.0%) | 3 (100.0%) |
| Total | 433 (99.3%) | 3 (0.7%) |
Income Below Poverty Among Single-Parent Households in Berwyn Heights
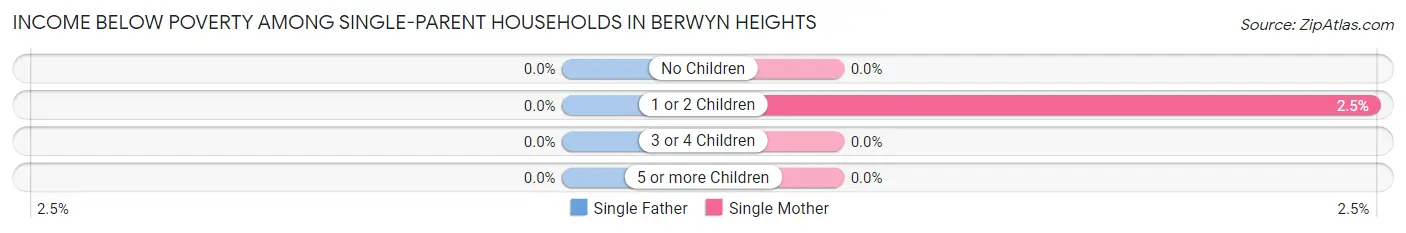
| Children | Single Father | Single Mother |
| No Children | 0 (0.0%) | 0 (0.0%) |
| 1 or 2 Children | 0 (0.0%) | 2 (2.5%) |
| 3 or 4 Children | 0 (0.0%) | 0 (0.0%) |
| 5 or more Children | 0 (0.0%) | 0 (0.0%) |
| Total | 0 (0.0%) | 2 (1.6%) |
Income Below Poverty Among Married-Couple vs Single-Parent Households in Berwyn Heights
The poverty data for Berwyn Heights shows that 3 of the married-couple family households (0.7%) and 2 of the single-parent households (1.0%) are living below the poverty level. Within the married-couple family households, those with 5 or more children have the highest poverty rate, with 3 households (100.0%) falling below the poverty line. Among the single-parent households, those with 1 or 2 children have the highest poverty rate, with 2 household (2.3%) living below poverty.
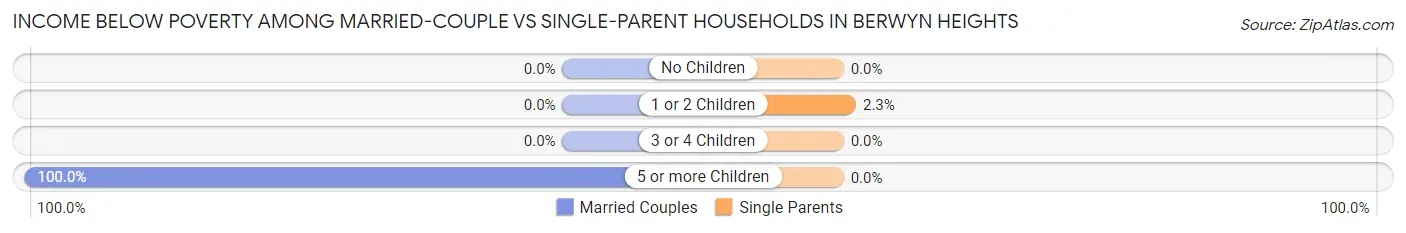
| Children | Married-Couple Families | Single-Parent Households |
| No Children | 0 (0.0%) | 0 (0.0%) |
| 1 or 2 Children | 0 (0.0%) | 2 (2.3%) |
| 3 or 4 Children | 0 (0.0%) | 0 (0.0%) |
| 5 or more Children | 3 (100.0%) | 0 (0.0%) |
| Total | 3 (0.7%) | 2 (1.0%) |
Race in Berwyn Heights
The most populous races in Berwyn Heights are Hispanic or Latino (1,629 | 49.2%), White / Caucasian (1,619 | 48.9%), and Some other Race (781 | 23.6%).
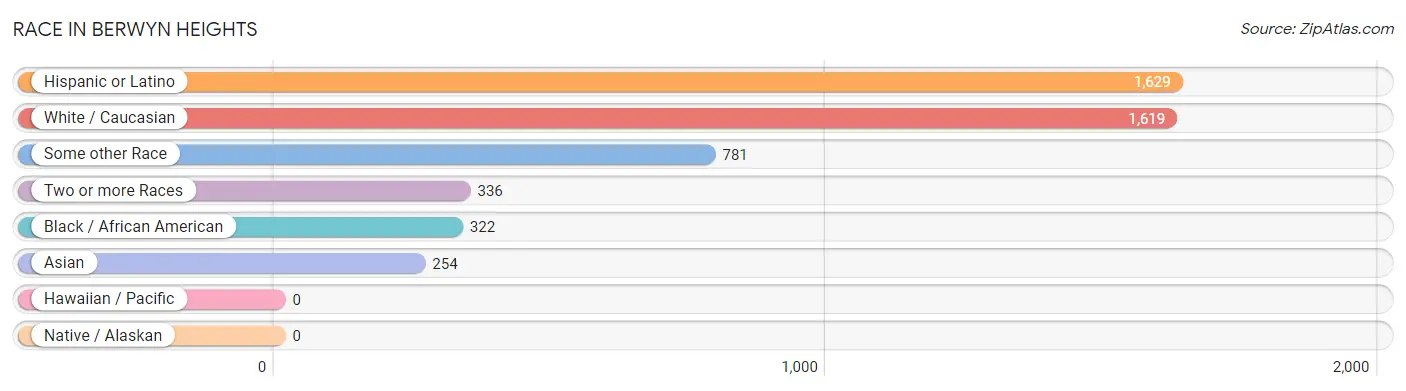
| Race | # Population | % Population |
| Asian | 254 | 7.7% |
| Black / African American | 322 | 9.7% |
| Hawaiian / Pacific | 0 | 0.0% |
| Hispanic or Latino | 1,629 | 49.2% |
| Native / Alaskan | 0 | 0.0% |
| White / Caucasian | 1,619 | 48.9% |
| Two or more Races | 336 | 10.1% |
| Some other Race | 781 | 23.6% |
| Total | 3,312 | 100.0% |
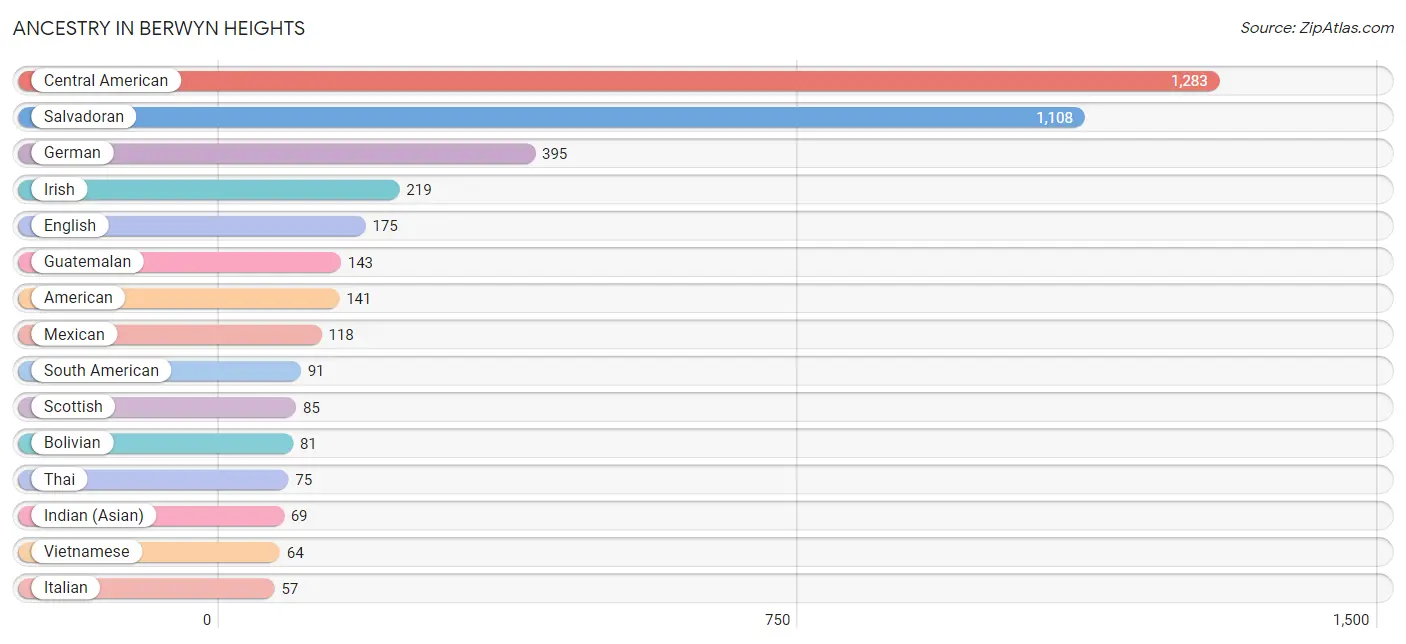
Ancestry in Berwyn Heights
The most populous ancestries reported in Berwyn Heights are Central American (1,283 | 38.7%), Salvadoran (1,108 | 33.5%), German (395 | 11.9%), Irish (219 | 6.6%), and English (175 | 5.3%), together accounting for 96.0% of all Berwyn Heights residents.
| Ancestry | # Population | % Population |
| African | 8 | 0.2% |
| American | 141 | 4.3% |
| Arab | 12 | 0.4% |
| Austrian | 13 | 0.4% |
| Bhutanese | 13 | 0.4% |
| Bolivian | 81 | 2.5% |
| British | 14 | 0.4% |
| Burmese | 53 | 1.6% |
| Canadian | 14 | 0.4% |
| Central American | 1,283 | 38.7% |
| Central American Indian | 5 | 0.2% |
| Croatian | 3 | 0.1% |
| Cuban | 29 | 0.9% |
| Czech | 4 | 0.1% |
| Dominican | 22 | 0.7% |
| Dutch | 38 | 1.1% |
| Ecuadorian | 10 | 0.3% |
| Egyptian | 3 | 0.1% |
| English | 175 | 5.3% |
| European | 51 | 1.5% |
| French | 45 | 1.4% |
| French Canadian | 14 | 0.4% |
| German | 395 | 11.9% |
| Guatemalan | 143 | 4.3% |
| Hungarian | 4 | 0.1% |
| Indian (Asian) | 69 | 2.1% |
| Iranian | 4 | 0.1% |
| Irish | 219 | 6.6% |
| Italian | 57 | 1.7% |
| Jamaican | 26 | 0.8% |
| Japanese | 5 | 0.2% |
| Korean | 4 | 0.1% |
| Mexican | 118 | 3.6% |
| Moroccan | 9 | 0.3% |
| Native Hawaiian | 21 | 0.6% |
| Nicaraguan | 32 | 1.0% |
| Nigerian | 4 | 0.1% |
| Northern European | 23 | 0.7% |
| Norwegian | 8 | 0.2% |
| Pennsylvania German | 6 | 0.2% |
| Polish | 36 | 1.1% |
| Romanian | 6 | 0.2% |
| Russian | 18 | 0.5% |
| Salvadoran | 1,108 | 33.5% |
| Scotch-Irish | 23 | 0.7% |
| Scottish | 85 | 2.6% |
| Seminole | 9 | 0.3% |
| Serbian | 21 | 0.6% |
| Slovak | 24 | 0.7% |
| South African | 22 | 0.7% |
| South American | 91 | 2.8% |
| Spaniard | 11 | 0.3% |
| Sri Lankan | 54 | 1.6% |
| Subsaharan African | 34 | 1.0% |
| Swedish | 17 | 0.5% |
| Thai | 75 | 2.3% |
| Ukrainian | 12 | 0.4% |
| Vietnamese | 64 | 1.9% |
| Welsh | 18 | 0.5% |
| West Indian | 30 | 0.9% |
| Yugoslavian | 2 | 0.1% | View All 61 Rows |
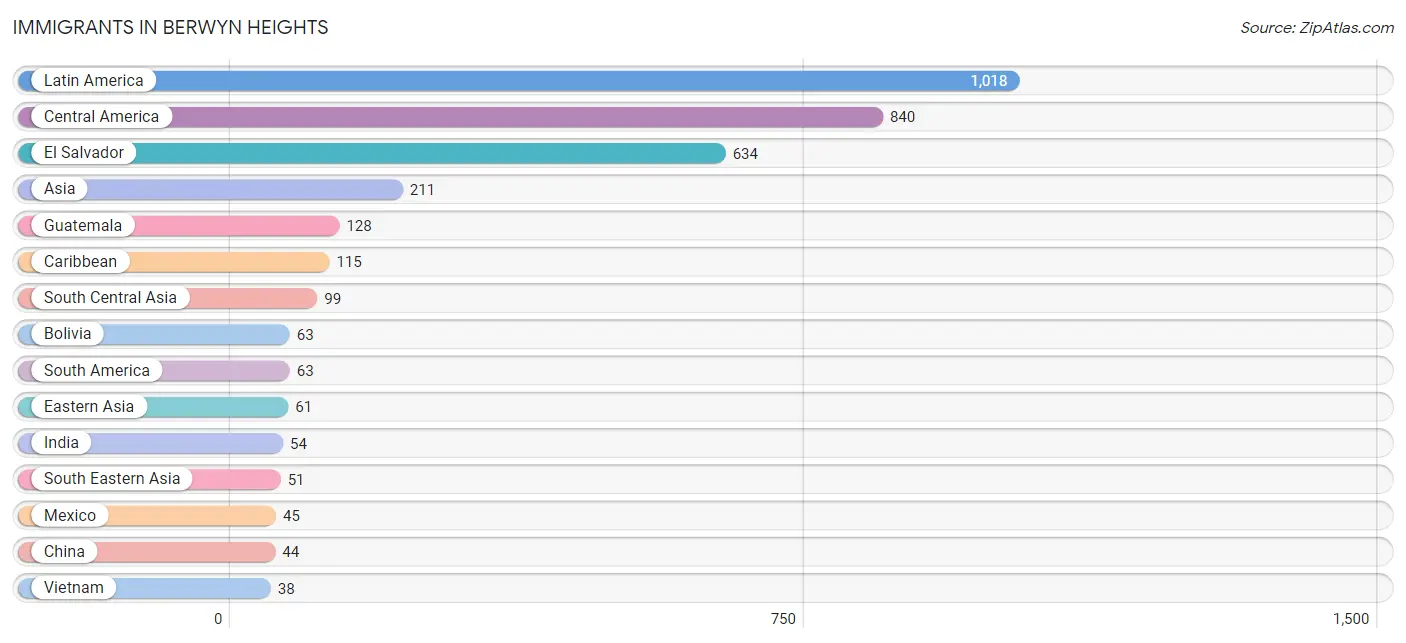
Immigrants in Berwyn Heights
The most numerous immigrant groups reported in Berwyn Heights came from Latin America (1,018 | 30.7%), Central America (840 | 25.4%), El Salvador (634 | 19.1%), Asia (211 | 6.4%), and Guatemala (128 | 3.9%), together accounting for 85.5% of all Berwyn Heights residents.
| Immigration Origin | # Population | % Population |
| Africa | 33 | 1.0% |
| Asia | 211 | 6.4% |
| Bangladesh | 31 | 0.9% |
| Bolivia | 63 | 1.9% |
| Caribbean | 115 | 3.5% |
| Central America | 840 | 25.4% |
| China | 44 | 1.3% |
| Cuba | 8 | 0.2% |
| Dominican Republic | 22 | 0.7% |
| Eastern Asia | 61 | 1.8% |
| Eastern Europe | 8 | 0.2% |
| Egypt | 3 | 0.1% |
| El Salvador | 634 | 19.1% |
| England | 2 | 0.1% |
| Europe | 22 | 0.7% |
| France | 2 | 0.1% |
| Germany | 5 | 0.2% |
| Guatemala | 128 | 3.9% |
| Honduras | 13 | 0.4% |
| India | 54 | 1.6% |
| Jamaica | 26 | 0.8% |
| Japan | 8 | 0.2% |
| Korea | 9 | 0.3% |
| Latin America | 1,018 | 30.7% |
| Mexico | 45 | 1.4% |
| Morocco | 4 | 0.1% |
| Netherlands | 5 | 0.2% |
| Nicaragua | 20 | 0.6% |
| Northern Africa | 7 | 0.2% |
| Northern Europe | 2 | 0.1% |
| Philippines | 13 | 0.4% |
| Serbia | 8 | 0.2% |
| South Africa | 26 | 0.8% |
| South America | 63 | 1.9% |
| South Central Asia | 99 | 3.0% |
| South Eastern Asia | 51 | 1.5% |
| Sri Lanka | 10 | 0.3% |
| Uzbekistan | 4 | 0.1% |
| Vietnam | 38 | 1.1% |
| Western Europe | 12 | 0.4% | View All 40 Rows |
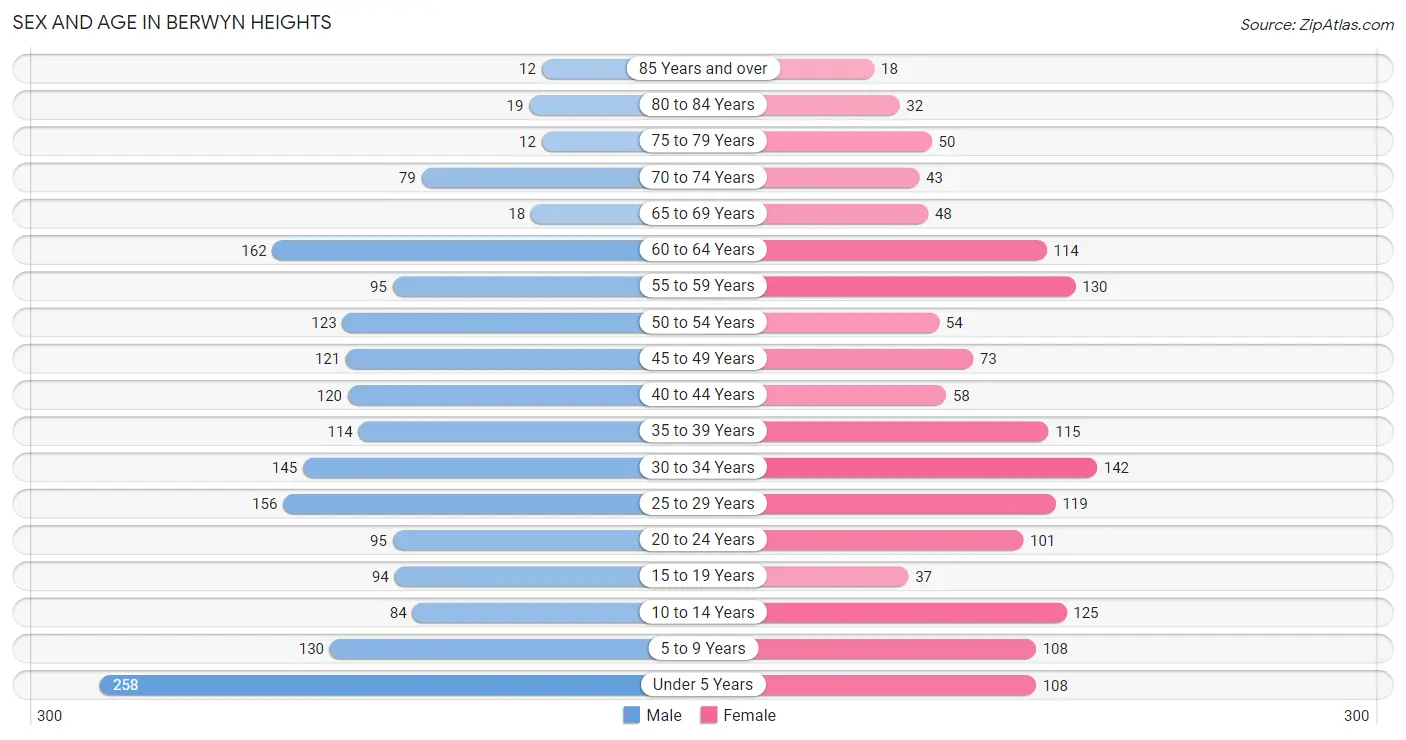
Sex and Age in Berwyn Heights
Sex and Age in Berwyn Heights
The most populous age groups in Berwyn Heights are Under 5 Years (258 | 14.0%) for men and 30 to 34 Years (142 | 9.6%) for women.
| Age Bracket | Male | Female |
| Under 5 Years | 258 (14.0%) | 108 (7.3%) |
| 5 to 9 Years | 130 (7.1%) | 108 (7.3%) |
| 10 to 14 Years | 84 (4.6%) | 125 (8.5%) |
| 15 to 19 Years | 94 (5.1%) | 37 (2.5%) |
| 20 to 24 Years | 95 (5.2%) | 101 (6.9%) |
| 25 to 29 Years | 156 (8.5%) | 119 (8.1%) |
| 30 to 34 Years | 145 (7.9%) | 142 (9.6%) |
| 35 to 39 Years | 114 (6.2%) | 115 (7.8%) |
| 40 to 44 Years | 120 (6.5%) | 58 (3.9%) |
| 45 to 49 Years | 121 (6.6%) | 73 (5.0%) |
| 50 to 54 Years | 123 (6.7%) | 54 (3.7%) |
| 55 to 59 Years | 95 (5.2%) | 130 (8.8%) |
| 60 to 64 Years | 162 (8.8%) | 114 (7.7%) |
| 65 to 69 Years | 18 (1.0%) | 48 (3.3%) |
| 70 to 74 Years | 79 (4.3%) | 43 (2.9%) |
| 75 to 79 Years | 12 (0.6%) | 50 (3.4%) |
| 80 to 84 Years | 19 (1.0%) | 32 (2.2%) |
| 85 Years and over | 12 (0.6%) | 18 (1.2%) |
| Total | 1,837 (100.0%) | 1,475 (100.0%) |
Families and Households in Berwyn Heights
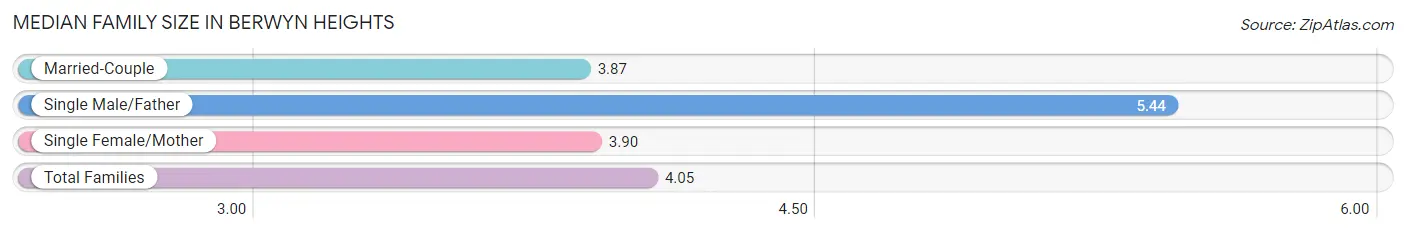
Median Family Size in Berwyn Heights
The median family size in Berwyn Heights is 4.05 persons per family, with single male/father families (72 | 11.4%) accounting for the largest median family size of 5.44 persons per family. On the other hand, married-couple families (436 | 68.8%) represent the smallest median family size with 3.87 persons per family.
| Family Type | # Families | Family Size |
| Married-Couple | 436 (68.8%) | 3.87 |
| Single Male/Father | 72 (11.4%) | 5.44 |
| Single Female/Mother | 126 (19.9%) | 3.90 |
| Total Families | 634 (100.0%) | 4.05 |
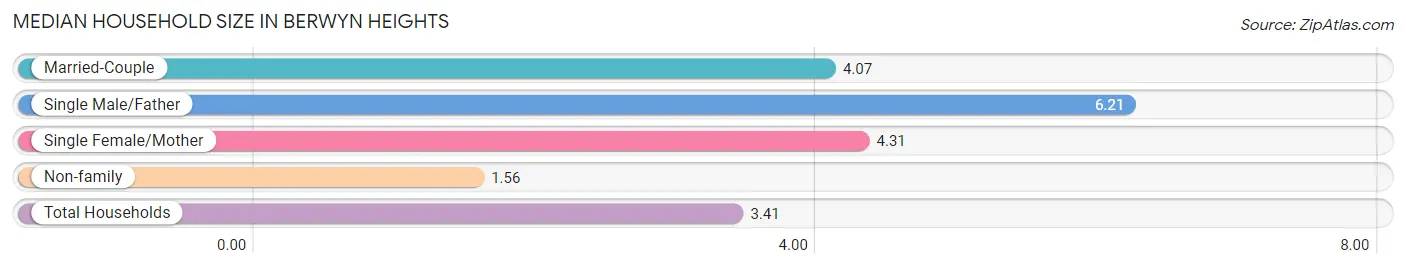
Median Household Size in Berwyn Heights
The median household size in Berwyn Heights is 3.41 persons per household, with single male/father households (72 | 7.5%) accounting for the largest median household size of 6.21 persons per household. non-family households (326 | 34.0%) represent the smallest median household size with 1.56 persons per household.
| Household Type | # Households | Household Size |
| Married-Couple | 436 (45.4%) | 4.07 |
| Single Male/Father | 72 (7.5%) | 6.21 |
| Single Female/Mother | 126 (13.1%) | 4.31 |
| Non-family | 326 (34.0%) | 1.56 |
| Total Households | 960 (100.0%) | 3.41 |
Household Size by Marriage Status in Berwyn Heights
Out of a total of 960 households in Berwyn Heights, 634 (66.0%) are family households, while 326 (34.0%) are nonfamily households. The most numerous type of family households are 2-person households, comprising 229, and the most common type of nonfamily households are 1-person households, comprising 224.
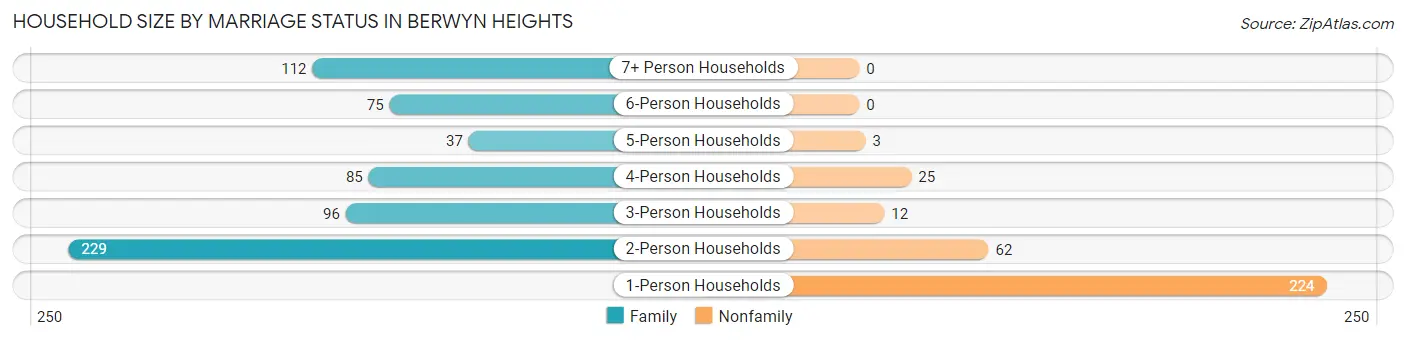
| Household Size | Family Households | Nonfamily Households |
| 1-Person Households | - | 224 (23.3%) |
| 2-Person Households | 229 (23.8%) | 62 (6.5%) |
| 3-Person Households | 96 (10.0%) | 12 (1.3%) |
| 4-Person Households | 85 (8.8%) | 25 (2.6%) |
| 5-Person Households | 37 (3.8%) | 3 (0.3%) |
| 6-Person Households | 75 (7.8%) | 0 (0.0%) |
| 7+ Person Households | 112 (11.7%) | 0 (0.0%) |
| Total | 634 (66.0%) | 326 (34.0%) |
Female Fertility in Berwyn Heights
Fertility by Age in Berwyn Heights
Average fertility rate in Berwyn Heights is 105.0 births per 1,000 women. Women in the age bracket of 20 to 34 years have the highest fertility rate with 160.0 births per 1,000 women. Women in the age bracket of 20 to 34 years acount for 85.3% of all women with births.
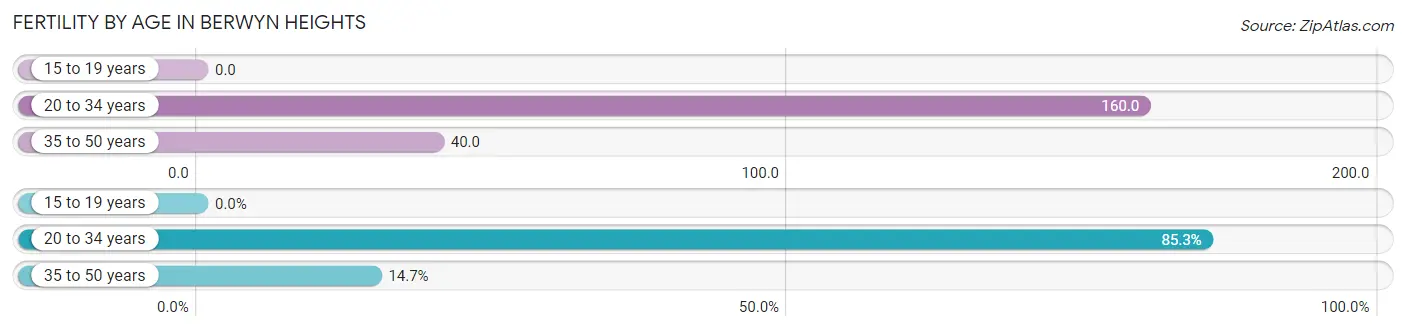
| Age Bracket | Women with Births | Births / 1,000 Women |
| 15 to 19 years | 0 (0.0%) | 0.0 |
| 20 to 34 years | 58 (85.3%) | 160.0 |
| 35 to 50 years | 10 (14.7%) | 40.0 |
| Total | 68 (100.0%) | 105.0 |
Fertility by Age by Marriage Status in Berwyn Heights
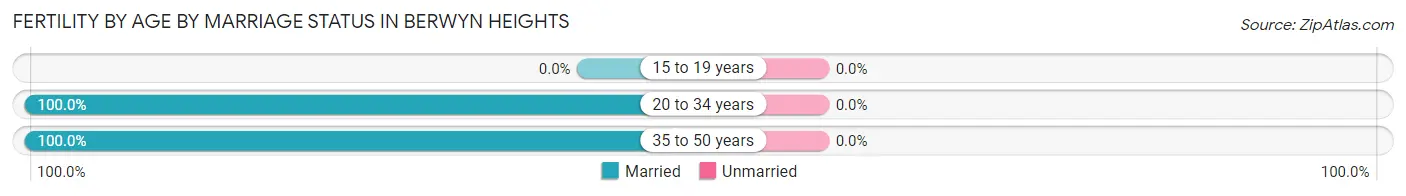
| Age Bracket | Married | Unmarried |
| 15 to 19 years | 0 (0.0%) | 0 (0.0%) |
| 20 to 34 years | 58 (100.0%) | 0 (0.0%) |
| 35 to 50 years | 10 (100.0%) | 0 (0.0%) |
| Total | 68 (100.0%) | 0 (0.0%) |
Fertility by Education in Berwyn Heights
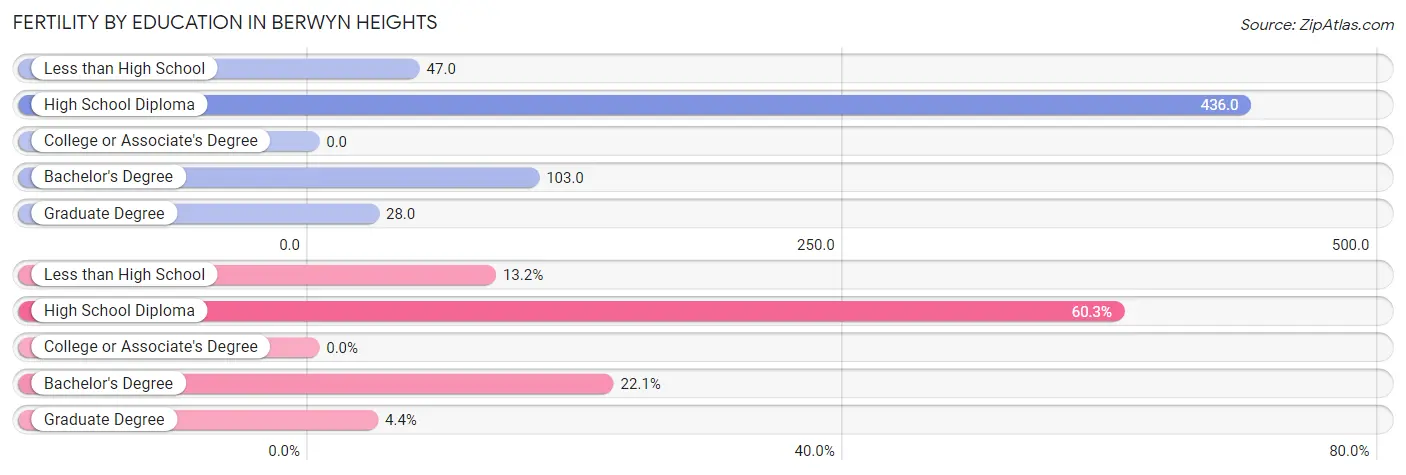
| Educational Attainment | Women with Births | Births / 1,000 Women |
| Less than High School | 9 (13.2%) | 47.0 |
| High School Diploma | 41 (60.3%) | 436.0 |
| College or Associate's Degree | 0 (0.0%) | 0.0 |
| Bachelor's Degree | 15 (22.1%) | 103.0 |
| Graduate Degree | 3 (4.4%) | 28.0 |
| Total | 68 (100.0%) | 105.0 |
Fertility by Education by Marriage Status in Berwyn Heights
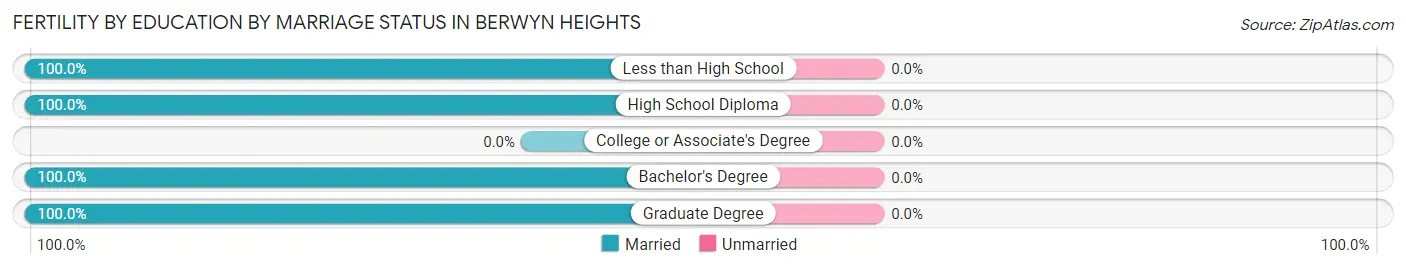
| Educational Attainment | Married | Unmarried |
| Less than High School | 9 (100.0%) | 0 (0.0%) |
| High School Diploma | 41 (100.0%) | 0 (0.0%) |
| College or Associate's Degree | 0 (0.0%) | 0 (0.0%) |
| Bachelor's Degree | 15 (100.0%) | 0 (0.0%) |
| Graduate Degree | 3 (100.0%) | 0 (0.0%) |
| Total | 68 (100.0%) | 0 (0.0%) |
Employment Characteristics in Berwyn Heights
Employment by Class of Employer in Berwyn Heights
Among the 1,643 employed individuals in Berwyn Heights, private company employees (740 | 45.0%), federal government employees (257 | 15.6%), and self-employed (not incorporated) (194 | 11.8%) make up the most common classes of employment.
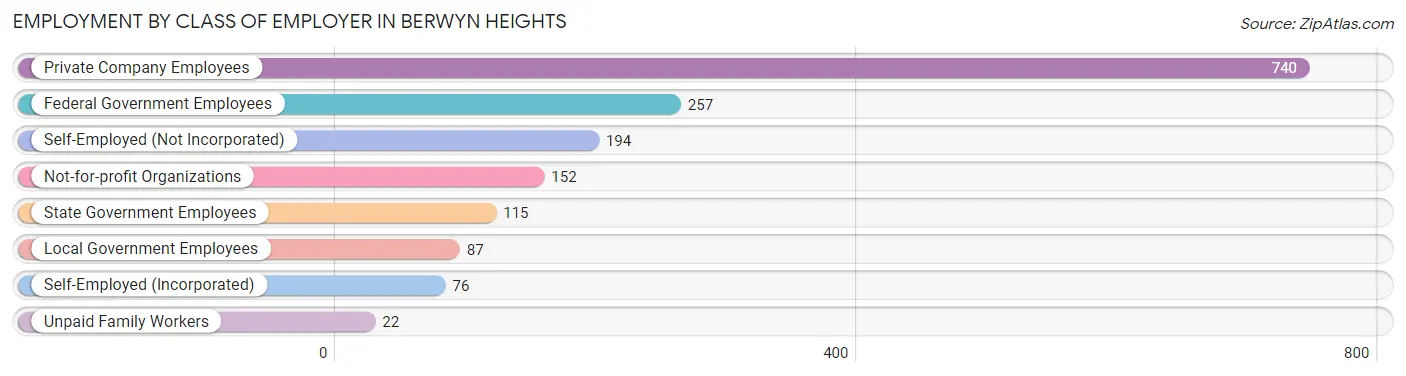
| Employer Class | # Employees | % Employees |
| Private Company Employees | 740 | 45.0% |
| Self-Employed (Incorporated) | 76 | 4.6% |
| Self-Employed (Not Incorporated) | 194 | 11.8% |
| Not-for-profit Organizations | 152 | 9.2% |
| Local Government Employees | 87 | 5.3% |
| State Government Employees | 115 | 7.0% |
| Federal Government Employees | 257 | 15.6% |
| Unpaid Family Workers | 22 | 1.3% |
| Total | 1,643 | 100.0% |
Employment Status by Age in Berwyn Heights
According to the labor force statistics for Berwyn Heights, out of the total population over 16 years of age (2,482), 70.9% or 1,760 individuals are in the labor force, with 4.8% or 84 of them unemployed. The age group with the highest labor force participation rate is 30 to 34 years, with 94.8% or 272 individuals in the labor force. Within the labor force, the 20 to 24 years age range has the highest percentage of unemployed individuals, with 25.0% or 33 of them being unemployed.
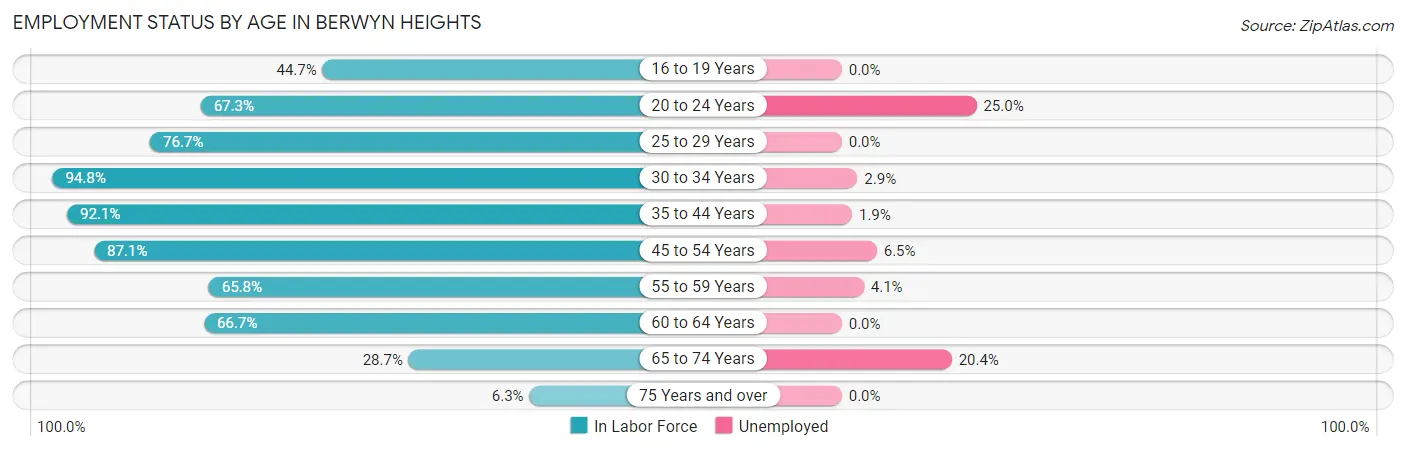
| Age Bracket | In Labor Force | Unemployed |
| 16 to 19 Years | 51 (44.7%) | 0 (0.0%) |
| 20 to 24 Years | 132 (67.3%) | 33 (25.0%) |
| 25 to 29 Years | 211 (76.7%) | 0 (0.0%) |
| 30 to 34 Years | 272 (94.8%) | 8 (2.9%) |
| 35 to 44 Years | 375 (92.1%) | 7 (1.9%) |
| 45 to 54 Years | 323 (87.1%) | 21 (6.5%) |
| 55 to 59 Years | 148 (65.8%) | 6 (4.1%) |
| 60 to 64 Years | 184 (66.7%) | 0 (0.0%) |
| 65 to 74 Years | 54 (28.7%) | 11 (20.4%) |
| 75 Years and over | 9 (6.3%) | 0 (0.0%) |
| Total | 1,760 (70.9%) | 84 (4.8%) |
Employment Status by Educational Attainment in Berwyn Heights
According to labor force statistics for Berwyn Heights, 82.2% of individuals (1,513) out of the total population between 25 and 64 years of age (1,841) are in the labor force, with 2.8% or 42 of them being unemployed. The group with the highest labor force participation rate are those with the educational attainment of bachelor's degree or higher, with 90.2% or 760 individuals in the labor force. Within the labor force, individuals with bachelor's degree or higher education have the highest percentage of unemployment, with 3.6% or 27 of them being unemployed.
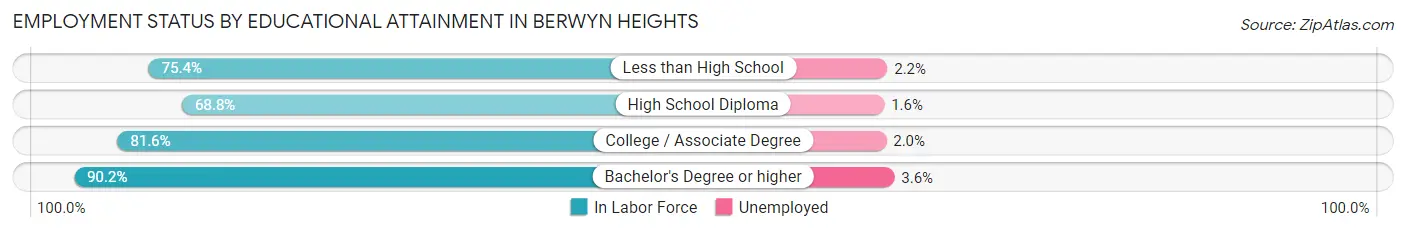
| Educational Attainment | In Labor Force | Unemployed |
| Less than High School | 312 (75.4%) | 9 (2.2%) |
| High School Diploma | 192 (68.8%) | 4 (1.6%) |
| College / Associate Degree | 249 (81.6%) | 6 (2.0%) |
| Bachelor's Degree or higher | 760 (90.2%) | 30 (3.6%) |
| Total | 1,513 (82.2%) | 52 (2.8%) |
Employment Occupations by Sex in Berwyn Heights
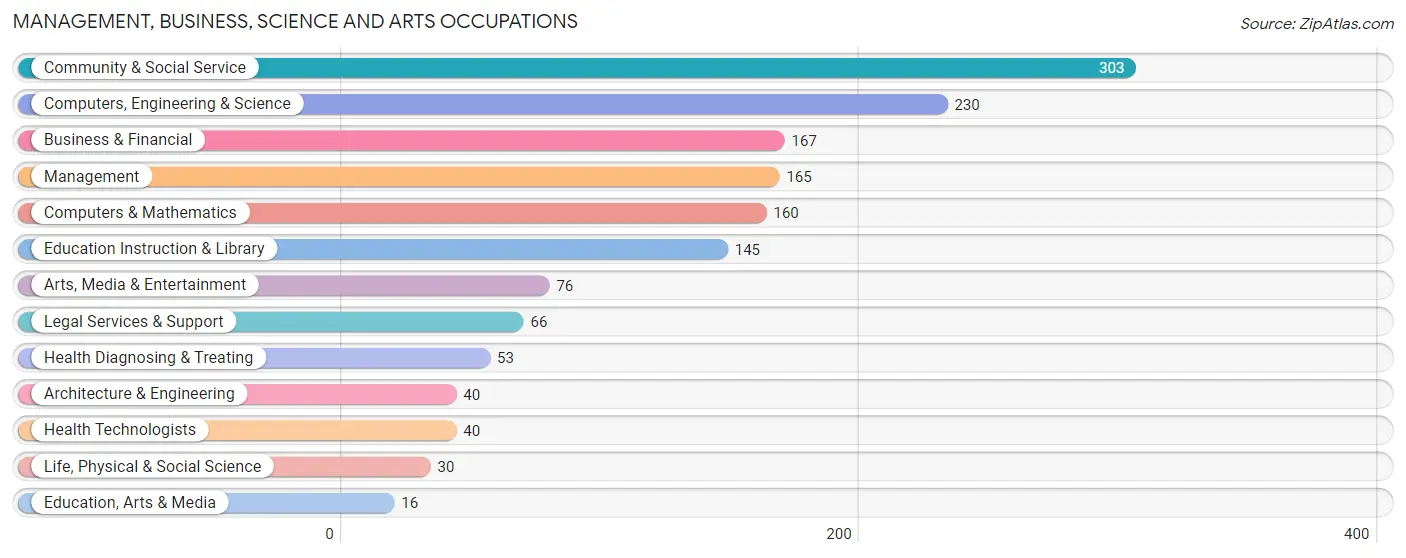
Management, Business, Science and Arts Occupations
The most common Management, Business, Science and Arts occupations in Berwyn Heights are Community & Social Service (303 | 18.1%), Computers, Engineering & Science (230 | 13.8%), Business & Financial (167 | 10.0%), Management (165 | 9.9%), and Computers & Mathematics (160 | 9.6%).
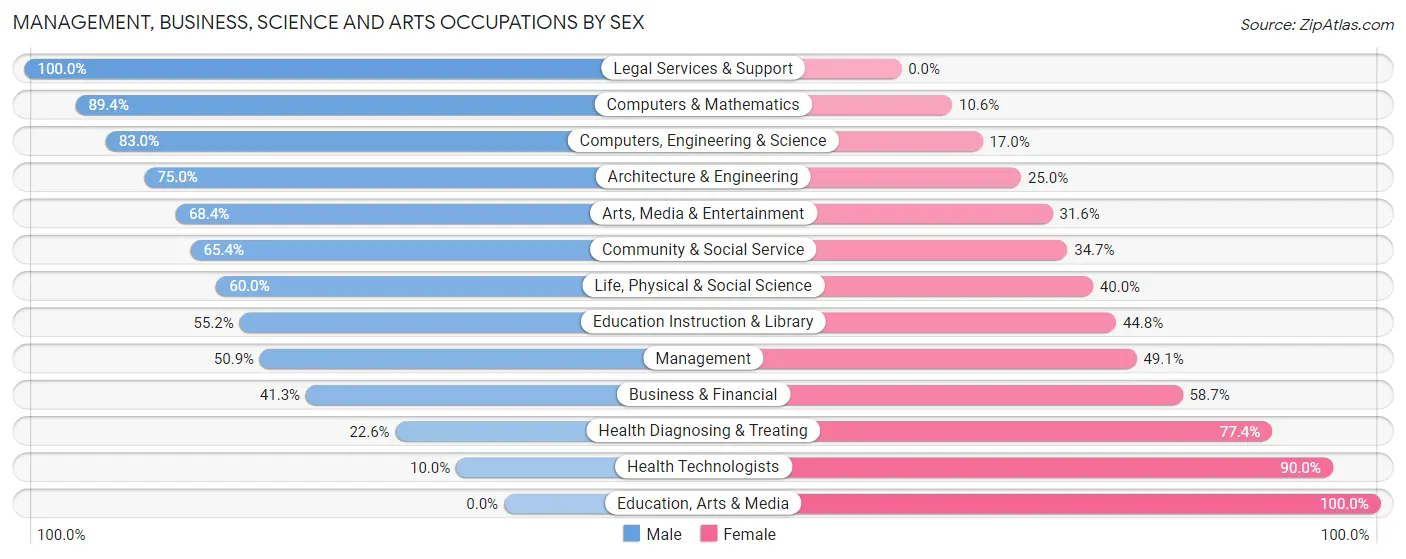
Management, Business, Science and Arts Occupations by Sex
Within the Management, Business, Science and Arts occupations in Berwyn Heights, the most male-oriented occupations are Legal Services & Support (100.0%), Computers & Mathematics (89.4%), and Computers, Engineering & Science (83.0%), while the most female-oriented occupations are Education, Arts & Media (100.0%), Health Technologists (90.0%), and Health Diagnosing & Treating (77.4%).
| Occupation | Male | Female |
| Management | 84 (50.9%) | 81 (49.1%) |
| Business & Financial | 69 (41.3%) | 98 (58.7%) |
| Computers, Engineering & Science | 191 (83.0%) | 39 (17.0%) |
| Computers & Mathematics | 143 (89.4%) | 17 (10.6%) |
| Architecture & Engineering | 30 (75.0%) | 10 (25.0%) |
| Life, Physical & Social Science | 18 (60.0%) | 12 (40.0%) |
| Community & Social Service | 198 (65.3%) | 105 (34.6%) |
| Education, Arts & Media | 0 (0.0%) | 16 (100.0%) |
| Legal Services & Support | 66 (100.0%) | 0 (0.0%) |
| Education Instruction & Library | 80 (55.2%) | 65 (44.8%) |
| Arts, Media & Entertainment | 52 (68.4%) | 24 (31.6%) |
| Health Diagnosing & Treating | 12 (22.6%) | 41 (77.4%) |
| Health Technologists | 4 (10.0%) | 36 (90.0%) |
| Total (Category) | 554 (60.4%) | 364 (39.7%) |
| Total (Overall) | 1,075 (64.4%) | 595 (35.6%) |
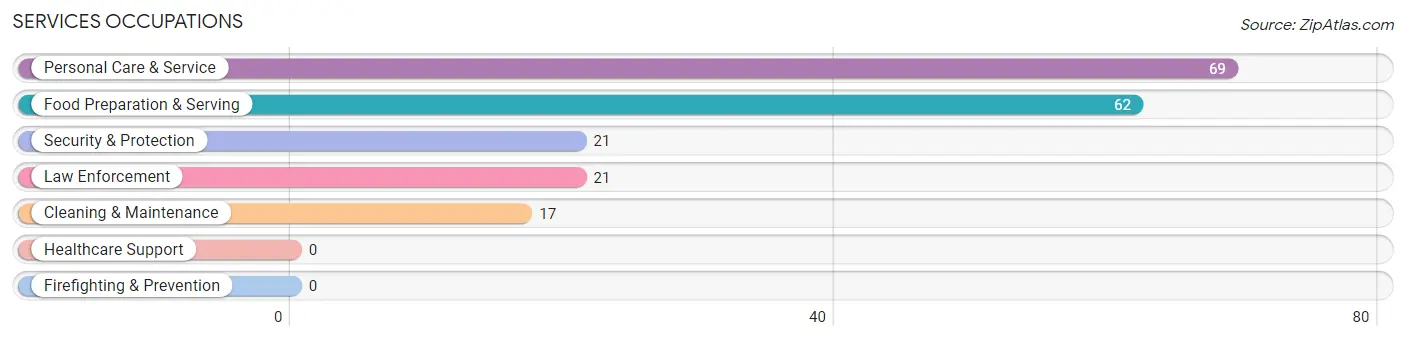
Services Occupations
The most common Services occupations in Berwyn Heights are Personal Care & Service (69 | 4.1%), Food Preparation & Serving (62 | 3.7%), Security & Protection (21 | 1.3%), Law Enforcement (21 | 1.3%), and Cleaning & Maintenance (17 | 1.0%).
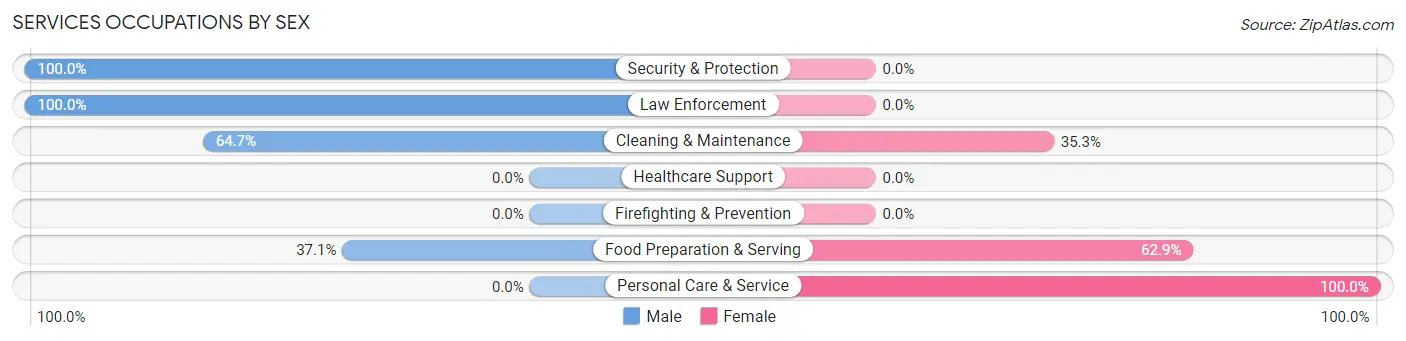
Services Occupations by Sex
Within the Services occupations in Berwyn Heights, the most male-oriented occupations are Security & Protection (100.0%), Law Enforcement (100.0%), and Cleaning & Maintenance (64.7%), while the most female-oriented occupations are Personal Care & Service (100.0%), Food Preparation & Serving (62.9%), and Cleaning & Maintenance (35.3%).
| Occupation | Male | Female |
| Healthcare Support | 0 (0.0%) | 0 (0.0%) |
| Security & Protection | 21 (100.0%) | 0 (0.0%) |
| Firefighting & Prevention | 0 (0.0%) | 0 (0.0%) |
| Law Enforcement | 21 (100.0%) | 0 (0.0%) |
| Food Preparation & Serving | 23 (37.1%) | 39 (62.9%) |
| Cleaning & Maintenance | 11 (64.7%) | 6 (35.3%) |
| Personal Care & Service | 0 (0.0%) | 69 (100.0%) |
| Total (Category) | 55 (32.5%) | 114 (67.5%) |
| Total (Overall) | 1,075 (64.4%) | 595 (35.6%) |
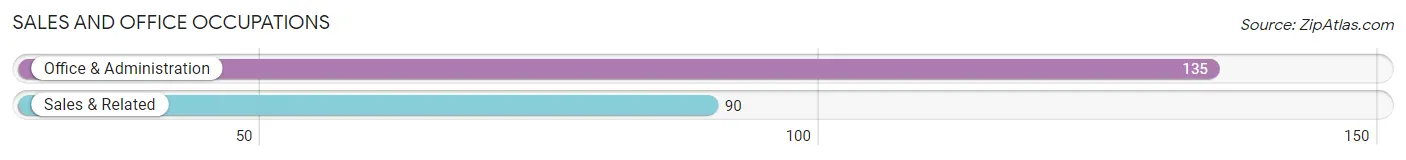
Sales and Office Occupations
The most common Sales and Office occupations in Berwyn Heights are Office & Administration (135 | 8.1%), and Sales & Related (90 | 5.4%).
Sales and Office Occupations by Sex
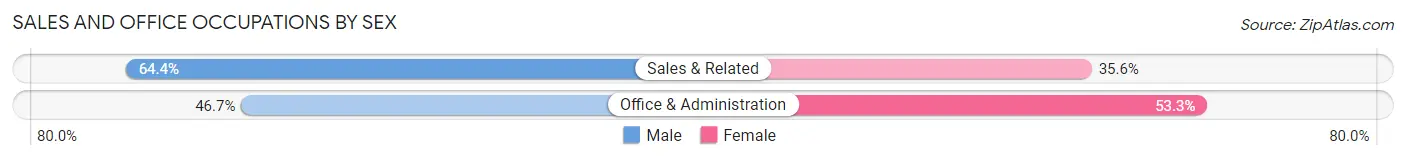
| Occupation | Male | Female |
| Sales & Related | 58 (64.4%) | 32 (35.6%) |
| Office & Administration | 63 (46.7%) | 72 (53.3%) |
| Total (Category) | 121 (53.8%) | 104 (46.2%) |
| Total (Overall) | 1,075 (64.4%) | 595 (35.6%) |
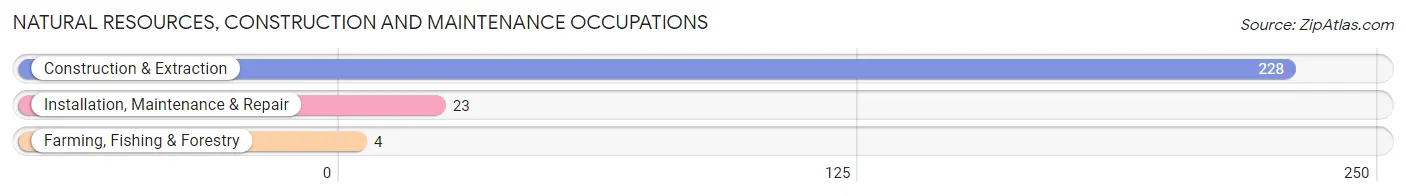
Natural Resources, Construction and Maintenance Occupations
The most common Natural Resources, Construction and Maintenance occupations in Berwyn Heights are Construction & Extraction (228 | 13.7%), Installation, Maintenance & Repair (23 | 1.4%), and Farming, Fishing & Forestry (4 | 0.2%).
Natural Resources, Construction and Maintenance Occupations by Sex
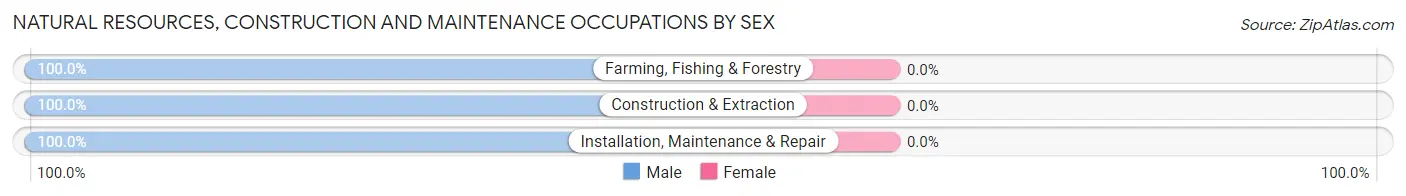
| Occupation | Male | Female |
| Farming, Fishing & Forestry | 4 (100.0%) | 0 (0.0%) |
| Construction & Extraction | 228 (100.0%) | 0 (0.0%) |
| Installation, Maintenance & Repair | 23 (100.0%) | 0 (0.0%) |
| Total (Category) | 255 (100.0%) | 0 (0.0%) |
| Total (Overall) | 1,075 (64.4%) | 595 (35.6%) |
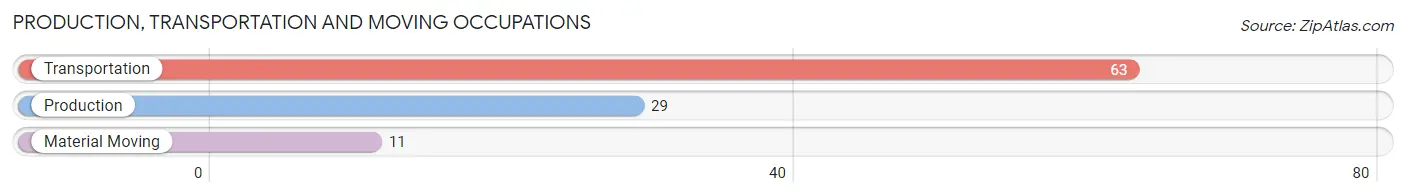
Production, Transportation and Moving Occupations
The most common Production, Transportation and Moving occupations in Berwyn Heights are Transportation (63 | 3.8%), Production (29 | 1.7%), and Material Moving (11 | 0.7%).
Production, Transportation and Moving Occupations by Sex
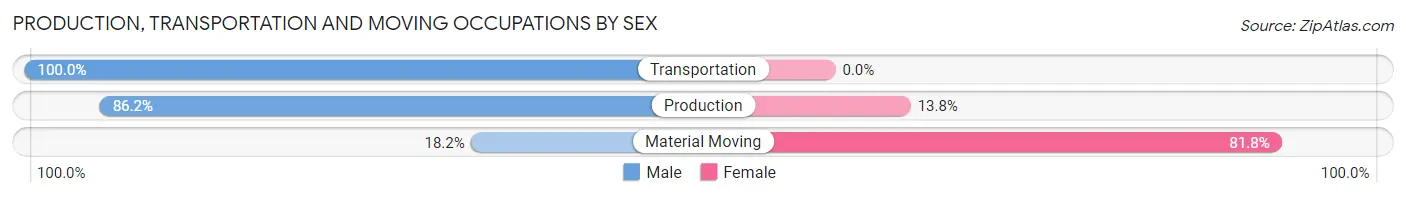
| Occupation | Male | Female |
| Production | 25 (86.2%) | 4 (13.8%) |
| Transportation | 63 (100.0%) | 0 (0.0%) |
| Material Moving | 2 (18.2%) | 9 (81.8%) |
| Total (Category) | 90 (87.4%) | 13 (12.6%) |
| Total (Overall) | 1,075 (64.4%) | 595 (35.6%) |
Employment Industries by Sex in Berwyn Heights
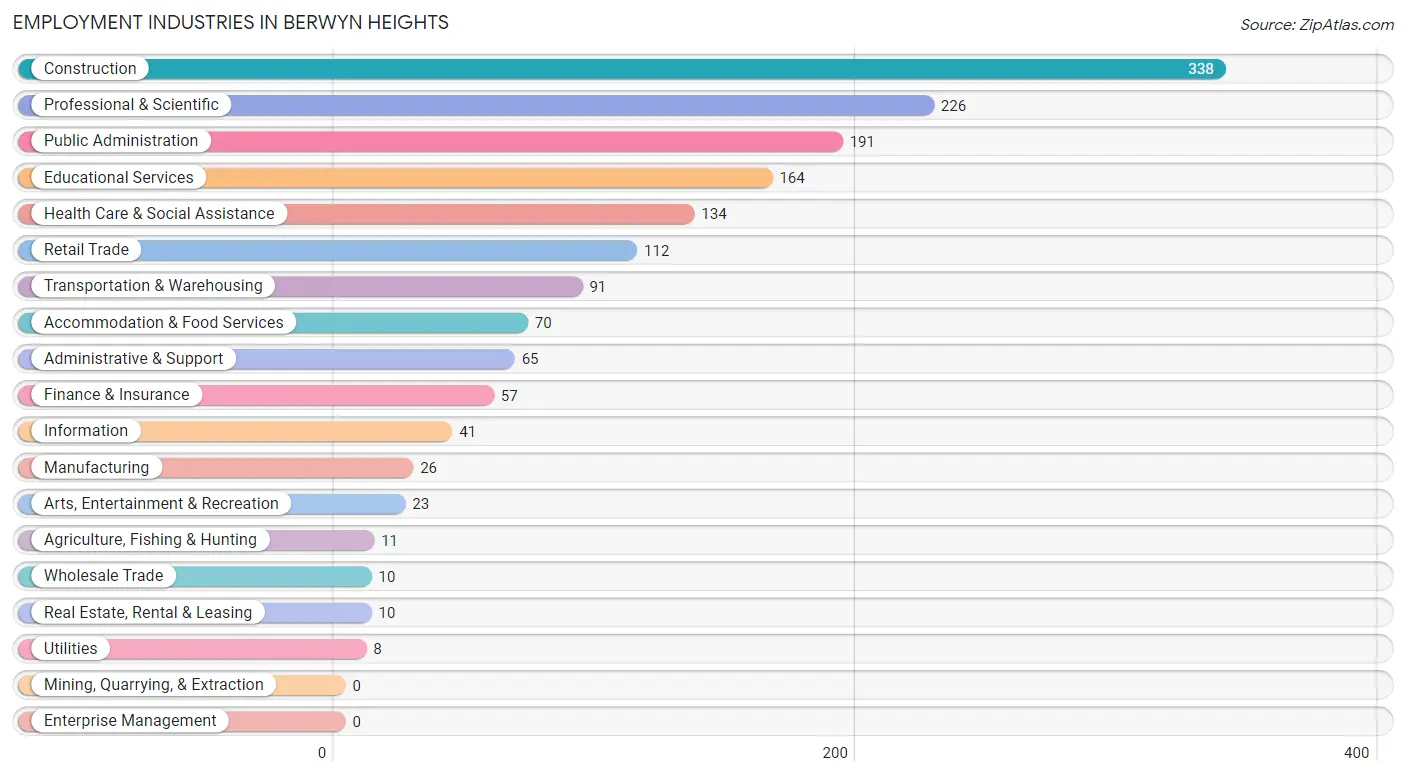
Employment Industries in Berwyn Heights
The major employment industries in Berwyn Heights include Construction (338 | 20.2%), Professional & Scientific (226 | 13.5%), Public Administration (191 | 11.4%), Educational Services (164 | 9.8%), and Health Care & Social Assistance (134 | 8.0%).
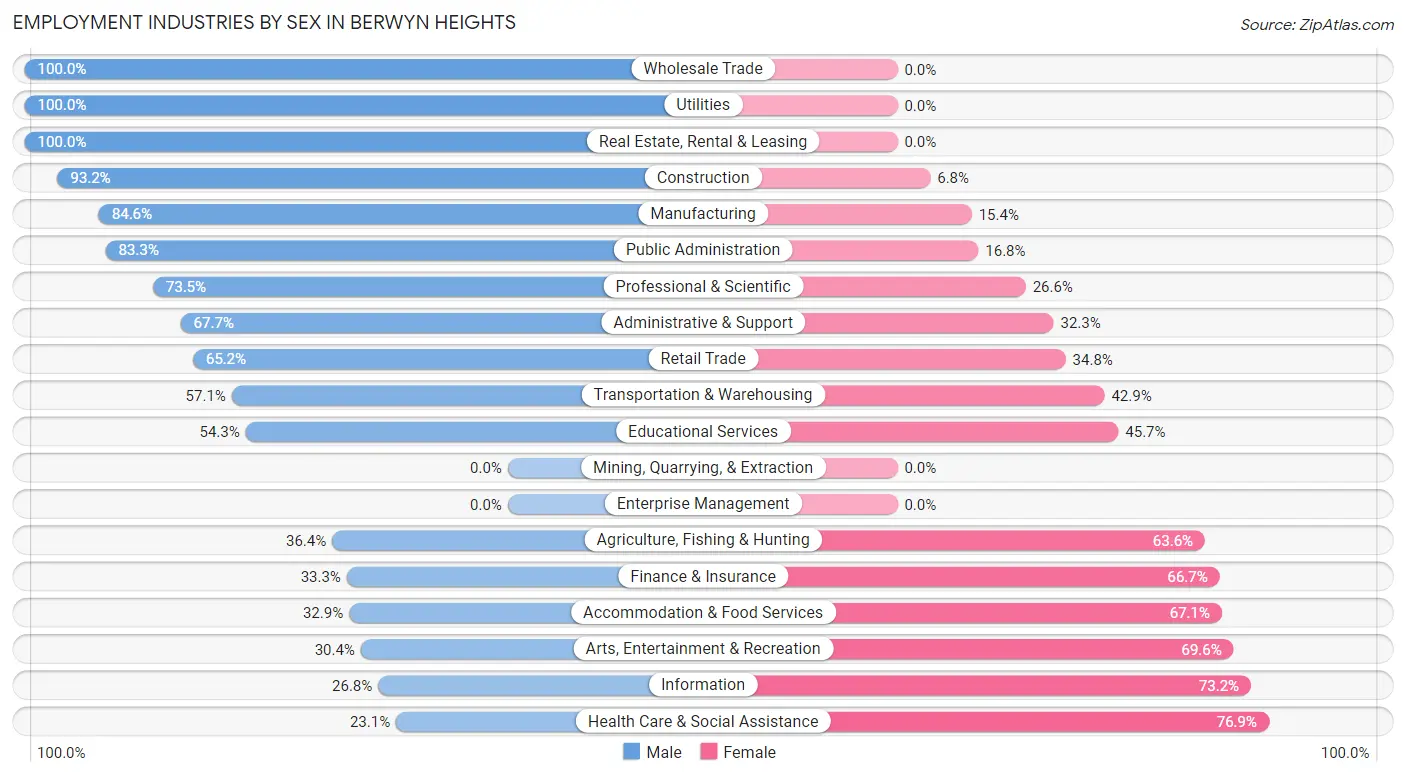
Employment Industries by Sex in Berwyn Heights
The Berwyn Heights industries that see more men than women are Wholesale Trade (100.0%), Utilities (100.0%), and Real Estate, Rental & Leasing (100.0%), whereas the industries that tend to have a higher number of women are Health Care & Social Assistance (76.9%), Information (73.2%), and Arts, Entertainment & Recreation (69.6%).
| Industry | Male | Female |
| Agriculture, Fishing & Hunting | 4 (36.4%) | 7 (63.6%) |
| Mining, Quarrying, & Extraction | 0 (0.0%) | 0 (0.0%) |
| Construction | 315 (93.2%) | 23 (6.8%) |
| Manufacturing | 22 (84.6%) | 4 (15.4%) |
| Wholesale Trade | 10 (100.0%) | 0 (0.0%) |
| Retail Trade | 73 (65.2%) | 39 (34.8%) |
| Transportation & Warehousing | 52 (57.1%) | 39 (42.9%) |
| Utilities | 8 (100.0%) | 0 (0.0%) |
| Information | 11 (26.8%) | 30 (73.2%) |
| Finance & Insurance | 19 (33.3%) | 38 (66.7%) |
| Real Estate, Rental & Leasing | 10 (100.0%) | 0 (0.0%) |
| Professional & Scientific | 166 (73.5%) | 60 (26.6%) |
| Enterprise Management | 0 (0.0%) | 0 (0.0%) |
| Administrative & Support | 44 (67.7%) | 21 (32.3%) |
| Educational Services | 89 (54.3%) | 75 (45.7%) |
| Health Care & Social Assistance | 31 (23.1%) | 103 (76.9%) |
| Arts, Entertainment & Recreation | 7 (30.4%) | 16 (69.6%) |
| Accommodation & Food Services | 23 (32.9%) | 47 (67.1%) |
| Public Administration | 159 (83.3%) | 32 (16.8%) |
| Total | 1,075 (64.4%) | 595 (35.6%) |
Education in Berwyn Heights
School Enrollment in Berwyn Heights
The most common levels of schooling among the 656 students in Berwyn Heights are elementary school (182 | 27.7%), middle school (172 | 26.2%), and high school (77 | 11.7%).
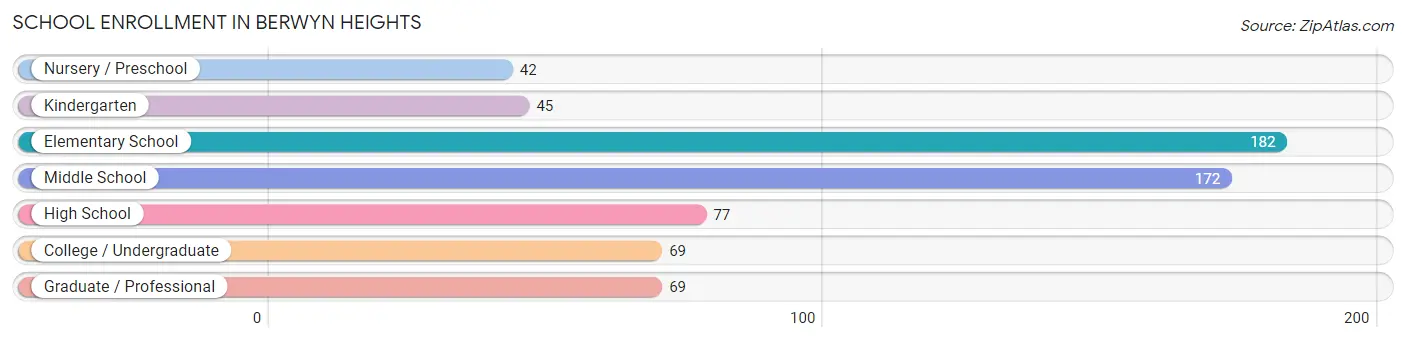
| School Level | # Students | % Students |
| Nursery / Preschool | 42 | 6.4% |
| Kindergarten | 45 | 6.9% |
| Elementary School | 182 | 27.7% |
| Middle School | 172 | 26.2% |
| High School | 77 | 11.7% |
| College / Undergraduate | 69 | 10.5% |
| Graduate / Professional | 69 | 10.5% |
| Total | 656 | 100.0% |
School Enrollment by Age by Funding Source in Berwyn Heights
Out of a total of 656 students who are enrolled in schools in Berwyn Heights, 75 (11.4%) attend a private institution, while the remaining 581 (88.6%) are enrolled in public schools. The age group of 15 to 17 year olds has the highest likelihood of being enrolled in private schools, with 12 (29.3% in the age bracket) enrolled. Conversely, the age group of 18 to 19 year olds has the lowest likelihood of being enrolled in a private school, with 50 (100.0% in the age bracket) attending a public institution.
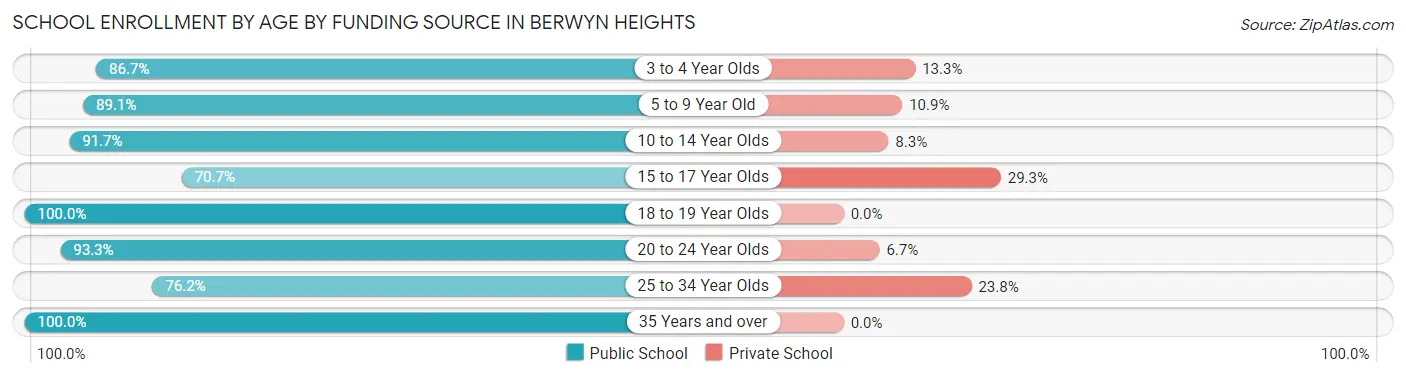
| Age Bracket | Public School | Private School |
| 3 to 4 Year Olds | 39 (86.7%) | 6 (13.3%) |
| 5 to 9 Year Old | 196 (89.1%) | 24 (10.9%) |
| 10 to 14 Year Olds | 165 (91.7%) | 15 (8.3%) |
| 15 to 17 Year Olds | 29 (70.7%) | 12 (29.3%) |
| 18 to 19 Year Olds | 50 (100.0%) | 0 (0.0%) |
| 20 to 24 Year Olds | 42 (93.3%) | 3 (6.7%) |
| 25 to 34 Year Olds | 48 (76.2%) | 15 (23.8%) |
| 35 Years and over | 12 (100.0%) | 0 (0.0%) |
| Total | 581 (88.6%) | 75 (11.4%) |
Educational Attainment by Field of Study in Berwyn Heights
Social sciences (184 | 16.6%), liberal arts & history (104 | 9.4%), business (97 | 8.8%), computers & mathematics (90 | 8.1%), and engineering (89 | 8.0%) are the most common fields of study among 1,107 individuals in Berwyn Heights who have obtained a bachelor's degree or higher.
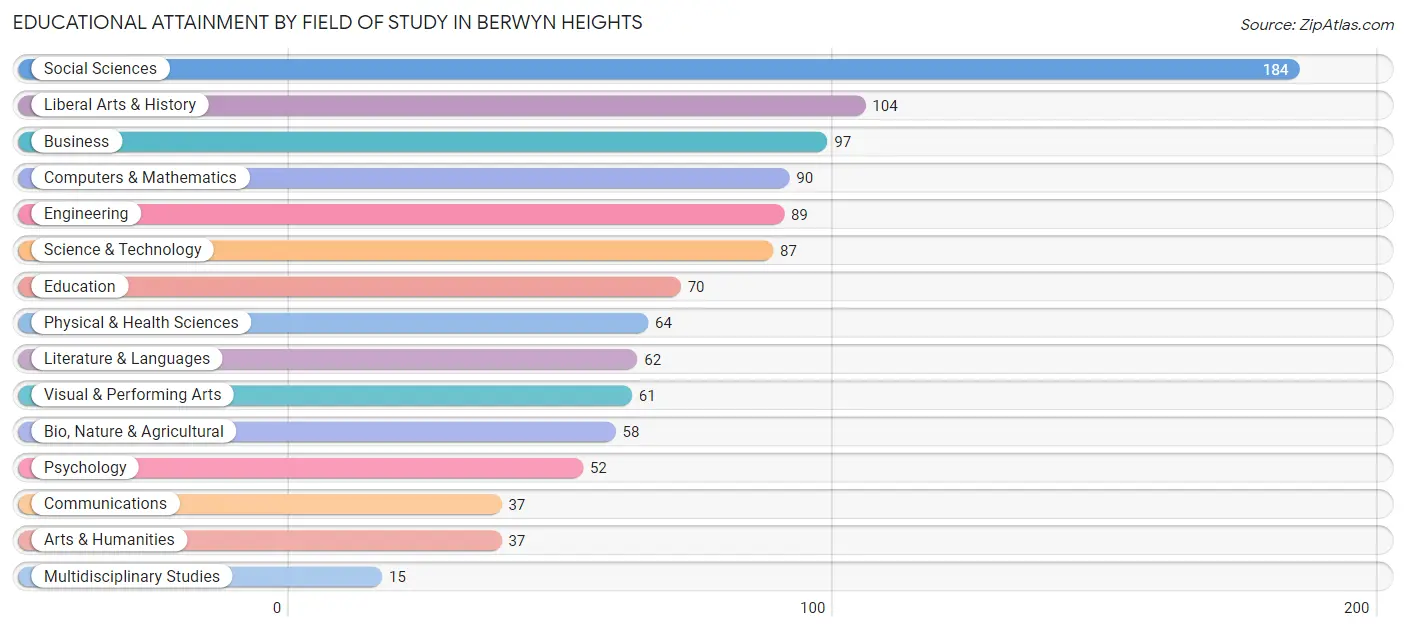
| Field of Study | # Graduates | % Graduates |
| Computers & Mathematics | 90 | 8.1% |
| Bio, Nature & Agricultural | 58 | 5.2% |
| Physical & Health Sciences | 64 | 5.8% |
| Psychology | 52 | 4.7% |
| Social Sciences | 184 | 16.6% |
| Engineering | 89 | 8.0% |
| Multidisciplinary Studies | 15 | 1.4% |
| Science & Technology | 87 | 7.9% |
| Business | 97 | 8.8% |
| Education | 70 | 6.3% |
| Literature & Languages | 62 | 5.6% |
| Liberal Arts & History | 104 | 9.4% |
| Visual & Performing Arts | 61 | 5.5% |
| Communications | 37 | 3.3% |
| Arts & Humanities | 37 | 3.3% |
| Total | 1,107 | 100.0% |
Transportation & Commute in Berwyn Heights
Vehicle Availability by Sex in Berwyn Heights
The most prevalent vehicle ownership categories in Berwyn Heights are males with 2 vehicles (298, accounting for 28.1%) and females with 2 vehicles (208, making up 51.1%).
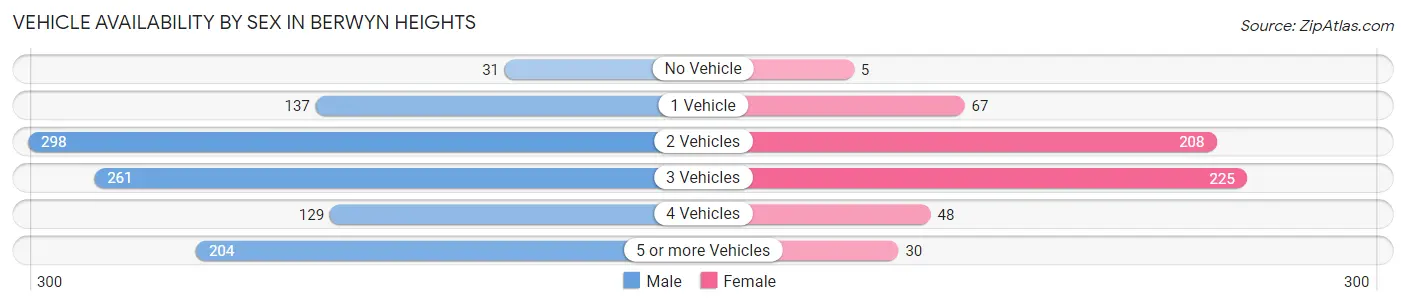
| Vehicles Available | Male | Female |
| No Vehicle | 31 (2.9%) | 5 (0.9%) |
| 1 Vehicle | 137 (12.9%) | 67 (11.5%) |
| 2 Vehicles | 298 (28.1%) | 208 (35.7%) |
| 3 Vehicles | 261 (24.6%) | 225 (38.6%) |
| 4 Vehicles | 129 (12.2%) | 48 (8.2%) |
| 5 or more Vehicles | 204 (19.3%) | 30 (5.1%) |
| Total | 1,060 (100.0%) | 583 (100.0%) |
Commute Time in Berwyn Heights
The most frequently occuring commute durations in Berwyn Heights are 30 to 34 minutes (339 commuters, 28.9%), 45 to 59 minutes (237 commuters, 20.2%), and 60 to 89 minutes (134 commuters, 11.4%).
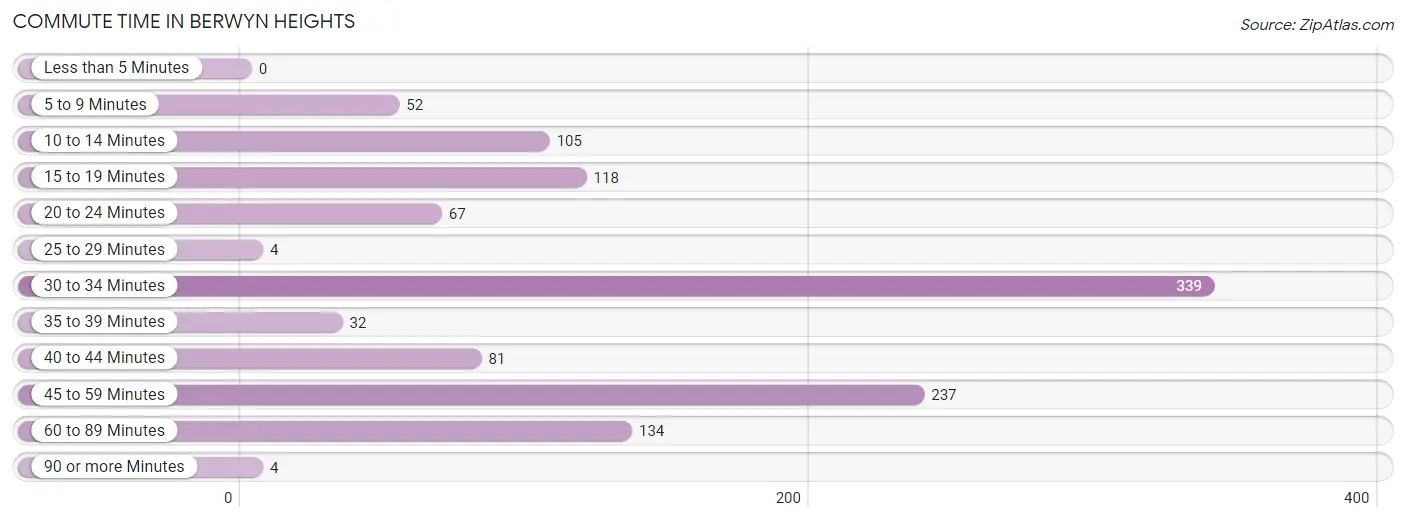
| Commute Time | # Commuters | % Commuters |
| Less than 5 Minutes | 0 | 0.0% |
| 5 to 9 Minutes | 52 | 4.4% |
| 10 to 14 Minutes | 105 | 8.9% |
| 15 to 19 Minutes | 118 | 10.1% |
| 20 to 24 Minutes | 67 | 5.7% |
| 25 to 29 Minutes | 4 | 0.3% |
| 30 to 34 Minutes | 339 | 28.9% |
| 35 to 39 Minutes | 32 | 2.7% |
| 40 to 44 Minutes | 81 | 6.9% |
| 45 to 59 Minutes | 237 | 20.2% |
| 60 to 89 Minutes | 134 | 11.4% |
| 90 or more Minutes | 4 | 0.3% |
Commute Time by Sex in Berwyn Heights
The most common commute times in Berwyn Heights are 30 to 34 minutes (274 commuters, 35.1%) for males and 45 to 59 minutes (80 commuters, 20.4%) for females.
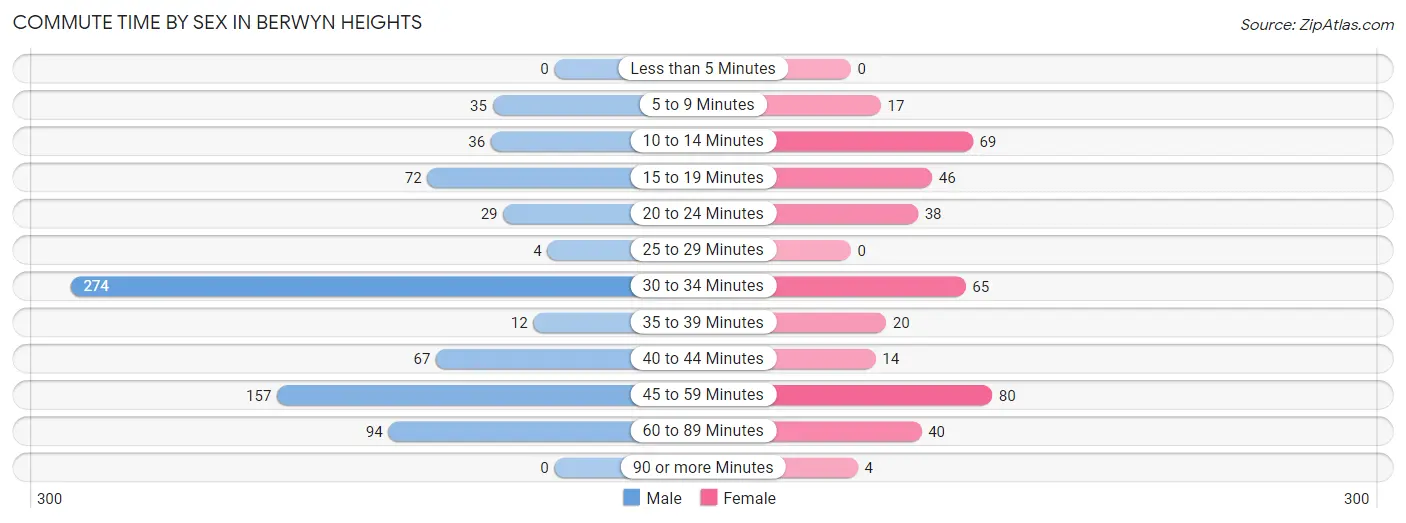
| Commute Time | Male | Female |
| Less than 5 Minutes | 0 (0.0%) | 0 (0.0%) |
| 5 to 9 Minutes | 35 (4.5%) | 17 (4.3%) |
| 10 to 14 Minutes | 36 (4.6%) | 69 (17.6%) |
| 15 to 19 Minutes | 72 (9.2%) | 46 (11.7%) |
| 20 to 24 Minutes | 29 (3.7%) | 38 (9.7%) |
| 25 to 29 Minutes | 4 (0.5%) | 0 (0.0%) |
| 30 to 34 Minutes | 274 (35.1%) | 65 (16.5%) |
| 35 to 39 Minutes | 12 (1.5%) | 20 (5.1%) |
| 40 to 44 Minutes | 67 (8.6%) | 14 (3.6%) |
| 45 to 59 Minutes | 157 (20.1%) | 80 (20.4%) |
| 60 to 89 Minutes | 94 (12.0%) | 40 (10.2%) |
| 90 or more Minutes | 0 (0.0%) | 4 (1.0%) |
Time of Departure to Work by Sex in Berwyn Heights
The most frequent times of departure to work in Berwyn Heights are 6:00 AM to 6:29 AM (241, 30.9%) for males and 9:00 AM to 9:59 AM (81, 20.6%) for females.
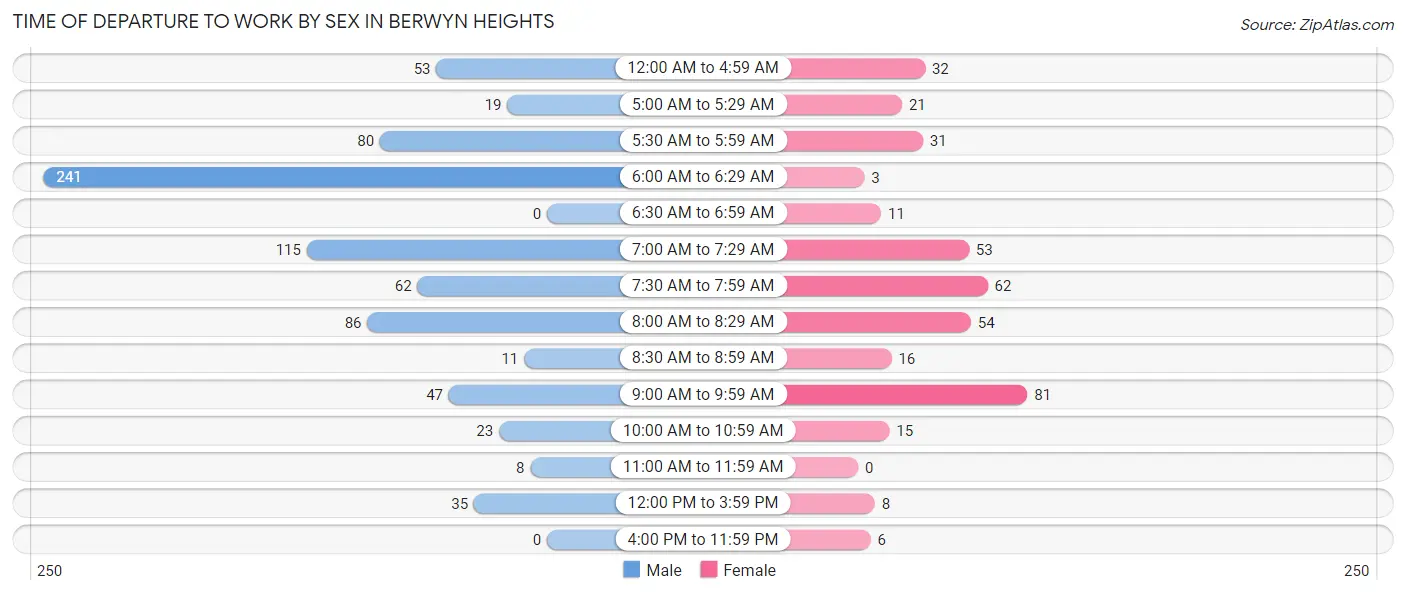
| Time of Departure | Male | Female |
| 12:00 AM to 4:59 AM | 53 (6.8%) | 32 (8.1%) |
| 5:00 AM to 5:29 AM | 19 (2.4%) | 21 (5.3%) |
| 5:30 AM to 5:59 AM | 80 (10.3%) | 31 (7.9%) |
| 6:00 AM to 6:29 AM | 241 (30.9%) | 3 (0.8%) |
| 6:30 AM to 6:59 AM | 0 (0.0%) | 11 (2.8%) |
| 7:00 AM to 7:29 AM | 115 (14.7%) | 53 (13.5%) |
| 7:30 AM to 7:59 AM | 62 (8.0%) | 62 (15.8%) |
| 8:00 AM to 8:29 AM | 86 (11.0%) | 54 (13.7%) |
| 8:30 AM to 8:59 AM | 11 (1.4%) | 16 (4.1%) |
| 9:00 AM to 9:59 AM | 47 (6.0%) | 81 (20.6%) |
| 10:00 AM to 10:59 AM | 23 (2.9%) | 15 (3.8%) |
| 11:00 AM to 11:59 AM | 8 (1.0%) | 0 (0.0%) |
| 12:00 PM to 3:59 PM | 35 (4.5%) | 8 (2.0%) |
| 4:00 PM to 11:59 PM | 0 (0.0%) | 6 (1.5%) |
| Total | 780 (100.0%) | 393 (100.0%) |
Housing Occupancy in Berwyn Heights
Occupancy by Ownership in Berwyn Heights
Of the total 960 dwellings in Berwyn Heights, owner-occupied units account for 830 (86.5%), while renter-occupied units make up 130 (13.5%).
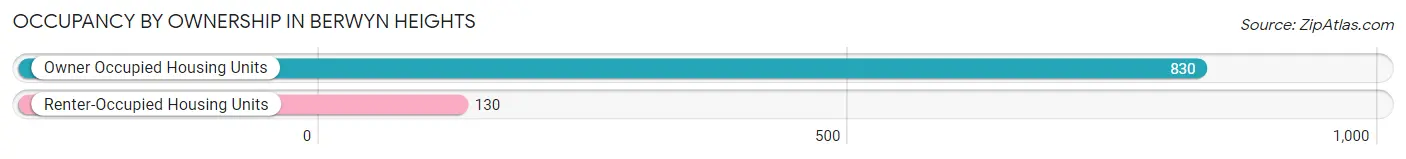
| Occupancy | # Housing Units | % Housing Units |
| Owner Occupied Housing Units | 830 | 86.5% |
| Renter-Occupied Housing Units | 130 | 13.5% |
| Total Occupied Housing Units | 960 | 100.0% |
Occupancy by Household Size in Berwyn Heights
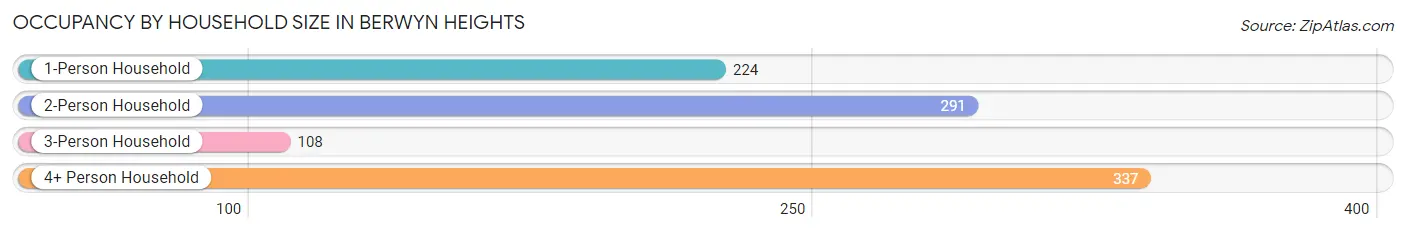
| Household Size | # Housing Units | % Housing Units |
| 1-Person Household | 224 | 23.3% |
| 2-Person Household | 291 | 30.3% |
| 3-Person Household | 108 | 11.3% |
| 4+ Person Household | 337 | 35.1% |
| Total Housing Units | 960 | 100.0% |
Occupancy by Ownership by Household Size in Berwyn Heights
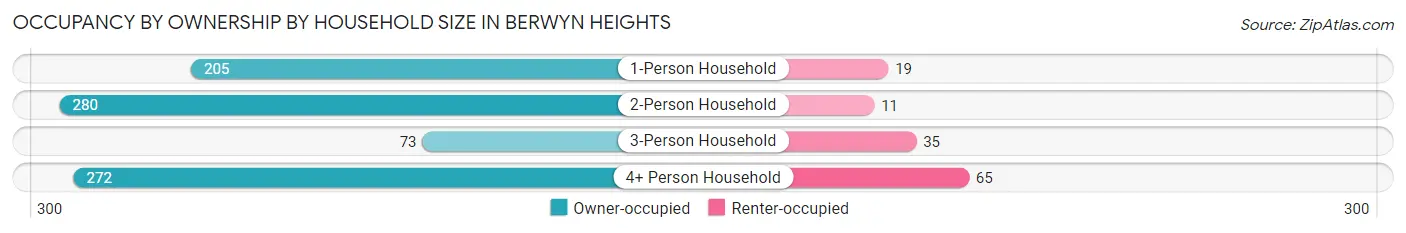
| Household Size | Owner-occupied | Renter-occupied |
| 1-Person Household | 205 (91.5%) | 19 (8.5%) |
| 2-Person Household | 280 (96.2%) | 11 (3.8%) |
| 3-Person Household | 73 (67.6%) | 35 (32.4%) |
| 4+ Person Household | 272 (80.7%) | 65 (19.3%) |
| Total Housing Units | 830 (86.5%) | 130 (13.5%) |
Occupancy by Educational Attainment in Berwyn Heights
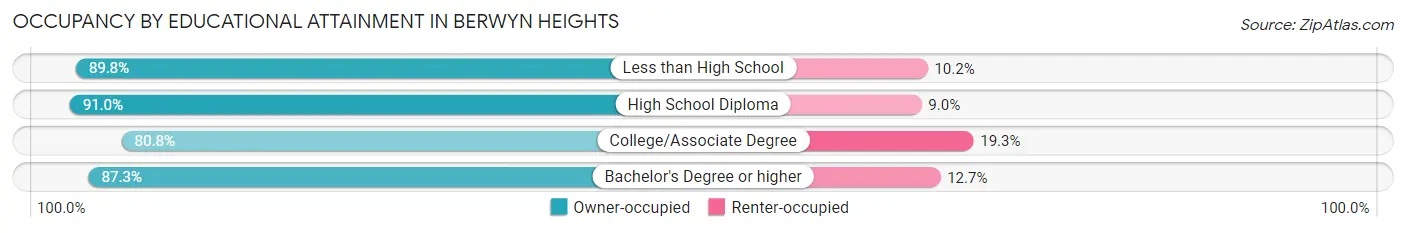
| Household Size | Owner-occupied | Renter-occupied |
| Less than High School | 106 (89.8%) | 12 (10.2%) |
| High School Diploma | 71 (91.0%) | 7 (9.0%) |
| College/Associate Degree | 172 (80.7%) | 41 (19.3%) |
| Bachelor's Degree or higher | 481 (87.3%) | 70 (12.7%) |
Occupancy by Age of Householder in Berwyn Heights
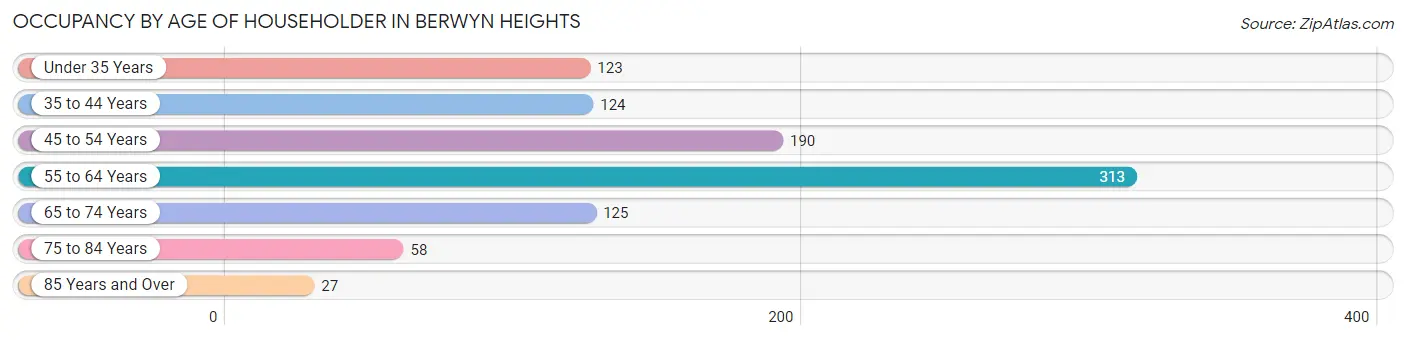
| Age Bracket | # Households | % Households |
| Under 35 Years | 123 | 12.8% |
| 35 to 44 Years | 124 | 12.9% |
| 45 to 54 Years | 190 | 19.8% |
| 55 to 64 Years | 313 | 32.6% |
| 65 to 74 Years | 125 | 13.0% |
| 75 to 84 Years | 58 | 6.0% |
| 85 Years and Over | 27 | 2.8% |
| Total | 960 | 100.0% |
Housing Finances in Berwyn Heights
Median Income by Occupancy in Berwyn Heights
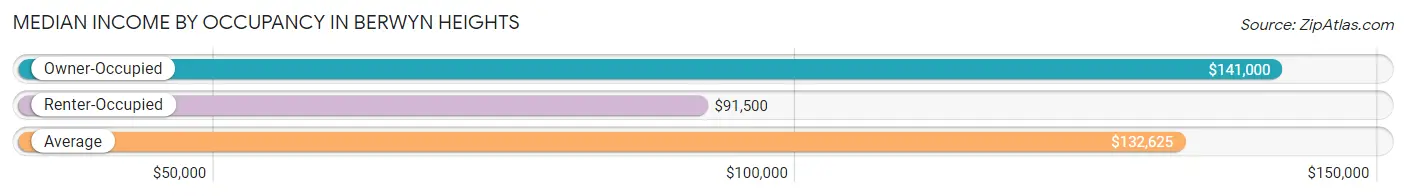
| Occupancy Type | # Households | Median Income |
| Owner-Occupied | 830 (86.5%) | $141,000 |
| Renter-Occupied | 130 (13.5%) | $91,500 |
| Average | 960 (100.0%) | $132,625 |
Occupancy by Householder Income Bracket in Berwyn Heights
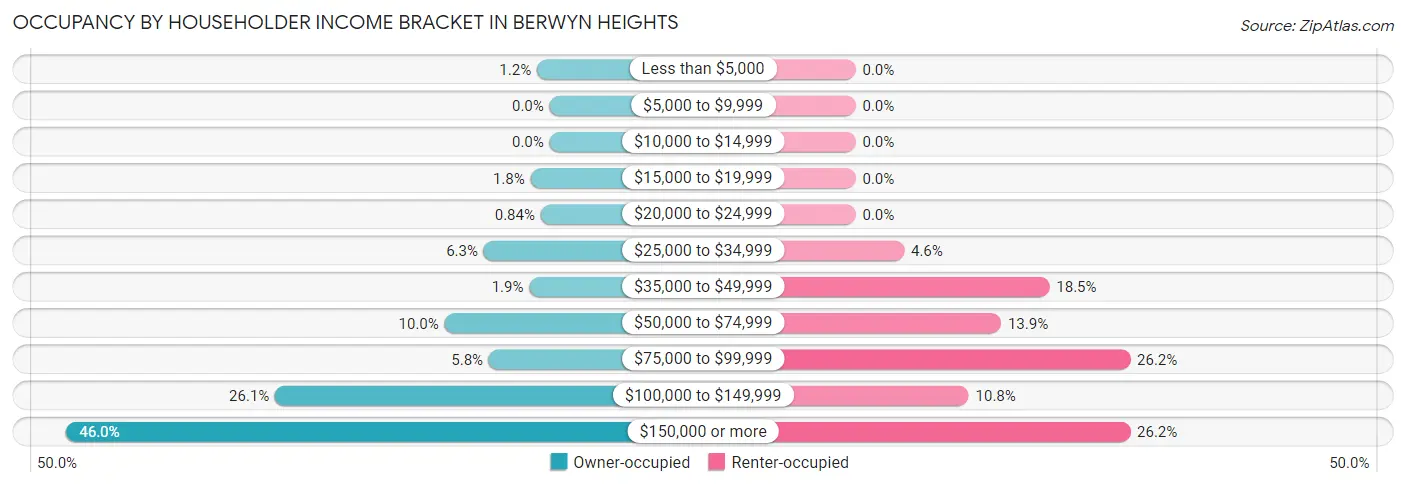
| Income Bracket | Owner-occupied | Renter-occupied |
| Less than $5,000 | 10 (1.2%) | 0 (0.0%) |
| $5,000 to $9,999 | 0 (0.0%) | 0 (0.0%) |
| $10,000 to $14,999 | 0 (0.0%) | 0 (0.0%) |
| $15,000 to $19,999 | 15 (1.8%) | 0 (0.0%) |
| $20,000 to $24,999 | 7 (0.8%) | 0 (0.0%) |
| $25,000 to $34,999 | 52 (6.3%) | 6 (4.6%) |
| $35,000 to $49,999 | 16 (1.9%) | 24 (18.5%) |
| $50,000 to $74,999 | 83 (10.0%) | 18 (13.9%) |
| $75,000 to $99,999 | 48 (5.8%) | 34 (26.2%) |
| $100,000 to $149,999 | 217 (26.1%) | 14 (10.8%) |
| $150,000 or more | 382 (46.0%) | 34 (26.2%) |
| Total | 830 (100.0%) | 130 (100.0%) |
Monthly Housing Cost Tiers in Berwyn Heights
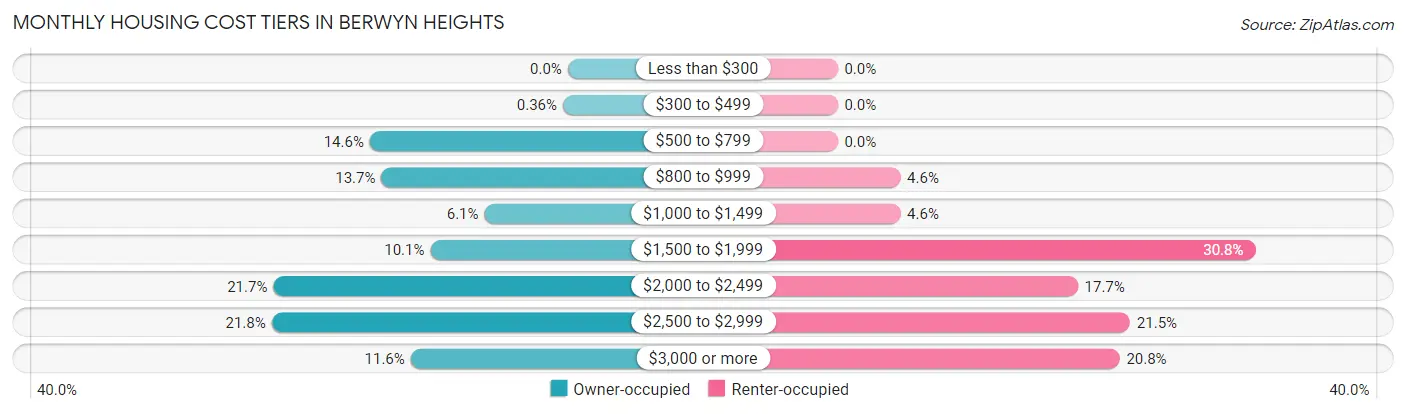
| Monthly Cost | Owner-occupied | Renter-occupied |
| Less than $300 | 0 (0.0%) | 0 (0.0%) |
| $300 to $499 | 3 (0.4%) | 0 (0.0%) |
| $500 to $799 | 121 (14.6%) | 0 (0.0%) |
| $800 to $999 | 114 (13.7%) | 6 (4.6%) |
| $1,000 to $1,499 | 51 (6.1%) | 6 (4.6%) |
| $1,500 to $1,999 | 84 (10.1%) | 40 (30.8%) |
| $2,000 to $2,499 | 180 (21.7%) | 23 (17.7%) |
| $2,500 to $2,999 | 181 (21.8%) | 28 (21.5%) |
| $3,000 or more | 96 (11.6%) | 27 (20.8%) |
| Total | 830 (100.0%) | 130 (100.0%) |
Physical Housing Characteristics in Berwyn Heights
Housing Structures in Berwyn Heights
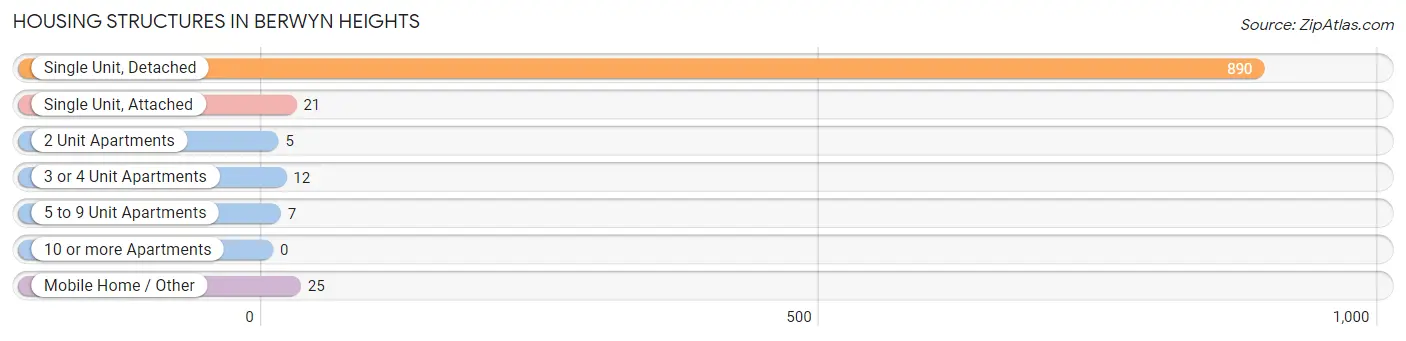
| Structure Type | # Housing Units | % Housing Units |
| Single Unit, Detached | 890 | 92.7% |
| Single Unit, Attached | 21 | 2.2% |
| 2 Unit Apartments | 5 | 0.5% |
| 3 or 4 Unit Apartments | 12 | 1.3% |
| 5 to 9 Unit Apartments | 7 | 0.7% |
| 10 or more Apartments | 0 | 0.0% |
| Mobile Home / Other | 25 | 2.6% |
| Total | 960 | 100.0% |
Housing Structures by Occupancy in Berwyn Heights
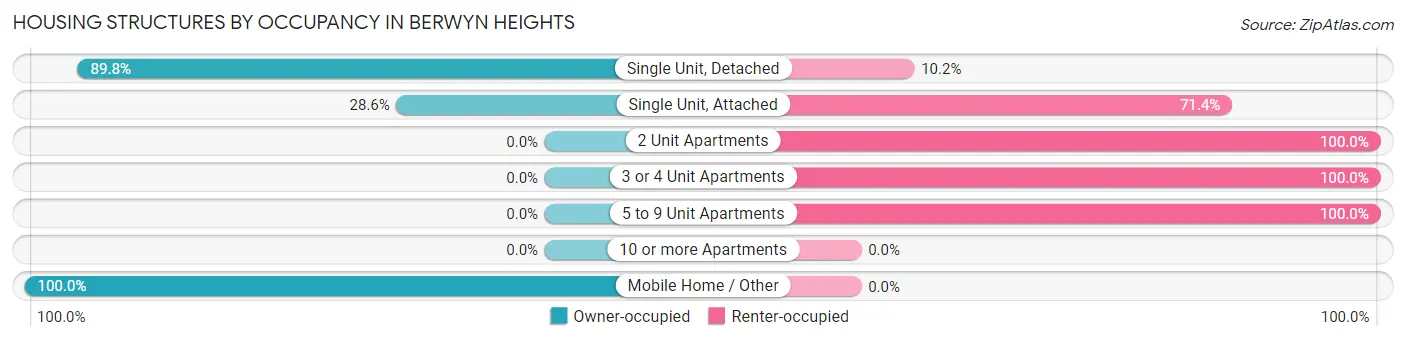
| Structure Type | Owner-occupied | Renter-occupied |
| Single Unit, Detached | 799 (89.8%) | 91 (10.2%) |
| Single Unit, Attached | 6 (28.6%) | 15 (71.4%) |
| 2 Unit Apartments | 0 (0.0%) | 5 (100.0%) |
| 3 or 4 Unit Apartments | 0 (0.0%) | 12 (100.0%) |
| 5 to 9 Unit Apartments | 0 (0.0%) | 7 (100.0%) |
| 10 or more Apartments | 0 (0.0%) | 0 (0.0%) |
| Mobile Home / Other | 25 (100.0%) | 0 (0.0%) |
| Total | 830 (86.5%) | 130 (13.5%) |
Housing Structures by Number of Rooms in Berwyn Heights
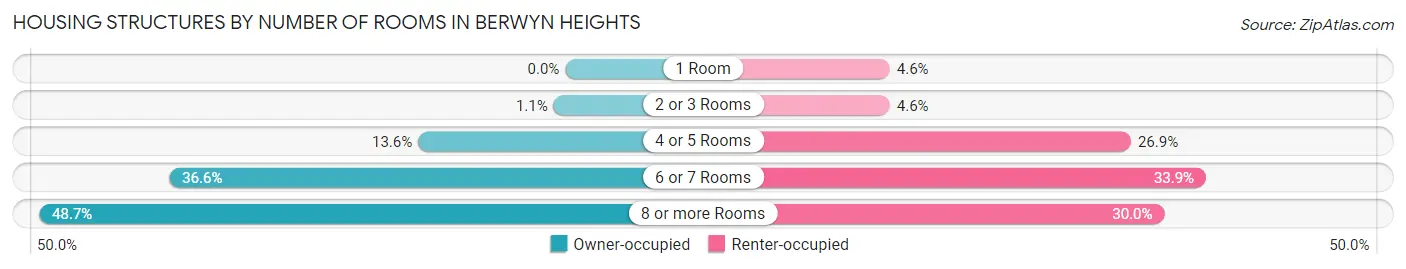
| Number of Rooms | Owner-occupied | Renter-occupied |
| 1 Room | 0 (0.0%) | 6 (4.6%) |
| 2 or 3 Rooms | 9 (1.1%) | 6 (4.6%) |
| 4 or 5 Rooms | 113 (13.6%) | 35 (26.9%) |
| 6 or 7 Rooms | 304 (36.6%) | 44 (33.9%) |
| 8 or more Rooms | 404 (48.7%) | 39 (30.0%) |
| Total | 830 (100.0%) | 130 (100.0%) |
Housing Structure by Heating Type in Berwyn Heights
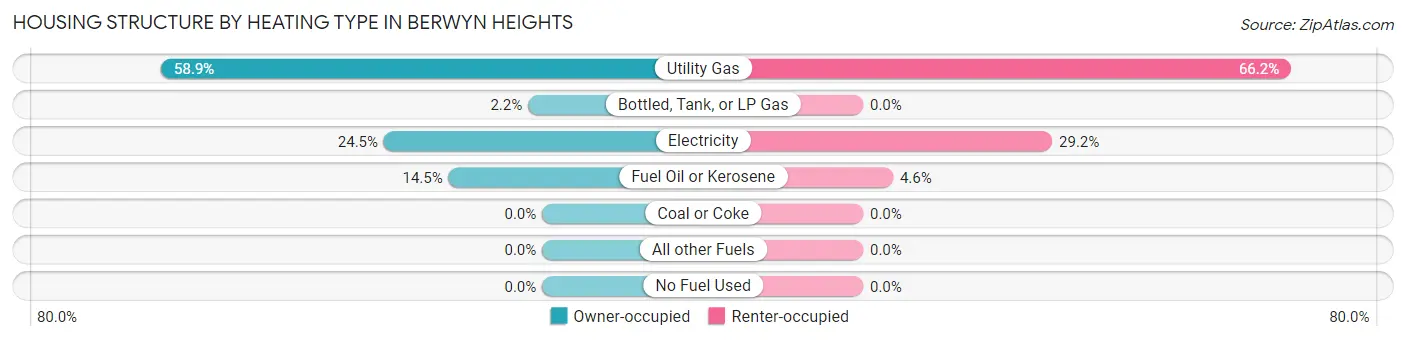
| Heating Type | Owner-occupied | Renter-occupied |
| Utility Gas | 489 (58.9%) | 86 (66.1%) |
| Bottled, Tank, or LP Gas | 18 (2.2%) | 0 (0.0%) |
| Electricity | 203 (24.5%) | 38 (29.2%) |
| Fuel Oil or Kerosene | 120 (14.5%) | 6 (4.6%) |
| Coal or Coke | 0 (0.0%) | 0 (0.0%) |
| All other Fuels | 0 (0.0%) | 0 (0.0%) |
| No Fuel Used | 0 (0.0%) | 0 (0.0%) |
| Total | 830 (100.0%) | 130 (100.0%) |
Household Vehicle Usage in Berwyn Heights
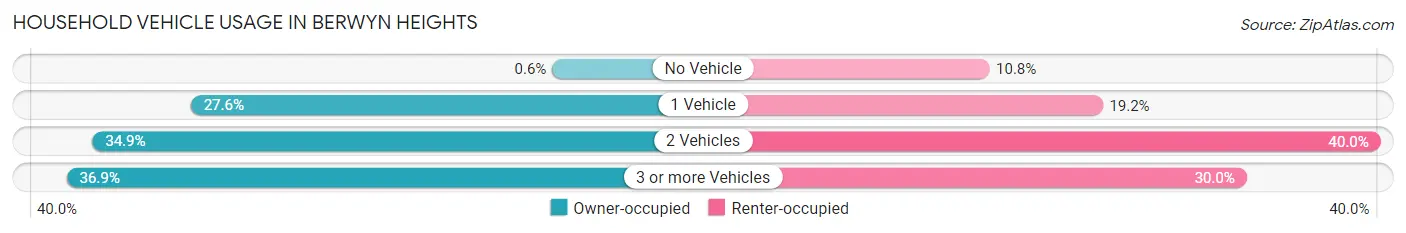
| Vehicles per Household | Owner-occupied | Renter-occupied |
| No Vehicle | 5 (0.6%) | 14 (10.8%) |
| 1 Vehicle | 229 (27.6%) | 25 (19.2%) |
| 2 Vehicles | 290 (34.9%) | 52 (40.0%) |
| 3 or more Vehicles | 306 (36.9%) | 39 (30.0%) |
| Total | 830 (100.0%) | 130 (100.0%) |
Real Estate & Mortgages in Berwyn Heights
Real Estate and Mortgage Overview in Berwyn Heights
| Characteristic | Without Mortgage | With Mortgage |
| Housing Units | 272 | 558 |
| Median Property Value | $353,800 | $389,000 |
| Median Household Income | $159,583 | $241 |
| Monthly Housing Costs | $817 | $96 |
| Real Estate Taxes | $4,897 | $24 |
Property Value by Mortgage Status in Berwyn Heights
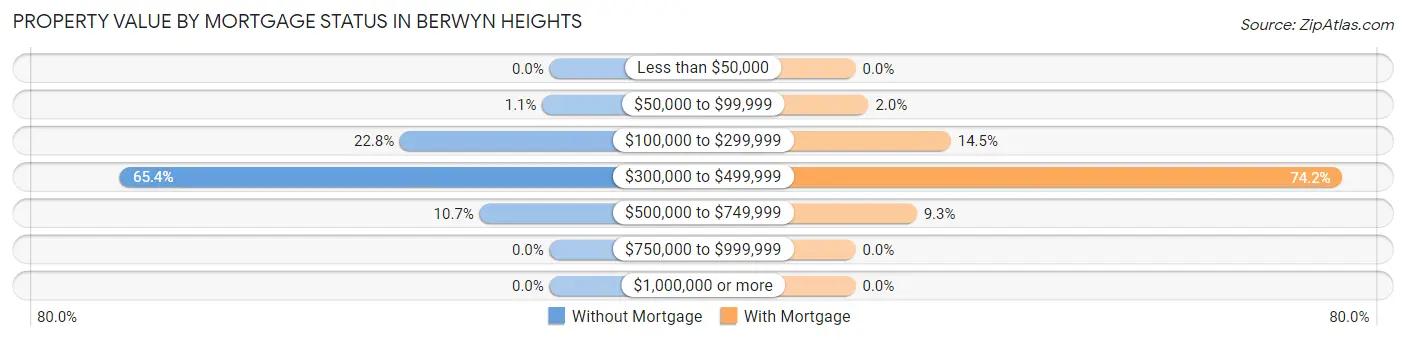
| Property Value | Without Mortgage | With Mortgage |
| Less than $50,000 | 0 (0.0%) | 0 (0.0%) |
| $50,000 to $99,999 | 3 (1.1%) | 11 (2.0%) |
| $100,000 to $299,999 | 62 (22.8%) | 81 (14.5%) |
| $300,000 to $499,999 | 178 (65.4%) | 414 (74.2%) |
| $500,000 to $749,999 | 29 (10.7%) | 52 (9.3%) |
| $750,000 to $999,999 | 0 (0.0%) | 0 (0.0%) |
| $1,000,000 or more | 0 (0.0%) | 0 (0.0%) |
| Total | 272 (100.0%) | 558 (100.0%) |
Household Income by Mortgage Status in Berwyn Heights
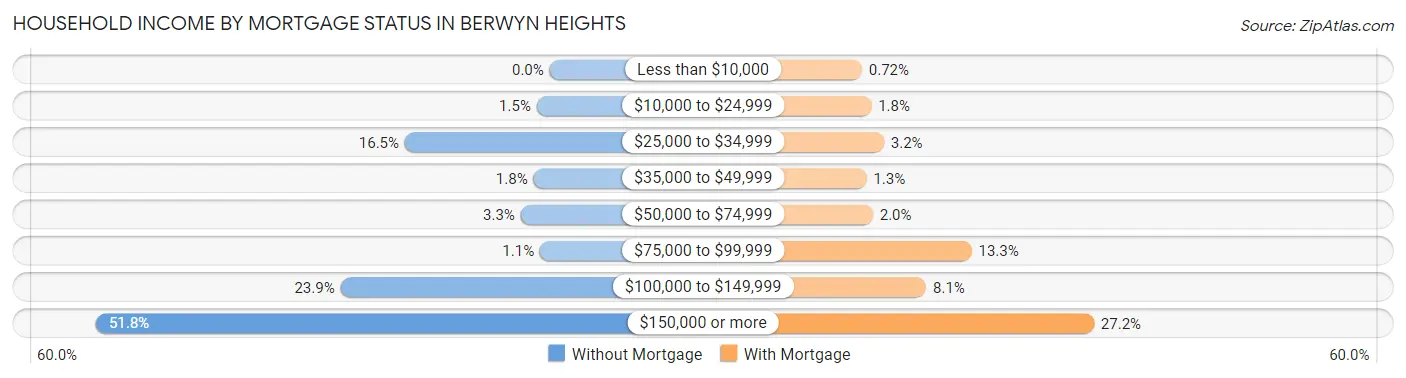
| Household Income | Without Mortgage | With Mortgage |
| Less than $10,000 | 0 (0.0%) | 4 (0.7%) |
| $10,000 to $24,999 | 4 (1.5%) | 10 (1.8%) |
| $25,000 to $34,999 | 45 (16.5%) | 18 (3.2%) |
| $35,000 to $49,999 | 5 (1.8%) | 7 (1.3%) |
| $50,000 to $74,999 | 9 (3.3%) | 11 (2.0%) |
| $75,000 to $99,999 | 3 (1.1%) | 74 (13.3%) |
| $100,000 to $149,999 | 65 (23.9%) | 45 (8.1%) |
| $150,000 or more | 141 (51.8%) | 152 (27.2%) |
| Total | 272 (100.0%) | 558 (100.0%) |
Property Value to Household Income Ratio in Berwyn Heights
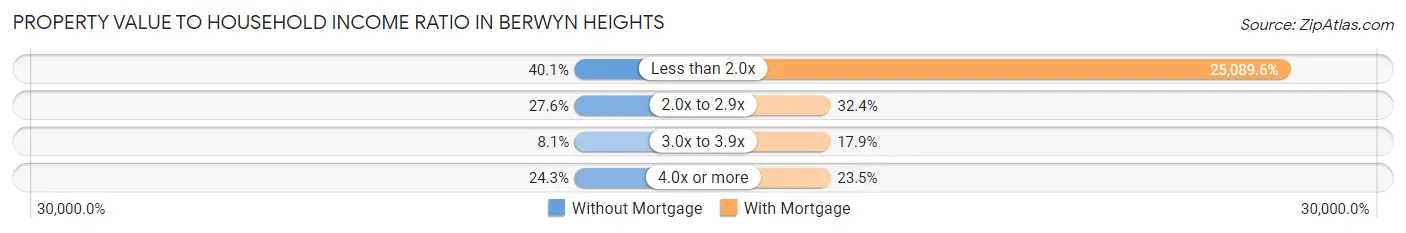
| Value-to-Income Ratio | Without Mortgage | With Mortgage |
| Less than 2.0x | 109 (40.1%) | 140,000 (25,089.6%) |
| 2.0x to 2.9x | 75 (27.6%) | 181 (32.4%) |
| 3.0x to 3.9x | 22 (8.1%) | 100 (17.9%) |
| 4.0x or more | 66 (24.3%) | 131 (23.5%) |
| Total | 272 (100.0%) | 558 (100.0%) |
Real Estate Taxes by Mortgage Status in Berwyn Heights
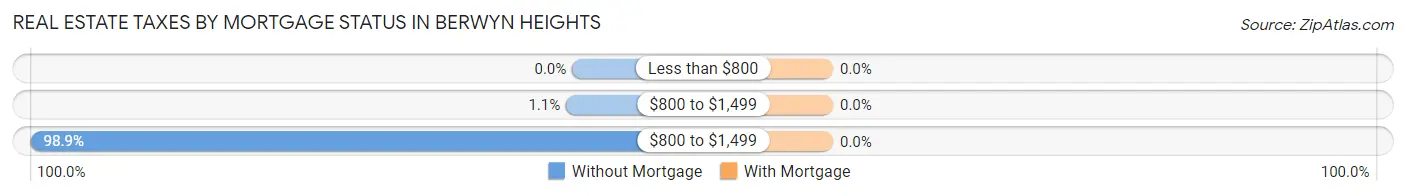
| Property Taxes | Without Mortgage | With Mortgage |
| Less than $800 | 0 (0.0%) | 0 (0.0%) |
| $800 to $1,499 | 3 (1.1%) | 0 (0.0%) |
| $800 to $1,499 | 269 (98.9%) | 0 (0.0%) |
| Total | 272 (100.0%) | 558 (100.0%) |
Health & Disability in Berwyn Heights
Health Insurance Coverage by Age in Berwyn Heights
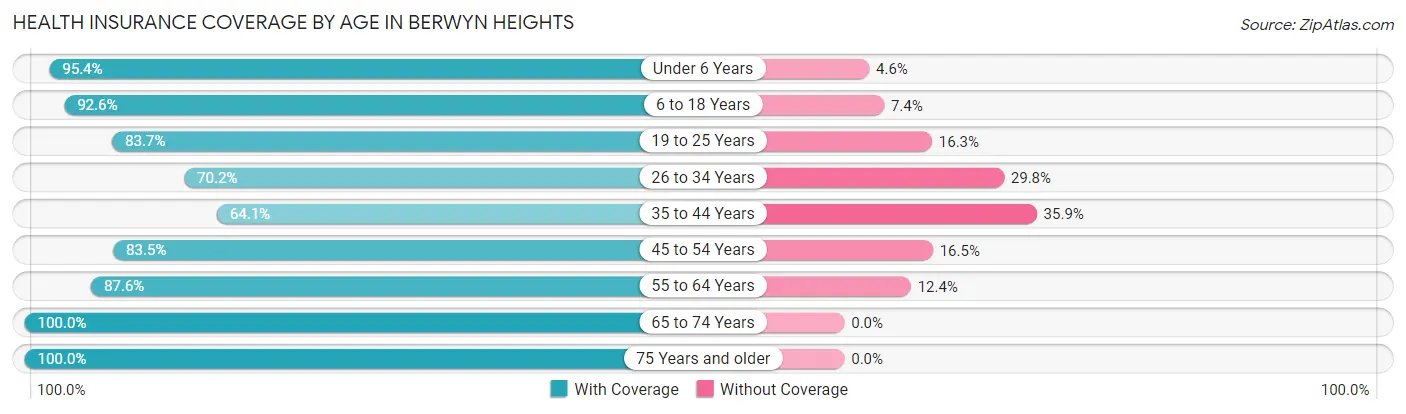
| Age Bracket | With Coverage | Without Coverage |
| Under 6 Years | 413 (95.4%) | 20 (4.6%) |
| 6 to 18 Years | 438 (92.6%) | 35 (7.4%) |
| 19 to 25 Years | 210 (83.7%) | 41 (16.3%) |
| 26 to 34 Years | 380 (70.2%) | 161 (29.8%) |
| 35 to 44 Years | 261 (64.1%) | 146 (35.9%) |
| 45 to 54 Years | 309 (83.5%) | 61 (16.5%) |
| 55 to 64 Years | 439 (87.6%) | 62 (12.4%) |
| 65 to 74 Years | 188 (100.0%) | 0 (0.0%) |
| 75 Years and older | 138 (100.0%) | 0 (0.0%) |
| Total | 2,776 (84.1%) | 526 (15.9%) |
Health Insurance Coverage by Citizenship Status in Berwyn Heights
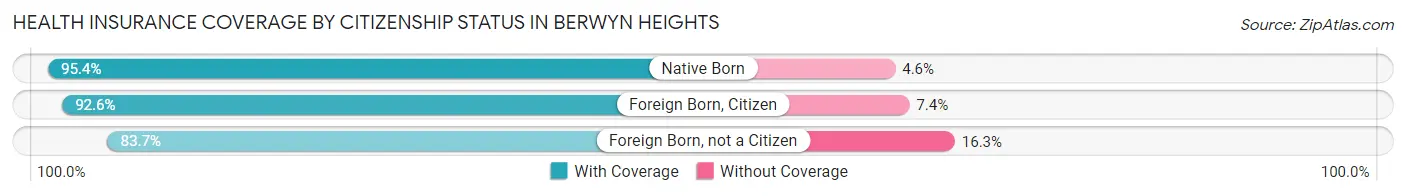
| Citizenship Status | With Coverage | Without Coverage |
| Native Born | 413 (95.4%) | 20 (4.6%) |
| Foreign Born, Citizen | 438 (92.6%) | 35 (7.4%) |
| Foreign Born, not a Citizen | 210 (83.7%) | 41 (16.3%) |
Health Insurance Coverage by Household Income in Berwyn Heights
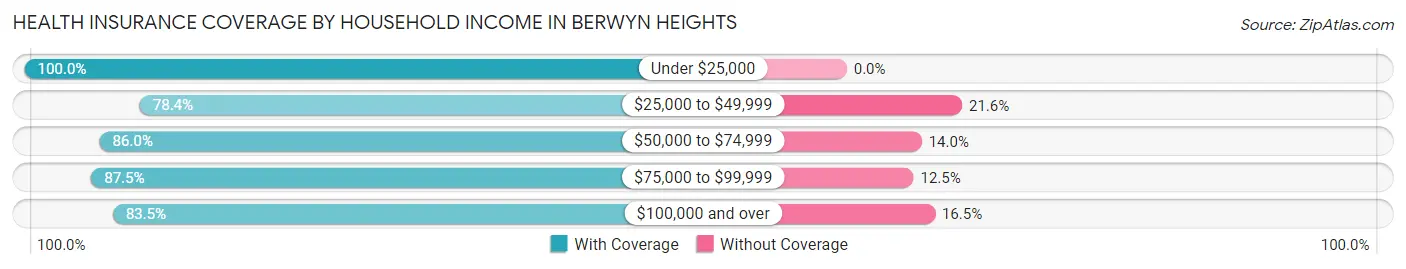
| Household Income | With Coverage | Without Coverage |
| Under $25,000 | 37 (100.0%) | 0 (0.0%) |
| $25,000 to $49,999 | 196 (78.4%) | 54 (21.6%) |
| $50,000 to $74,999 | 245 (86.0%) | 40 (14.0%) |
| $75,000 to $99,999 | 294 (87.5%) | 42 (12.5%) |
| $100,000 and over | 1,971 (83.5%) | 390 (16.5%) |
Public vs Private Health Insurance Coverage by Age in Berwyn Heights
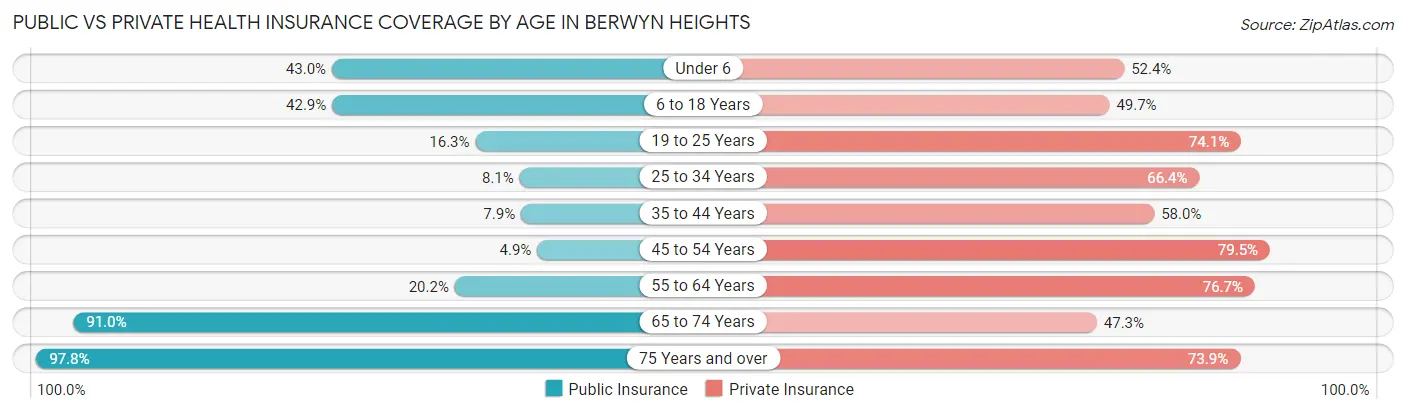
| Age Bracket | Public Insurance | Private Insurance |
| Under 6 | 186 (43.0%) | 227 (52.4%) |
| 6 to 18 Years | 203 (42.9%) | 235 (49.7%) |
| 19 to 25 Years | 41 (16.3%) | 186 (74.1%) |
| 25 to 34 Years | 44 (8.1%) | 359 (66.4%) |
| 35 to 44 Years | 32 (7.9%) | 236 (58.0%) |
| 45 to 54 Years | 18 (4.9%) | 294 (79.5%) |
| 55 to 64 Years | 101 (20.2%) | 384 (76.6%) |
| 65 to 74 Years | 171 (91.0%) | 89 (47.3%) |
| 75 Years and over | 135 (97.8%) | 102 (73.9%) |
| Total | 931 (28.2%) | 2,112 (64.0%) |
Disability Status by Sex by Age in Berwyn Heights
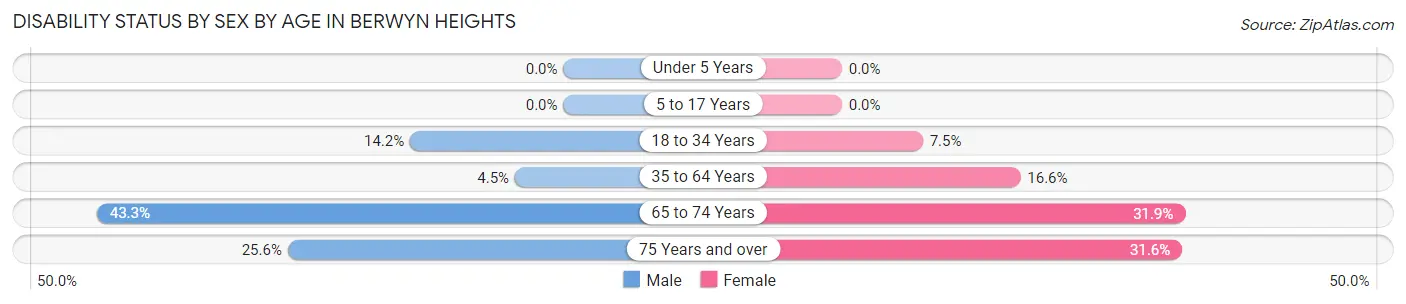
| Age Bracket | Male | Female |
| Under 5 Years | 0 (0.0%) | 0 (0.0%) |
| 5 to 17 Years | 0 (0.0%) | 0 (0.0%) |
| 18 to 34 Years | 67 (14.2%) | 28 (7.5%) |
| 35 to 64 Years | 33 (4.5%) | 90 (16.6%) |
| 65 to 74 Years | 42 (43.3%) | 29 (31.9%) |
| 75 Years and over | 11 (25.6%) | 30 (31.6%) |
Disability Class by Sex by Age in Berwyn Heights
Disability Class: Hearing Difficulty
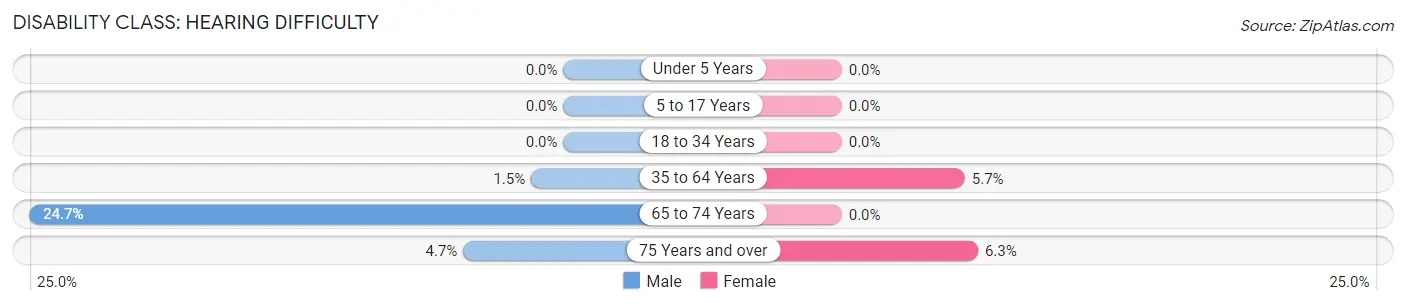
| Age Bracket | Male | Female |
| Under 5 Years | 0 (0.0%) | 0 (0.0%) |
| 5 to 17 Years | 0 (0.0%) | 0 (0.0%) |
| 18 to 34 Years | 0 (0.0%) | 0 (0.0%) |
| 35 to 64 Years | 11 (1.5%) | 31 (5.7%) |
| 65 to 74 Years | 24 (24.7%) | 0 (0.0%) |
| 75 Years and over | 2 (4.6%) | 6 (6.3%) |
Disability Class: Vision Difficulty
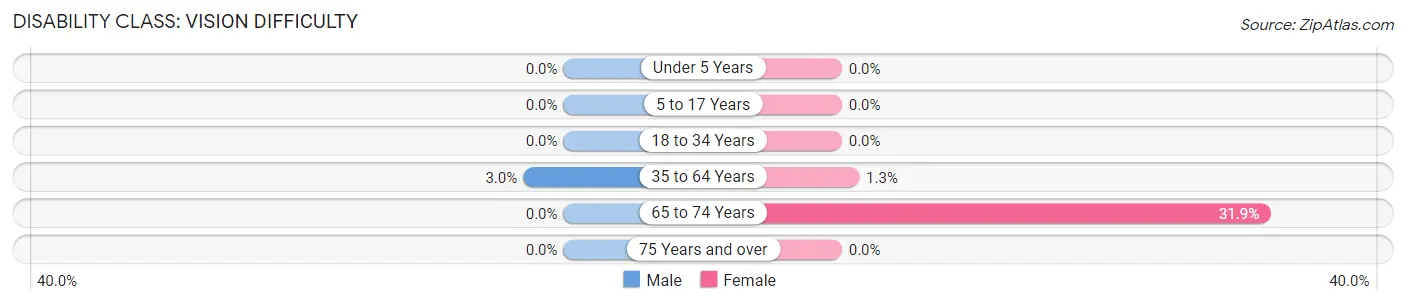
| Age Bracket | Male | Female |
| Under 5 Years | 0 (0.0%) | 0 (0.0%) |
| 5 to 17 Years | 0 (0.0%) | 0 (0.0%) |
| 18 to 34 Years | 0 (0.0%) | 0 (0.0%) |
| 35 to 64 Years | 22 (3.0%) | 7 (1.3%) |
| 65 to 74 Years | 0 (0.0%) | 29 (31.9%) |
| 75 Years and over | 0 (0.0%) | 0 (0.0%) |
Disability Class: Cognitive Difficulty
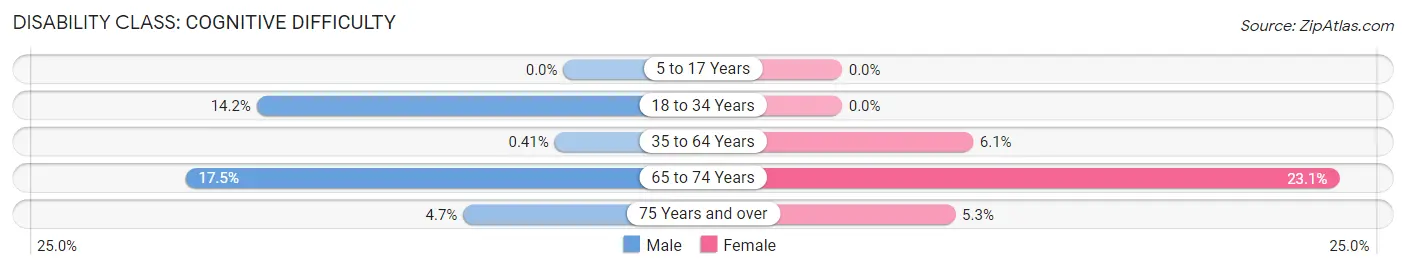
| Age Bracket | Male | Female |
| 5 to 17 Years | 0 (0.0%) | 0 (0.0%) |
| 18 to 34 Years | 67 (14.2%) | 0 (0.0%) |
| 35 to 64 Years | 3 (0.4%) | 33 (6.1%) |
| 65 to 74 Years | 17 (17.5%) | 21 (23.1%) |
| 75 Years and over | 2 (4.6%) | 5 (5.3%) |
Disability Class: Ambulatory Difficulty
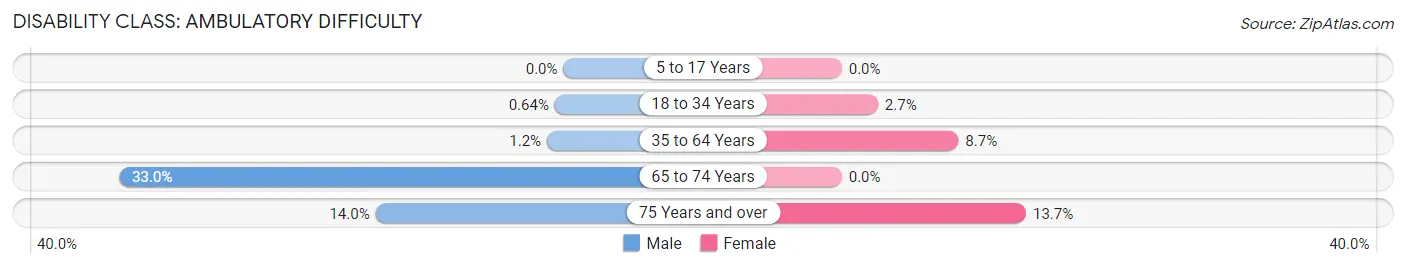
| Age Bracket | Male | Female |
| 5 to 17 Years | 0 (0.0%) | 0 (0.0%) |
| 18 to 34 Years | 3 (0.6%) | 10 (2.7%) |
| 35 to 64 Years | 9 (1.2%) | 47 (8.7%) |
| 65 to 74 Years | 32 (33.0%) | 0 (0.0%) |
| 75 Years and over | 6 (14.0%) | 13 (13.7%) |
Disability Class: Self-Care Difficulty
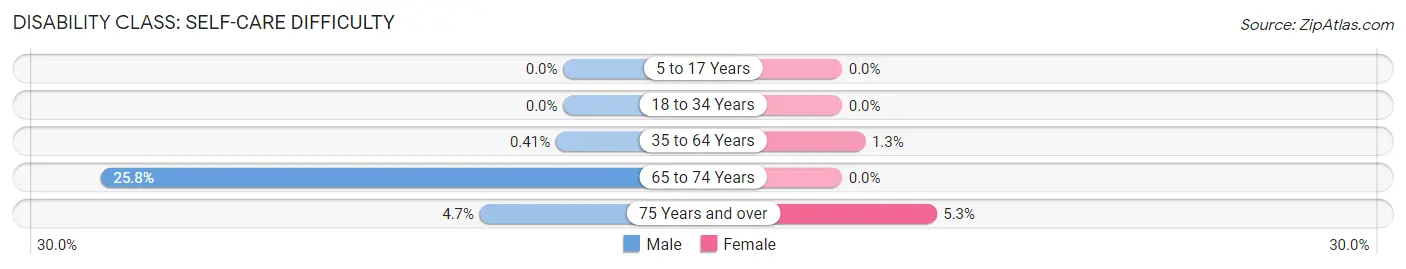
| Age Bracket | Male | Female |
| 5 to 17 Years | 0 (0.0%) | 0 (0.0%) |
| 18 to 34 Years | 0 (0.0%) | 0 (0.0%) |
| 35 to 64 Years | 3 (0.4%) | 7 (1.3%) |
| 65 to 74 Years | 25 (25.8%) | 0 (0.0%) |
| 75 Years and over | 2 (4.6%) | 5 (5.3%) |
Technology Access in Berwyn Heights
Computing Device Access in Berwyn Heights
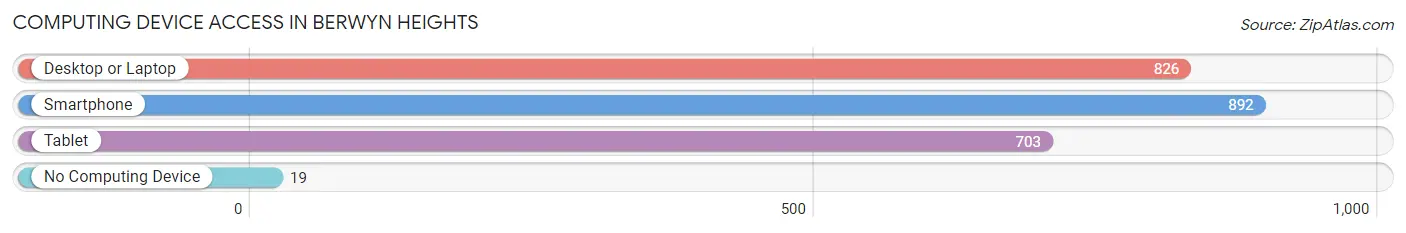
| Device Type | # Households | % Households |
| Desktop or Laptop | 826 | 86.0% |
| Smartphone | 892 | 92.9% |
| Tablet | 703 | 73.2% |
| No Computing Device | 19 | 2.0% |
| Total | 960 | 100.0% |
Internet Access in Berwyn Heights
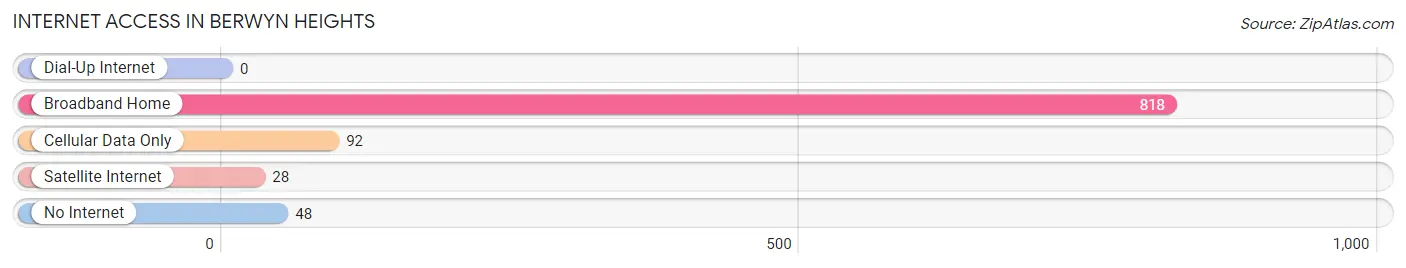
| Internet Type | # Households | % Households |
| Dial-Up Internet | 0 | 0.0% |
| Broadband Home | 818 | 85.2% |
| Cellular Data Only | 92 | 9.6% |
| Satellite Internet | 28 | 2.9% |
| No Internet | 48 | 5.0% |
| Total | 960 | 100.0% |
Berwyn Heights Summary
Berwyn Heights, Maryland is a small town located in Prince George’s County, Maryland. It is situated just east of the Washington, D.C. border and is part of the Washington metropolitan area. The town is home to approximately 3,000 people and is known for its small-town charm and close-knit community.
History
Berwyn Heights was founded in 1887 by a group of farmers who wanted to create a small, rural community. The town was named after Berwyn, a small village in Wales. The town was originally a farming community, but as the Washington, D.C. area grew, so did Berwyn Heights. In the early 1900s, the town began to attract more residents and businesses, and by the 1950s, it had become a popular suburb of Washington, D.C.
Geography
Berwyn Heights is located in Prince George’s County, Maryland, just east of the Washington, D.C. border. The town is situated on a hill, and is surrounded by the towns of College Park, Greenbelt, and Hyattsville. The town is bordered by the Northwest Branch of the Anacostia River to the north and the Northeast Branch of the Anacostia River to the south. The town is located in the Piedmont region of Maryland, and is characterized by rolling hills and wooded areas.
Economy
Berwyn Heights is a small, residential community, and the majority of its residents are employed in the Washington, D.C. area. The town does not have any major industries or businesses, but there are several small businesses located in the town, including restaurants, retail stores, and professional services. The town is also home to the University of Maryland, College Park, which is one of the largest employers in the area.
Demographics
As of the 2010 census, the population of Berwyn Heights was 3,068. The town is predominantly white (77.3%), with African Americans (14.2%), Asians (4.2%), and Hispanics (3.3%) making up the remainder of the population. The median household income in the town is $90,945, and the median home value is $346,400.
Berwyn Heights is a small, close-knit community that is known for its small-town charm and friendly atmosphere. The town is home to a diverse population, and is a popular suburb of Washington, D.C. The town is a great place to live, work, and raise a family, and is a great example of a small town in the Washington metropolitan area.
Common Questions
What is Per Capita Income in Berwyn Heights?
Per Capita income in Berwyn Heights is $45,548.
What is the Median Family Income in Berwyn Heights?
Median Family Income in Berwyn Heights is $135,756.
What is the Median Household income in Berwyn Heights?
Median Household Income in Berwyn Heights is $132,625.
What is Income or Wage Gap in Berwyn Heights?
Income or Wage Gap in Berwyn Heights is 16.8%.
Women in Berwyn Heights earn 83.2 cents for every dollar earned by a man.
What is Inequality or Gini Index in Berwyn Heights?
Inequality or Gini Index in Berwyn Heights is 0.35.
What is the Total Population of Berwyn Heights?
Total Population of Berwyn Heights is 3,312.
What is the Total Male Population of Berwyn Heights?
Total Male Population of Berwyn Heights is 1,837.
What is the Total Female Population of Berwyn Heights?
Total Female Population of Berwyn Heights is 1,475.
What is the Ratio of Males per 100 Females in Berwyn Heights?
There are 124.54 Males per 100 Females in Berwyn Heights.
What is the Ratio of Females per 100 Males in Berwyn Heights?
There are 80.29 Females per 100 Males in Berwyn Heights.
What is the Median Population Age in Berwyn Heights?
Median Population Age in Berwyn Heights is 34.1 Years.
What is the Average Family Size in Berwyn Heights
Average Family Size in Berwyn Heights is 4.0 People.
What is the Average Household Size in Berwyn Heights
Average Household Size in Berwyn Heights is 3.4 People.
How Large is the Labor Force in Berwyn Heights?
There are 1,760 People in the Labor Forcein in Berwyn Heights.
What is the Percentage of People in the Labor Force in Berwyn Heights?
70.9% of People are in the Labor Force in Berwyn Heights.
What is the Unemployment Rate in Berwyn Heights?
Unemployment Rate in Berwyn Heights is 4.8%.