Jugtown, MD Map & Demographics
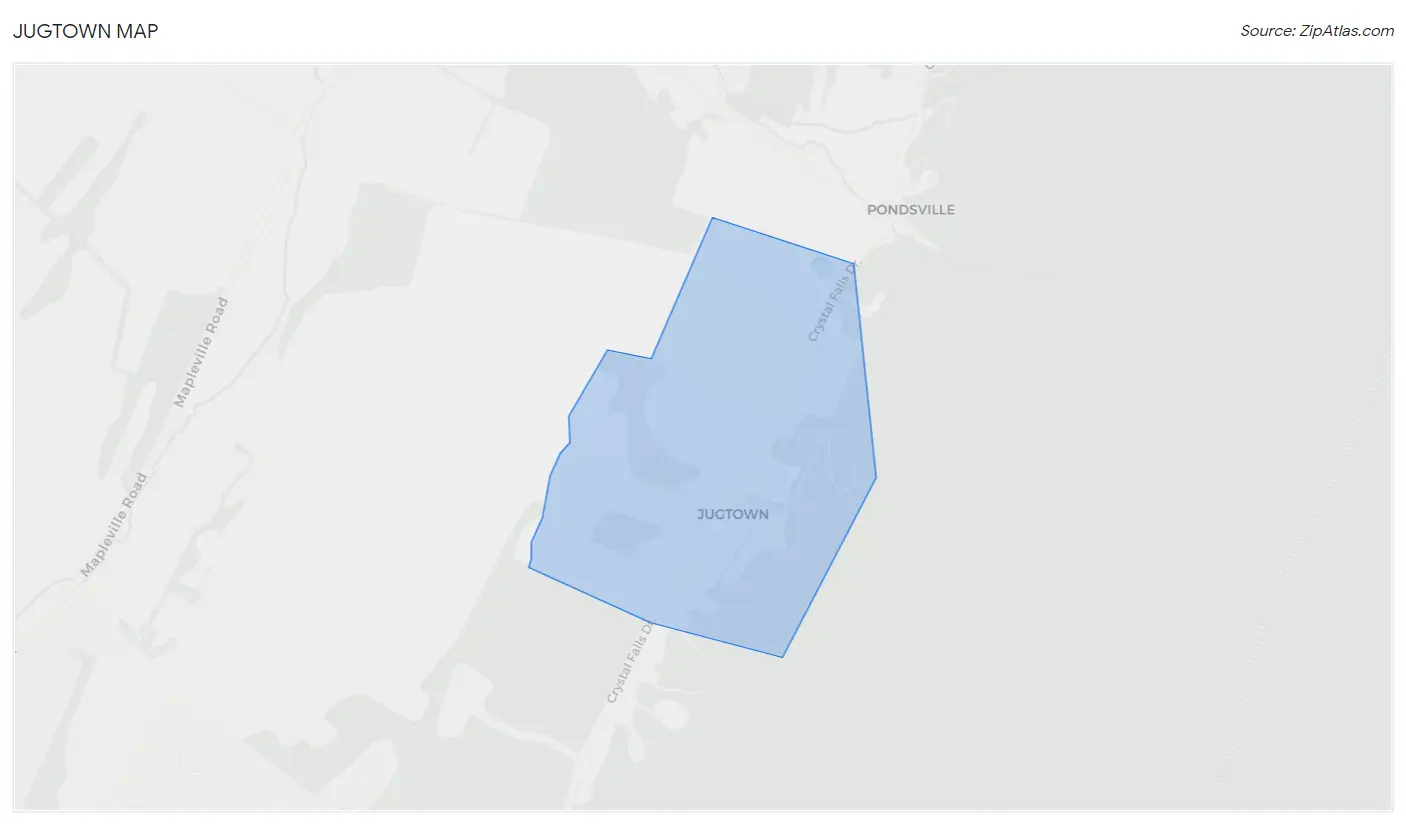
Jugtown Map
Jugtown Overview
$44,256
PER CAPITA INCOME
$250,001
AVG FAMILY INCOME
$187,159
AVG HOUSEHOLD INCOME
0.27
INEQUALITY / GINI INDEX
142
TOTAL POPULATION
77
MALE POPULATION
65
FEMALE POPULATION
118.46
MALES / 100 FEMALES
84.42
FEMALES / 100 MALES
29.8
MEDIAN AGE
5.0
AVG FAMILY SIZE
4.1
AVG HOUSEHOLD SIZE
77
LABOR FORCE [ PEOPLE ]
82.8%
PERCENT IN LABOR FORCE
Income in Jugtown
Income Overview in Jugtown
Per Capita Income in Jugtown is $44,256, while median incomes of families and households are $250,001 and $187,159 respectively.
| Characteristic | Number | Measure |
| Per Capita Income | 142 | $44,256 |
| Median Family Income | 27 | $250,001 |
| Mean Family Income | 27 | $232,163 |
| Median Household Income | 35 | $187,159 |
| Mean Household Income | 35 | $183,446 |
| Income Deficit | 27 | $0 |
| Wage / Income Gap (%) | 142 | 0.00% |
| Wage / Income Gap ($) | 142 | 100.00¢ per $1 |
| Gini / Inequality Index | 142 | 0.27 |
Earnings by Sex in Jugtown
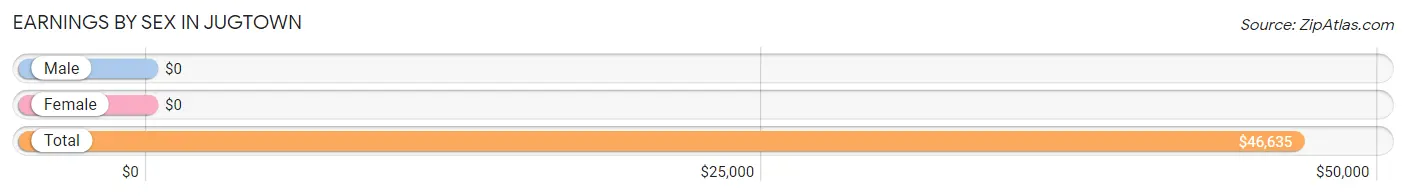
| Sex | Number | Average Earnings |
| Male | 41 (53.2%) | $0 |
| Female | 36 (46.8%) | $0 |
| Total | 77 (100.0%) | $46,635 |
Earnings by Sex by Income Bracket in Jugtown
The most common earnings brackets in Jugtown are $100,000+ for men (21 | 51.2%) and $12,500 to $14,999 for women (15 | 41.7%).
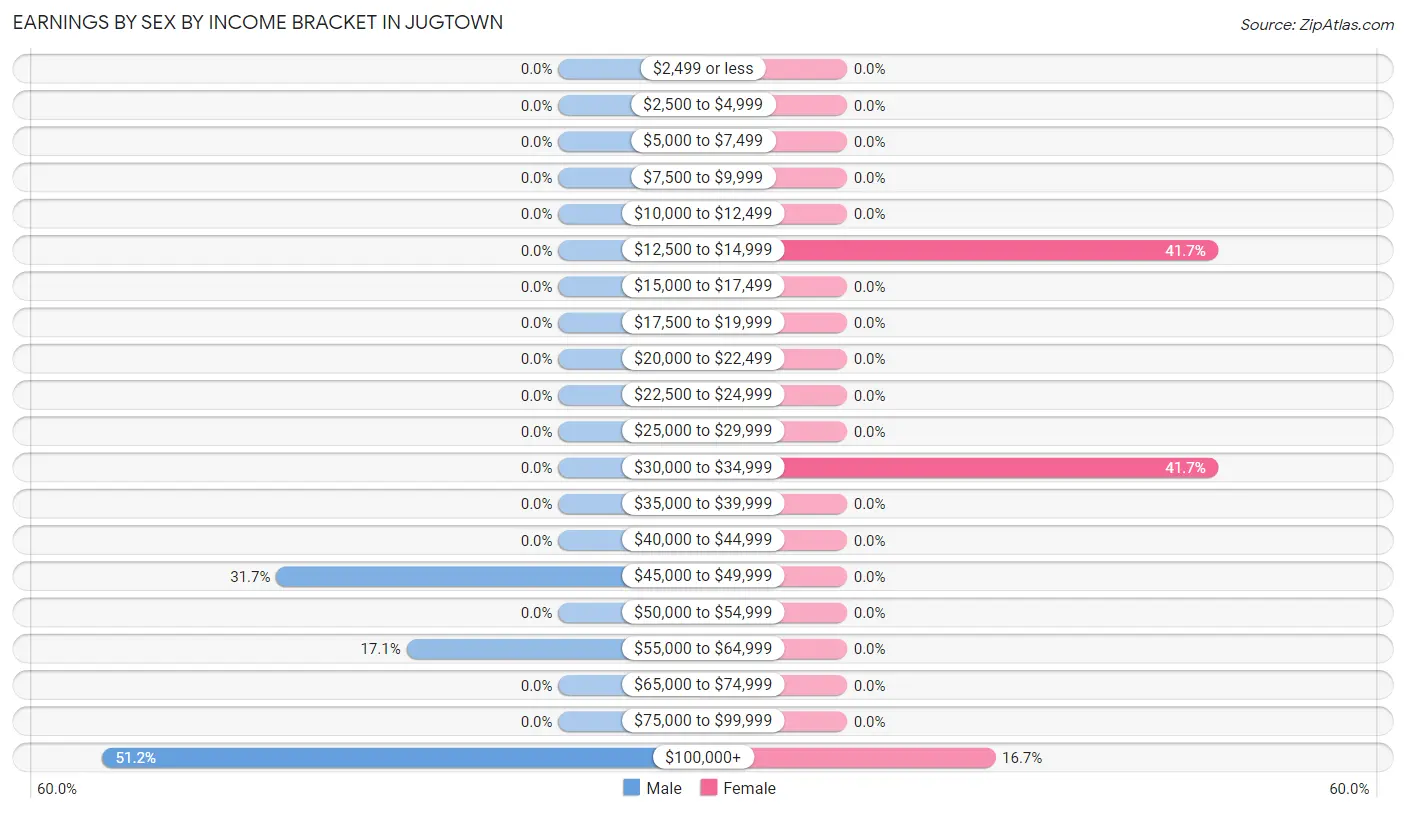
| Income | Male | Female |
| $2,499 or less | 0 (0.0%) | 0 (0.0%) |
| $2,500 to $4,999 | 0 (0.0%) | 0 (0.0%) |
| $5,000 to $7,499 | 0 (0.0%) | 0 (0.0%) |
| $7,500 to $9,999 | 0 (0.0%) | 0 (0.0%) |
| $10,000 to $12,499 | 0 (0.0%) | 0 (0.0%) |
| $12,500 to $14,999 | 0 (0.0%) | 15 (41.7%) |
| $15,000 to $17,499 | 0 (0.0%) | 0 (0.0%) |
| $17,500 to $19,999 | 0 (0.0%) | 0 (0.0%) |
| $20,000 to $22,499 | 0 (0.0%) | 0 (0.0%) |
| $22,500 to $24,999 | 0 (0.0%) | 0 (0.0%) |
| $25,000 to $29,999 | 0 (0.0%) | 0 (0.0%) |
| $30,000 to $34,999 | 0 (0.0%) | 15 (41.7%) |
| $35,000 to $39,999 | 0 (0.0%) | 0 (0.0%) |
| $40,000 to $44,999 | 0 (0.0%) | 0 (0.0%) |
| $45,000 to $49,999 | 13 (31.7%) | 0 (0.0%) |
| $50,000 to $54,999 | 0 (0.0%) | 0 (0.0%) |
| $55,000 to $64,999 | 7 (17.1%) | 0 (0.0%) |
| $65,000 to $74,999 | 0 (0.0%) | 0 (0.0%) |
| $75,000 to $99,999 | 0 (0.0%) | 0 (0.0%) |
| $100,000+ | 21 (51.2%) | 6 (16.7%) |
| Total | 41 (100.0%) | 36 (100.0%) |
Earnings by Sex by Educational Attainment in Jugtown
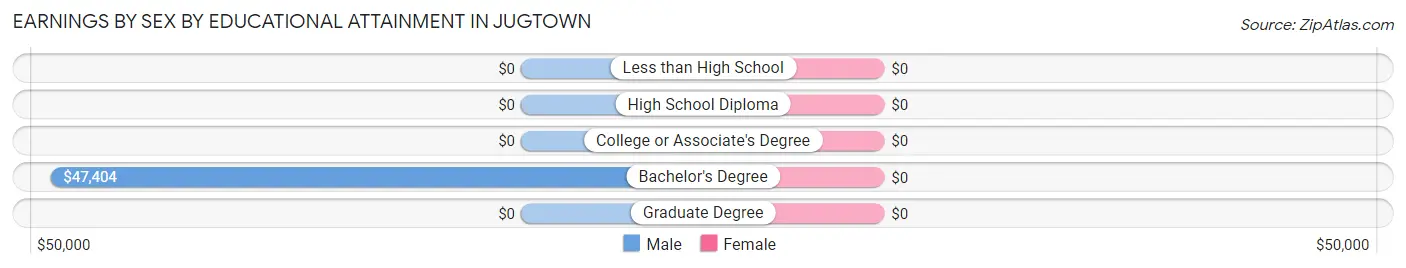
| Educational Attainment | Male Income | Female Income |
| Less than High School | - | - |
| High School Diploma | - | - |
| College or Associate's Degree | - | - |
| Bachelor's Degree | $47,404 | $0 |
| Graduate Degree | - | - |
| Total | - | - |
Family Income in Jugtown
Family Income Brackets in Jugtown
According to the Jugtown family income data, there are 16 families falling into the $200,000+ income range, which is the most common income bracket and makes up 59.3% of all families.
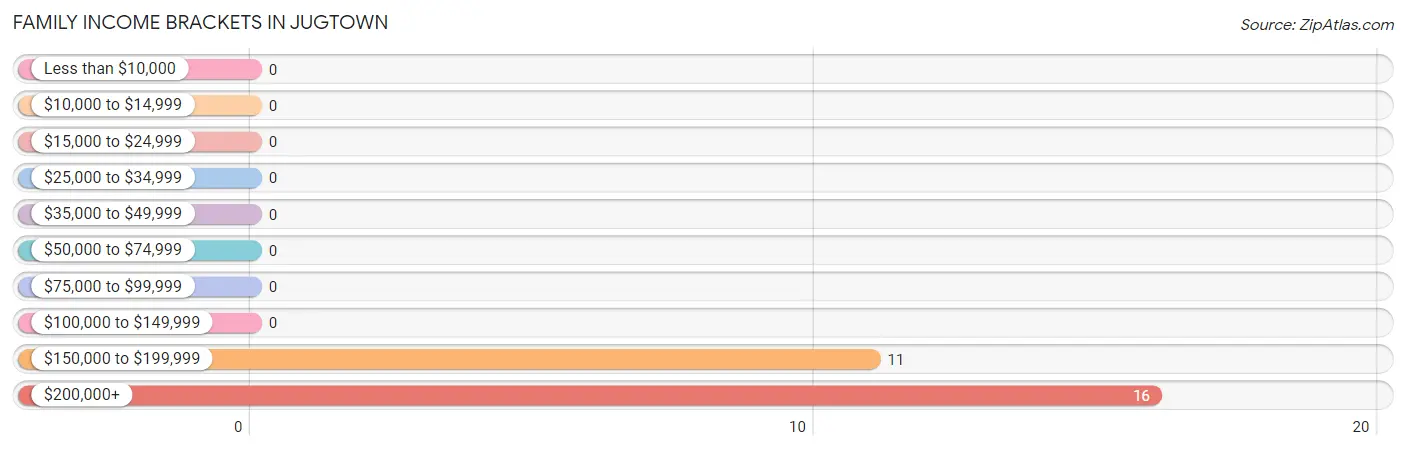
| Income Bracket | # Families | % Families |
| Less than $10,000 | 0 | 0.0% |
| $10,000 to $14,999 | 0 | 0.0% |
| $15,000 to $24,999 | 0 | 0.0% |
| $25,000 to $34,999 | 0 | 0.0% |
| $35,000 to $49,999 | 0 | 0.0% |
| $50,000 to $74,999 | 0 | 0.0% |
| $75,000 to $99,999 | 0 | 0.0% |
| $100,000 to $149,999 | 0 | 0.0% |
| $150,000 to $199,999 | 11 | 40.7% |
| $200,000+ | 16 | 59.3% |
Family Income by Famaliy Size in Jugtown
| Income Bracket | # Families | Median Income |
| 2-Person Families | 5 (18.5%) | $0 |
| 3-Person Families | 0 (0.0%) | $0 |
| 4-Person Families | 0 (0.0%) | $0 |
| 5-Person Families | 6 (22.2%) | $0 |
| 6-Person Families | 16 (59.3%) | $0 |
| 7+ Person Families | 0 (0.0%) | $0 |
| Total | 27 (100.0%) | $250,001 |
Family Income by Number of Earners in Jugtown
| Number of Earners | # Families | Median Income |
| No Earners | 0 (0.0%) | $0 |
| 1 Earner | 5 (18.5%) | $0 |
| 2 Earners | 6 (22.2%) | $0 |
| 3+ Earners | 16 (59.3%) | $0 |
| Total | 27 (100.0%) | $250,001 |
Household Income in Jugtown
Household Income Brackets in Jugtown
With 16 households falling in the category, the $200,000+ income range is the most frequent in Jugtown, accounting for 45.7% of all households.
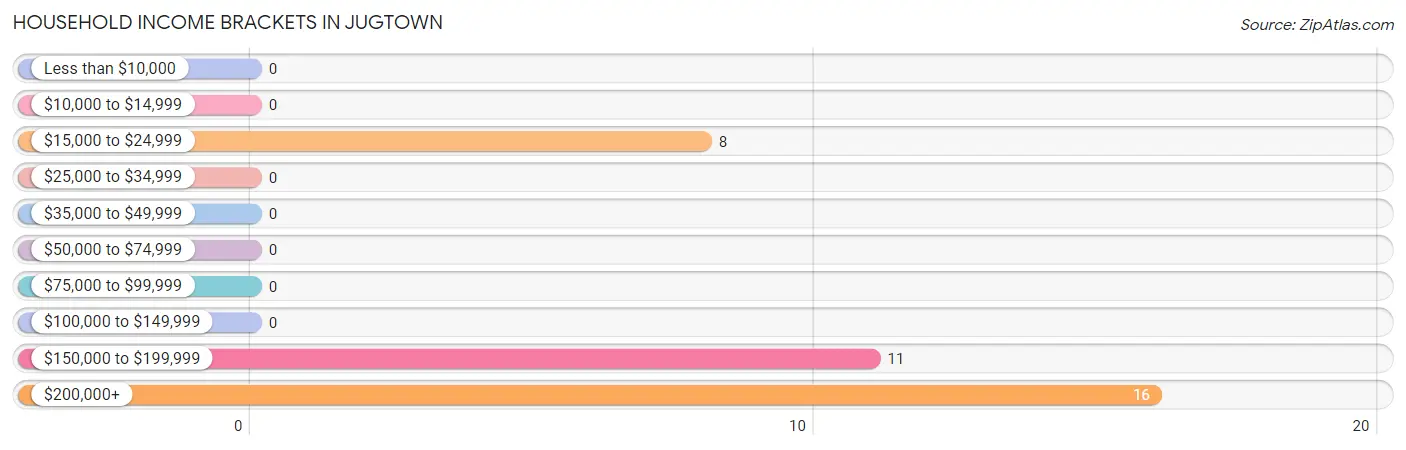
| Income Bracket | # Households | % Households |
| Less than $10,000 | 0 | 0.0% |
| $10,000 to $14,999 | 0 | 0.0% |
| $15,000 to $24,999 | 8 | 22.9% |
| $25,000 to $34,999 | 0 | 0.0% |
| $35,000 to $49,999 | 0 | 0.0% |
| $50,000 to $74,999 | 0 | 0.0% |
| $75,000 to $99,999 | 0 | 0.0% |
| $100,000 to $149,999 | 0 | 0.0% |
| $150,000 to $199,999 | 11 | 31.4% |
| $200,000+ | 16 | 45.7% |
Household Income by Householder Age in Jugtown
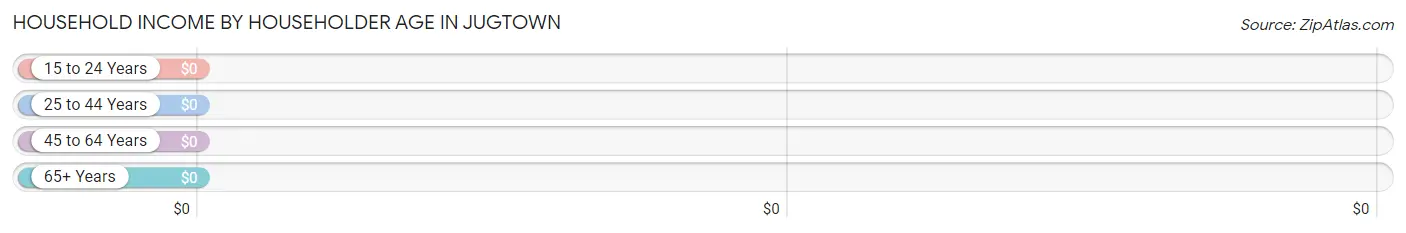
| Income Bracket | # Households | Median Income |
| 15 to 24 Years | 0 (0.0%) | $0 |
| 25 to 44 Years | 6 (17.1%) | $0 |
| 45 to 64 Years | 21 (60.0%) | $0 |
| 65+ Years | 8 (22.9%) | $0 |
| Total | 35 (100.0%) | $187,159 |
Poverty in Jugtown
Income Below Poverty by Sex and Age in Jugtown
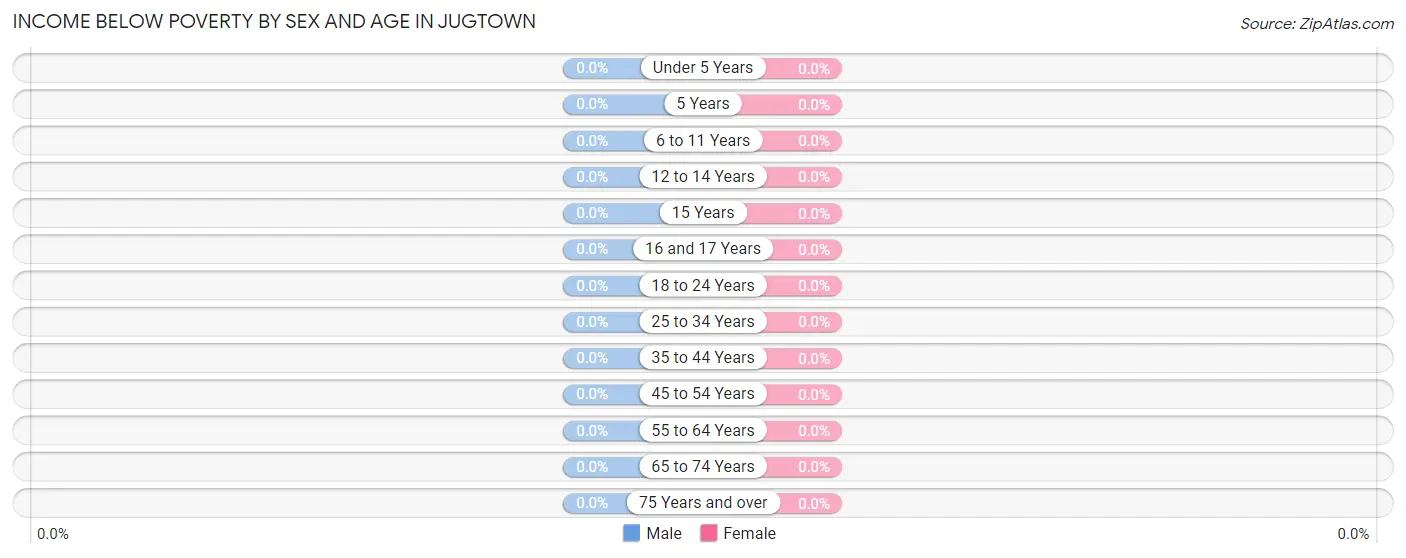
| Age Bracket | Male | Female |
| Under 5 Years | 0 (0.0%) | 0 (0.0%) |
| 5 Years | 0 (0.0%) | 0 (0.0%) |
| 6 to 11 Years | 0 (0.0%) | 0 (0.0%) |
| 12 to 14 Years | 0 (0.0%) | 0 (0.0%) |
| 15 Years | 0 (0.0%) | 0 (0.0%) |
| 16 and 17 Years | 0 (0.0%) | 0 (0.0%) |
| 18 to 24 Years | 0 (0.0%) | 0 (0.0%) |
| 25 to 34 Years | 0 (0.0%) | 0 (0.0%) |
| 35 to 44 Years | 0 (0.0%) | 0 (0.0%) |
| 45 to 54 Years | 0 (0.0%) | 0 (0.0%) |
| 55 to 64 Years | 0 (0.0%) | 0 (0.0%) |
| 65 to 74 Years | 0 (0.0%) | 0 (0.0%) |
| 75 Years and over | 0 (0.0%) | 0 (0.0%) |
| Total | 0 (0.0%) | 0 (0.0%) |
Income Above Poverty by Sex and Age in Jugtown
According to the poverty statistics in Jugtown, males aged 6 to 11 years and females aged 5 years are the age groups that are most secure financially, with 100.0% of males and 100.0% of females in these age groups living above the poverty line.
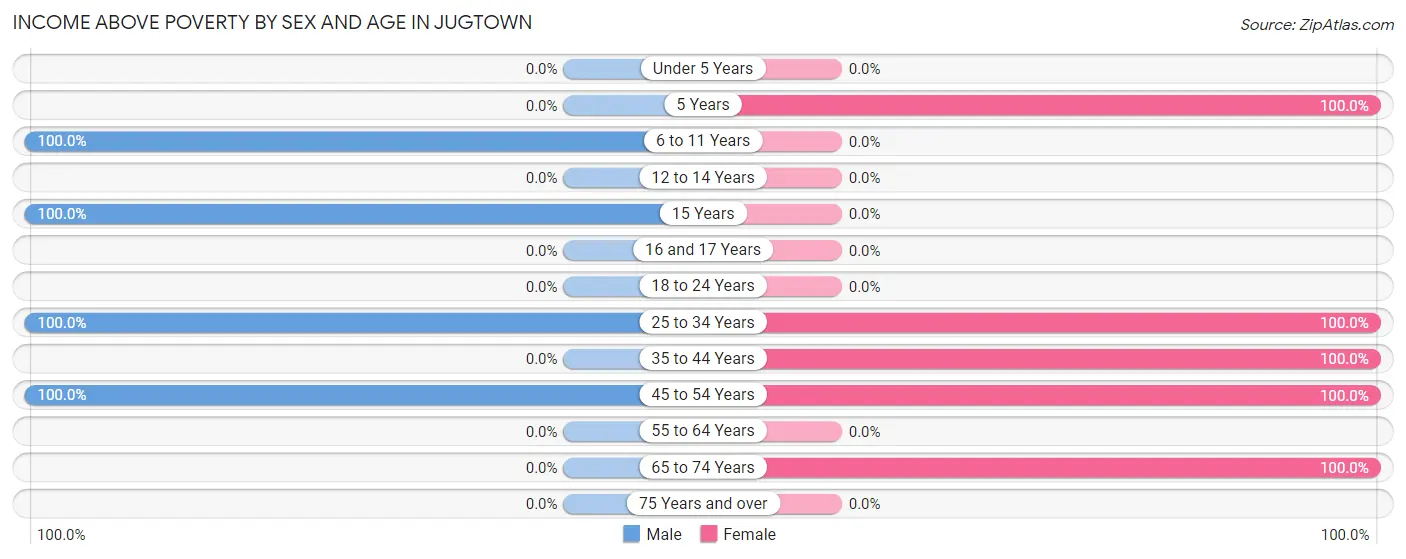
| Age Bracket | Male | Female |
| Under 5 Years | 0 (0.0%) | 0 (0.0%) |
| 5 Years | 0 (0.0%) | 13 (100.0%) |
| 6 to 11 Years | 28 (100.0%) | 0 (0.0%) |
| 12 to 14 Years | 0 (0.0%) | 0 (0.0%) |
| 15 Years | 8 (100.0%) | 0 (0.0%) |
| 16 and 17 Years | 0 (0.0%) | 0 (0.0%) |
| 18 to 24 Years | 0 (0.0%) | 0 (0.0%) |
| 25 to 34 Years | 13 (100.0%) | 15 (100.0%) |
| 35 to 44 Years | 0 (0.0%) | 6 (100.0%) |
| 45 to 54 Years | 28 (100.0%) | 23 (100.0%) |
| 55 to 64 Years | 0 (0.0%) | 0 (0.0%) |
| 65 to 74 Years | 0 (0.0%) | 8 (100.0%) |
| 75 Years and over | 0 (0.0%) | 0 (0.0%) |
| Total | 77 (100.0%) | 65 (100.0%) |
Income Below Poverty Among Married-Couple Families in Jugtown
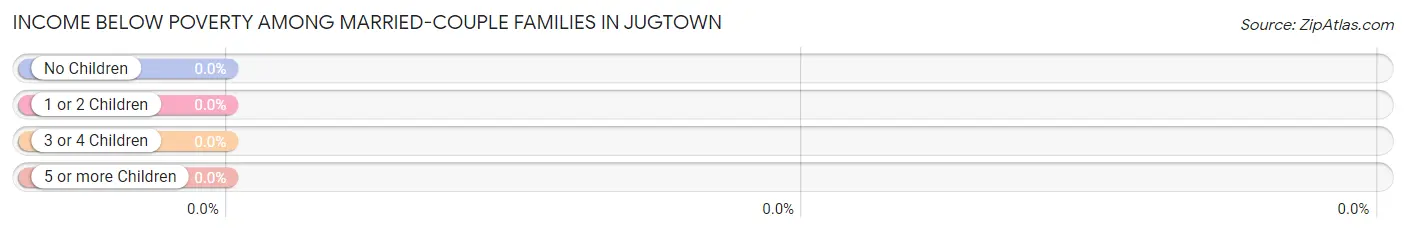
| Children | Above Poverty | Below Poverty |
| No Children | 5 (100.0%) | 0 (0.0%) |
| 1 or 2 Children | 16 (100.0%) | 0 (0.0%) |
| 3 or 4 Children | 6 (100.0%) | 0 (0.0%) |
| 5 or more Children | 0 (0.0%) | 0 (0.0%) |
| Total | 27 (100.0%) | 0 (0.0%) |
Income Below Poverty Among Single-Parent Households in Jugtown
| Children | Single Father | Single Mother |
| No Children | 0 (0.0%) | 0 (0.0%) |
| 1 or 2 Children | 0 (0.0%) | 0 (0.0%) |
| 3 or 4 Children | 0 (0.0%) | 0 (0.0%) |
| 5 or more Children | 0 (0.0%) | 0 (0.0%) |
| Total | 0 (0.0%) | 0 (0.0%) |
Income Below Poverty Among Married-Couple vs Single-Parent Households in Jugtown
| Children | Married-Couple Families | Single-Parent Households |
| No Children | 0 (0.0%) | 0 (0.0%) |
| 1 or 2 Children | 0 (0.0%) | 0 (0.0%) |
| 3 or 4 Children | 0 (0.0%) | 0 (0.0%) |
| 5 or more Children | 0 (0.0%) | 0 (0.0%) |
| Total | 0 (0.0%) | 0 (0.0%) |
Race in Jugtown
The most populous races in Jugtown are , and White / Caucasian (142 | 100.0%).
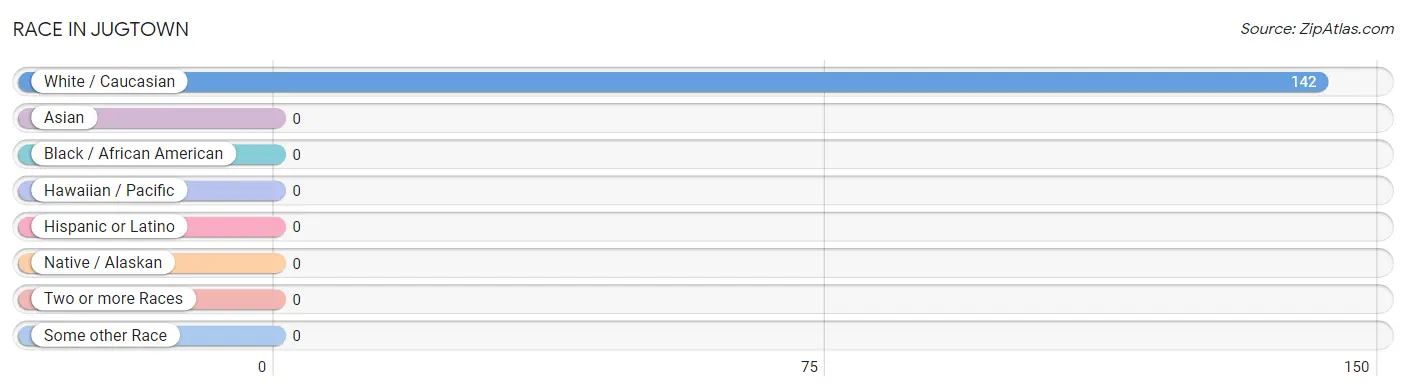
| Race | # Population | % Population |
| Asian | 0 | 0.0% |
| Black / African American | 0 | 0.0% |
| Hawaiian / Pacific | 0 | 0.0% |
| Hispanic or Latino | 0 | 0.0% |
| Native / Alaskan | 0 | 0.0% |
| White / Caucasian | 142 | 100.0% |
| Two or more Races | 0 | 0.0% |
| Some other Race | 0 | 0.0% |
| Total | 142 | 100.0% |
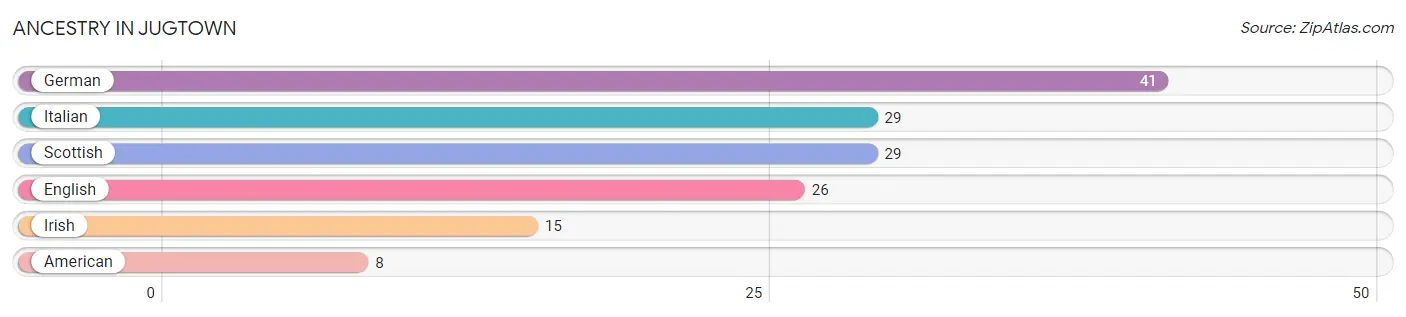
Ancestry in Jugtown
The most populous ancestries reported in Jugtown are German (41 | 28.9%), Italian (29 | 20.4%), Scottish (29 | 20.4%), English (26 | 18.3%), and Irish (15 | 10.6%), together accounting for 98.6% of all Jugtown residents.
| Ancestry | # Population | % Population |
| American | 8 | 5.6% |
| English | 26 | 18.3% |
| German | 41 | 28.9% |
| Irish | 15 | 10.6% |
| Italian | 29 | 20.4% |
| Scottish | 29 | 20.4% | View All 6 Rows |
Immigrants in Jugtown

| Immigration Origin | # Population | % Population | View All 0 Rows |
Sex and Age in Jugtown
Sex and Age in Jugtown
The most populous age groups in Jugtown are 5 to 9 Years (21 | 27.3%) for men and 50 to 54 Years (23 | 35.4%) for women.
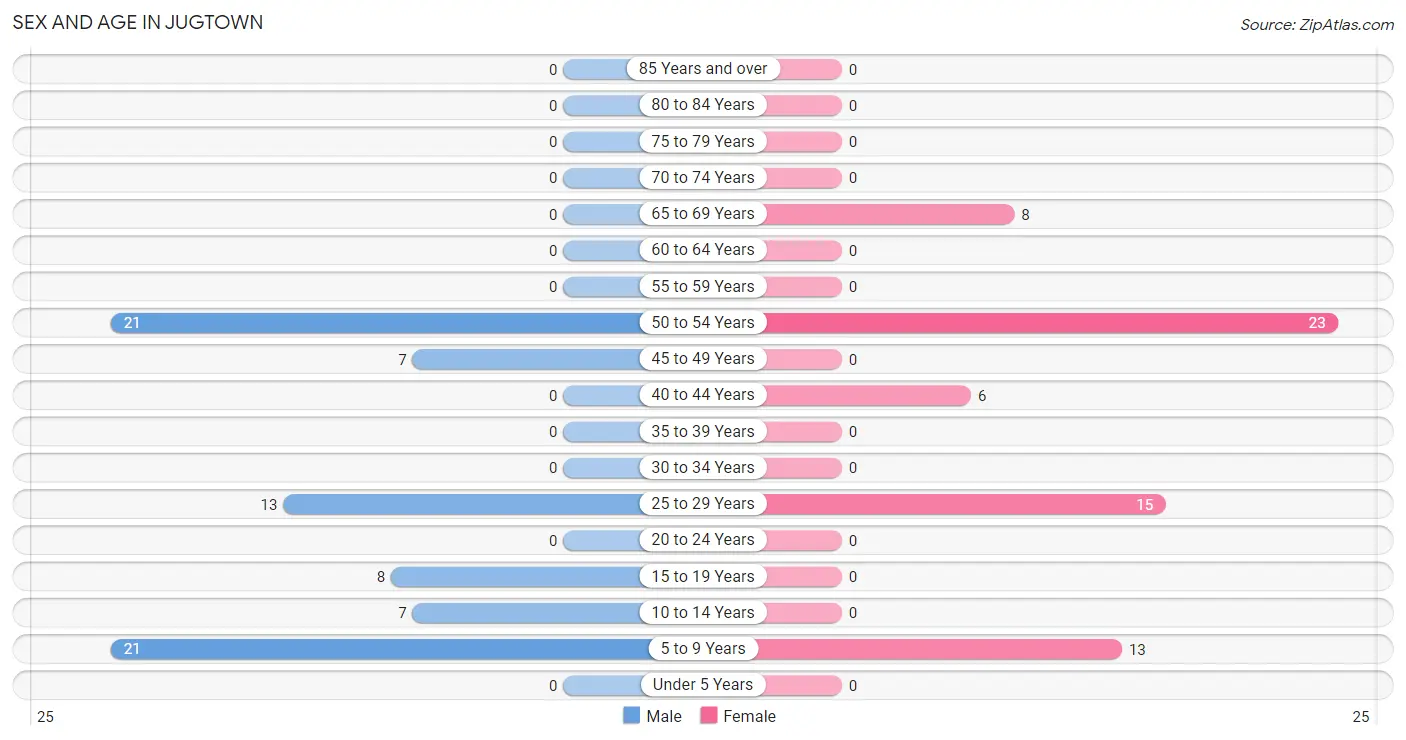
| Age Bracket | Male | Female |
| Under 5 Years | 0 (0.0%) | 0 (0.0%) |
| 5 to 9 Years | 21 (27.3%) | 13 (20.0%) |
| 10 to 14 Years | 7 (9.1%) | 0 (0.0%) |
| 15 to 19 Years | 8 (10.4%) | 0 (0.0%) |
| 20 to 24 Years | 0 (0.0%) | 0 (0.0%) |
| 25 to 29 Years | 13 (16.9%) | 15 (23.1%) |
| 30 to 34 Years | 0 (0.0%) | 0 (0.0%) |
| 35 to 39 Years | 0 (0.0%) | 0 (0.0%) |
| 40 to 44 Years | 0 (0.0%) | 6 (9.2%) |
| 45 to 49 Years | 7 (9.1%) | 0 (0.0%) |
| 50 to 54 Years | 21 (27.3%) | 23 (35.4%) |
| 55 to 59 Years | 0 (0.0%) | 0 (0.0%) |
| 60 to 64 Years | 0 (0.0%) | 0 (0.0%) |
| 65 to 69 Years | 0 (0.0%) | 8 (12.3%) |
| 70 to 74 Years | 0 (0.0%) | 0 (0.0%) |
| 75 to 79 Years | 0 (0.0%) | 0 (0.0%) |
| 80 to 84 Years | 0 (0.0%) | 0 (0.0%) |
| 85 Years and over | 0 (0.0%) | 0 (0.0%) |
| Total | 77 (100.0%) | 65 (100.0%) |
Families and Households in Jugtown
Median Family Size in Jugtown
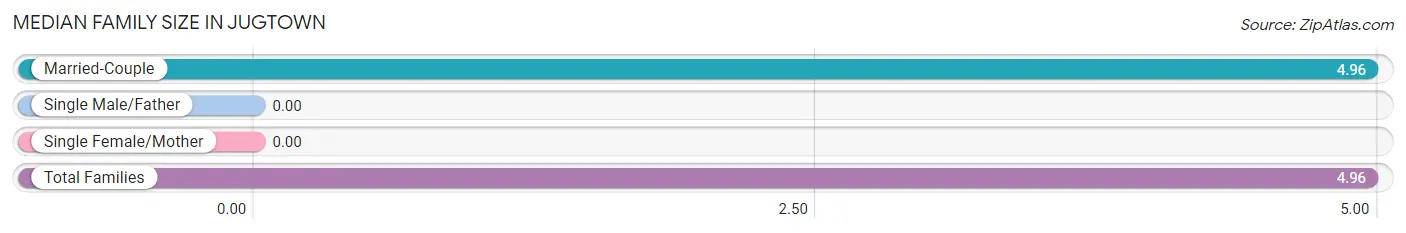
| Family Type | # Families | Family Size |
| Married-Couple | 27 (100.0%) | 4.96 |
| Single Male/Father | 0 (0.0%) | - |
| Single Female/Mother | 0 (0.0%) | - |
| Total Families | 27 (100.0%) | 4.96 |
Median Household Size in Jugtown
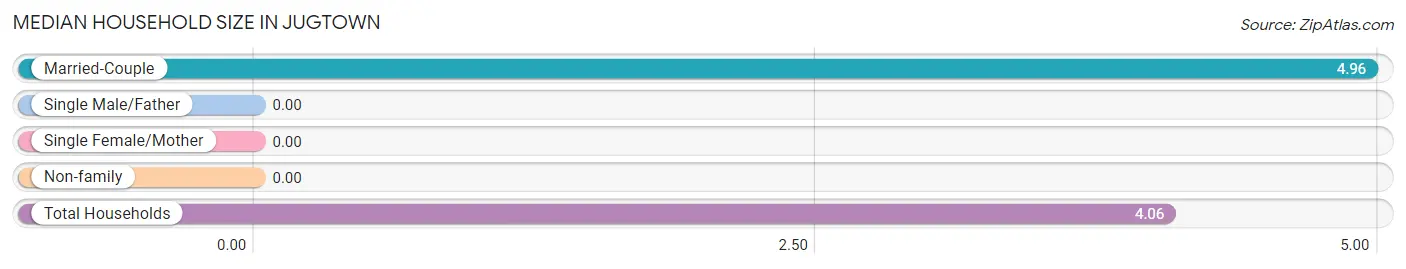
| Household Type | # Households | Household Size |
| Married-Couple | 27 (77.1%) | 4.96 |
| Single Male/Father | 0 (0.0%) | - |
| Single Female/Mother | 0 (0.0%) | - |
| Non-family | 8 (22.9%) | - |
| Total Households | 35 (100.0%) | 4.06 |
Household Size by Marriage Status in Jugtown
Out of a total of 35 households in Jugtown, 27 (77.1%) are family households, while 8 (22.9%) are nonfamily households. The most numerous type of family households are 6-person households, comprising 16, and the most common type of nonfamily households are 1-person households, comprising 8.
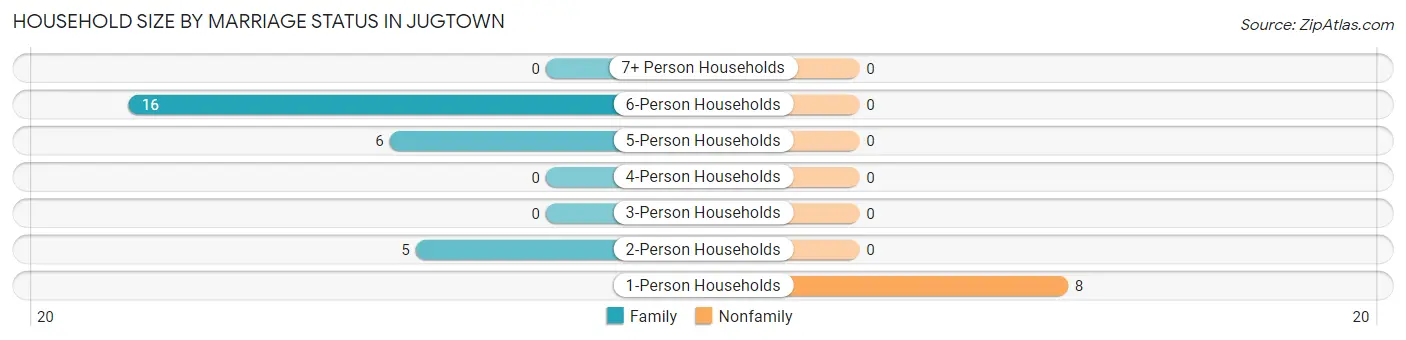
| Household Size | Family Households | Nonfamily Households |
| 1-Person Households | - | 8 (22.9%) |
| 2-Person Households | 5 (14.3%) | 0 (0.0%) |
| 3-Person Households | 0 (0.0%) | 0 (0.0%) |
| 4-Person Households | 0 (0.0%) | 0 (0.0%) |
| 5-Person Households | 6 (17.1%) | 0 (0.0%) |
| 6-Person Households | 16 (45.7%) | 0 (0.0%) |
| 7+ Person Households | 0 (0.0%) | 0 (0.0%) |
| Total | 27 (77.1%) | 8 (22.9%) |
Female Fertility in Jugtown
Fertility by Age in Jugtown
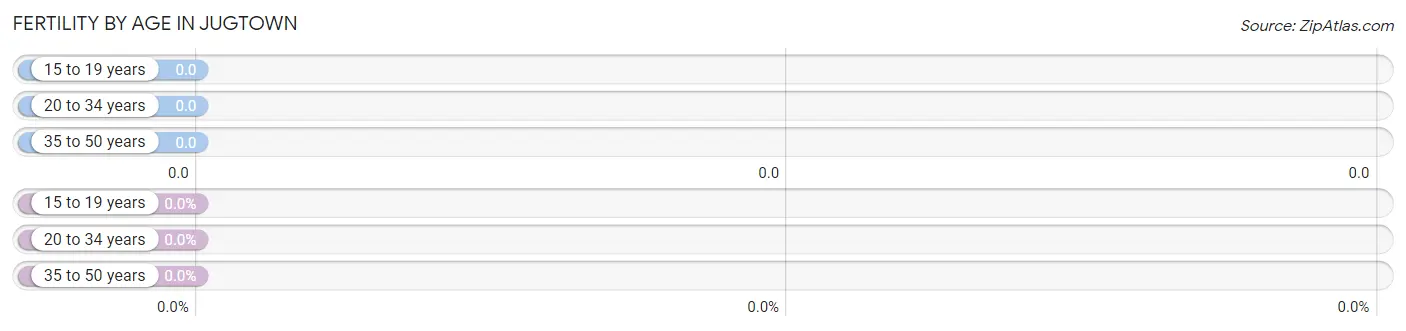
| Age Bracket | Women with Births | Births / 1,000 Women |
| 15 to 19 years | 0 (0.0%) | 0.0 |
| 20 to 34 years | 0 (0.0%) | 0.0 |
| 35 to 50 years | 0 (0.0%) | 0.0 |
| Total | 0 (0.0%) | 0.0 |
Fertility by Age by Marriage Status in Jugtown
| Age Bracket | Married | Unmarried |
| 15 to 19 years | 0 (0.0%) | 0 (0.0%) |
| 20 to 34 years | 0 (0.0%) | 0 (0.0%) |
| 35 to 50 years | 0 (0.0%) | 0 (0.0%) |
| Total | 0 (0.0%) | 0 (0.0%) |
Fertility by Education in Jugtown
| Educational Attainment | Women with Births | Births / 1,000 Women |
| Less than High School | 0 (0.0%) | 0.0 |
| High School Diploma | 0 (0.0%) | 0.0 |
| College or Associate's Degree | 0 (0.0%) | 0.0 |
| Bachelor's Degree | 0 (0.0%) | 0.0 |
| Graduate Degree | 0 (0.0%) | 0.0 |
| Total | 0 (0.0%) | 0.0 |
Fertility by Education by Marriage Status in Jugtown
| Educational Attainment | Married | Unmarried |
| Less than High School | 0 (0.0%) | 0 (0.0%) |
| High School Diploma | 0 (0.0%) | 0 (0.0%) |
| College or Associate's Degree | 0 (0.0%) | 0 (0.0%) |
| Bachelor's Degree | 0 (0.0%) | 0 (0.0%) |
| Graduate Degree | 0 (0.0%) | 0 (0.0%) |
| Total | 0 (0.0%) | 0 (0.0%) |
Employment Characteristics in Jugtown
Employment by Class of Employer in Jugtown
Among the 77 employed individuals in Jugtown, private company employees (71 | 92.2%), and not-for-profit organizations (6 | 7.8%) make up the most common classes of employment.
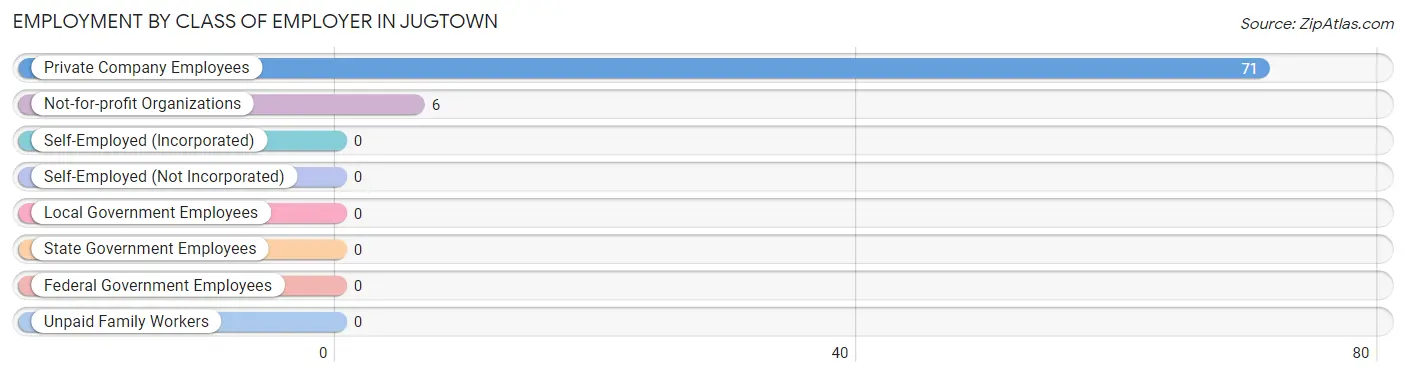
| Employer Class | # Employees | % Employees |
| Private Company Employees | 71 | 92.2% |
| Self-Employed (Incorporated) | 0 | 0.0% |
| Self-Employed (Not Incorporated) | 0 | 0.0% |
| Not-for-profit Organizations | 6 | 7.8% |
| Local Government Employees | 0 | 0.0% |
| State Government Employees | 0 | 0.0% |
| Federal Government Employees | 0 | 0.0% |
| Unpaid Family Workers | 0 | 0.0% |
| Total | 77 | 100.0% |
Employment Status by Age in Jugtown
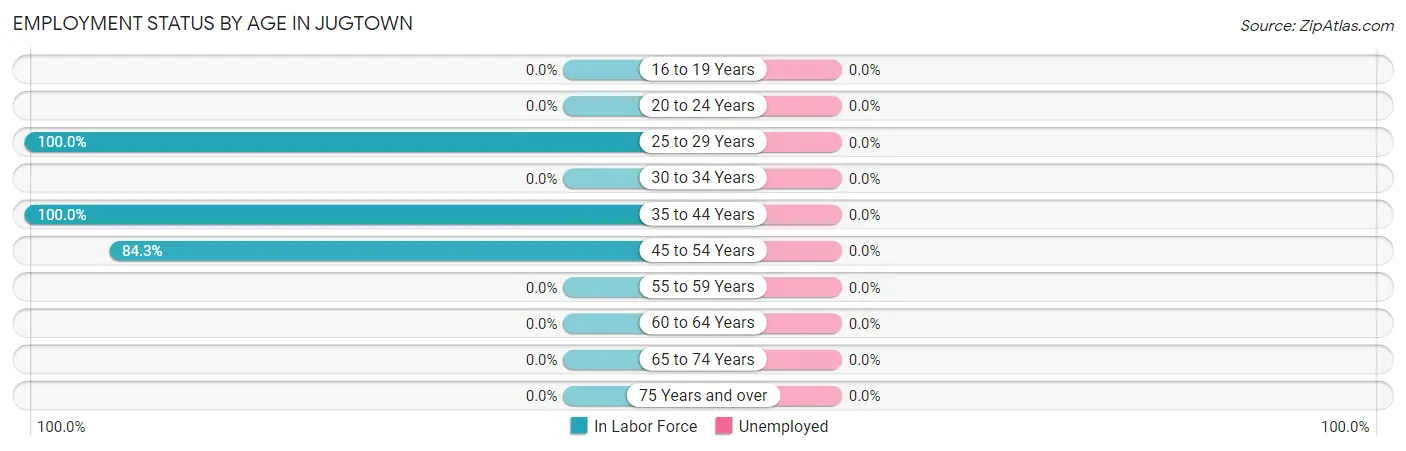
| Age Bracket | In Labor Force | Unemployed |
| 16 to 19 Years | 0 (0.0%) | 0 (0.0%) |
| 20 to 24 Years | 0 (0.0%) | 0 (0.0%) |
| 25 to 29 Years | 28 (100.0%) | 0 (0.0%) |
| 30 to 34 Years | 0 (0.0%) | 0 (0.0%) |
| 35 to 44 Years | 6 (100.0%) | 0 (0.0%) |
| 45 to 54 Years | 43 (84.3%) | 0 (0.0%) |
| 55 to 59 Years | 0 (0.0%) | 0 (0.0%) |
| 60 to 64 Years | 0 (0.0%) | 0 (0.0%) |
| 65 to 74 Years | 0 (0.0%) | 0 (0.0%) |
| 75 Years and over | 0 (0.0%) | 0 (0.0%) |
| Total | 77 (82.8%) | 0 (0.0%) |
Employment Status by Educational Attainment in Jugtown
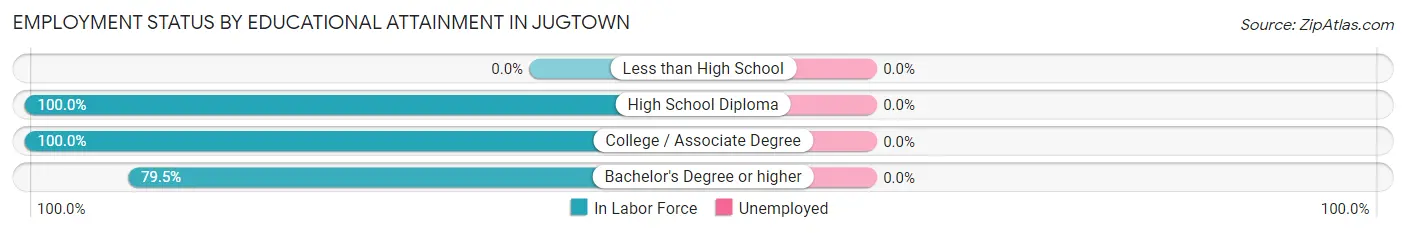
| Educational Attainment | In Labor Force | Unemployed |
| Less than High School | 0 (0.0%) | 0 (0.0%) |
| High School Diploma | 15 (100.0%) | 0 (0.0%) |
| College / Associate Degree | 31 (100.0%) | 0 (0.0%) |
| Bachelor's Degree or higher | 31 (79.5%) | 0 (0.0%) |
| Total | 77 (90.6%) | 0 (0.0%) |
Employment Occupations by Sex in Jugtown
Management, Business, Science and Arts Occupations
The most common Management, Business, Science and Arts occupations in Jugtown are Computers, Engineering & Science (16 | 20.8%), Architecture & Engineering (16 | 20.8%), Health Diagnosing & Treating (6 | 7.8%), Health Technologists (6 | 7.8%), and Management (5 | 6.5%).
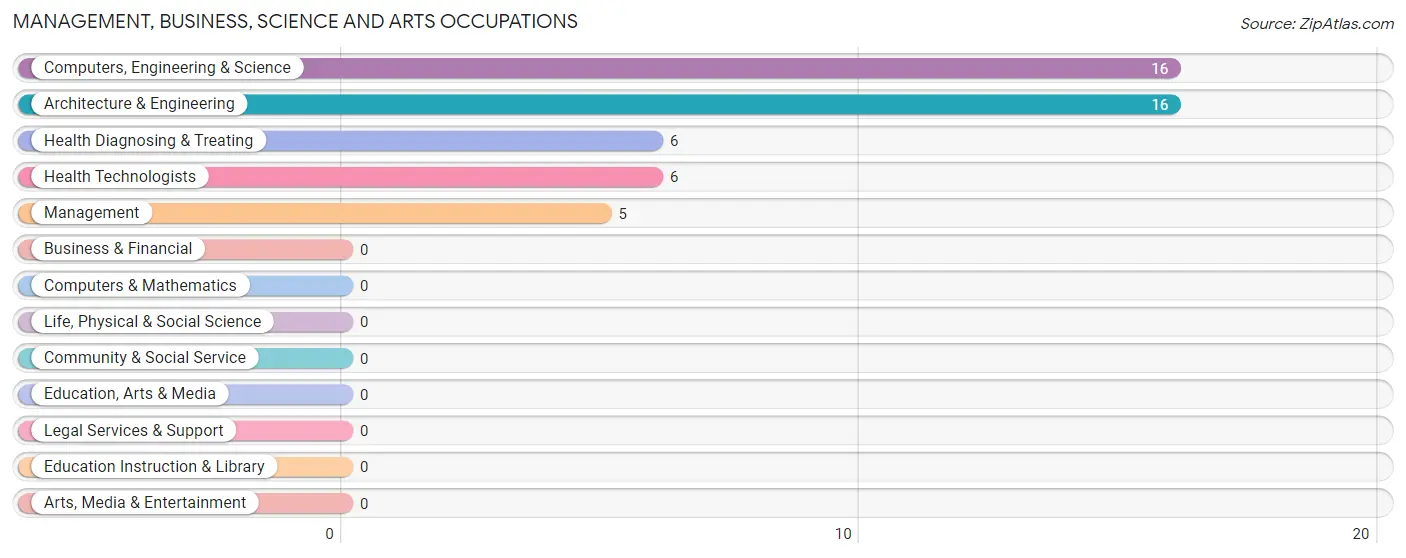
Management, Business, Science and Arts Occupations by Sex
Within the Management, Business, Science and Arts occupations in Jugtown, the most male-oriented occupations are Management (100.0%), Computers, Engineering & Science (100.0%), and Architecture & Engineering (100.0%), while the most female-oriented occupations are Health Diagnosing & Treating (100.0%), and Health Technologists (100.0%).
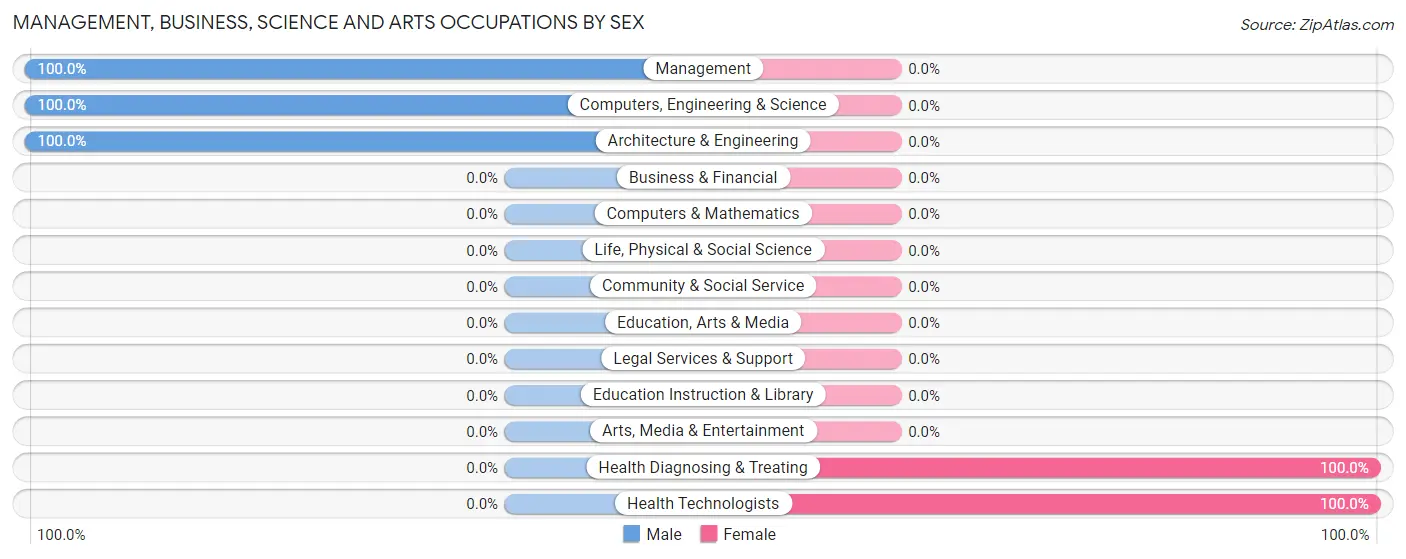
| Occupation | Male | Female |
| Management | 5 (100.0%) | 0 (0.0%) |
| Business & Financial | 0 (0.0%) | 0 (0.0%) |
| Computers, Engineering & Science | 16 (100.0%) | 0 (0.0%) |
| Computers & Mathematics | 0 (0.0%) | 0 (0.0%) |
| Architecture & Engineering | 16 (100.0%) | 0 (0.0%) |
| Life, Physical & Social Science | 0 (0.0%) | 0 (0.0%) |
| Community & Social Service | 0 (0.0%) | 0 (0.0%) |
| Education, Arts & Media | 0 (0.0%) | 0 (0.0%) |
| Legal Services & Support | 0 (0.0%) | 0 (0.0%) |
| Education Instruction & Library | 0 (0.0%) | 0 (0.0%) |
| Arts, Media & Entertainment | 0 (0.0%) | 0 (0.0%) |
| Health Diagnosing & Treating | 0 (0.0%) | 6 (100.0%) |
| Health Technologists | 0 (0.0%) | 6 (100.0%) |
| Total (Category) | 21 (77.8%) | 6 (22.2%) |
| Total (Overall) | 41 (53.2%) | 36 (46.8%) |
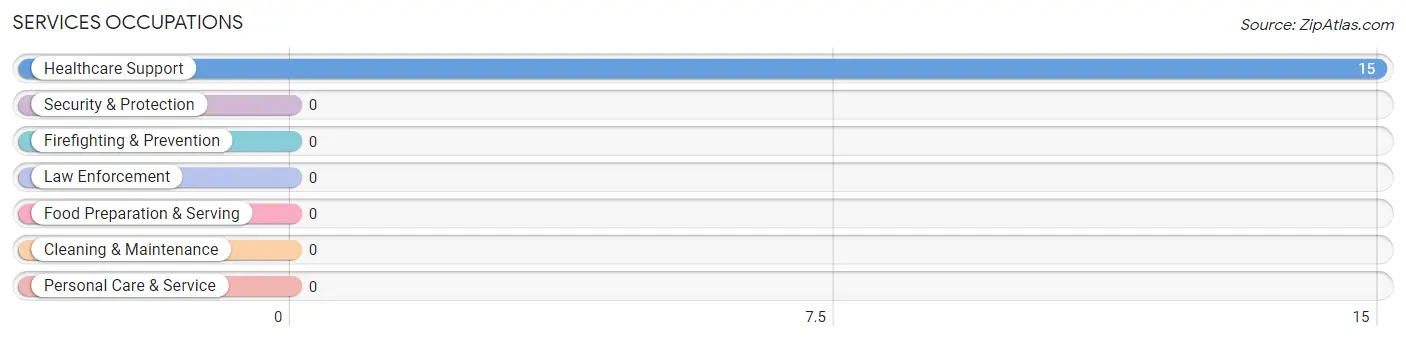
Services Occupations
The most common Services occupations in Jugtown are , and Healthcare Support (15 | 19.5%).
Services Occupations by Sex
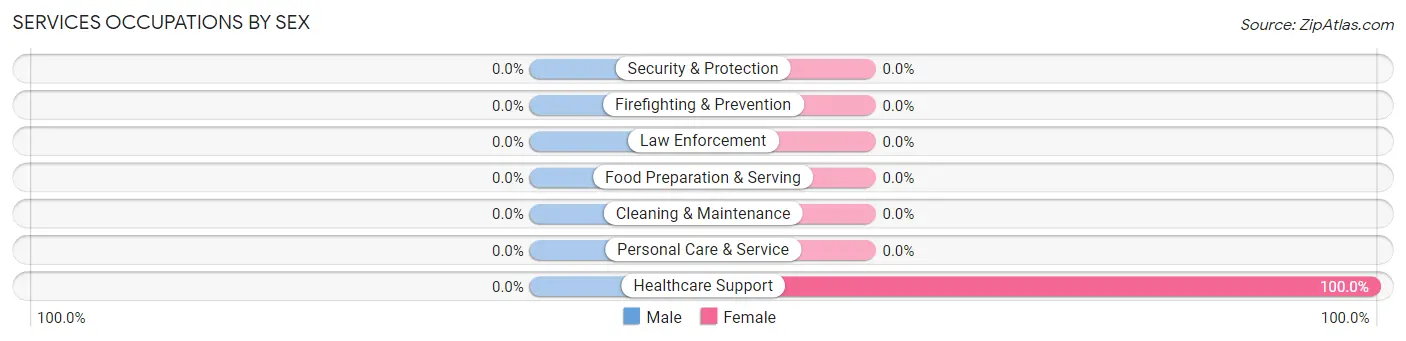
| Occupation | Male | Female |
| Healthcare Support | 0 (0.0%) | 15 (100.0%) |
| Security & Protection | 0 (0.0%) | 0 (0.0%) |
| Firefighting & Prevention | 0 (0.0%) | 0 (0.0%) |
| Law Enforcement | 0 (0.0%) | 0 (0.0%) |
| Food Preparation & Serving | 0 (0.0%) | 0 (0.0%) |
| Cleaning & Maintenance | 0 (0.0%) | 0 (0.0%) |
| Personal Care & Service | 0 (0.0%) | 0 (0.0%) |
| Total (Category) | 0 (0.0%) | 15 (100.0%) |
| Total (Overall) | 41 (53.2%) | 36 (46.8%) |
Sales and Office Occupations
The most common Sales and Office occupations in Jugtown are , and Sales & Related (15 | 19.5%).
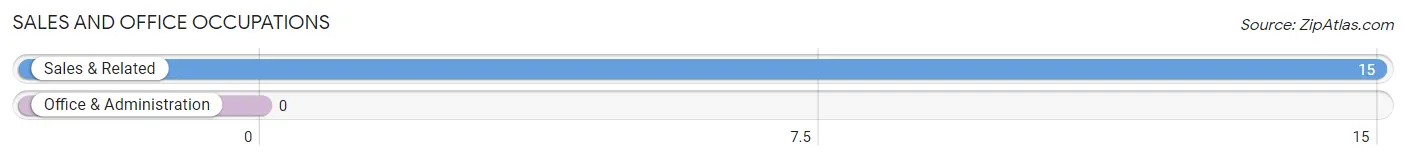
Sales and Office Occupations by Sex
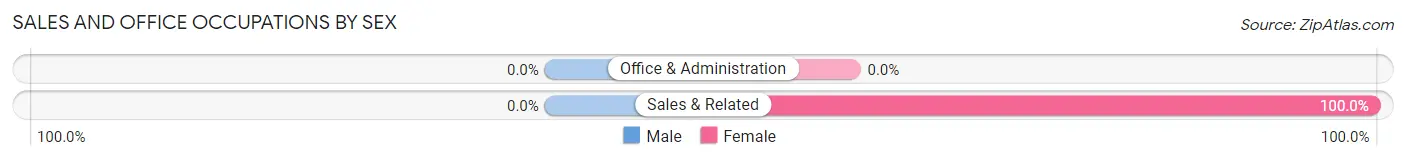
| Occupation | Male | Female |
| Sales & Related | 0 (0.0%) | 15 (100.0%) |
| Office & Administration | 0 (0.0%) | 0 (0.0%) |
| Total (Category) | 0 (0.0%) | 15 (100.0%) |
| Total (Overall) | 41 (53.2%) | 36 (46.8%) |
Natural Resources, Construction and Maintenance Occupations
The most common Natural Resources, Construction and Maintenance occupations in Jugtown are , and Installation, Maintenance & Repair (7 | 9.1%).
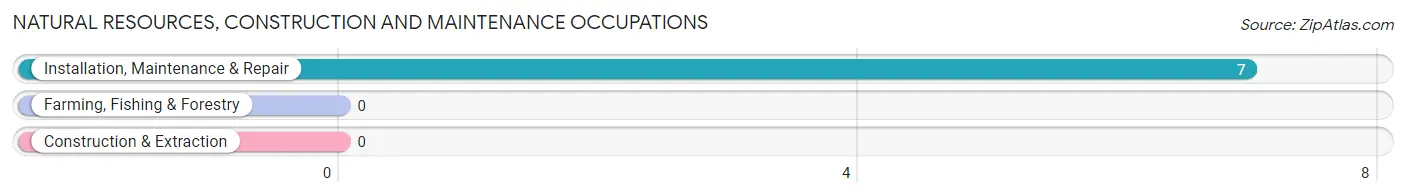
Natural Resources, Construction and Maintenance Occupations by Sex
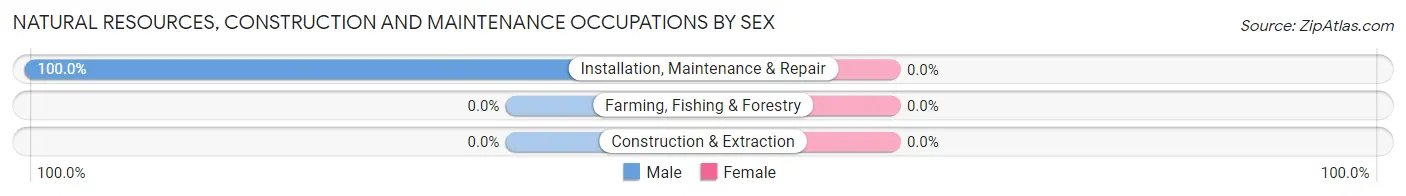
| Occupation | Male | Female |
| Farming, Fishing & Forestry | 0 (0.0%) | 0 (0.0%) |
| Construction & Extraction | 0 (0.0%) | 0 (0.0%) |
| Installation, Maintenance & Repair | 7 (100.0%) | 0 (0.0%) |
| Total (Category) | 7 (100.0%) | 0 (0.0%) |
| Total (Overall) | 41 (53.2%) | 36 (46.8%) |
Production, Transportation and Moving Occupations
The most common Production, Transportation and Moving occupations in Jugtown are , and Production (13 | 16.9%).
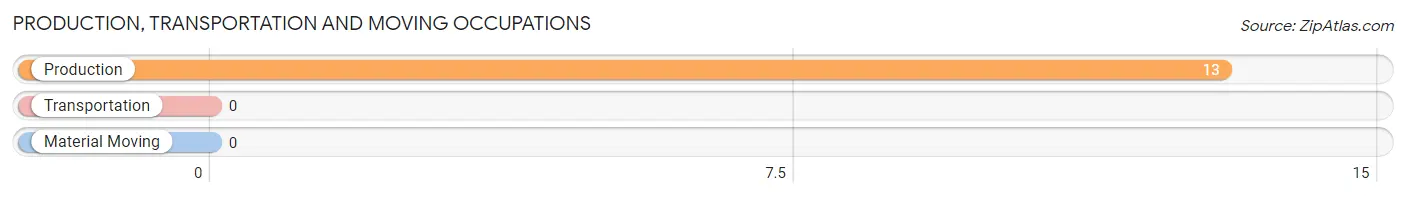
Production, Transportation and Moving Occupations by Sex
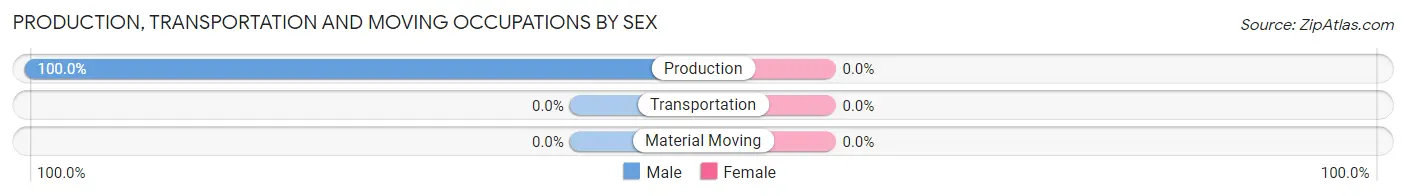
| Occupation | Male | Female |
| Production | 13 (100.0%) | 0 (0.0%) |
| Transportation | 0 (0.0%) | 0 (0.0%) |
| Material Moving | 0 (0.0%) | 0 (0.0%) |
| Total (Category) | 13 (100.0%) | 0 (0.0%) |
| Total (Overall) | 41 (53.2%) | 36 (46.8%) |
Employment Industries by Sex in Jugtown
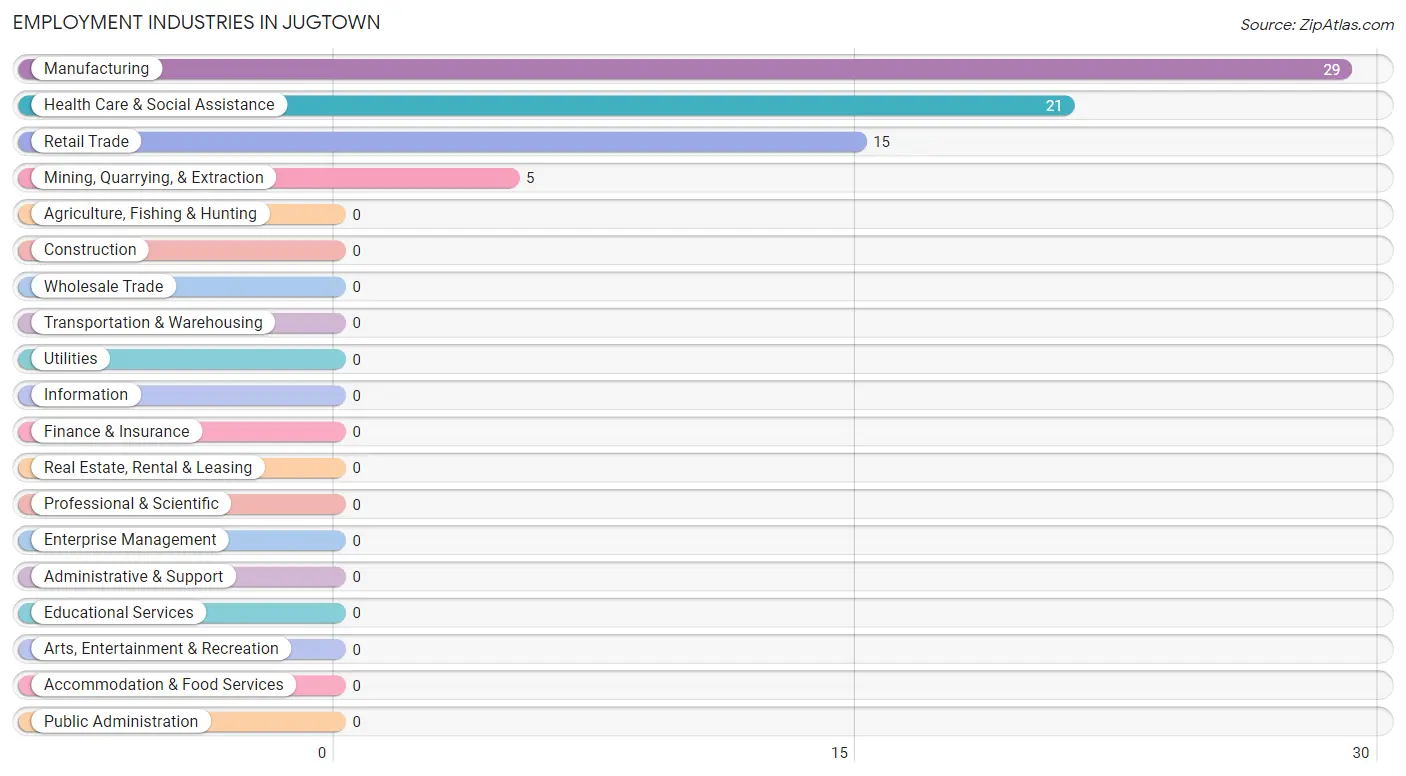
Employment Industries in Jugtown
The major employment industries in Jugtown include Manufacturing (29 | 37.7%), Health Care & Social Assistance (21 | 27.3%), Retail Trade (15 | 19.5%), and Mining, Quarrying, & Extraction (5 | 6.5%).
Employment Industries by Sex in Jugtown
The Jugtown industries that see more men than women are Mining, Quarrying, & Extraction (100.0%), and Manufacturing (100.0%), whereas the industries that tend to have a higher number of women are Retail Trade (100.0%), and Health Care & Social Assistance (100.0%).
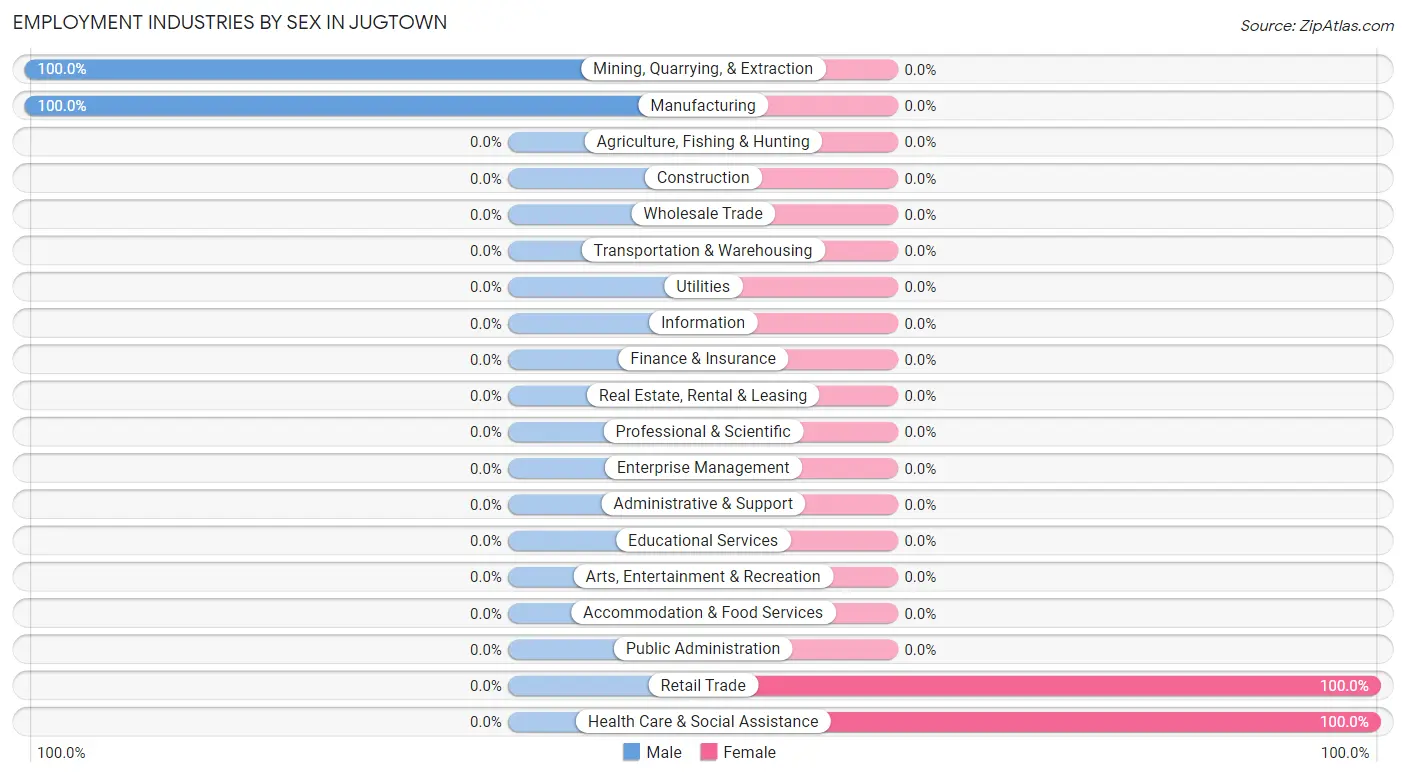
| Industry | Male | Female |
| Agriculture, Fishing & Hunting | 0 (0.0%) | 0 (0.0%) |
| Mining, Quarrying, & Extraction | 5 (100.0%) | 0 (0.0%) |
| Construction | 0 (0.0%) | 0 (0.0%) |
| Manufacturing | 29 (100.0%) | 0 (0.0%) |
| Wholesale Trade | 0 (0.0%) | 0 (0.0%) |
| Retail Trade | 0 (0.0%) | 15 (100.0%) |
| Transportation & Warehousing | 0 (0.0%) | 0 (0.0%) |
| Utilities | 0 (0.0%) | 0 (0.0%) |
| Information | 0 (0.0%) | 0 (0.0%) |
| Finance & Insurance | 0 (0.0%) | 0 (0.0%) |
| Real Estate, Rental & Leasing | 0 (0.0%) | 0 (0.0%) |
| Professional & Scientific | 0 (0.0%) | 0 (0.0%) |
| Enterprise Management | 0 (0.0%) | 0 (0.0%) |
| Administrative & Support | 0 (0.0%) | 0 (0.0%) |
| Educational Services | 0 (0.0%) | 0 (0.0%) |
| Health Care & Social Assistance | 0 (0.0%) | 21 (100.0%) |
| Arts, Entertainment & Recreation | 0 (0.0%) | 0 (0.0%) |
| Accommodation & Food Services | 0 (0.0%) | 0 (0.0%) |
| Public Administration | 0 (0.0%) | 0 (0.0%) |
| Total | 41 (53.2%) | 36 (46.8%) |
Education in Jugtown
School Enrollment in Jugtown
The most common levels of schooling among the 49 students in Jugtown are kindergarten (20 | 40.8%), elementary school (14 | 28.6%), and high school (8 | 16.3%).
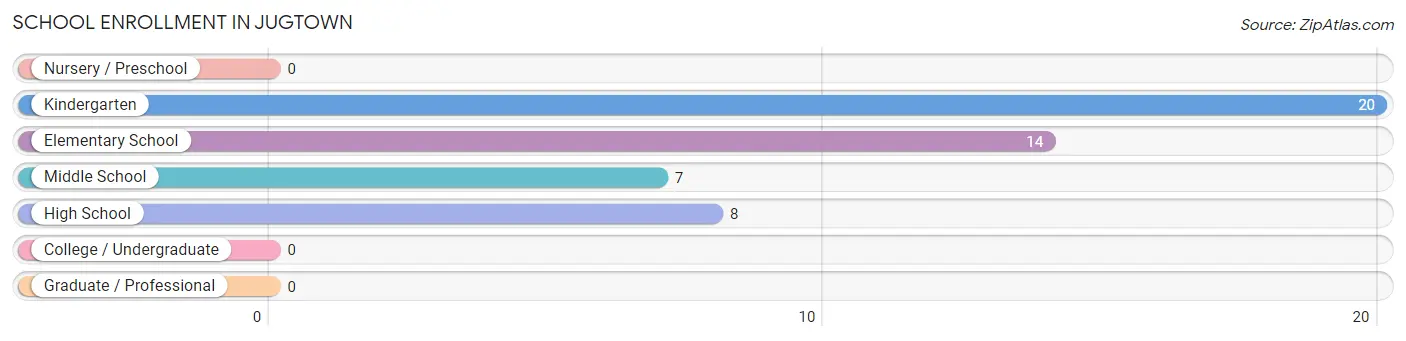
| School Level | # Students | % Students |
| Nursery / Preschool | 0 | 0.0% |
| Kindergarten | 20 | 40.8% |
| Elementary School | 14 | 28.6% |
| Middle School | 7 | 14.3% |
| High School | 8 | 16.3% |
| College / Undergraduate | 0 | 0.0% |
| Graduate / Professional | 0 | 0.0% |
| Total | 49 | 100.0% |
School Enrollment by Age by Funding Source in Jugtown
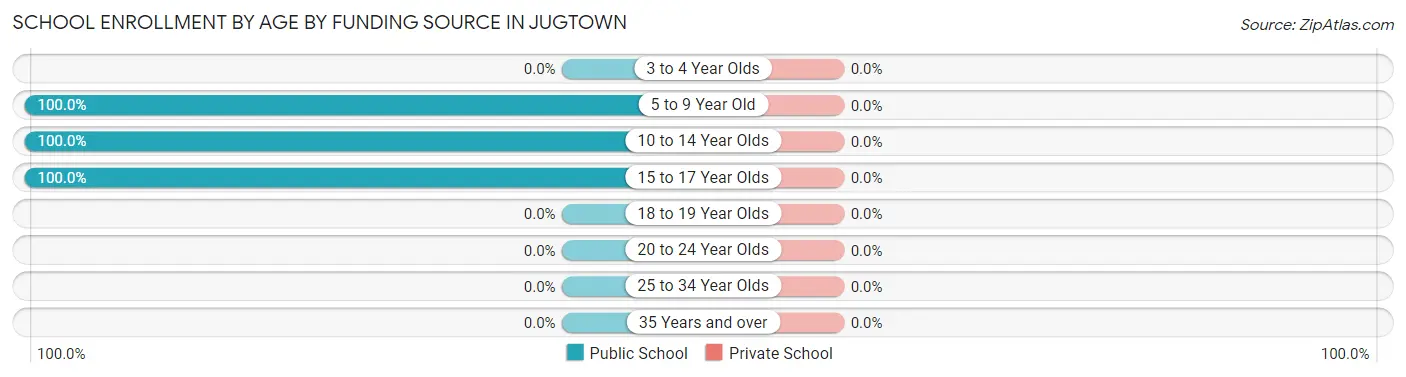
| Age Bracket | Public School | Private School |
| 3 to 4 Year Olds | 0 (0.0%) | 0 (0.0%) |
| 5 to 9 Year Old | 34 (100.0%) | 0 (0.0%) |
| 10 to 14 Year Olds | 7 (100.0%) | 0 (0.0%) |
| 15 to 17 Year Olds | 8 (100.0%) | 0 (0.0%) |
| 18 to 19 Year Olds | 0 (0.0%) | 0 (0.0%) |
| 20 to 24 Year Olds | 0 (0.0%) | 0 (0.0%) |
| 25 to 34 Year Olds | 0 (0.0%) | 0 (0.0%) |
| 35 Years and over | 0 (0.0%) | 0 (0.0%) |
| Total | 49 (100.0%) | 0 (0.0%) |
Educational Attainment by Field of Study in Jugtown
Business (13 | 33.3%), social sciences (8 | 20.5%), visual & performing arts (7 | 17.9%), science & technology (6 | 15.4%), and physical & health sciences (5 | 12.8%) are the most common fields of study among 39 individuals in Jugtown who have obtained a bachelor's degree or higher.
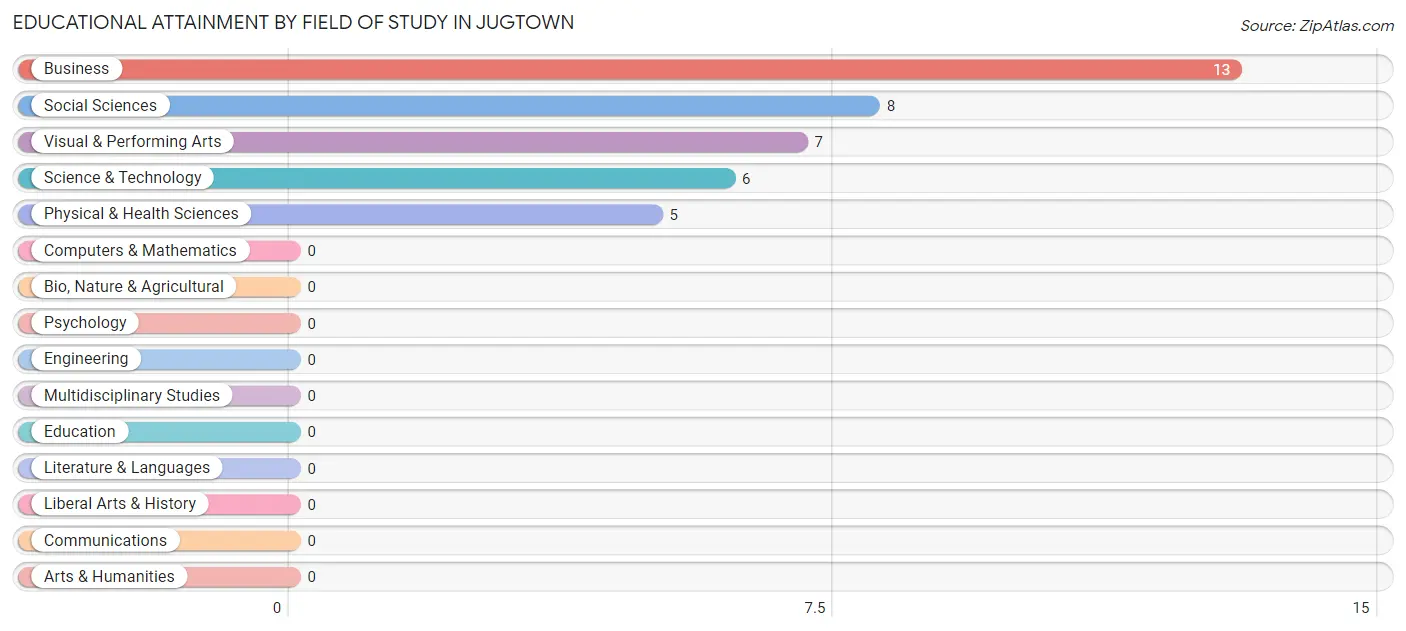
| Field of Study | # Graduates | % Graduates |
| Computers & Mathematics | 0 | 0.0% |
| Bio, Nature & Agricultural | 0 | 0.0% |
| Physical & Health Sciences | 5 | 12.8% |
| Psychology | 0 | 0.0% |
| Social Sciences | 8 | 20.5% |
| Engineering | 0 | 0.0% |
| Multidisciplinary Studies | 0 | 0.0% |
| Science & Technology | 6 | 15.4% |
| Business | 13 | 33.3% |
| Education | 0 | 0.0% |
| Literature & Languages | 0 | 0.0% |
| Liberal Arts & History | 0 | 0.0% |
| Visual & Performing Arts | 7 | 17.9% |
| Communications | 0 | 0.0% |
| Arts & Humanities | 0 | 0.0% |
| Total | 39 | 100.0% |
Transportation & Commute in Jugtown
Vehicle Availability by Sex in Jugtown
The most prevalent vehicle ownership categories in Jugtown are males with 5 or more vehicles (36, accounting for 87.8%) and females with 5 or more vehicles (36, making up 100.0%).
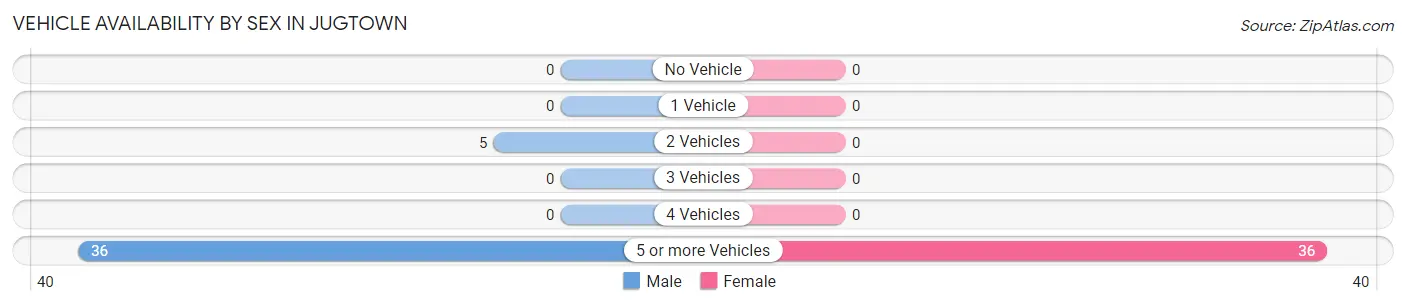
| Vehicles Available | Male | Female |
| No Vehicle | 0 (0.0%) | 0 (0.0%) |
| 1 Vehicle | 0 (0.0%) | 0 (0.0%) |
| 2 Vehicles | 5 (12.2%) | 0 (0.0%) |
| 3 Vehicles | 0 (0.0%) | 0 (0.0%) |
| 4 Vehicles | 0 (0.0%) | 0 (0.0%) |
| 5 or more Vehicles | 36 (87.8%) | 36 (100.0%) |
| Total | 41 (100.0%) | 36 (100.0%) |
Commute Time in Jugtown
The most frequently occuring commute durations in Jugtown are 30 to 34 minutes (35 commuters, 45.5%), 25 to 29 minutes (21 commuters, 27.3%), and 35 to 39 minutes (16 commuters, 20.8%).
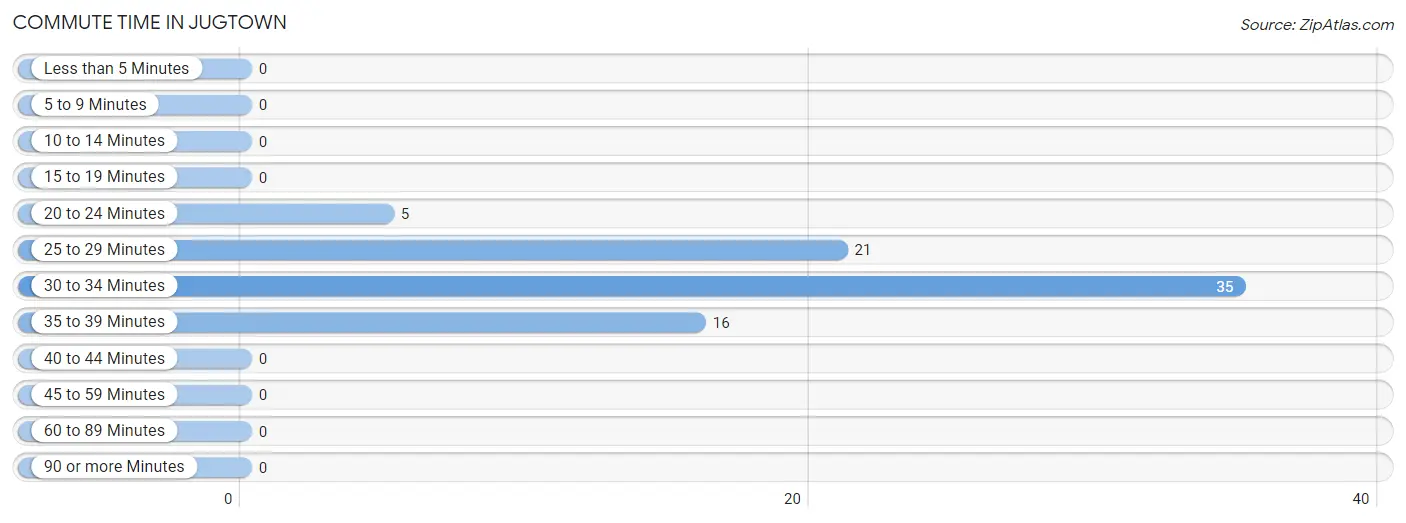
| Commute Time | # Commuters | % Commuters |
| Less than 5 Minutes | 0 | 0.0% |
| 5 to 9 Minutes | 0 | 0.0% |
| 10 to 14 Minutes | 0 | 0.0% |
| 15 to 19 Minutes | 0 | 0.0% |
| 20 to 24 Minutes | 5 | 6.5% |
| 25 to 29 Minutes | 21 | 27.3% |
| 30 to 34 Minutes | 35 | 45.5% |
| 35 to 39 Minutes | 16 | 20.8% |
| 40 to 44 Minutes | 0 | 0.0% |
| 45 to 59 Minutes | 0 | 0.0% |
| 60 to 89 Minutes | 0 | 0.0% |
| 90 or more Minutes | 0 | 0.0% |
Commute Time by Sex in Jugtown
The most common commute times in Jugtown are 30 to 34 minutes (20 commuters, 48.8%) for males and 25 to 29 minutes (21 commuters, 58.3%) for females.
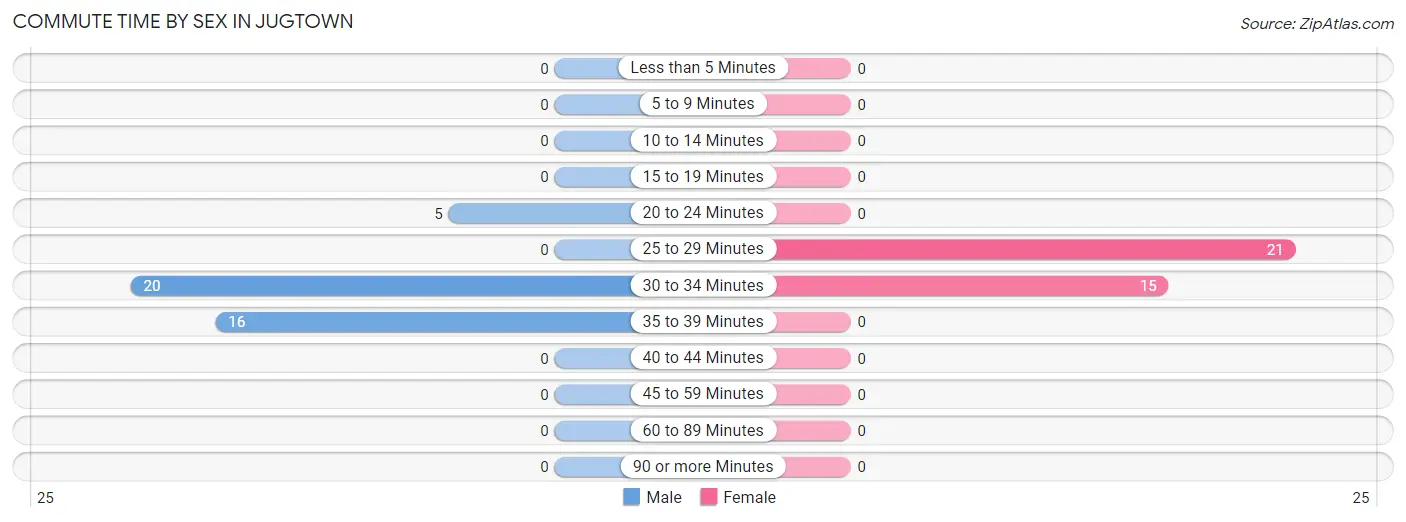
| Commute Time | Male | Female |
| Less than 5 Minutes | 0 (0.0%) | 0 (0.0%) |
| 5 to 9 Minutes | 0 (0.0%) | 0 (0.0%) |
| 10 to 14 Minutes | 0 (0.0%) | 0 (0.0%) |
| 15 to 19 Minutes | 0 (0.0%) | 0 (0.0%) |
| 20 to 24 Minutes | 5 (12.2%) | 0 (0.0%) |
| 25 to 29 Minutes | 0 (0.0%) | 21 (58.3%) |
| 30 to 34 Minutes | 20 (48.8%) | 15 (41.7%) |
| 35 to 39 Minutes | 16 (39.0%) | 0 (0.0%) |
| 40 to 44 Minutes | 0 (0.0%) | 0 (0.0%) |
| 45 to 59 Minutes | 0 (0.0%) | 0 (0.0%) |
| 60 to 89 Minutes | 0 (0.0%) | 0 (0.0%) |
| 90 or more Minutes | 0 (0.0%) | 0 (0.0%) |
Time of Departure to Work by Sex in Jugtown
The most frequent times of departure to work in Jugtown are 9:00 AM to 9:59 AM (16, 39.0%) for males and 6:00 AM to 6:29 AM (15, 41.7%) for females.
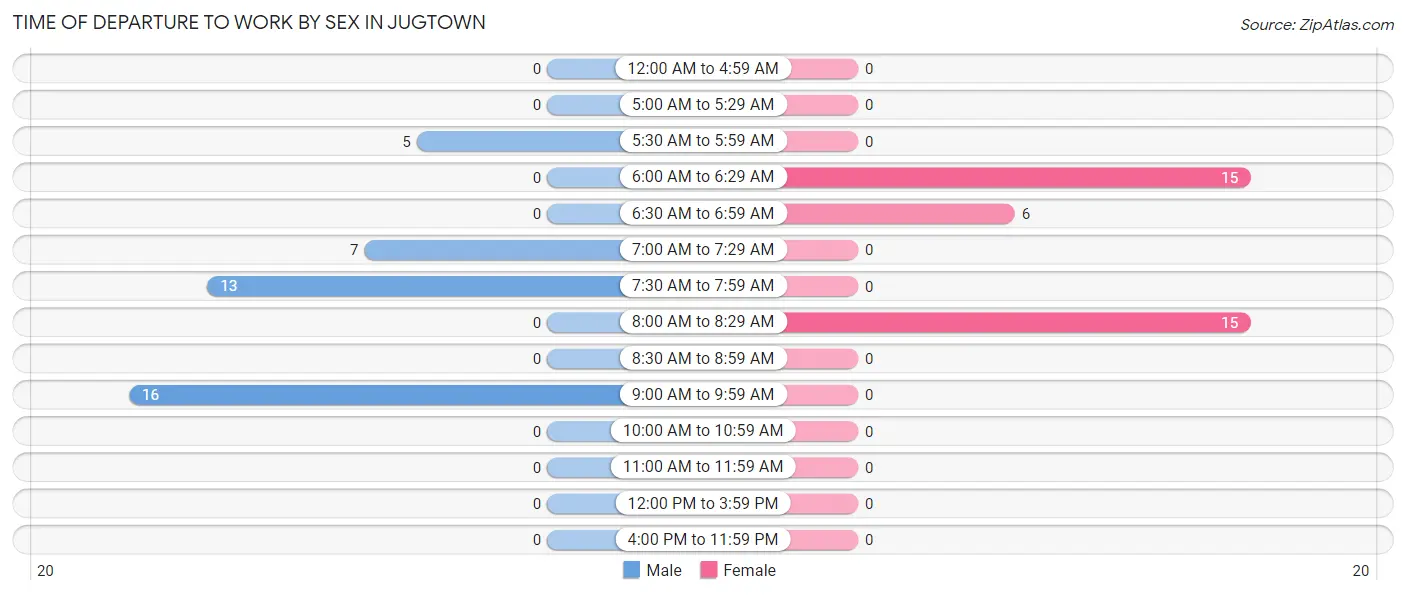
| Time of Departure | Male | Female |
| 12:00 AM to 4:59 AM | 0 (0.0%) | 0 (0.0%) |
| 5:00 AM to 5:29 AM | 0 (0.0%) | 0 (0.0%) |
| 5:30 AM to 5:59 AM | 5 (12.2%) | 0 (0.0%) |
| 6:00 AM to 6:29 AM | 0 (0.0%) | 15 (41.7%) |
| 6:30 AM to 6:59 AM | 0 (0.0%) | 6 (16.7%) |
| 7:00 AM to 7:29 AM | 7 (17.1%) | 0 (0.0%) |
| 7:30 AM to 7:59 AM | 13 (31.7%) | 0 (0.0%) |
| 8:00 AM to 8:29 AM | 0 (0.0%) | 15 (41.7%) |
| 8:30 AM to 8:59 AM | 0 (0.0%) | 0 (0.0%) |
| 9:00 AM to 9:59 AM | 16 (39.0%) | 0 (0.0%) |
| 10:00 AM to 10:59 AM | 0 (0.0%) | 0 (0.0%) |
| 11:00 AM to 11:59 AM | 0 (0.0%) | 0 (0.0%) |
| 12:00 PM to 3:59 PM | 0 (0.0%) | 0 (0.0%) |
| 4:00 PM to 11:59 PM | 0 (0.0%) | 0 (0.0%) |
| Total | 41 (100.0%) | 36 (100.0%) |
Housing Occupancy in Jugtown
Occupancy by Ownership in Jugtown
Of the total 35 dwellings in Jugtown, owner-occupied units account for 35 (100.0%), while renter-occupied units make up 0 (0.0%).
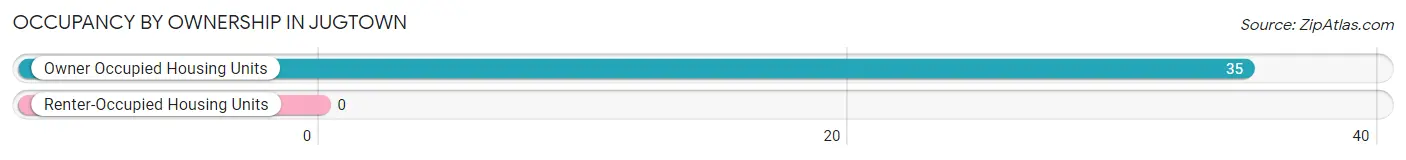
| Occupancy | # Housing Units | % Housing Units |
| Owner Occupied Housing Units | 35 | 100.0% |
| Renter-Occupied Housing Units | 0 | 0.0% |
| Total Occupied Housing Units | 35 | 100.0% |
Occupancy by Household Size in Jugtown
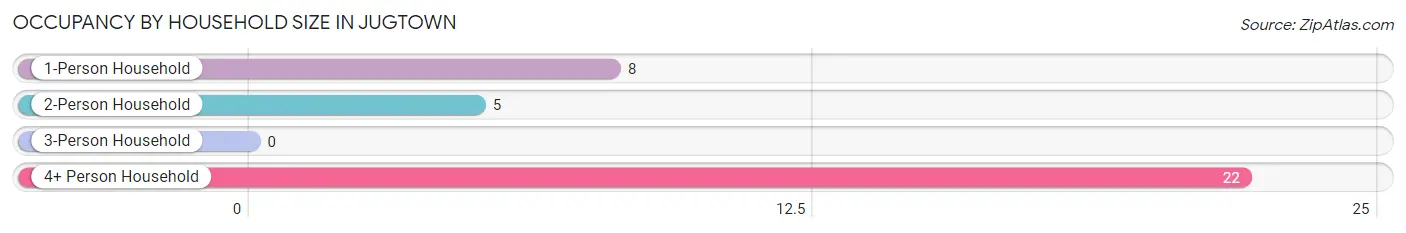
| Household Size | # Housing Units | % Housing Units |
| 1-Person Household | 8 | 22.9% |
| 2-Person Household | 5 | 14.3% |
| 3-Person Household | 0 | 0.0% |
| 4+ Person Household | 22 | 62.9% |
| Total Housing Units | 35 | 100.0% |
Occupancy by Ownership by Household Size in Jugtown
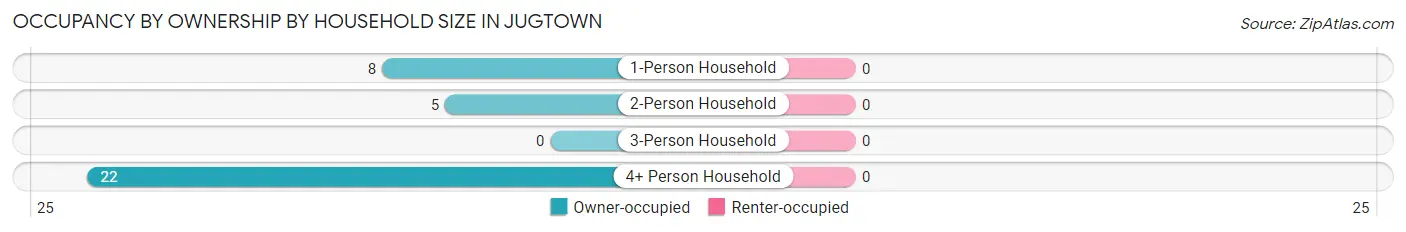
| Household Size | Owner-occupied | Renter-occupied |
| 1-Person Household | 8 (100.0%) | 0 (0.0%) |
| 2-Person Household | 5 (100.0%) | 0 (0.0%) |
| 3-Person Household | 0 (0.0%) | 0 (0.0%) |
| 4+ Person Household | 22 (100.0%) | 0 (0.0%) |
| Total Housing Units | 35 (100.0%) | 0 (0.0%) |
Occupancy by Educational Attainment in Jugtown
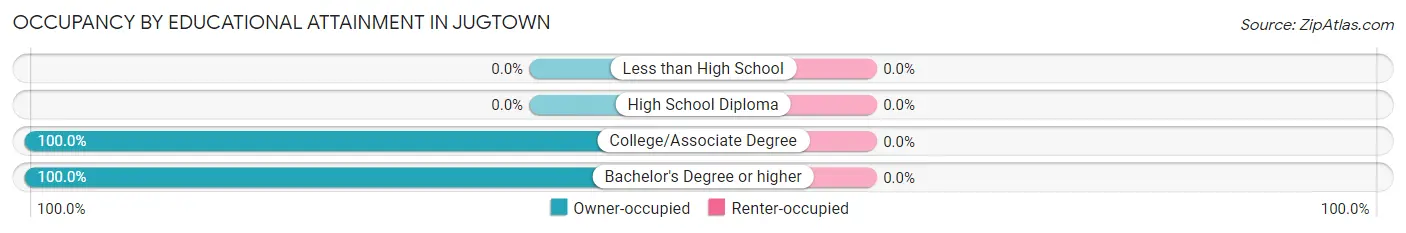
| Household Size | Owner-occupied | Renter-occupied |
| Less than High School | 0 (0.0%) | 0 (0.0%) |
| High School Diploma | 0 (0.0%) | 0 (0.0%) |
| College/Associate Degree | 24 (100.0%) | 0 (0.0%) |
| Bachelor's Degree or higher | 11 (100.0%) | 0 (0.0%) |
Occupancy by Age of Householder in Jugtown
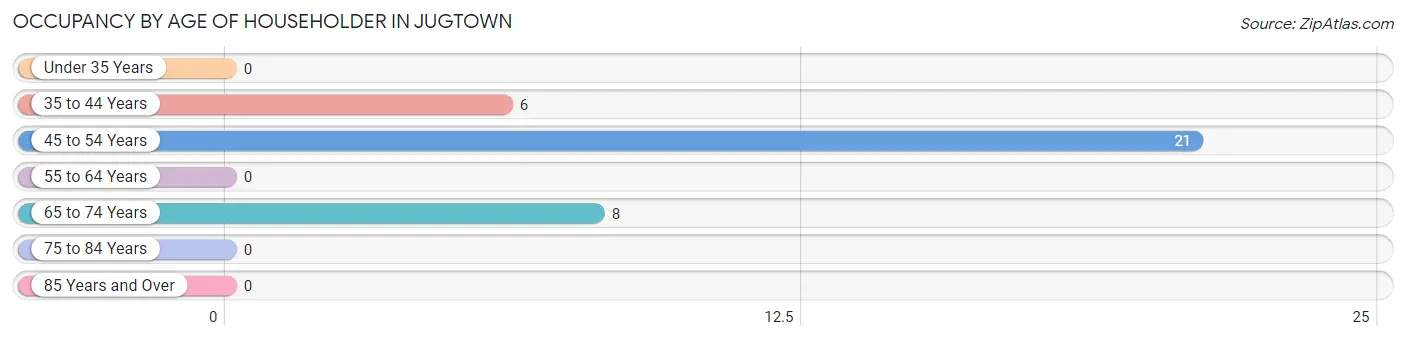
| Age Bracket | # Households | % Households |
| Under 35 Years | 0 | 0.0% |
| 35 to 44 Years | 6 | 17.1% |
| 45 to 54 Years | 21 | 60.0% |
| 55 to 64 Years | 0 | 0.0% |
| 65 to 74 Years | 8 | 22.9% |
| 75 to 84 Years | 0 | 0.0% |
| 85 Years and Over | 0 | 0.0% |
| Total | 35 | 100.0% |
Housing Finances in Jugtown
Median Income by Occupancy in Jugtown
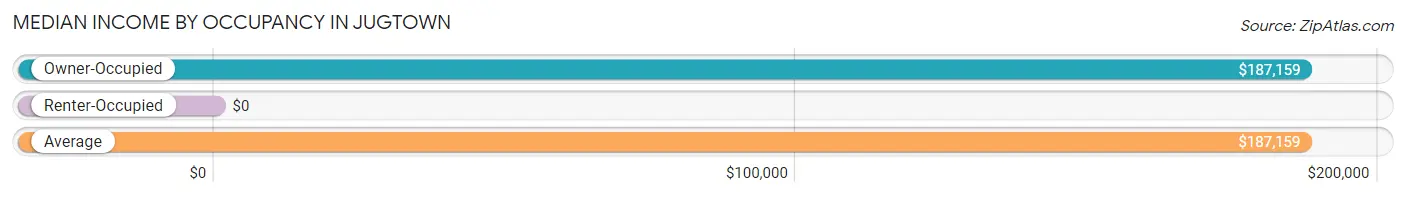
| Occupancy Type | # Households | Median Income |
| Owner-Occupied | 35 (100.0%) | $187,159 |
| Renter-Occupied | 0 (0.0%) | $0 |
| Average | 35 (100.0%) | $187,159 |
Occupancy by Householder Income Bracket in Jugtown
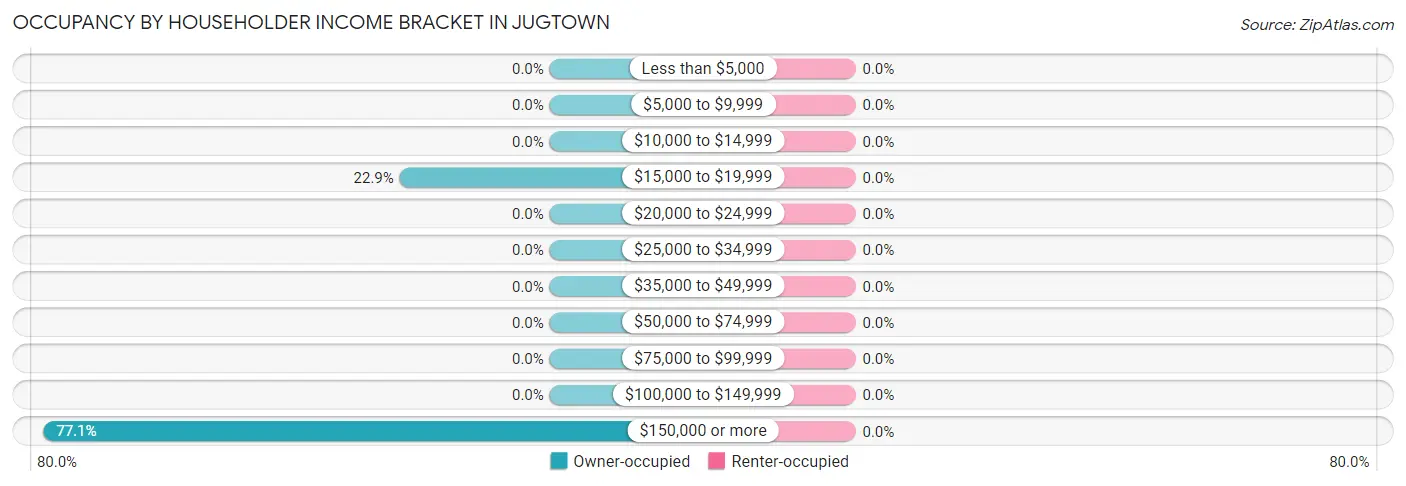
| Income Bracket | Owner-occupied | Renter-occupied |
| Less than $5,000 | 0 (0.0%) | 0 (0.0%) |
| $5,000 to $9,999 | 0 (0.0%) | 0 (0.0%) |
| $10,000 to $14,999 | 0 (0.0%) | 0 (0.0%) |
| $15,000 to $19,999 | 8 (22.9%) | 0 (0.0%) |
| $20,000 to $24,999 | 0 (0.0%) | 0 (0.0%) |
| $25,000 to $34,999 | 0 (0.0%) | 0 (0.0%) |
| $35,000 to $49,999 | 0 (0.0%) | 0 (0.0%) |
| $50,000 to $74,999 | 0 (0.0%) | 0 (0.0%) |
| $75,000 to $99,999 | 0 (0.0%) | 0 (0.0%) |
| $100,000 to $149,999 | 0 (0.0%) | 0 (0.0%) |
| $150,000 or more | 27 (77.1%) | 0 (0.0%) |
| Total | 35 (100.0%) | 0 (0.0%) |
Monthly Housing Cost Tiers in Jugtown
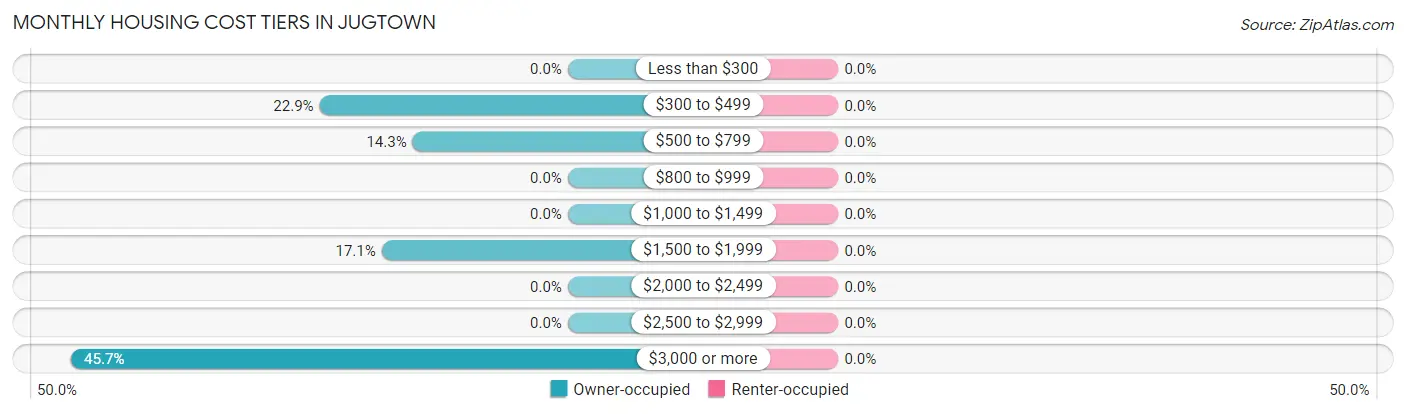
| Monthly Cost | Owner-occupied | Renter-occupied |
| Less than $300 | 0 (0.0%) | 0 (0.0%) |
| $300 to $499 | 8 (22.9%) | 0 (0.0%) |
| $500 to $799 | 5 (14.3%) | 0 (0.0%) |
| $800 to $999 | 0 (0.0%) | 0 (0.0%) |
| $1,000 to $1,499 | 0 (0.0%) | 0 (0.0%) |
| $1,500 to $1,999 | 6 (17.1%) | 0 (0.0%) |
| $2,000 to $2,499 | 0 (0.0%) | 0 (0.0%) |
| $2,500 to $2,999 | 0 (0.0%) | 0 (0.0%) |
| $3,000 or more | 16 (45.7%) | 0 (0.0%) |
| Total | 35 (100.0%) | 0 (0.0%) |
Physical Housing Characteristics in Jugtown
Housing Structures in Jugtown
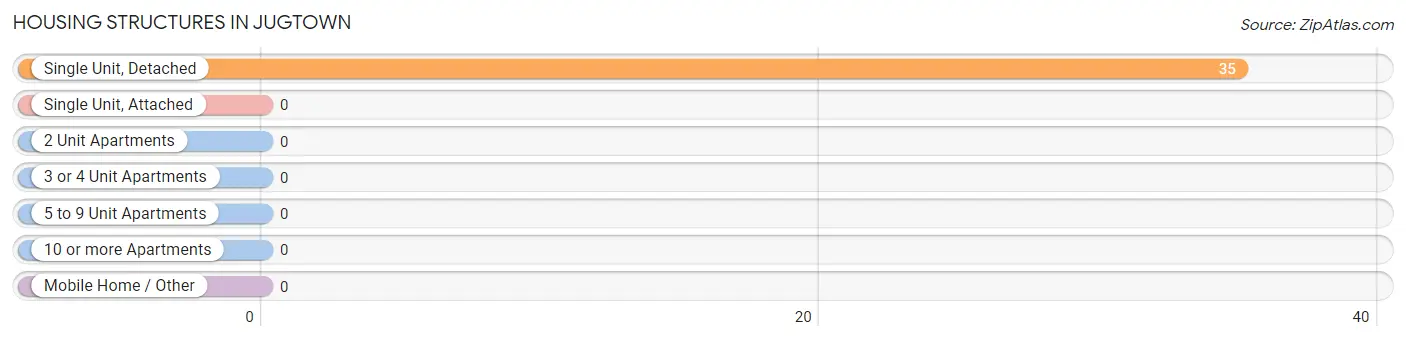
| Structure Type | # Housing Units | % Housing Units |
| Single Unit, Detached | 35 | 100.0% |
| Single Unit, Attached | 0 | 0.0% |
| 2 Unit Apartments | 0 | 0.0% |
| 3 or 4 Unit Apartments | 0 | 0.0% |
| 5 to 9 Unit Apartments | 0 | 0.0% |
| 10 or more Apartments | 0 | 0.0% |
| Mobile Home / Other | 0 | 0.0% |
| Total | 35 | 100.0% |
Housing Structures by Occupancy in Jugtown
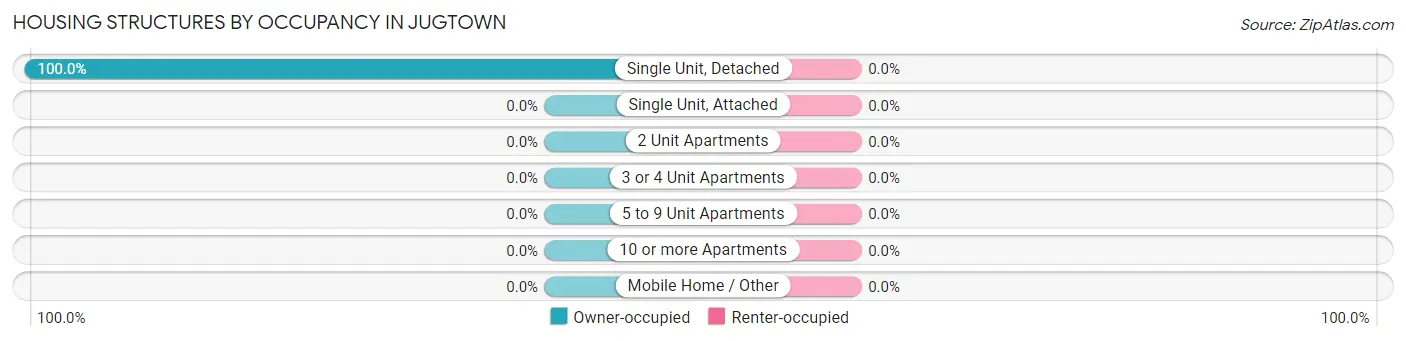
| Structure Type | Owner-occupied | Renter-occupied |
| Single Unit, Detached | 35 (100.0%) | 0 (0.0%) |
| Single Unit, Attached | 0 (0.0%) | 0 (0.0%) |
| 2 Unit Apartments | 0 (0.0%) | 0 (0.0%) |
| 3 or 4 Unit Apartments | 0 (0.0%) | 0 (0.0%) |
| 5 to 9 Unit Apartments | 0 (0.0%) | 0 (0.0%) |
| 10 or more Apartments | 0 (0.0%) | 0 (0.0%) |
| Mobile Home / Other | 0 (0.0%) | 0 (0.0%) |
| Total | 35 (100.0%) | 0 (0.0%) |
Housing Structures by Number of Rooms in Jugtown
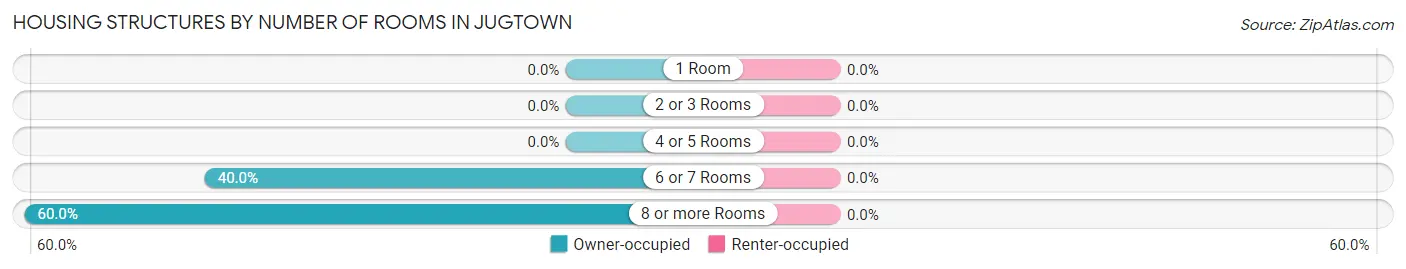
| Number of Rooms | Owner-occupied | Renter-occupied |
| 1 Room | 0 (0.0%) | 0 (0.0%) |
| 2 or 3 Rooms | 0 (0.0%) | 0 (0.0%) |
| 4 or 5 Rooms | 0 (0.0%) | 0 (0.0%) |
| 6 or 7 Rooms | 14 (40.0%) | 0 (0.0%) |
| 8 or more Rooms | 21 (60.0%) | 0 (0.0%) |
| Total | 35 (100.0%) | 0 (0.0%) |
Housing Structure by Heating Type in Jugtown
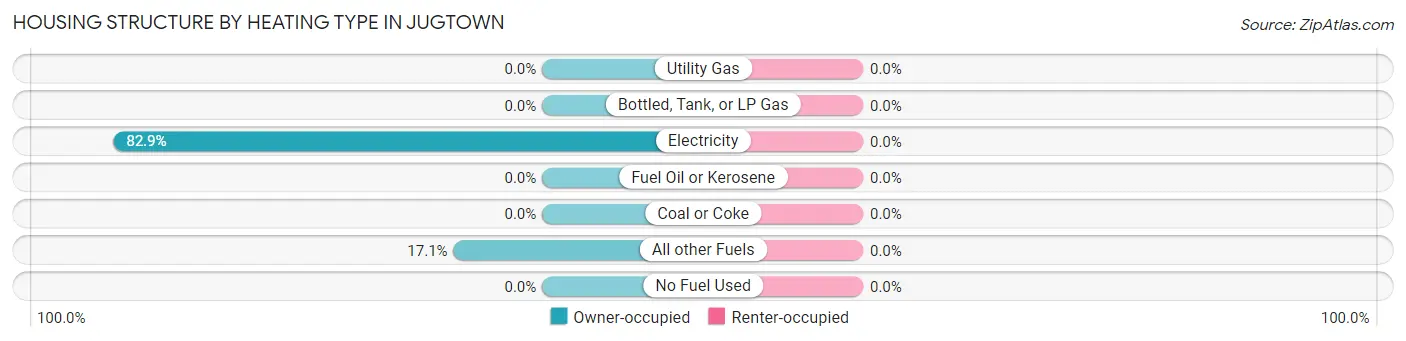
| Heating Type | Owner-occupied | Renter-occupied |
| Utility Gas | 0 (0.0%) | 0 (0.0%) |
| Bottled, Tank, or LP Gas | 0 (0.0%) | 0 (0.0%) |
| Electricity | 29 (82.9%) | 0 (0.0%) |
| Fuel Oil or Kerosene | 0 (0.0%) | 0 (0.0%) |
| Coal or Coke | 0 (0.0%) | 0 (0.0%) |
| All other Fuels | 6 (17.1%) | 0 (0.0%) |
| No Fuel Used | 0 (0.0%) | 0 (0.0%) |
| Total | 35 (100.0%) | 0 (0.0%) |
Household Vehicle Usage in Jugtown
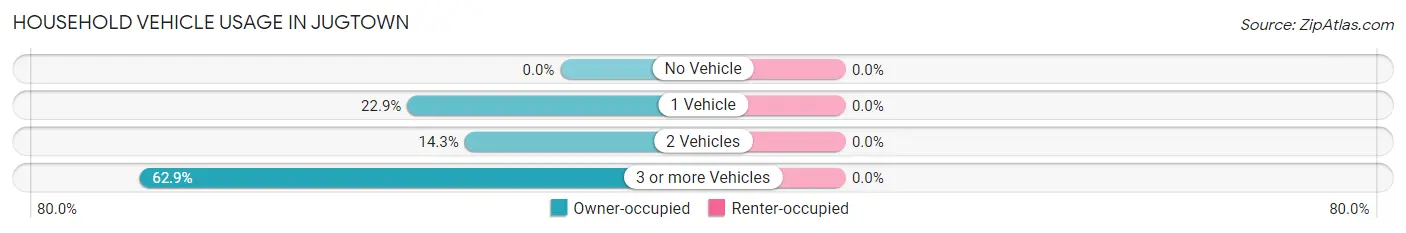
| Vehicles per Household | Owner-occupied | Renter-occupied |
| No Vehicle | 0 (0.0%) | 0 (0.0%) |
| 1 Vehicle | 8 (22.9%) | 0 (0.0%) |
| 2 Vehicles | 5 (14.3%) | 0 (0.0%) |
| 3 or more Vehicles | 22 (62.9%) | 0 (0.0%) |
| Total | 35 (100.0%) | 0 (0.0%) |
Real Estate & Mortgages in Jugtown
Real Estate and Mortgage Overview in Jugtown
| Characteristic | Without Mortgage | With Mortgage |
| Housing Units | 13 | 22 |
| Median Property Value | - | - |
| Median Household Income | - | - |
| Monthly Housing Costs | - | - |
| Real Estate Taxes | - | - |
Property Value by Mortgage Status in Jugtown
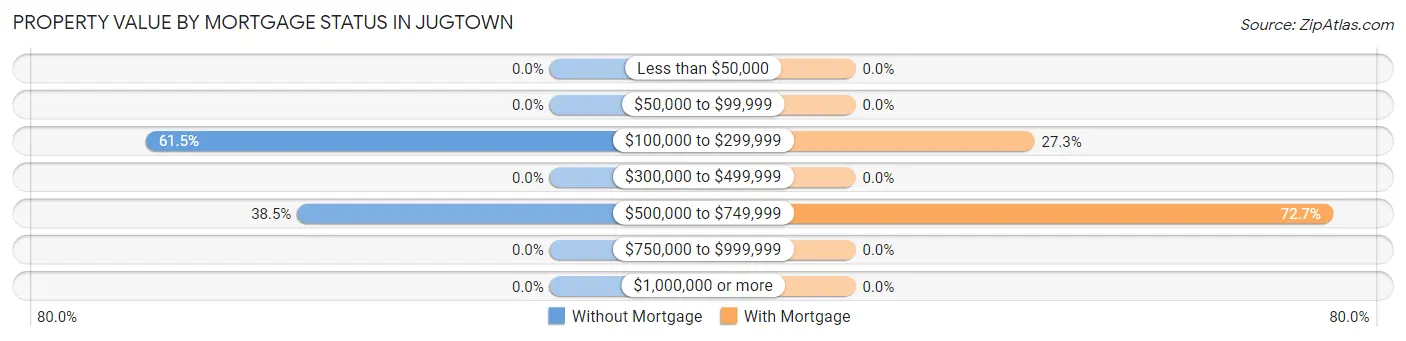
| Property Value | Without Mortgage | With Mortgage |
| Less than $50,000 | 0 (0.0%) | 0 (0.0%) |
| $50,000 to $99,999 | 0 (0.0%) | 0 (0.0%) |
| $100,000 to $299,999 | 8 (61.5%) | 6 (27.3%) |
| $300,000 to $499,999 | 0 (0.0%) | 0 (0.0%) |
| $500,000 to $749,999 | 5 (38.5%) | 16 (72.7%) |
| $750,000 to $999,999 | 0 (0.0%) | 0 (0.0%) |
| $1,000,000 or more | 0 (0.0%) | 0 (0.0%) |
| Total | 13 (100.0%) | 22 (100.0%) |
Household Income by Mortgage Status in Jugtown
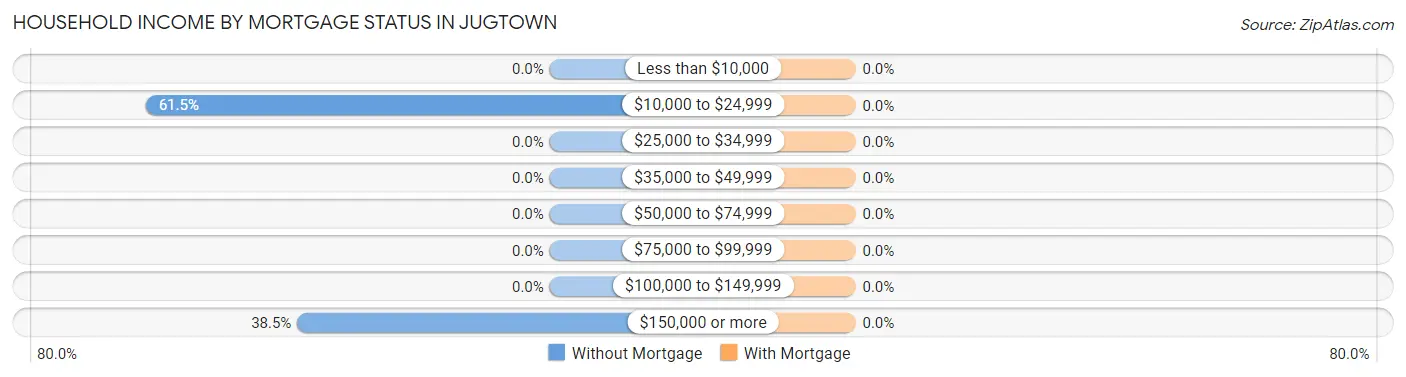
| Household Income | Without Mortgage | With Mortgage |
| Less than $10,000 | 0 (0.0%) | 0 (0.0%) |
| $10,000 to $24,999 | 8 (61.5%) | 0 (0.0%) |
| $25,000 to $34,999 | 0 (0.0%) | 0 (0.0%) |
| $35,000 to $49,999 | 0 (0.0%) | 0 (0.0%) |
| $50,000 to $74,999 | 0 (0.0%) | 0 (0.0%) |
| $75,000 to $99,999 | 0 (0.0%) | 0 (0.0%) |
| $100,000 to $149,999 | 0 (0.0%) | 0 (0.0%) |
| $150,000 or more | 5 (38.5%) | 0 (0.0%) |
| Total | 13 (100.0%) | 22 (100.0%) |
Property Value to Household Income Ratio in Jugtown
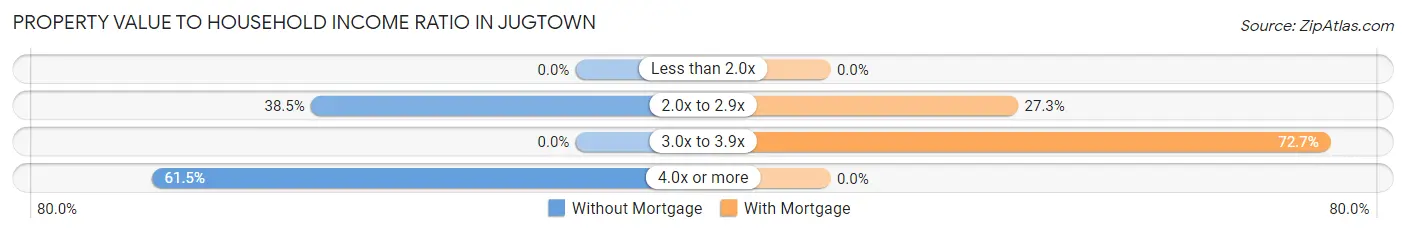
| Value-to-Income Ratio | Without Mortgage | With Mortgage |
| Less than 2.0x | 0 (0.0%) | 0 (0.0%) |
| 2.0x to 2.9x | 5 (38.5%) | 6 (27.3%) |
| 3.0x to 3.9x | 0 (0.0%) | 16 (72.7%) |
| 4.0x or more | 8 (61.5%) | 0 (0.0%) |
| Total | 13 (100.0%) | 22 (100.0%) |
Real Estate Taxes by Mortgage Status in Jugtown
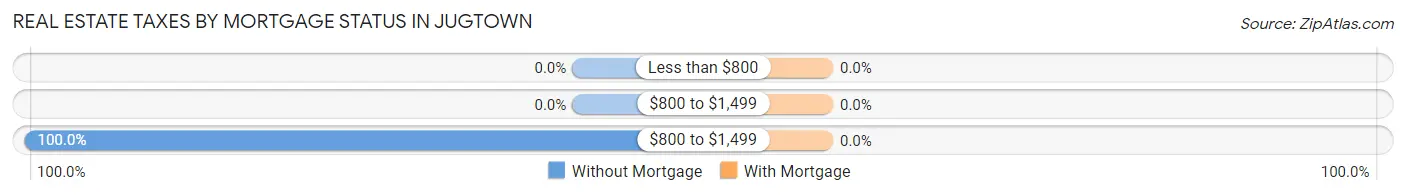
| Property Taxes | Without Mortgage | With Mortgage |
| Less than $800 | 0 (0.0%) | 0 (0.0%) |
| $800 to $1,499 | 0 (0.0%) | 0 (0.0%) |
| $800 to $1,499 | 13 (100.0%) | 0 (0.0%) |
| Total | 13 (100.0%) | 22 (100.0%) |
Health & Disability in Jugtown
Health Insurance Coverage by Age in Jugtown
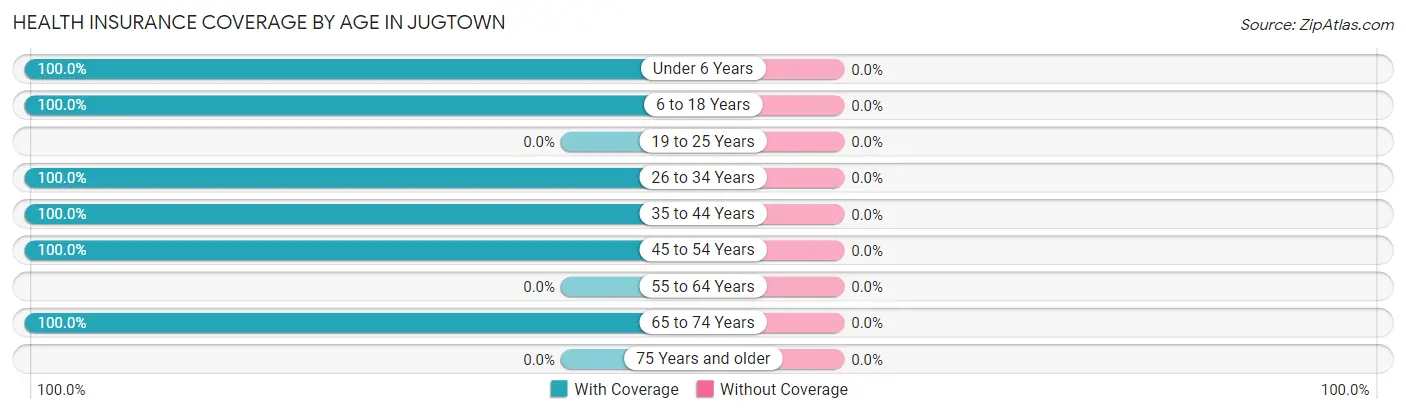
| Age Bracket | With Coverage | Without Coverage |
| Under 6 Years | 13 (100.0%) | 0 (0.0%) |
| 6 to 18 Years | 36 (100.0%) | 0 (0.0%) |
| 19 to 25 Years | 0 (0.0%) | 0 (0.0%) |
| 26 to 34 Years | 28 (100.0%) | 0 (0.0%) |
| 35 to 44 Years | 6 (100.0%) | 0 (0.0%) |
| 45 to 54 Years | 51 (100.0%) | 0 (0.0%) |
| 55 to 64 Years | 0 (0.0%) | 0 (0.0%) |
| 65 to 74 Years | 8 (100.0%) | 0 (0.0%) |
| 75 Years and older | 0 (0.0%) | 0 (0.0%) |
| Total | 142 (100.0%) | 0 (0.0%) |
Health Insurance Coverage by Citizenship Status in Jugtown
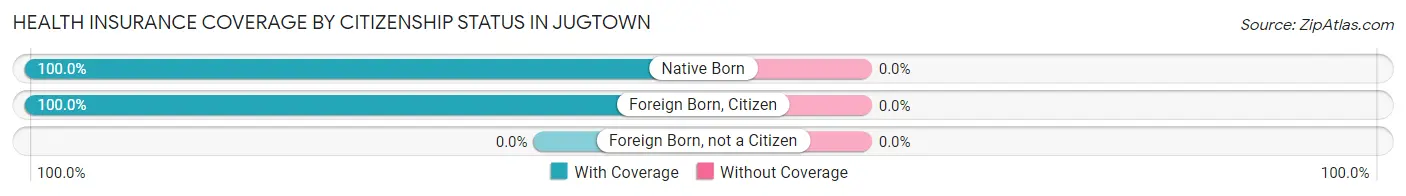
| Citizenship Status | With Coverage | Without Coverage |
| Native Born | 13 (100.0%) | 0 (0.0%) |
| Foreign Born, Citizen | 36 (100.0%) | 0 (0.0%) |
| Foreign Born, not a Citizen | 0 (0.0%) | 0 (0.0%) |
Health Insurance Coverage by Household Income in Jugtown
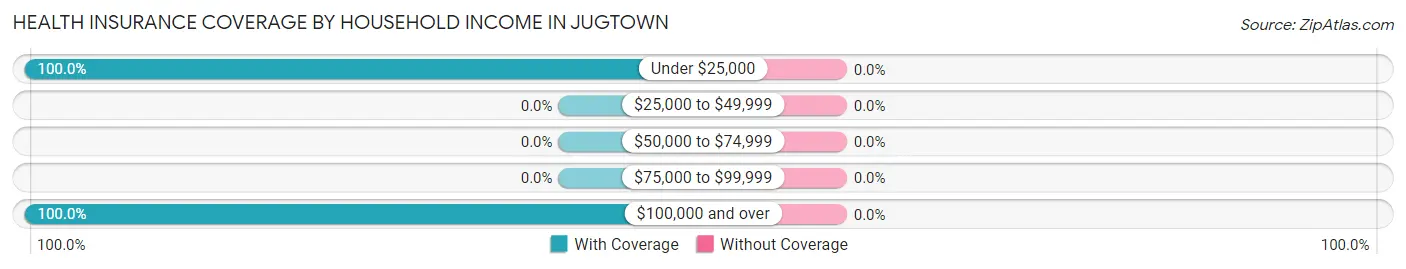
| Household Income | With Coverage | Without Coverage |
| Under $25,000 | 8 (100.0%) | 0 (0.0%) |
| $25,000 to $49,999 | 0 (0.0%) | 0 (0.0%) |
| $50,000 to $74,999 | 0 (0.0%) | 0 (0.0%) |
| $75,000 to $99,999 | 0 (0.0%) | 0 (0.0%) |
| $100,000 and over | 134 (100.0%) | 0 (0.0%) |
Public vs Private Health Insurance Coverage by Age in Jugtown
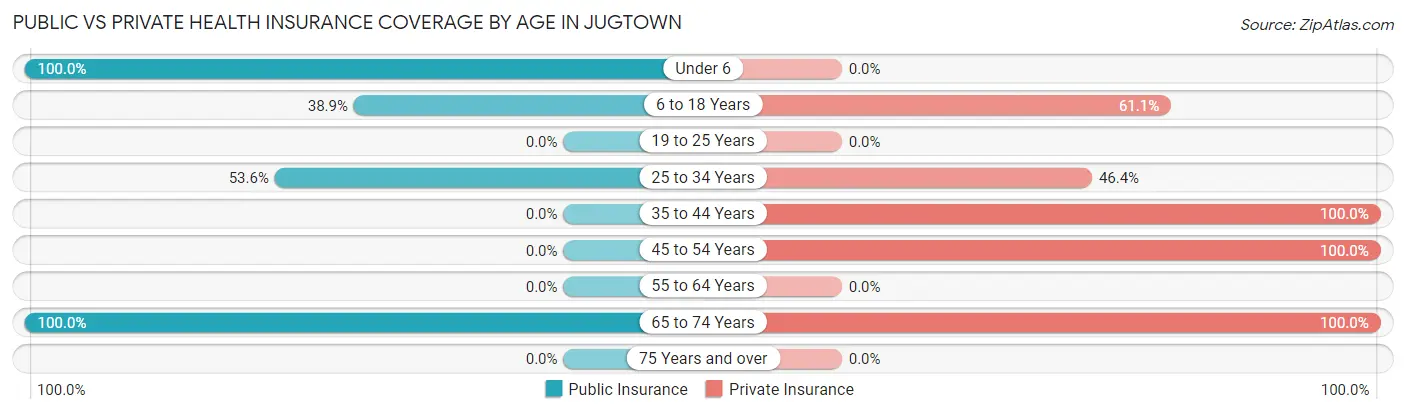
| Age Bracket | Public Insurance | Private Insurance |
| Under 6 | 13 (100.0%) | 0 (0.0%) |
| 6 to 18 Years | 14 (38.9%) | 22 (61.1%) |
| 19 to 25 Years | 0 (0.0%) | 0 (0.0%) |
| 25 to 34 Years | 15 (53.6%) | 13 (46.4%) |
| 35 to 44 Years | 0 (0.0%) | 6 (100.0%) |
| 45 to 54 Years | 0 (0.0%) | 51 (100.0%) |
| 55 to 64 Years | 0 (0.0%) | 0 (0.0%) |
| 65 to 74 Years | 8 (100.0%) | 8 (100.0%) |
| 75 Years and over | 0 (0.0%) | 0 (0.0%) |
| Total | 50 (35.2%) | 100 (70.4%) |
Disability Status by Sex by Age in Jugtown
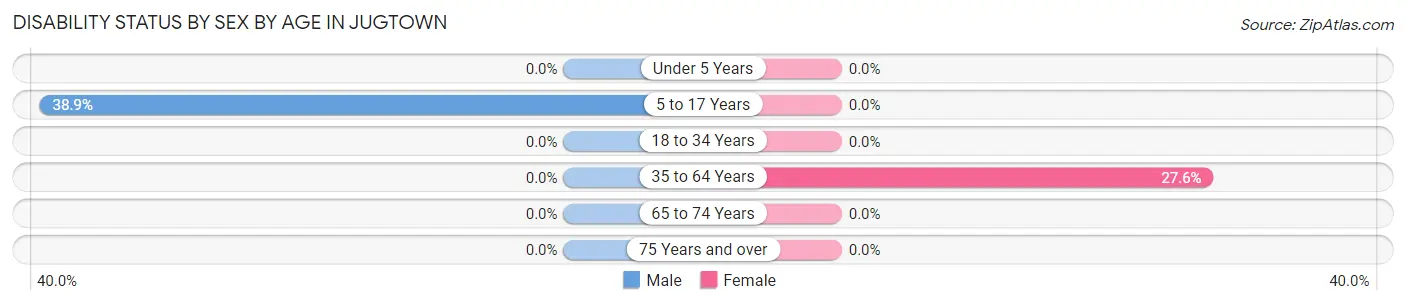
| Age Bracket | Male | Female |
| Under 5 Years | 0 (0.0%) | 0 (0.0%) |
| 5 to 17 Years | 14 (38.9%) | 0 (0.0%) |
| 18 to 34 Years | 0 (0.0%) | 0 (0.0%) |
| 35 to 64 Years | 0 (0.0%) | 8 (27.6%) |
| 65 to 74 Years | 0 (0.0%) | 0 (0.0%) |
| 75 Years and over | 0 (0.0%) | 0 (0.0%) |
Disability Class by Sex by Age in Jugtown
Disability Class: Hearing Difficulty
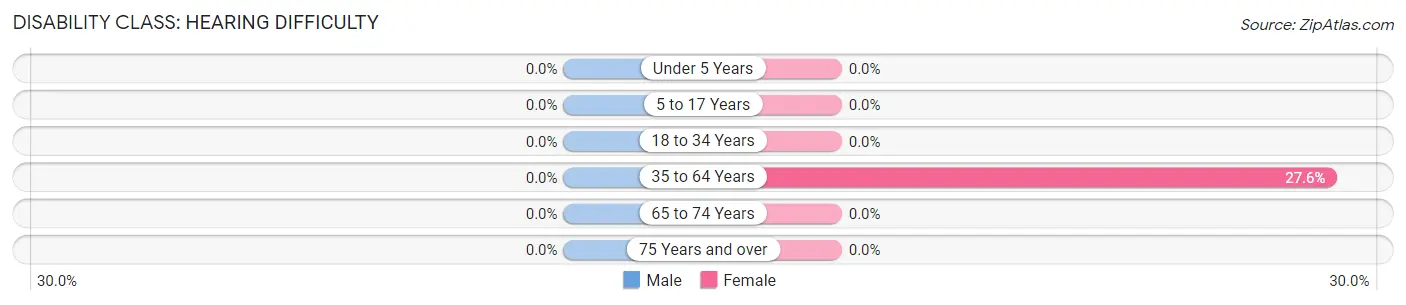
| Age Bracket | Male | Female |
| Under 5 Years | 0 (0.0%) | 0 (0.0%) |
| 5 to 17 Years | 0 (0.0%) | 0 (0.0%) |
| 18 to 34 Years | 0 (0.0%) | 0 (0.0%) |
| 35 to 64 Years | 0 (0.0%) | 8 (27.6%) |
| 65 to 74 Years | 0 (0.0%) | 0 (0.0%) |
| 75 Years and over | 0 (0.0%) | 0 (0.0%) |
Disability Class: Vision Difficulty
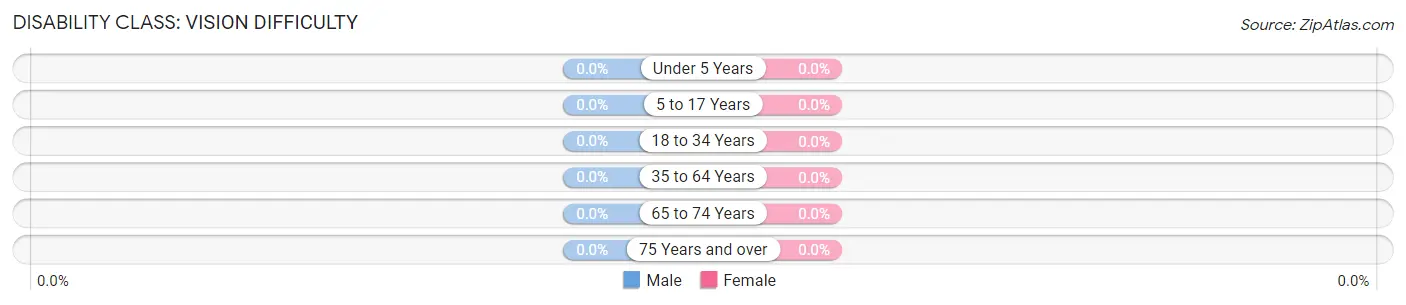
| Age Bracket | Male | Female |
| Under 5 Years | 0 (0.0%) | 0 (0.0%) |
| 5 to 17 Years | 0 (0.0%) | 0 (0.0%) |
| 18 to 34 Years | 0 (0.0%) | 0 (0.0%) |
| 35 to 64 Years | 0 (0.0%) | 0 (0.0%) |
| 65 to 74 Years | 0 (0.0%) | 0 (0.0%) |
| 75 Years and over | 0 (0.0%) | 0 (0.0%) |
Disability Class: Cognitive Difficulty
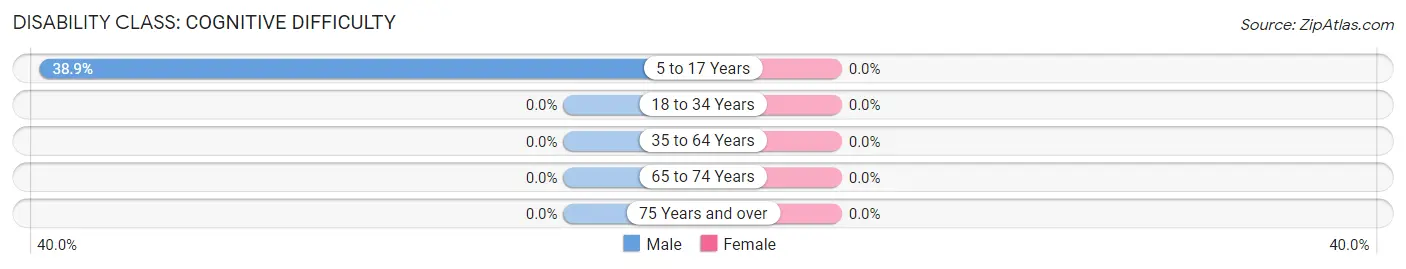
| Age Bracket | Male | Female |
| 5 to 17 Years | 14 (38.9%) | 0 (0.0%) |
| 18 to 34 Years | 0 (0.0%) | 0 (0.0%) |
| 35 to 64 Years | 0 (0.0%) | 0 (0.0%) |
| 65 to 74 Years | 0 (0.0%) | 0 (0.0%) |
| 75 Years and over | 0 (0.0%) | 0 (0.0%) |
Disability Class: Ambulatory Difficulty
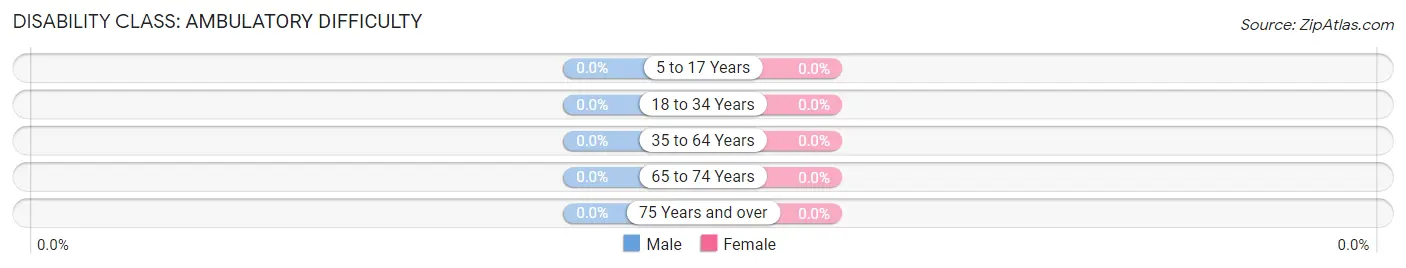
| Age Bracket | Male | Female |
| 5 to 17 Years | 0 (0.0%) | 0 (0.0%) |
| 18 to 34 Years | 0 (0.0%) | 0 (0.0%) |
| 35 to 64 Years | 0 (0.0%) | 0 (0.0%) |
| 65 to 74 Years | 0 (0.0%) | 0 (0.0%) |
| 75 Years and over | 0 (0.0%) | 0 (0.0%) |
Disability Class: Self-Care Difficulty
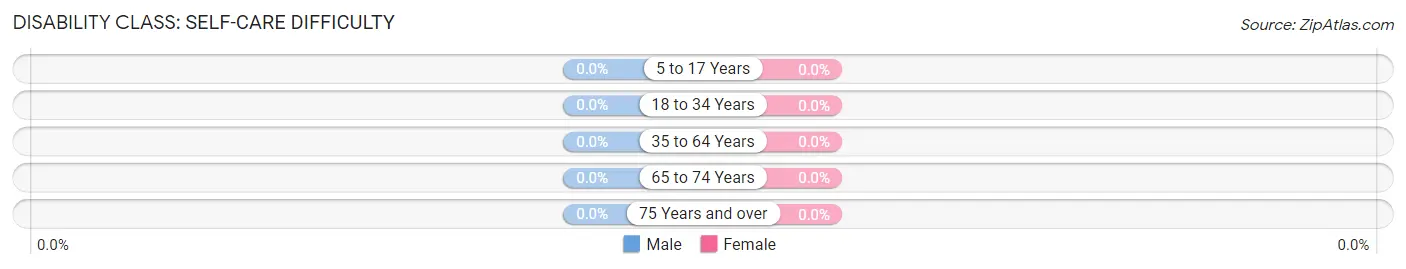
| Age Bracket | Male | Female |
| 5 to 17 Years | 0 (0.0%) | 0 (0.0%) |
| 18 to 34 Years | 0 (0.0%) | 0 (0.0%) |
| 35 to 64 Years | 0 (0.0%) | 0 (0.0%) |
| 65 to 74 Years | 0 (0.0%) | 0 (0.0%) |
| 75 Years and over | 0 (0.0%) | 0 (0.0%) |
Technology Access in Jugtown
Computing Device Access in Jugtown
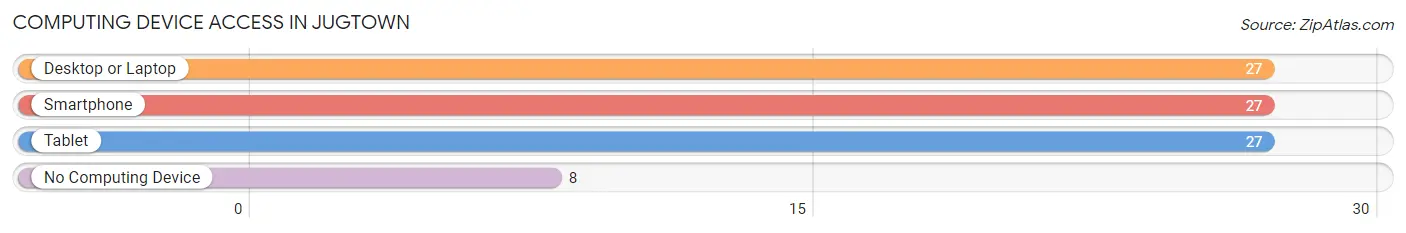
| Device Type | # Households | % Households |
| Desktop or Laptop | 27 | 77.1% |
| Smartphone | 27 | 77.1% |
| Tablet | 27 | 77.1% |
| No Computing Device | 8 | 22.9% |
| Total | 35 | 100.0% |
Internet Access in Jugtown
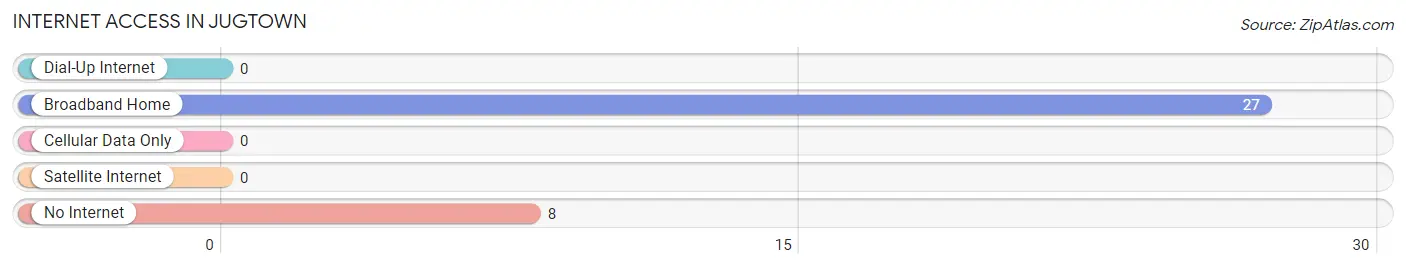
| Internet Type | # Households | % Households |
| Dial-Up Internet | 0 | 0.0% |
| Broadband Home | 27 | 77.1% |
| Cellular Data Only | 0 | 0.0% |
| Satellite Internet | 0 | 0.0% |
| No Internet | 8 | 22.9% |
| Total | 35 | 100.0% |
Jugtown Summary
Jugtown is a small unincorporated community located in Cecil County, Maryland. It is situated along the Susquehanna River, just south of the Pennsylvania border. The community is named for the large jug-shaped rock formations that are found in the area.
History
Jugtown was first settled in the late 1700s by a group of German immigrants. The settlers were attracted to the area due to its fertile soil and abundant natural resources. The community was originally known as “Jugtown” due to the large jug-shaped rocks that were found in the area. The rocks were believed to have been formed by the Susquehanna River over time.
The community grew slowly over the years, and by the mid-1800s, it had become a thriving agricultural community. The area was known for its production of tobacco, corn, and wheat. In addition, the community was home to several small businesses, including a general store, a blacksmith, and a gristmill.
In the late 1800s, the community began to decline due to the introduction of the railroad. The railroad bypassed Jugtown, and many of the businesses and farms in the area were forced to close. By the early 1900s, the population of Jugtown had dwindled to just a few dozen people.
Geography
Jugtown is located in Cecil County, Maryland, just south of the Pennsylvania border. The community is situated along the Susquehanna River, and is surrounded by rolling hills and farmland. The area is known for its jug-shaped rock formations, which are believed to have been formed by the Susquehanna River over time.
The climate in Jugtown is humid subtropical, with hot, humid summers and cold, wet winters. The average annual temperature is around 54°F (12°C). The average annual precipitation is around 40 inches (101 cm).
Economy
The economy of Jugtown is largely based on agriculture. The area is known for its production of tobacco, corn, and wheat. In addition, the community is home to several small businesses, including a general store, a blacksmith, and a gristmill.
Demographics
As of the 2010 census, the population of Jugtown was 545. The racial makeup of the community was 97.3% White, 0.7% African American, 0.2% Native American, 0.2% Asian, and 1.6% from other races. The median household income was $45,000, and the median family income was $50,000.
Conclusion
Jugtown is a small unincorporated community located in Cecil County, Maryland. It is situated along the Susquehanna River, just south of the Pennsylvania border. The community is named for the large jug-shaped rock formations that are found in the area. The economy of Jugtown is largely based on agriculture, and the population of the community was 545 as of the 2010 census.
Common Questions
What is Per Capita Income in Jugtown?
Per Capita income in Jugtown is $44,256.
What is the Median Family Income in Jugtown?
Median Family Income in Jugtown is $250,001.
What is the Median Household income in Jugtown?
Median Household Income in Jugtown is $187,159.
What is Inequality or Gini Index in Jugtown?
Inequality or Gini Index in Jugtown is 0.27.
What is the Total Population of Jugtown?
Total Population of Jugtown is 142.
What is the Total Male Population of Jugtown?
Total Male Population of Jugtown is 77.
What is the Total Female Population of Jugtown?
Total Female Population of Jugtown is 65.
What is the Ratio of Males per 100 Females in Jugtown?
There are 118.46 Males per 100 Females in Jugtown.
What is the Ratio of Females per 100 Males in Jugtown?
There are 84.42 Females per 100 Males in Jugtown.
What is the Median Population Age in Jugtown?
Median Population Age in Jugtown is 29.8 Years.
What is the Average Family Size in Jugtown
Average Family Size in Jugtown is 5.0 People.
What is the Average Household Size in Jugtown
Average Household Size in Jugtown is 4.1 People.
How Large is the Labor Force in Jugtown?
There are 77 People in the Labor Forcein in Jugtown.
What is the Percentage of People in the Labor Force in Jugtown?
82.8% of People are in the Labor Force in Jugtown.