Edgemont, MD Map & Demographics
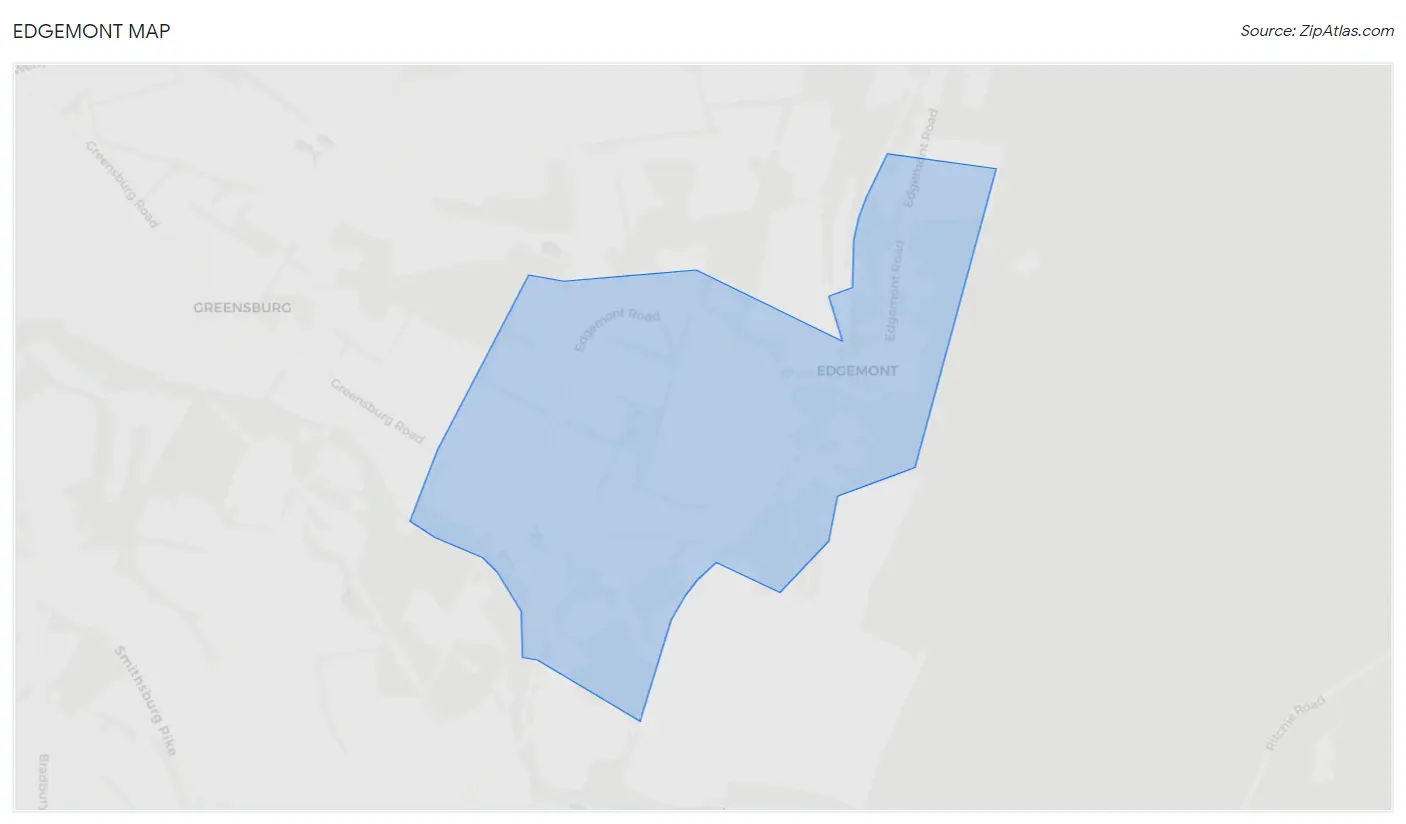
Edgemont Map
Edgemont Overview
$38,697
PER CAPITA INCOME
$66,250
AVG HOUSEHOLD INCOME
0.25
INEQUALITY / GINI INDEX
244
TOTAL POPULATION
115
MALE POPULATION
129
FEMALE POPULATION
89.15
MALES / 100 FEMALES
112.17
FEMALES / 100 MALES
56.6
MEDIAN AGE
2.7
AVG FAMILY SIZE
2.1
AVG HOUSEHOLD SIZE
158
LABOR FORCE [ PEOPLE ]
70.2%
PERCENT IN LABOR FORCE
7.6%
UNEMPLOYMENT RATE
Income in Edgemont
Income Overview in Edgemont
| Characteristic | Number | Measure |
| Per Capita Income | 244 | $38,697 |
| Median Family Income | 66 | $0 |
| Mean Family Income | 66 | $101,067 |
| Median Household Income | 117 | $66,250 |
| Mean Household Income | 117 | $81,371 |
| Income Deficit | 66 | $0 |
| Wage / Income Gap (%) | 244 | 0.00% |
| Wage / Income Gap ($) | 244 | 100.00¢ per $1 |
| Gini / Inequality Index | 244 | 0.25 |
Earnings by Sex in Edgemont
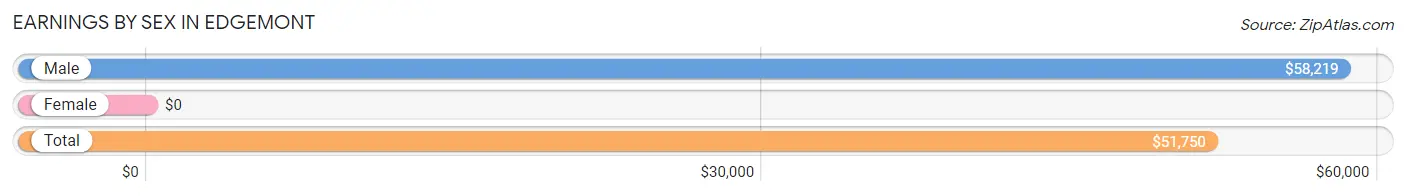
| Sex | Number | Average Earnings |
| Male | 99 (67.8%) | $58,219 |
| Female | 47 (32.2%) | $0 |
| Total | 146 (100.0%) | $51,750 |
Earnings by Sex by Income Bracket in Edgemont
The most common earnings brackets in Edgemont are $55,000 to $64,999 for men (40 | 40.4%) and $5,000 to $7,499 for women (11 | 23.4%).
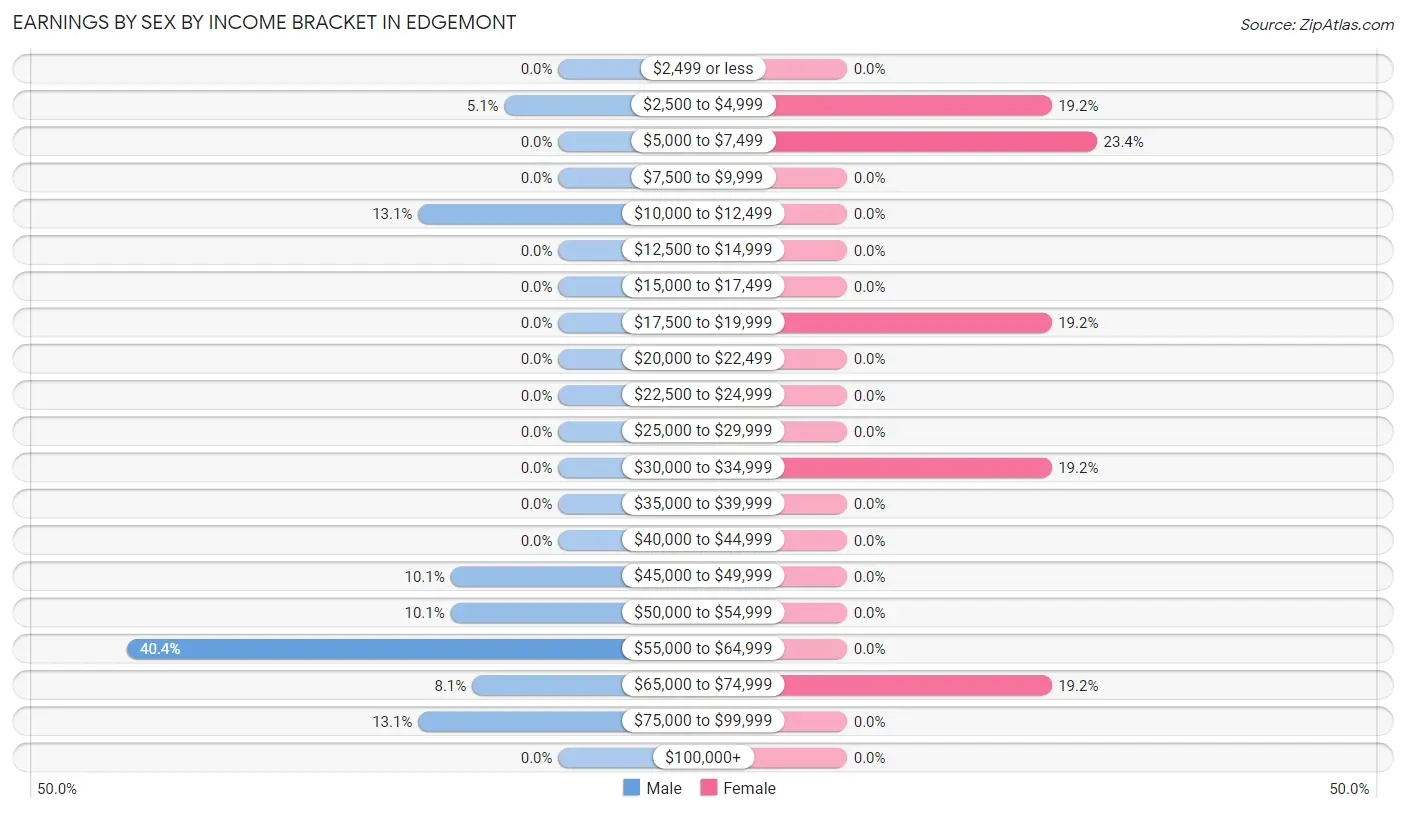
| Income | Male | Female |
| $2,499 or less | 0 (0.0%) | 0 (0.0%) |
| $2,500 to $4,999 | 5 (5.1%) | 9 (19.2%) |
| $5,000 to $7,499 | 0 (0.0%) | 11 (23.4%) |
| $7,500 to $9,999 | 0 (0.0%) | 0 (0.0%) |
| $10,000 to $12,499 | 13 (13.1%) | 0 (0.0%) |
| $12,500 to $14,999 | 0 (0.0%) | 0 (0.0%) |
| $15,000 to $17,499 | 0 (0.0%) | 0 (0.0%) |
| $17,500 to $19,999 | 0 (0.0%) | 9 (19.2%) |
| $20,000 to $22,499 | 0 (0.0%) | 0 (0.0%) |
| $22,500 to $24,999 | 0 (0.0%) | 0 (0.0%) |
| $25,000 to $29,999 | 0 (0.0%) | 0 (0.0%) |
| $30,000 to $34,999 | 0 (0.0%) | 9 (19.2%) |
| $35,000 to $39,999 | 0 (0.0%) | 0 (0.0%) |
| $40,000 to $44,999 | 0 (0.0%) | 0 (0.0%) |
| $45,000 to $49,999 | 10 (10.1%) | 0 (0.0%) |
| $50,000 to $54,999 | 10 (10.1%) | 0 (0.0%) |
| $55,000 to $64,999 | 40 (40.4%) | 0 (0.0%) |
| $65,000 to $74,999 | 8 (8.1%) | 9 (19.2%) |
| $75,000 to $99,999 | 13 (13.1%) | 0 (0.0%) |
| $100,000+ | 0 (0.0%) | 0 (0.0%) |
| Total | 99 (100.0%) | 47 (100.0%) |
Earnings by Sex by Educational Attainment in Edgemont
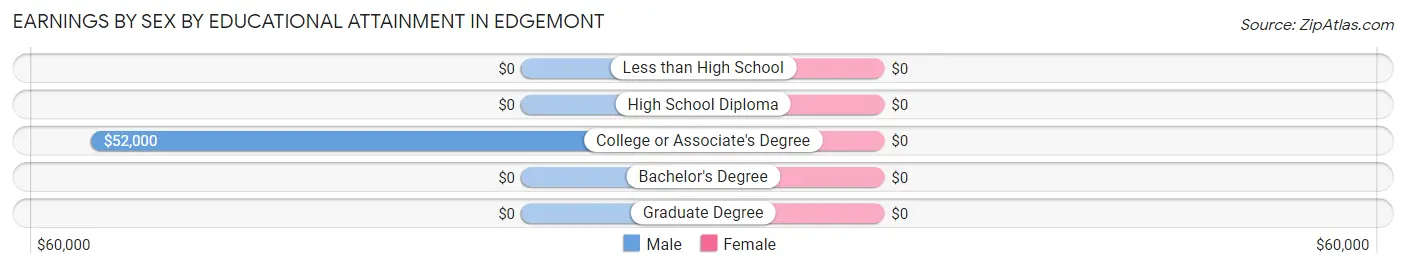
| Educational Attainment | Male Income | Female Income |
| Less than High School | - | - |
| High School Diploma | - | - |
| College or Associate's Degree | $52,000 | $0 |
| Bachelor's Degree | - | - |
| Graduate Degree | - | - |
| Total | $58,219 | $0 |
Family Income in Edgemont
Family Income Brackets in Edgemont
According to the Edgemont family income data, there are 34 families falling into the $50,000 to $74,999 income range, which is the most common income bracket and makes up 51.5% of all families.
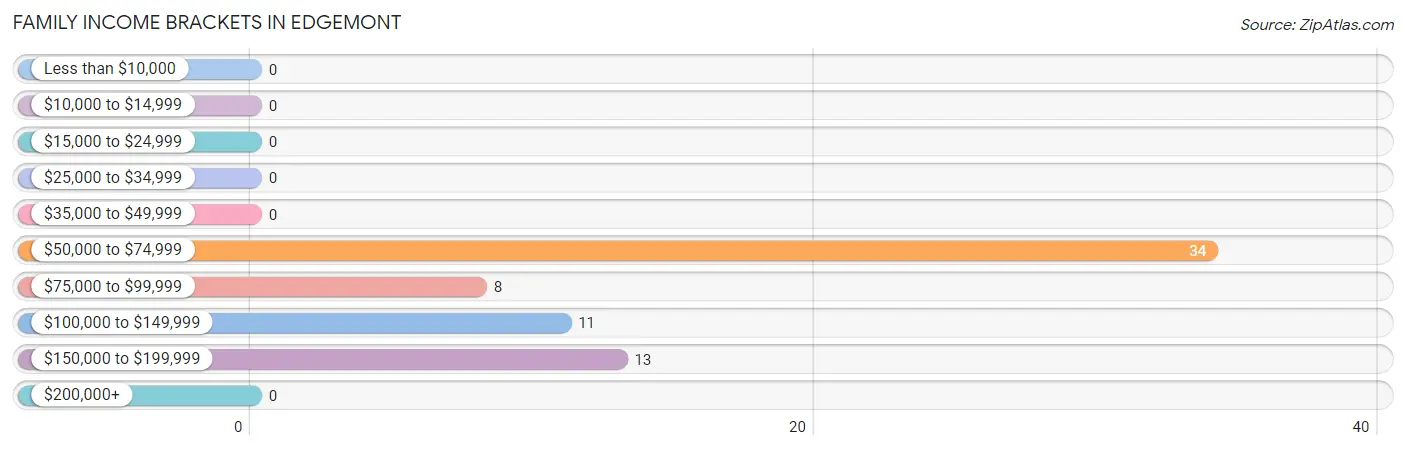
| Income Bracket | # Families | % Families |
| Less than $10,000 | 0 | 0.0% |
| $10,000 to $14,999 | 0 | 0.0% |
| $15,000 to $24,999 | 0 | 0.0% |
| $25,000 to $34,999 | 0 | 0.0% |
| $35,000 to $49,999 | 0 | 0.0% |
| $50,000 to $74,999 | 34 | 51.5% |
| $75,000 to $99,999 | 8 | 12.1% |
| $100,000 to $149,999 | 11 | 16.7% |
| $150,000 to $199,999 | 13 | 19.7% |
| $200,000+ | 0 | 0.0% |
Family Income by Famaliy Size in Edgemont
3-person families (29 | 43.9%) account for the highest median family income in Edgemont with $88,906 per family, while 3-person families (29 | 43.9%) have the highest median income of $29,635 per family member.
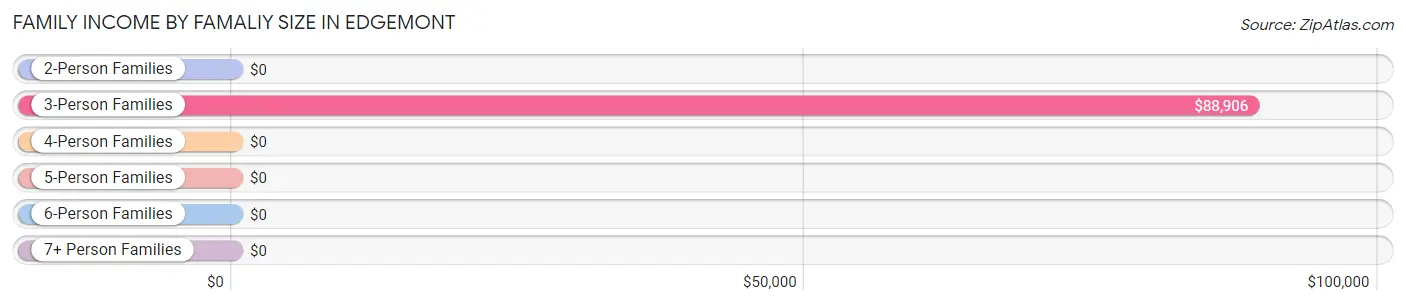
| Income Bracket | # Families | Median Income |
| 2-Person Families | 31 (47.0%) | $0 |
| 3-Person Families | 29 (43.9%) | $88,906 |
| 4-Person Families | 0 (0.0%) | $0 |
| 5-Person Families | 6 (9.1%) | $0 |
| 6-Person Families | 0 (0.0%) | $0 |
| 7+ Person Families | 0 (0.0%) | $0 |
| Total | 66 (100.0%) | $0 |
Family Income by Number of Earners in Edgemont
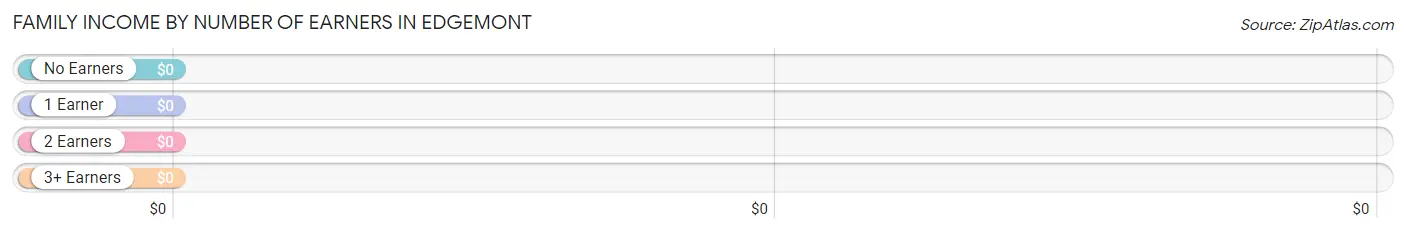
| Number of Earners | # Families | Median Income |
| No Earners | 0 (0.0%) | $0 |
| 1 Earner | 37 (56.1%) | $0 |
| 2 Earners | 21 (31.8%) | $0 |
| 3+ Earners | 8 (12.1%) | $0 |
| Total | 66 (100.0%) | $0 |
Household Income in Edgemont
Household Income Brackets in Edgemont
With 76 households falling in the category, the $50,000 to $74,999 income range is the most frequent in Edgemont, accounting for 65.0% of all households.
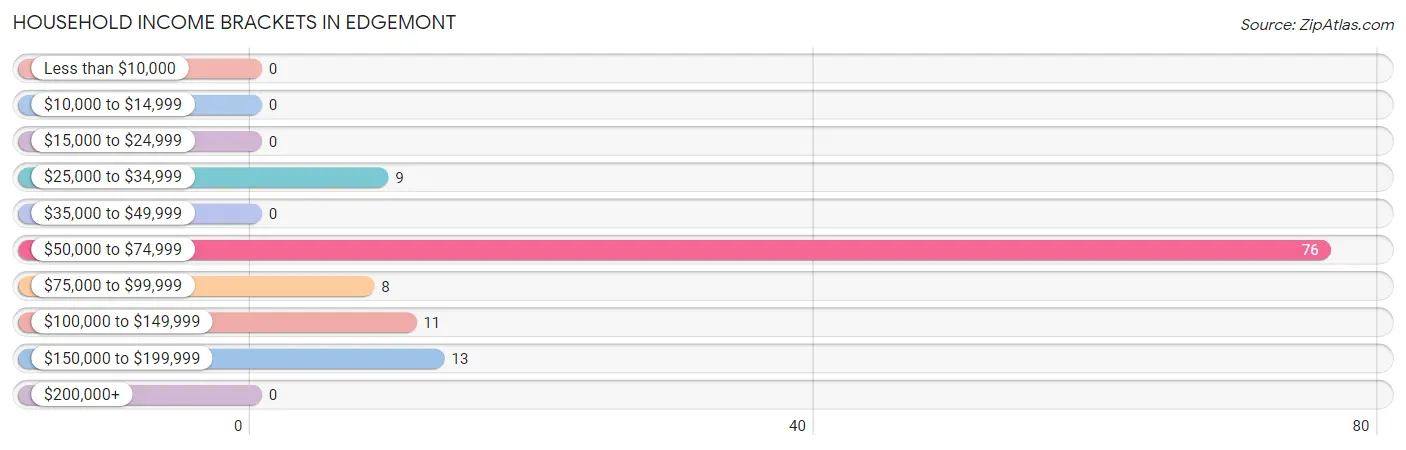
| Income Bracket | # Households | % Households |
| Less than $10,000 | 0 | 0.0% |
| $10,000 to $14,999 | 0 | 0.0% |
| $15,000 to $24,999 | 0 | 0.0% |
| $25,000 to $34,999 | 9 | 7.7% |
| $35,000 to $49,999 | 0 | 0.0% |
| $50,000 to $74,999 | 76 | 65.0% |
| $75,000 to $99,999 | 8 | 6.8% |
| $100,000 to $149,999 | 11 | 9.4% |
| $150,000 to $199,999 | 13 | 11.1% |
| $200,000+ | 0 | 0.0% |
Household Income by Householder Age in Edgemont
The median household income in Edgemont is $66,250, with the highest median household income of $58,711 found in the 45 to 64 years age bracket for the primary householder. A total of 49 households (41.9%) fall into this category.
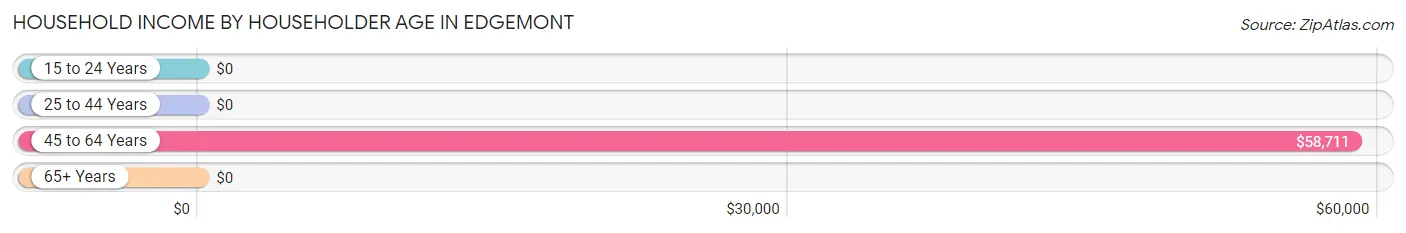
| Income Bracket | # Households | Median Income |
| 15 to 24 Years | 0 (0.0%) | $0 |
| 25 to 44 Years | 6 (5.1%) | $0 |
| 45 to 64 Years | 49 (41.9%) | $58,711 |
| 65+ Years | 62 (53.0%) | $0 |
| Total | 117 (100.0%) | $66,250 |
Poverty in Edgemont
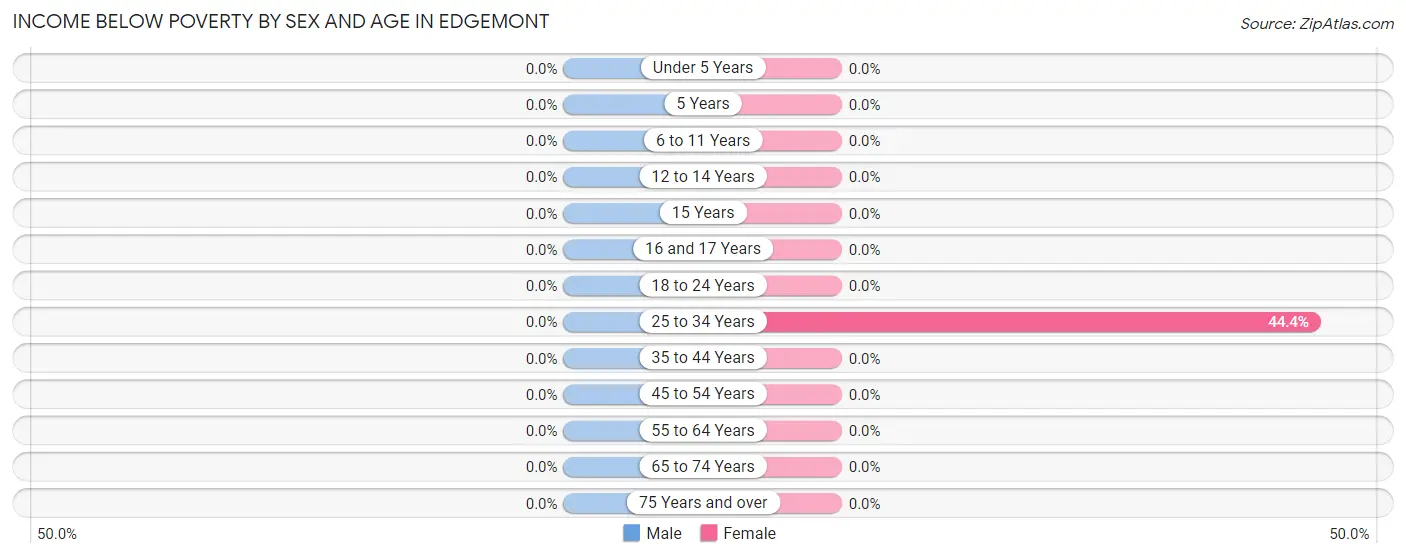
Income Below Poverty by Sex and Age in Edgemont
| Age Bracket | Male | Female |
| Under 5 Years | 0 (0.0%) | 0 (0.0%) |
| 5 Years | 0 (0.0%) | 0 (0.0%) |
| 6 to 11 Years | 0 (0.0%) | 0 (0.0%) |
| 12 to 14 Years | 0 (0.0%) | 0 (0.0%) |
| 15 Years | 0 (0.0%) | 0 (0.0%) |
| 16 and 17 Years | 0 (0.0%) | 0 (0.0%) |
| 18 to 24 Years | 0 (0.0%) | 0 (0.0%) |
| 25 to 34 Years | 0 (0.0%) | 12 (44.4%) |
| 35 to 44 Years | 0 (0.0%) | 0 (0.0%) |
| 45 to 54 Years | 0 (0.0%) | 0 (0.0%) |
| 55 to 64 Years | 0 (0.0%) | 0 (0.0%) |
| 65 to 74 Years | 0 (0.0%) | 0 (0.0%) |
| 75 Years and over | 0 (0.0%) | 0 (0.0%) |
| Total | 0 (0.0%) | 12 (9.3%) |
Income Above Poverty by Sex and Age in Edgemont
According to the poverty statistics in Edgemont, males aged 6 to 11 years and females aged under 5 years are the age groups that are most secure financially, with 100.0% of males and 100.0% of females in these age groups living above the poverty line.
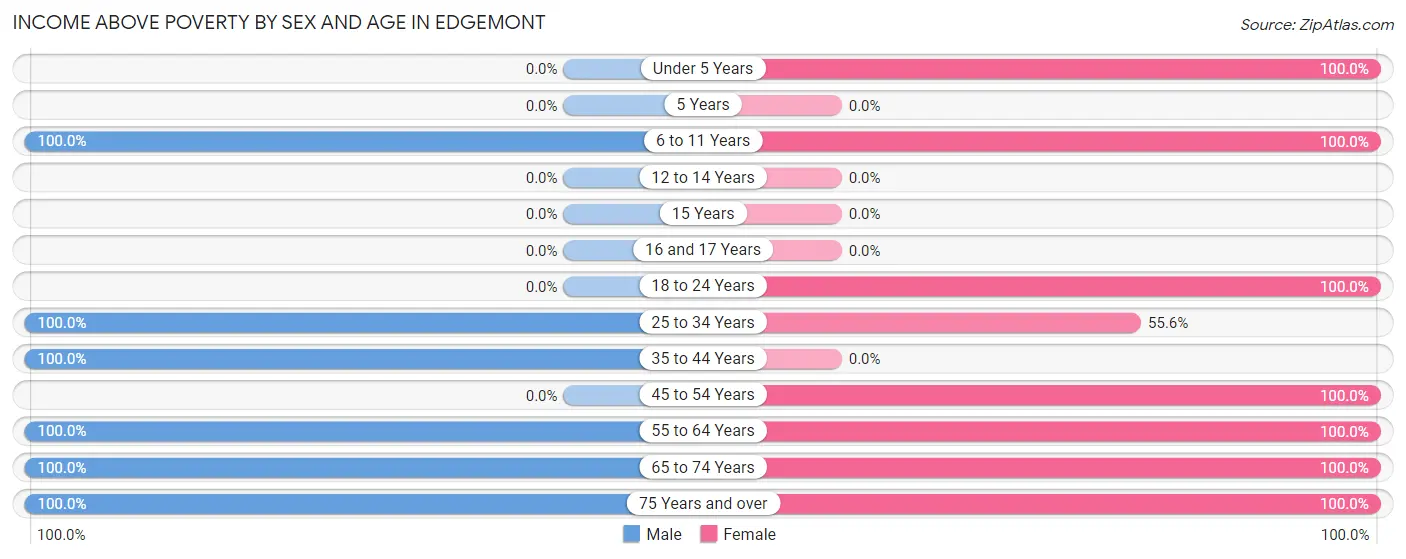
| Age Bracket | Male | Female |
| Under 5 Years | 0 (0.0%) | 6 (100.0%) |
| 5 Years | 0 (0.0%) | 0 (0.0%) |
| 6 to 11 Years | 6 (100.0%) | 7 (100.0%) |
| 12 to 14 Years | 0 (0.0%) | 0 (0.0%) |
| 15 Years | 0 (0.0%) | 0 (0.0%) |
| 16 and 17 Years | 0 (0.0%) | 0 (0.0%) |
| 18 to 24 Years | 0 (0.0%) | 9 (100.0%) |
| 25 to 34 Years | 8 (100.0%) | 15 (55.6%) |
| 35 to 44 Years | 10 (100.0%) | 0 (0.0%) |
| 45 to 54 Years | 0 (0.0%) | 11 (100.0%) |
| 55 to 64 Years | 50 (100.0%) | 18 (100.0%) |
| 65 to 74 Years | 31 (100.0%) | 29 (100.0%) |
| 75 Years and over | 10 (100.0%) | 22 (100.0%) |
| Total | 115 (100.0%) | 117 (90.7%) |
Income Below Poverty Among Married-Couple Families in Edgemont
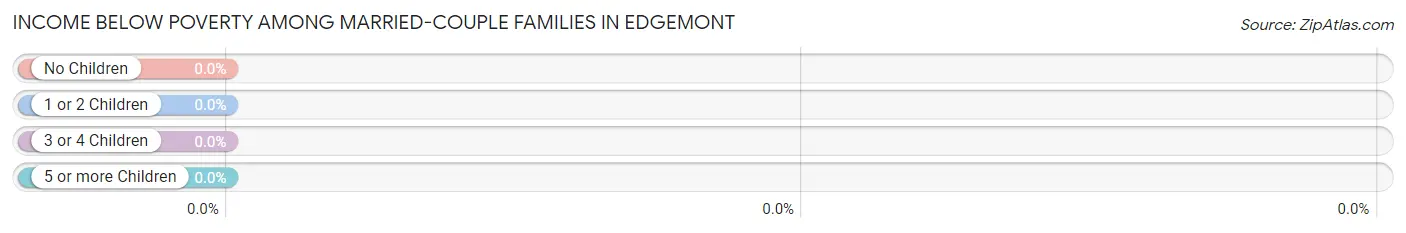
| Children | Above Poverty | Below Poverty |
| No Children | 50 (100.0%) | 0 (0.0%) |
| 1 or 2 Children | 0 (0.0%) | 0 (0.0%) |
| 3 or 4 Children | 6 (100.0%) | 0 (0.0%) |
| 5 or more Children | 0 (0.0%) | 0 (0.0%) |
| Total | 56 (100.0%) | 0 (0.0%) |
Income Below Poverty Among Single-Parent Households in Edgemont
| Children | Single Father | Single Mother |
| No Children | 0 (0.0%) | 0 (0.0%) |
| 1 or 2 Children | 0 (0.0%) | 0 (0.0%) |
| 3 or 4 Children | 0 (0.0%) | 0 (0.0%) |
| 5 or more Children | 0 (0.0%) | 0 (0.0%) |
| Total | 0 (0.0%) | 0 (0.0%) |
Income Below Poverty Among Married-Couple vs Single-Parent Households in Edgemont
| Children | Married-Couple Families | Single-Parent Households |
| No Children | 0 (0.0%) | 0 (0.0%) |
| 1 or 2 Children | 0 (0.0%) | 0 (0.0%) |
| 3 or 4 Children | 0 (0.0%) | 0 (0.0%) |
| 5 or more Children | 0 (0.0%) | 0 (0.0%) |
| Total | 0 (0.0%) | 0 (0.0%) |
Race in Edgemont
The most populous races in Edgemont are , and White / Caucasian (244 | 100.0%).
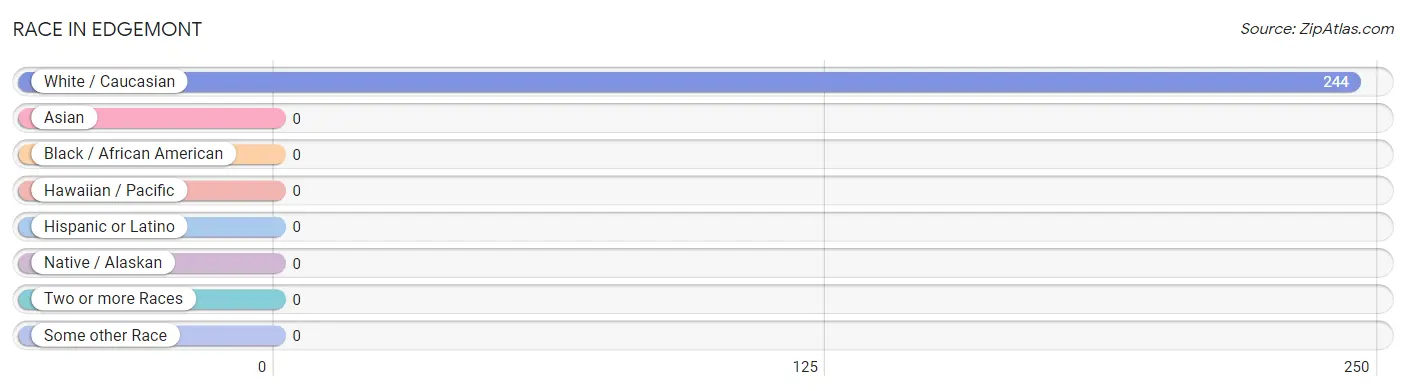
| Race | # Population | % Population |
| Asian | 0 | 0.0% |
| Black / African American | 0 | 0.0% |
| Hawaiian / Pacific | 0 | 0.0% |
| Hispanic or Latino | 0 | 0.0% |
| Native / Alaskan | 0 | 0.0% |
| White / Caucasian | 244 | 100.0% |
| Two or more Races | 0 | 0.0% |
| Some other Race | 0 | 0.0% |
| Total | 244 | 100.0% |
Ancestry in Edgemont
The most populous ancestries reported in Edgemont are German (82 | 33.6%), Irish (76 | 31.1%), English (64 | 26.2%), Italian (49 | 20.1%), and American (32 | 13.1%), together accounting for 124.2% of all Edgemont residents.
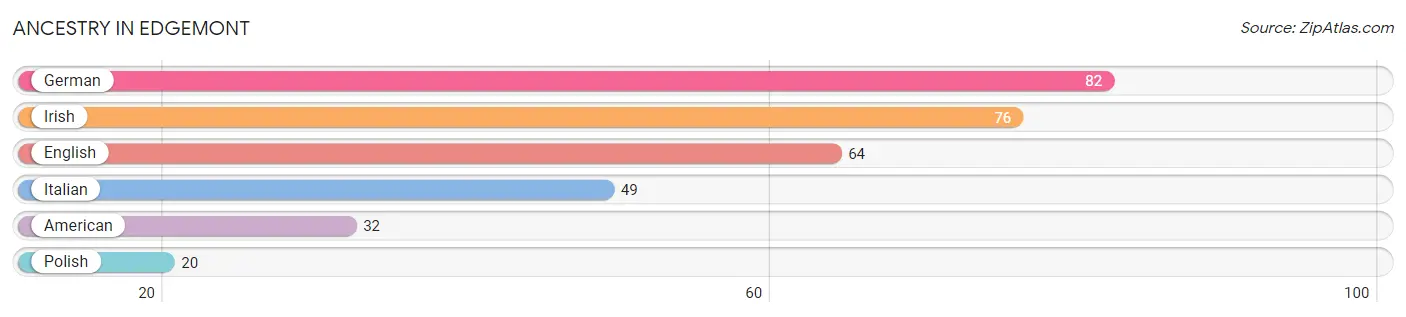
| Ancestry | # Population | % Population |
| American | 32 | 13.1% |
| English | 64 | 26.2% |
| German | 82 | 33.6% |
| Irish | 76 | 31.1% |
| Italian | 49 | 20.1% |
| Polish | 20 | 8.2% | View All 6 Rows |
Immigrants in Edgemont

| Immigration Origin | # Population | % Population | View All 0 Rows |
Sex and Age in Edgemont
Sex and Age in Edgemont
The most populous age groups in Edgemont are 55 to 59 Years (50 | 43.5%) for men and 65 to 69 Years (24 | 18.6%) for women.
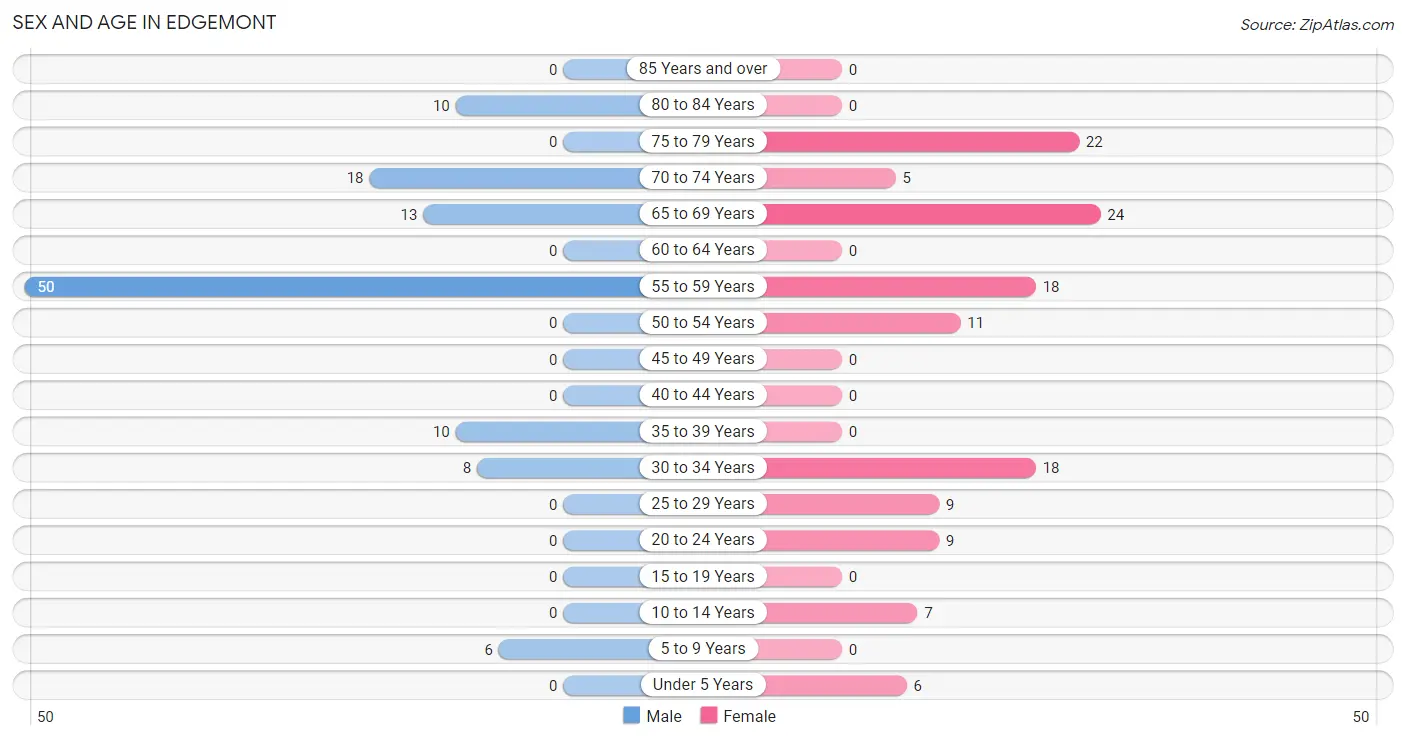
| Age Bracket | Male | Female |
| Under 5 Years | 0 (0.0%) | 6 (4.6%) |
| 5 to 9 Years | 6 (5.2%) | 0 (0.0%) |
| 10 to 14 Years | 0 (0.0%) | 7 (5.4%) |
| 15 to 19 Years | 0 (0.0%) | 0 (0.0%) |
| 20 to 24 Years | 0 (0.0%) | 9 (7.0%) |
| 25 to 29 Years | 0 (0.0%) | 9 (7.0%) |
| 30 to 34 Years | 8 (7.0%) | 18 (14.0%) |
| 35 to 39 Years | 10 (8.7%) | 0 (0.0%) |
| 40 to 44 Years | 0 (0.0%) | 0 (0.0%) |
| 45 to 49 Years | 0 (0.0%) | 0 (0.0%) |
| 50 to 54 Years | 0 (0.0%) | 11 (8.5%) |
| 55 to 59 Years | 50 (43.5%) | 18 (14.0%) |
| 60 to 64 Years | 0 (0.0%) | 0 (0.0%) |
| 65 to 69 Years | 13 (11.3%) | 24 (18.6%) |
| 70 to 74 Years | 18 (15.7%) | 5 (3.9%) |
| 75 to 79 Years | 0 (0.0%) | 22 (17.1%) |
| 80 to 84 Years | 10 (8.7%) | 0 (0.0%) |
| 85 Years and over | 0 (0.0%) | 0 (0.0%) |
| Total | 115 (100.0%) | 129 (100.0%) |
Families and Households in Edgemont
Median Family Size in Edgemont
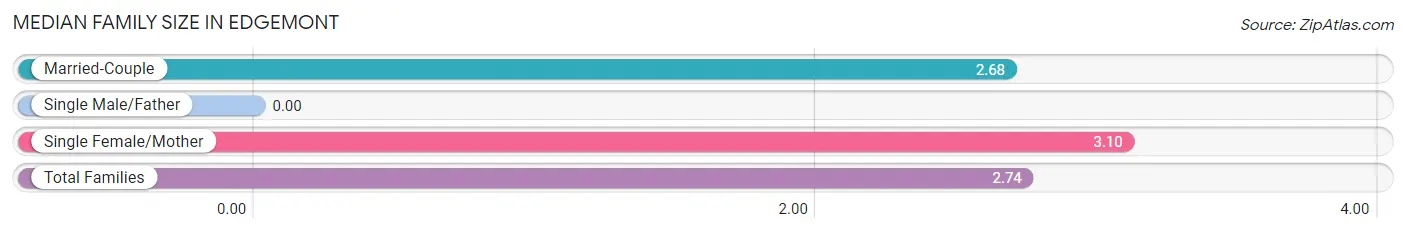
| Family Type | # Families | Family Size |
| Married-Couple | 56 (84.9%) | 2.68 |
| Single Male/Father | 0 (0.0%) | - |
| Single Female/Mother | 10 (15.1%) | 3.10 |
| Total Families | 66 (100.0%) | 2.74 |
Median Household Size in Edgemont
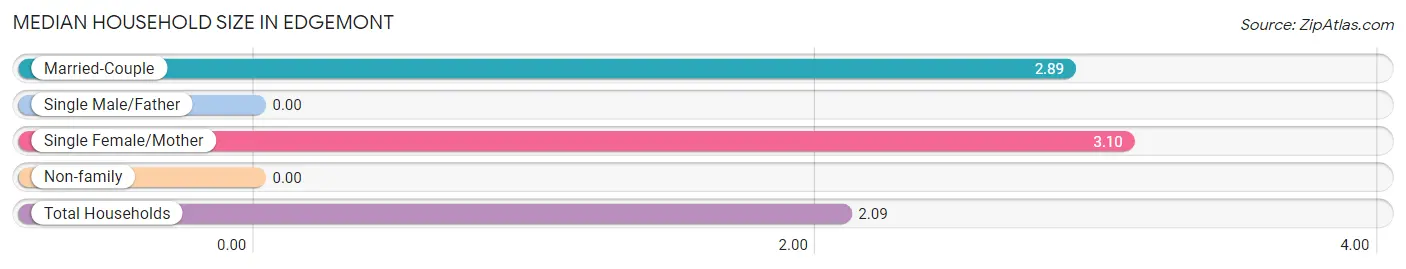
| Household Type | # Households | Household Size |
| Married-Couple | 56 (47.9%) | 2.89 |
| Single Male/Father | 0 (0.0%) | - |
| Single Female/Mother | 10 (8.6%) | 3.10 |
| Non-family | 51 (43.6%) | - |
| Total Households | 117 (100.0%) | 2.09 |
Household Size by Marriage Status in Edgemont
Out of a total of 117 households in Edgemont, 66 (56.4%) are family households, while 51 (43.6%) are nonfamily households. The most numerous type of family households are 3-person households, comprising 42, and the most common type of nonfamily households are 1-person households, comprising 51.
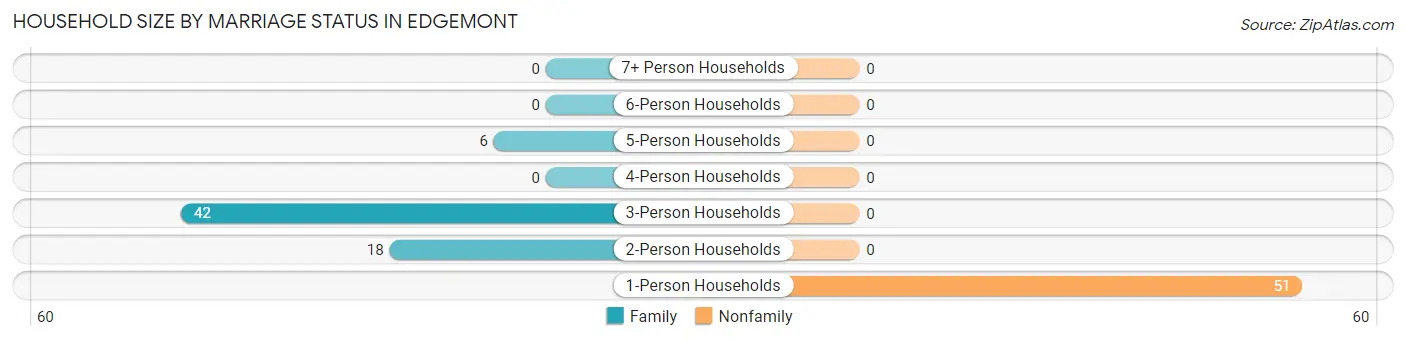
| Household Size | Family Households | Nonfamily Households |
| 1-Person Households | - | 51 (43.6%) |
| 2-Person Households | 18 (15.4%) | 0 (0.0%) |
| 3-Person Households | 42 (35.9%) | 0 (0.0%) |
| 4-Person Households | 0 (0.0%) | 0 (0.0%) |
| 5-Person Households | 6 (5.1%) | 0 (0.0%) |
| 6-Person Households | 0 (0.0%) | 0 (0.0%) |
| 7+ Person Households | 0 (0.0%) | 0 (0.0%) |
| Total | 66 (56.4%) | 51 (43.6%) |
Female Fertility in Edgemont
Fertility by Age in Edgemont
Average fertility rate in Edgemont is 255.0 births per 1,000 women. Women in the age bracket of 20 to 34 years have the highest fertility rate with 333.0 births per 1,000 women. Women in the age bracket of 20 to 34 years acount for 100.0% of all women with births.
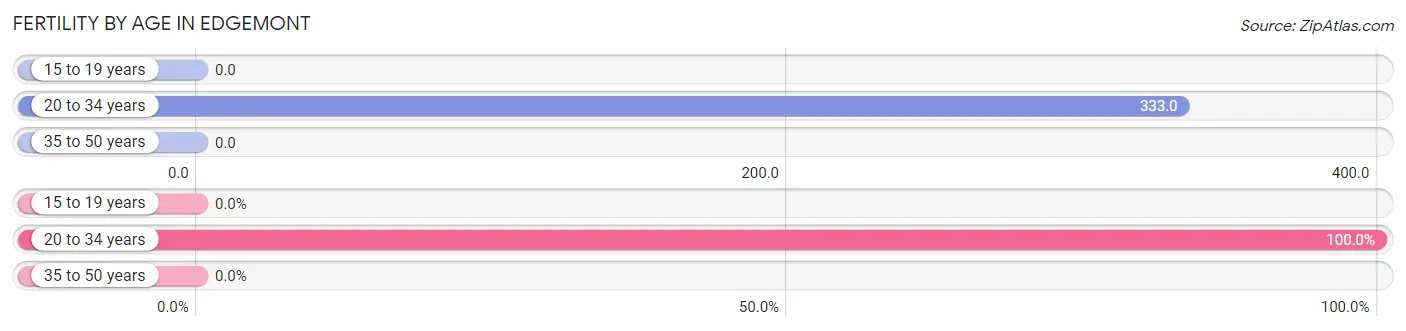
| Age Bracket | Women with Births | Births / 1,000 Women |
| 15 to 19 years | 0 (0.0%) | 0.0 |
| 20 to 34 years | 12 (100.0%) | 333.0 |
| 35 to 50 years | 0 (0.0%) | 0.0 |
| Total | 12 (100.0%) | 255.0 |
Fertility by Age by Marriage Status in Edgemont
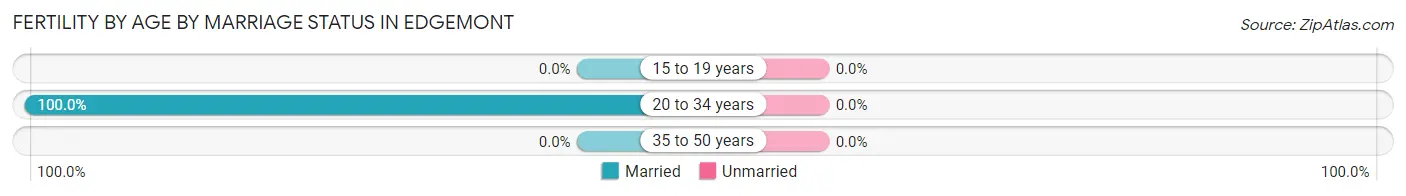
| Age Bracket | Married | Unmarried |
| 15 to 19 years | 0 (0.0%) | 0 (0.0%) |
| 20 to 34 years | 12 (100.0%) | 0 (0.0%) |
| 35 to 50 years | 0 (0.0%) | 0 (0.0%) |
| Total | 12 (100.0%) | 0 (0.0%) |
Fertility by Education in Edgemont
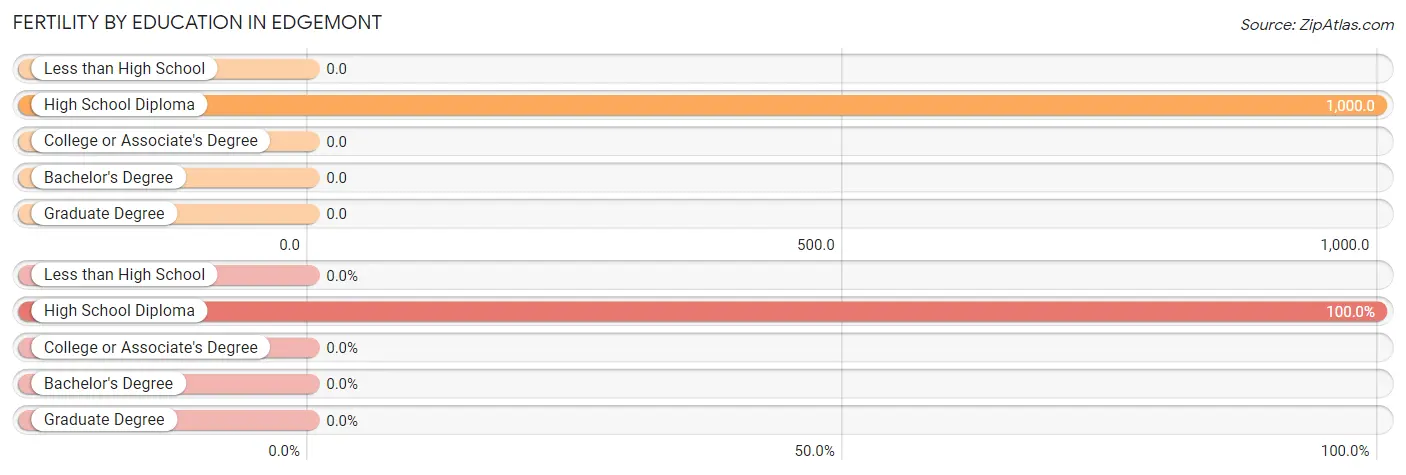
| Educational Attainment | Women with Births | Births / 1,000 Women |
| Less than High School | 0 (0.0%) | 0.0 |
| High School Diploma | 12 (100.0%) | 1,000.0 |
| College or Associate's Degree | 0 (0.0%) | 0.0 |
| Bachelor's Degree | 0 (0.0%) | 0.0 |
| Graduate Degree | 0 (0.0%) | 0.0 |
| Total | 12 (100.0%) | 255.0 |
Fertility by Education by Marriage Status in Edgemont
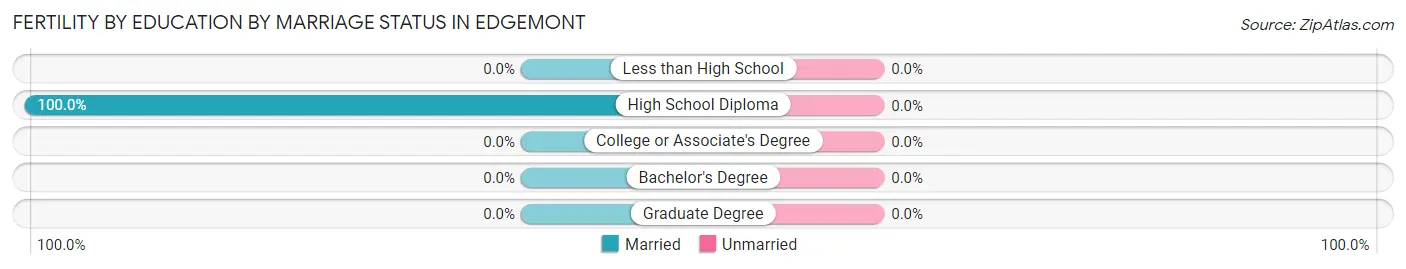
| Educational Attainment | Married | Unmarried |
| Less than High School | 0 (0.0%) | 0 (0.0%) |
| High School Diploma | 12 (100.0%) | 0 (0.0%) |
| College or Associate's Degree | 0 (0.0%) | 0 (0.0%) |
| Bachelor's Degree | 0 (0.0%) | 0 (0.0%) |
| Graduate Degree | 0 (0.0%) | 0 (0.0%) |
| Total | 12 (100.0%) | 0 (0.0%) |
Employment Characteristics in Edgemont
Employment by Class of Employer in Edgemont
Among the 146 employed individuals in Edgemont, local government employees (53 | 36.3%), private company employees (42 | 28.8%), and state government employees (19 | 13.0%) make up the most common classes of employment.
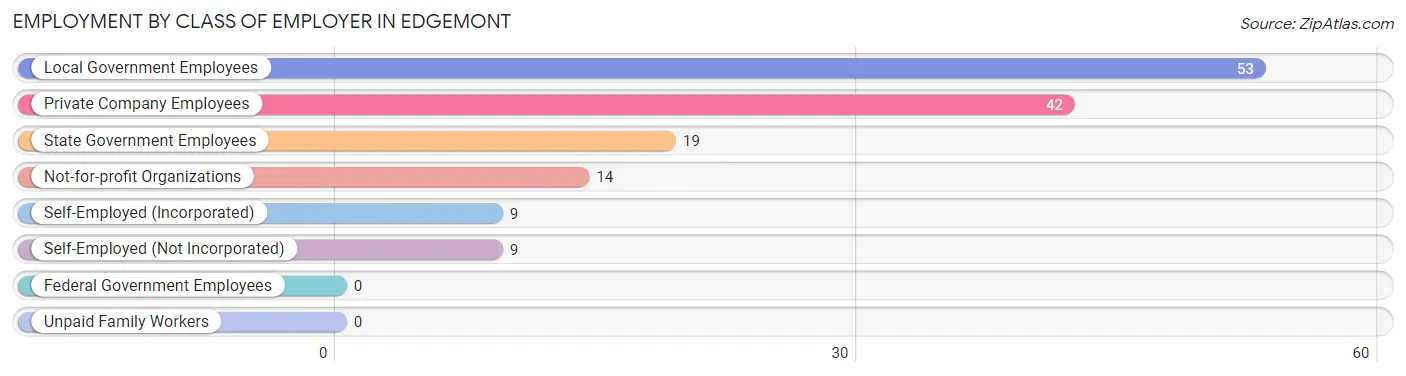
| Employer Class | # Employees | % Employees |
| Private Company Employees | 42 | 28.8% |
| Self-Employed (Incorporated) | 9 | 6.2% |
| Self-Employed (Not Incorporated) | 9 | 6.2% |
| Not-for-profit Organizations | 14 | 9.6% |
| Local Government Employees | 53 | 36.3% |
| State Government Employees | 19 | 13.0% |
| Federal Government Employees | 0 | 0.0% |
| Unpaid Family Workers | 0 | 0.0% |
| Total | 146 | 100.0% |
Employment Status by Age in Edgemont
According to the labor force statistics for Edgemont, out of the total population over 16 years of age (225), 70.2% or 158 individuals are in the labor force, with 7.6% or 12 of them unemployed. The age group with the highest labor force participation rate is 20 to 24 years, with 100.0% or 9 individuals in the labor force. Within the labor force, the 30 to 34 years age range has the highest percentage of unemployed individuals, with 60.0% or 12 of them being unemployed.
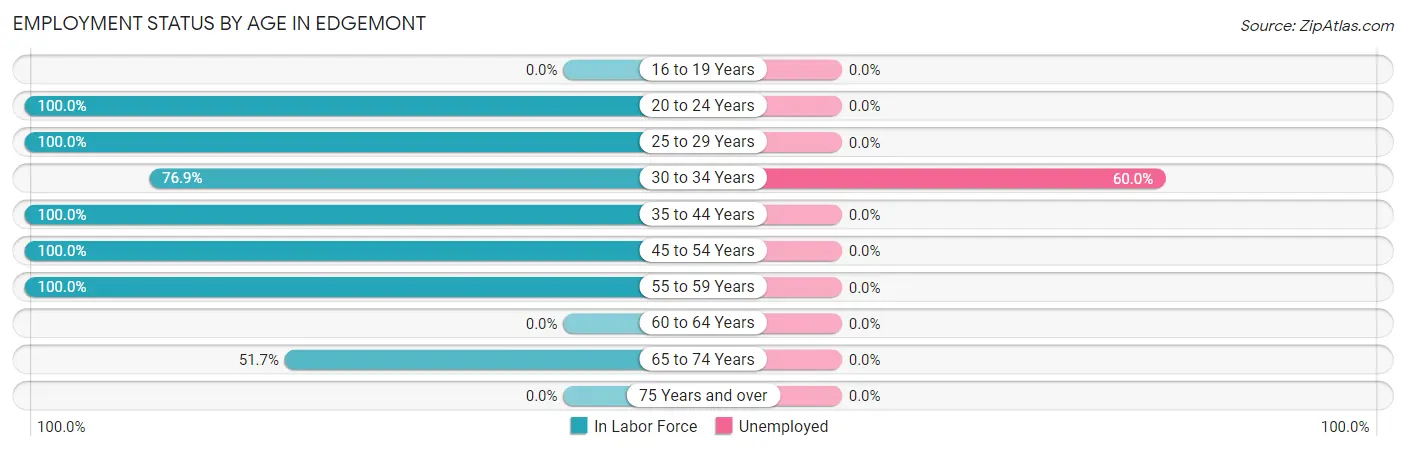
| Age Bracket | In Labor Force | Unemployed |
| 16 to 19 Years | 0 (0.0%) | 0 (0.0%) |
| 20 to 24 Years | 9 (100.0%) | 0 (0.0%) |
| 25 to 29 Years | 9 (100.0%) | 0 (0.0%) |
| 30 to 34 Years | 20 (76.9%) | 12 (60.0%) |
| 35 to 44 Years | 10 (100.0%) | 0 (0.0%) |
| 45 to 54 Years | 11 (100.0%) | 0 (0.0%) |
| 55 to 59 Years | 68 (100.0%) | 0 (0.0%) |
| 60 to 64 Years | 0 (0.0%) | 0 (0.0%) |
| 65 to 74 Years | 31 (51.7%) | 0 (0.0%) |
| 75 Years and over | 0 (0.0%) | 0 (0.0%) |
| Total | 158 (70.2%) | 12 (7.6%) |
Employment Status by Educational Attainment in Edgemont
According to labor force statistics for Edgemont, 95.2% of individuals (118) out of the total population between 25 and 64 years of age (124) are in the labor force, with 10.2% or 12 of them being unemployed. The group with the highest labor force participation rate are those with the educational attainment of high school diploma, with 100.0% or 53 individuals in the labor force. Within the labor force, individuals with high school diploma education have the highest percentage of unemployment, with 22.6% or 12 of them being unemployed.
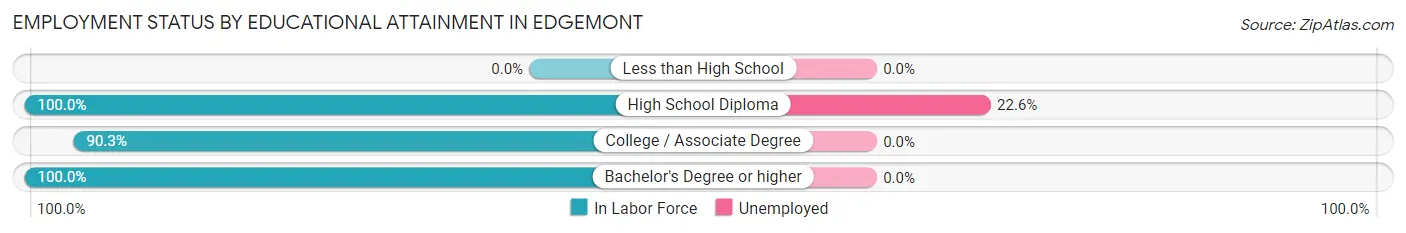
| Educational Attainment | In Labor Force | Unemployed |
| Less than High School | 0 (0.0%) | 0 (0.0%) |
| High School Diploma | 53 (100.0%) | 12 (22.6%) |
| College / Associate Degree | 56 (90.3%) | 0 (0.0%) |
| Bachelor's Degree or higher | 9 (100.0%) | 0 (0.0%) |
| Total | 118 (95.2%) | 13 (10.2%) |
Employment Occupations by Sex in Edgemont
Management, Business, Science and Arts Occupations
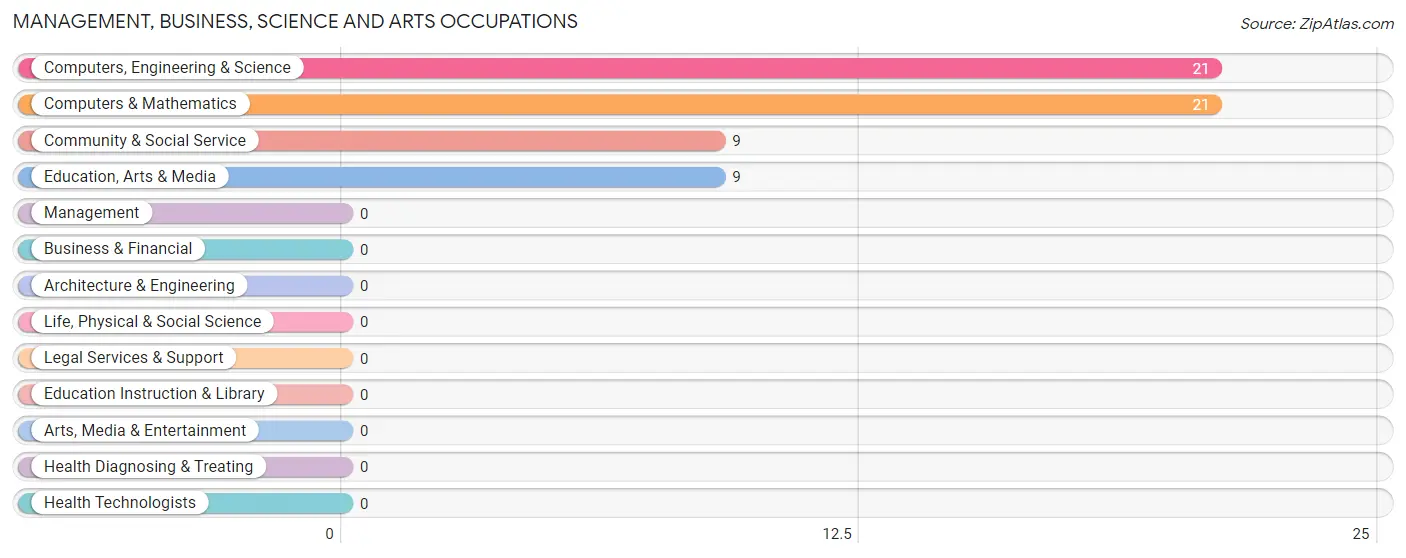
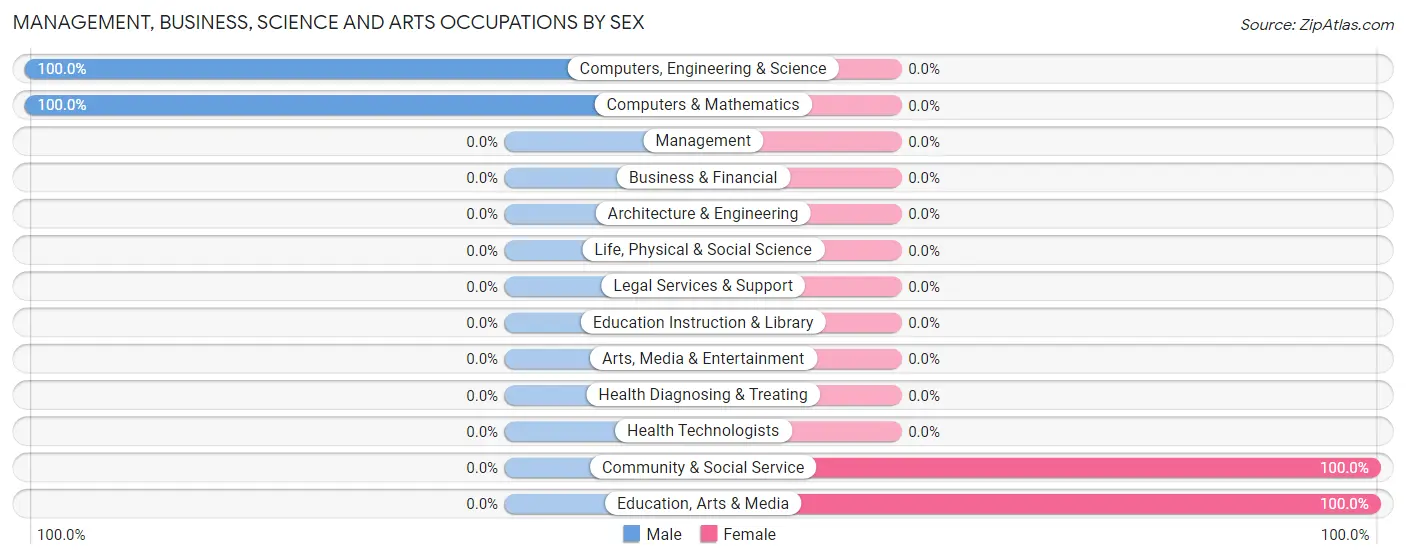
The most common Management, Business, Science and Arts occupations in Edgemont are Computers, Engineering & Science (21 | 14.4%), Computers & Mathematics (21 | 14.4%), Community & Social Service (9 | 6.2%), and Education, Arts & Media (9 | 6.2%).
Management, Business, Science and Arts Occupations by Sex
Within the Management, Business, Science and Arts occupations in Edgemont, the most male-oriented occupations are Computers, Engineering & Science (100.0%), and Computers & Mathematics (100.0%), while the most female-oriented occupations are Community & Social Service (100.0%), and Education, Arts & Media (100.0%).
| Occupation | Male | Female |
| Management | 0 (0.0%) | 0 (0.0%) |
| Business & Financial | 0 (0.0%) | 0 (0.0%) |
| Computers, Engineering & Science | 21 (100.0%) | 0 (0.0%) |
| Computers & Mathematics | 21 (100.0%) | 0 (0.0%) |
| Architecture & Engineering | 0 (0.0%) | 0 (0.0%) |
| Life, Physical & Social Science | 0 (0.0%) | 0 (0.0%) |
| Community & Social Service | 0 (0.0%) | 9 (100.0%) |
| Education, Arts & Media | 0 (0.0%) | 9 (100.0%) |
| Legal Services & Support | 0 (0.0%) | 0 (0.0%) |
| Education Instruction & Library | 0 (0.0%) | 0 (0.0%) |
| Arts, Media & Entertainment | 0 (0.0%) | 0 (0.0%) |
| Health Diagnosing & Treating | 0 (0.0%) | 0 (0.0%) |
| Health Technologists | 0 (0.0%) | 0 (0.0%) |
| Total (Category) | 21 (70.0%) | 9 (30.0%) |
| Total (Overall) | 99 (67.8%) | 47 (32.2%) |
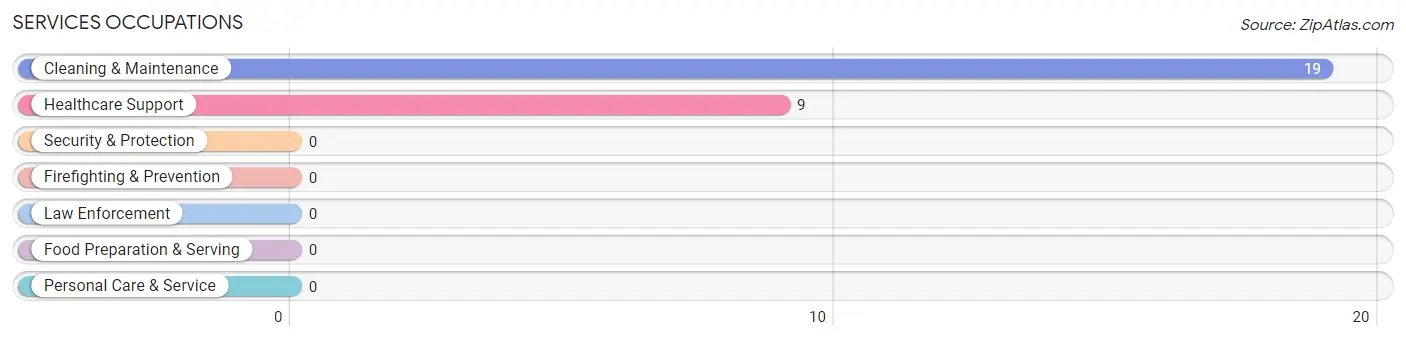
Services Occupations
The most common Services occupations in Edgemont are Cleaning & Maintenance (19 | 13.0%), and Healthcare Support (9 | 6.2%).
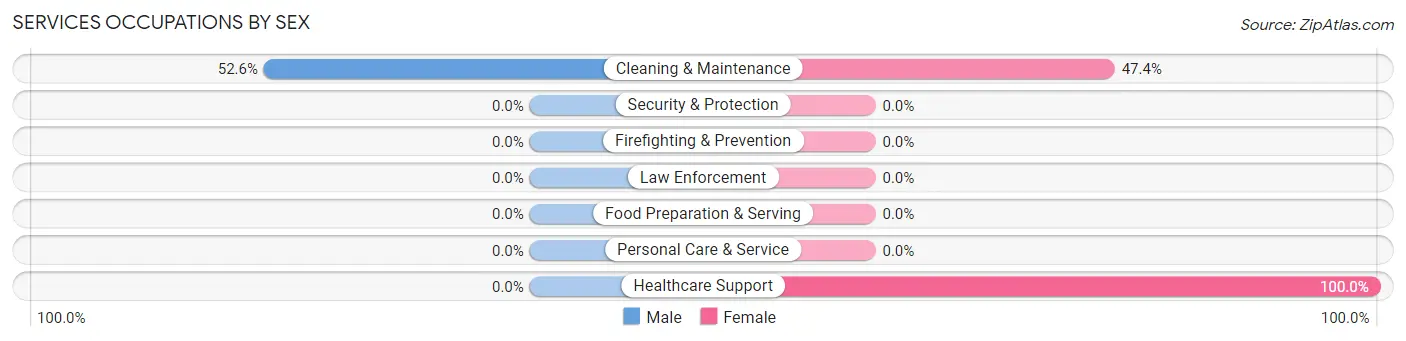
Services Occupations by Sex
| Occupation | Male | Female |
| Healthcare Support | 0 (0.0%) | 9 (100.0%) |
| Security & Protection | 0 (0.0%) | 0 (0.0%) |
| Firefighting & Prevention | 0 (0.0%) | 0 (0.0%) |
| Law Enforcement | 0 (0.0%) | 0 (0.0%) |
| Food Preparation & Serving | 0 (0.0%) | 0 (0.0%) |
| Cleaning & Maintenance | 10 (52.6%) | 9 (47.4%) |
| Personal Care & Service | 0 (0.0%) | 0 (0.0%) |
| Total (Category) | 10 (35.7%) | 18 (64.3%) |
| Total (Overall) | 99 (67.8%) | 47 (32.2%) |
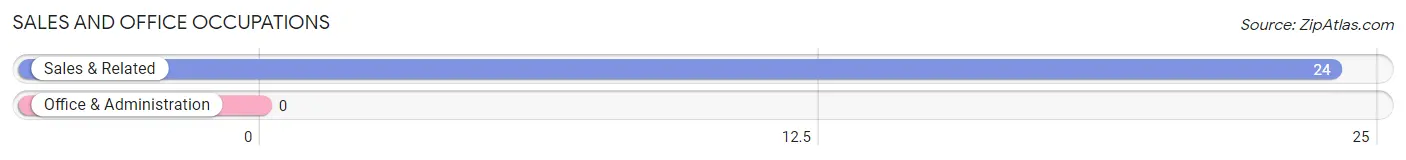
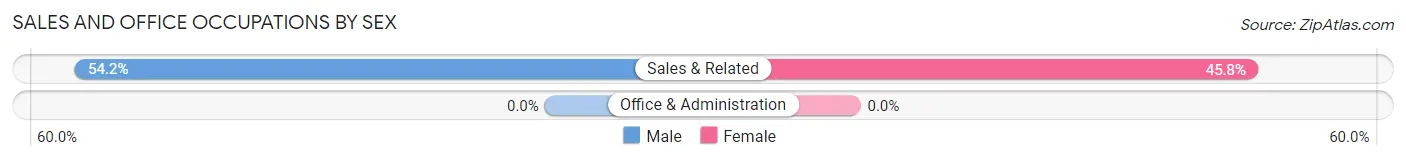
Sales and Office Occupations
The most common Sales and Office occupations in Edgemont are , and Sales & Related (24 | 16.4%).
Sales and Office Occupations by Sex
| Occupation | Male | Female |
| Sales & Related | 13 (54.2%) | 11 (45.8%) |
| Office & Administration | 0 (0.0%) | 0 (0.0%) |
| Total (Category) | 13 (54.2%) | 11 (45.8%) |
| Total (Overall) | 99 (67.8%) | 47 (32.2%) |
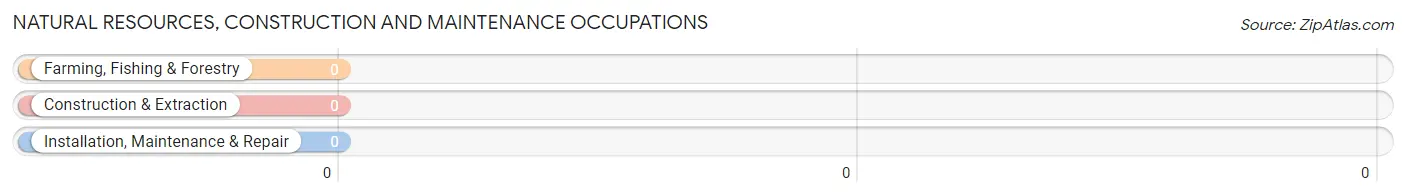
Natural Resources, Construction and Maintenance Occupations
Natural Resources, Construction and Maintenance Occupations by Sex
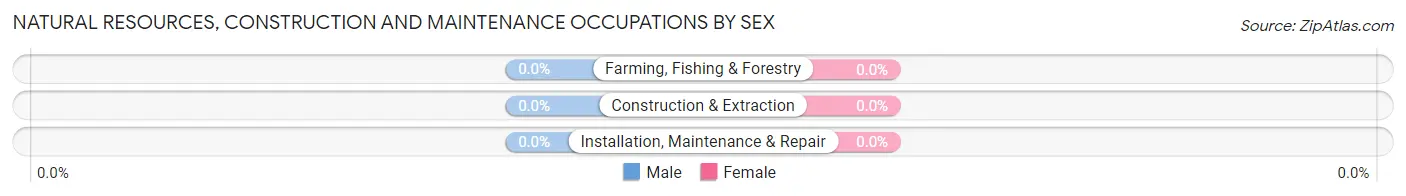
| Occupation | Male | Female |
| Farming, Fishing & Forestry | 0 (0.0%) | 0 (0.0%) |
| Construction & Extraction | 0 (0.0%) | 0 (0.0%) |
| Installation, Maintenance & Repair | 0 (0.0%) | 0 (0.0%) |
| Total (Category) | 0 (0.0%) | 0 (0.0%) |
| Total (Overall) | 99 (67.8%) | 47 (32.2%) |
Production, Transportation and Moving Occupations
The most common Production, Transportation and Moving occupations in Edgemont are Transportation (37 | 25.3%), Production (18 | 12.3%), and Material Moving (9 | 6.2%).
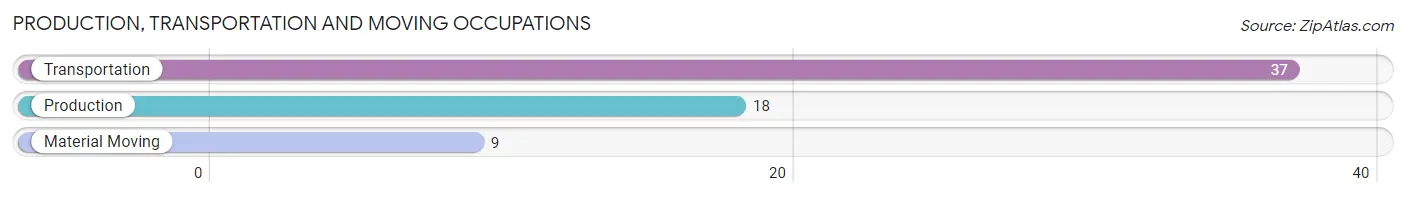
Production, Transportation and Moving Occupations by Sex
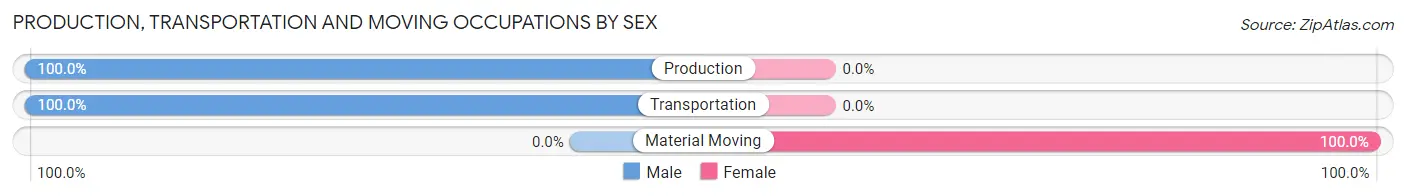
| Occupation | Male | Female |
| Production | 18 (100.0%) | 0 (0.0%) |
| Transportation | 37 (100.0%) | 0 (0.0%) |
| Material Moving | 0 (0.0%) | 9 (100.0%) |
| Total (Category) | 55 (85.9%) | 9 (14.1%) |
| Total (Overall) | 99 (67.8%) | 47 (32.2%) |
Employment Industries by Sex in Edgemont
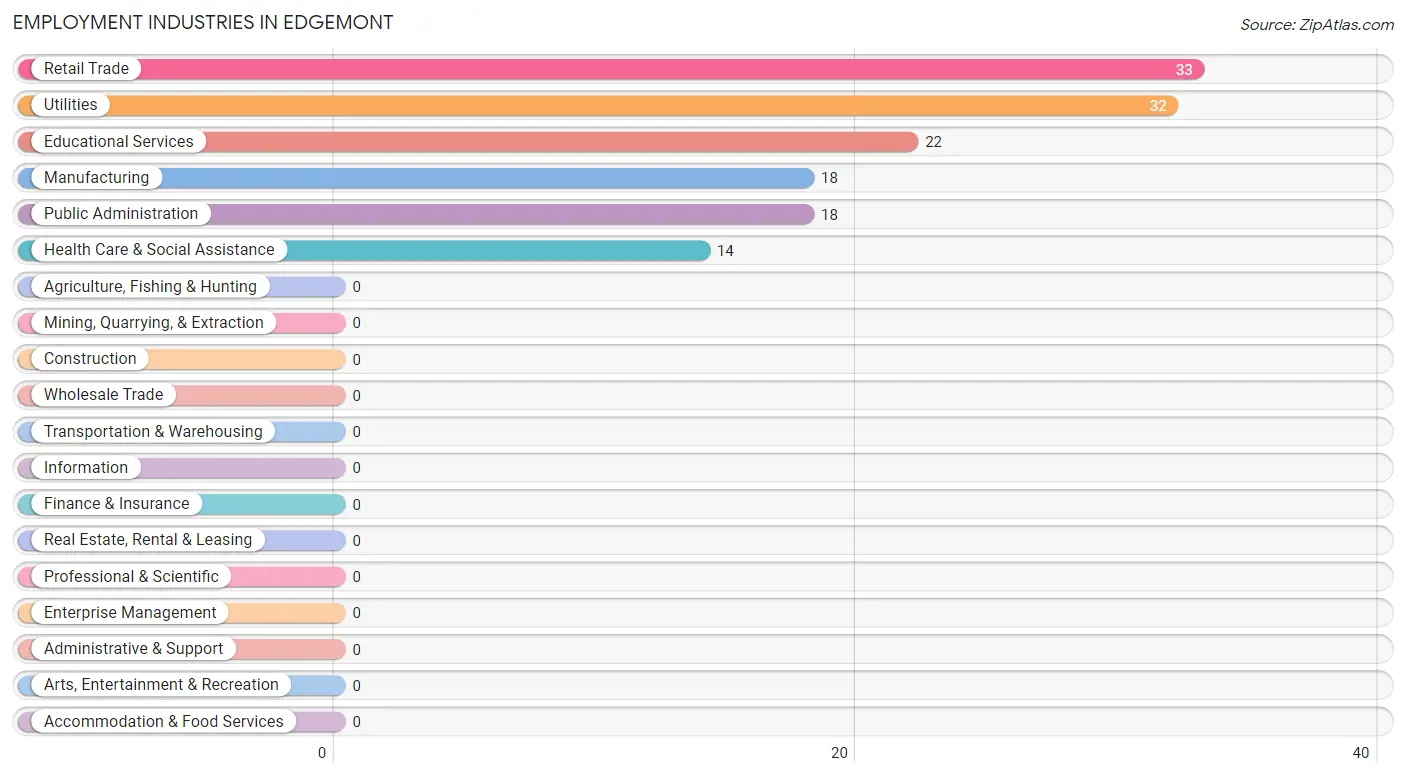
Employment Industries in Edgemont
The major employment industries in Edgemont include Retail Trade (33 | 22.6%), Utilities (32 | 21.9%), Educational Services (22 | 15.1%), Manufacturing (18 | 12.3%), and Public Administration (18 | 12.3%).
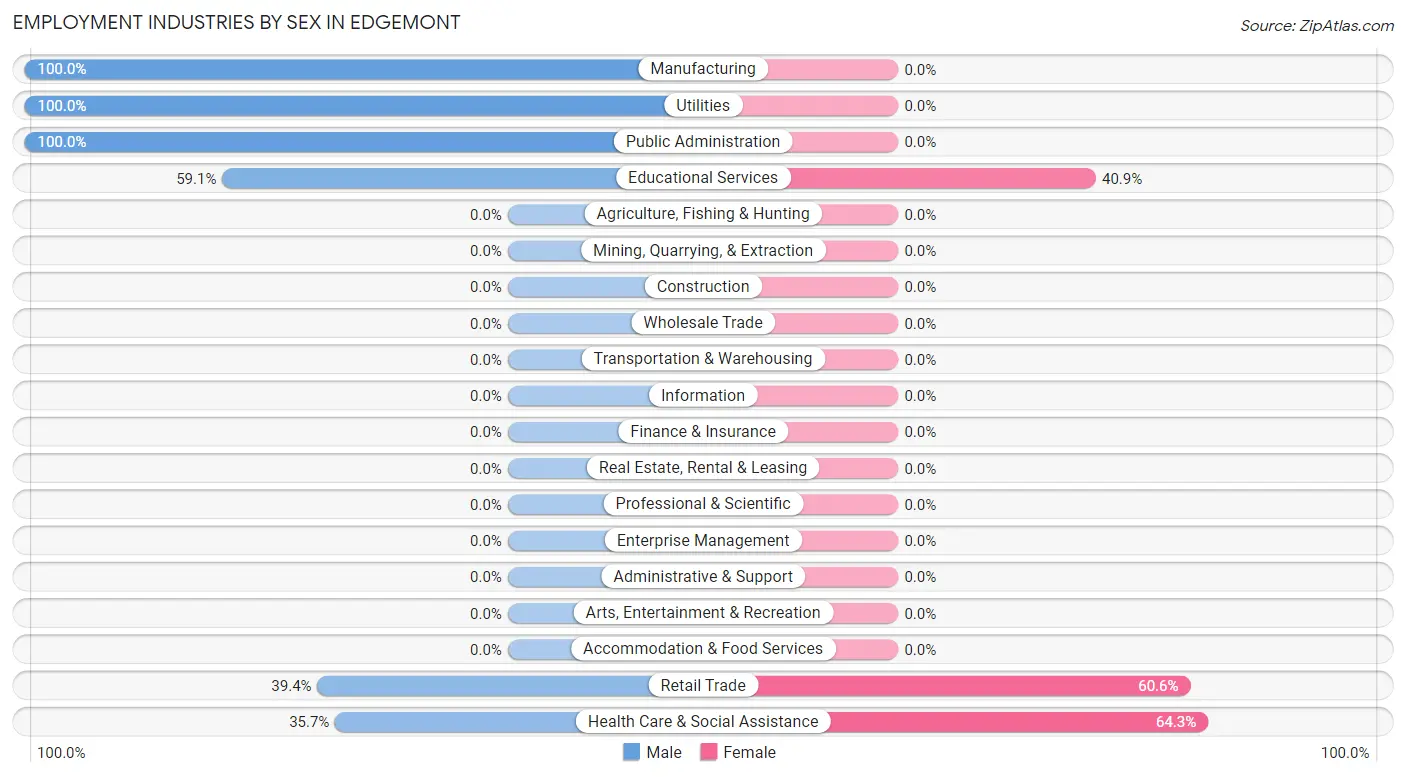
Employment Industries by Sex in Edgemont
The Edgemont industries that see more men than women are Manufacturing (100.0%), Utilities (100.0%), and Public Administration (100.0%), whereas the industries that tend to have a higher number of women are Health Care & Social Assistance (64.3%), Retail Trade (60.6%), and Educational Services (40.9%).
| Industry | Male | Female |
| Agriculture, Fishing & Hunting | 0 (0.0%) | 0 (0.0%) |
| Mining, Quarrying, & Extraction | 0 (0.0%) | 0 (0.0%) |
| Construction | 0 (0.0%) | 0 (0.0%) |
| Manufacturing | 18 (100.0%) | 0 (0.0%) |
| Wholesale Trade | 0 (0.0%) | 0 (0.0%) |
| Retail Trade | 13 (39.4%) | 20 (60.6%) |
| Transportation & Warehousing | 0 (0.0%) | 0 (0.0%) |
| Utilities | 32 (100.0%) | 0 (0.0%) |
| Information | 0 (0.0%) | 0 (0.0%) |
| Finance & Insurance | 0 (0.0%) | 0 (0.0%) |
| Real Estate, Rental & Leasing | 0 (0.0%) | 0 (0.0%) |
| Professional & Scientific | 0 (0.0%) | 0 (0.0%) |
| Enterprise Management | 0 (0.0%) | 0 (0.0%) |
| Administrative & Support | 0 (0.0%) | 0 (0.0%) |
| Educational Services | 13 (59.1%) | 9 (40.9%) |
| Health Care & Social Assistance | 5 (35.7%) | 9 (64.3%) |
| Arts, Entertainment & Recreation | 0 (0.0%) | 0 (0.0%) |
| Accommodation & Food Services | 0 (0.0%) | 0 (0.0%) |
| Public Administration | 18 (100.0%) | 0 (0.0%) |
| Total | 99 (67.8%) | 47 (32.2%) |
Education in Edgemont
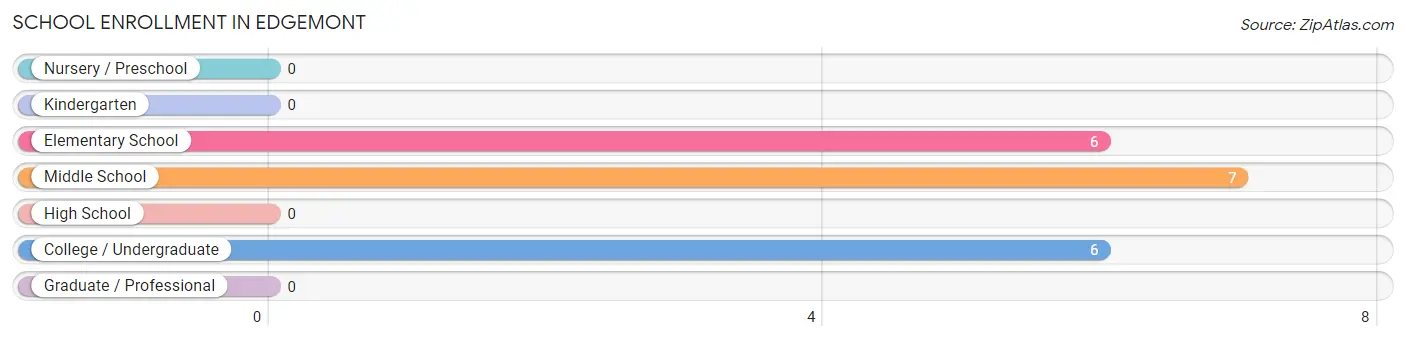
School Enrollment in Edgemont
The most common levels of schooling among the 19 students in Edgemont are middle school (7 | 36.8%), elementary school (6 | 31.6%), and college / undergraduate (6 | 31.6%).
| School Level | # Students | % Students |
| Nursery / Preschool | 0 | 0.0% |
| Kindergarten | 0 | 0.0% |
| Elementary School | 6 | 31.6% |
| Middle School | 7 | 36.8% |
| High School | 0 | 0.0% |
| College / Undergraduate | 6 | 31.6% |
| Graduate / Professional | 0 | 0.0% |
| Total | 19 | 100.0% |
School Enrollment by Age by Funding Source in Edgemont
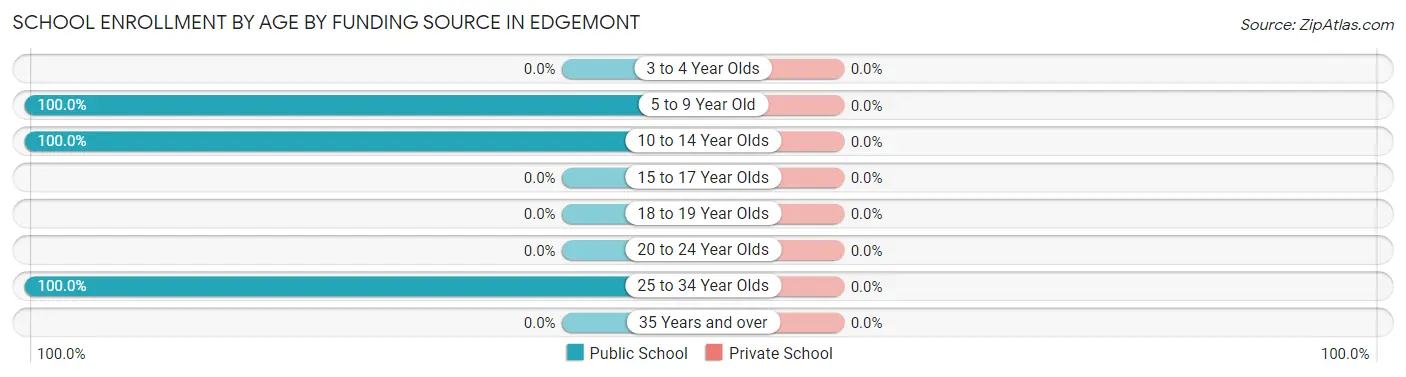
| Age Bracket | Public School | Private School |
| 3 to 4 Year Olds | 0 (0.0%) | 0 (0.0%) |
| 5 to 9 Year Old | 6 (100.0%) | 0 (0.0%) |
| 10 to 14 Year Olds | 7 (100.0%) | 0 (0.0%) |
| 15 to 17 Year Olds | 0 (0.0%) | 0 (0.0%) |
| 18 to 19 Year Olds | 0 (0.0%) | 0 (0.0%) |
| 20 to 24 Year Olds | 0 (0.0%) | 0 (0.0%) |
| 25 to 34 Year Olds | 6 (100.0%) | 0 (0.0%) |
| 35 Years and over | 0 (0.0%) | 0 (0.0%) |
| Total | 19 (100.0%) | 0 (0.0%) |
Educational Attainment by Field of Study in Edgemont
Science & technology (13 | 41.9%), social sciences (9 | 29.0%), and arts & humanities (9 | 29.0%) are the most common fields of study among 31 individuals in Edgemont who have obtained a bachelor's degree or higher.
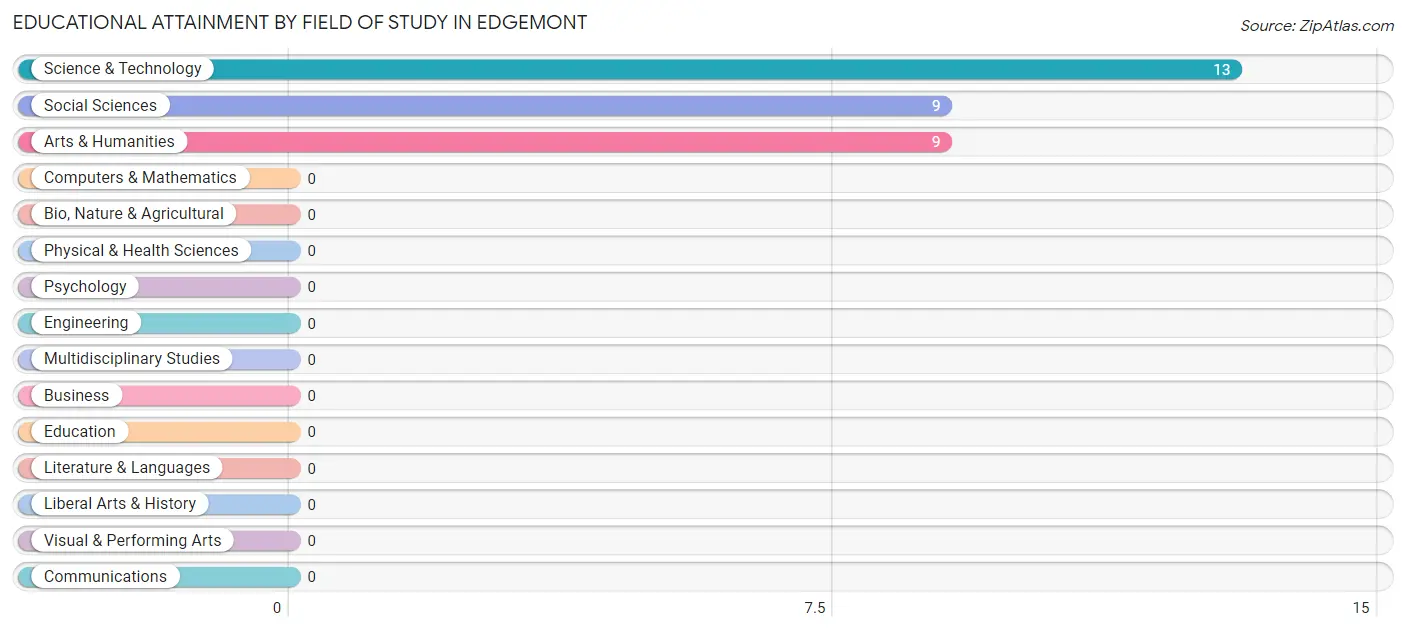
| Field of Study | # Graduates | % Graduates |
| Computers & Mathematics | 0 | 0.0% |
| Bio, Nature & Agricultural | 0 | 0.0% |
| Physical & Health Sciences | 0 | 0.0% |
| Psychology | 0 | 0.0% |
| Social Sciences | 9 | 29.0% |
| Engineering | 0 | 0.0% |
| Multidisciplinary Studies | 0 | 0.0% |
| Science & Technology | 13 | 41.9% |
| Business | 0 | 0.0% |
| Education | 0 | 0.0% |
| Literature & Languages | 0 | 0.0% |
| Liberal Arts & History | 0 | 0.0% |
| Visual & Performing Arts | 0 | 0.0% |
| Communications | 0 | 0.0% |
| Arts & Humanities | 9 | 29.0% |
| Total | 31 | 100.0% |
Transportation & Commute in Edgemont
Vehicle Availability by Sex in Edgemont
The most prevalent vehicle ownership categories in Edgemont are males with 2 vehicles (36, accounting for 36.4%) and females with 2 vehicles (11, making up 76.6%).
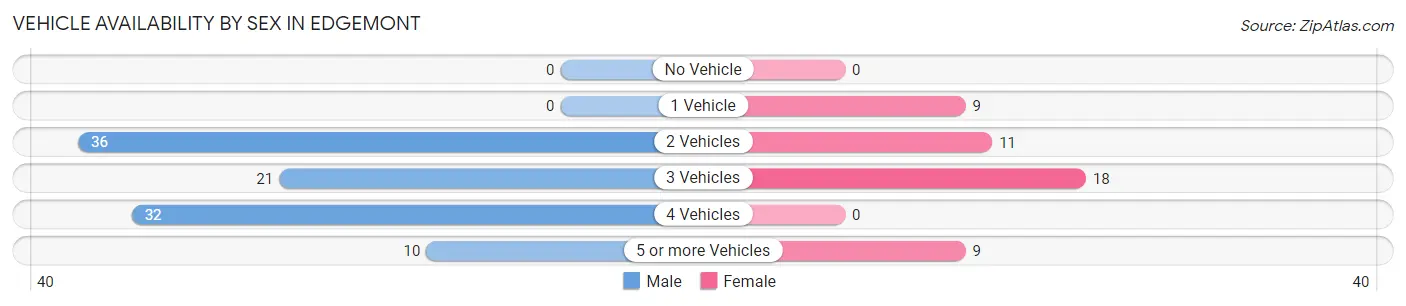
| Vehicles Available | Male | Female |
| No Vehicle | 0 (0.0%) | 0 (0.0%) |
| 1 Vehicle | 0 (0.0%) | 9 (19.2%) |
| 2 Vehicles | 36 (36.4%) | 11 (23.4%) |
| 3 Vehicles | 21 (21.2%) | 18 (38.3%) |
| 4 Vehicles | 32 (32.3%) | 0 (0.0%) |
| 5 or more Vehicles | 10 (10.1%) | 9 (19.2%) |
| Total | 99 (100.0%) | 47 (100.0%) |
Commute Time in Edgemont
The most frequently occuring commute durations in Edgemont are 20 to 24 minutes (37 commuters, 27.0%), 15 to 19 minutes (32 commuters, 23.4%), and 30 to 34 minutes (32 commuters, 23.4%).
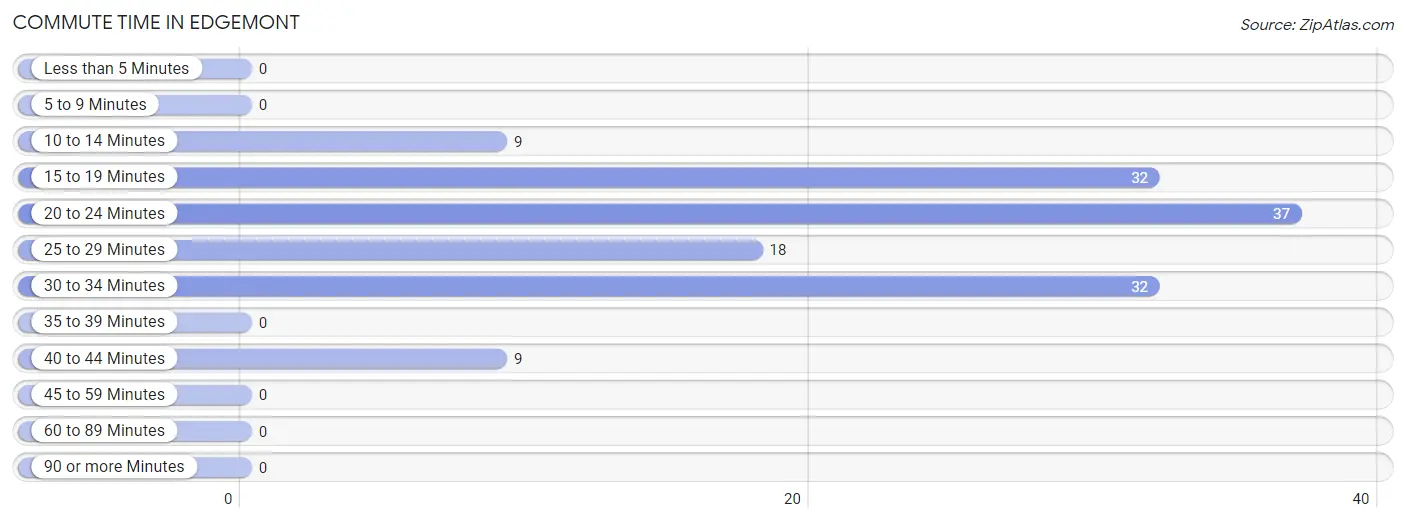
| Commute Time | # Commuters | % Commuters |
| Less than 5 Minutes | 0 | 0.0% |
| 5 to 9 Minutes | 0 | 0.0% |
| 10 to 14 Minutes | 9 | 6.6% |
| 15 to 19 Minutes | 32 | 23.4% |
| 20 to 24 Minutes | 37 | 27.0% |
| 25 to 29 Minutes | 18 | 13.1% |
| 30 to 34 Minutes | 32 | 23.4% |
| 35 to 39 Minutes | 0 | 0.0% |
| 40 to 44 Minutes | 9 | 6.6% |
| 45 to 59 Minutes | 0 | 0.0% |
| 60 to 89 Minutes | 0 | 0.0% |
| 90 or more Minutes | 0 | 0.0% |
Commute Time by Sex in Edgemont
The most common commute times in Edgemont are 20 to 24 minutes (37 commuters, 37.4%) for males and 15 to 19 minutes (11 commuters, 28.9%) for females.
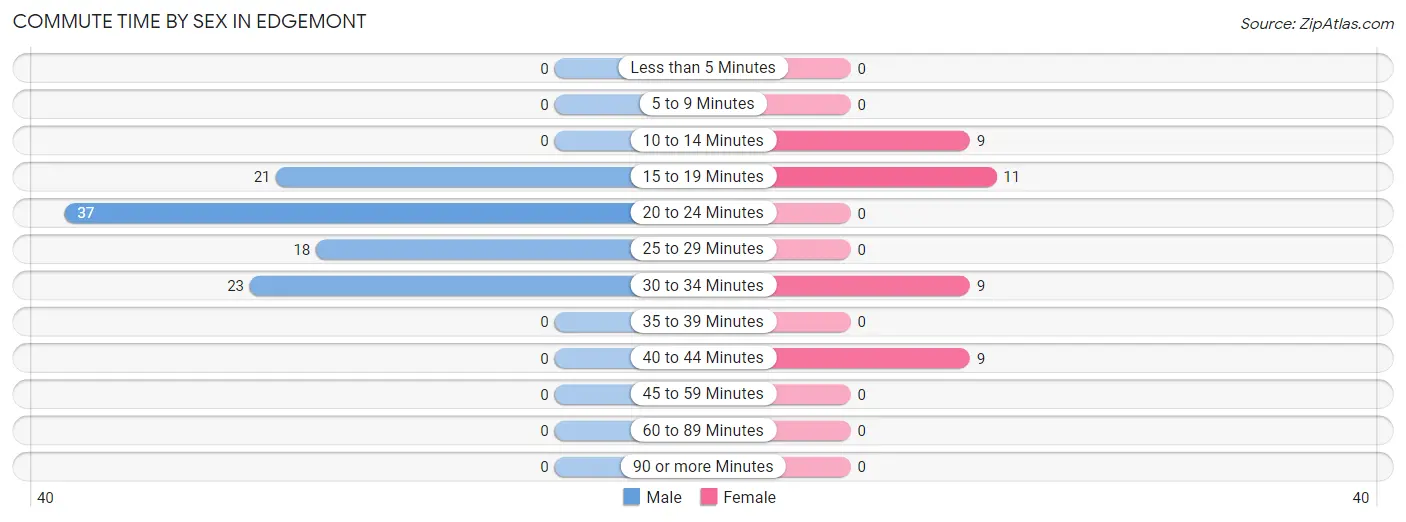
| Commute Time | Male | Female |
| Less than 5 Minutes | 0 (0.0%) | 0 (0.0%) |
| 5 to 9 Minutes | 0 (0.0%) | 0 (0.0%) |
| 10 to 14 Minutes | 0 (0.0%) | 9 (23.7%) |
| 15 to 19 Minutes | 21 (21.2%) | 11 (28.9%) |
| 20 to 24 Minutes | 37 (37.4%) | 0 (0.0%) |
| 25 to 29 Minutes | 18 (18.2%) | 0 (0.0%) |
| 30 to 34 Minutes | 23 (23.2%) | 9 (23.7%) |
| 35 to 39 Minutes | 0 (0.0%) | 0 (0.0%) |
| 40 to 44 Minutes | 0 (0.0%) | 9 (23.7%) |
| 45 to 59 Minutes | 0 (0.0%) | 0 (0.0%) |
| 60 to 89 Minutes | 0 (0.0%) | 0 (0.0%) |
| 90 or more Minutes | 0 (0.0%) | 0 (0.0%) |
Time of Departure to Work by Sex in Edgemont
The most frequent times of departure to work in Edgemont are 6:30 AM to 6:59 AM (32, 32.3%) for males and 8:30 AM to 8:59 AM (11, 28.9%) for females.
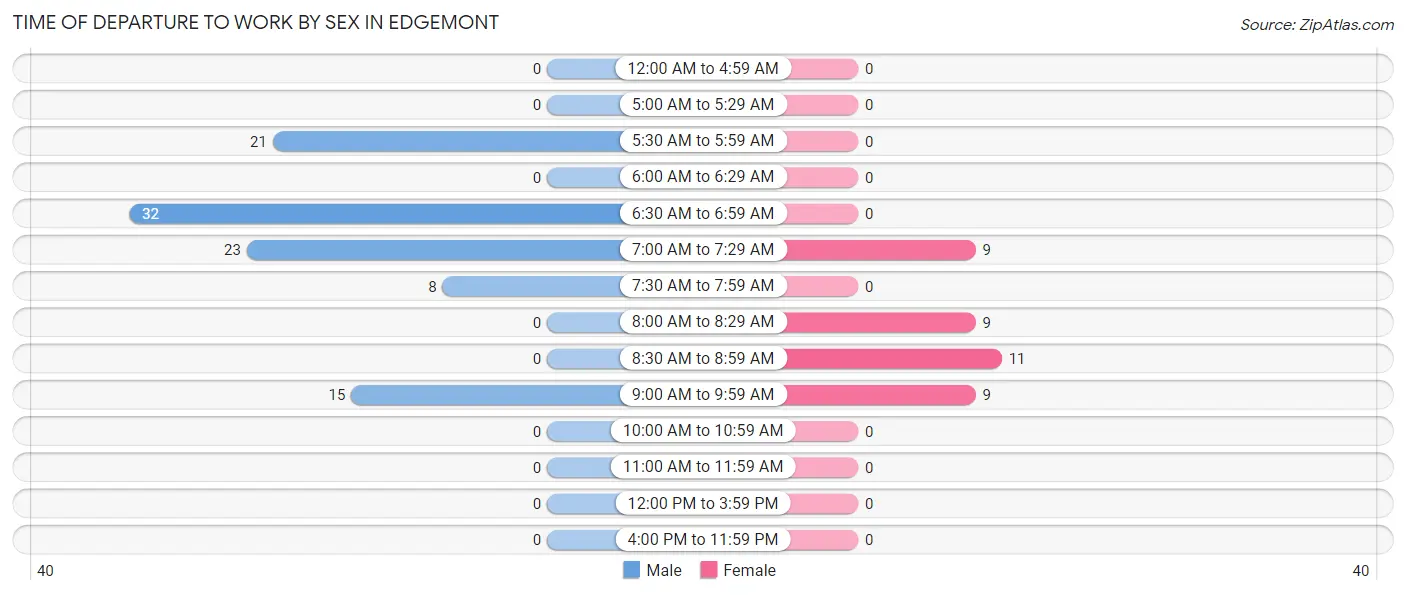
| Time of Departure | Male | Female |
| 12:00 AM to 4:59 AM | 0 (0.0%) | 0 (0.0%) |
| 5:00 AM to 5:29 AM | 0 (0.0%) | 0 (0.0%) |
| 5:30 AM to 5:59 AM | 21 (21.2%) | 0 (0.0%) |
| 6:00 AM to 6:29 AM | 0 (0.0%) | 0 (0.0%) |
| 6:30 AM to 6:59 AM | 32 (32.3%) | 0 (0.0%) |
| 7:00 AM to 7:29 AM | 23 (23.2%) | 9 (23.7%) |
| 7:30 AM to 7:59 AM | 8 (8.1%) | 0 (0.0%) |
| 8:00 AM to 8:29 AM | 0 (0.0%) | 9 (23.7%) |
| 8:30 AM to 8:59 AM | 0 (0.0%) | 11 (28.9%) |
| 9:00 AM to 9:59 AM | 15 (15.1%) | 9 (23.7%) |
| 10:00 AM to 10:59 AM | 0 (0.0%) | 0 (0.0%) |
| 11:00 AM to 11:59 AM | 0 (0.0%) | 0 (0.0%) |
| 12:00 PM to 3:59 PM | 0 (0.0%) | 0 (0.0%) |
| 4:00 PM to 11:59 PM | 0 (0.0%) | 0 (0.0%) |
| Total | 99 (100.0%) | 38 (100.0%) |
Housing Occupancy in Edgemont
Occupancy by Ownership in Edgemont
Of the total 117 dwellings in Edgemont, owner-occupied units account for 108 (92.3%), while renter-occupied units make up 9 (7.7%).
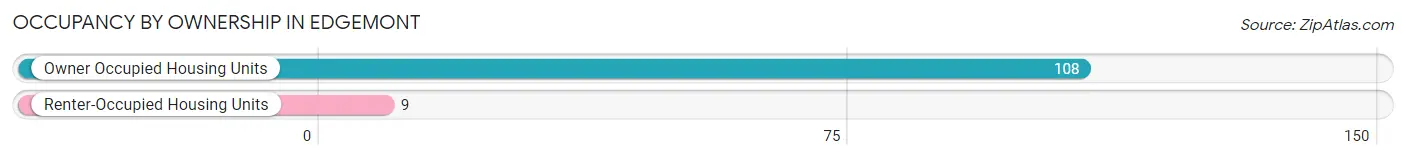
| Occupancy | # Housing Units | % Housing Units |
| Owner Occupied Housing Units | 108 | 92.3% |
| Renter-Occupied Housing Units | 9 | 7.7% |
| Total Occupied Housing Units | 117 | 100.0% |
Occupancy by Household Size in Edgemont
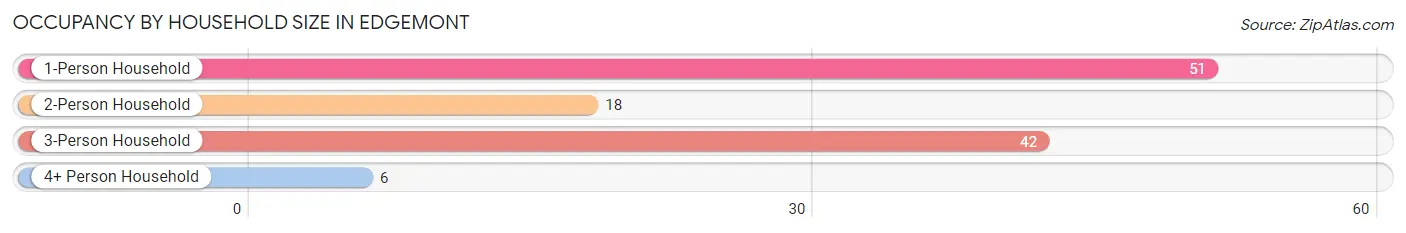
| Household Size | # Housing Units | % Housing Units |
| 1-Person Household | 51 | 43.6% |
| 2-Person Household | 18 | 15.4% |
| 3-Person Household | 42 | 35.9% |
| 4+ Person Household | 6 | 5.1% |
| Total Housing Units | 117 | 100.0% |
Occupancy by Ownership by Household Size in Edgemont
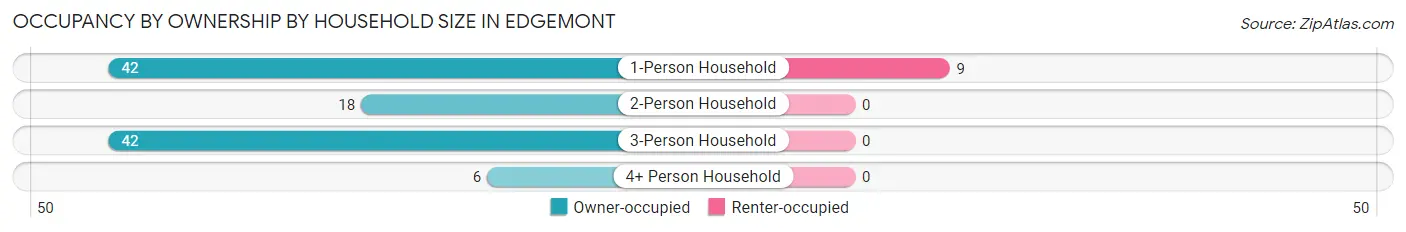
| Household Size | Owner-occupied | Renter-occupied |
| 1-Person Household | 42 (82.4%) | 9 (17.6%) |
| 2-Person Household | 18 (100.0%) | 0 (0.0%) |
| 3-Person Household | 42 (100.0%) | 0 (0.0%) |
| 4+ Person Household | 6 (100.0%) | 0 (0.0%) |
| Total Housing Units | 108 (92.3%) | 9 (7.7%) |
Occupancy by Educational Attainment in Edgemont
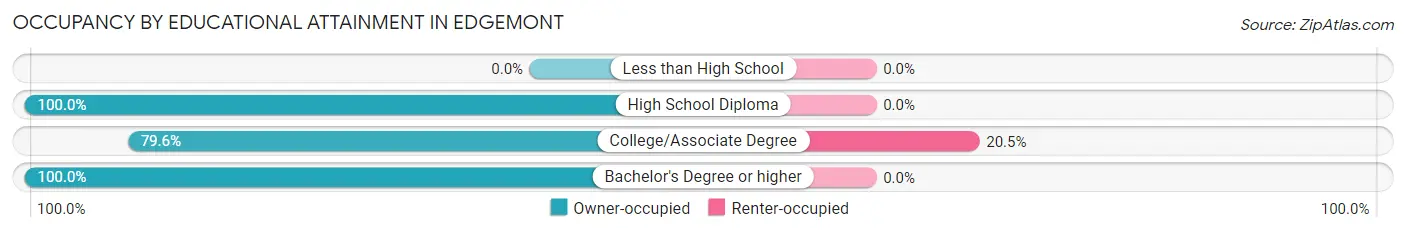
| Household Size | Owner-occupied | Renter-occupied |
| Less than High School | 0 (0.0%) | 0 (0.0%) |
| High School Diploma | 60 (100.0%) | 0 (0.0%) |
| College/Associate Degree | 35 (79.5%) | 9 (20.4%) |
| Bachelor's Degree or higher | 13 (100.0%) | 0 (0.0%) |
Occupancy by Age of Householder in Edgemont
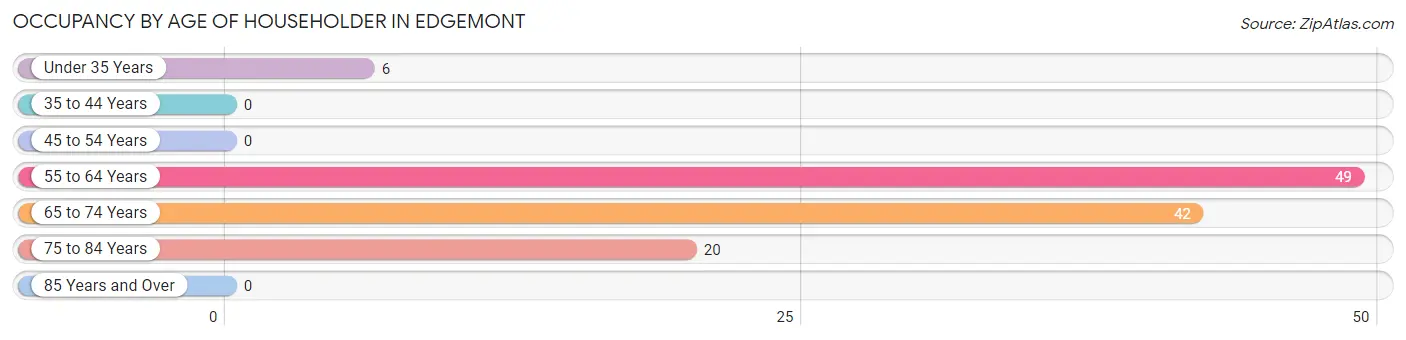
| Age Bracket | # Households | % Households |
| Under 35 Years | 6 | 5.1% |
| 35 to 44 Years | 0 | 0.0% |
| 45 to 54 Years | 0 | 0.0% |
| 55 to 64 Years | 49 | 41.9% |
| 65 to 74 Years | 42 | 35.9% |
| 75 to 84 Years | 20 | 17.1% |
| 85 Years and Over | 0 | 0.0% |
| Total | 117 | 100.0% |
Housing Finances in Edgemont
Median Income by Occupancy in Edgemont
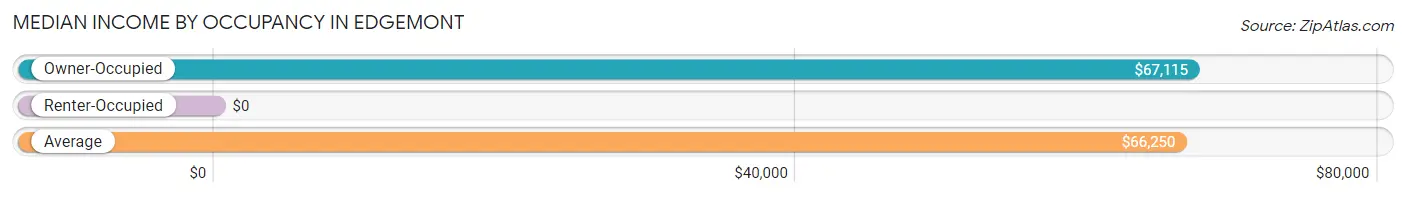
| Occupancy Type | # Households | Median Income |
| Owner-Occupied | 108 (92.3%) | $67,115 |
| Renter-Occupied | 9 (7.7%) | $0 |
| Average | 117 (100.0%) | $66,250 |
Occupancy by Householder Income Bracket in Edgemont
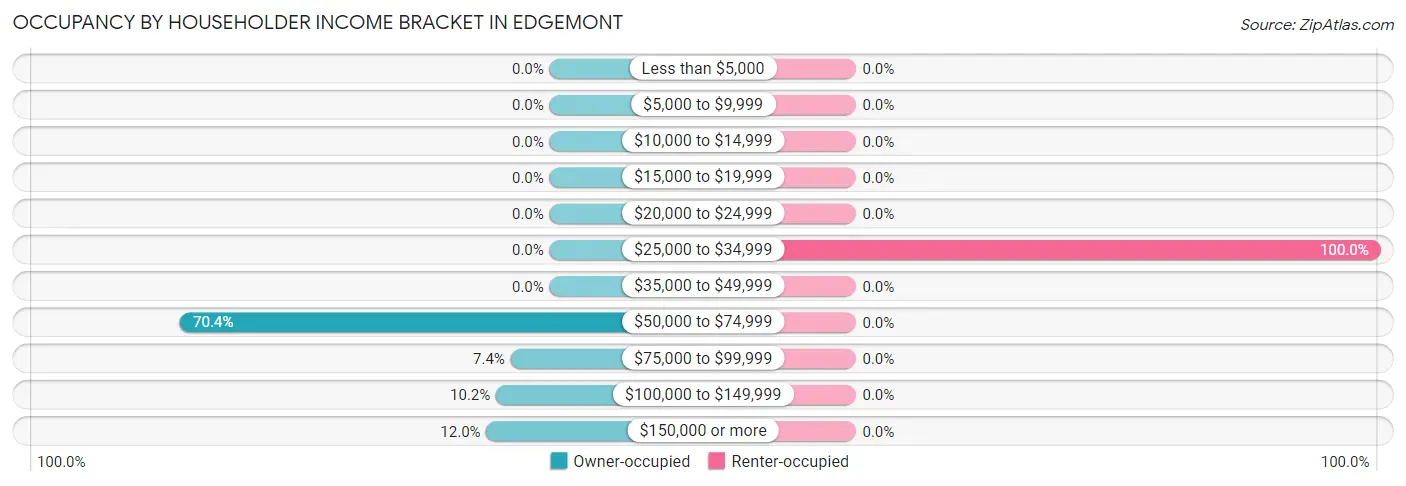
| Income Bracket | Owner-occupied | Renter-occupied |
| Less than $5,000 | 0 (0.0%) | 0 (0.0%) |
| $5,000 to $9,999 | 0 (0.0%) | 0 (0.0%) |
| $10,000 to $14,999 | 0 (0.0%) | 0 (0.0%) |
| $15,000 to $19,999 | 0 (0.0%) | 0 (0.0%) |
| $20,000 to $24,999 | 0 (0.0%) | 0 (0.0%) |
| $25,000 to $34,999 | 0 (0.0%) | 9 (100.0%) |
| $35,000 to $49,999 | 0 (0.0%) | 0 (0.0%) |
| $50,000 to $74,999 | 76 (70.4%) | 0 (0.0%) |
| $75,000 to $99,999 | 8 (7.4%) | 0 (0.0%) |
| $100,000 to $149,999 | 11 (10.2%) | 0 (0.0%) |
| $150,000 or more | 13 (12.0%) | 0 (0.0%) |
| Total | 108 (100.0%) | 9 (100.0%) |
Monthly Housing Cost Tiers in Edgemont
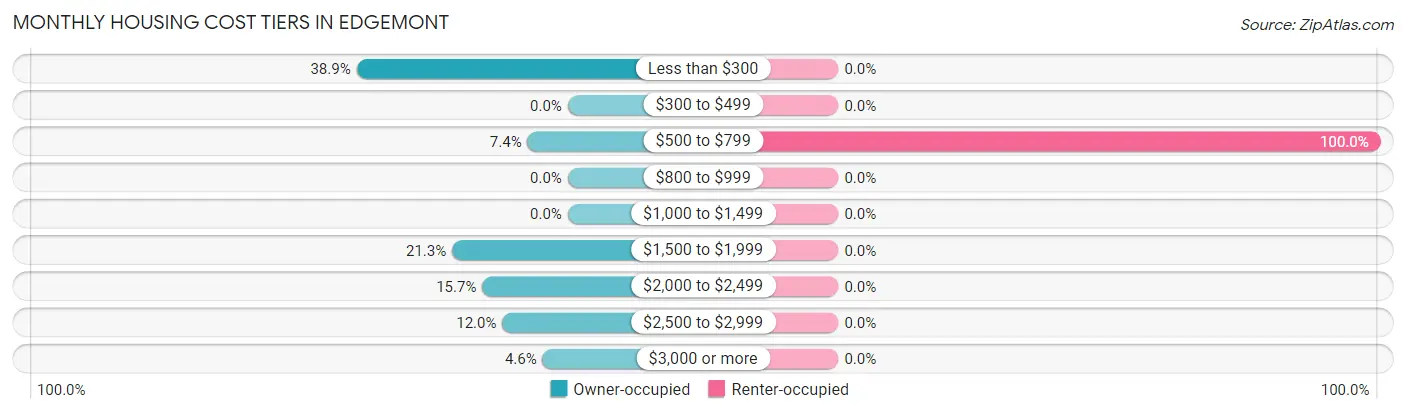
| Monthly Cost | Owner-occupied | Renter-occupied |
| Less than $300 | 42 (38.9%) | 0 (0.0%) |
| $300 to $499 | 0 (0.0%) | 0 (0.0%) |
| $500 to $799 | 8 (7.4%) | 9 (100.0%) |
| $800 to $999 | 0 (0.0%) | 0 (0.0%) |
| $1,000 to $1,499 | 0 (0.0%) | 0 (0.0%) |
| $1,500 to $1,999 | 23 (21.3%) | 0 (0.0%) |
| $2,000 to $2,499 | 17 (15.7%) | 0 (0.0%) |
| $2,500 to $2,999 | 13 (12.0%) | 0 (0.0%) |
| $3,000 or more | 5 (4.6%) | 0 (0.0%) |
| Total | 108 (100.0%) | 9 (100.0%) |
Physical Housing Characteristics in Edgemont
Housing Structures in Edgemont
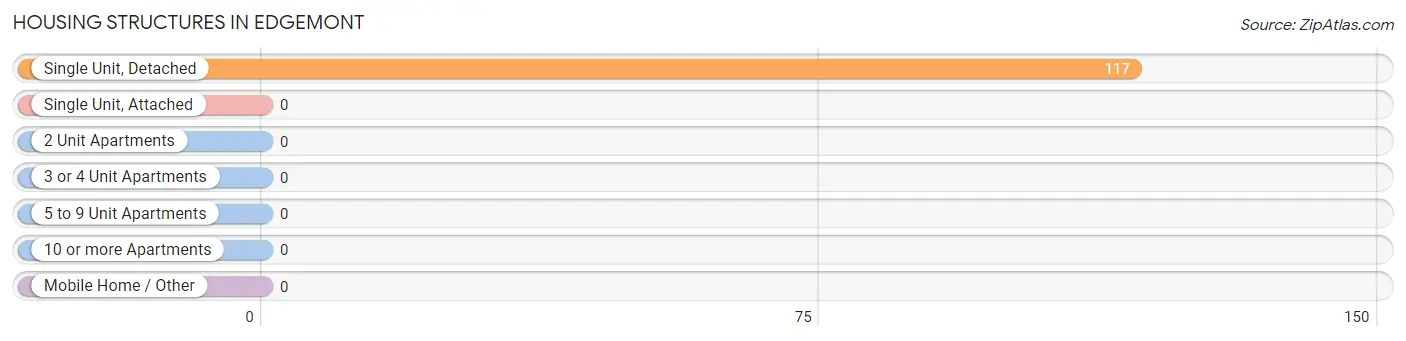
| Structure Type | # Housing Units | % Housing Units |
| Single Unit, Detached | 117 | 100.0% |
| Single Unit, Attached | 0 | 0.0% |
| 2 Unit Apartments | 0 | 0.0% |
| 3 or 4 Unit Apartments | 0 | 0.0% |
| 5 to 9 Unit Apartments | 0 | 0.0% |
| 10 or more Apartments | 0 | 0.0% |
| Mobile Home / Other | 0 | 0.0% |
| Total | 117 | 100.0% |
Housing Structures by Occupancy in Edgemont
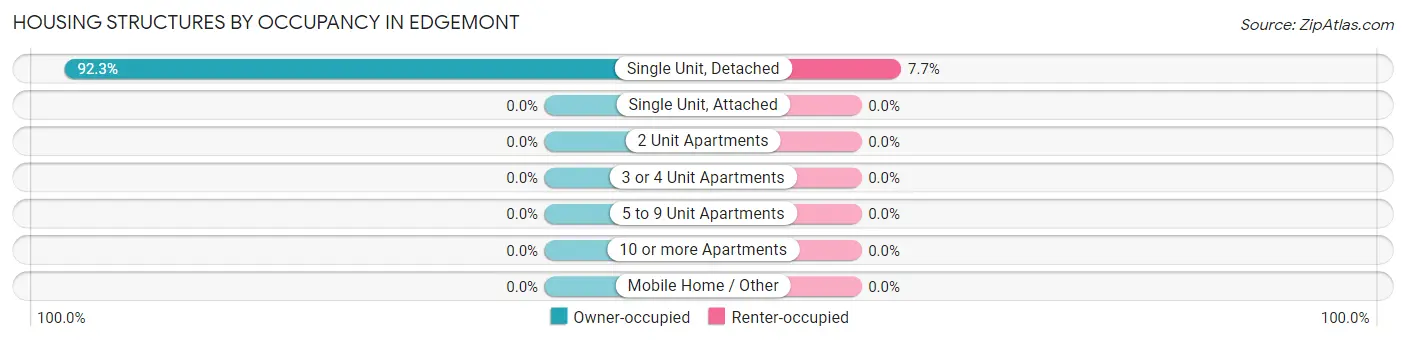
| Structure Type | Owner-occupied | Renter-occupied |
| Single Unit, Detached | 108 (92.3%) | 9 (7.7%) |
| Single Unit, Attached | 0 (0.0%) | 0 (0.0%) |
| 2 Unit Apartments | 0 (0.0%) | 0 (0.0%) |
| 3 or 4 Unit Apartments | 0 (0.0%) | 0 (0.0%) |
| 5 to 9 Unit Apartments | 0 (0.0%) | 0 (0.0%) |
| 10 or more Apartments | 0 (0.0%) | 0 (0.0%) |
| Mobile Home / Other | 0 (0.0%) | 0 (0.0%) |
| Total | 108 (92.3%) | 9 (7.7%) |
Housing Structures by Number of Rooms in Edgemont
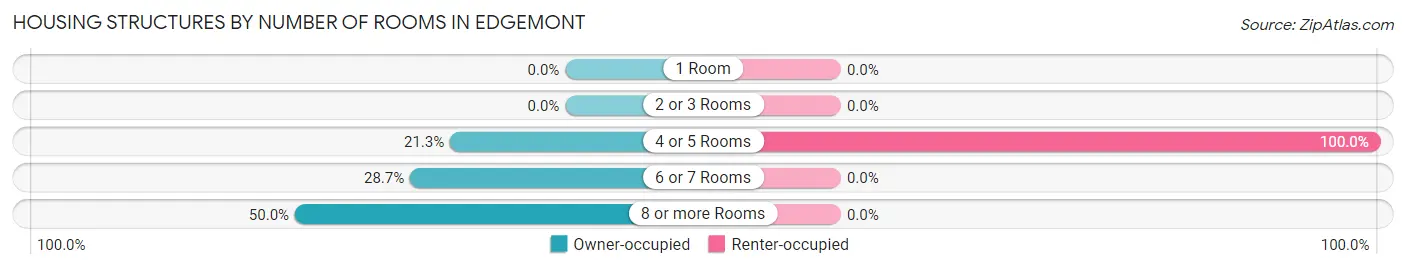
| Number of Rooms | Owner-occupied | Renter-occupied |
| 1 Room | 0 (0.0%) | 0 (0.0%) |
| 2 or 3 Rooms | 0 (0.0%) | 0 (0.0%) |
| 4 or 5 Rooms | 23 (21.3%) | 9 (100.0%) |
| 6 or 7 Rooms | 31 (28.7%) | 0 (0.0%) |
| 8 or more Rooms | 54 (50.0%) | 0 (0.0%) |
| Total | 108 (100.0%) | 9 (100.0%) |
Housing Structure by Heating Type in Edgemont
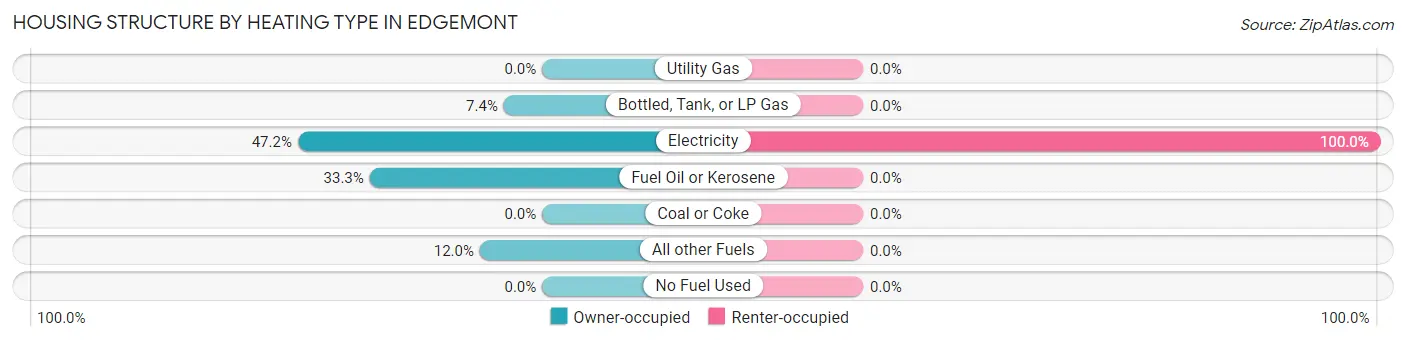
| Heating Type | Owner-occupied | Renter-occupied |
| Utility Gas | 0 (0.0%) | 0 (0.0%) |
| Bottled, Tank, or LP Gas | 8 (7.4%) | 0 (0.0%) |
| Electricity | 51 (47.2%) | 9 (100.0%) |
| Fuel Oil or Kerosene | 36 (33.3%) | 0 (0.0%) |
| Coal or Coke | 0 (0.0%) | 0 (0.0%) |
| All other Fuels | 13 (12.0%) | 0 (0.0%) |
| No Fuel Used | 0 (0.0%) | 0 (0.0%) |
| Total | 108 (100.0%) | 9 (100.0%) |
Household Vehicle Usage in Edgemont
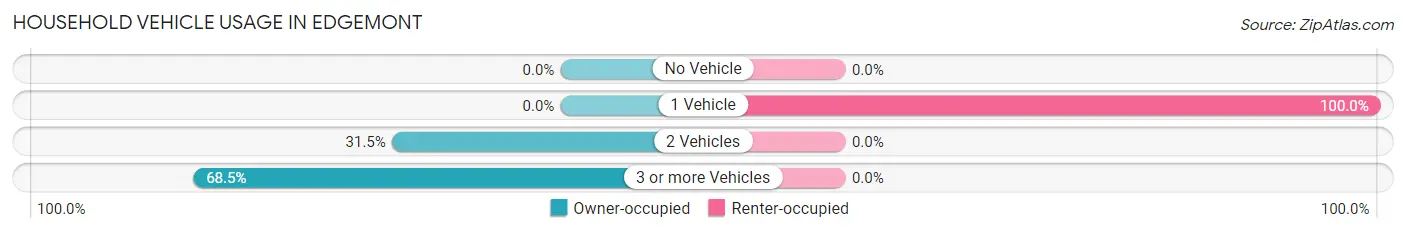
| Vehicles per Household | Owner-occupied | Renter-occupied |
| No Vehicle | 0 (0.0%) | 0 (0.0%) |
| 1 Vehicle | 0 (0.0%) | 9 (100.0%) |
| 2 Vehicles | 34 (31.5%) | 0 (0.0%) |
| 3 or more Vehicles | 74 (68.5%) | 0 (0.0%) |
| Total | 108 (100.0%) | 9 (100.0%) |
Real Estate & Mortgages in Edgemont
Real Estate and Mortgage Overview in Edgemont
| Characteristic | Without Mortgage | With Mortgage |
| Housing Units | 50 | 58 |
| Median Property Value | $268,800 | $400,000 |
| Median Household Income | $59,453 | $13 |
| Monthly Housing Costs | $273 | $5 |
| Real Estate Taxes | $1,734 | $0 |
Property Value by Mortgage Status in Edgemont
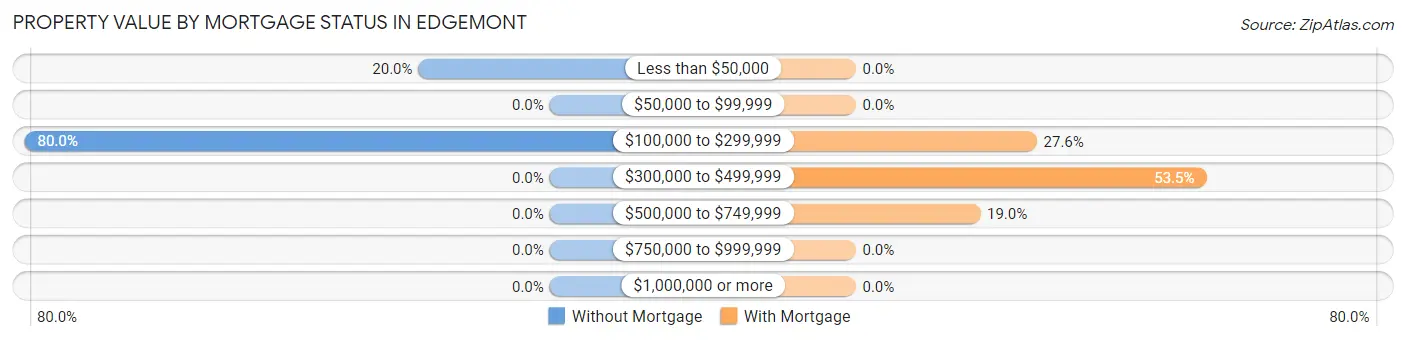
| Property Value | Without Mortgage | With Mortgage |
| Less than $50,000 | 10 (20.0%) | 0 (0.0%) |
| $50,000 to $99,999 | 0 (0.0%) | 0 (0.0%) |
| $100,000 to $299,999 | 40 (80.0%) | 16 (27.6%) |
| $300,000 to $499,999 | 0 (0.0%) | 31 (53.4%) |
| $500,000 to $749,999 | 0 (0.0%) | 11 (19.0%) |
| $750,000 to $999,999 | 0 (0.0%) | 0 (0.0%) |
| $1,000,000 or more | 0 (0.0%) | 0 (0.0%) |
| Total | 50 (100.0%) | 58 (100.0%) |
Household Income by Mortgage Status in Edgemont
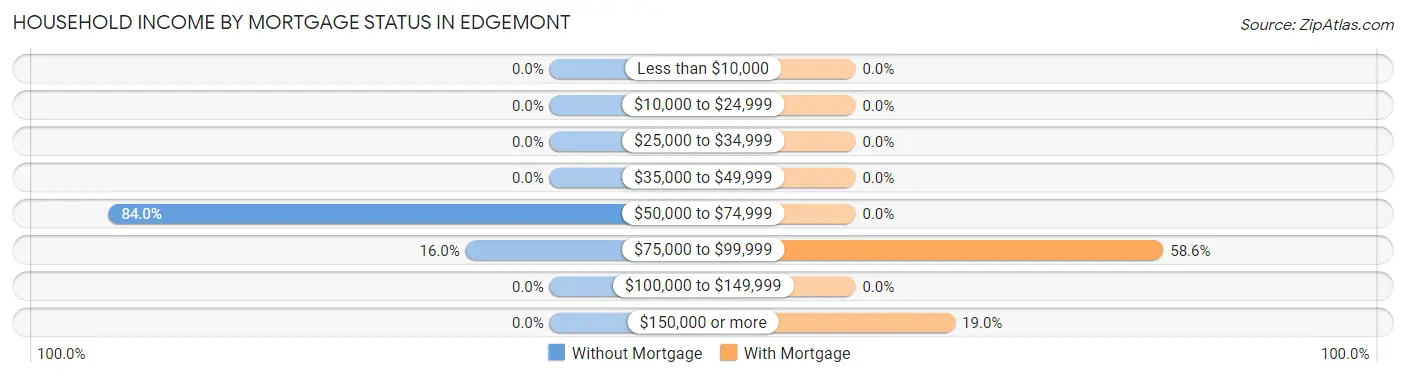
| Household Income | Without Mortgage | With Mortgage |
| Less than $10,000 | 0 (0.0%) | 0 (0.0%) |
| $10,000 to $24,999 | 0 (0.0%) | 0 (0.0%) |
| $25,000 to $34,999 | 0 (0.0%) | 0 (0.0%) |
| $35,000 to $49,999 | 0 (0.0%) | 0 (0.0%) |
| $50,000 to $74,999 | 42 (84.0%) | 0 (0.0%) |
| $75,000 to $99,999 | 8 (16.0%) | 34 (58.6%) |
| $100,000 to $149,999 | 0 (0.0%) | 0 (0.0%) |
| $150,000 or more | 0 (0.0%) | 11 (19.0%) |
| Total | 50 (100.0%) | 58 (100.0%) |
Property Value to Household Income Ratio in Edgemont
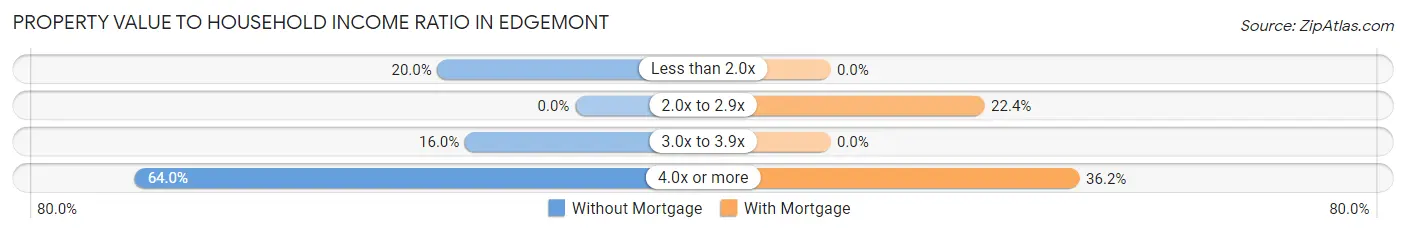
| Value-to-Income Ratio | Without Mortgage | With Mortgage |
| Less than 2.0x | 10 (20.0%) | 0 (0.0%) |
| 2.0x to 2.9x | 0 (0.0%) | 13 (22.4%) |
| 3.0x to 3.9x | 8 (16.0%) | 0 (0.0%) |
| 4.0x or more | 32 (64.0%) | 21 (36.2%) |
| Total | 50 (100.0%) | 58 (100.0%) |
Real Estate Taxes by Mortgage Status in Edgemont
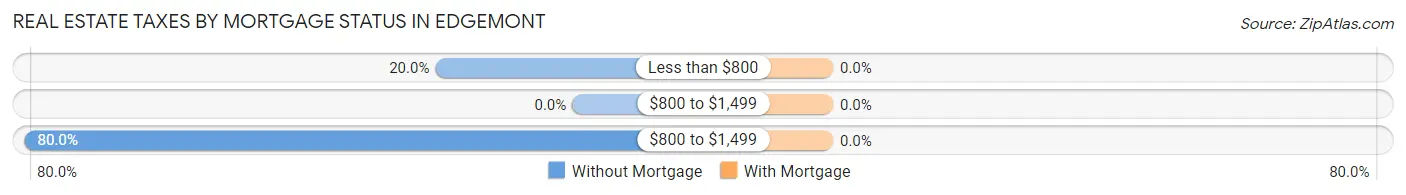
| Property Taxes | Without Mortgage | With Mortgage |
| Less than $800 | 10 (20.0%) | 0 (0.0%) |
| $800 to $1,499 | 0 (0.0%) | 0 (0.0%) |
| $800 to $1,499 | 40 (80.0%) | 0 (0.0%) |
| Total | 50 (100.0%) | 58 (100.0%) |
Health & Disability in Edgemont
Health Insurance Coverage by Age in Edgemont
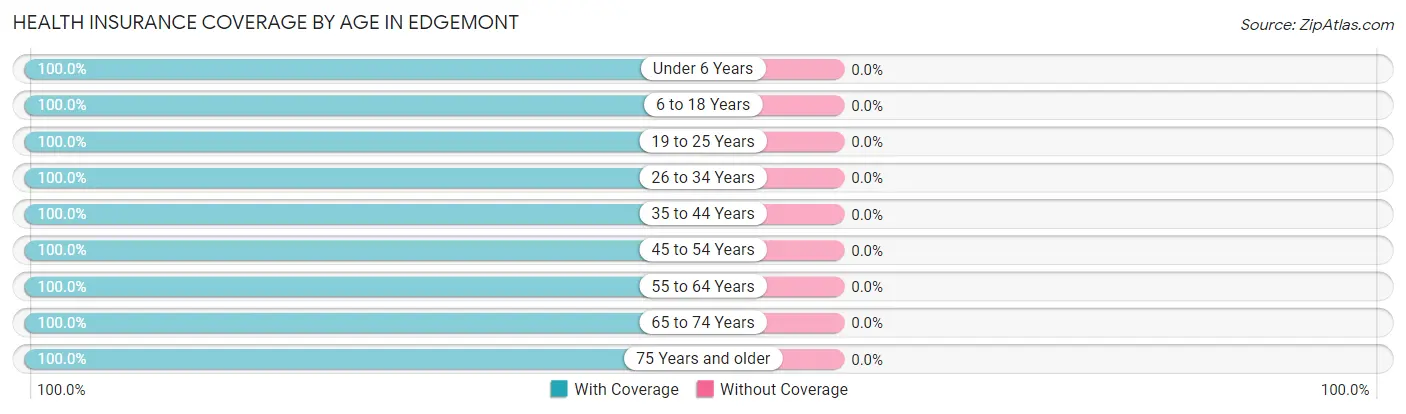
| Age Bracket | With Coverage | Without Coverage |
| Under 6 Years | 6 (100.0%) | 0 (0.0%) |
| 6 to 18 Years | 13 (100.0%) | 0 (0.0%) |
| 19 to 25 Years | 18 (100.0%) | 0 (0.0%) |
| 26 to 34 Years | 26 (100.0%) | 0 (0.0%) |
| 35 to 44 Years | 10 (100.0%) | 0 (0.0%) |
| 45 to 54 Years | 11 (100.0%) | 0 (0.0%) |
| 55 to 64 Years | 68 (100.0%) | 0 (0.0%) |
| 65 to 74 Years | 60 (100.0%) | 0 (0.0%) |
| 75 Years and older | 32 (100.0%) | 0 (0.0%) |
| Total | 244 (100.0%) | 0 (0.0%) |
Health Insurance Coverage by Citizenship Status in Edgemont
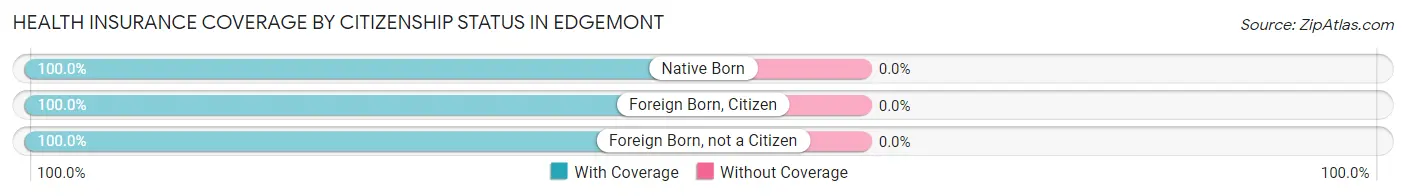
| Citizenship Status | With Coverage | Without Coverage |
| Native Born | 6 (100.0%) | 0 (0.0%) |
| Foreign Born, Citizen | 13 (100.0%) | 0 (0.0%) |
| Foreign Born, not a Citizen | 18 (100.0%) | 0 (0.0%) |
Health Insurance Coverage by Household Income in Edgemont
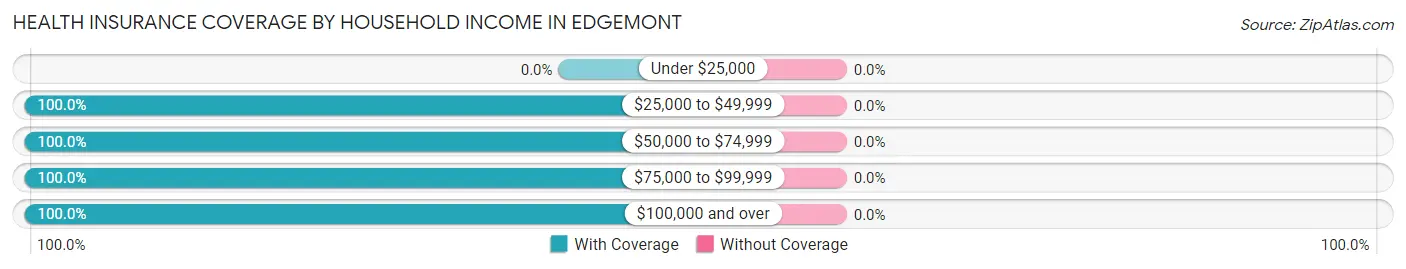
| Household Income | With Coverage | Without Coverage |
| Under $25,000 | 0 (0.0%) | 0 (0.0%) |
| $25,000 to $49,999 | 9 (100.0%) | 0 (0.0%) |
| $50,000 to $74,999 | 141 (100.0%) | 0 (0.0%) |
| $75,000 to $99,999 | 26 (100.0%) | 0 (0.0%) |
| $100,000 and over | 68 (100.0%) | 0 (0.0%) |
Public vs Private Health Insurance Coverage by Age in Edgemont
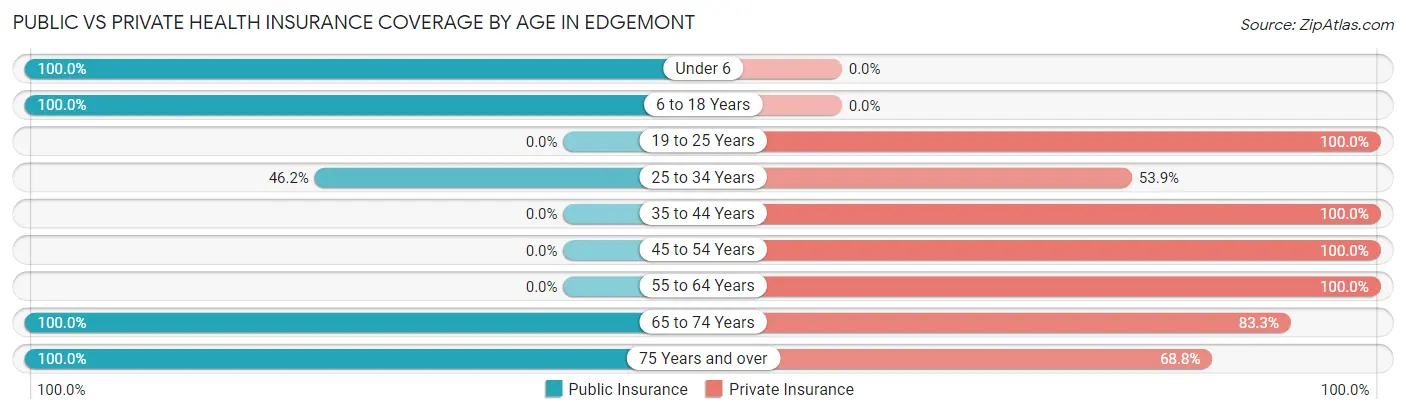
| Age Bracket | Public Insurance | Private Insurance |
| Under 6 | 6 (100.0%) | 0 (0.0%) |
| 6 to 18 Years | 13 (100.0%) | 0 (0.0%) |
| 19 to 25 Years | 0 (0.0%) | 18 (100.0%) |
| 25 to 34 Years | 12 (46.2%) | 14 (53.8%) |
| 35 to 44 Years | 0 (0.0%) | 10 (100.0%) |
| 45 to 54 Years | 0 (0.0%) | 11 (100.0%) |
| 55 to 64 Years | 0 (0.0%) | 68 (100.0%) |
| 65 to 74 Years | 60 (100.0%) | 50 (83.3%) |
| 75 Years and over | 32 (100.0%) | 22 (68.8%) |
| Total | 123 (50.4%) | 193 (79.1%) |
Disability Status by Sex by Age in Edgemont
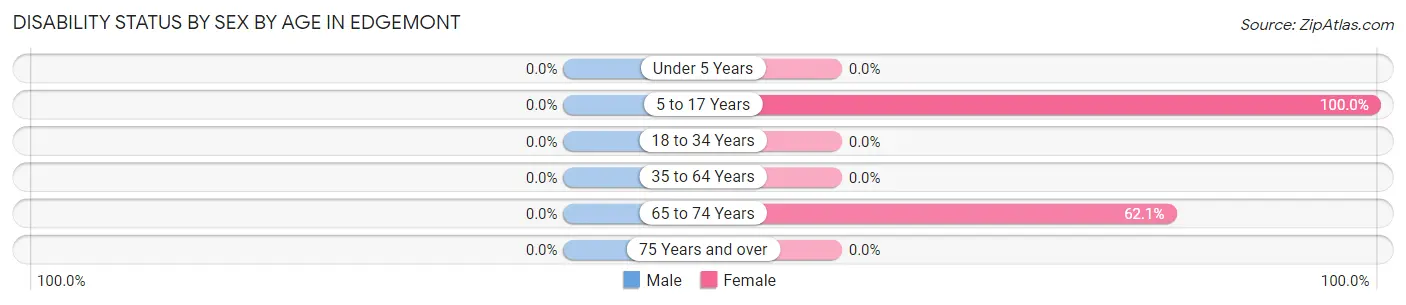
| Age Bracket | Male | Female |
| Under 5 Years | 0 (0.0%) | 0 (0.0%) |
| 5 to 17 Years | 0 (0.0%) | 7 (100.0%) |
| 18 to 34 Years | 0 (0.0%) | 0 (0.0%) |
| 35 to 64 Years | 0 (0.0%) | 0 (0.0%) |
| 65 to 74 Years | 0 (0.0%) | 18 (62.1%) |
| 75 Years and over | 0 (0.0%) | 0 (0.0%) |
Disability Class by Sex by Age in Edgemont
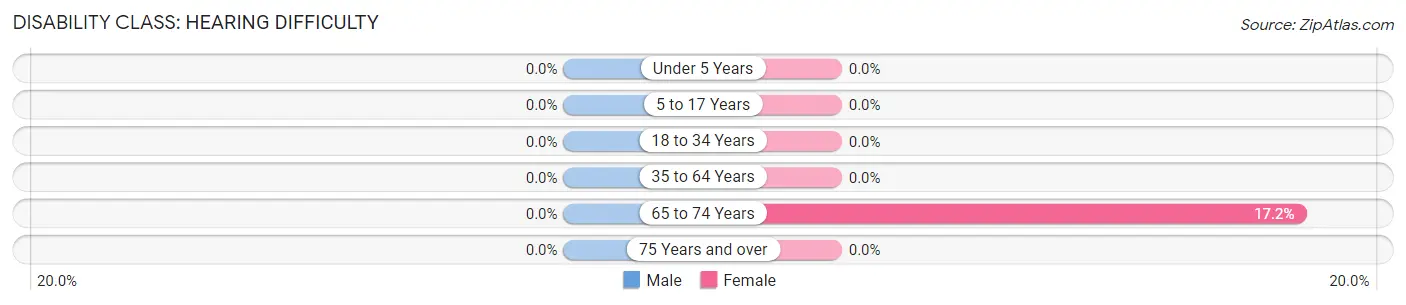
Disability Class: Hearing Difficulty
| Age Bracket | Male | Female |
| Under 5 Years | 0 (0.0%) | 0 (0.0%) |
| 5 to 17 Years | 0 (0.0%) | 0 (0.0%) |
| 18 to 34 Years | 0 (0.0%) | 0 (0.0%) |
| 35 to 64 Years | 0 (0.0%) | 0 (0.0%) |
| 65 to 74 Years | 0 (0.0%) | 5 (17.2%) |
| 75 Years and over | 0 (0.0%) | 0 (0.0%) |
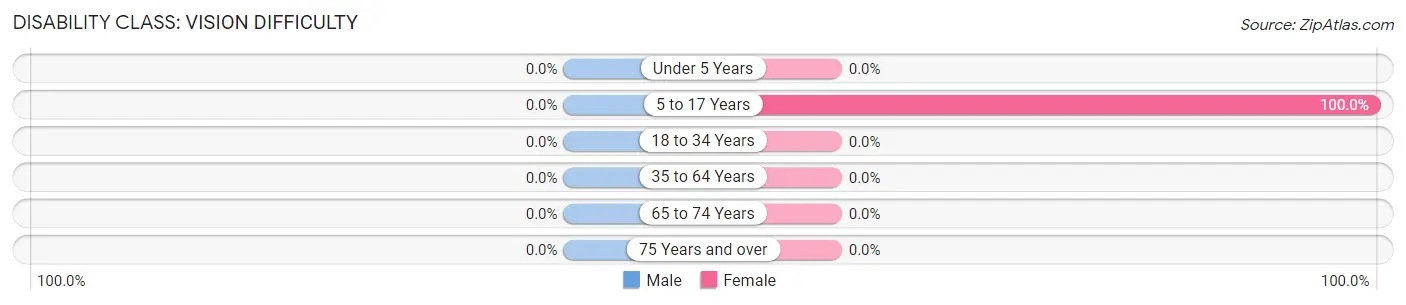
Disability Class: Vision Difficulty
| Age Bracket | Male | Female |
| Under 5 Years | 0 (0.0%) | 0 (0.0%) |
| 5 to 17 Years | 0 (0.0%) | 7 (100.0%) |
| 18 to 34 Years | 0 (0.0%) | 0 (0.0%) |
| 35 to 64 Years | 0 (0.0%) | 0 (0.0%) |
| 65 to 74 Years | 0 (0.0%) | 0 (0.0%) |
| 75 Years and over | 0 (0.0%) | 0 (0.0%) |
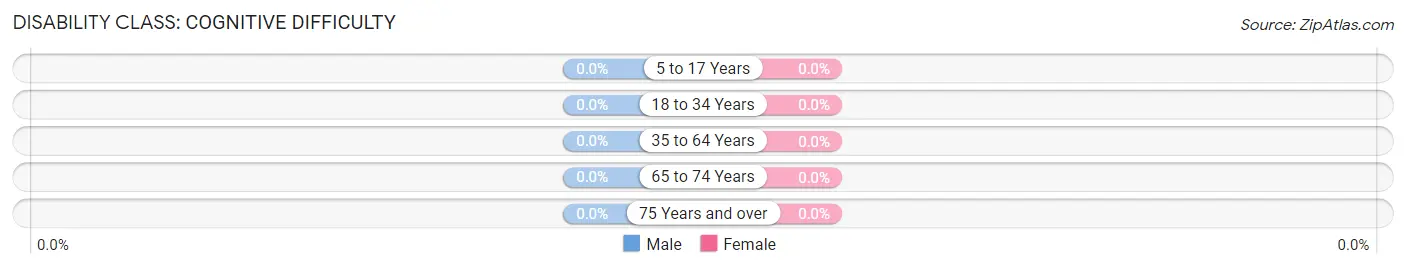
Disability Class: Cognitive Difficulty
| Age Bracket | Male | Female |
| 5 to 17 Years | 0 (0.0%) | 0 (0.0%) |
| 18 to 34 Years | 0 (0.0%) | 0 (0.0%) |
| 35 to 64 Years | 0 (0.0%) | 0 (0.0%) |
| 65 to 74 Years | 0 (0.0%) | 0 (0.0%) |
| 75 Years and over | 0 (0.0%) | 0 (0.0%) |
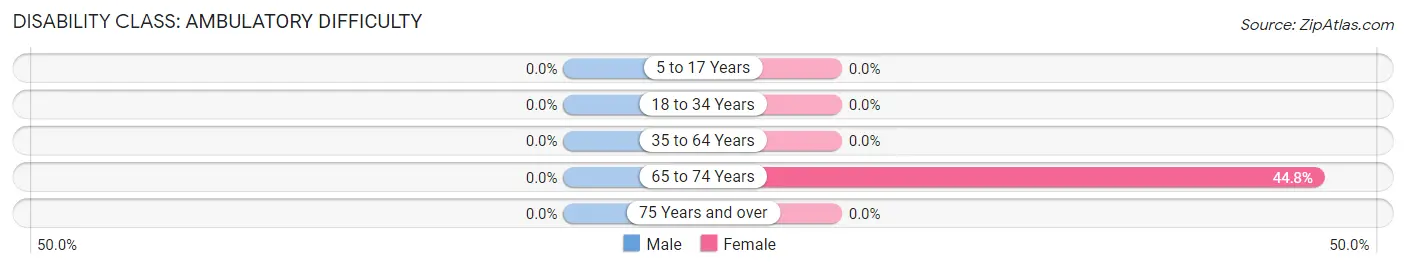
Disability Class: Ambulatory Difficulty
| Age Bracket | Male | Female |
| 5 to 17 Years | 0 (0.0%) | 0 (0.0%) |
| 18 to 34 Years | 0 (0.0%) | 0 (0.0%) |
| 35 to 64 Years | 0 (0.0%) | 0 (0.0%) |
| 65 to 74 Years | 0 (0.0%) | 13 (44.8%) |
| 75 Years and over | 0 (0.0%) | 0 (0.0%) |
Disability Class: Self-Care Difficulty

| Age Bracket | Male | Female |
| 5 to 17 Years | 0 (0.0%) | 0 (0.0%) |
| 18 to 34 Years | 0 (0.0%) | 0 (0.0%) |
| 35 to 64 Years | 0 (0.0%) | 0 (0.0%) |
| 65 to 74 Years | 0 (0.0%) | 0 (0.0%) |
| 75 Years and over | 0 (0.0%) | 0 (0.0%) |
Technology Access in Edgemont
Computing Device Access in Edgemont
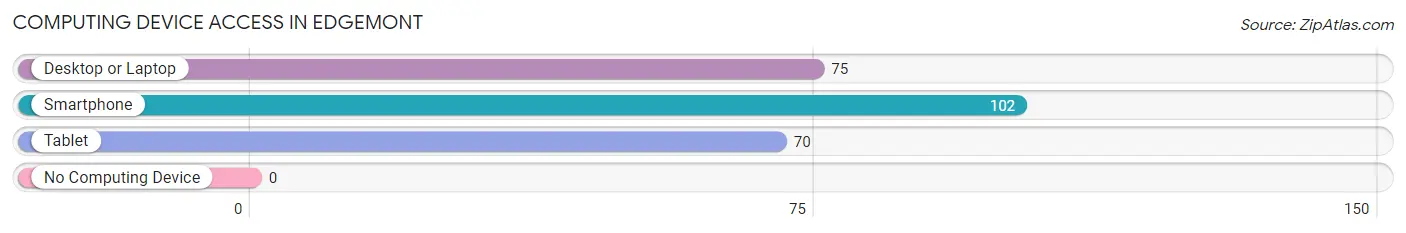
| Device Type | # Households | % Households |
| Desktop or Laptop | 75 | 64.1% |
| Smartphone | 102 | 87.2% |
| Tablet | 70 | 59.8% |
| No Computing Device | 0 | 0.0% |
| Total | 117 | 100.0% |
Internet Access in Edgemont
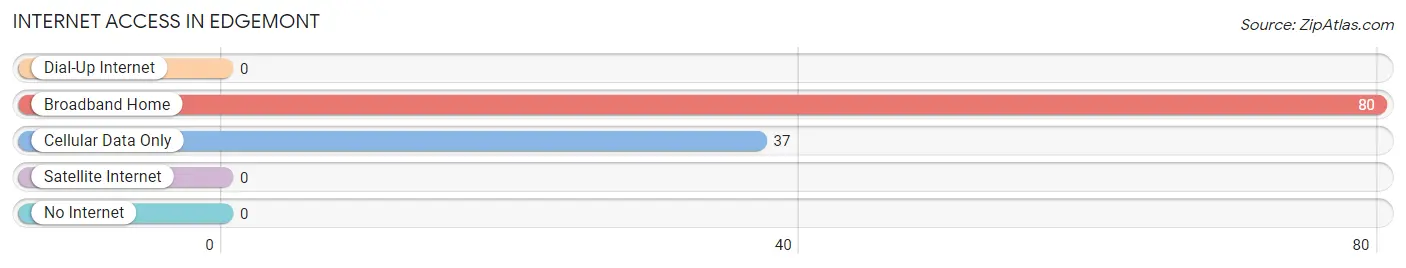
| Internet Type | # Households | % Households |
| Dial-Up Internet | 0 | 0.0% |
| Broadband Home | 80 | 68.4% |
| Cellular Data Only | 37 | 31.6% |
| Satellite Internet | 0 | 0.0% |
| No Internet | 0 | 0.0% |
| Total | 117 | 100.0% |
Edgemont Summary
Edgemont, Maryland is a small unincorporated community located in Montgomery County, Maryland. It is situated in the northern part of the county, just south of the Potomac River. The community is bordered by the towns of Poolesville and Barnesville to the north, and the towns of Dickerson and Beallsville to the south. The population of Edgemont was estimated to be 1,845 in 2019.
History
Edgemont was first settled in the late 1700s by a group of German immigrants. The town was originally known as “Edge Hill” and was later changed to “Edgemont” in 1883. The town was named after the nearby Edgemont Hill, which was a popular spot for picnics and other outdoor activities.
The town was primarily an agricultural community until the late 19th century, when the railroad was built through the area. This allowed for the development of a small industrial center, which included a sawmill, a gristmill, and a brickyard. The town also had a post office, a general store, and a blacksmith shop.
Geography
Edgemont is located in northern Montgomery County, Maryland. It is situated in the Piedmont region of the state, which is characterized by rolling hills and valleys. The town is bordered by the towns of Poolesville and Barnesville to the north, and the towns of Dickerson and Beallsville to the south. The Potomac River is located just to the north of the town.
The climate in Edgemont is typical of the mid-Atlantic region, with hot, humid summers and cold, wet winters. The average annual temperature is around 54 degrees Fahrenheit, with an average high of around 80 degrees in the summer and an average low of around 30 degrees in the winter.
Economy
Edgemont’s economy is primarily based on agriculture and light industry. The town is home to several farms, which produce a variety of crops, including corn, soybeans, wheat, and hay. The town also has a few small businesses, including a general store, a post office, and a few restaurants.
Demographics
As of 2019, the population of Edgemont was estimated to be 1,845. The racial makeup of the town was 94.3% White, 2.2% African American, 0.7% Asian, 0.3% Native American, and 2.5% from other races. The median household income was $90,945, and the median home value was $400,000. The town has a high rate of homeownership, with over 80% of the population owning their own homes.
Edgemont is a small, rural community with a rich history and a strong sense of community. The town is home to a variety of businesses and farms, and the residents take pride in their town and its history. The town is a great place to live, work, and raise a family.
Common Questions
What is Per Capita Income in Edgemont?
Per Capita income in Edgemont is $38,697.
What is the Median Household income in Edgemont?
Median Household Income in Edgemont is $66,250.
What is Inequality or Gini Index in Edgemont?
Inequality or Gini Index in Edgemont is 0.25.
What is the Total Population of Edgemont?
Total Population of Edgemont is 244.
What is the Total Male Population of Edgemont?
Total Male Population of Edgemont is 115.
What is the Total Female Population of Edgemont?
Total Female Population of Edgemont is 129.
What is the Ratio of Males per 100 Females in Edgemont?
There are 89.15 Males per 100 Females in Edgemont.
What is the Ratio of Females per 100 Males in Edgemont?
There are 112.17 Females per 100 Males in Edgemont.
What is the Median Population Age in Edgemont?
Median Population Age in Edgemont is 56.6 Years.
What is the Average Family Size in Edgemont
Average Family Size in Edgemont is 2.7 People.
What is the Average Household Size in Edgemont
Average Household Size in Edgemont is 2.1 People.
How Large is the Labor Force in Edgemont?
There are 158 People in the Labor Forcein in Edgemont.
What is the Percentage of People in the Labor Force in Edgemont?
70.2% of People are in the Labor Force in Edgemont.
What is the Unemployment Rate in Edgemont?
Unemployment Rate in Edgemont is 7.6%.