Zip Codes with the Highest Percentage of Population Employed in Agriculture, Fishing & Hunting in Quincy, IL
RELATED REPORTS & OPTIONS
Agriculture, Fishing & Hunting
Quincy
Compare Zip Codes
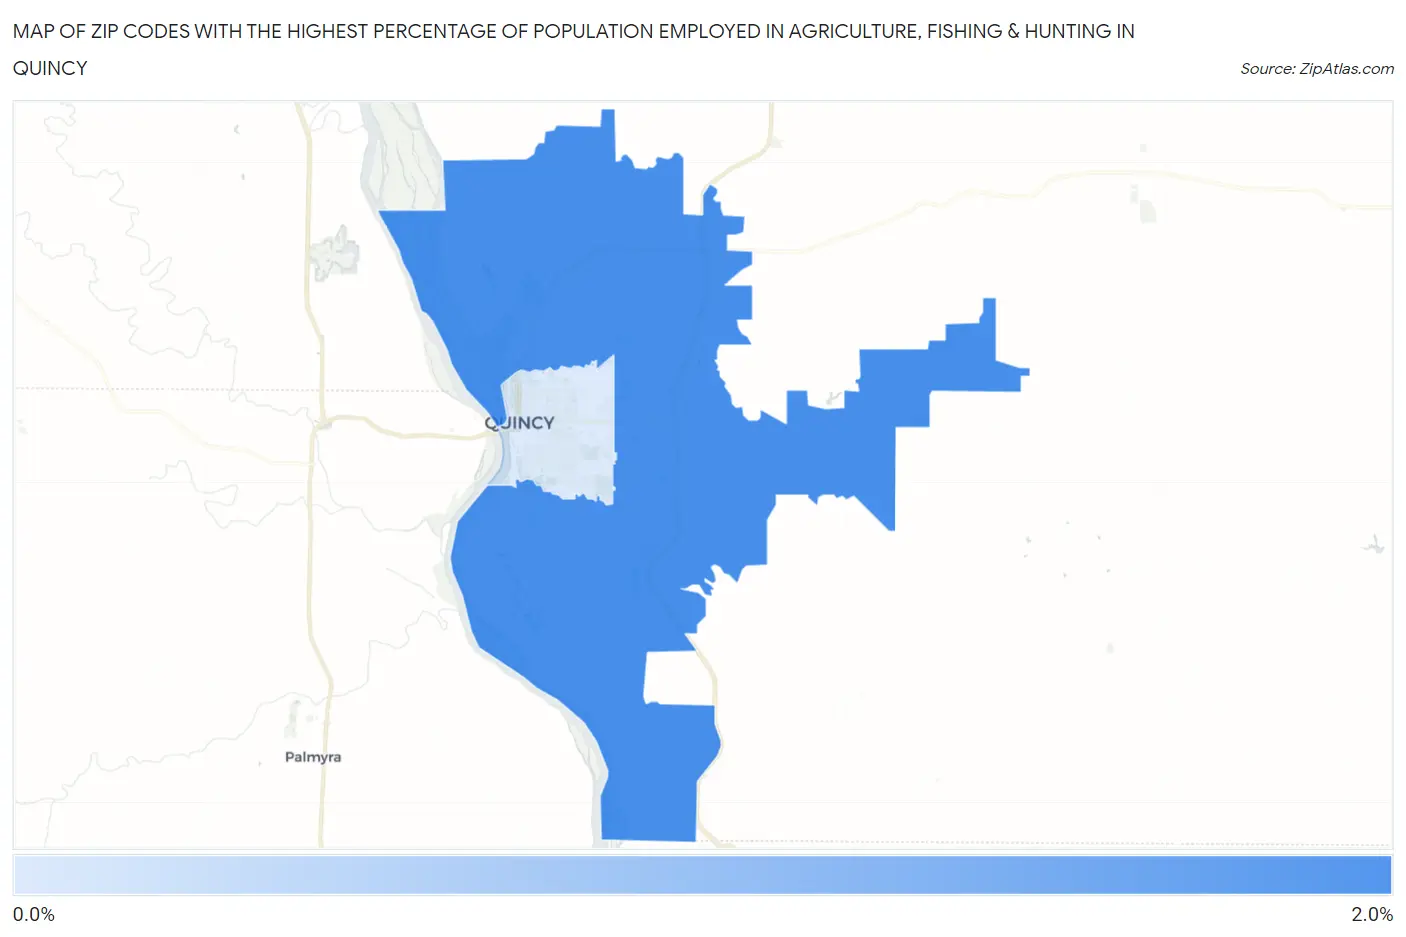
Map of Zip Codes with the Highest Percentage of Population Employed in Agriculture, Fishing & Hunting in Quincy
0.57%
1.9%
Zip Codes with the Highest Percentage of Population Employed in Agriculture, Fishing & Hunting in Quincy, IL
| Zip Code | % Employed | vs State | vs National | |
| 1. | 62305 | 1.9% | 0.88%(+0.976)#697 | 1.2%(+0.654)#13,147 |
| 2. | 62301 | 0.57% | 0.88%(-0.311)#898 | 1.2%(-0.633)#18,720 |
1
Common Questions
What are the Top Zip Codes with the Highest Percentage of Population Employed in Agriculture, Fishing & Hunting in Quincy, IL?
Top Zip Codes with the Highest Percentage of Population Employed in Agriculture, Fishing & Hunting in Quincy, IL are:
What zip code has the Highest Percentage of Population Employed in Agriculture, Fishing & Hunting in Quincy, IL?
62305 has the Highest Percentage of Population Employed in Agriculture, Fishing & Hunting in Quincy, IL with 1.9%.
What is the Percentage of Population Employed in Agriculture, Fishing & Hunting in Quincy, IL?
Percentage of Population Employed in Agriculture, Fishing & Hunting in Quincy is 0.59%.
What is the Percentage of Population Employed in Agriculture, Fishing & Hunting in Illinois?
Percentage of Population Employed in Agriculture, Fishing & Hunting in Illinois is 0.88%.
What is the Percentage of Population Employed in Agriculture, Fishing & Hunting in the United States?
Percentage of Population Employed in Agriculture, Fishing & Hunting in the United States is 1.2%.