Zip Codes with the Highest Percentage of Population Employed in Agriculture, Fishing & Hunting in East Saint Louis, IL
RELATED REPORTS & OPTIONS
Agriculture, Fishing & Hunting
East Saint Louis
Compare Zip Codes
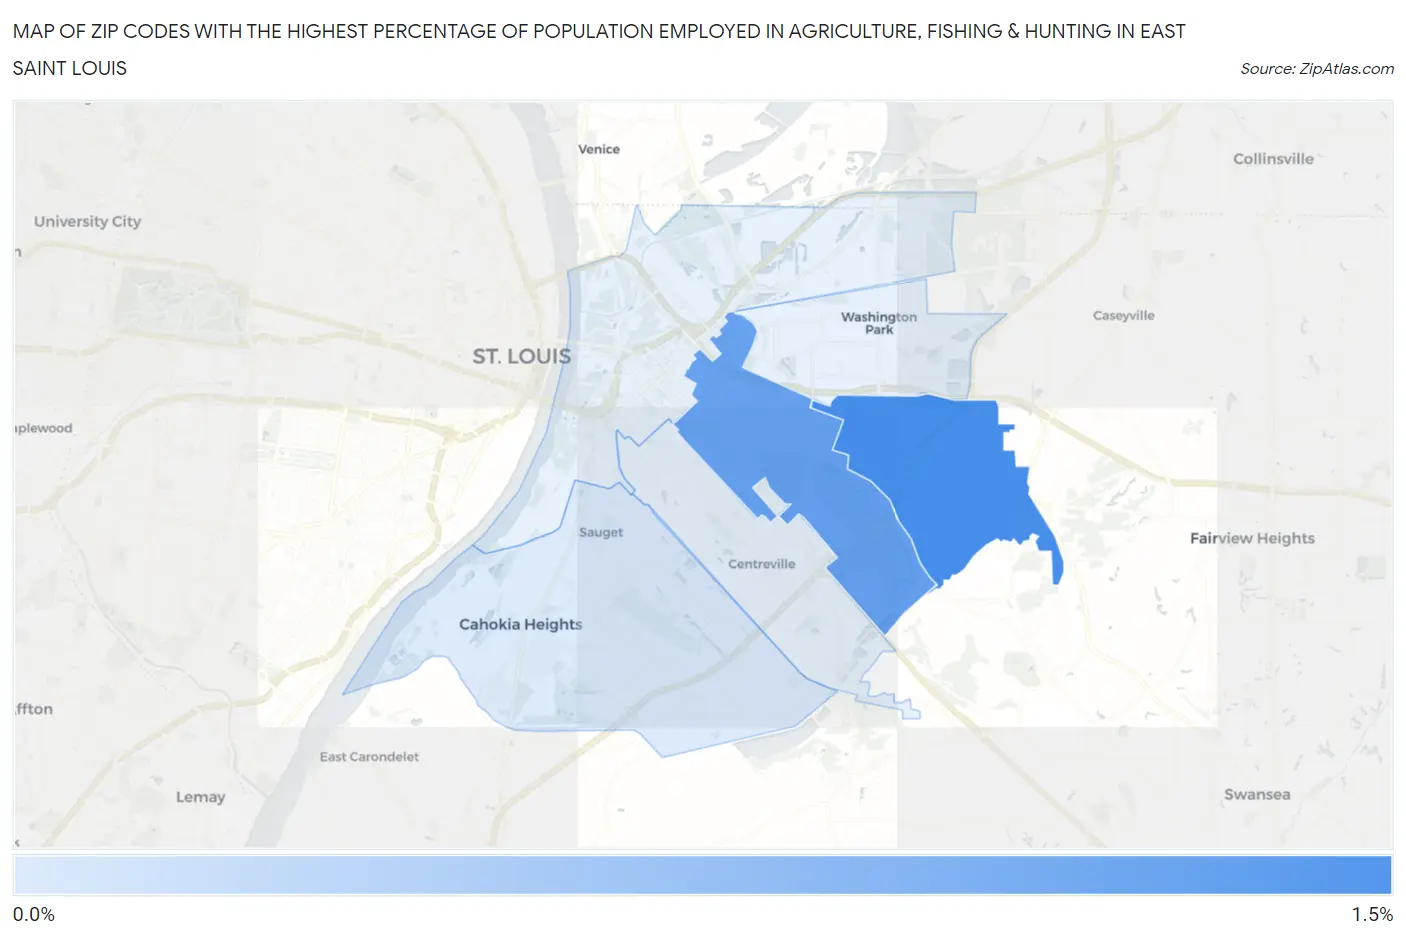
Map of Zip Codes with the Highest Percentage of Population Employed in Agriculture, Fishing & Hunting in East Saint Louis
0.27%
1.2%
Zip Codes with the Highest Percentage of Population Employed in Agriculture, Fishing & Hunting in East Saint Louis, IL
| Zip Code | % Employed | vs State | vs National | |
| 1. | 62203 | 1.2% | 0.88%(+0.353)#789 | 1.2%(+0.032)#15,285 |
| 2. | 62205 | 1.0% | 0.88%(+0.141)#824 | 1.2%(-0.180)#16,138 |
| 3. | 62206 | 0.27% | 0.88%(-0.605)#993 | 1.2%(-0.927)#21,508 |
1
Common Questions
What are the Top 5 Zip Codes with the Highest Percentage of Population Employed in Agriculture, Fishing & Hunting in East Saint Louis, IL?
Top 5 Zip Codes with the Highest Percentage of Population Employed in Agriculture, Fishing & Hunting in East Saint Louis, IL are:
What zip code has the Highest Percentage of Population Employed in Agriculture, Fishing & Hunting in East Saint Louis, IL?
62203 has the Highest Percentage of Population Employed in Agriculture, Fishing & Hunting in East Saint Louis, IL with 1.2%.
What is the Percentage of Population Employed in Agriculture, Fishing & Hunting in Illinois?
Percentage of Population Employed in Agriculture, Fishing & Hunting in Illinois is 0.88%.
What is the Percentage of Population Employed in Agriculture, Fishing & Hunting in the United States?
Percentage of Population Employed in Agriculture, Fishing & Hunting in the United States is 1.2%.