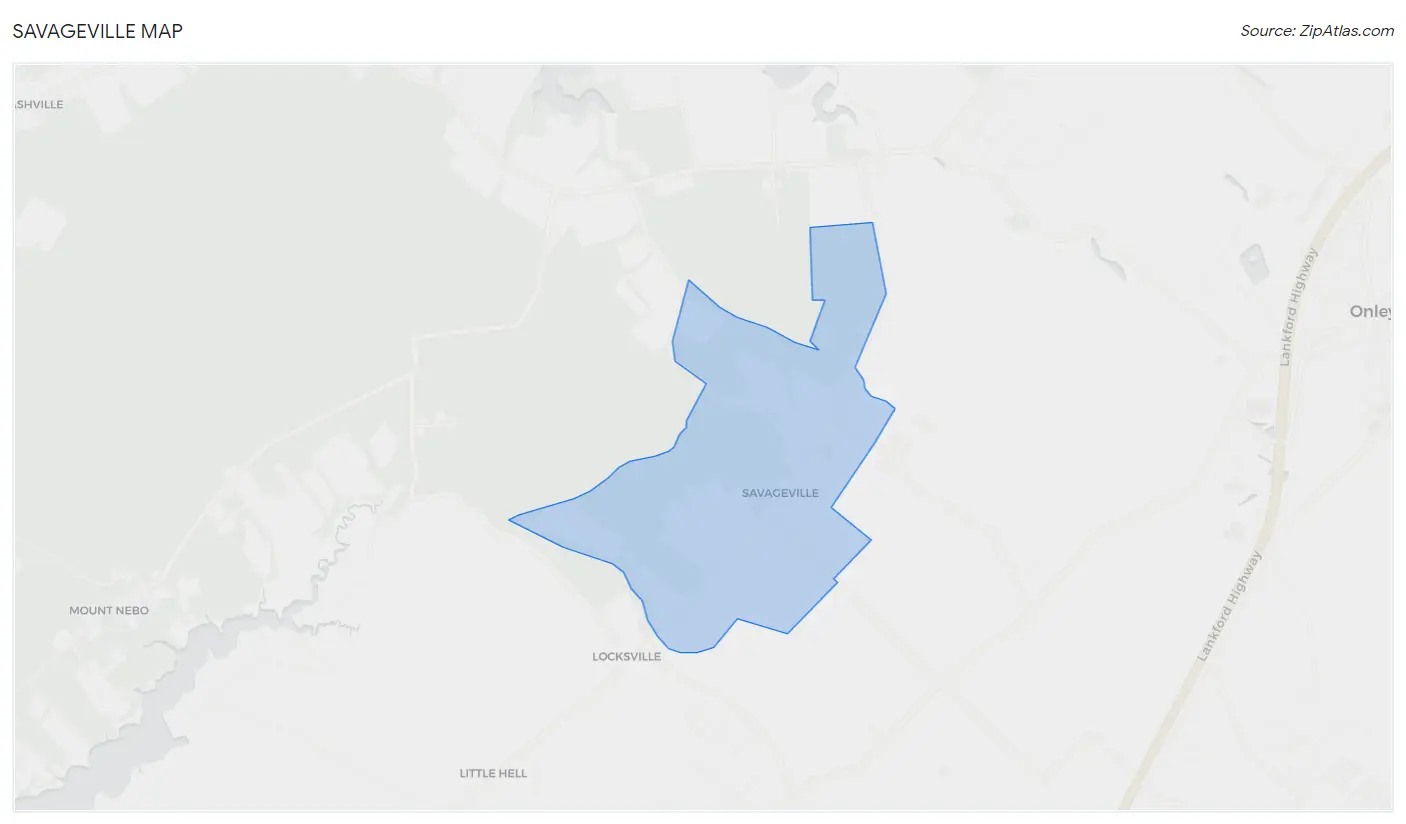
Savageville, VA Map & Demographics
Savageville Map
Savageville Overview
$24,833
PER CAPITA INCOME
$48,730
AVG HOUSEHOLD INCOME
51.7%
WAGE / INCOME GAP [ % ]
48.3¢/ $1
WAGE / INCOME GAP [ $ ]
0.23
INEQUALITY / GINI INDEX
574
TOTAL POPULATION
253
MALE POPULATION
321
FEMALE POPULATION
78.82
MALES / 100 FEMALES
126.88
FEMALES / 100 MALES
23.0
MEDIAN AGE
3.4
AVG FAMILY SIZE
2.5
AVG HOUSEHOLD SIZE
377
LABOR FORCE [ PEOPLE ]
93.1%
PERCENT IN LABOR FORCE
Income in Savageville
Income Overview in Savageville
| Characteristic | Number | Measure |
| Per Capita Income | 574 | $24,833 |
| Median Family Income | 143 | $0 |
| Mean Family Income | 143 | $70,622 |
| Median Household Income | 233 | $48,730 |
| Mean Household Income | 233 | $61,227 |
| Income Deficit | 143 | $0 |
| Wage / Income Gap (%) | 574 | 51.71% |
| Wage / Income Gap ($) | 574 | 48.29¢ per $1 |
| Gini / Inequality Index | 574 | 0.23 |
Earnings by Sex in Savageville
Average Earnings in Savageville are $28,427, $48,952 for men and $23,639 for women, a difference of 51.7%.
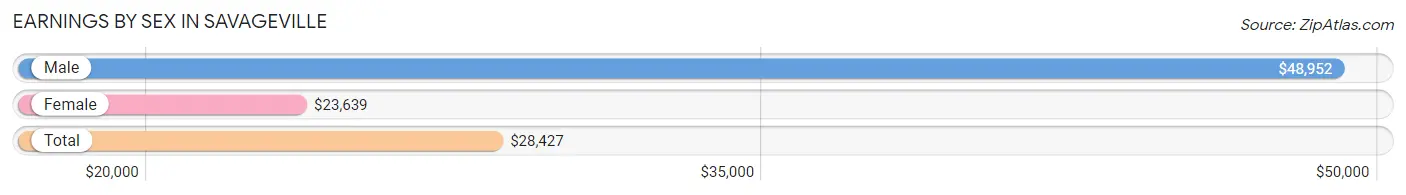
| Sex | Number | Average Earnings |
| Male | 152 (40.3%) | $48,952 |
| Female | 225 (59.7%) | $23,639 |
| Total | 377 (100.0%) | $28,427 |
Earnings by Sex by Income Bracket in Savageville
The most common earnings brackets in Savageville are $45,000 to $49,999 for men (62 | 40.8%) and $25,000 to $29,999 for women (88 | 39.1%).
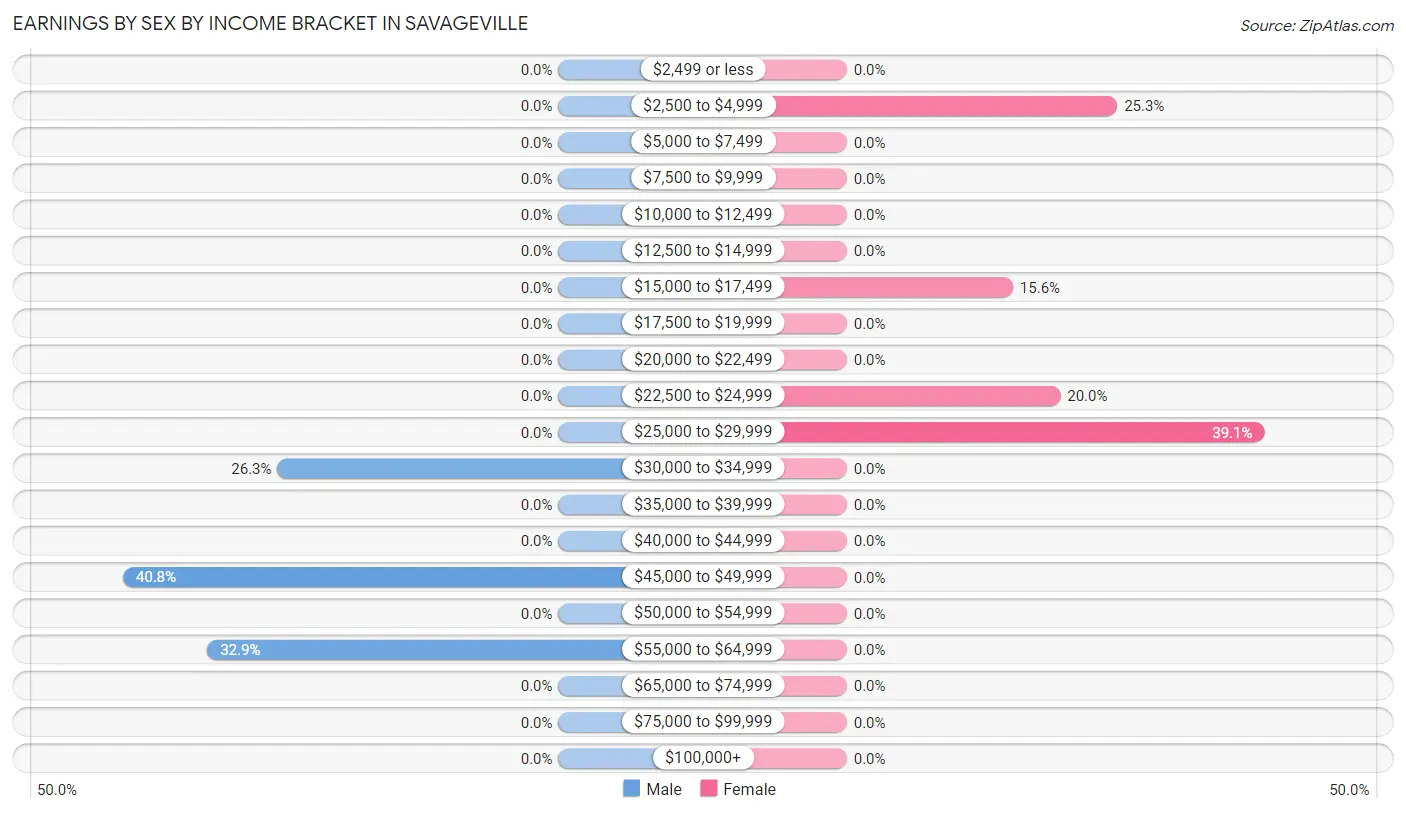
| Income | Male | Female |
| $2,499 or less | 0 (0.0%) | 0 (0.0%) |
| $2,500 to $4,999 | 0 (0.0%) | 57 (25.3%) |
| $5,000 to $7,499 | 0 (0.0%) | 0 (0.0%) |
| $7,500 to $9,999 | 0 (0.0%) | 0 (0.0%) |
| $10,000 to $12,499 | 0 (0.0%) | 0 (0.0%) |
| $12,500 to $14,999 | 0 (0.0%) | 0 (0.0%) |
| $15,000 to $17,499 | 0 (0.0%) | 35 (15.6%) |
| $17,500 to $19,999 | 0 (0.0%) | 0 (0.0%) |
| $20,000 to $22,499 | 0 (0.0%) | 0 (0.0%) |
| $22,500 to $24,999 | 0 (0.0%) | 45 (20.0%) |
| $25,000 to $29,999 | 0 (0.0%) | 88 (39.1%) |
| $30,000 to $34,999 | 40 (26.3%) | 0 (0.0%) |
| $35,000 to $39,999 | 0 (0.0%) | 0 (0.0%) |
| $40,000 to $44,999 | 0 (0.0%) | 0 (0.0%) |
| $45,000 to $49,999 | 62 (40.8%) | 0 (0.0%) |
| $50,000 to $54,999 | 0 (0.0%) | 0 (0.0%) |
| $55,000 to $64,999 | 50 (32.9%) | 0 (0.0%) |
| $65,000 to $74,999 | 0 (0.0%) | 0 (0.0%) |
| $75,000 to $99,999 | 0 (0.0%) | 0 (0.0%) |
| $100,000+ | 0 (0.0%) | 0 (0.0%) |
| Total | 152 (100.0%) | 225 (100.0%) |
Earnings by Sex by Educational Attainment in Savageville
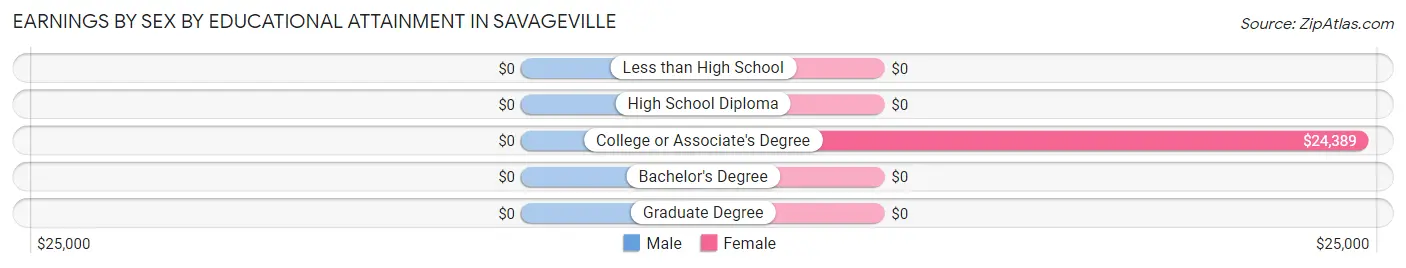
| Educational Attainment | Male Income | Female Income |
| Less than High School | - | - |
| High School Diploma | - | - |
| College or Associate's Degree | - | - |
| Bachelor's Degree | - | - |
| Graduate Degree | - | - |
| Total | - | - |
Family Income in Savageville
Family Income Brackets in Savageville
According to the Savageville family income data, there are 58 families falling into the $25,000 to $34,999 income range, which is the most common income bracket and makes up 40.6% of all families.
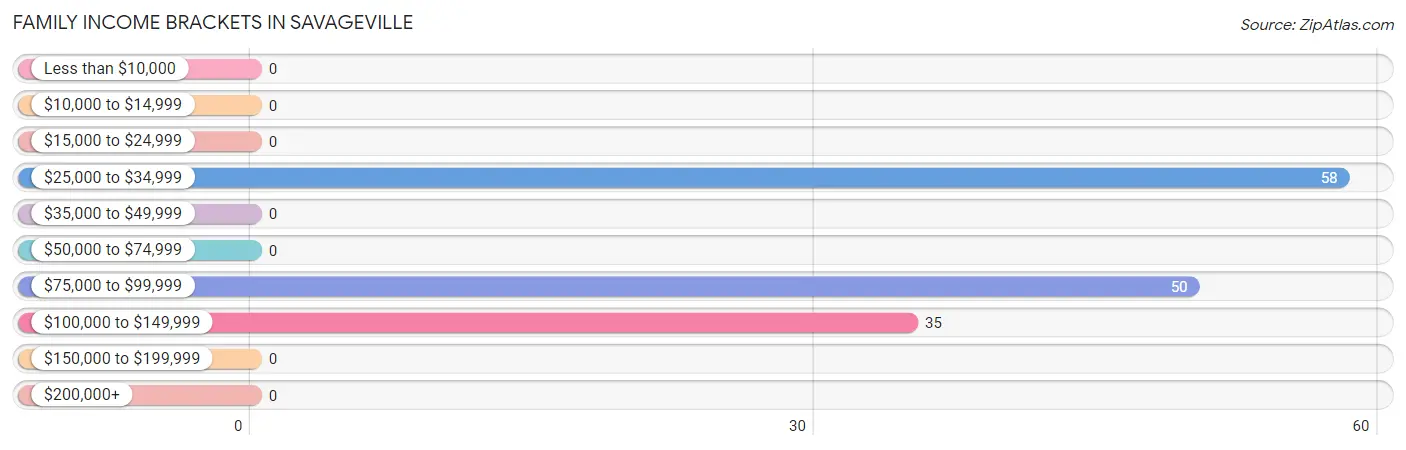
| Income Bracket | # Families | % Families |
| Less than $10,000 | 0 | 0.0% |
| $10,000 to $14,999 | 0 | 0.0% |
| $15,000 to $24,999 | 0 | 0.0% |
| $25,000 to $34,999 | 58 | 40.6% |
| $35,000 to $49,999 | 0 | 0.0% |
| $50,000 to $74,999 | 0 | 0.0% |
| $75,000 to $99,999 | 50 | 35.0% |
| $100,000 to $149,999 | 35 | 24.5% |
| $150,000 to $199,999 | 0 | 0.0% |
| $200,000+ | 0 | 0.0% |
Family Income by Famaliy Size in Savageville
| Income Bracket | # Families | Median Income |
| 2-Person Families | 0 (0.0%) | $0 |
| 3-Person Families | 85 (59.4%) | $0 |
| 4-Person Families | 58 (40.6%) | $0 |
| 5-Person Families | 0 (0.0%) | $0 |
| 6-Person Families | 0 (0.0%) | $0 |
| 7+ Person Families | 0 (0.0%) | $0 |
| Total | 143 (100.0%) | $0 |
Family Income by Number of Earners in Savageville
| Number of Earners | # Families | Median Income |
| No Earners | 0 (0.0%) | $0 |
| 1 Earner | 58 (40.6%) | $0 |
| 2 Earners | 0 (0.0%) | $0 |
| 3+ Earners | 85 (59.4%) | $0 |
| Total | 143 (100.0%) | $0 |
Household Income in Savageville
Household Income Brackets in Savageville
With 90 households falling in the category, the $35,000 to $49,999 income range is the most frequent in Savageville, accounting for 38.6% of all households.
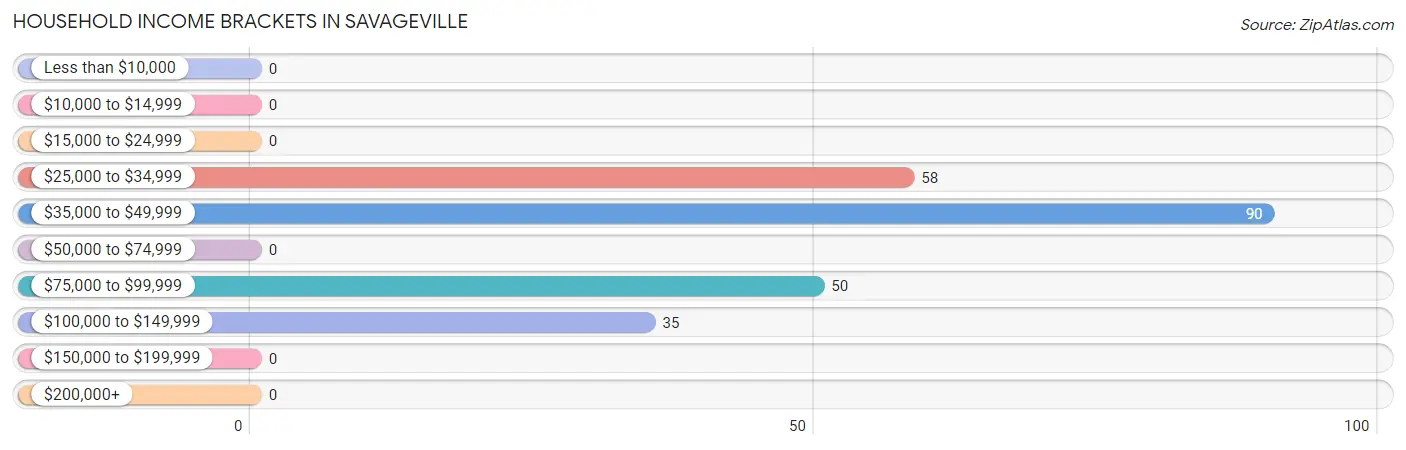
| Income Bracket | # Households | % Households |
| Less than $10,000 | 0 | 0.0% |
| $10,000 to $14,999 | 0 | 0.0% |
| $15,000 to $24,999 | 0 | 0.0% |
| $25,000 to $34,999 | 58 | 24.9% |
| $35,000 to $49,999 | 90 | 38.6% |
| $50,000 to $74,999 | 0 | 0.0% |
| $75,000 to $99,999 | 50 | 21.5% |
| $100,000 to $149,999 | 35 | 15.0% |
| $150,000 to $199,999 | 0 | 0.0% |
| $200,000+ | 0 | 0.0% |
Household Income by Householder Age in Savageville
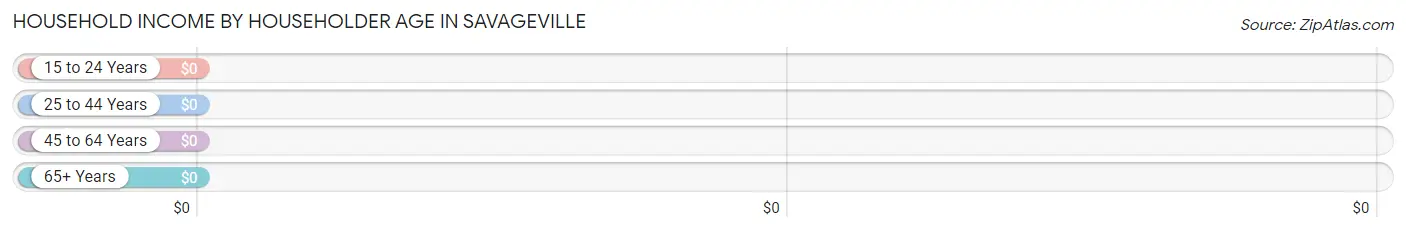
| Income Bracket | # Households | Median Income |
| 15 to 24 Years | 62 (26.6%) | $0 |
| 25 to 44 Years | 58 (24.9%) | $0 |
| 45 to 64 Years | 85 (36.5%) | $0 |
| 65+ Years | 28 (12.0%) | $0 |
| Total | 233 (100.0%) | $48,730 |
Poverty in Savageville
Income Below Poverty by Sex and Age in Savageville
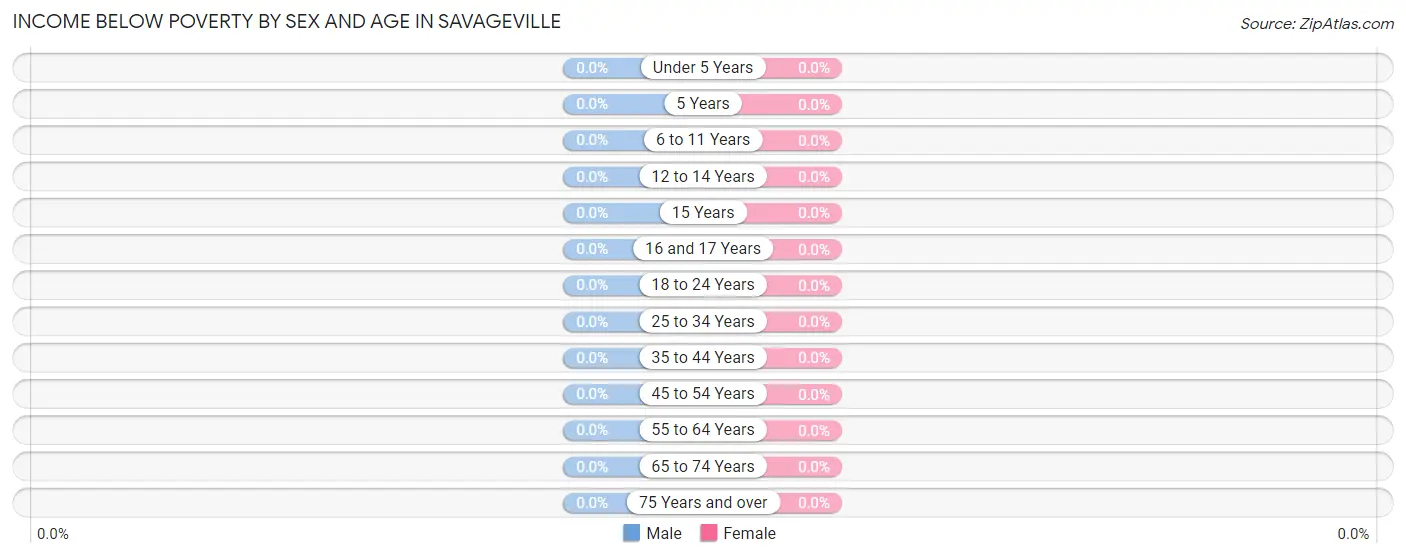
| Age Bracket | Male | Female |
| Under 5 Years | 0 (0.0%) | 0 (0.0%) |
| 5 Years | 0 (0.0%) | 0 (0.0%) |
| 6 to 11 Years | 0 (0.0%) | 0 (0.0%) |
| 12 to 14 Years | 0 (0.0%) | 0 (0.0%) |
| 15 Years | 0 (0.0%) | 0 (0.0%) |
| 16 and 17 Years | 0 (0.0%) | 0 (0.0%) |
| 18 to 24 Years | 0 (0.0%) | 0 (0.0%) |
| 25 to 34 Years | 0 (0.0%) | 0 (0.0%) |
| 35 to 44 Years | 0 (0.0%) | 0 (0.0%) |
| 45 to 54 Years | 0 (0.0%) | 0 (0.0%) |
| 55 to 64 Years | 0 (0.0%) | 0 (0.0%) |
| 65 to 74 Years | 0 (0.0%) | 0 (0.0%) |
| 75 Years and over | 0 (0.0%) | 0 (0.0%) |
| Total | 0 (0.0%) | 0 (0.0%) |
Income Above Poverty by Sex and Age in Savageville
According to the poverty statistics in Savageville, males aged 6 to 11 years and females aged under 5 years are the age groups that are most secure financially, with 100.0% of males and 100.0% of females in these age groups living above the poverty line.
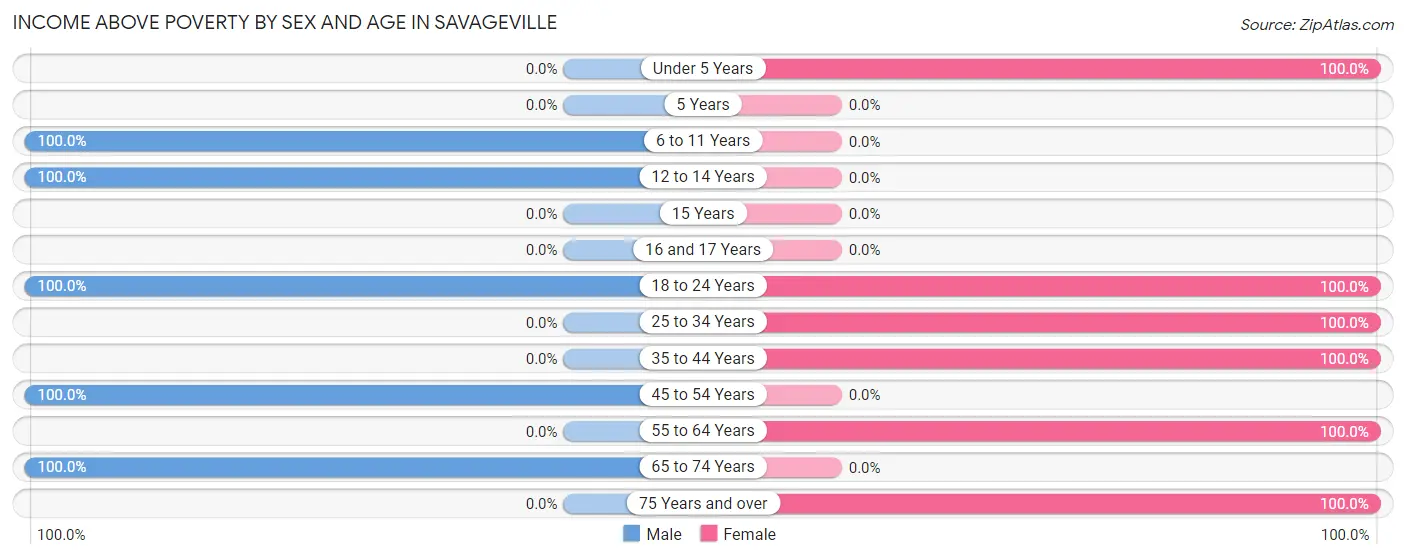
| Age Bracket | Male | Female |
| Under 5 Years | 0 (0.0%) | 68 (100.0%) |
| 5 Years | 0 (0.0%) | 0 (0.0%) |
| 6 to 11 Years | 51 (100.0%) | 0 (0.0%) |
| 12 to 14 Years | 50 (100.0%) | 0 (0.0%) |
| 15 Years | 0 (0.0%) | 0 (0.0%) |
| 16 and 17 Years | 0 (0.0%) | 0 (0.0%) |
| 18 to 24 Years | 62 (100.0%) | 57 (100.0%) |
| 25 to 34 Years | 0 (0.0%) | 45 (100.0%) |
| 35 to 44 Years | 0 (0.0%) | 58 (100.0%) |
| 45 to 54 Years | 50 (100.0%) | 0 (0.0%) |
| 55 to 64 Years | 0 (0.0%) | 65 (100.0%) |
| 65 to 74 Years | 40 (100.0%) | 0 (0.0%) |
| 75 Years and over | 0 (0.0%) | 28 (100.0%) |
| Total | 253 (100.0%) | 321 (100.0%) |
Income Below Poverty Among Married-Couple Families in Savageville
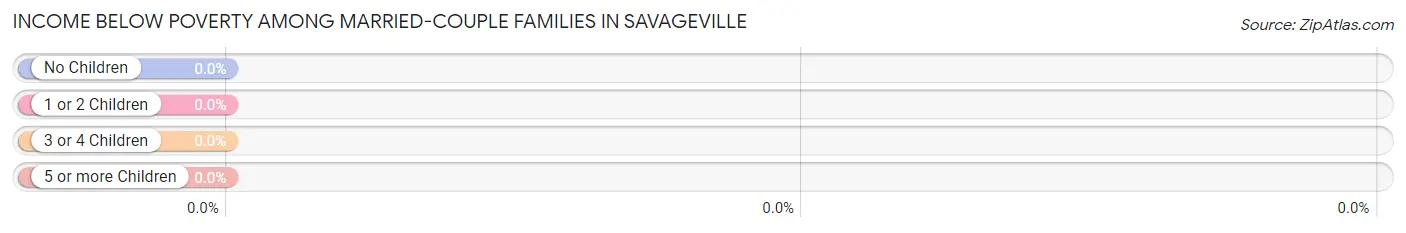
| Children | Above Poverty | Below Poverty |
| No Children | 85 (100.0%) | 0 (0.0%) |
| 1 or 2 Children | 0 (0.0%) | 0 (0.0%) |
| 3 or 4 Children | 0 (0.0%) | 0 (0.0%) |
| 5 or more Children | 0 (0.0%) | 0 (0.0%) |
| Total | 85 (100.0%) | 0 (0.0%) |
Income Below Poverty Among Single-Parent Households in Savageville
| Children | Single Father | Single Mother |
| No Children | 0 (0.0%) | 0 (0.0%) |
| 1 or 2 Children | 0 (0.0%) | 0 (0.0%) |
| 3 or 4 Children | 0 (0.0%) | 0 (0.0%) |
| 5 or more Children | 0 (0.0%) | 0 (0.0%) |
| Total | 0 (0.0%) | 0 (0.0%) |
Income Below Poverty Among Married-Couple vs Single-Parent Households in Savageville
| Children | Married-Couple Families | Single-Parent Households |
| No Children | 0 (0.0%) | 0 (0.0%) |
| 1 or 2 Children | 0 (0.0%) | 0 (0.0%) |
| 3 or 4 Children | 0 (0.0%) | 0 (0.0%) |
| 5 or more Children | 0 (0.0%) | 0 (0.0%) |
| Total | 0 (0.0%) | 0 (0.0%) |
Race in Savageville
The most populous races in Savageville are Black / African American (512 | 89.2%), and White / Caucasian (62 | 10.8%).
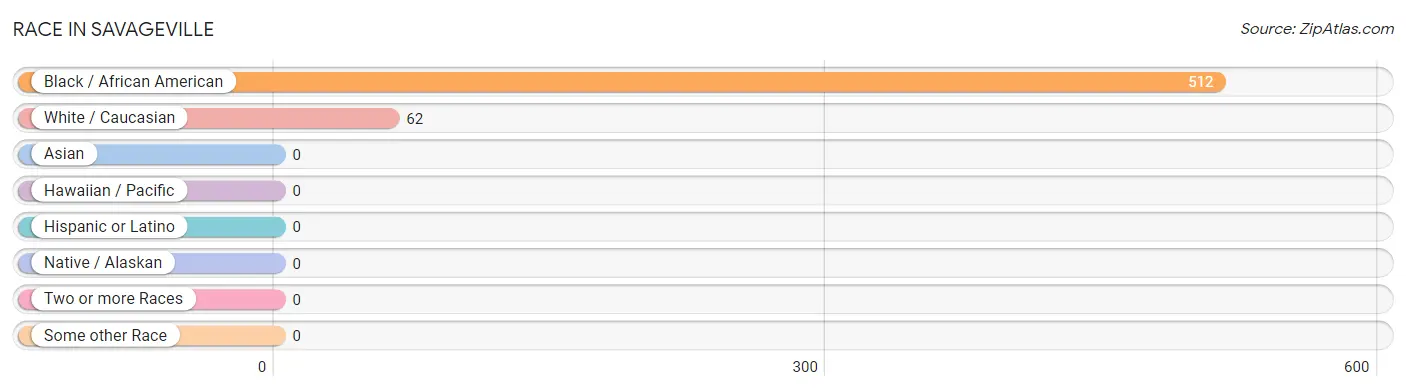
| Race | # Population | % Population |
| Asian | 0 | 0.0% |
| Black / African American | 512 | 89.2% |
| Hawaiian / Pacific | 0 | 0.0% |
| Hispanic or Latino | 0 | 0.0% |
| Native / Alaskan | 0 | 0.0% |
| White / Caucasian | 62 | 10.8% |
| Two or more Races | 0 | 0.0% |
| Some other Race | 0 | 0.0% |
| Total | 574 | 100.0% |
Ancestry in Savageville
The most populous ancestries reported in Savageville are , and American (574 | 100.0%), together accounting for 100.0% of all Savageville residents.

| Ancestry | # Population | % Population |
| American | 574 | 100.0% | View All 1 Rows |
Immigrants in Savageville

| Immigration Origin | # Population | % Population | View All 0 Rows |
Sex and Age in Savageville
Sex and Age in Savageville
The most populous age groups in Savageville are 20 to 24 Years (62 | 24.5%) for men and Under 5 Years (68 | 21.2%) for women.
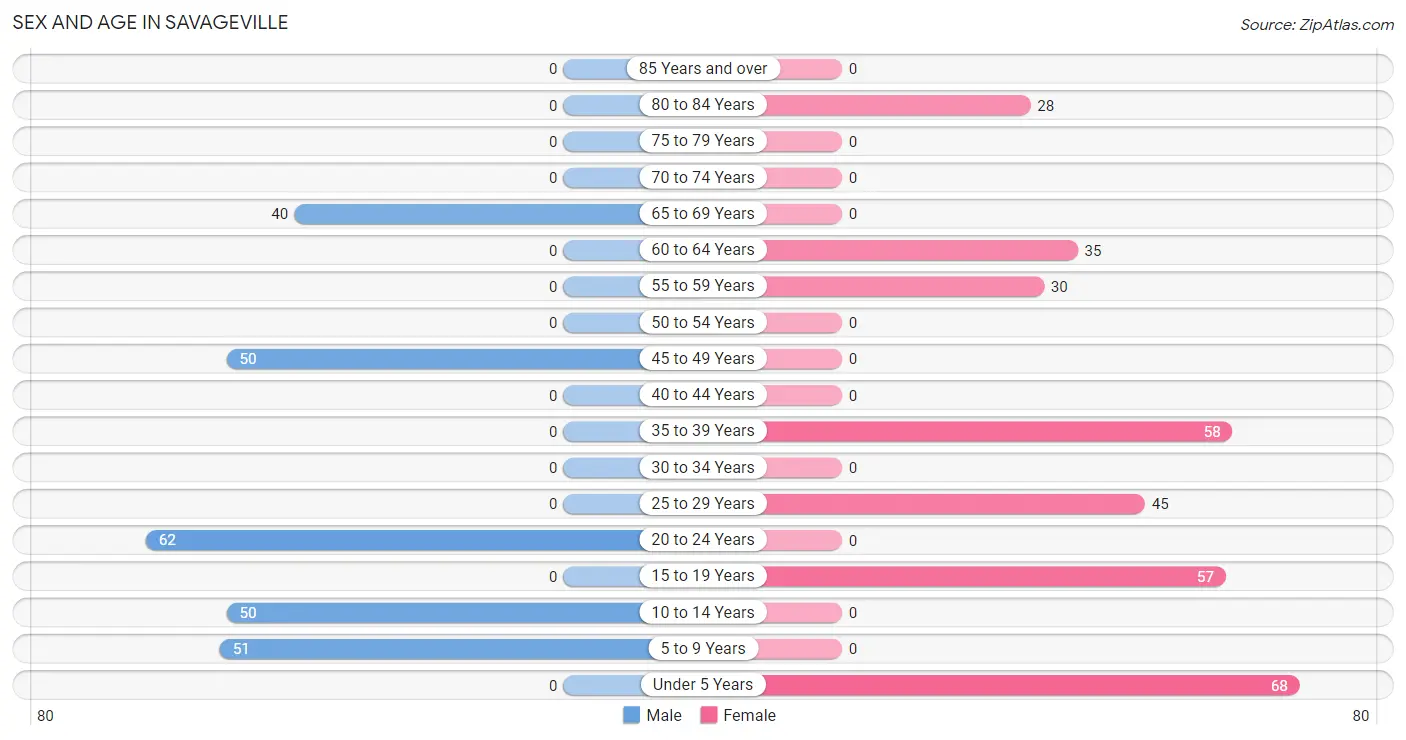
| Age Bracket | Male | Female |
| Under 5 Years | 0 (0.0%) | 68 (21.2%) |
| 5 to 9 Years | 51 (20.2%) | 0 (0.0%) |
| 10 to 14 Years | 50 (19.8%) | 0 (0.0%) |
| 15 to 19 Years | 0 (0.0%) | 57 (17.8%) |
| 20 to 24 Years | 62 (24.5%) | 0 (0.0%) |
| 25 to 29 Years | 0 (0.0%) | 45 (14.0%) |
| 30 to 34 Years | 0 (0.0%) | 0 (0.0%) |
| 35 to 39 Years | 0 (0.0%) | 58 (18.1%) |
| 40 to 44 Years | 0 (0.0%) | 0 (0.0%) |
| 45 to 49 Years | 50 (19.8%) | 0 (0.0%) |
| 50 to 54 Years | 0 (0.0%) | 0 (0.0%) |
| 55 to 59 Years | 0 (0.0%) | 30 (9.3%) |
| 60 to 64 Years | 0 (0.0%) | 35 (10.9%) |
| 65 to 69 Years | 40 (15.8%) | 0 (0.0%) |
| 70 to 74 Years | 0 (0.0%) | 0 (0.0%) |
| 75 to 79 Years | 0 (0.0%) | 0 (0.0%) |
| 80 to 84 Years | 0 (0.0%) | 28 (8.7%) |
| 85 Years and over | 0 (0.0%) | 0 (0.0%) |
| Total | 253 (100.0%) | 321 (100.0%) |
Families and Households in Savageville
Median Family Size in Savageville
| Family Type | # Families | Family Size |
| Married-Couple | 85 (59.4%) | 3.02 |
| Single Male/Father | 0 (0.0%) | - |
| Single Female/Mother | 58 (40.6%) | 3.91 |
| Total Families | 143 (100.0%) | 3.38 |
Median Household Size in Savageville
| Household Type | # Households | Household Size |
| Married-Couple | 85 (36.5%) | 3.02 |
| Single Male/Father | 0 (0.0%) | - |
| Single Female/Mother | 58 (24.9%) | 3.91 |
| Non-family | 90 (38.6%) | - |
| Total Households | 233 (100.0%) | 2.46 |
Household Size by Marriage Status in Savageville
Out of a total of 233 households in Savageville, 143 (61.4%) are family households, while 90 (38.6%) are nonfamily households. The most numerous type of family households are 3-person households, comprising 85, and the most common type of nonfamily households are 1-person households, comprising 90.
| Household Size | Family Households | Nonfamily Households |
| 1-Person Households | - | 90 (38.6%) |
| 2-Person Households | 0 (0.0%) | 0 (0.0%) |
| 3-Person Households | 85 (36.5%) | 0 (0.0%) |
| 4-Person Households | 58 (24.9%) | 0 (0.0%) |
| 5-Person Households | 0 (0.0%) | 0 (0.0%) |
| 6-Person Households | 0 (0.0%) | 0 (0.0%) |
| 7+ Person Households | 0 (0.0%) | 0 (0.0%) |
| Total | 143 (61.4%) | 90 (38.6%) |
Female Fertility in Savageville
Fertility by Age in Savageville
| Age Bracket | Women with Births | Births / 1,000 Women |
| 15 to 19 years | 0 (0.0%) | 0.0 |
| 20 to 34 years | 0 (0.0%) | 0.0 |
| 35 to 50 years | 0 (0.0%) | 0.0 |
| Total | 0 (0.0%) | 0.0 |
Fertility by Age by Marriage Status in Savageville
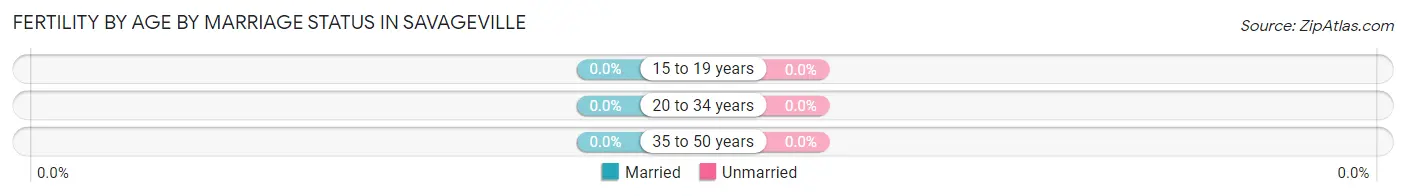
| Age Bracket | Married | Unmarried |
| 15 to 19 years | 0 (0.0%) | 0 (0.0%) |
| 20 to 34 years | 0 (0.0%) | 0 (0.0%) |
| 35 to 50 years | 0 (0.0%) | 0 (0.0%) |
| Total | 0 (0.0%) | 0 (0.0%) |
Fertility by Education in Savageville
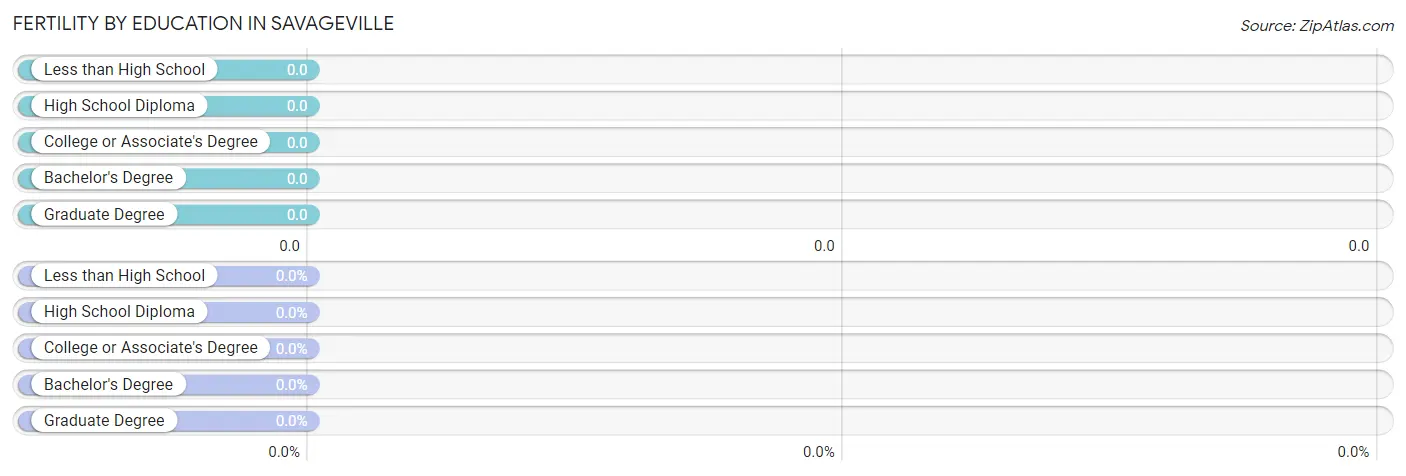
| Educational Attainment | Women with Births | Births / 1,000 Women |
| Less than High School | 0 (0.0%) | 0.0 |
| High School Diploma | 0 (0.0%) | 0.0 |
| College or Associate's Degree | 0 (0.0%) | 0.0 |
| Bachelor's Degree | 0 (0.0%) | 0.0 |
| Graduate Degree | 0 (0.0%) | 0.0 |
| Total | 0 (0.0%) | 0.0 |
Fertility by Education by Marriage Status in Savageville
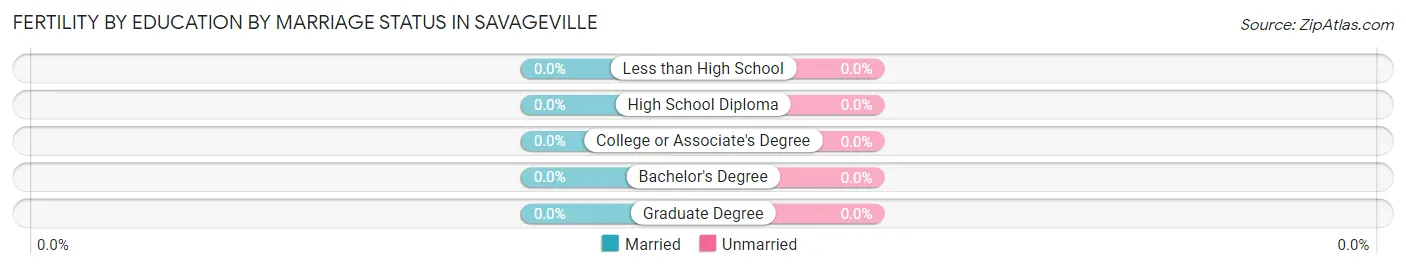
| Educational Attainment | Married | Unmarried |
| Less than High School | 0 (0.0%) | 0 (0.0%) |
| High School Diploma | 0 (0.0%) | 0 (0.0%) |
| College or Associate's Degree | 0 (0.0%) | 0 (0.0%) |
| Bachelor's Degree | 0 (0.0%) | 0 (0.0%) |
| Graduate Degree | 0 (0.0%) | 0 (0.0%) |
| Total | 0 (0.0%) | 0 (0.0%) |
Employment Characteristics in Savageville
Employment by Class of Employer in Savageville
Among the 377 employed individuals in Savageville, private company employees (207 | 54.9%), not-for-profit organizations (130 | 34.5%), and local government employees (40 | 10.6%) make up the most common classes of employment.
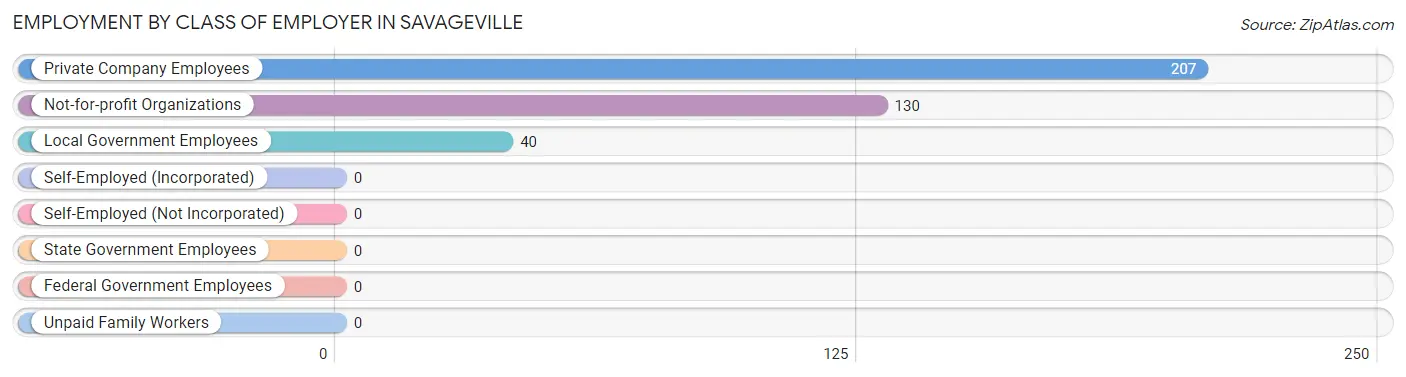
| Employer Class | # Employees | % Employees |
| Private Company Employees | 207 | 54.9% |
| Self-Employed (Incorporated) | 0 | 0.0% |
| Self-Employed (Not Incorporated) | 0 | 0.0% |
| Not-for-profit Organizations | 130 | 34.5% |
| Local Government Employees | 40 | 10.6% |
| State Government Employees | 0 | 0.0% |
| Federal Government Employees | 0 | 0.0% |
| Unpaid Family Workers | 0 | 0.0% |
| Total | 377 | 100.0% |
Employment Status by Age in Savageville
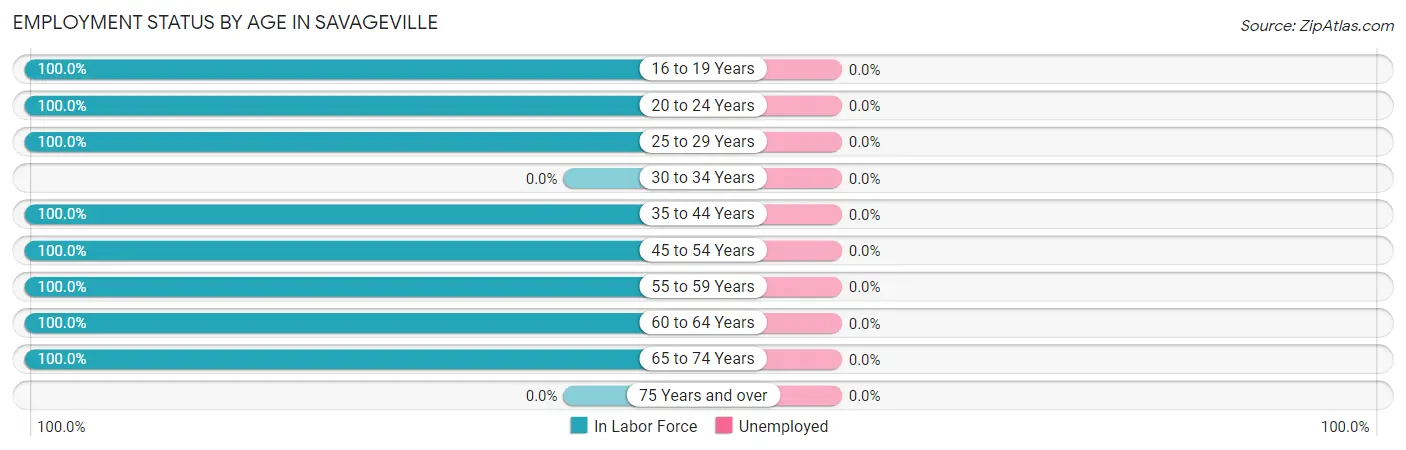
| Age Bracket | In Labor Force | Unemployed |
| 16 to 19 Years | 57 (100.0%) | 0 (0.0%) |
| 20 to 24 Years | 62 (100.0%) | 0 (0.0%) |
| 25 to 29 Years | 45 (100.0%) | 0 (0.0%) |
| 30 to 34 Years | 0 (0.0%) | 0 (0.0%) |
| 35 to 44 Years | 58 (100.0%) | 0 (0.0%) |
| 45 to 54 Years | 50 (100.0%) | 0 (0.0%) |
| 55 to 59 Years | 30 (100.0%) | 0 (0.0%) |
| 60 to 64 Years | 35 (100.0%) | 0 (0.0%) |
| 65 to 74 Years | 40 (100.0%) | 0 (0.0%) |
| 75 Years and over | 0 (0.0%) | 0 (0.0%) |
| Total | 377 (93.1%) | 0 (0.0%) |
Employment Status by Educational Attainment in Savageville
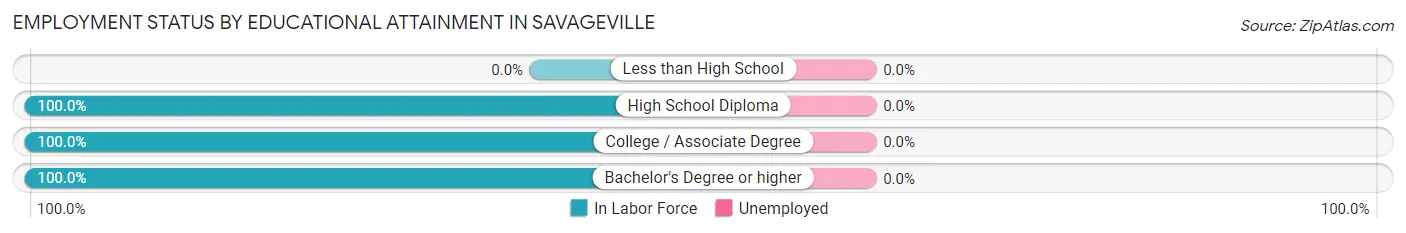
| Educational Attainment | In Labor Force | Unemployed |
| Less than High School | 0 (0.0%) | 0 (0.0%) |
| High School Diploma | 30 (100.0%) | 0 (0.0%) |
| College / Associate Degree | 138 (100.0%) | 0 (0.0%) |
| Bachelor's Degree or higher | 50 (100.0%) | 0 (0.0%) |
| Total | 218 (100.0%) | 0 (0.0%) |
Employment Occupations by Sex in Savageville
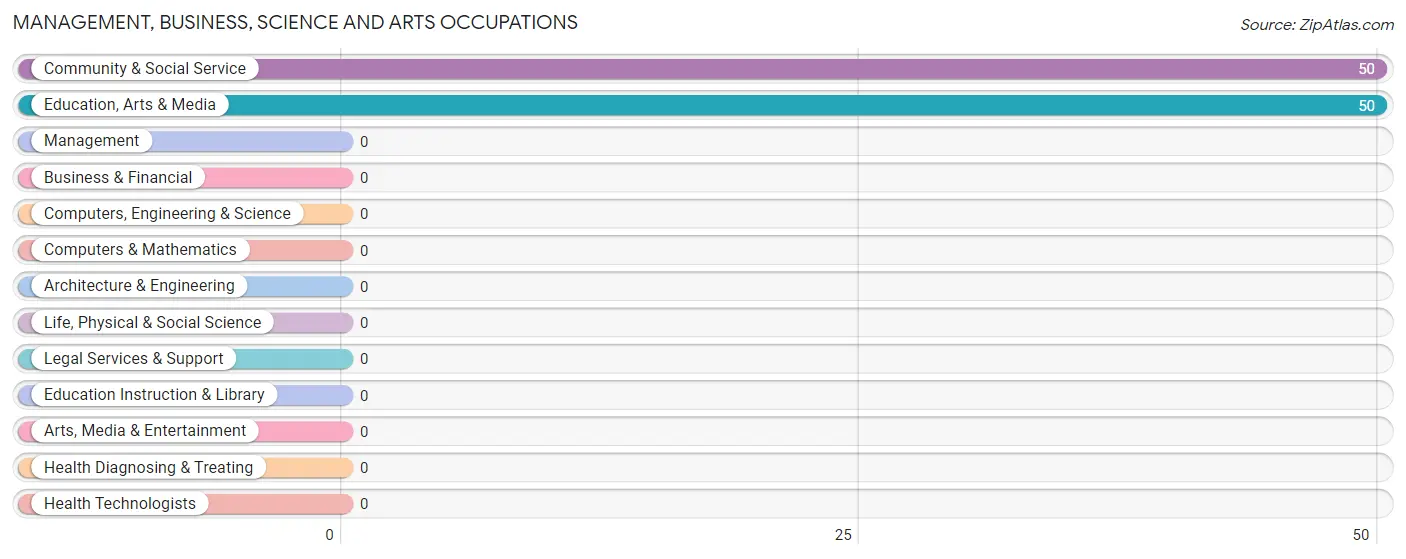
Management, Business, Science and Arts Occupations
The most common Management, Business, Science and Arts occupations in Savageville are Community & Social Service (50 | 13.3%), and Education, Arts & Media (50 | 13.3%).
Management, Business, Science and Arts Occupations by Sex
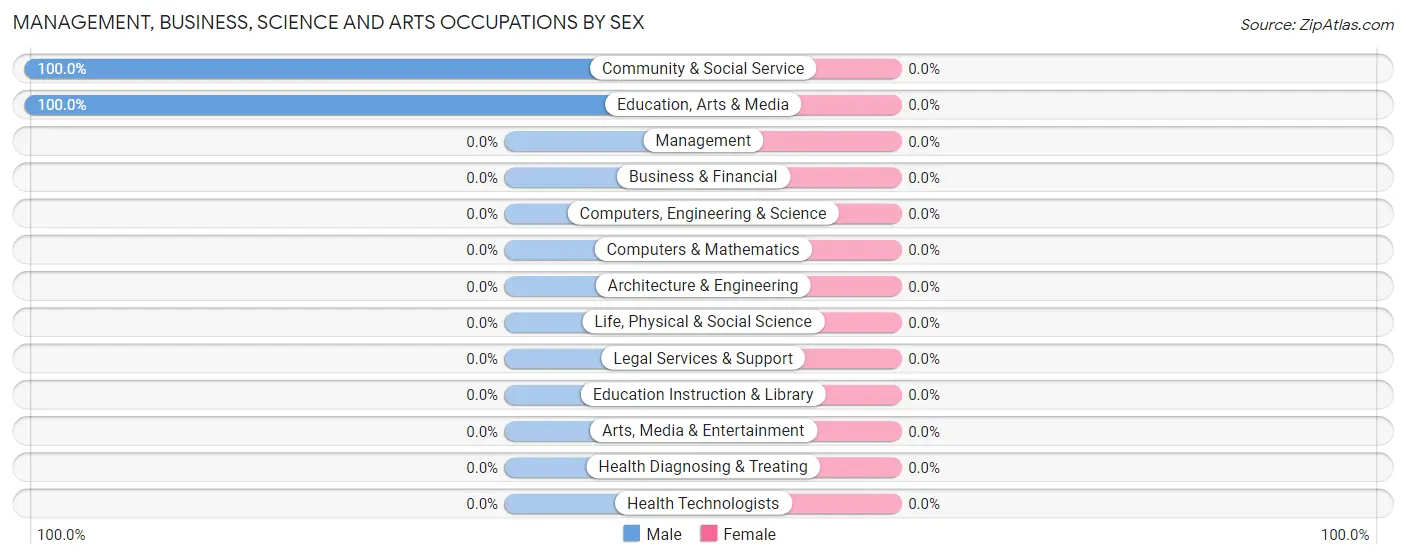
| Occupation | Male | Female |
| Management | 0 (0.0%) | 0 (0.0%) |
| Business & Financial | 0 (0.0%) | 0 (0.0%) |
| Computers, Engineering & Science | 0 (0.0%) | 0 (0.0%) |
| Computers & Mathematics | 0 (0.0%) | 0 (0.0%) |
| Architecture & Engineering | 0 (0.0%) | 0 (0.0%) |
| Life, Physical & Social Science | 0 (0.0%) | 0 (0.0%) |
| Community & Social Service | 50 (100.0%) | 0 (0.0%) |
| Education, Arts & Media | 50 (100.0%) | 0 (0.0%) |
| Legal Services & Support | 0 (0.0%) | 0 (0.0%) |
| Education Instruction & Library | 0 (0.0%) | 0 (0.0%) |
| Arts, Media & Entertainment | 0 (0.0%) | 0 (0.0%) |
| Health Diagnosing & Treating | 0 (0.0%) | 0 (0.0%) |
| Health Technologists | 0 (0.0%) | 0 (0.0%) |
| Total (Category) | 50 (100.0%) | 0 (0.0%) |
| Total (Overall) | 152 (40.3%) | 225 (59.7%) |
Services Occupations
The most common Services occupations in Savageville are , and Cleaning & Maintenance (35 | 9.3%).
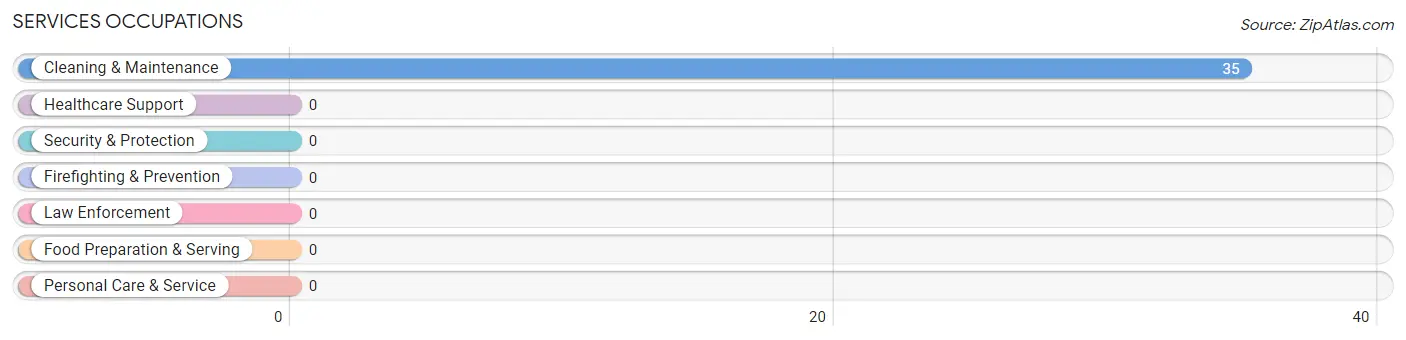
Services Occupations by Sex
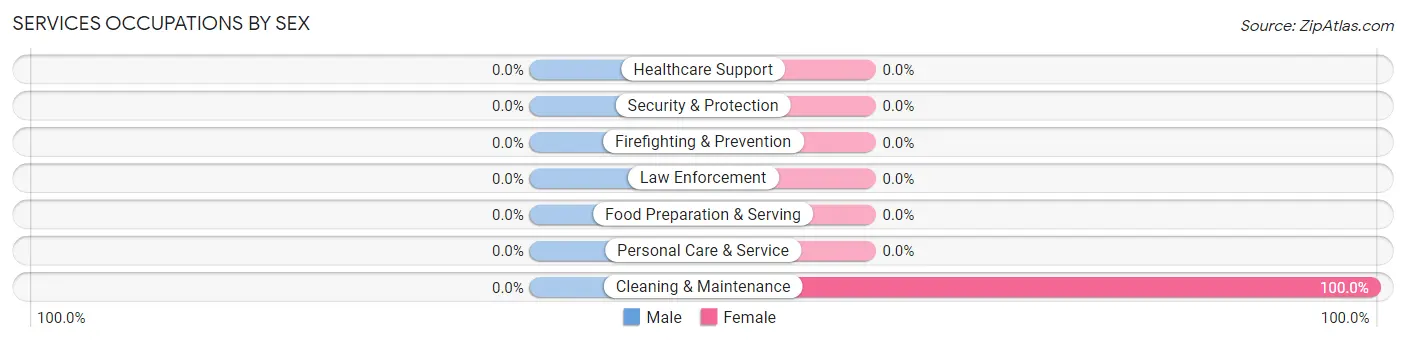
| Occupation | Male | Female |
| Healthcare Support | 0 (0.0%) | 0 (0.0%) |
| Security & Protection | 0 (0.0%) | 0 (0.0%) |
| Firefighting & Prevention | 0 (0.0%) | 0 (0.0%) |
| Law Enforcement | 0 (0.0%) | 0 (0.0%) |
| Food Preparation & Serving | 0 (0.0%) | 0 (0.0%) |
| Cleaning & Maintenance | 0 (0.0%) | 35 (100.0%) |
| Personal Care & Service | 0 (0.0%) | 0 (0.0%) |
| Total (Category) | 0 (0.0%) | 35 (100.0%) |
| Total (Overall) | 152 (40.3%) | 225 (59.7%) |
Sales and Office Occupations
The most common Sales and Office occupations in Savageville are Office & Administration (103 | 27.3%), and Sales & Related (57 | 15.1%).
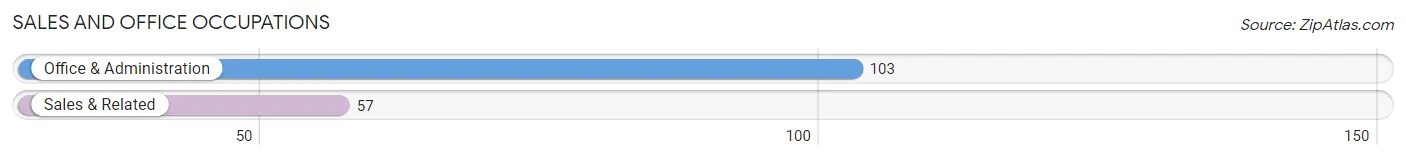
Sales and Office Occupations by Sex
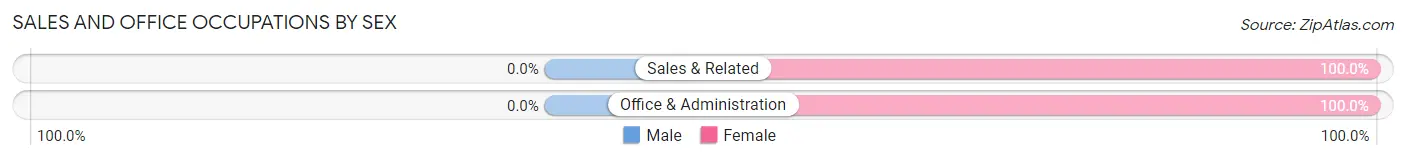
| Occupation | Male | Female |
| Sales & Related | 0 (0.0%) | 57 (100.0%) |
| Office & Administration | 0 (0.0%) | 103 (100.0%) |
| Total (Category) | 0 (0.0%) | 160 (100.0%) |
| Total (Overall) | 152 (40.3%) | 225 (59.7%) |
Natural Resources, Construction and Maintenance Occupations
The most common Natural Resources, Construction and Maintenance occupations in Savageville are Installation, Maintenance & Repair (62 | 16.5%), and Farming, Fishing & Forestry (30 | 8.0%).

Natural Resources, Construction and Maintenance Occupations by Sex
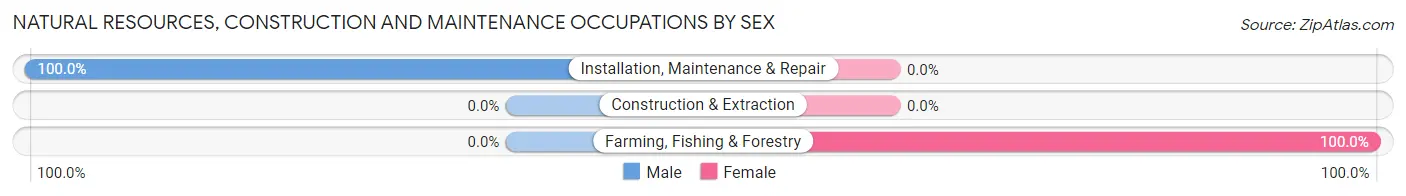
| Occupation | Male | Female |
| Farming, Fishing & Forestry | 0 (0.0%) | 30 (100.0%) |
| Construction & Extraction | 0 (0.0%) | 0 (0.0%) |
| Installation, Maintenance & Repair | 62 (100.0%) | 0 (0.0%) |
| Total (Category) | 62 (67.4%) | 30 (32.6%) |
| Total (Overall) | 152 (40.3%) | 225 (59.7%) |
Production, Transportation and Moving Occupations
The most common Production, Transportation and Moving occupations in Savageville are , and Transportation (40 | 10.6%).
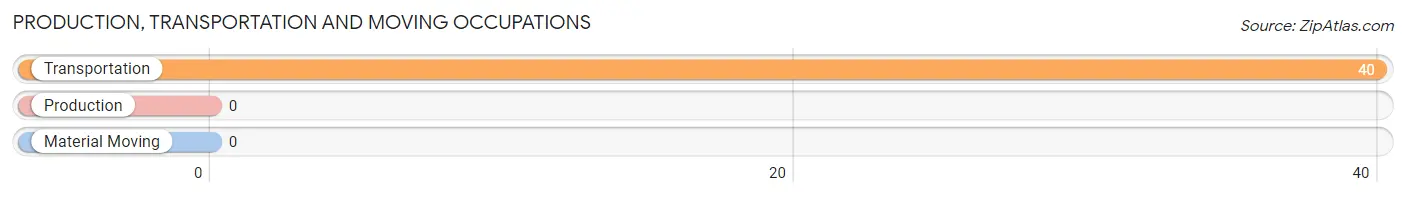
Production, Transportation and Moving Occupations by Sex
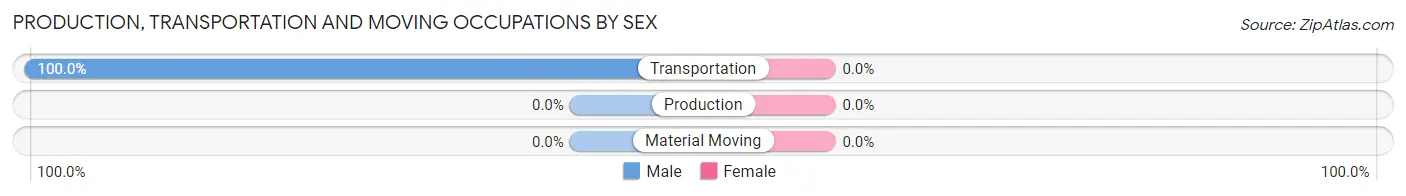
| Occupation | Male | Female |
| Production | 0 (0.0%) | 0 (0.0%) |
| Transportation | 40 (100.0%) | 0 (0.0%) |
| Material Moving | 0 (0.0%) | 0 (0.0%) |
| Total (Category) | 40 (100.0%) | 0 (0.0%) |
| Total (Overall) | 152 (40.3%) | 225 (59.7%) |
Employment Industries by Sex in Savageville
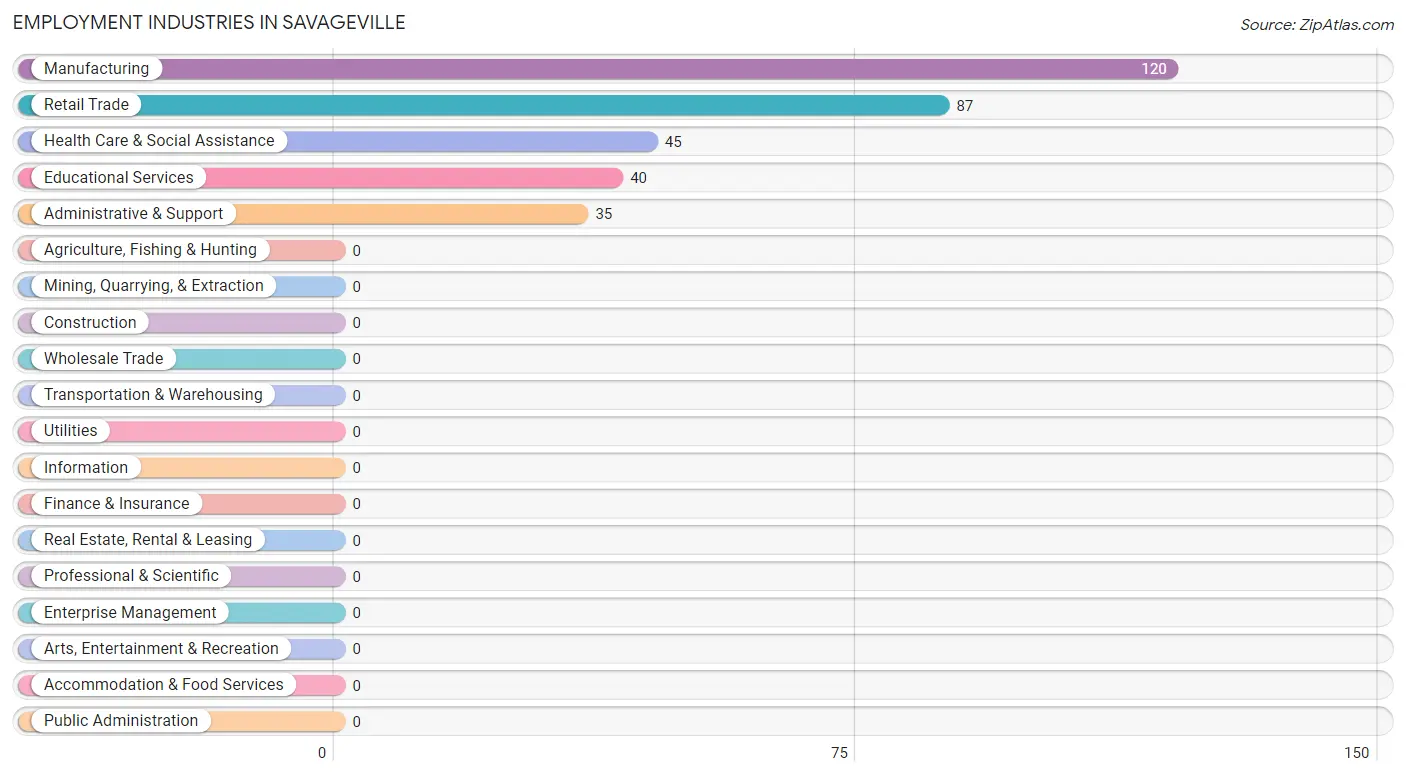
Employment Industries in Savageville
The major employment industries in Savageville include Manufacturing (120 | 31.8%), Retail Trade (87 | 23.1%), Health Care & Social Assistance (45 | 11.9%), Educational Services (40 | 10.6%), and Administrative & Support (35 | 9.3%).
Employment Industries by Sex in Savageville
The Savageville industries that see more men than women are Educational Services (100.0%), and Manufacturing (51.7%), whereas the industries that tend to have a higher number of women are Retail Trade (100.0%), Administrative & Support (100.0%), and Health Care & Social Assistance (100.0%).
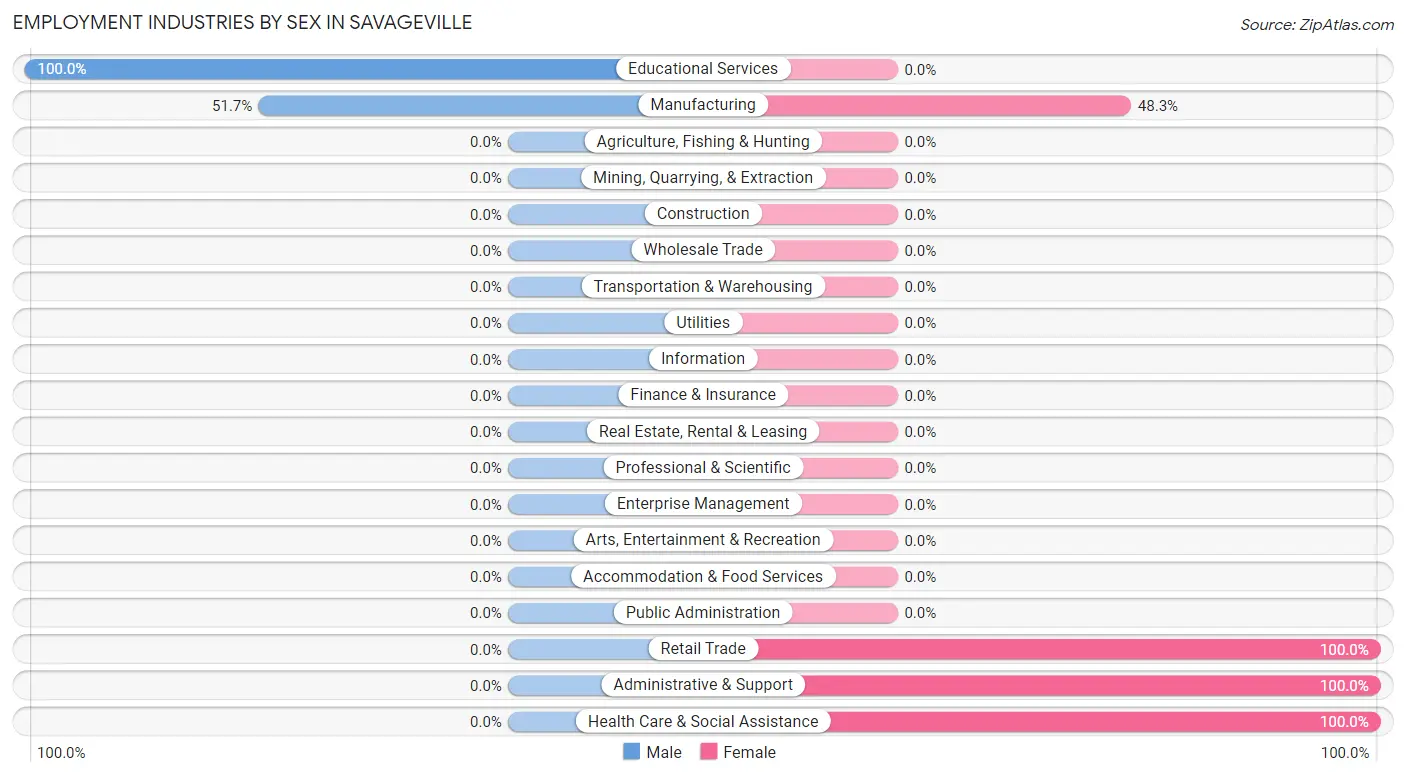
| Industry | Male | Female |
| Agriculture, Fishing & Hunting | 0 (0.0%) | 0 (0.0%) |
| Mining, Quarrying, & Extraction | 0 (0.0%) | 0 (0.0%) |
| Construction | 0 (0.0%) | 0 (0.0%) |
| Manufacturing | 62 (51.7%) | 58 (48.3%) |
| Wholesale Trade | 0 (0.0%) | 0 (0.0%) |
| Retail Trade | 0 (0.0%) | 87 (100.0%) |
| Transportation & Warehousing | 0 (0.0%) | 0 (0.0%) |
| Utilities | 0 (0.0%) | 0 (0.0%) |
| Information | 0 (0.0%) | 0 (0.0%) |
| Finance & Insurance | 0 (0.0%) | 0 (0.0%) |
| Real Estate, Rental & Leasing | 0 (0.0%) | 0 (0.0%) |
| Professional & Scientific | 0 (0.0%) | 0 (0.0%) |
| Enterprise Management | 0 (0.0%) | 0 (0.0%) |
| Administrative & Support | 0 (0.0%) | 35 (100.0%) |
| Educational Services | 40 (100.0%) | 0 (0.0%) |
| Health Care & Social Assistance | 0 (0.0%) | 45 (100.0%) |
| Arts, Entertainment & Recreation | 0 (0.0%) | 0 (0.0%) |
| Accommodation & Food Services | 0 (0.0%) | 0 (0.0%) |
| Public Administration | 0 (0.0%) | 0 (0.0%) |
| Total | 152 (40.3%) | 225 (59.7%) |
Education in Savageville
School Enrollment in Savageville
The most common levels of schooling among the 158 students in Savageville are college / undergraduate (57 | 36.1%), elementary school (51 | 32.3%), and middle school (50 | 31.7%).
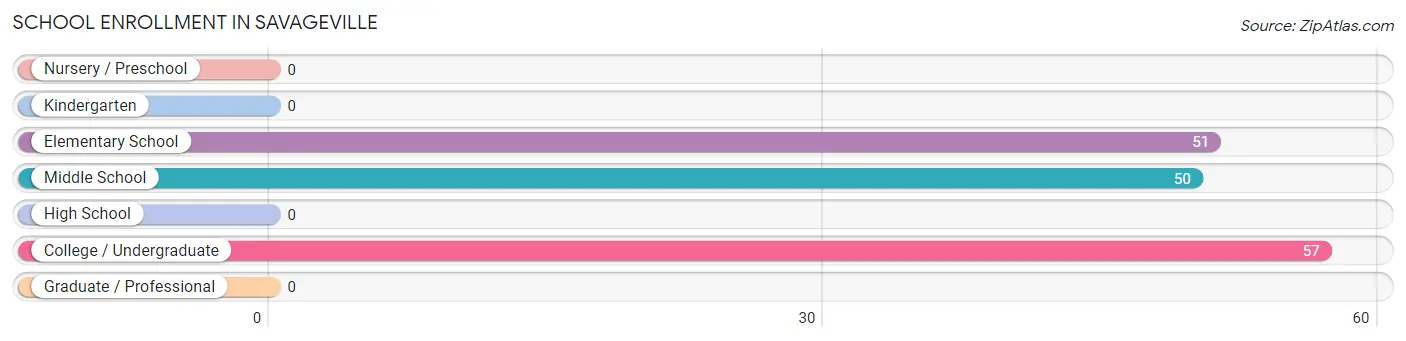
| School Level | # Students | % Students |
| Nursery / Preschool | 0 | 0.0% |
| Kindergarten | 0 | 0.0% |
| Elementary School | 51 | 32.3% |
| Middle School | 50 | 31.7% |
| High School | 0 | 0.0% |
| College / Undergraduate | 57 | 36.1% |
| Graduate / Professional | 0 | 0.0% |
| Total | 158 | 100.0% |
School Enrollment by Age by Funding Source in Savageville
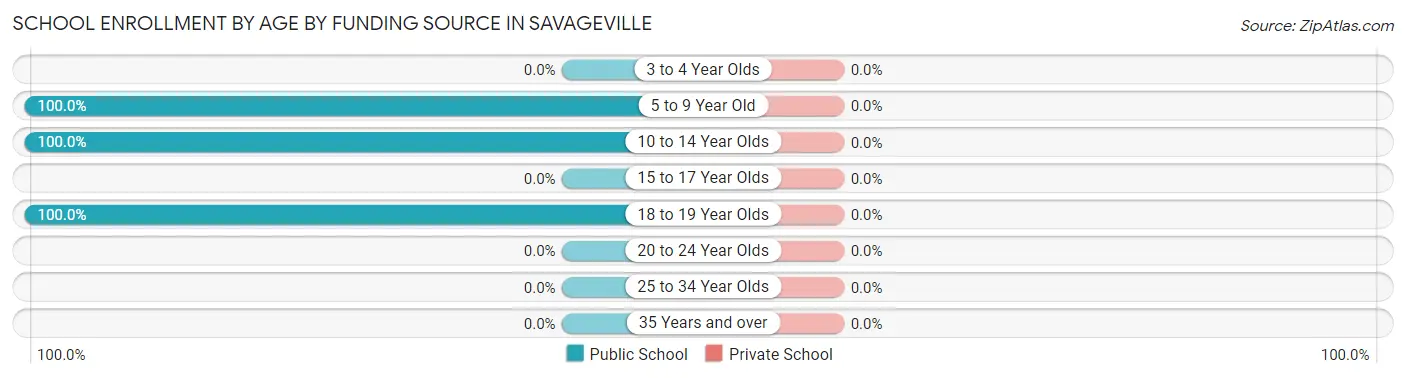
| Age Bracket | Public School | Private School |
| 3 to 4 Year Olds | 0 (0.0%) | 0 (0.0%) |
| 5 to 9 Year Old | 51 (100.0%) | 0 (0.0%) |
| 10 to 14 Year Olds | 50 (100.0%) | 0 (0.0%) |
| 15 to 17 Year Olds | 0 (0.0%) | 0 (0.0%) |
| 18 to 19 Year Olds | 57 (100.0%) | 0 (0.0%) |
| 20 to 24 Year Olds | 0 (0.0%) | 0 (0.0%) |
| 25 to 34 Year Olds | 0 (0.0%) | 0 (0.0%) |
| 35 Years and over | 0 (0.0%) | 0 (0.0%) |
| Total | 158 (100.0%) | 0 (0.0%) |
Educational Attainment by Field of Study in Savageville
Social sciences (50 | 64.1%), and education (28 | 35.9%) are the most common fields of study among 78 individuals in Savageville who have obtained a bachelor's degree or higher.
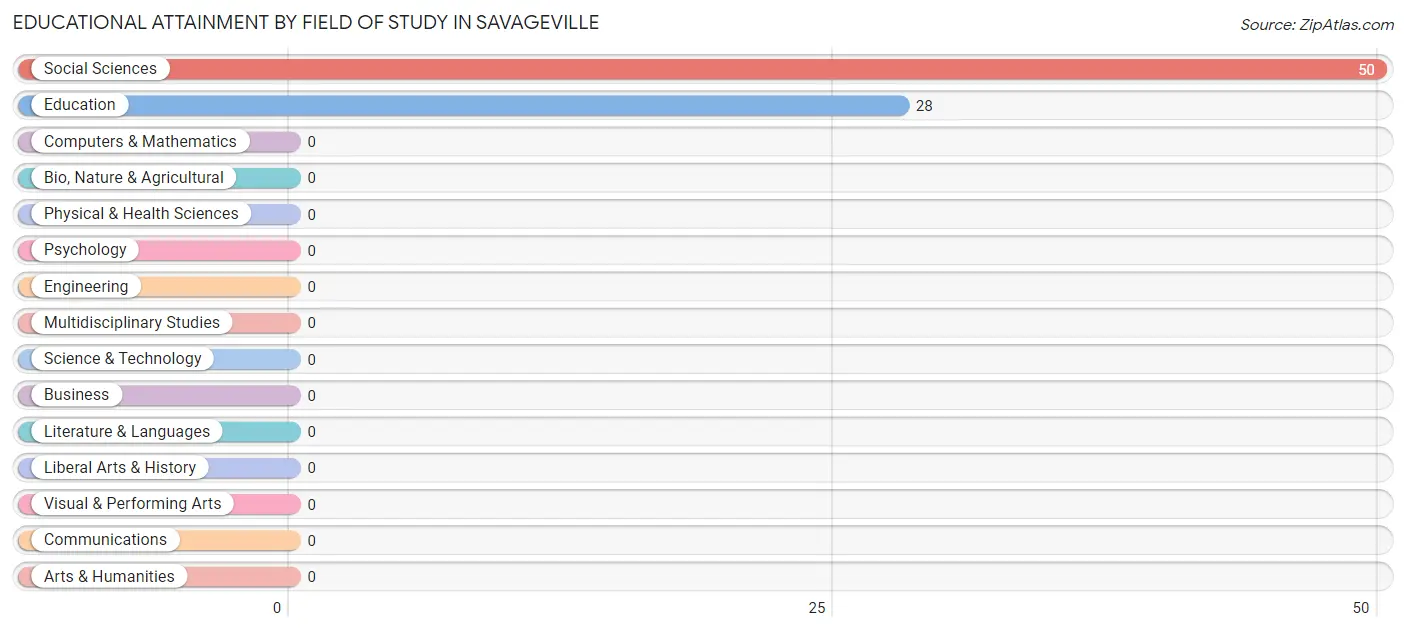
| Field of Study | # Graduates | % Graduates |
| Computers & Mathematics | 0 | 0.0% |
| Bio, Nature & Agricultural | 0 | 0.0% |
| Physical & Health Sciences | 0 | 0.0% |
| Psychology | 0 | 0.0% |
| Social Sciences | 50 | 64.1% |
| Engineering | 0 | 0.0% |
| Multidisciplinary Studies | 0 | 0.0% |
| Science & Technology | 0 | 0.0% |
| Business | 0 | 0.0% |
| Education | 28 | 35.9% |
| Literature & Languages | 0 | 0.0% |
| Liberal Arts & History | 0 | 0.0% |
| Visual & Performing Arts | 0 | 0.0% |
| Communications | 0 | 0.0% |
| Arts & Humanities | 0 | 0.0% |
| Total | 78 | 100.0% |
Transportation & Commute in Savageville
Vehicle Availability by Sex in Savageville
The most prevalent vehicle ownership categories in Savageville are males with 3 vehicles (90, accounting for 59.2%) and females with 3 vehicles (167, making up 40.0%).
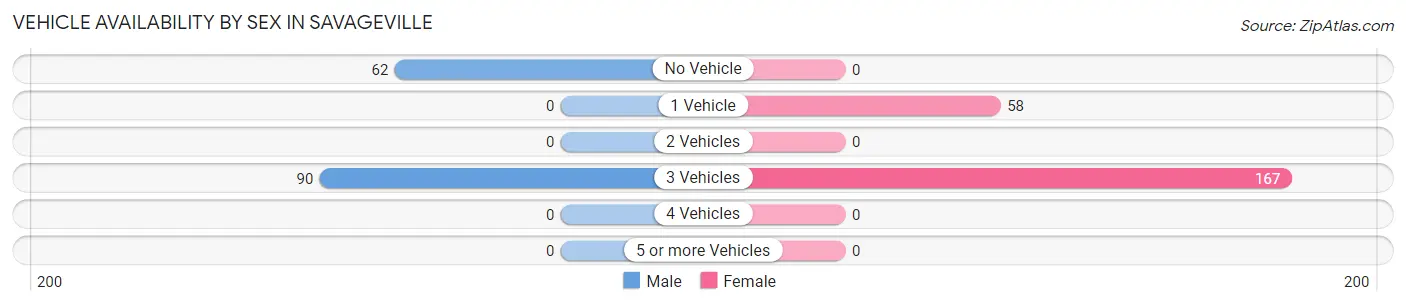
| Vehicles Available | Male | Female |
| No Vehicle | 62 (40.8%) | 0 (0.0%) |
| 1 Vehicle | 0 (0.0%) | 58 (25.8%) |
| 2 Vehicles | 0 (0.0%) | 0 (0.0%) |
| 3 Vehicles | 90 (59.2%) | 167 (74.2%) |
| 4 Vehicles | 0 (0.0%) | 0 (0.0%) |
| 5 or more Vehicles | 0 (0.0%) | 0 (0.0%) |
| Total | 152 (100.0%) | 225 (100.0%) |
Commute Time in Savageville
The most frequently occuring commute durations in Savageville are 45 to 59 minutes (97 commuters, 25.7%), 30 to 34 minutes (88 commuters, 23.3%), and 20 to 24 minutes (85 commuters, 22.6%).
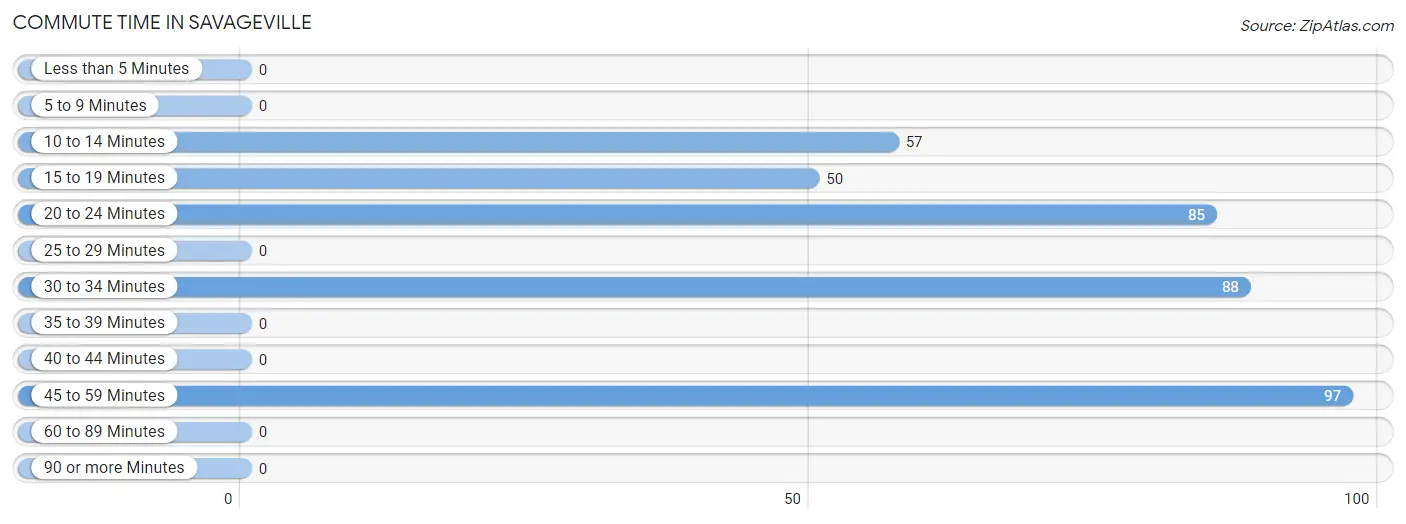
| Commute Time | # Commuters | % Commuters |
| Less than 5 Minutes | 0 | 0.0% |
| 5 to 9 Minutes | 0 | 0.0% |
| 10 to 14 Minutes | 57 | 15.1% |
| 15 to 19 Minutes | 50 | 13.3% |
| 20 to 24 Minutes | 85 | 22.6% |
| 25 to 29 Minutes | 0 | 0.0% |
| 30 to 34 Minutes | 88 | 23.3% |
| 35 to 39 Minutes | 0 | 0.0% |
| 40 to 44 Minutes | 0 | 0.0% |
| 45 to 59 Minutes | 97 | 25.7% |
| 60 to 89 Minutes | 0 | 0.0% |
| 90 or more Minutes | 0 | 0.0% |
Commute Time by Sex in Savageville
The most common commute times in Savageville are 45 to 59 minutes (62 commuters, 40.8%) for males and 30 to 34 minutes (88 commuters, 39.1%) for females.
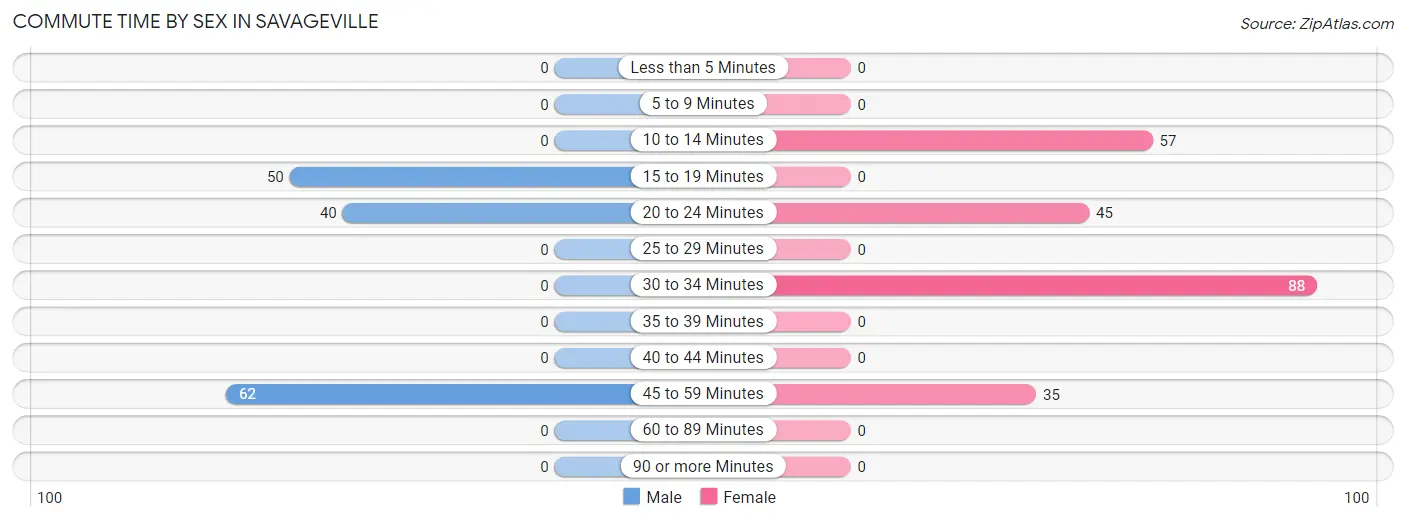
| Commute Time | Male | Female |
| Less than 5 Minutes | 0 (0.0%) | 0 (0.0%) |
| 5 to 9 Minutes | 0 (0.0%) | 0 (0.0%) |
| 10 to 14 Minutes | 0 (0.0%) | 57 (25.3%) |
| 15 to 19 Minutes | 50 (32.9%) | 0 (0.0%) |
| 20 to 24 Minutes | 40 (26.3%) | 45 (20.0%) |
| 25 to 29 Minutes | 0 (0.0%) | 0 (0.0%) |
| 30 to 34 Minutes | 0 (0.0%) | 88 (39.1%) |
| 35 to 39 Minutes | 0 (0.0%) | 0 (0.0%) |
| 40 to 44 Minutes | 0 (0.0%) | 0 (0.0%) |
| 45 to 59 Minutes | 62 (40.8%) | 35 (15.6%) |
| 60 to 89 Minutes | 0 (0.0%) | 0 (0.0%) |
| 90 or more Minutes | 0 (0.0%) | 0 (0.0%) |
Time of Departure to Work by Sex in Savageville
The most frequent times of departure to work in Savageville are 12:00 AM to 4:59 AM (62, 40.8%) for males and 8:00 AM to 8:29 AM (75, 33.3%) for females.
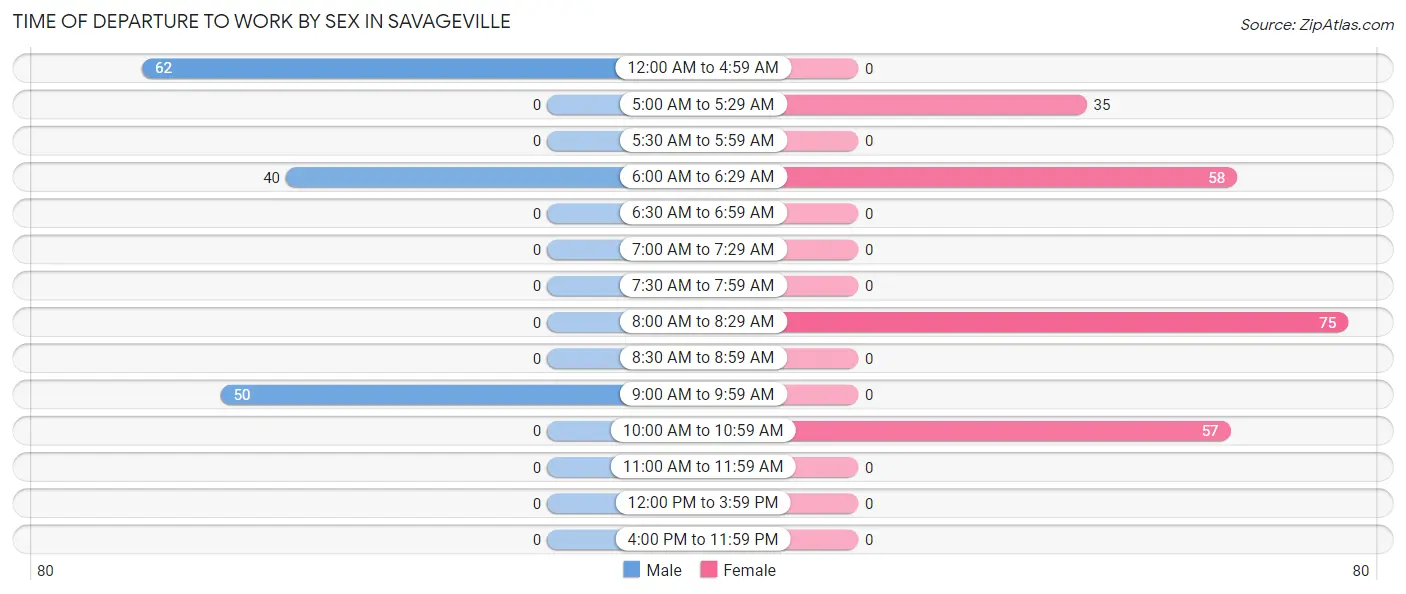
| Time of Departure | Male | Female |
| 12:00 AM to 4:59 AM | 62 (40.8%) | 0 (0.0%) |
| 5:00 AM to 5:29 AM | 0 (0.0%) | 35 (15.6%) |
| 5:30 AM to 5:59 AM | 0 (0.0%) | 0 (0.0%) |
| 6:00 AM to 6:29 AM | 40 (26.3%) | 58 (25.8%) |
| 6:30 AM to 6:59 AM | 0 (0.0%) | 0 (0.0%) |
| 7:00 AM to 7:29 AM | 0 (0.0%) | 0 (0.0%) |
| 7:30 AM to 7:59 AM | 0 (0.0%) | 0 (0.0%) |
| 8:00 AM to 8:29 AM | 0 (0.0%) | 75 (33.3%) |
| 8:30 AM to 8:59 AM | 0 (0.0%) | 0 (0.0%) |
| 9:00 AM to 9:59 AM | 50 (32.9%) | 0 (0.0%) |
| 10:00 AM to 10:59 AM | 0 (0.0%) | 57 (25.3%) |
| 11:00 AM to 11:59 AM | 0 (0.0%) | 0 (0.0%) |
| 12:00 PM to 3:59 PM | 0 (0.0%) | 0 (0.0%) |
| 4:00 PM to 11:59 PM | 0 (0.0%) | 0 (0.0%) |
| Total | 152 (100.0%) | 225 (100.0%) |
Housing Occupancy in Savageville
Occupancy by Ownership in Savageville
Of the total 233 dwellings in Savageville, owner-occupied units account for 113 (48.5%), while renter-occupied units make up 120 (51.5%).
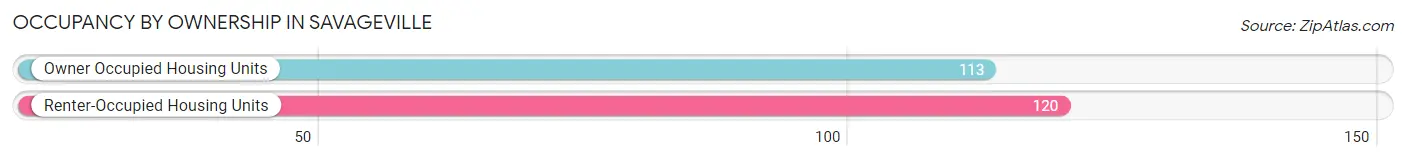
| Occupancy | # Housing Units | % Housing Units |
| Owner Occupied Housing Units | 113 | 48.5% |
| Renter-Occupied Housing Units | 120 | 51.5% |
| Total Occupied Housing Units | 233 | 100.0% |
Occupancy by Household Size in Savageville
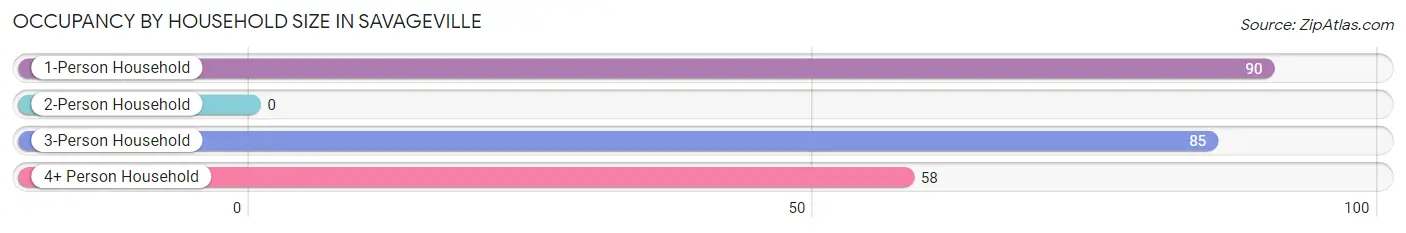
| Household Size | # Housing Units | % Housing Units |
| 1-Person Household | 90 | 38.6% |
| 2-Person Household | 0 | 0.0% |
| 3-Person Household | 85 | 36.5% |
| 4+ Person Household | 58 | 24.9% |
| Total Housing Units | 233 | 100.0% |
Occupancy by Ownership by Household Size in Savageville
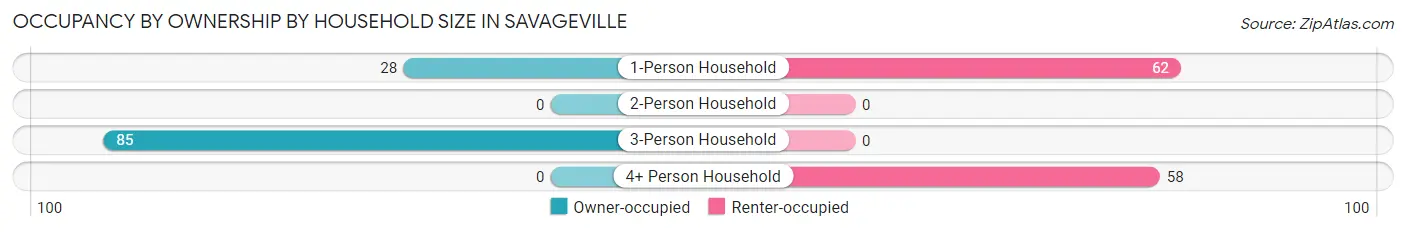
| Household Size | Owner-occupied | Renter-occupied |
| 1-Person Household | 28 (31.1%) | 62 (68.9%) |
| 2-Person Household | 0 (0.0%) | 0 (0.0%) |
| 3-Person Household | 85 (100.0%) | 0 (0.0%) |
| 4+ Person Household | 0 (0.0%) | 58 (100.0%) |
| Total Housing Units | 113 (48.5%) | 120 (51.5%) |
Occupancy by Educational Attainment in Savageville
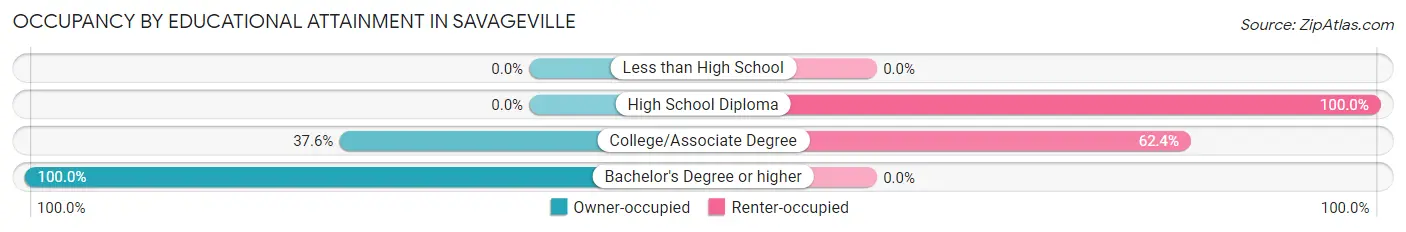
| Household Size | Owner-occupied | Renter-occupied |
| Less than High School | 0 (0.0%) | 0 (0.0%) |
| High School Diploma | 0 (0.0%) | 62 (100.0%) |
| College/Associate Degree | 35 (37.6%) | 58 (62.4%) |
| Bachelor's Degree or higher | 78 (100.0%) | 0 (0.0%) |
Occupancy by Age of Householder in Savageville
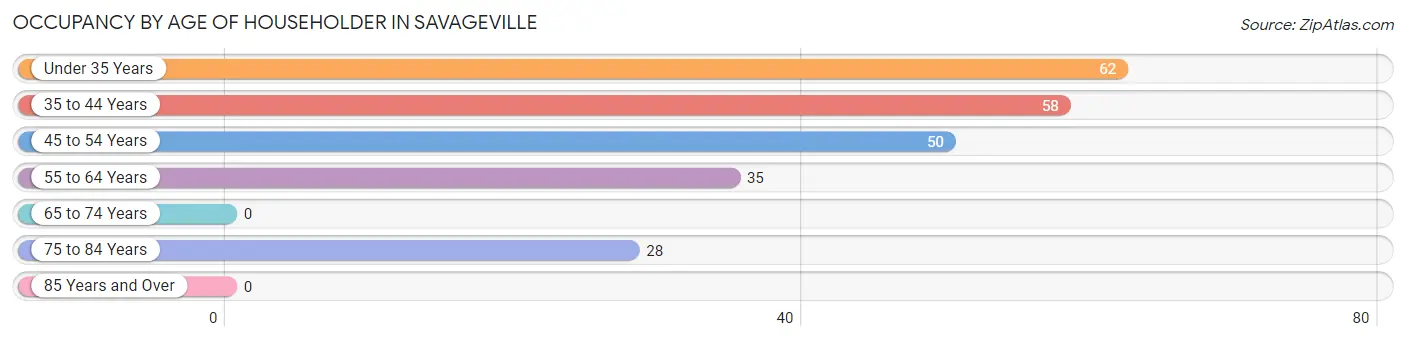
| Age Bracket | # Households | % Households |
| Under 35 Years | 62 | 26.6% |
| 35 to 44 Years | 58 | 24.9% |
| 45 to 54 Years | 50 | 21.5% |
| 55 to 64 Years | 35 | 15.0% |
| 65 to 74 Years | 0 | 0.0% |
| 75 to 84 Years | 28 | 12.0% |
| 85 Years and Over | 0 | 0.0% |
| Total | 233 | 100.0% |
Housing Finances in Savageville
Median Income by Occupancy in Savageville
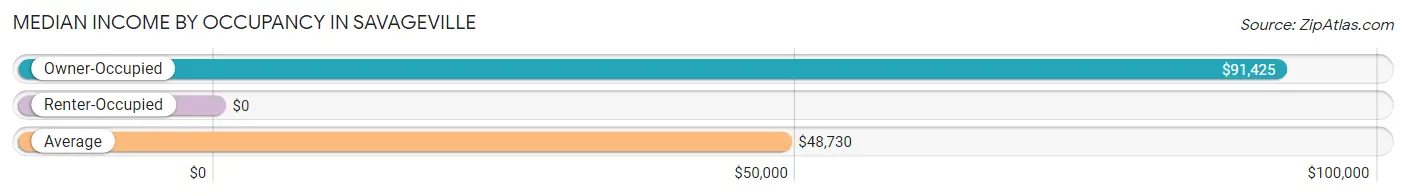
| Occupancy Type | # Households | Median Income |
| Owner-Occupied | 113 (48.5%) | $91,425 |
| Renter-Occupied | 120 (51.5%) | $0 |
| Average | 233 (100.0%) | $48,730 |
Occupancy by Householder Income Bracket in Savageville
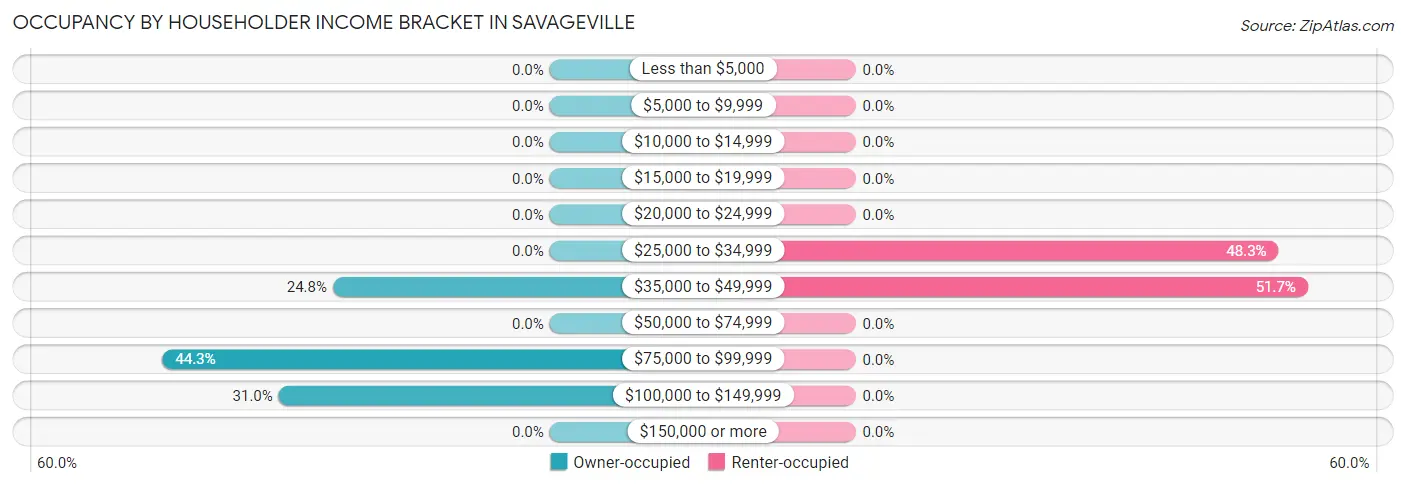
| Income Bracket | Owner-occupied | Renter-occupied |
| Less than $5,000 | 0 (0.0%) | 0 (0.0%) |
| $5,000 to $9,999 | 0 (0.0%) | 0 (0.0%) |
| $10,000 to $14,999 | 0 (0.0%) | 0 (0.0%) |
| $15,000 to $19,999 | 0 (0.0%) | 0 (0.0%) |
| $20,000 to $24,999 | 0 (0.0%) | 0 (0.0%) |
| $25,000 to $34,999 | 0 (0.0%) | 58 (48.3%) |
| $35,000 to $49,999 | 28 (24.8%) | 62 (51.7%) |
| $50,000 to $74,999 | 0 (0.0%) | 0 (0.0%) |
| $75,000 to $99,999 | 50 (44.3%) | 0 (0.0%) |
| $100,000 to $149,999 | 35 (31.0%) | 0 (0.0%) |
| $150,000 or more | 0 (0.0%) | 0 (0.0%) |
| Total | 113 (100.0%) | 120 (100.0%) |
Monthly Housing Cost Tiers in Savageville
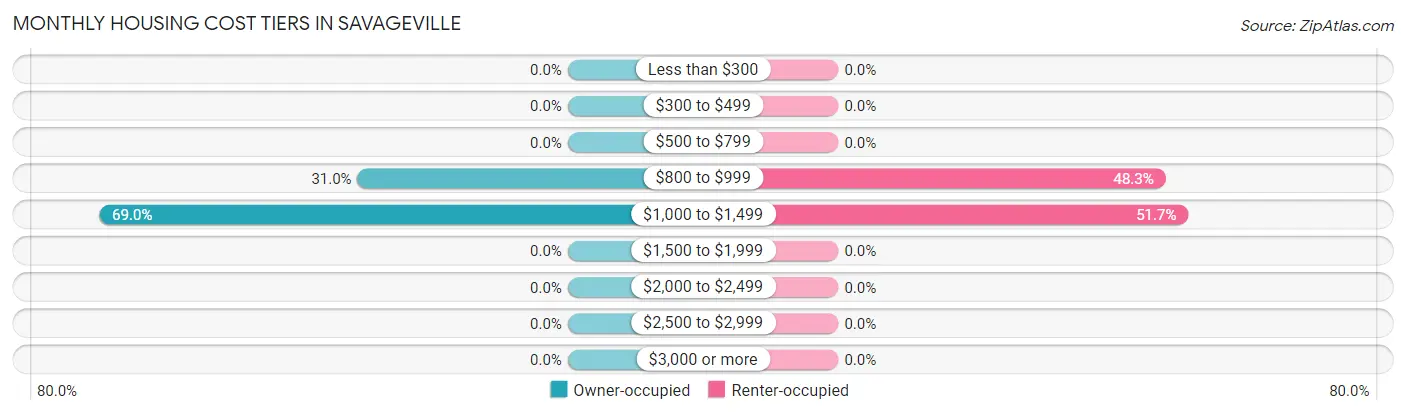
| Monthly Cost | Owner-occupied | Renter-occupied |
| Less than $300 | 0 (0.0%) | 0 (0.0%) |
| $300 to $499 | 0 (0.0%) | 0 (0.0%) |
| $500 to $799 | 0 (0.0%) | 0 (0.0%) |
| $800 to $999 | 35 (31.0%) | 58 (48.3%) |
| $1,000 to $1,499 | 78 (69.0%) | 62 (51.7%) |
| $1,500 to $1,999 | 0 (0.0%) | 0 (0.0%) |
| $2,000 to $2,499 | 0 (0.0%) | 0 (0.0%) |
| $2,500 to $2,999 | 0 (0.0%) | 0 (0.0%) |
| $3,000 or more | 0 (0.0%) | 0 (0.0%) |
| Total | 113 (100.0%) | 120 (100.0%) |
Physical Housing Characteristics in Savageville
Housing Structures in Savageville
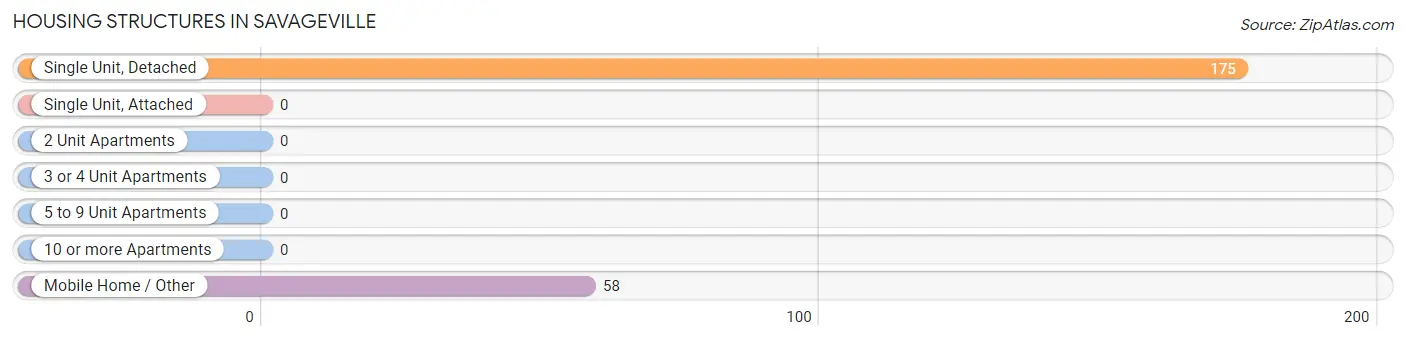
| Structure Type | # Housing Units | % Housing Units |
| Single Unit, Detached | 175 | 75.1% |
| Single Unit, Attached | 0 | 0.0% |
| 2 Unit Apartments | 0 | 0.0% |
| 3 or 4 Unit Apartments | 0 | 0.0% |
| 5 to 9 Unit Apartments | 0 | 0.0% |
| 10 or more Apartments | 0 | 0.0% |
| Mobile Home / Other | 58 | 24.9% |
| Total | 233 | 100.0% |
Housing Structures by Occupancy in Savageville
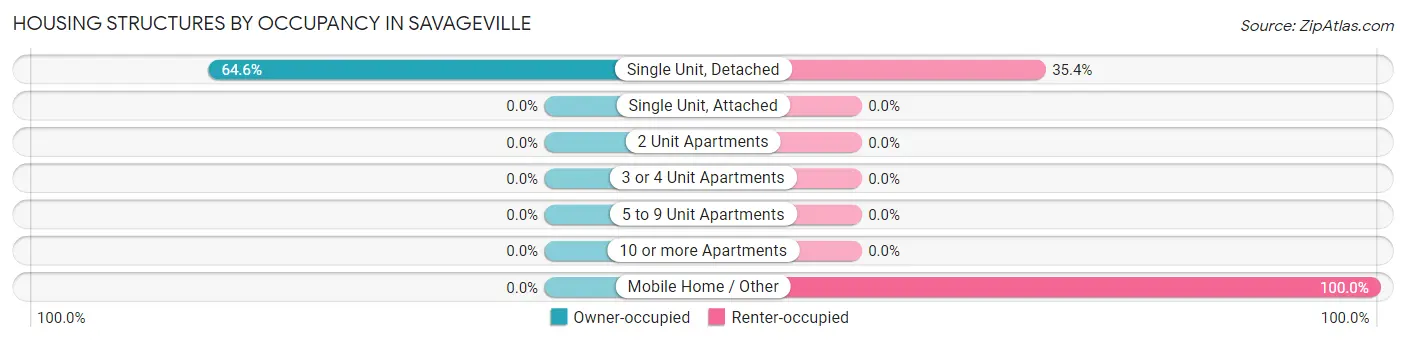
| Structure Type | Owner-occupied | Renter-occupied |
| Single Unit, Detached | 113 (64.6%) | 62 (35.4%) |
| Single Unit, Attached | 0 (0.0%) | 0 (0.0%) |
| 2 Unit Apartments | 0 (0.0%) | 0 (0.0%) |
| 3 or 4 Unit Apartments | 0 (0.0%) | 0 (0.0%) |
| 5 to 9 Unit Apartments | 0 (0.0%) | 0 (0.0%) |
| 10 or more Apartments | 0 (0.0%) | 0 (0.0%) |
| Mobile Home / Other | 0 (0.0%) | 58 (100.0%) |
| Total | 113 (48.5%) | 120 (51.5%) |
Housing Structures by Number of Rooms in Savageville
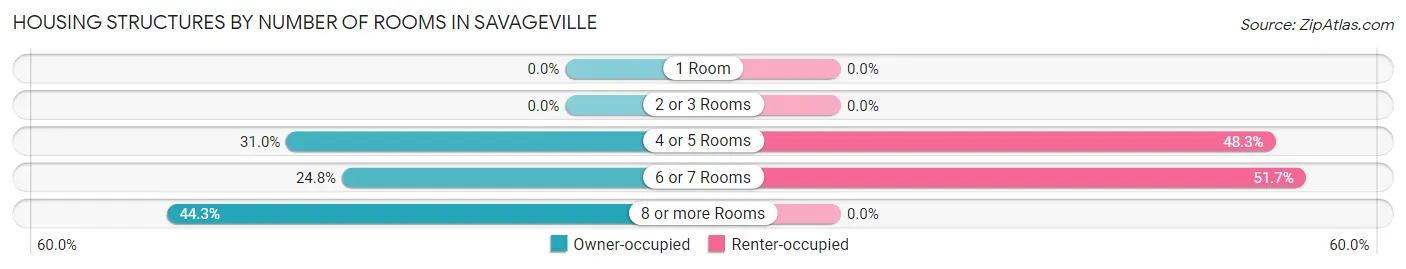
| Number of Rooms | Owner-occupied | Renter-occupied |
| 1 Room | 0 (0.0%) | 0 (0.0%) |
| 2 or 3 Rooms | 0 (0.0%) | 0 (0.0%) |
| 4 or 5 Rooms | 35 (31.0%) | 58 (48.3%) |
| 6 or 7 Rooms | 28 (24.8%) | 62 (51.7%) |
| 8 or more Rooms | 50 (44.3%) | 0 (0.0%) |
| Total | 113 (100.0%) | 120 (100.0%) |
Housing Structure by Heating Type in Savageville
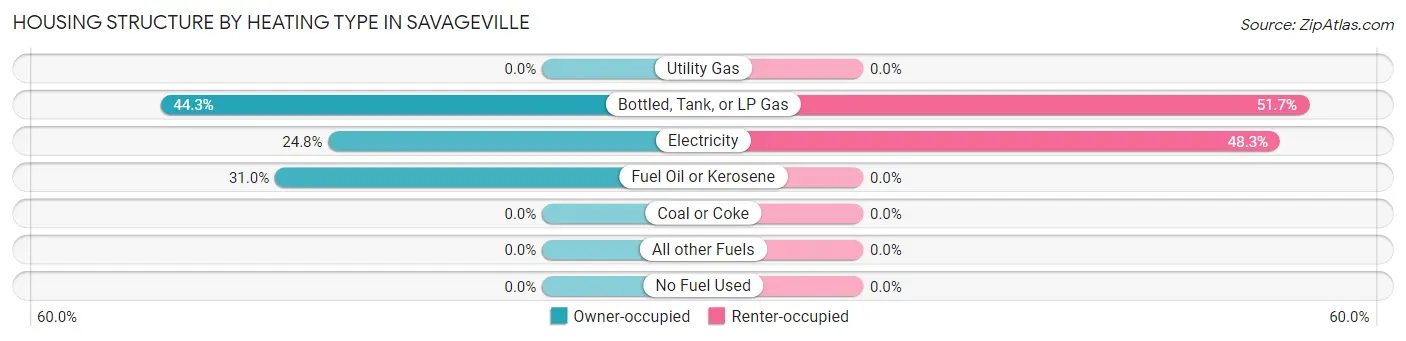
| Heating Type | Owner-occupied | Renter-occupied |
| Utility Gas | 0 (0.0%) | 0 (0.0%) |
| Bottled, Tank, or LP Gas | 50 (44.3%) | 62 (51.7%) |
| Electricity | 28 (24.8%) | 58 (48.3%) |
| Fuel Oil or Kerosene | 35 (31.0%) | 0 (0.0%) |
| Coal or Coke | 0 (0.0%) | 0 (0.0%) |
| All other Fuels | 0 (0.0%) | 0 (0.0%) |
| No Fuel Used | 0 (0.0%) | 0 (0.0%) |
| Total | 113 (100.0%) | 120 (100.0%) |
Household Vehicle Usage in Savageville
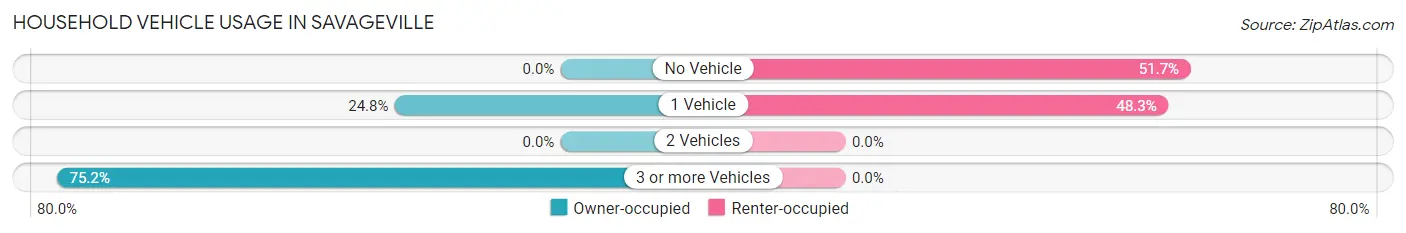
| Vehicles per Household | Owner-occupied | Renter-occupied |
| No Vehicle | 0 (0.0%) | 62 (51.7%) |
| 1 Vehicle | 28 (24.8%) | 58 (48.3%) |
| 2 Vehicles | 0 (0.0%) | 0 (0.0%) |
| 3 or more Vehicles | 85 (75.2%) | 0 (0.0%) |
| Total | 113 (100.0%) | 120 (100.0%) |
Real Estate & Mortgages in Savageville
Real Estate and Mortgage Overview in Savageville
| Characteristic | Without Mortgage | With Mortgage |
| Housing Units | 50 | 63 |
| Median Property Value | - | - |
| Median Household Income | - | - |
| Monthly Housing Costs | - | - |
| Real Estate Taxes | - | - |
Property Value by Mortgage Status in Savageville
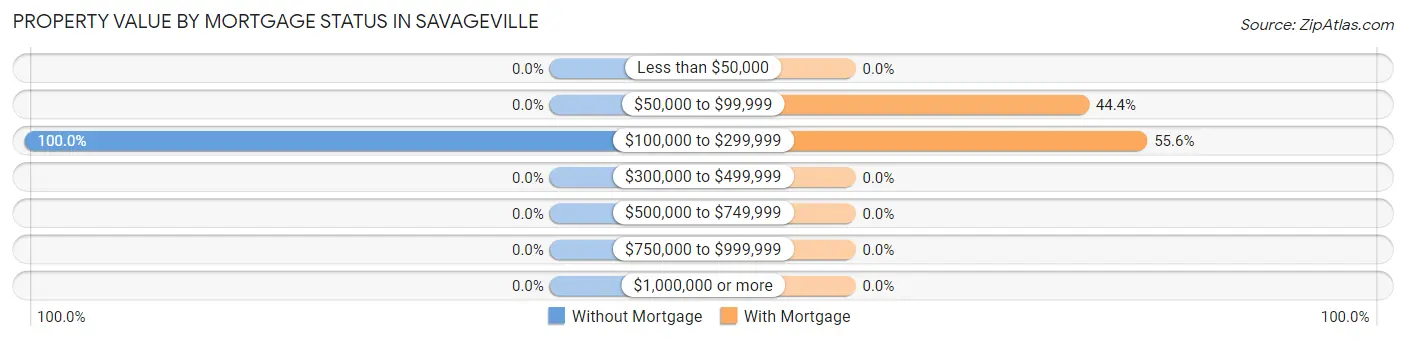
| Property Value | Without Mortgage | With Mortgage |
| Less than $50,000 | 0 (0.0%) | 0 (0.0%) |
| $50,000 to $99,999 | 0 (0.0%) | 28 (44.4%) |
| $100,000 to $299,999 | 50 (100.0%) | 35 (55.6%) |
| $300,000 to $499,999 | 0 (0.0%) | 0 (0.0%) |
| $500,000 to $749,999 | 0 (0.0%) | 0 (0.0%) |
| $750,000 to $999,999 | 0 (0.0%) | 0 (0.0%) |
| $1,000,000 or more | 0 (0.0%) | 0 (0.0%) |
| Total | 50 (100.0%) | 63 (100.0%) |
Household Income by Mortgage Status in Savageville
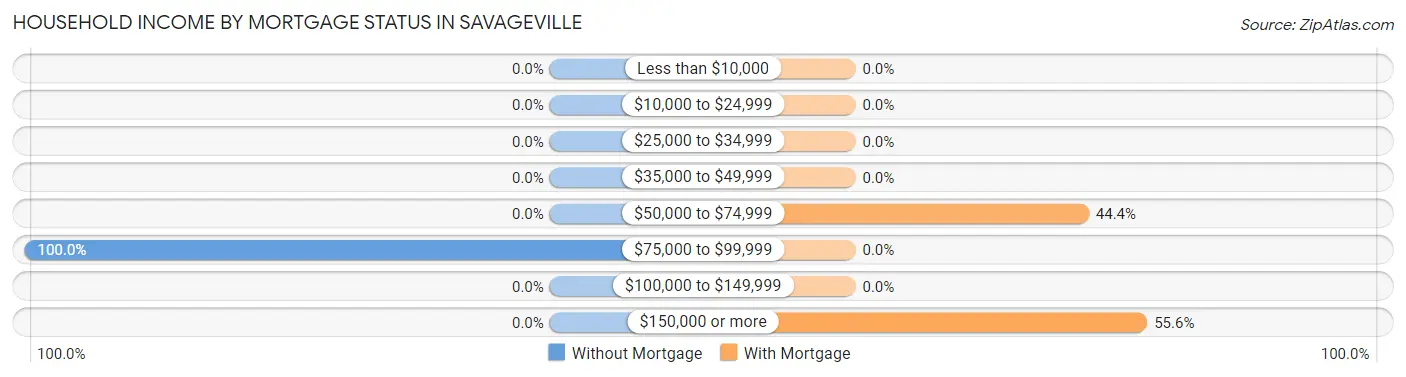
| Household Income | Without Mortgage | With Mortgage |
| Less than $10,000 | 0 (0.0%) | 0 (0.0%) |
| $10,000 to $24,999 | 0 (0.0%) | 0 (0.0%) |
| $25,000 to $34,999 | 0 (0.0%) | 0 (0.0%) |
| $35,000 to $49,999 | 0 (0.0%) | 0 (0.0%) |
| $50,000 to $74,999 | 0 (0.0%) | 28 (44.4%) |
| $75,000 to $99,999 | 50 (100.0%) | 0 (0.0%) |
| $100,000 to $149,999 | 0 (0.0%) | 0 (0.0%) |
| $150,000 or more | 0 (0.0%) | 35 (55.6%) |
| Total | 50 (100.0%) | 63 (100.0%) |
Property Value to Household Income Ratio in Savageville
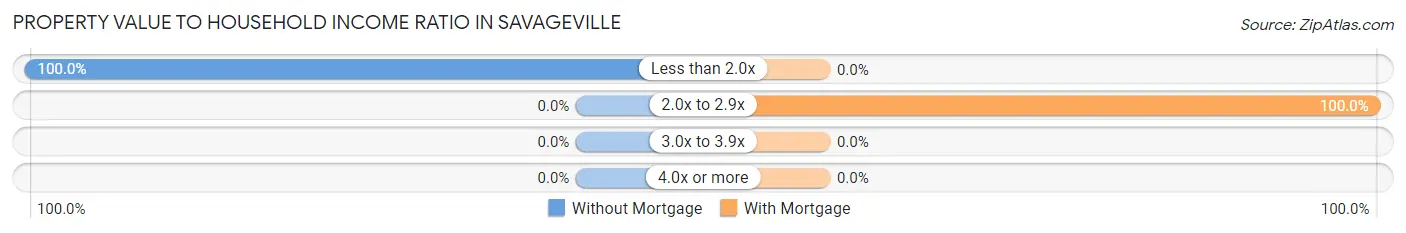
| Value-to-Income Ratio | Without Mortgage | With Mortgage |
| Less than 2.0x | 50 (100.0%) | 0 (0.0%) |
| 2.0x to 2.9x | 0 (0.0%) | 63 (100.0%) |
| 3.0x to 3.9x | 0 (0.0%) | 0 (0.0%) |
| 4.0x or more | 0 (0.0%) | 0 (0.0%) |
| Total | 50 (100.0%) | 63 (100.0%) |
Real Estate Taxes by Mortgage Status in Savageville

| Property Taxes | Without Mortgage | With Mortgage |
| Less than $800 | 0 (0.0%) | 0 (0.0%) |
| $800 to $1,499 | 50 (100.0%) | 35 (55.6%) |
| $800 to $1,499 | 0 (0.0%) | 28 (44.4%) |
| Total | 50 (100.0%) | 63 (100.0%) |
Health & Disability in Savageville
Health Insurance Coverage by Age in Savageville
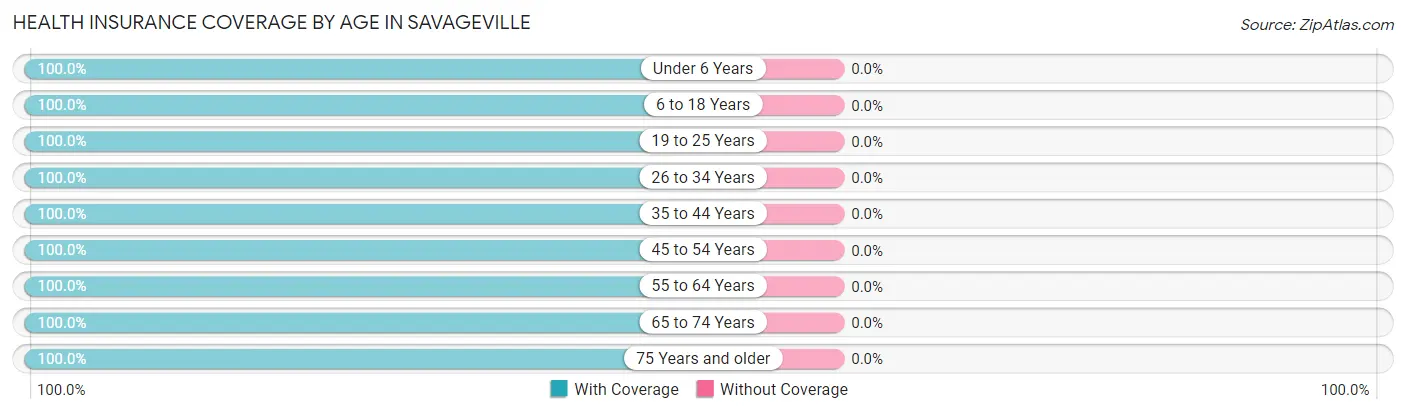
| Age Bracket | With Coverage | Without Coverage |
| Under 6 Years | 68 (100.0%) | 0 (0.0%) |
| 6 to 18 Years | 101 (100.0%) | 0 (0.0%) |
| 19 to 25 Years | 119 (100.0%) | 0 (0.0%) |
| 26 to 34 Years | 45 (100.0%) | 0 (0.0%) |
| 35 to 44 Years | 58 (100.0%) | 0 (0.0%) |
| 45 to 54 Years | 50 (100.0%) | 0 (0.0%) |
| 55 to 64 Years | 65 (100.0%) | 0 (0.0%) |
| 65 to 74 Years | 40 (100.0%) | 0 (0.0%) |
| 75 Years and older | 28 (100.0%) | 0 (0.0%) |
| Total | 574 (100.0%) | 0 (0.0%) |
Health Insurance Coverage by Citizenship Status in Savageville
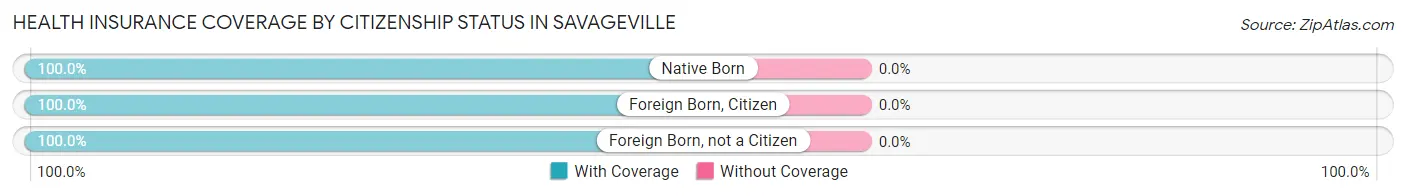
| Citizenship Status | With Coverage | Without Coverage |
| Native Born | 68 (100.0%) | 0 (0.0%) |
| Foreign Born, Citizen | 101 (100.0%) | 0 (0.0%) |
| Foreign Born, not a Citizen | 119 (100.0%) | 0 (0.0%) |
Health Insurance Coverage by Household Income in Savageville
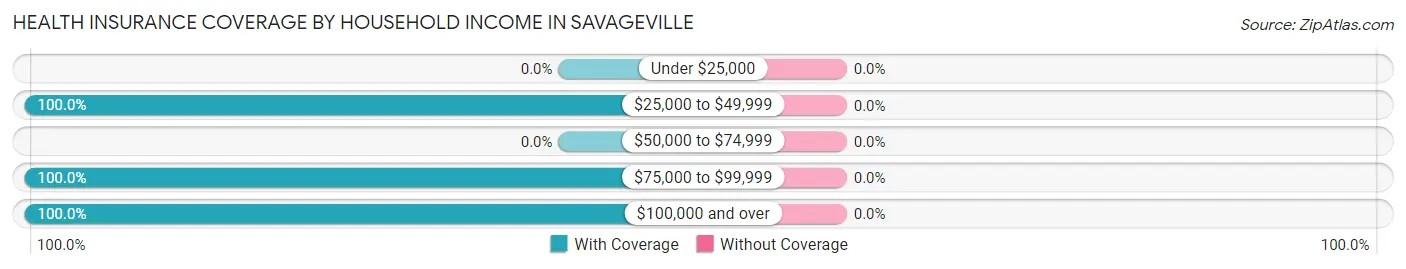
| Household Income | With Coverage | Without Coverage |
| Under $25,000 | 0 (0.0%) | 0 (0.0%) |
| $25,000 to $49,999 | 317 (100.0%) | 0 (0.0%) |
| $50,000 to $74,999 | 0 (0.0%) | 0 (0.0%) |
| $75,000 to $99,999 | 137 (100.0%) | 0 (0.0%) |
| $100,000 and over | 120 (100.0%) | 0 (0.0%) |
Public vs Private Health Insurance Coverage by Age in Savageville
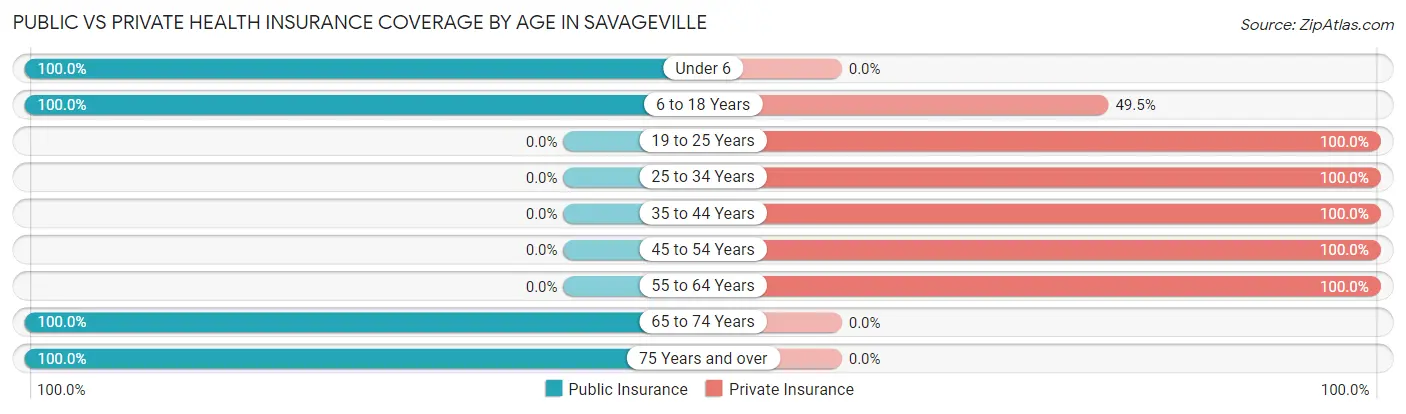
| Age Bracket | Public Insurance | Private Insurance |
| Under 6 | 68 (100.0%) | 0 (0.0%) |
| 6 to 18 Years | 101 (100.0%) | 50 (49.5%) |
| 19 to 25 Years | 0 (0.0%) | 119 (100.0%) |
| 25 to 34 Years | 0 (0.0%) | 45 (100.0%) |
| 35 to 44 Years | 0 (0.0%) | 58 (100.0%) |
| 45 to 54 Years | 0 (0.0%) | 50 (100.0%) |
| 55 to 64 Years | 0 (0.0%) | 65 (100.0%) |
| 65 to 74 Years | 40 (100.0%) | 0 (0.0%) |
| 75 Years and over | 28 (100.0%) | 0 (0.0%) |
| Total | 237 (41.3%) | 387 (67.4%) |
Disability Status by Sex by Age in Savageville
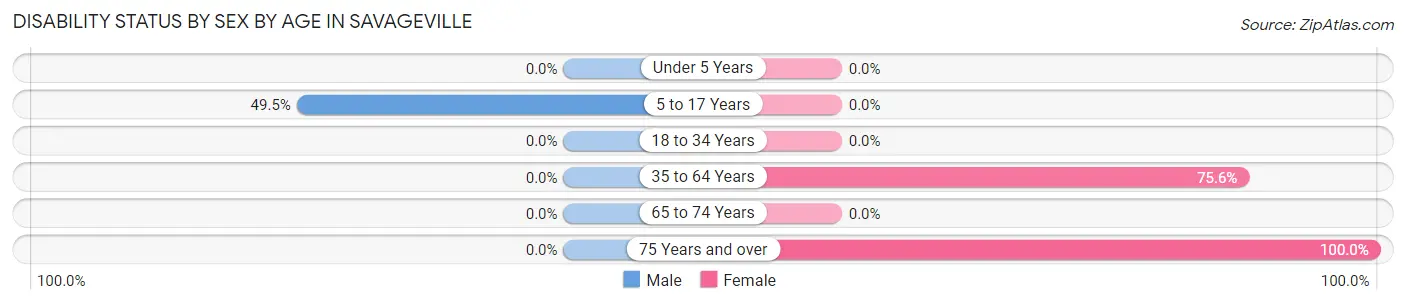
| Age Bracket | Male | Female |
| Under 5 Years | 0 (0.0%) | 0 (0.0%) |
| 5 to 17 Years | 50 (49.5%) | 0 (0.0%) |
| 18 to 34 Years | 0 (0.0%) | 0 (0.0%) |
| 35 to 64 Years | 0 (0.0%) | 93 (75.6%) |
| 65 to 74 Years | 0 (0.0%) | 0 (0.0%) |
| 75 Years and over | 0 (0.0%) | 28 (100.0%) |
Disability Class by Sex by Age in Savageville
Disability Class: Hearing Difficulty
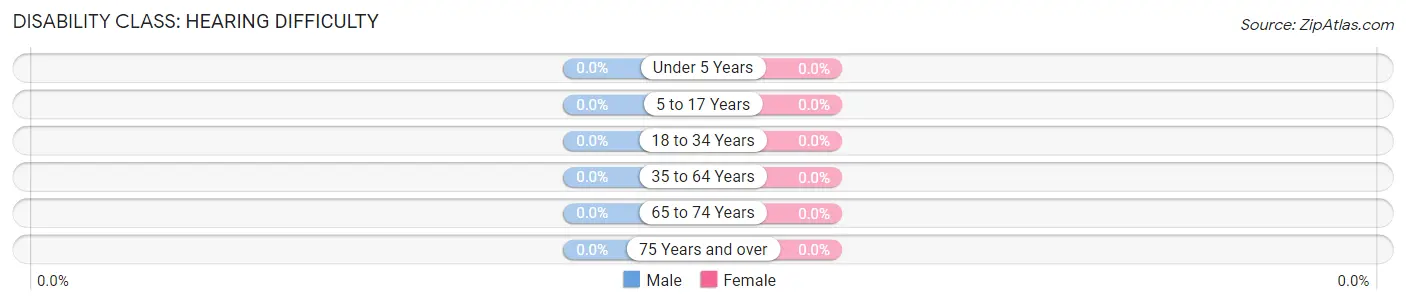
| Age Bracket | Male | Female |
| Under 5 Years | 0 (0.0%) | 0 (0.0%) |
| 5 to 17 Years | 0 (0.0%) | 0 (0.0%) |
| 18 to 34 Years | 0 (0.0%) | 0 (0.0%) |
| 35 to 64 Years | 0 (0.0%) | 0 (0.0%) |
| 65 to 74 Years | 0 (0.0%) | 0 (0.0%) |
| 75 Years and over | 0 (0.0%) | 0 (0.0%) |
Disability Class: Vision Difficulty
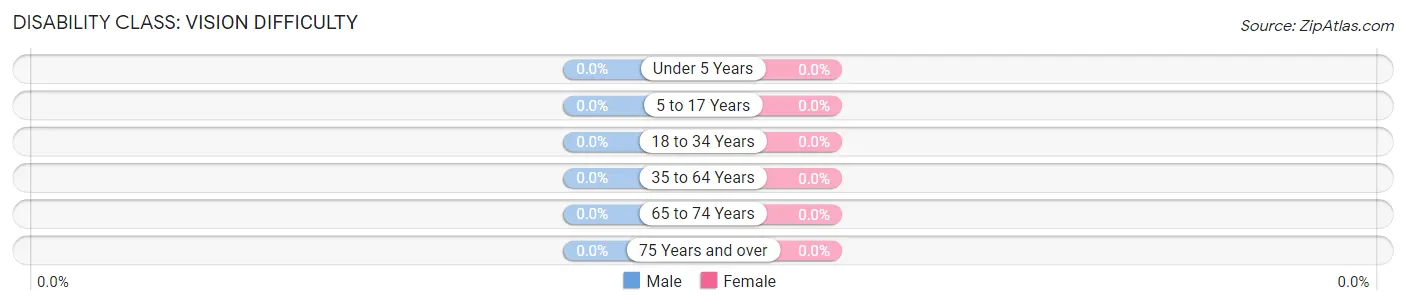
| Age Bracket | Male | Female |
| Under 5 Years | 0 (0.0%) | 0 (0.0%) |
| 5 to 17 Years | 0 (0.0%) | 0 (0.0%) |
| 18 to 34 Years | 0 (0.0%) | 0 (0.0%) |
| 35 to 64 Years | 0 (0.0%) | 0 (0.0%) |
| 65 to 74 Years | 0 (0.0%) | 0 (0.0%) |
| 75 Years and over | 0 (0.0%) | 0 (0.0%) |
Disability Class: Cognitive Difficulty
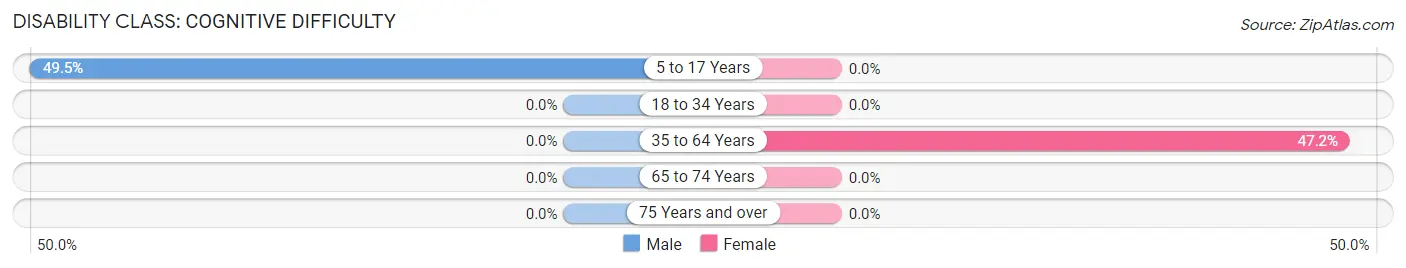
| Age Bracket | Male | Female |
| 5 to 17 Years | 50 (49.5%) | 0 (0.0%) |
| 18 to 34 Years | 0 (0.0%) | 0 (0.0%) |
| 35 to 64 Years | 0 (0.0%) | 58 (47.1%) |
| 65 to 74 Years | 0 (0.0%) | 0 (0.0%) |
| 75 Years and over | 0 (0.0%) | 0 (0.0%) |
Disability Class: Ambulatory Difficulty
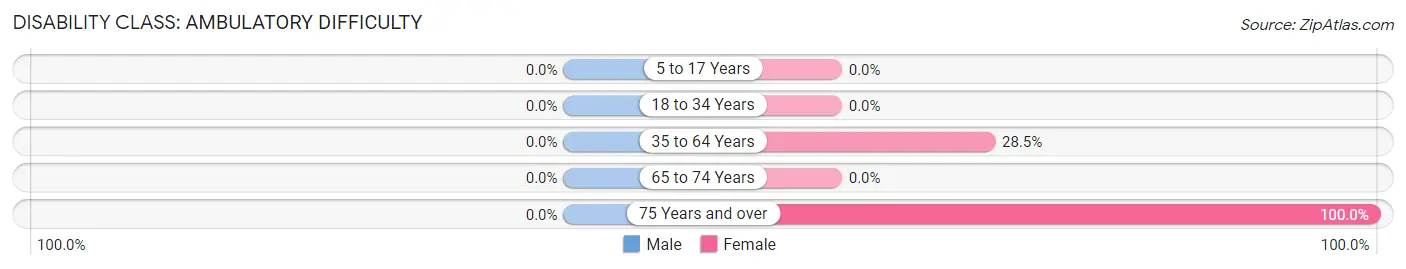
| Age Bracket | Male | Female |
| 5 to 17 Years | 0 (0.0%) | 0 (0.0%) |
| 18 to 34 Years | 0 (0.0%) | 0 (0.0%) |
| 35 to 64 Years | 0 (0.0%) | 35 (28.5%) |
| 65 to 74 Years | 0 (0.0%) | 0 (0.0%) |
| 75 Years and over | 0 (0.0%) | 28 (100.0%) |
Disability Class: Self-Care Difficulty
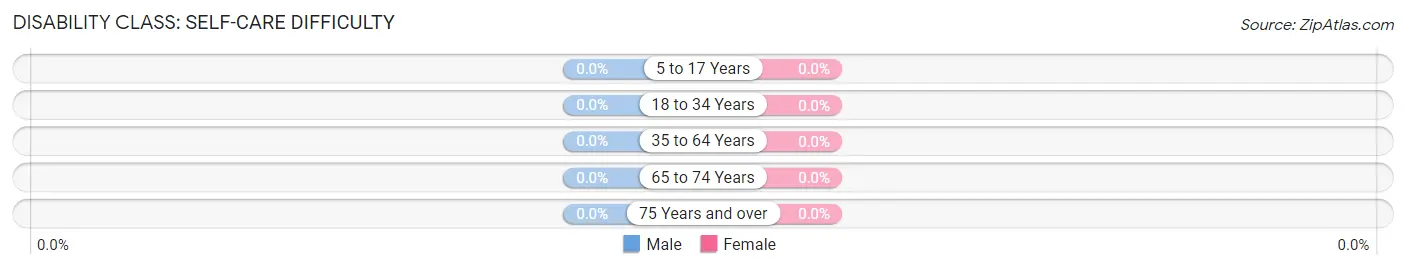
| Age Bracket | Male | Female |
| 5 to 17 Years | 0 (0.0%) | 0 (0.0%) |
| 18 to 34 Years | 0 (0.0%) | 0 (0.0%) |
| 35 to 64 Years | 0 (0.0%) | 0 (0.0%) |
| 65 to 74 Years | 0 (0.0%) | 0 (0.0%) |
| 75 Years and over | 0 (0.0%) | 0 (0.0%) |
Technology Access in Savageville
Computing Device Access in Savageville
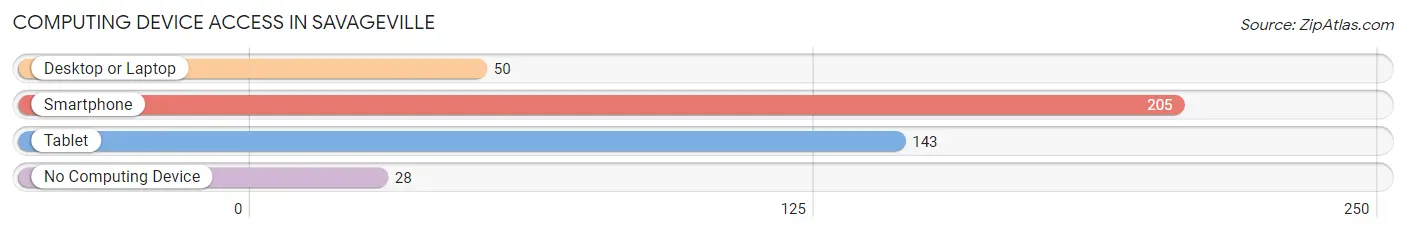
| Device Type | # Households | % Households |
| Desktop or Laptop | 50 | 21.5% |
| Smartphone | 205 | 88.0% |
| Tablet | 143 | 61.4% |
| No Computing Device | 28 | 12.0% |
| Total | 233 | 100.0% |
Internet Access in Savageville
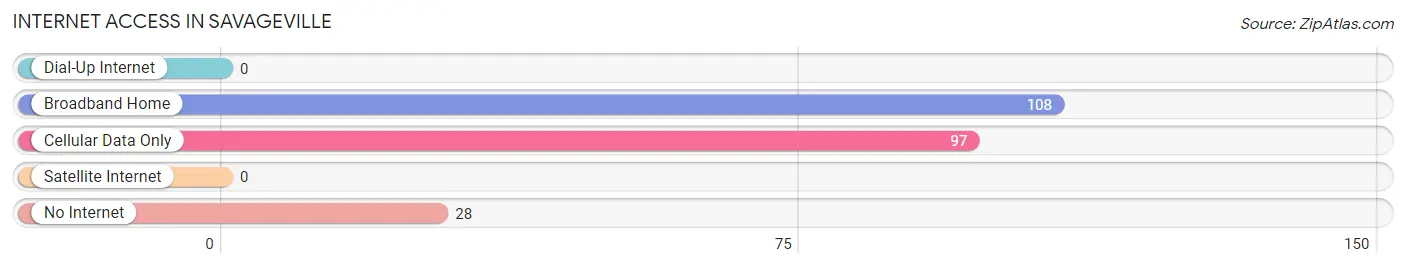
| Internet Type | # Households | % Households |
| Dial-Up Internet | 0 | 0.0% |
| Broadband Home | 108 | 46.4% |
| Cellular Data Only | 97 | 41.6% |
| Satellite Internet | 0 | 0.0% |
| No Internet | 28 | 12.0% |
| Total | 233 | 100.0% |
Savageville Summary
Savageville is an unincorporated community located in the northern part of Rockingham County, Virginia. It is situated in the Shenandoah Valley, approximately 10 miles south of Harrisonburg and 25 miles north of Staunton. The community is bordered by the North Fork of the Shenandoah River to the east and the Massanutten Mountain to the west.
History
Savageville was first settled in the late 1700s by the Savage family, who were among the first settlers in the area. The community was named after the family and was originally known as Savage’s Mill. The Savage family built a grist mill and a saw mill on the banks of the North Fork of the Shenandoah River. The mills were used to grind grain and cut lumber for the local community.
In the early 1800s, the community began to grow and the first post office was established in 1820. The post office was named Savageville and the community was officially incorporated in 1836.
In the late 1800s, the community was home to several businesses, including a general store, a blacksmith shop, a tannery, and a hotel. The hotel was a popular destination for travelers and was known for its excellent food and hospitality.
Geography
Savageville is located in the northern part of Rockingham County, Virginia. It is situated in the Shenandoah Valley, approximately 10 miles south of Harrisonburg and 25 miles north of Staunton. The community is bordered by the North Fork of the Shenandoah River to the east and the Massanutten Mountain to the west.
The terrain of the area is mostly rolling hills and valleys, with the Massanutten Mountain providing a scenic backdrop. The climate is temperate, with hot summers and cold winters. The average annual temperature is around 55 degrees Fahrenheit.
Economy
Savageville’s economy is largely based on agriculture and tourism. The area is home to several farms, which produce a variety of crops, including corn, soybeans, wheat, and hay. The community is also home to several wineries, which produce a variety of wines.
Tourism is an important part of the local economy. The area is home to several historic sites, including the Savage Mill, which is listed on the National Register of Historic Places. The community is also home to several outdoor recreation areas, including the George Washington National Forest and the Shenandoah National Park.
Demographics
As of the 2010 census, the population of Savageville was 1,845. The racial makeup of the community was 94.3% White, 2.2% African American, 0.3% Native American, 0.7% Asian, 0.1% Pacific Islander, and 2.4% from other races. The median household income was $45,938.
Savageville is served by the Rockingham County Public Schools system. The community is home to one elementary school, one middle school, and one high school. The community is also home to several churches, including the Savageville United Methodist Church and the Savageville Baptist Church.
Common Questions
What is Per Capita Income in Savageville?
Per Capita income in Savageville is $24,833.
What is the Median Household income in Savageville?
Median Household Income in Savageville is $48,730.
What is Income or Wage Gap in Savageville?
Income or Wage Gap in Savageville is 51.7%.
Women in Savageville earn 48.3 cents for every dollar earned by a man.
What is Inequality or Gini Index in Savageville?
Inequality or Gini Index in Savageville is 0.23.
What is the Total Population of Savageville?
Total Population of Savageville is 574.
What is the Total Male Population of Savageville?
Total Male Population of Savageville is 253.
What is the Total Female Population of Savageville?
Total Female Population of Savageville is 321.
What is the Ratio of Males per 100 Females in Savageville?
There are 78.82 Males per 100 Females in Savageville.
What is the Ratio of Females per 100 Males in Savageville?
There are 126.88 Females per 100 Males in Savageville.
What is the Median Population Age in Savageville?
Median Population Age in Savageville is 23.0 Years.
What is the Average Family Size in Savageville
Average Family Size in Savageville is 3.4 People.
What is the Average Household Size in Savageville
Average Household Size in Savageville is 2.5 People.
How Large is the Labor Force in Savageville?
There are 377 People in the Labor Forcein in Savageville.
What is the Percentage of People in the Labor Force in Savageville?
93.1% of People are in the Labor Force in Savageville.