Bassett, VA Map & Demographics
Bassett Map
Bassett Overview
$20,154
PER CAPITA INCOME
$48,542
AVG FAMILY INCOME
$38,611
AVG HOUSEHOLD INCOME
22.7%
WAGE / INCOME GAP [ % ]
77.3¢/ $1
WAGE / INCOME GAP [ $ ]
0.42
INEQUALITY / GINI INDEX
852
TOTAL POPULATION
455
MALE POPULATION
397
FEMALE POPULATION
114.61
MALES / 100 FEMALES
87.25
FEMALES / 100 MALES
52.1
MEDIAN AGE
3.6
AVG FAMILY SIZE
2.4
AVG HOUSEHOLD SIZE
227
LABOR FORCE [ PEOPLE ]
32.3%
PERCENT IN LABOR FORCE
13.2%
UNEMPLOYMENT RATE
Bassett Zip Codes
Bassett Area Codes
Income in Bassett
Income Overview in Bassett
Per Capita Income in Bassett is $20,154, while median incomes of families and households are $48,542 and $38,611 respectively.
| Characteristic | Number | Measure |
| Per Capita Income | 852 | $20,154 |
| Median Family Income | 165 | $48,542 |
| Mean Family Income | 165 | $52,379 |
| Median Household Income | 318 | $38,611 |
| Mean Household Income | 318 | $43,203 |
| Income Deficit | 165 | $0 |
| Wage / Income Gap (%) | 852 | 22.68% |
| Wage / Income Gap ($) | 852 | 77.32¢ per $1 |
| Gini / Inequality Index | 852 | 0.42 |
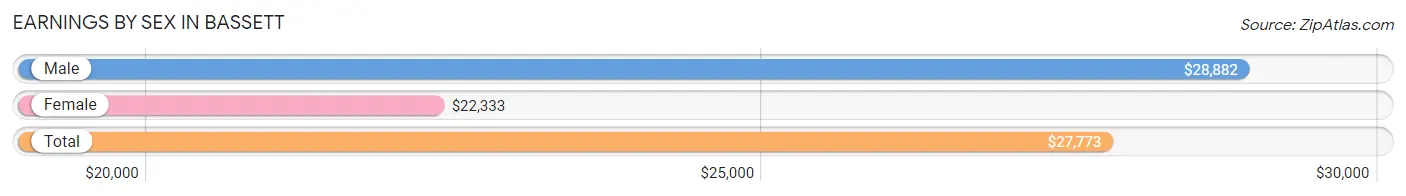
Earnings by Sex in Bassett
Average Earnings in Bassett are $27,773, $28,882 for men and $22,333 for women, a difference of 22.7%.
| Sex | Number | Average Earnings |
| Male | 113 (49.8%) | $28,882 |
| Female | 114 (50.2%) | $22,333 |
| Total | 227 (100.0%) | $27,773 |
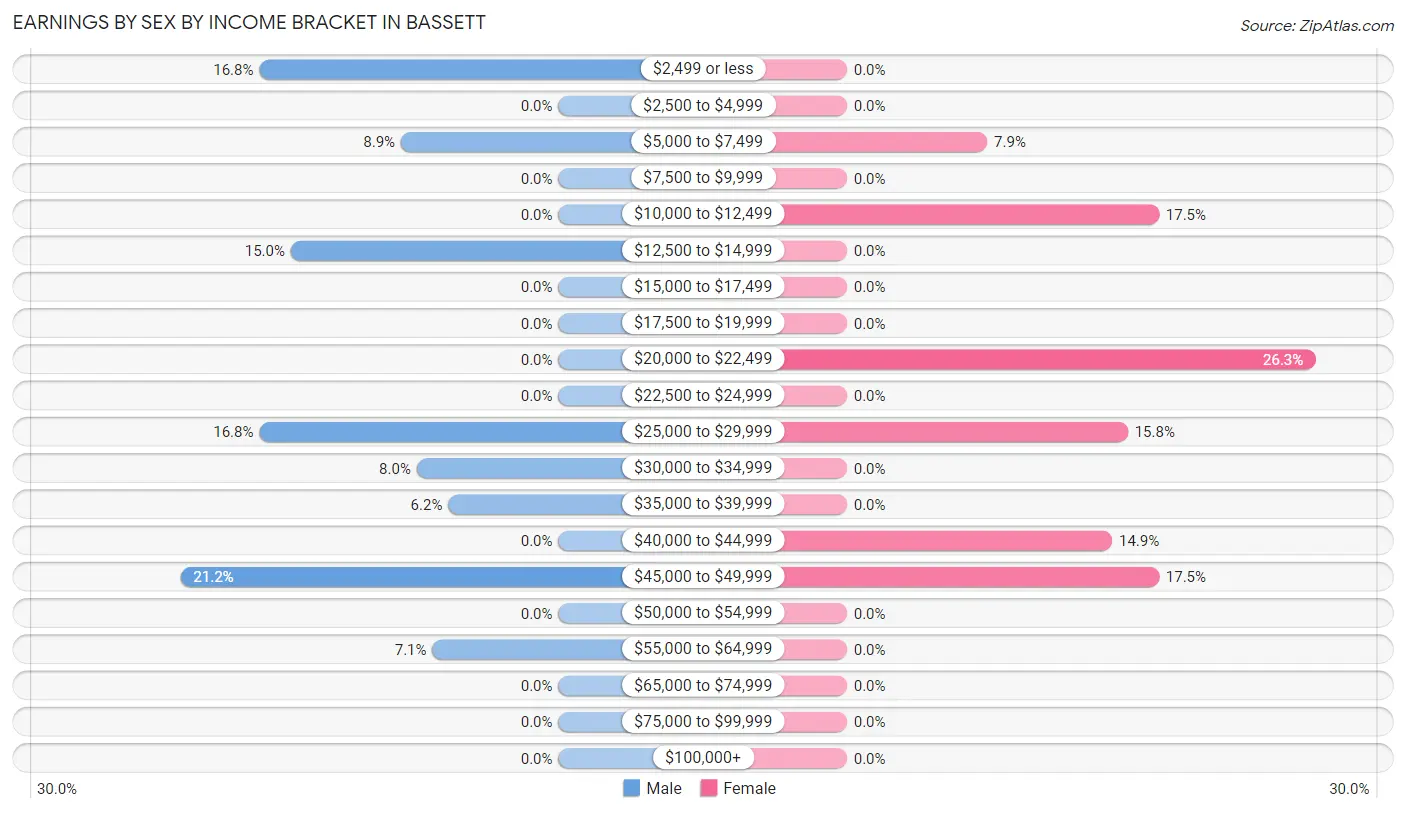
Earnings by Sex by Income Bracket in Bassett
The most common earnings brackets in Bassett are $45,000 to $49,999 for men (24 | 21.2%) and $20,000 to $22,499 for women (30 | 26.3%).
| Income | Male | Female |
| $2,499 or less | 19 (16.8%) | 0 (0.0%) |
| $2,500 to $4,999 | 0 (0.0%) | 0 (0.0%) |
| $5,000 to $7,499 | 10 (8.8%) | 9 (7.9%) |
| $7,500 to $9,999 | 0 (0.0%) | 0 (0.0%) |
| $10,000 to $12,499 | 0 (0.0%) | 20 (17.5%) |
| $12,500 to $14,999 | 17 (15.0%) | 0 (0.0%) |
| $15,000 to $17,499 | 0 (0.0%) | 0 (0.0%) |
| $17,500 to $19,999 | 0 (0.0%) | 0 (0.0%) |
| $20,000 to $22,499 | 0 (0.0%) | 30 (26.3%) |
| $22,500 to $24,999 | 0 (0.0%) | 0 (0.0%) |
| $25,000 to $29,999 | 19 (16.8%) | 18 (15.8%) |
| $30,000 to $34,999 | 9 (8.0%) | 0 (0.0%) |
| $35,000 to $39,999 | 7 (6.2%) | 0 (0.0%) |
| $40,000 to $44,999 | 0 (0.0%) | 17 (14.9%) |
| $45,000 to $49,999 | 24 (21.2%) | 20 (17.5%) |
| $50,000 to $54,999 | 0 (0.0%) | 0 (0.0%) |
| $55,000 to $64,999 | 8 (7.1%) | 0 (0.0%) |
| $65,000 to $74,999 | 0 (0.0%) | 0 (0.0%) |
| $75,000 to $99,999 | 0 (0.0%) | 0 (0.0%) |
| $100,000+ | 0 (0.0%) | 0 (0.0%) |
| Total | 113 (100.0%) | 114 (100.0%) |
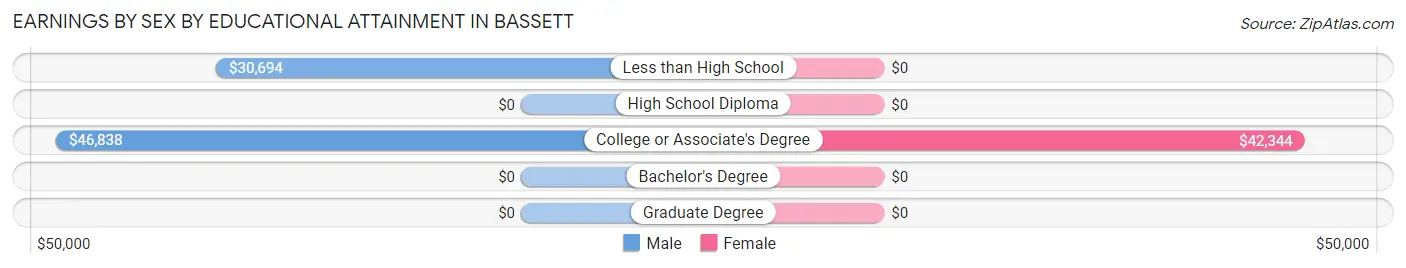
Earnings by Sex by Educational Attainment in Bassett
Average earnings in Bassett are $37,679 for men and $22,292 for women, a difference of 40.8%. Men with an educational attainment of college or associate's degree enjoy the highest average annual earnings of $46,838, while those with less than high school education earn the least with $30,694. Women with an educational attainment of college or associate's degree earn the most with the average annual earnings of $42,344, while those with college or associate's degree education have the smallest earnings of $42,344.
| Educational Attainment | Male Income | Female Income |
| Less than High School | $30,694 | $0 |
| High School Diploma | - | - |
| College or Associate's Degree | $46,838 | $42,344 |
| Bachelor's Degree | - | - |
| Graduate Degree | - | - |
| Total | $37,679 | $22,292 |
Family Income in Bassett
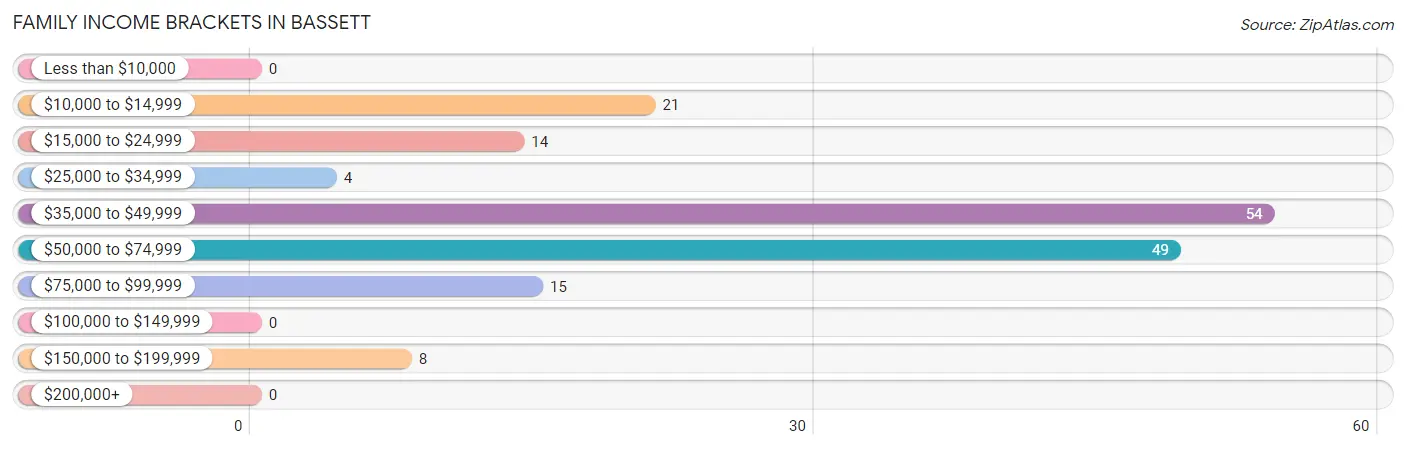
Family Income Brackets in Bassett
According to the Bassett family income data, there are 54 families falling into the $35,000 to $49,999 income range, which is the most common income bracket and makes up 32.7% of all families.
| Income Bracket | # Families | % Families |
| Less than $10,000 | 0 | 0.0% |
| $10,000 to $14,999 | 21 | 12.7% |
| $15,000 to $24,999 | 14 | 8.5% |
| $25,000 to $34,999 | 4 | 2.4% |
| $35,000 to $49,999 | 54 | 32.7% |
| $50,000 to $74,999 | 49 | 29.7% |
| $75,000 to $99,999 | 15 | 9.1% |
| $100,000 to $149,999 | 0 | 0.0% |
| $150,000 to $199,999 | 8 | 4.8% |
| $200,000+ | 0 | 0.0% |
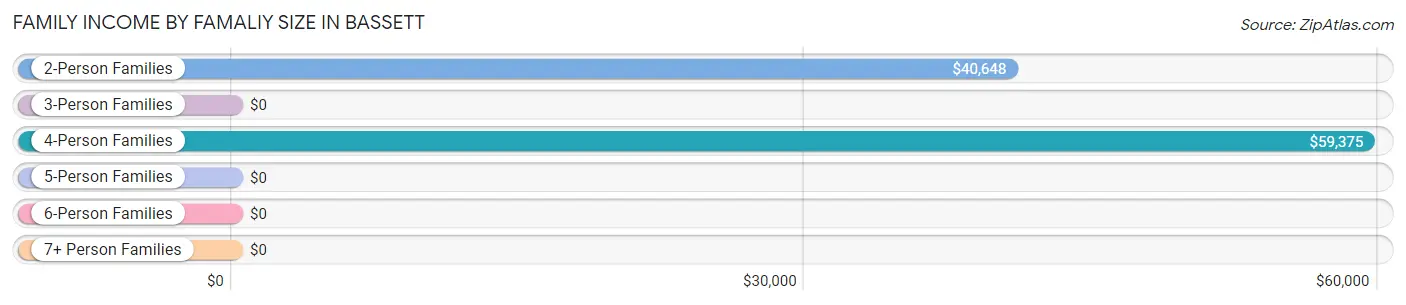
Family Income by Famaliy Size in Bassett
4-person families (54 | 32.7%) account for the highest median family income in Bassett with $59,375 per family, while 2-person families (92 | 55.8%) have the highest median income of $20,324 per family member.
| Income Bracket | # Families | Median Income |
| 2-Person Families | 92 (55.8%) | $40,648 |
| 3-Person Families | 0 (0.0%) | $0 |
| 4-Person Families | 54 (32.7%) | $59,375 |
| 5-Person Families | 11 (6.7%) | $0 |
| 6-Person Families | 8 (4.9%) | $0 |
| 7+ Person Families | 0 (0.0%) | $0 |
| Total | 165 (100.0%) | $48,542 |
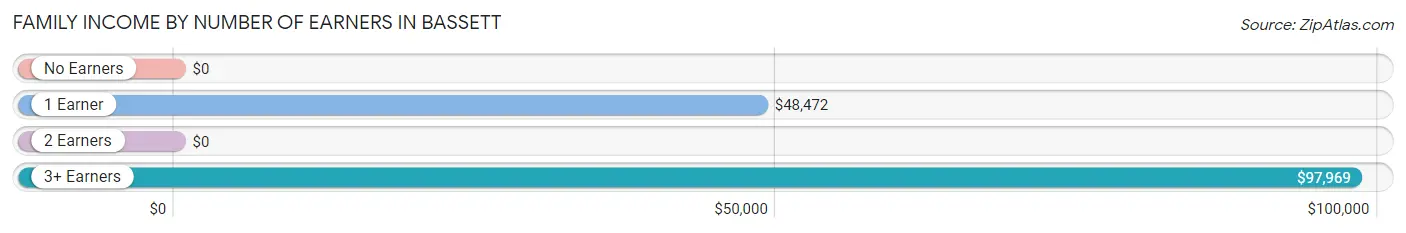
Family Income by Number of Earners in Bassett
| Number of Earners | # Families | Median Income |
| No Earners | 50 (30.3%) | $0 |
| 1 Earner | 86 (52.1%) | $48,472 |
| 2 Earners | 0 (0.0%) | $0 |
| 3+ Earners | 29 (17.6%) | $97,969 |
| Total | 165 (100.0%) | $48,542 |
Household Income in Bassett
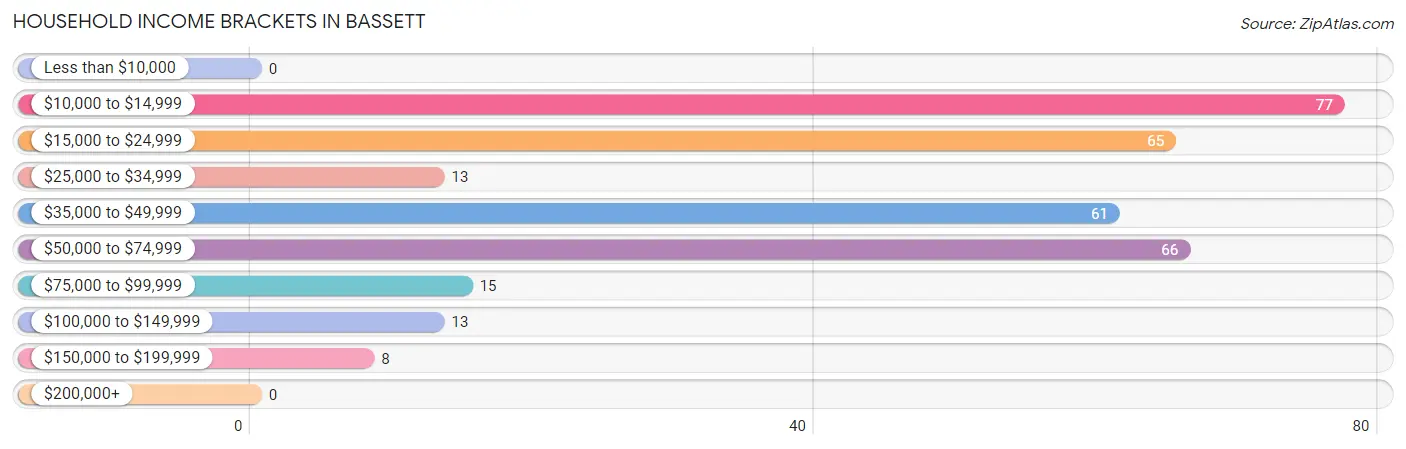
Household Income Brackets in Bassett
With 77 households falling in the category, the $10,000 to $14,999 income range is the most frequent in Bassett, accounting for 24.2% of all households.
| Income Bracket | # Households | % Households |
| Less than $10,000 | 0 | 0.0% |
| $10,000 to $14,999 | 77 | 24.2% |
| $15,000 to $24,999 | 65 | 20.4% |
| $25,000 to $34,999 | 13 | 4.1% |
| $35,000 to $49,999 | 61 | 19.2% |
| $50,000 to $74,999 | 66 | 20.8% |
| $75,000 to $99,999 | 15 | 4.7% |
| $100,000 to $149,999 | 13 | 4.1% |
| $150,000 to $199,999 | 8 | 2.5% |
| $200,000+ | 0 | 0.0% |
Household Income by Householder Age in Bassett
The median household income in Bassett is $38,611, with the highest median household income of $49,432 found in the 25 to 44 years age bracket for the primary householder. A total of 49 households (15.4%) fall into this category.
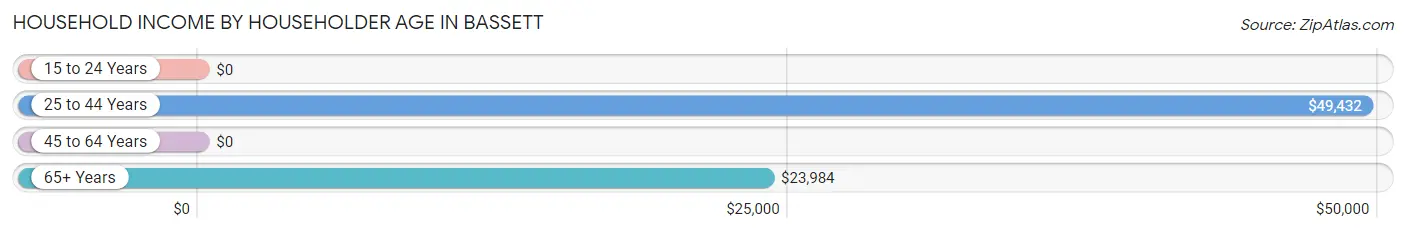
| Income Bracket | # Households | Median Income |
| 15 to 24 Years | 0 (0.0%) | $0 |
| 25 to 44 Years | 49 (15.4%) | $49,432 |
| 45 to 64 Years | 102 (32.1%) | $0 |
| 65+ Years | 167 (52.5%) | $23,984 |
| Total | 318 (100.0%) | $38,611 |
Poverty in Bassett
Income Below Poverty by Sex and Age in Bassett
With 22.9% poverty level for males and 20.6% for females among the residents of Bassett, 15 year old males and 12 to 14 year old females are the most vulnerable to poverty, with 13 males (100.0%) and 34 females (100.0%) in their respective age groups living below the poverty level.
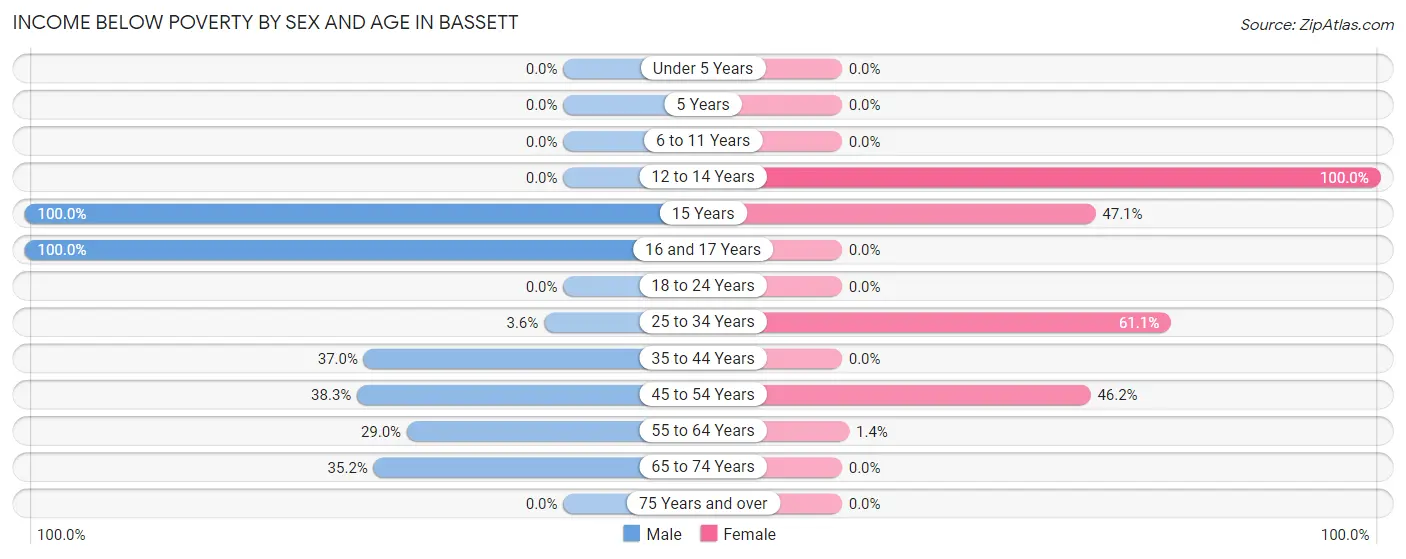
| Age Bracket | Male | Female |
| Under 5 Years | 0 (0.0%) | 0 (0.0%) |
| 5 Years | 0 (0.0%) | 0 (0.0%) |
| 6 to 11 Years | 0 (0.0%) | 0 (0.0%) |
| 12 to 14 Years | 0 (0.0%) | 34 (100.0%) |
| 15 Years | 13 (100.0%) | 8 (47.1%) |
| 16 and 17 Years | 14 (100.0%) | 0 (0.0%) |
| 18 to 24 Years | 0 (0.0%) | 0 (0.0%) |
| 25 to 34 Years | 2 (3.6%) | 11 (61.1%) |
| 35 to 44 Years | 10 (37.0%) | 0 (0.0%) |
| 45 to 54 Years | 31 (38.3%) | 12 (46.2%) |
| 55 to 64 Years | 9 (29.0%) | 1 (1.3%) |
| 65 to 74 Years | 25 (35.2%) | 0 (0.0%) |
| 75 Years and over | 0 (0.0%) | 0 (0.0%) |
| Total | 104 (22.9%) | 66 (20.6%) |
Income Above Poverty by Sex and Age in Bassett
According to the poverty statistics in Bassett, males aged under 5 years and females aged 5 years are the age groups that are most secure financially, with 100.0% of males and 100.0% of females in these age groups living above the poverty line.
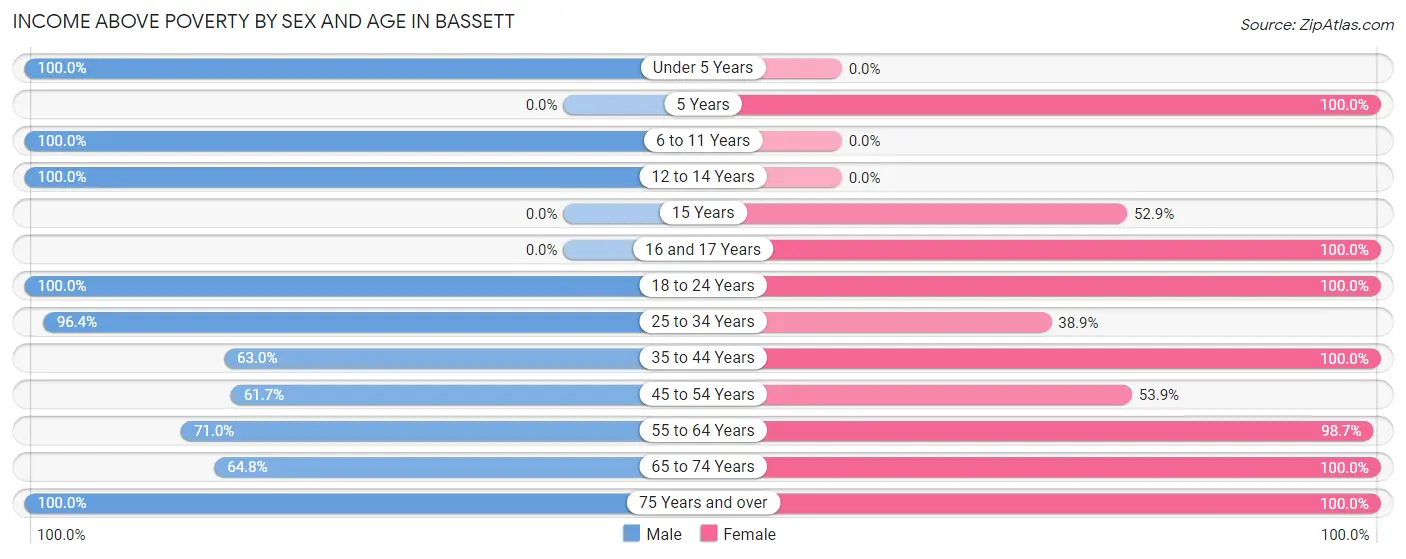
| Age Bracket | Male | Female |
| Under 5 Years | 26 (100.0%) | 0 (0.0%) |
| 5 Years | 0 (0.0%) | 21 (100.0%) |
| 6 to 11 Years | 20 (100.0%) | 0 (0.0%) |
| 12 to 14 Years | 19 (100.0%) | 0 (0.0%) |
| 15 Years | 0 (0.0%) | 9 (52.9%) |
| 16 and 17 Years | 0 (0.0%) | 17 (100.0%) |
| 18 to 24 Years | 36 (100.0%) | 10 (100.0%) |
| 25 to 34 Years | 54 (96.4%) | 7 (38.9%) |
| 35 to 44 Years | 17 (63.0%) | 27 (100.0%) |
| 45 to 54 Years | 50 (61.7%) | 14 (53.8%) |
| 55 to 64 Years | 22 (71.0%) | 73 (98.7%) |
| 65 to 74 Years | 46 (64.8%) | 4 (100.0%) |
| 75 Years and over | 61 (100.0%) | 72 (100.0%) |
| Total | 351 (77.1%) | 254 (79.4%) |
Income Below Poverty Among Married-Couple Families in Bassett
The poverty statistics for married-couple families in Bassett show that 15.2% or 21 of the total 138 families live below the poverty line. Families with 1 or 2 children have the highest poverty rate of 30.0%, comprising of 9 families. On the other hand, families with 3 or 4 children have the lowest poverty rate of 0.0%, which includes 0 families.
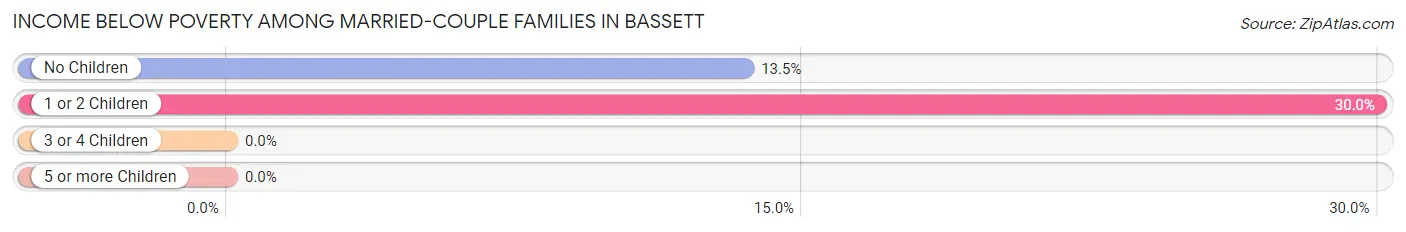
| Children | Above Poverty | Below Poverty |
| No Children | 77 (86.5%) | 12 (13.5%) |
| 1 or 2 Children | 21 (70.0%) | 9 (30.0%) |
| 3 or 4 Children | 19 (100.0%) | 0 (0.0%) |
| 5 or more Children | 0 (0.0%) | 0 (0.0%) |
| Total | 117 (84.8%) | 21 (15.2%) |
Income Below Poverty Among Single-Parent Households in Bassett
| Children | Single Father | Single Mother |
| No Children | 0 (0.0%) | 0 (0.0%) |
| 1 or 2 Children | 0 (0.0%) | 0 (0.0%) |
| 3 or 4 Children | 0 (0.0%) | 0 (0.0%) |
| 5 or more Children | 0 (0.0%) | 0 (0.0%) |
| Total | 0 (0.0%) | 0 (0.0%) |
Income Below Poverty Among Married-Couple vs Single-Parent Households in Bassett
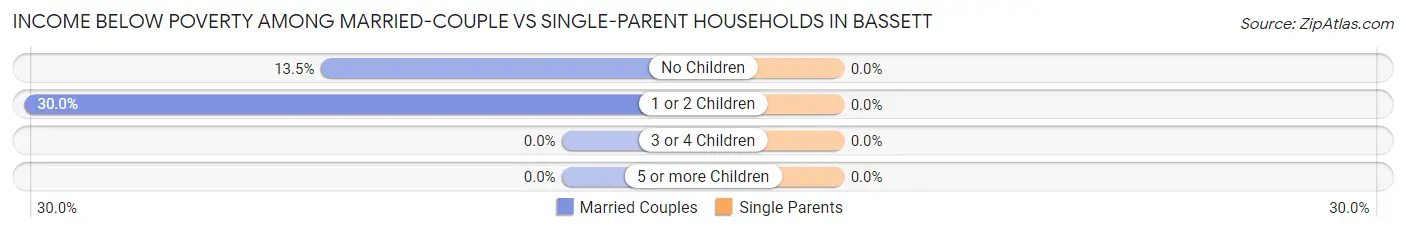
| Children | Married-Couple Families | Single-Parent Households |
| No Children | 12 (13.5%) | 0 (0.0%) |
| 1 or 2 Children | 9 (30.0%) | 0 (0.0%) |
| 3 or 4 Children | 0 (0.0%) | 0 (0.0%) |
| 5 or more Children | 0 (0.0%) | 0 (0.0%) |
| Total | 21 (15.2%) | 0 (0.0%) |
Race in Bassett
The most populous races in Bassett are White / Caucasian (534 | 62.7%), Black / African American (239 | 28.1%), and Hispanic or Latino (71 | 8.3%).
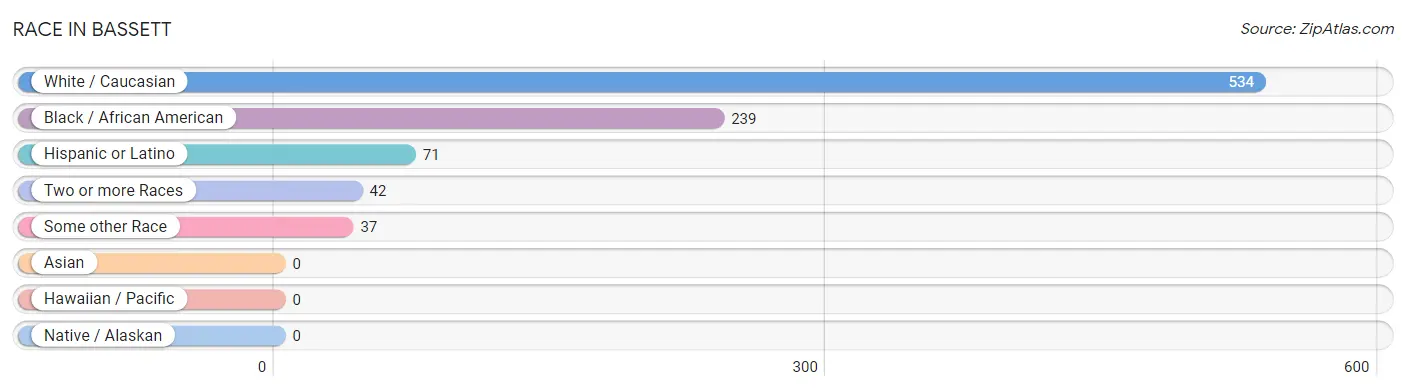
| Race | # Population | % Population |
| Asian | 0 | 0.0% |
| Black / African American | 239 | 28.1% |
| Hawaiian / Pacific | 0 | 0.0% |
| Hispanic or Latino | 71 | 8.3% |
| Native / Alaskan | 0 | 0.0% |
| White / Caucasian | 534 | 62.7% |
| Two or more Races | 42 | 4.9% |
| Some other Race | 37 | 4.3% |
| Total | 852 | 100.0% |
Ancestry in Bassett
The most populous ancestries reported in Bassett are English (176 | 20.7%), American (126 | 14.8%), Mexican (71 | 8.3%), Irish (64 | 7.5%), and German (36 | 4.2%), together accounting for 55.5% of all Bassett residents.
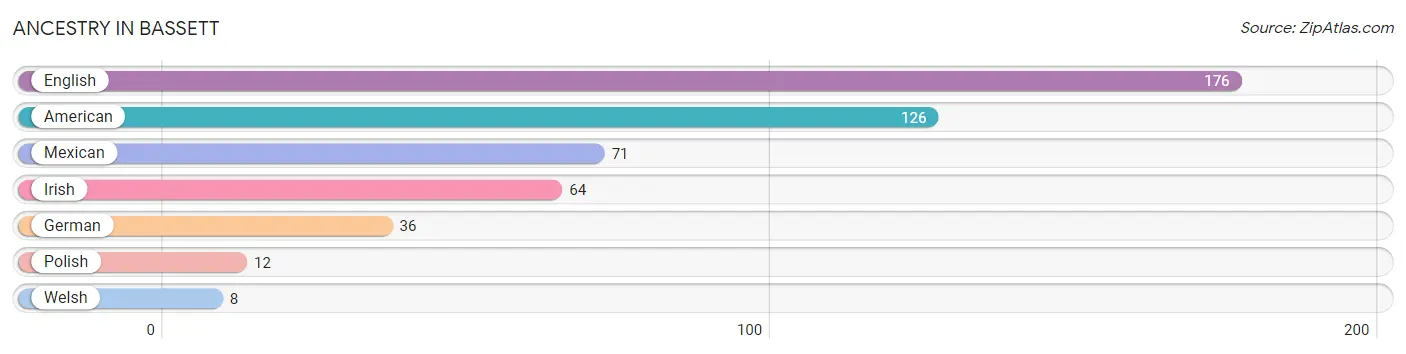
| Ancestry | # Population | % Population |
| American | 126 | 14.8% |
| English | 176 | 20.7% |
| German | 36 | 4.2% |
| Irish | 64 | 7.5% |
| Mexican | 71 | 8.3% |
| Polish | 12 | 1.4% |
| Welsh | 8 | 0.9% | View All 7 Rows |
Immigrants in Bassett
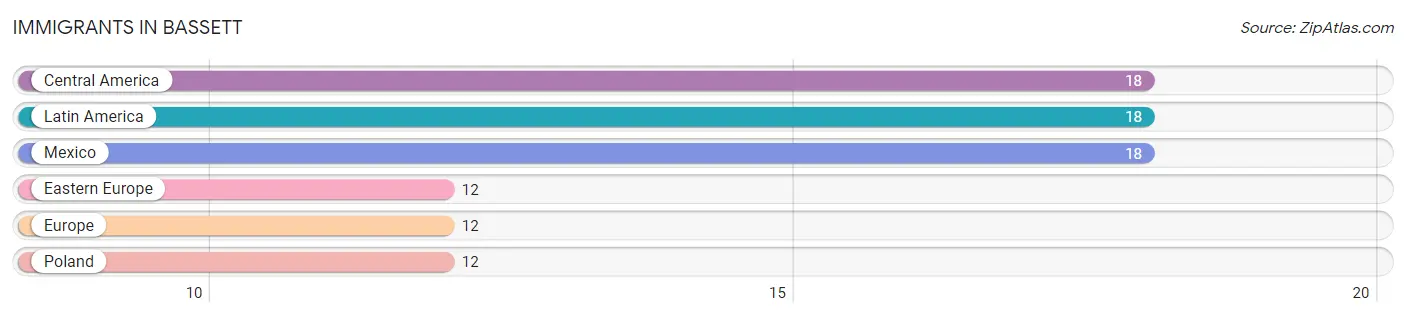
The most numerous immigrant groups reported in Bassett came from Central America (18 | 2.1%), Latin America (18 | 2.1%), Mexico (18 | 2.1%), Eastern Europe (12 | 1.4%), and Europe (12 | 1.4%), together accounting for 9.1% of all Bassett residents.
| Immigration Origin | # Population | % Population |
| Central America | 18 | 2.1% |
| Eastern Europe | 12 | 1.4% |
| Europe | 12 | 1.4% |
| Latin America | 18 | 2.1% |
| Mexico | 18 | 2.1% |
| Poland | 12 | 1.4% | View All 6 Rows |
Sex and Age in Bassett
Sex and Age in Bassett
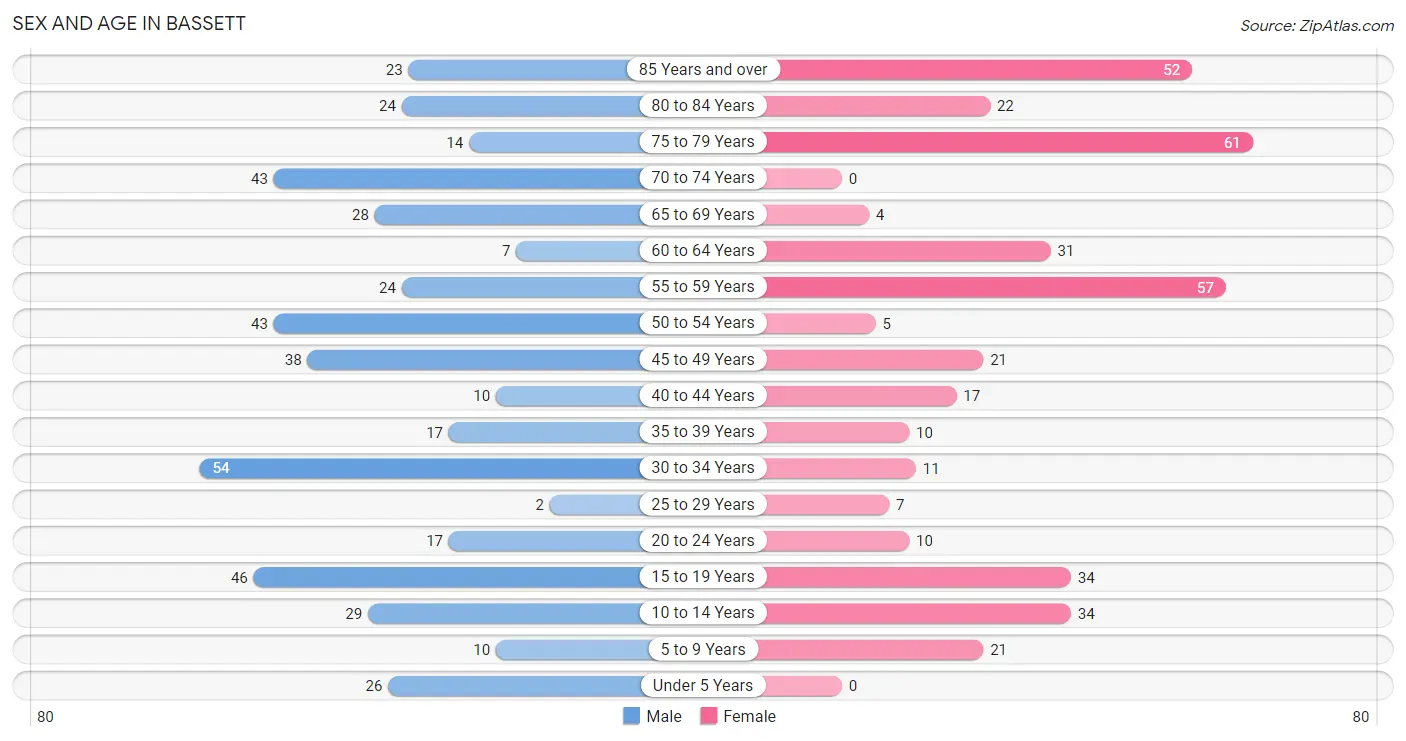
The most populous age groups in Bassett are 30 to 34 Years (54 | 11.9%) for men and 75 to 79 Years (61 | 15.4%) for women.
| Age Bracket | Male | Female |
| Under 5 Years | 26 (5.7%) | 0 (0.0%) |
| 5 to 9 Years | 10 (2.2%) | 21 (5.3%) |
| 10 to 14 Years | 29 (6.4%) | 34 (8.6%) |
| 15 to 19 Years | 46 (10.1%) | 34 (8.6%) |
| 20 to 24 Years | 17 (3.7%) | 10 (2.5%) |
| 25 to 29 Years | 2 (0.4%) | 7 (1.8%) |
| 30 to 34 Years | 54 (11.9%) | 11 (2.8%) |
| 35 to 39 Years | 17 (3.7%) | 10 (2.5%) |
| 40 to 44 Years | 10 (2.2%) | 17 (4.3%) |
| 45 to 49 Years | 38 (8.4%) | 21 (5.3%) |
| 50 to 54 Years | 43 (9.5%) | 5 (1.3%) |
| 55 to 59 Years | 24 (5.3%) | 57 (14.4%) |
| 60 to 64 Years | 7 (1.5%) | 31 (7.8%) |
| 65 to 69 Years | 28 (6.1%) | 4 (1.0%) |
| 70 to 74 Years | 43 (9.5%) | 0 (0.0%) |
| 75 to 79 Years | 14 (3.1%) | 61 (15.4%) |
| 80 to 84 Years | 24 (5.3%) | 22 (5.5%) |
| 85 Years and over | 23 (5.1%) | 52 (13.1%) |
| Total | 455 (100.0%) | 397 (100.0%) |
Families and Households in Bassett
Median Family Size in Bassett
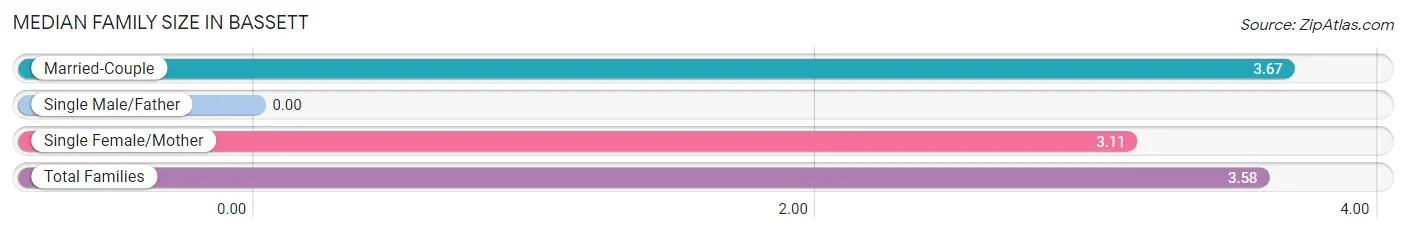
| Family Type | # Families | Family Size |
| Married-Couple | 138 (83.6%) | 3.67 |
| Single Male/Father | 0 (0.0%) | - |
| Single Female/Mother | 27 (16.4%) | 3.11 |
| Total Families | 165 (100.0%) | 3.58 |
Median Household Size in Bassett
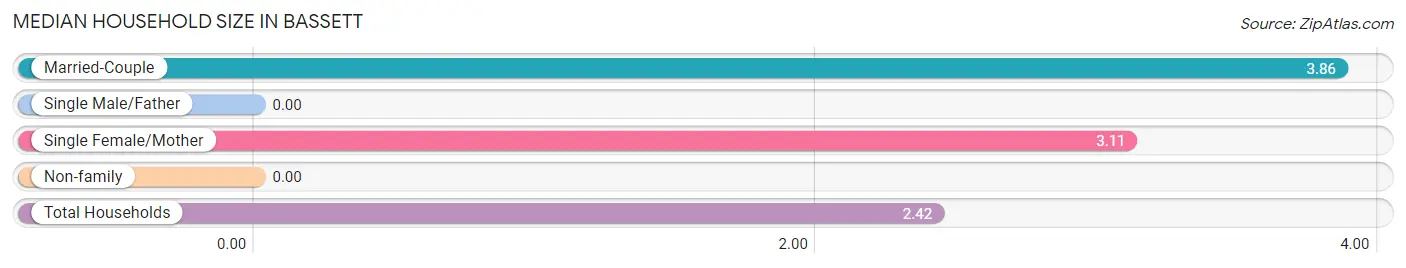
| Household Type | # Households | Household Size |
| Married-Couple | 138 (43.4%) | 3.86 |
| Single Male/Father | 0 (0.0%) | - |
| Single Female/Mother | 27 (8.5%) | 3.11 |
| Non-family | 153 (48.1%) | - |
| Total Households | 318 (100.0%) | 2.42 |
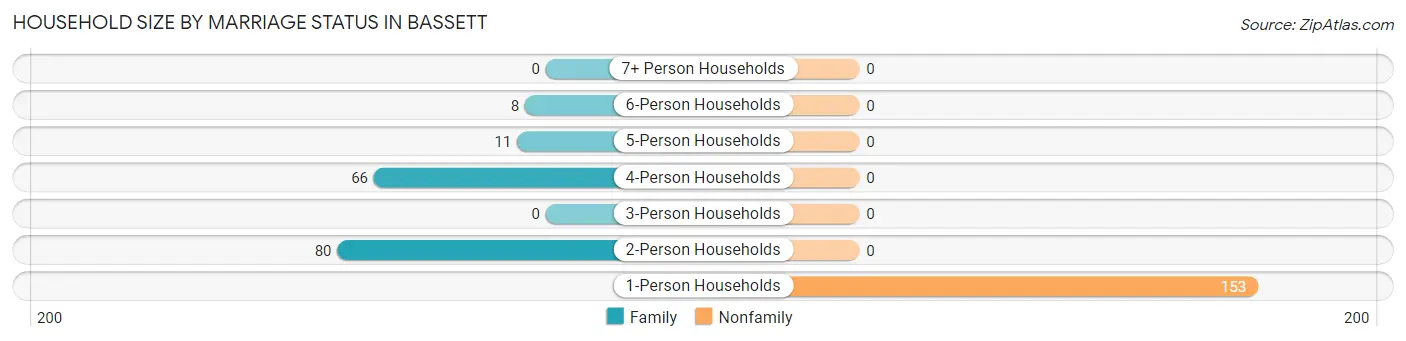
Household Size by Marriage Status in Bassett
Out of a total of 318 households in Bassett, 165 (51.9%) are family households, while 153 (48.1%) are nonfamily households. The most numerous type of family households are 2-person households, comprising 80, and the most common type of nonfamily households are 1-person households, comprising 153.
| Household Size | Family Households | Nonfamily Households |
| 1-Person Households | - | 153 (48.1%) |
| 2-Person Households | 80 (25.2%) | 0 (0.0%) |
| 3-Person Households | 0 (0.0%) | 0 (0.0%) |
| 4-Person Households | 66 (20.7%) | 0 (0.0%) |
| 5-Person Households | 11 (3.5%) | 0 (0.0%) |
| 6-Person Households | 8 (2.5%) | 0 (0.0%) |
| 7+ Person Households | 0 (0.0%) | 0 (0.0%) |
| Total | 165 (51.9%) | 153 (48.1%) |
Female Fertility in Bassett
Fertility by Age in Bassett
| Age Bracket | Women with Births | Births / 1,000 Women |
| 15 to 19 years | 0 (0.0%) | 0.0 |
| 20 to 34 years | 0 (0.0%) | 0.0 |
| 35 to 50 years | 0 (0.0%) | 0.0 |
| Total | 0 (0.0%) | 0.0 |
Fertility by Age by Marriage Status in Bassett
| Age Bracket | Married | Unmarried |
| 15 to 19 years | 0 (0.0%) | 0 (0.0%) |
| 20 to 34 years | 0 (0.0%) | 0 (0.0%) |
| 35 to 50 years | 0 (0.0%) | 0 (0.0%) |
| Total | 0 (0.0%) | 0 (0.0%) |
Fertility by Education in Bassett
| Educational Attainment | Women with Births | Births / 1,000 Women |
| Less than High School | 0 (0.0%) | 0.0 |
| High School Diploma | 0 (0.0%) | 0.0 |
| College or Associate's Degree | 0 (0.0%) | 0.0 |
| Bachelor's Degree | 0 (0.0%) | 0.0 |
| Graduate Degree | 0 (0.0%) | 0.0 |
| Total | 0 (0.0%) | 0.0 |
Fertility by Education by Marriage Status in Bassett
| Educational Attainment | Married | Unmarried |
| Less than High School | 0 (0.0%) | 0 (0.0%) |
| High School Diploma | 0 (0.0%) | 0 (0.0%) |
| College or Associate's Degree | 0 (0.0%) | 0 (0.0%) |
| Bachelor's Degree | 0 (0.0%) | 0 (0.0%) |
| Graduate Degree | 0 (0.0%) | 0 (0.0%) |
| Total | 0 (0.0%) | 0 (0.0%) |
Employment Characteristics in Bassett
Employment by Class of Employer in Bassett
Among the 197 employed individuals in Bassett, private company employees (159 | 80.7%), not-for-profit organizations (30 | 15.2%), and state government employees (8 | 4.1%) make up the most common classes of employment.
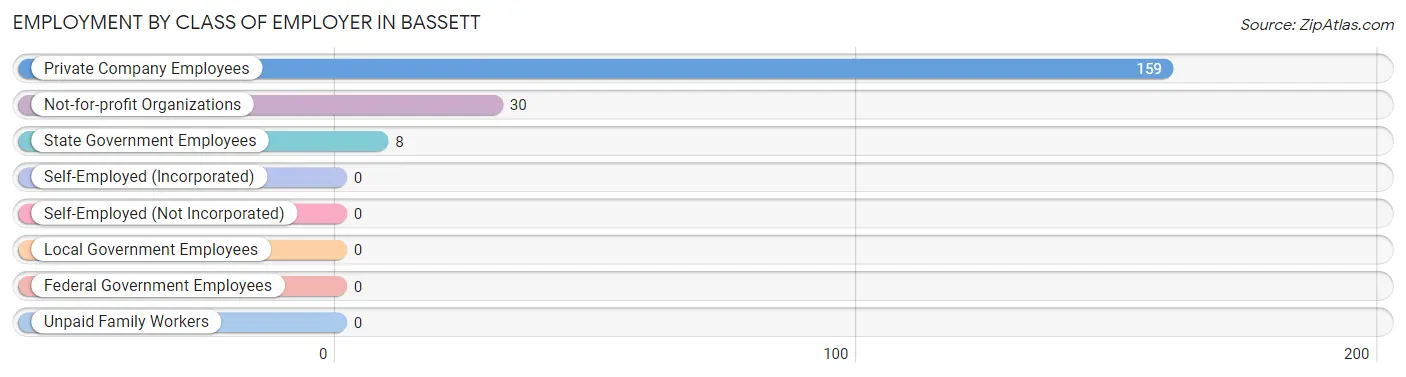
| Employer Class | # Employees | % Employees |
| Private Company Employees | 159 | 80.7% |
| Self-Employed (Incorporated) | 0 | 0.0% |
| Self-Employed (Not Incorporated) | 0 | 0.0% |
| Not-for-profit Organizations | 30 | 15.2% |
| Local Government Employees | 0 | 0.0% |
| State Government Employees | 8 | 4.1% |
| Federal Government Employees | 0 | 0.0% |
| Unpaid Family Workers | 0 | 0.0% |
| Total | 197 | 100.0% |
Employment Status by Age in Bassett
According to the labor force statistics for Bassett, out of the total population over 16 years of age (702), 32.3% or 227 individuals are in the labor force, with 13.2% or 30 of them unemployed. The age group with the highest labor force participation rate is 20 to 24 years, with 100.0% or 27 individuals in the labor force. Within the labor force, the 55 to 59 years age range has the highest percentage of unemployed individuals, with 52.6% or 30 of them being unemployed.
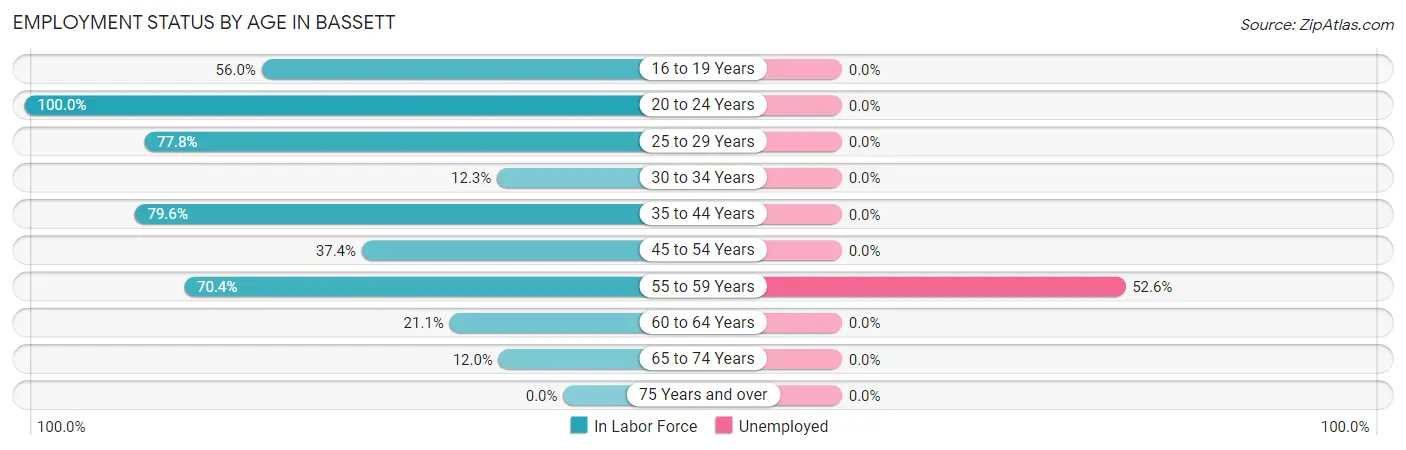
| Age Bracket | In Labor Force | Unemployed |
| 16 to 19 Years | 28 (56.0%) | 0 (0.0%) |
| 20 to 24 Years | 27 (100.0%) | 0 (0.0%) |
| 25 to 29 Years | 7 (77.8%) | 0 (0.0%) |
| 30 to 34 Years | 8 (12.3%) | 0 (0.0%) |
| 35 to 44 Years | 43 (79.6%) | 0 (0.0%) |
| 45 to 54 Years | 40 (37.4%) | 0 (0.0%) |
| 55 to 59 Years | 57 (70.4%) | 30 (52.6%) |
| 60 to 64 Years | 8 (21.1%) | 0 (0.0%) |
| 65 to 74 Years | 9 (12.0%) | 0 (0.0%) |
| 75 Years and over | 0 (0.0%) | 0 (0.0%) |
| Total | 227 (32.3%) | 30 (13.2%) |
Employment Status by Educational Attainment in Bassett
According to labor force statistics for Bassett, 46.0% of individuals (163) out of the total population between 25 and 64 years of age (354) are in the labor force, with 18.4% or 30 of them being unemployed. The group with the highest labor force participation rate are those with the educational attainment of bachelor's degree or higher, with 100.0% or 35 individuals in the labor force. Within the labor force, individuals with high school diploma education have the highest percentage of unemployment, with 75.0% or 30 of them being unemployed.
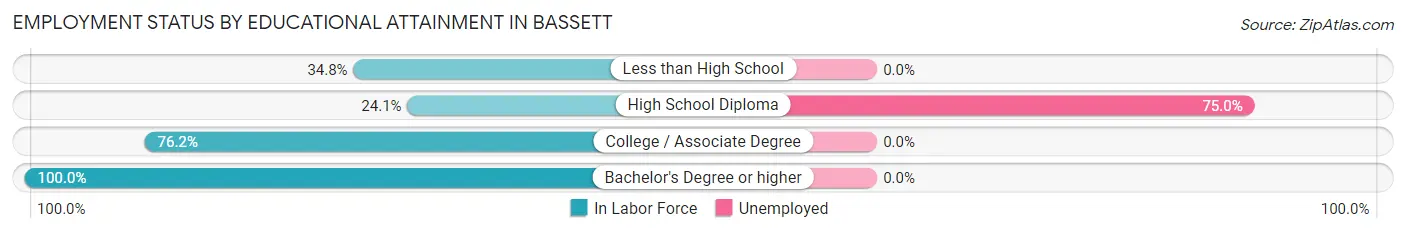
| Educational Attainment | In Labor Force | Unemployed |
| Less than High School | 24 (34.8%) | 0 (0.0%) |
| High School Diploma | 40 (24.1%) | 124 (75.0%) |
| College / Associate Degree | 64 (76.2%) | 0 (0.0%) |
| Bachelor's Degree or higher | 35 (100.0%) | 0 (0.0%) |
| Total | 163 (46.0%) | 65 (18.4%) |
Employment Occupations by Sex in Bassett
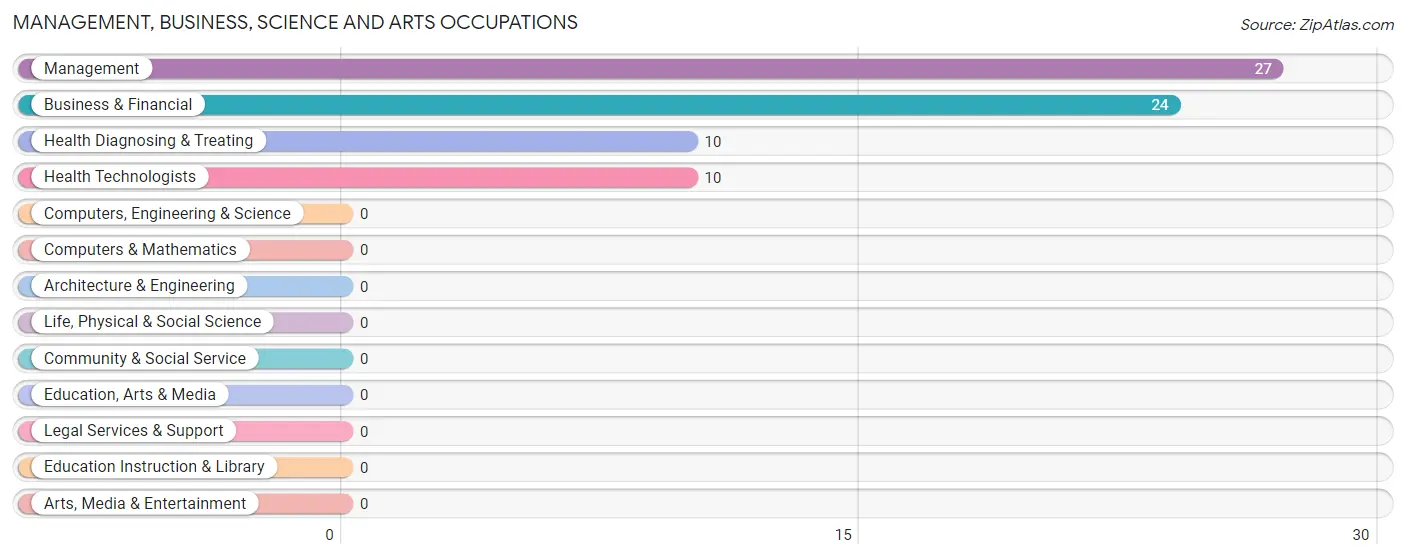
Management, Business, Science and Arts Occupations
The most common Management, Business, Science and Arts occupations in Bassett are Management (27 | 13.7%), Business & Financial (24 | 12.2%), Health Diagnosing & Treating (10 | 5.1%), and Health Technologists (10 | 5.1%).
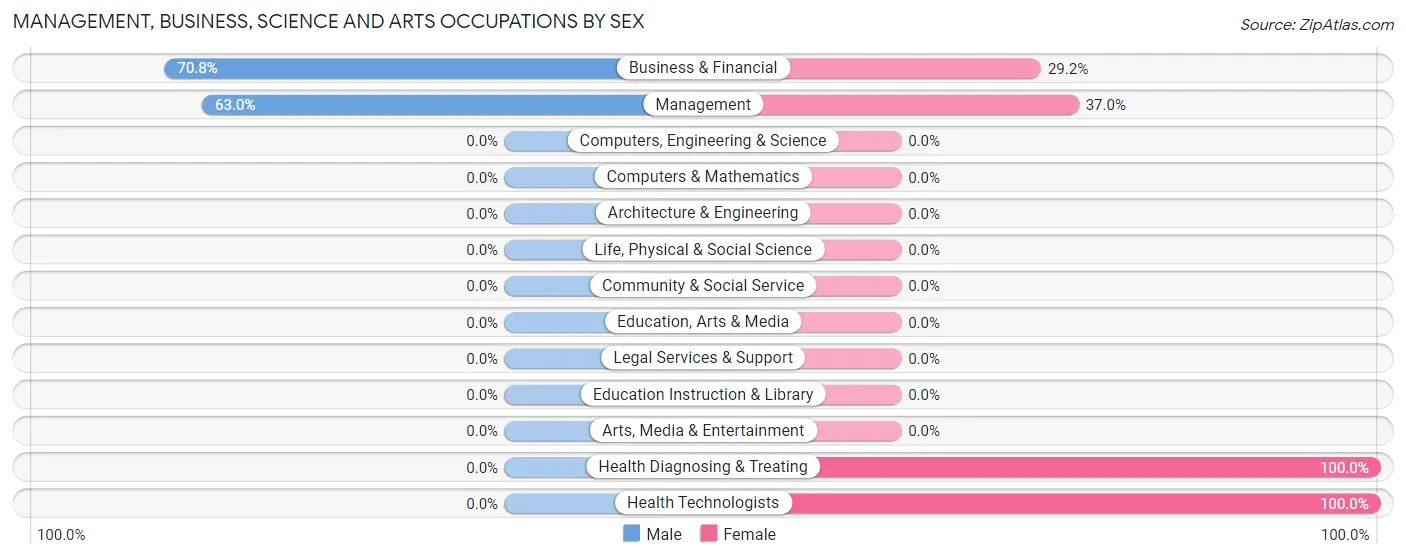
Management, Business, Science and Arts Occupations by Sex
Within the Management, Business, Science and Arts occupations in Bassett, the most male-oriented occupations are Business & Financial (70.8%), and Management (63.0%), while the most female-oriented occupations are Health Diagnosing & Treating (100.0%), Health Technologists (100.0%), and Management (37.0%).
| Occupation | Male | Female |
| Management | 17 (63.0%) | 10 (37.0%) |
| Business & Financial | 17 (70.8%) | 7 (29.2%) |
| Computers, Engineering & Science | 0 (0.0%) | 0 (0.0%) |
| Computers & Mathematics | 0 (0.0%) | 0 (0.0%) |
| Architecture & Engineering | 0 (0.0%) | 0 (0.0%) |
| Life, Physical & Social Science | 0 (0.0%) | 0 (0.0%) |
| Community & Social Service | 0 (0.0%) | 0 (0.0%) |
| Education, Arts & Media | 0 (0.0%) | 0 (0.0%) |
| Legal Services & Support | 0 (0.0%) | 0 (0.0%) |
| Education Instruction & Library | 0 (0.0%) | 0 (0.0%) |
| Arts, Media & Entertainment | 0 (0.0%) | 0 (0.0%) |
| Health Diagnosing & Treating | 0 (0.0%) | 10 (100.0%) |
| Health Technologists | 0 (0.0%) | 10 (100.0%) |
| Total (Category) | 34 (55.7%) | 27 (44.3%) |
| Total (Overall) | 113 (57.4%) | 84 (42.6%) |
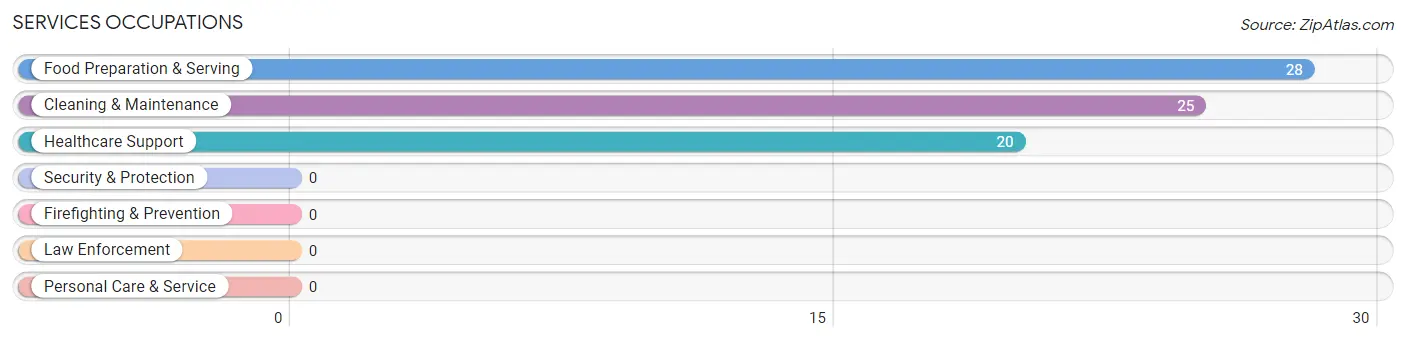
Services Occupations
The most common Services occupations in Bassett are Food Preparation & Serving (28 | 14.2%), Cleaning & Maintenance (25 | 12.7%), and Healthcare Support (20 | 10.2%).
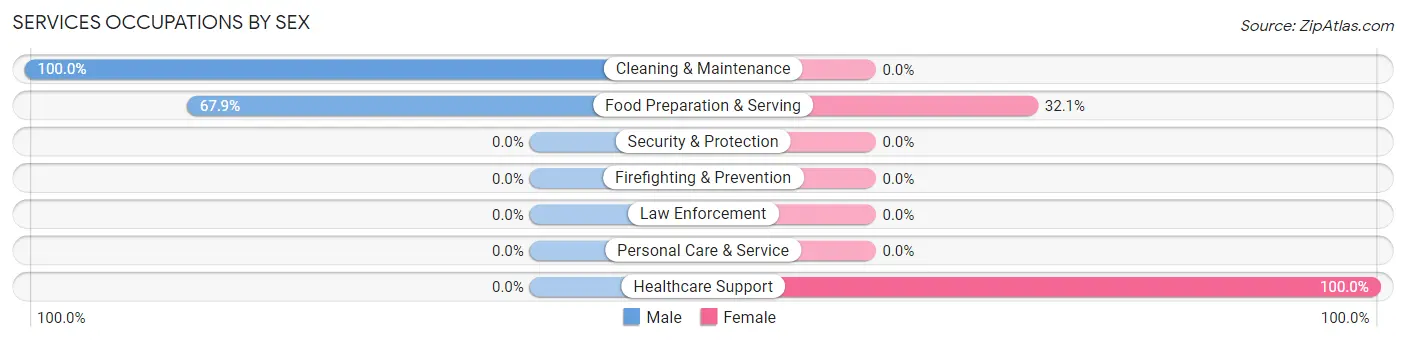
Services Occupations by Sex
Within the Services occupations in Bassett, the most male-oriented occupations are Cleaning & Maintenance (100.0%), and Food Preparation & Serving (67.9%), while the most female-oriented occupations are Healthcare Support (100.0%), and Food Preparation & Serving (32.1%).
| Occupation | Male | Female |
| Healthcare Support | 0 (0.0%) | 20 (100.0%) |
| Security & Protection | 0 (0.0%) | 0 (0.0%) |
| Firefighting & Prevention | 0 (0.0%) | 0 (0.0%) |
| Law Enforcement | 0 (0.0%) | 0 (0.0%) |
| Food Preparation & Serving | 19 (67.9%) | 9 (32.1%) |
| Cleaning & Maintenance | 25 (100.0%) | 0 (0.0%) |
| Personal Care & Service | 0 (0.0%) | 0 (0.0%) |
| Total (Category) | 44 (60.3%) | 29 (39.7%) |
| Total (Overall) | 113 (57.4%) | 84 (42.6%) |
Sales and Office Occupations
The most common Sales and Office occupations in Bassett are Office & Administration (17 | 8.6%), and Sales & Related (9 | 4.6%).
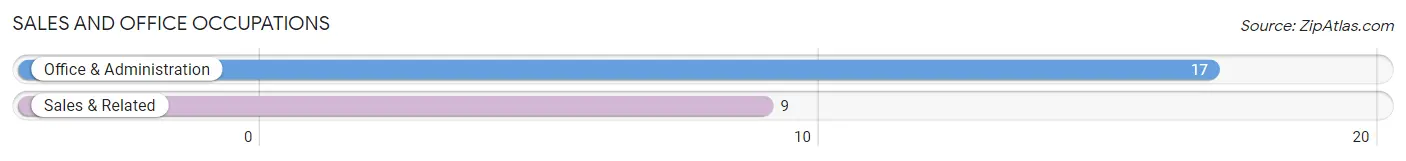
Sales and Office Occupations by Sex
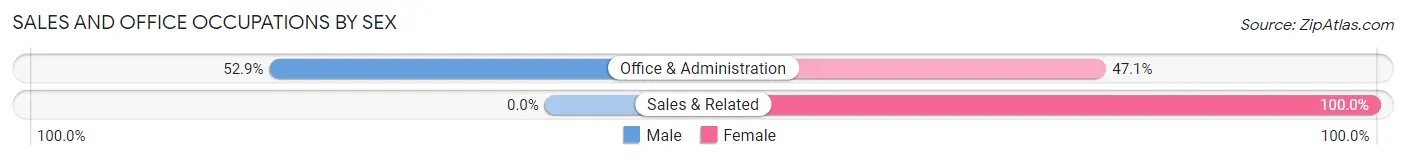
| Occupation | Male | Female |
| Sales & Related | 0 (0.0%) | 9 (100.0%) |
| Office & Administration | 9 (52.9%) | 8 (47.1%) |
| Total (Category) | 9 (34.6%) | 17 (65.4%) |
| Total (Overall) | 113 (57.4%) | 84 (42.6%) |
Natural Resources, Construction and Maintenance Occupations
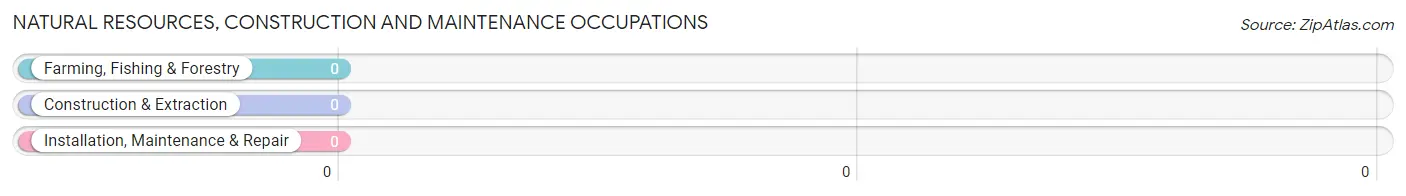
Natural Resources, Construction and Maintenance Occupations by Sex
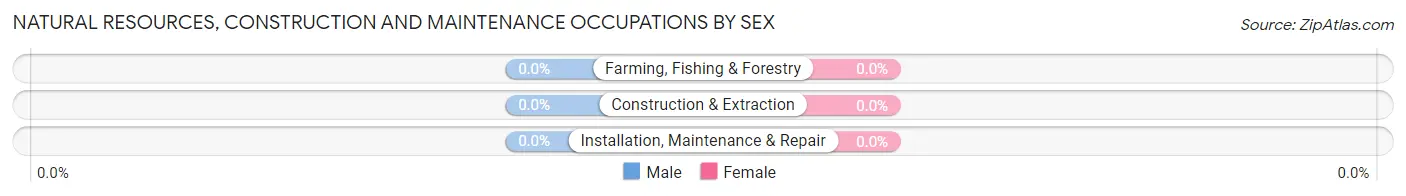
| Occupation | Male | Female |
| Farming, Fishing & Forestry | 0 (0.0%) | 0 (0.0%) |
| Construction & Extraction | 0 (0.0%) | 0 (0.0%) |
| Installation, Maintenance & Repair | 0 (0.0%) | 0 (0.0%) |
| Total (Category) | 0 (0.0%) | 0 (0.0%) |
| Total (Overall) | 113 (57.4%) | 84 (42.6%) |
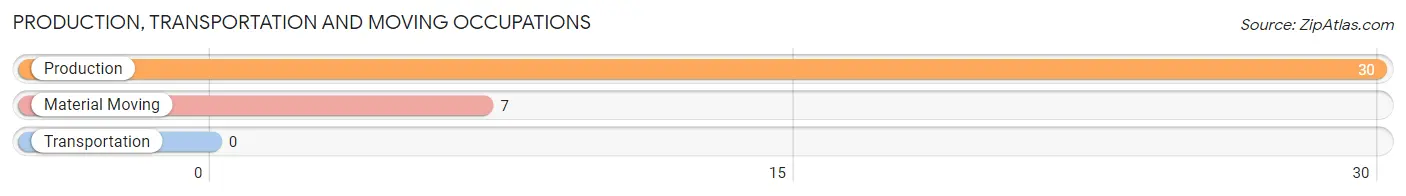
Production, Transportation and Moving Occupations
The most common Production, Transportation and Moving occupations in Bassett are Production (30 | 15.2%), and Material Moving (7 | 3.5%).
Production, Transportation and Moving Occupations by Sex
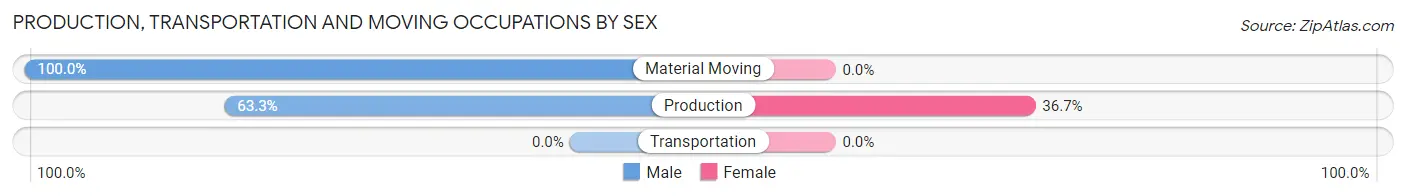
| Occupation | Male | Female |
| Production | 19 (63.3%) | 11 (36.7%) |
| Transportation | 0 (0.0%) | 0 (0.0%) |
| Material Moving | 7 (100.0%) | 0 (0.0%) |
| Total (Category) | 26 (70.3%) | 11 (29.7%) |
| Total (Overall) | 113 (57.4%) | 84 (42.6%) |
Employment Industries by Sex in Bassett
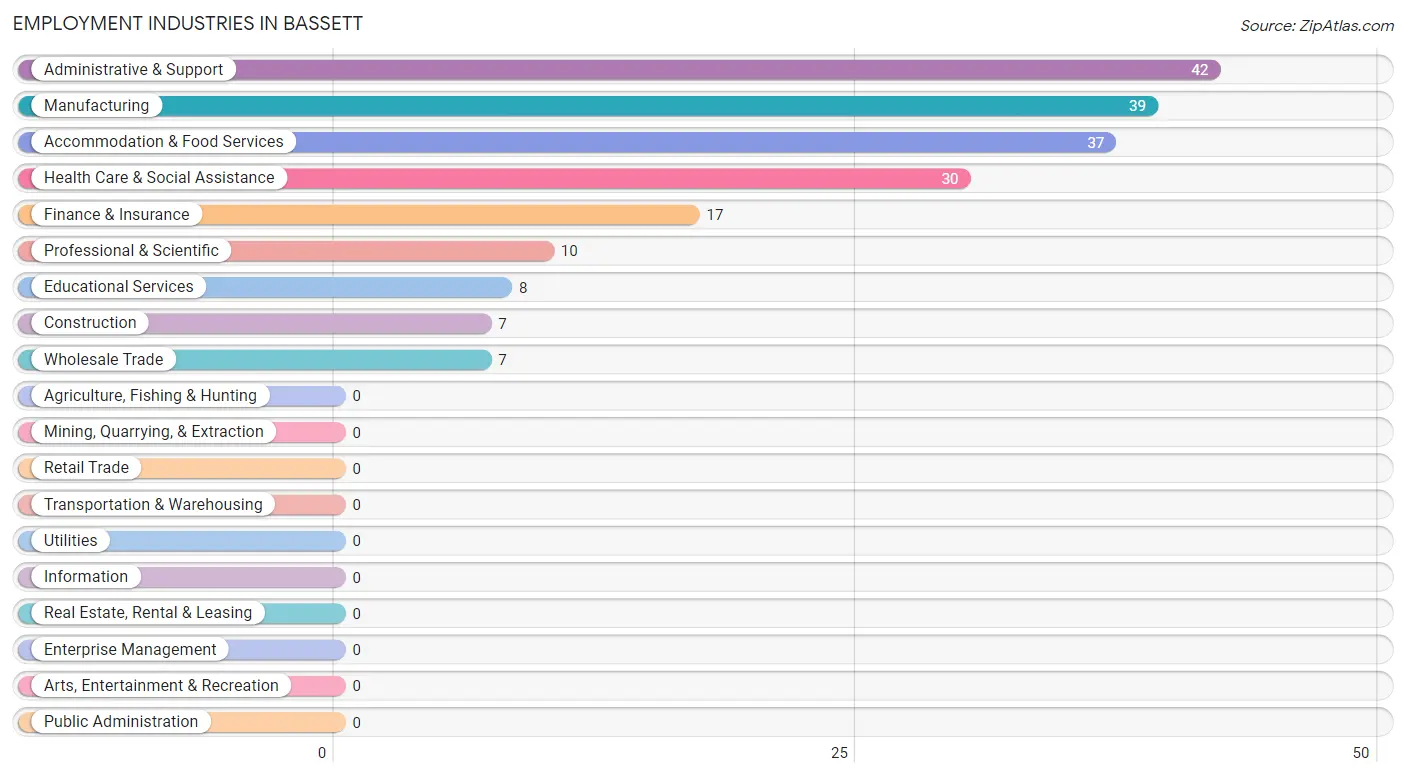
Employment Industries in Bassett
The major employment industries in Bassett include Administrative & Support (42 | 21.3%), Manufacturing (39 | 19.8%), Accommodation & Food Services (37 | 18.8%), Health Care & Social Assistance (30 | 15.2%), and Finance & Insurance (17 | 8.6%).
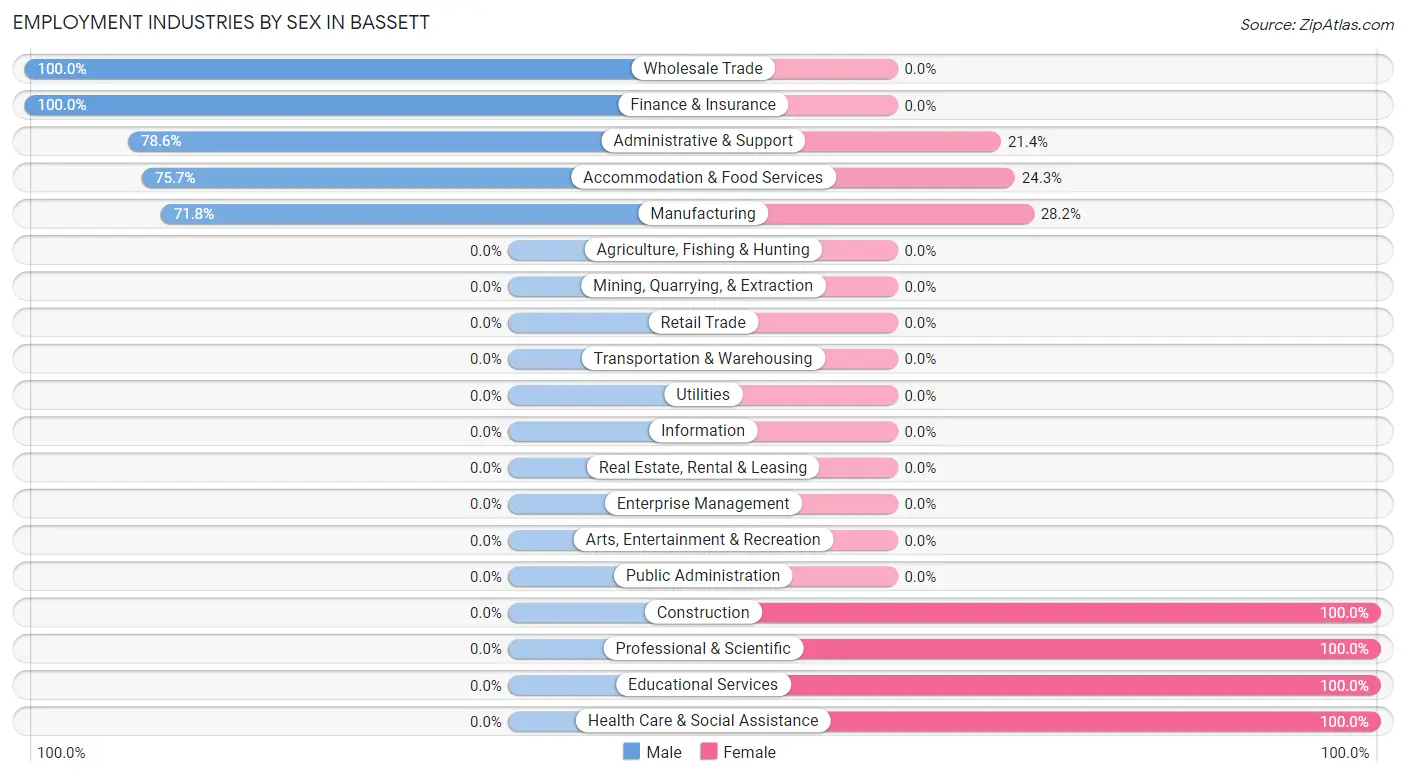
Employment Industries by Sex in Bassett
The Bassett industries that see more men than women are Wholesale Trade (100.0%), Finance & Insurance (100.0%), and Administrative & Support (78.6%), whereas the industries that tend to have a higher number of women are Construction (100.0%), Professional & Scientific (100.0%), and Educational Services (100.0%).
| Industry | Male | Female |
| Agriculture, Fishing & Hunting | 0 (0.0%) | 0 (0.0%) |
| Mining, Quarrying, & Extraction | 0 (0.0%) | 0 (0.0%) |
| Construction | 0 (0.0%) | 7 (100.0%) |
| Manufacturing | 28 (71.8%) | 11 (28.2%) |
| Wholesale Trade | 7 (100.0%) | 0 (0.0%) |
| Retail Trade | 0 (0.0%) | 0 (0.0%) |
| Transportation & Warehousing | 0 (0.0%) | 0 (0.0%) |
| Utilities | 0 (0.0%) | 0 (0.0%) |
| Information | 0 (0.0%) | 0 (0.0%) |
| Finance & Insurance | 17 (100.0%) | 0 (0.0%) |
| Real Estate, Rental & Leasing | 0 (0.0%) | 0 (0.0%) |
| Professional & Scientific | 0 (0.0%) | 10 (100.0%) |
| Enterprise Management | 0 (0.0%) | 0 (0.0%) |
| Administrative & Support | 33 (78.6%) | 9 (21.4%) |
| Educational Services | 0 (0.0%) | 8 (100.0%) |
| Health Care & Social Assistance | 0 (0.0%) | 30 (100.0%) |
| Arts, Entertainment & Recreation | 0 (0.0%) | 0 (0.0%) |
| Accommodation & Food Services | 28 (75.7%) | 9 (24.3%) |
| Public Administration | 0 (0.0%) | 0 (0.0%) |
| Total | 113 (57.4%) | 84 (42.6%) |
Education in Bassett
School Enrollment in Bassett
The most common levels of schooling among the 223 students in Bassett are college / undergraduate (66 | 29.6%), middle school (63 | 28.2%), and high school (61 | 27.4%).
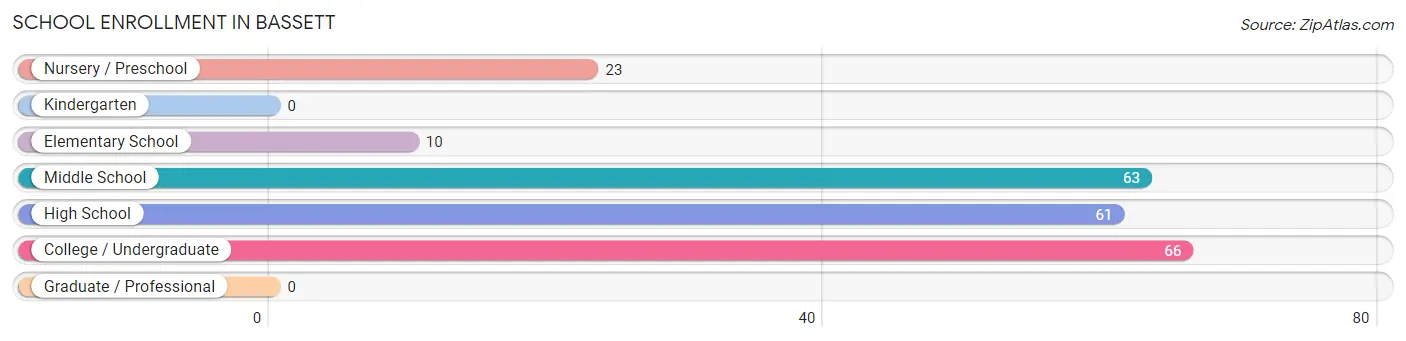
| School Level | # Students | % Students |
| Nursery / Preschool | 23 | 10.3% |
| Kindergarten | 0 | 0.0% |
| Elementary School | 10 | 4.5% |
| Middle School | 63 | 28.2% |
| High School | 61 | 27.4% |
| College / Undergraduate | 66 | 29.6% |
| Graduate / Professional | 0 | 0.0% |
| Total | 223 | 100.0% |
School Enrollment by Age by Funding Source in Bassett
Out of a total of 223 students who are enrolled in schools in Bassett, 50 (22.4%) attend a private institution, while the remaining 173 (77.6%) are enrolled in public schools. The age group of 10 to 14 year olds has the highest likelihood of being enrolled in private schools, with 43 (68.2% in the age bracket) enrolled. Conversely, the age group of 3 to 4 year olds has the lowest likelihood of being enrolled in a private school, with 13 (100.0% in the age bracket) attending a public institution.
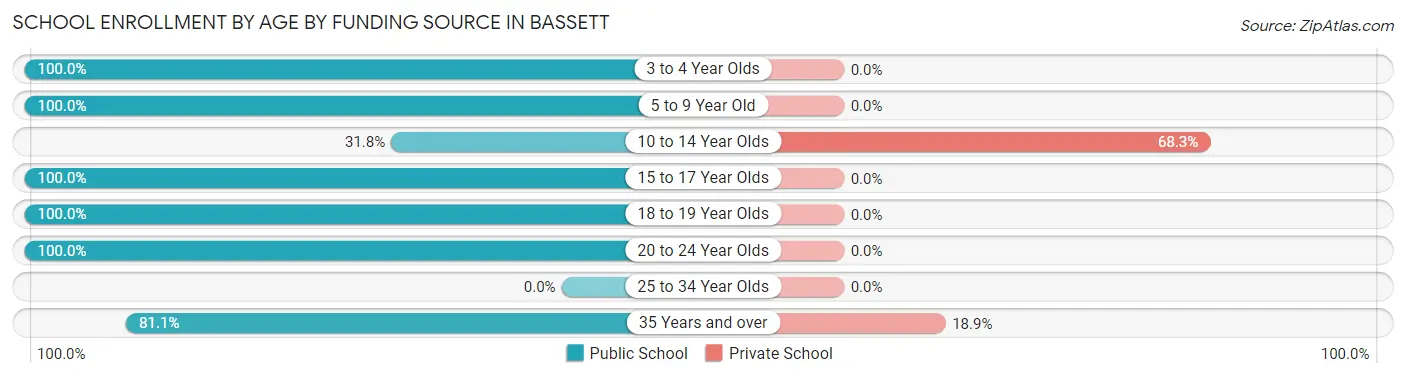
| Age Bracket | Public School | Private School |
| 3 to 4 Year Olds | 13 (100.0%) | 0 (0.0%) |
| 5 to 9 Year Old | 20 (100.0%) | 0 (0.0%) |
| 10 to 14 Year Olds | 20 (31.8%) | 43 (68.2%) |
| 15 to 17 Year Olds | 61 (100.0%) | 0 (0.0%) |
| 18 to 19 Year Olds | 19 (100.0%) | 0 (0.0%) |
| 20 to 24 Year Olds | 10 (100.0%) | 0 (0.0%) |
| 25 to 34 Year Olds | 0 (0.0%) | 0 (0.0%) |
| 35 Years and over | 30 (81.1%) | 7 (18.9%) |
| Total | 173 (77.6%) | 50 (22.4%) |
Educational Attainment by Field of Study in Bassett
Business (38 | 32.2%), education (27 | 22.9%), social sciences (20 | 17.0%), engineering (14 | 11.9%), and computers & mathematics (11 | 9.3%) are the most common fields of study among 118 individuals in Bassett who have obtained a bachelor's degree or higher.
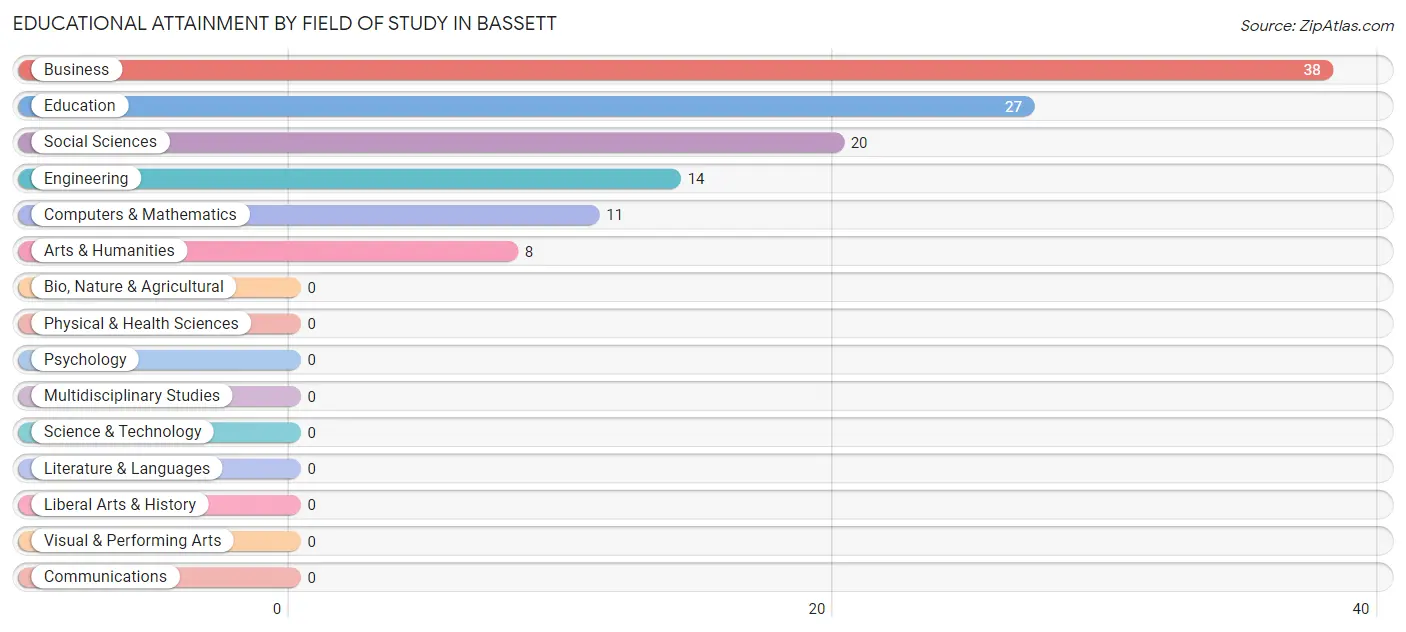
| Field of Study | # Graduates | % Graduates |
| Computers & Mathematics | 11 | 9.3% |
| Bio, Nature & Agricultural | 0 | 0.0% |
| Physical & Health Sciences | 0 | 0.0% |
| Psychology | 0 | 0.0% |
| Social Sciences | 20 | 17.0% |
| Engineering | 14 | 11.9% |
| Multidisciplinary Studies | 0 | 0.0% |
| Science & Technology | 0 | 0.0% |
| Business | 38 | 32.2% |
| Education | 27 | 22.9% |
| Literature & Languages | 0 | 0.0% |
| Liberal Arts & History | 0 | 0.0% |
| Visual & Performing Arts | 0 | 0.0% |
| Communications | 0 | 0.0% |
| Arts & Humanities | 8 | 6.8% |
| Total | 118 | 100.0% |
Transportation & Commute in Bassett
Vehicle Availability by Sex in Bassett
The most prevalent vehicle ownership categories in Bassett are males with 2 vehicles (39, accounting for 34.5%) and females with 2 vehicles (21, making up 46.4%).
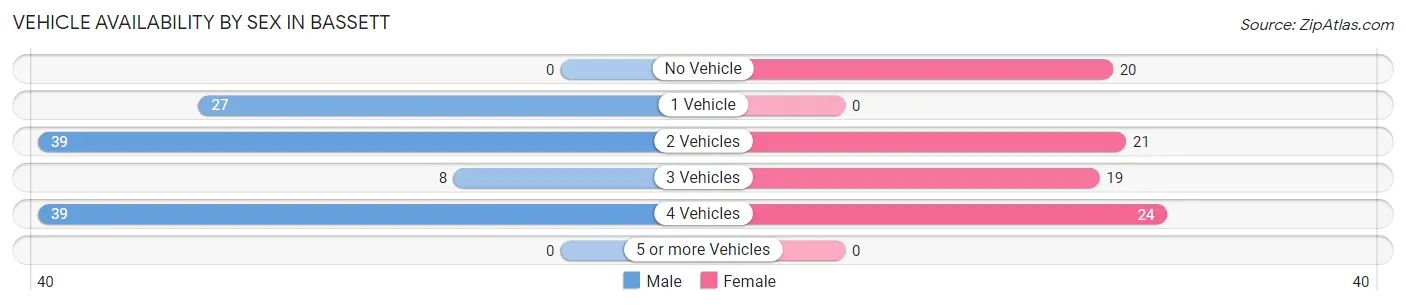
| Vehicles Available | Male | Female |
| No Vehicle | 0 (0.0%) | 20 (23.8%) |
| 1 Vehicle | 27 (23.9%) | 0 (0.0%) |
| 2 Vehicles | 39 (34.5%) | 21 (25.0%) |
| 3 Vehicles | 8 (7.1%) | 19 (22.6%) |
| 4 Vehicles | 39 (34.5%) | 24 (28.6%) |
| 5 or more Vehicles | 0 (0.0%) | 0 (0.0%) |
| Total | 113 (100.0%) | 84 (100.0%) |
Commute Time in Bassett
The most frequently occuring commute durations in Bassett are 20 to 24 minutes (50 commuters, 29.4%), 15 to 19 minutes (45 commuters, 26.5%), and less than 5 minutes (34 commuters, 20.0%).
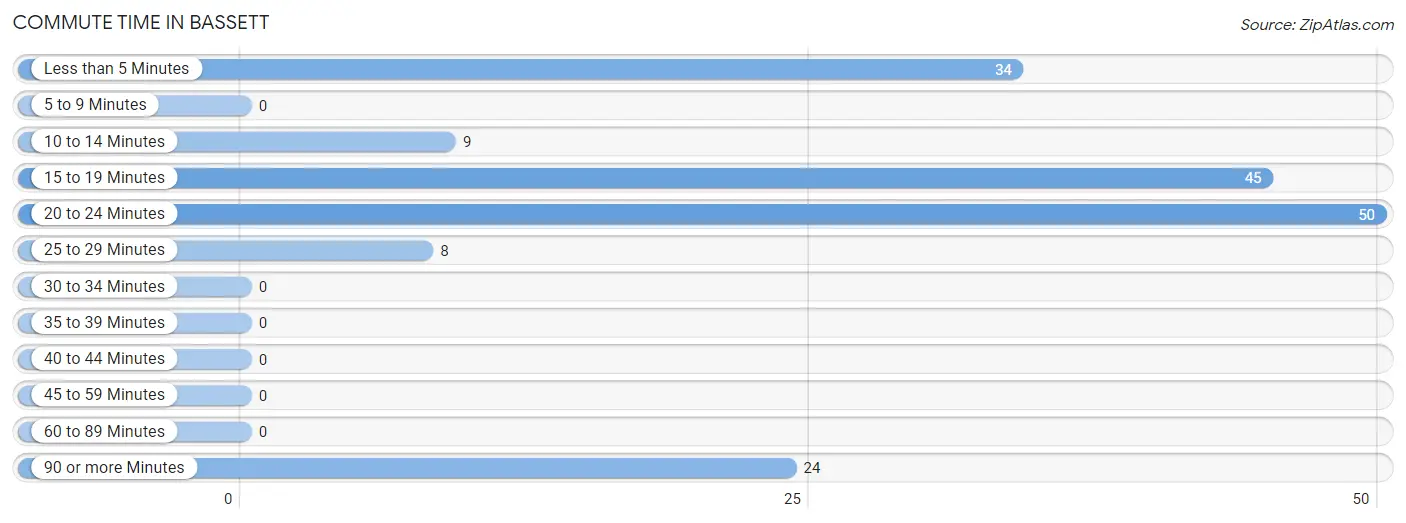
| Commute Time | # Commuters | % Commuters |
| Less than 5 Minutes | 34 | 20.0% |
| 5 to 9 Minutes | 0 | 0.0% |
| 10 to 14 Minutes | 9 | 5.3% |
| 15 to 19 Minutes | 45 | 26.5% |
| 20 to 24 Minutes | 50 | 29.4% |
| 25 to 29 Minutes | 8 | 4.7% |
| 30 to 34 Minutes | 0 | 0.0% |
| 35 to 39 Minutes | 0 | 0.0% |
| 40 to 44 Minutes | 0 | 0.0% |
| 45 to 59 Minutes | 0 | 0.0% |
| 60 to 89 Minutes | 0 | 0.0% |
| 90 or more Minutes | 24 | 14.1% |
Commute Time by Sex in Bassett
The most common commute times in Bassett are 20 to 24 minutes (35 commuters, 31.0%) for males and 15 to 19 minutes (18 commuters, 31.6%) for females.
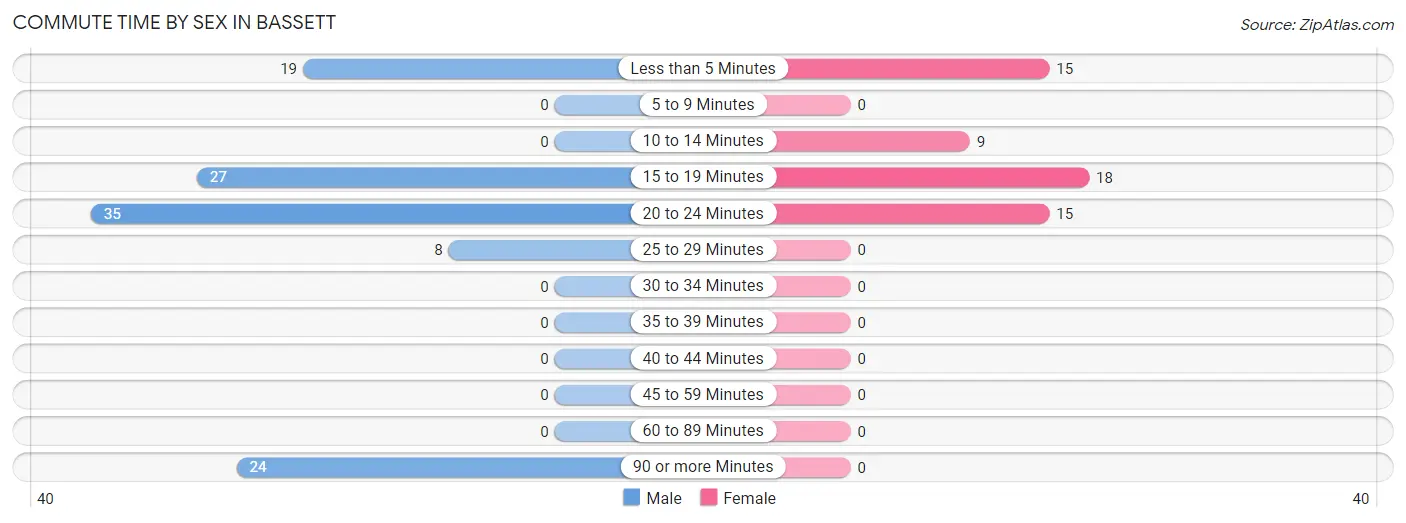
| Commute Time | Male | Female |
| Less than 5 Minutes | 19 (16.8%) | 15 (26.3%) |
| 5 to 9 Minutes | 0 (0.0%) | 0 (0.0%) |
| 10 to 14 Minutes | 0 (0.0%) | 9 (15.8%) |
| 15 to 19 Minutes | 27 (23.9%) | 18 (31.6%) |
| 20 to 24 Minutes | 35 (31.0%) | 15 (26.3%) |
| 25 to 29 Minutes | 8 (7.1%) | 0 (0.0%) |
| 30 to 34 Minutes | 0 (0.0%) | 0 (0.0%) |
| 35 to 39 Minutes | 0 (0.0%) | 0 (0.0%) |
| 40 to 44 Minutes | 0 (0.0%) | 0 (0.0%) |
| 45 to 59 Minutes | 0 (0.0%) | 0 (0.0%) |
| 60 to 89 Minutes | 0 (0.0%) | 0 (0.0%) |
| 90 or more Minutes | 24 (21.2%) | 0 (0.0%) |
Time of Departure to Work by Sex in Bassett
The most frequent times of departure to work in Bassett are 6:00 AM to 6:29 AM (33, 29.2%) for males and 8:00 AM to 8:29 AM (17, 29.8%) for females.
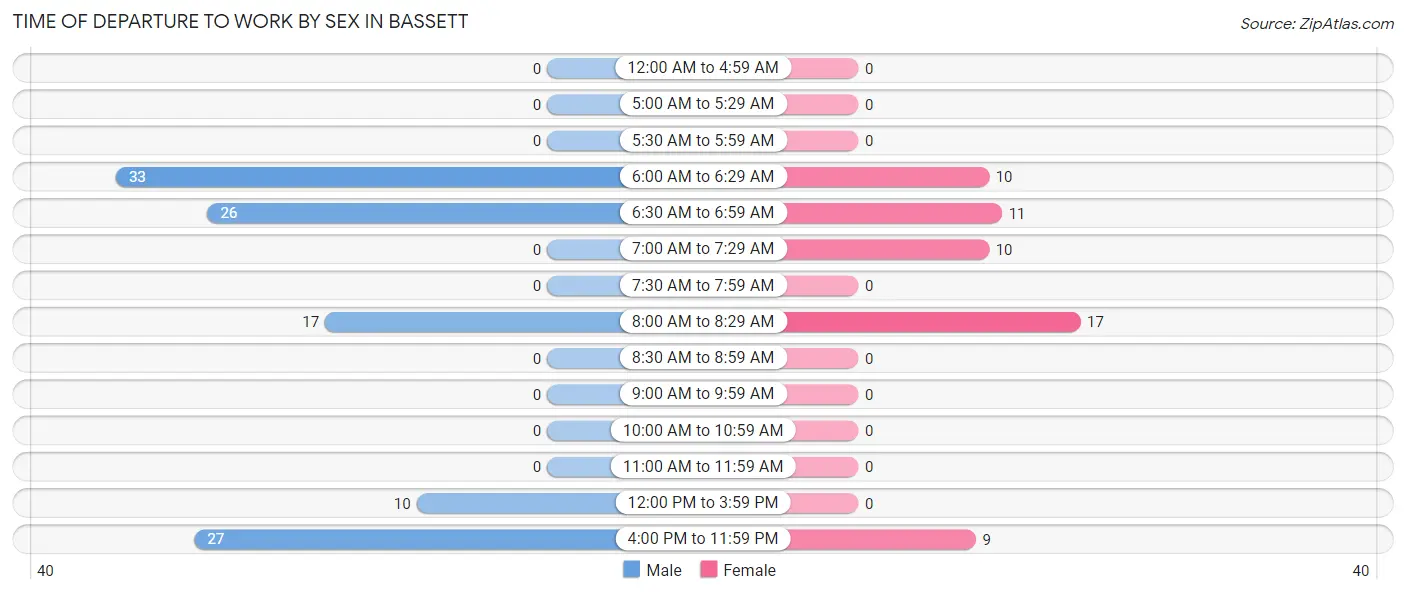
| Time of Departure | Male | Female |
| 12:00 AM to 4:59 AM | 0 (0.0%) | 0 (0.0%) |
| 5:00 AM to 5:29 AM | 0 (0.0%) | 0 (0.0%) |
| 5:30 AM to 5:59 AM | 0 (0.0%) | 0 (0.0%) |
| 6:00 AM to 6:29 AM | 33 (29.2%) | 10 (17.5%) |
| 6:30 AM to 6:59 AM | 26 (23.0%) | 11 (19.3%) |
| 7:00 AM to 7:29 AM | 0 (0.0%) | 10 (17.5%) |
| 7:30 AM to 7:59 AM | 0 (0.0%) | 0 (0.0%) |
| 8:00 AM to 8:29 AM | 17 (15.0%) | 17 (29.8%) |
| 8:30 AM to 8:59 AM | 0 (0.0%) | 0 (0.0%) |
| 9:00 AM to 9:59 AM | 0 (0.0%) | 0 (0.0%) |
| 10:00 AM to 10:59 AM | 0 (0.0%) | 0 (0.0%) |
| 11:00 AM to 11:59 AM | 0 (0.0%) | 0 (0.0%) |
| 12:00 PM to 3:59 PM | 10 (8.8%) | 0 (0.0%) |
| 4:00 PM to 11:59 PM | 27 (23.9%) | 9 (15.8%) |
| Total | 113 (100.0%) | 57 (100.0%) |
Housing Occupancy in Bassett
Occupancy by Ownership in Bassett
Of the total 318 dwellings in Bassett, owner-occupied units account for 220 (69.2%), while renter-occupied units make up 98 (30.8%).
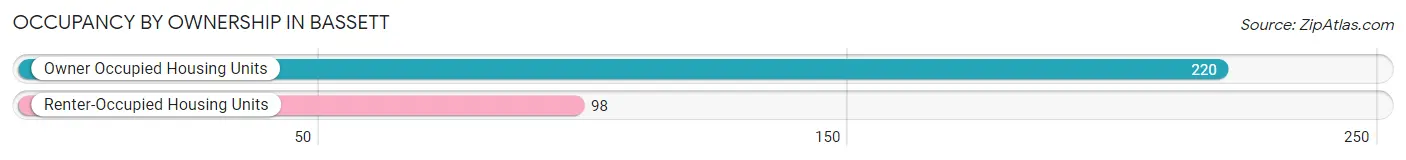
| Occupancy | # Housing Units | % Housing Units |
| Owner Occupied Housing Units | 220 | 69.2% |
| Renter-Occupied Housing Units | 98 | 30.8% |
| Total Occupied Housing Units | 318 | 100.0% |
Occupancy by Household Size in Bassett
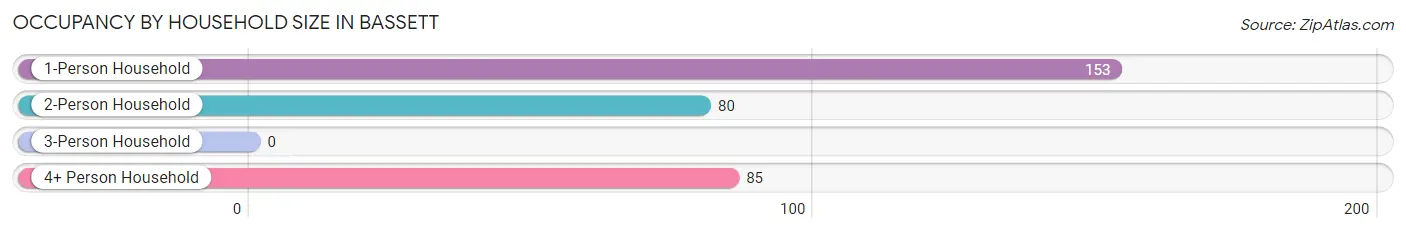
| Household Size | # Housing Units | % Housing Units |
| 1-Person Household | 153 | 48.1% |
| 2-Person Household | 80 | 25.2% |
| 3-Person Household | 0 | 0.0% |
| 4+ Person Household | 85 | 26.7% |
| Total Housing Units | 318 | 100.0% |
Occupancy by Ownership by Household Size in Bassett
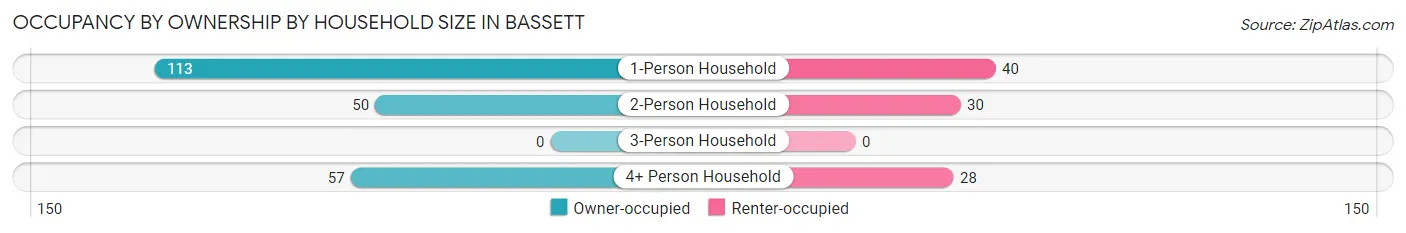
| Household Size | Owner-occupied | Renter-occupied |
| 1-Person Household | 113 (73.9%) | 40 (26.1%) |
| 2-Person Household | 50 (62.5%) | 30 (37.5%) |
| 3-Person Household | 0 (0.0%) | 0 (0.0%) |
| 4+ Person Household | 57 (67.1%) | 28 (32.9%) |
| Total Housing Units | 220 (69.2%) | 98 (30.8%) |
Occupancy by Educational Attainment in Bassett
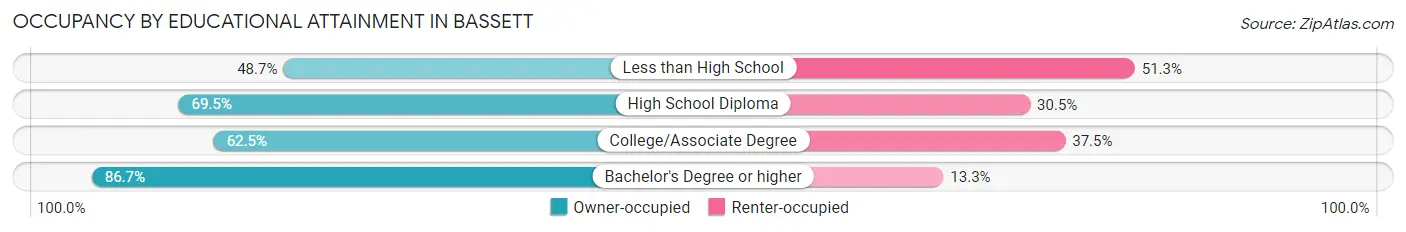
| Household Size | Owner-occupied | Renter-occupied |
| Less than High School | 38 (48.7%) | 40 (51.3%) |
| High School Diploma | 66 (69.5%) | 29 (30.5%) |
| College/Associate Degree | 25 (62.5%) | 15 (37.5%) |
| Bachelor's Degree or higher | 91 (86.7%) | 14 (13.3%) |
Occupancy by Age of Householder in Bassett
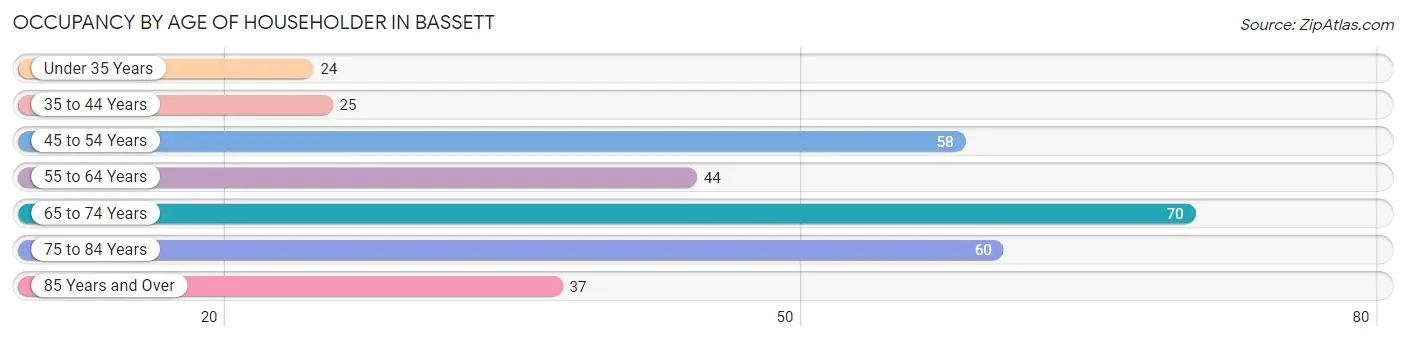
| Age Bracket | # Households | % Households |
| Under 35 Years | 24 | 7.5% |
| 35 to 44 Years | 25 | 7.9% |
| 45 to 54 Years | 58 | 18.2% |
| 55 to 64 Years | 44 | 13.8% |
| 65 to 74 Years | 70 | 22.0% |
| 75 to 84 Years | 60 | 18.9% |
| 85 Years and Over | 37 | 11.6% |
| Total | 318 | 100.0% |
Housing Finances in Bassett
Median Income by Occupancy in Bassett
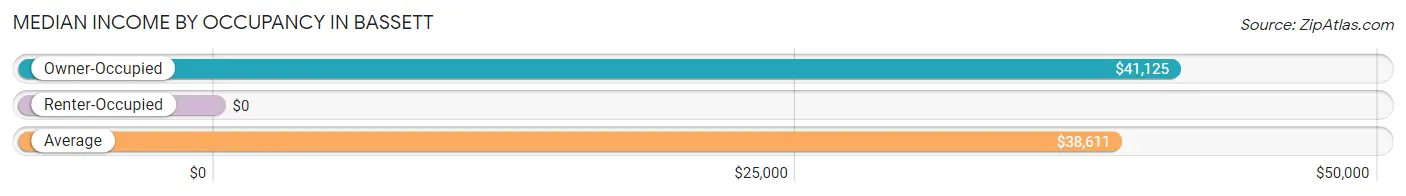
| Occupancy Type | # Households | Median Income |
| Owner-Occupied | 220 (69.2%) | $41,125 |
| Renter-Occupied | 98 (30.8%) | $0 |
| Average | 318 (100.0%) | $38,611 |
Occupancy by Householder Income Bracket in Bassett
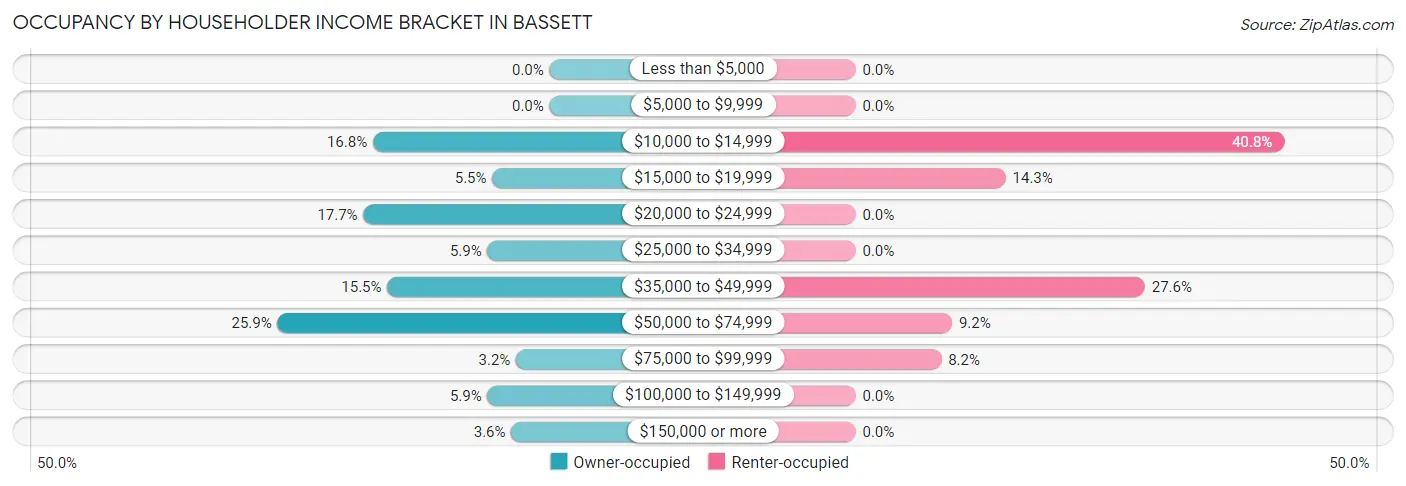
| Income Bracket | Owner-occupied | Renter-occupied |
| Less than $5,000 | 0 (0.0%) | 0 (0.0%) |
| $5,000 to $9,999 | 0 (0.0%) | 0 (0.0%) |
| $10,000 to $14,999 | 37 (16.8%) | 40 (40.8%) |
| $15,000 to $19,999 | 12 (5.4%) | 14 (14.3%) |
| $20,000 to $24,999 | 39 (17.7%) | 0 (0.0%) |
| $25,000 to $34,999 | 13 (5.9%) | 0 (0.0%) |
| $35,000 to $49,999 | 34 (15.4%) | 27 (27.6%) |
| $50,000 to $74,999 | 57 (25.9%) | 9 (9.2%) |
| $75,000 to $99,999 | 7 (3.2%) | 8 (8.2%) |
| $100,000 to $149,999 | 13 (5.9%) | 0 (0.0%) |
| $150,000 or more | 8 (3.6%) | 0 (0.0%) |
| Total | 220 (100.0%) | 98 (100.0%) |
Monthly Housing Cost Tiers in Bassett
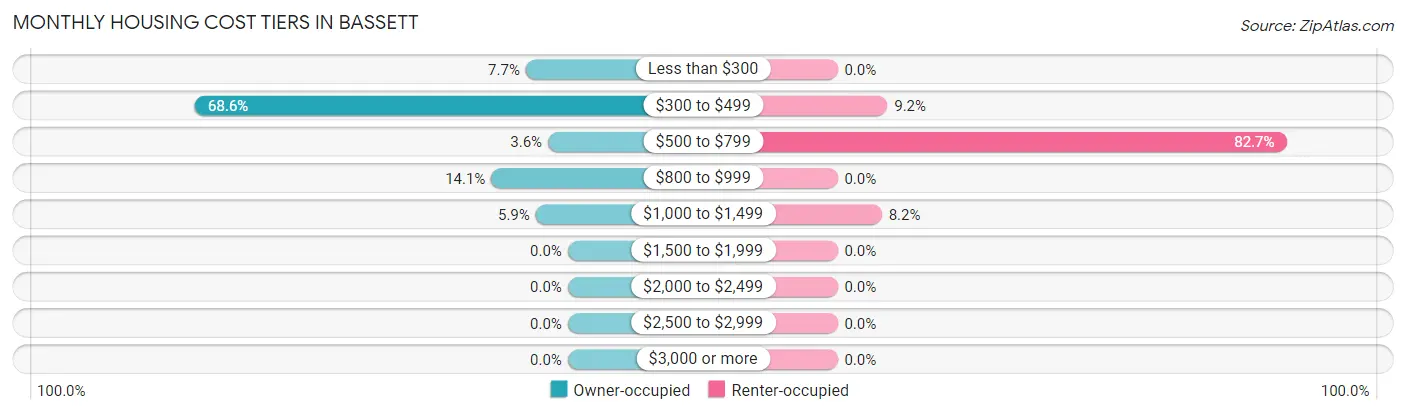
| Monthly Cost | Owner-occupied | Renter-occupied |
| Less than $300 | 17 (7.7%) | 0 (0.0%) |
| $300 to $499 | 151 (68.6%) | 9 (9.2%) |
| $500 to $799 | 8 (3.6%) | 81 (82.7%) |
| $800 to $999 | 31 (14.1%) | 0 (0.0%) |
| $1,000 to $1,499 | 13 (5.9%) | 8 (8.2%) |
| $1,500 to $1,999 | 0 (0.0%) | 0 (0.0%) |
| $2,000 to $2,499 | 0 (0.0%) | 0 (0.0%) |
| $2,500 to $2,999 | 0 (0.0%) | 0 (0.0%) |
| $3,000 or more | 0 (0.0%) | 0 (0.0%) |
| Total | 220 (100.0%) | 98 (100.0%) |
Physical Housing Characteristics in Bassett
Housing Structures in Bassett
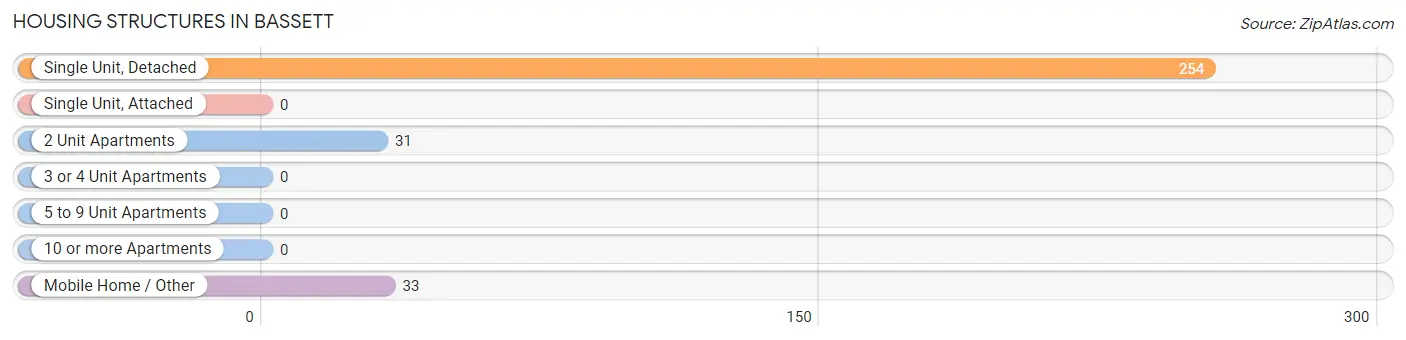
| Structure Type | # Housing Units | % Housing Units |
| Single Unit, Detached | 254 | 79.9% |
| Single Unit, Attached | 0 | 0.0% |
| 2 Unit Apartments | 31 | 9.8% |
| 3 or 4 Unit Apartments | 0 | 0.0% |
| 5 to 9 Unit Apartments | 0 | 0.0% |
| 10 or more Apartments | 0 | 0.0% |
| Mobile Home / Other | 33 | 10.4% |
| Total | 318 | 100.0% |
Housing Structures by Occupancy in Bassett
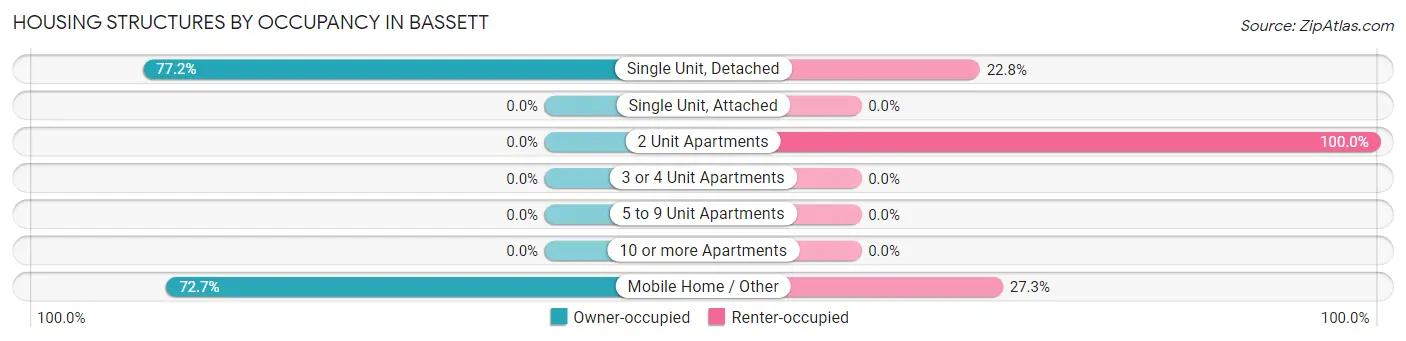
| Structure Type | Owner-occupied | Renter-occupied |
| Single Unit, Detached | 196 (77.2%) | 58 (22.8%) |
| Single Unit, Attached | 0 (0.0%) | 0 (0.0%) |
| 2 Unit Apartments | 0 (0.0%) | 31 (100.0%) |
| 3 or 4 Unit Apartments | 0 (0.0%) | 0 (0.0%) |
| 5 to 9 Unit Apartments | 0 (0.0%) | 0 (0.0%) |
| 10 or more Apartments | 0 (0.0%) | 0 (0.0%) |
| Mobile Home / Other | 24 (72.7%) | 9 (27.3%) |
| Total | 220 (69.2%) | 98 (30.8%) |
Housing Structures by Number of Rooms in Bassett
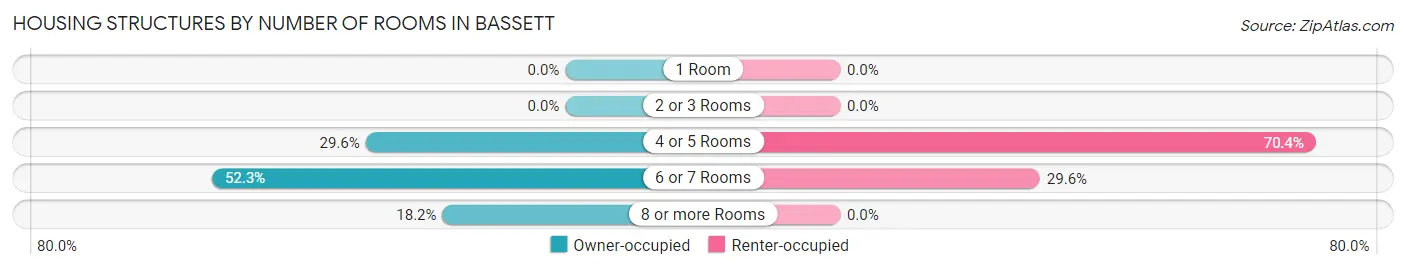
| Number of Rooms | Owner-occupied | Renter-occupied |
| 1 Room | 0 (0.0%) | 0 (0.0%) |
| 2 or 3 Rooms | 0 (0.0%) | 0 (0.0%) |
| 4 or 5 Rooms | 65 (29.5%) | 69 (70.4%) |
| 6 or 7 Rooms | 115 (52.3%) | 29 (29.6%) |
| 8 or more Rooms | 40 (18.2%) | 0 (0.0%) |
| Total | 220 (100.0%) | 98 (100.0%) |
Housing Structure by Heating Type in Bassett
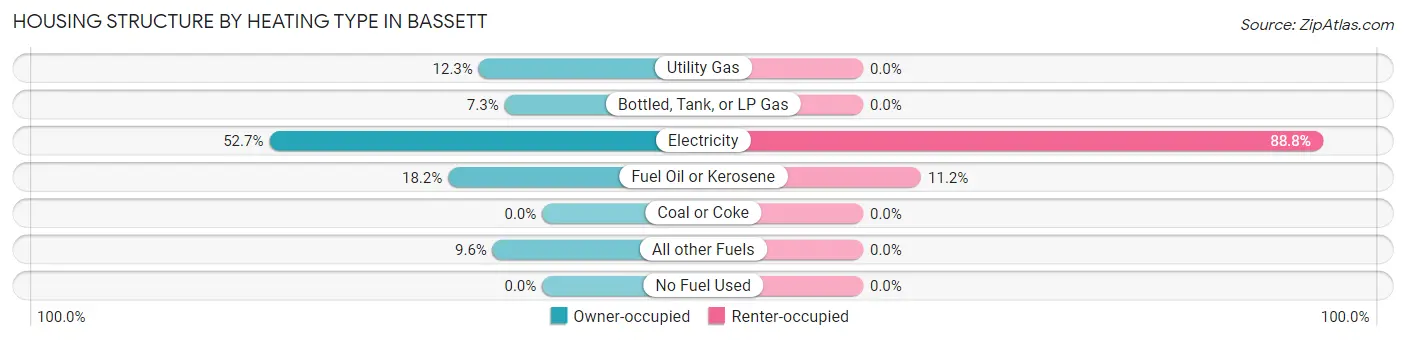
| Heating Type | Owner-occupied | Renter-occupied |
| Utility Gas | 27 (12.3%) | 0 (0.0%) |
| Bottled, Tank, or LP Gas | 16 (7.3%) | 0 (0.0%) |
| Electricity | 116 (52.7%) | 87 (88.8%) |
| Fuel Oil or Kerosene | 40 (18.2%) | 11 (11.2%) |
| Coal or Coke | 0 (0.0%) | 0 (0.0%) |
| All other Fuels | 21 (9.6%) | 0 (0.0%) |
| No Fuel Used | 0 (0.0%) | 0 (0.0%) |
| Total | 220 (100.0%) | 98 (100.0%) |
Household Vehicle Usage in Bassett
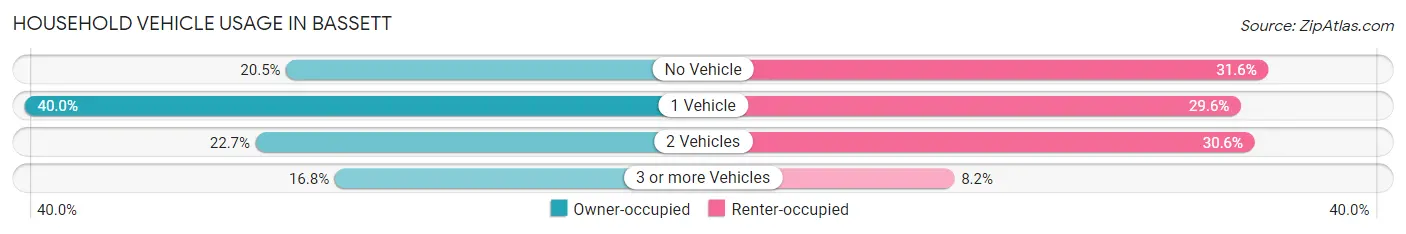
| Vehicles per Household | Owner-occupied | Renter-occupied |
| No Vehicle | 45 (20.4%) | 31 (31.6%) |
| 1 Vehicle | 88 (40.0%) | 29 (29.6%) |
| 2 Vehicles | 50 (22.7%) | 30 (30.6%) |
| 3 or more Vehicles | 37 (16.8%) | 8 (8.2%) |
| Total | 220 (100.0%) | 98 (100.0%) |
Real Estate & Mortgages in Bassett
Real Estate and Mortgage Overview in Bassett
| Characteristic | Without Mortgage | With Mortgage |
| Housing Units | 168 | 52 |
| Median Property Value | $99,200 | $97,500 |
| Median Household Income | $40,875 | $0 |
| Monthly Housing Costs | $344 | $0 |
| Real Estate Taxes | $500 | $0 |
Property Value by Mortgage Status in Bassett
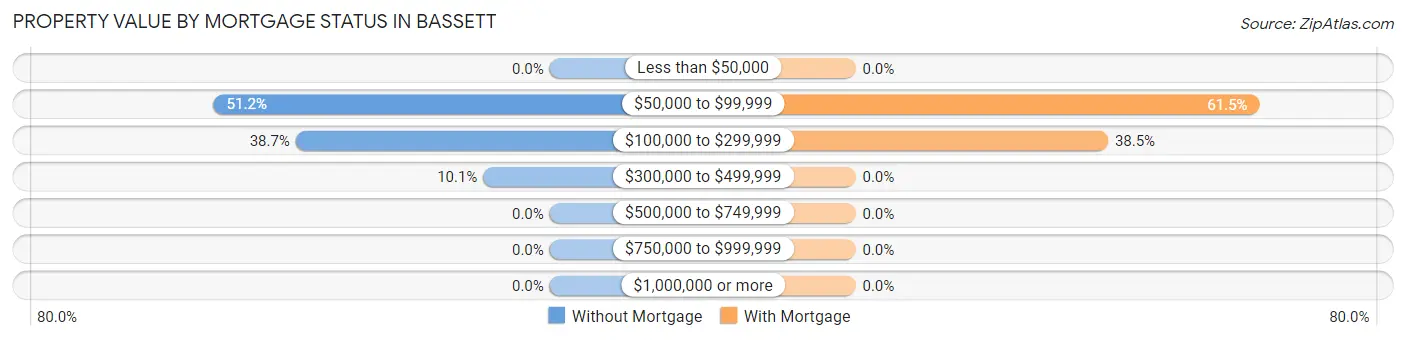
| Property Value | Without Mortgage | With Mortgage |
| Less than $50,000 | 0 (0.0%) | 0 (0.0%) |
| $50,000 to $99,999 | 86 (51.2%) | 32 (61.5%) |
| $100,000 to $299,999 | 65 (38.7%) | 20 (38.5%) |
| $300,000 to $499,999 | 17 (10.1%) | 0 (0.0%) |
| $500,000 to $749,999 | 0 (0.0%) | 0 (0.0%) |
| $750,000 to $999,999 | 0 (0.0%) | 0 (0.0%) |
| $1,000,000 or more | 0 (0.0%) | 0 (0.0%) |
| Total | 168 (100.0%) | 52 (100.0%) |
Household Income by Mortgage Status in Bassett
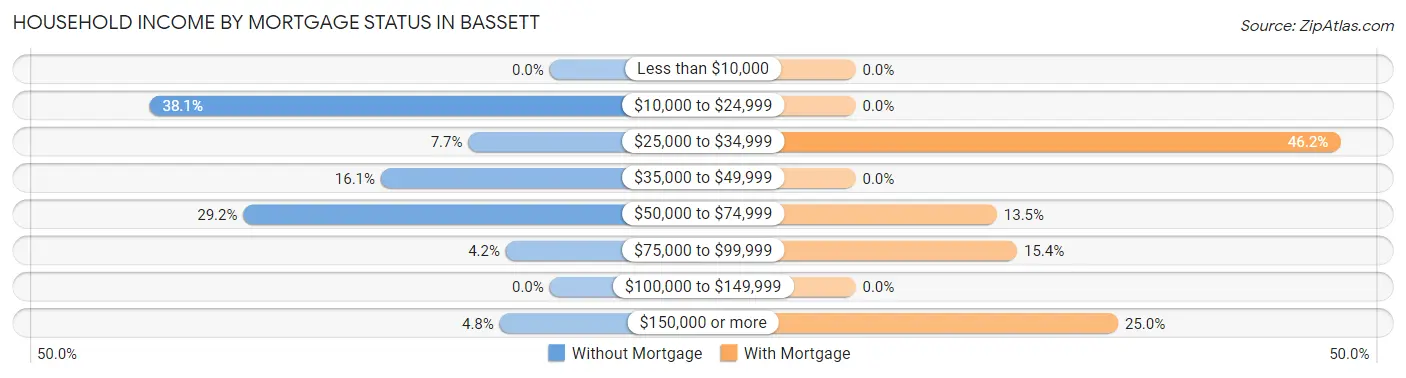
| Household Income | Without Mortgage | With Mortgage |
| Less than $10,000 | 0 (0.0%) | 0 (0.0%) |
| $10,000 to $24,999 | 64 (38.1%) | 0 (0.0%) |
| $25,000 to $34,999 | 13 (7.7%) | 24 (46.2%) |
| $35,000 to $49,999 | 27 (16.1%) | 0 (0.0%) |
| $50,000 to $74,999 | 49 (29.2%) | 7 (13.5%) |
| $75,000 to $99,999 | 7 (4.2%) | 8 (15.4%) |
| $100,000 to $149,999 | 0 (0.0%) | 0 (0.0%) |
| $150,000 or more | 8 (4.8%) | 13 (25.0%) |
| Total | 168 (100.0%) | 52 (100.0%) |
Property Value to Household Income Ratio in Bassett
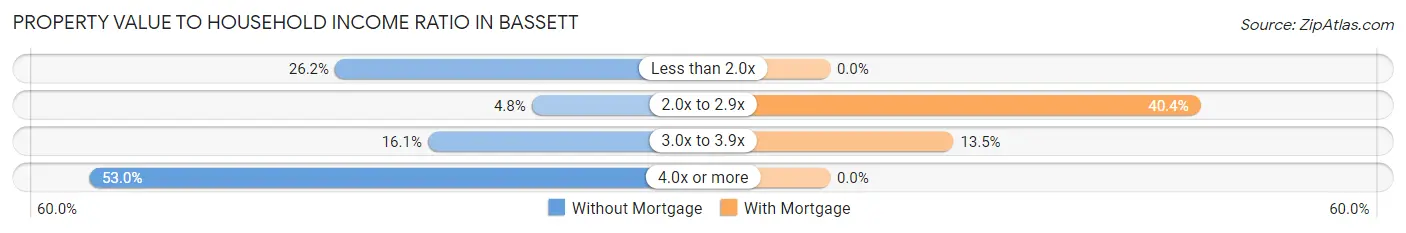
| Value-to-Income Ratio | Without Mortgage | With Mortgage |
| Less than 2.0x | 44 (26.2%) | 0 (0.0%) |
| 2.0x to 2.9x | 8 (4.8%) | 21 (40.4%) |
| 3.0x to 3.9x | 27 (16.1%) | 7 (13.5%) |
| 4.0x or more | 89 (53.0%) | 0 (0.0%) |
| Total | 168 (100.0%) | 52 (100.0%) |
Real Estate Taxes by Mortgage Status in Bassett
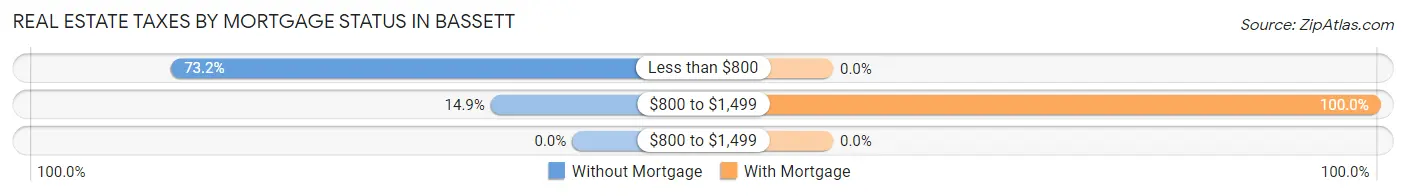
| Property Taxes | Without Mortgage | With Mortgage |
| Less than $800 | 123 (73.2%) | 0 (0.0%) |
| $800 to $1,499 | 25 (14.9%) | 52 (100.0%) |
| $800 to $1,499 | 0 (0.0%) | 0 (0.0%) |
| Total | 168 (100.0%) | 52 (100.0%) |
Health & Disability in Bassett
Health Insurance Coverage by Age in Bassett
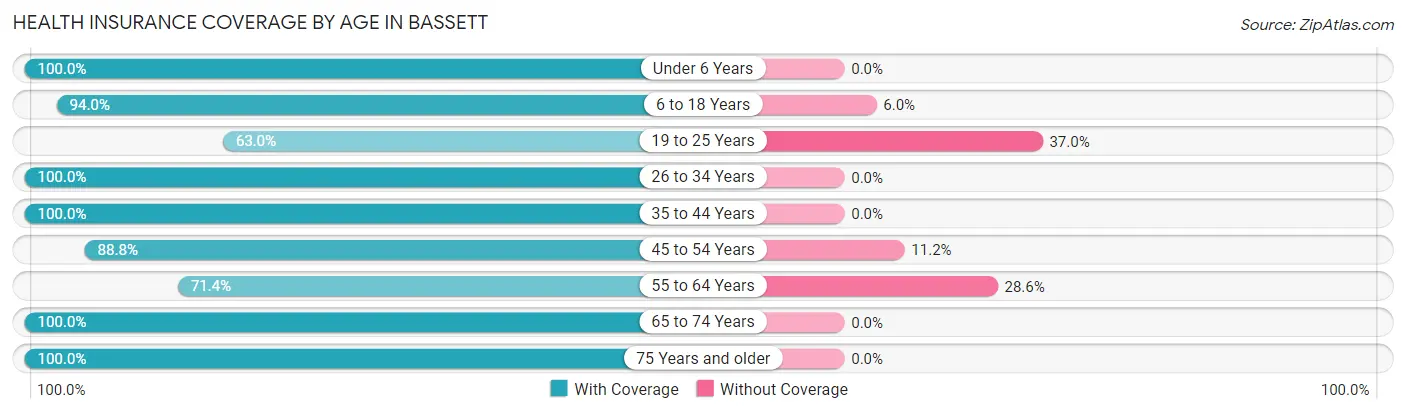
| Age Bracket | With Coverage | Without Coverage |
| Under 6 Years | 47 (100.0%) | 0 (0.0%) |
| 6 to 18 Years | 126 (94.0%) | 8 (6.0%) |
| 19 to 25 Years | 29 (63.0%) | 17 (37.0%) |
| 26 to 34 Years | 74 (100.0%) | 0 (0.0%) |
| 35 to 44 Years | 54 (100.0%) | 0 (0.0%) |
| 45 to 54 Years | 95 (88.8%) | 12 (11.2%) |
| 55 to 64 Years | 75 (71.4%) | 30 (28.6%) |
| 65 to 74 Years | 75 (100.0%) | 0 (0.0%) |
| 75 Years and older | 133 (100.0%) | 0 (0.0%) |
| Total | 708 (91.3%) | 67 (8.6%) |
Health Insurance Coverage by Citizenship Status in Bassett
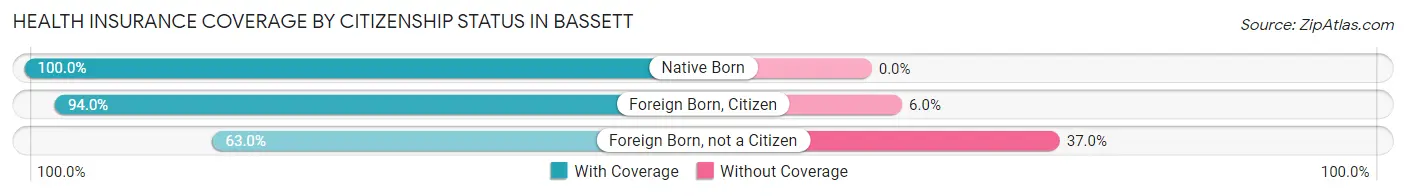
| Citizenship Status | With Coverage | Without Coverage |
| Native Born | 47 (100.0%) | 0 (0.0%) |
| Foreign Born, Citizen | 126 (94.0%) | 8 (6.0%) |
| Foreign Born, not a Citizen | 29 (63.0%) | 17 (37.0%) |
Health Insurance Coverage by Household Income in Bassett
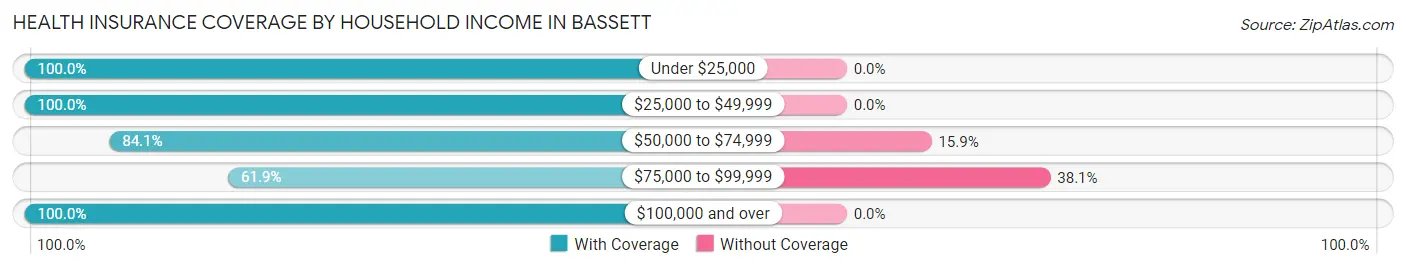
| Household Income | With Coverage | Without Coverage |
| Under $25,000 | 243 (100.0%) | 0 (0.0%) |
| $25,000 to $49,999 | 191 (100.0%) | 0 (0.0%) |
| $50,000 to $74,999 | 159 (84.1%) | 30 (15.9%) |
| $75,000 to $99,999 | 60 (61.9%) | 37 (38.1%) |
| $100,000 and over | 50 (100.0%) | 0 (0.0%) |
Public vs Private Health Insurance Coverage by Age in Bassett
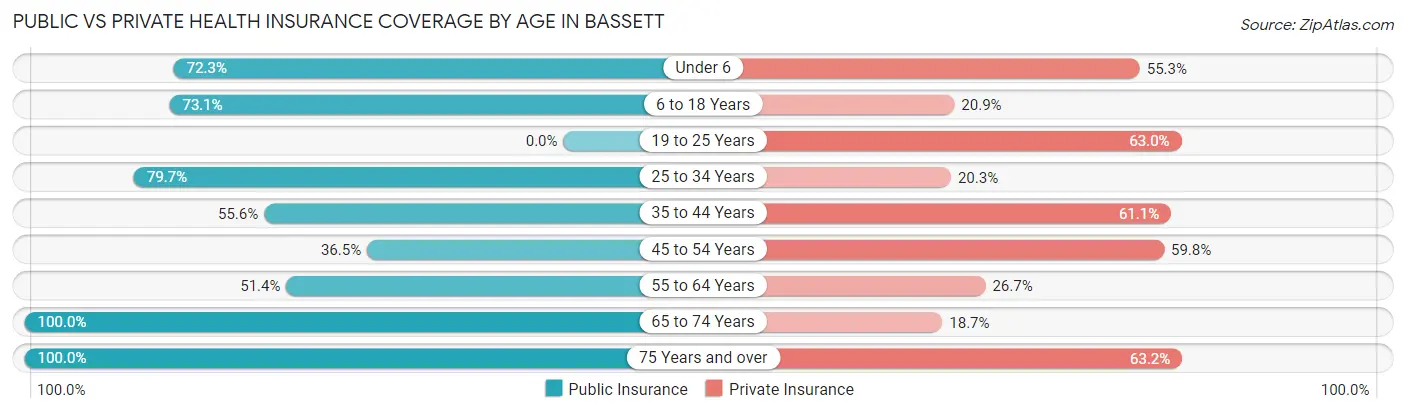
| Age Bracket | Public Insurance | Private Insurance |
| Under 6 | 34 (72.3%) | 26 (55.3%) |
| 6 to 18 Years | 98 (73.1%) | 28 (20.9%) |
| 19 to 25 Years | 0 (0.0%) | 29 (63.0%) |
| 25 to 34 Years | 59 (79.7%) | 15 (20.3%) |
| 35 to 44 Years | 30 (55.6%) | 33 (61.1%) |
| 45 to 54 Years | 39 (36.4%) | 64 (59.8%) |
| 55 to 64 Years | 54 (51.4%) | 28 (26.7%) |
| 65 to 74 Years | 75 (100.0%) | 14 (18.7%) |
| 75 Years and over | 133 (100.0%) | 84 (63.2%) |
| Total | 522 (67.3%) | 321 (41.4%) |
Disability Status by Sex by Age in Bassett
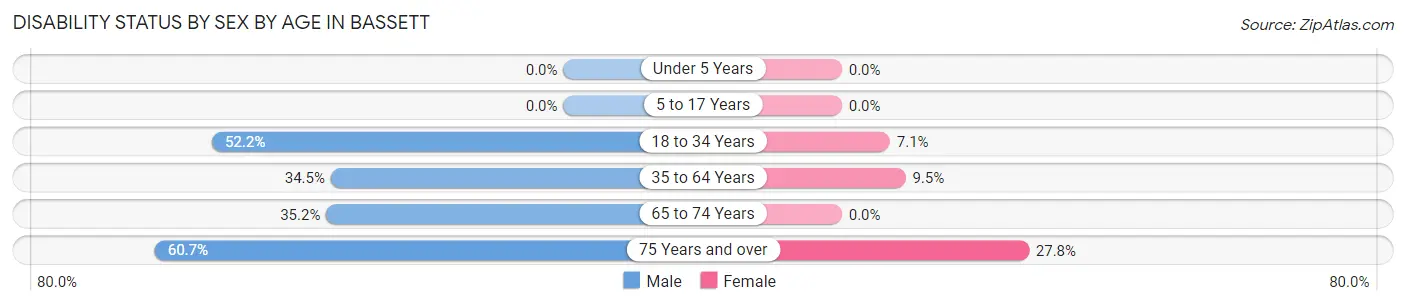
| Age Bracket | Male | Female |
| Under 5 Years | 0 (0.0%) | 0 (0.0%) |
| 5 to 17 Years | 0 (0.0%) | 0 (0.0%) |
| 18 to 34 Years | 48 (52.2%) | 2 (7.1%) |
| 35 to 64 Years | 48 (34.5%) | 12 (9.5%) |
| 65 to 74 Years | 25 (35.2%) | 0 (0.0%) |
| 75 Years and over | 37 (60.7%) | 20 (27.8%) |
Disability Class by Sex by Age in Bassett
Disability Class: Hearing Difficulty
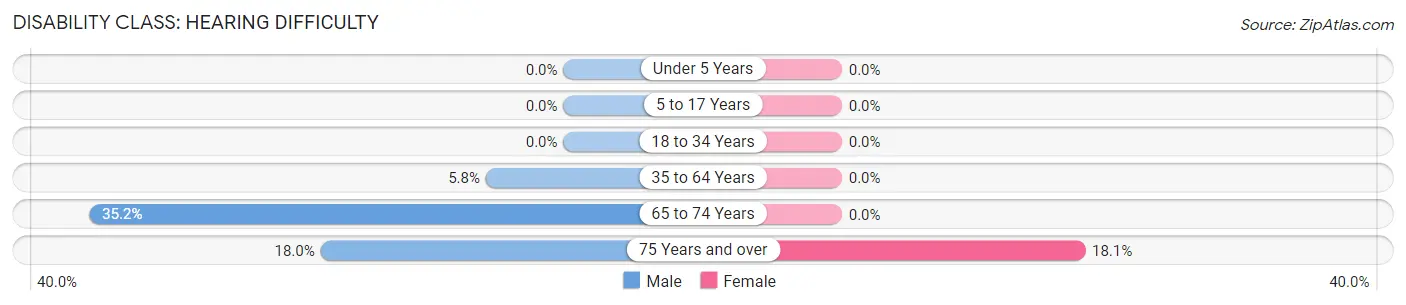
| Age Bracket | Male | Female |
| Under 5 Years | 0 (0.0%) | 0 (0.0%) |
| 5 to 17 Years | 0 (0.0%) | 0 (0.0%) |
| 18 to 34 Years | 0 (0.0%) | 0 (0.0%) |
| 35 to 64 Years | 8 (5.8%) | 0 (0.0%) |
| 65 to 74 Years | 25 (35.2%) | 0 (0.0%) |
| 75 Years and over | 11 (18.0%) | 13 (18.1%) |
Disability Class: Vision Difficulty
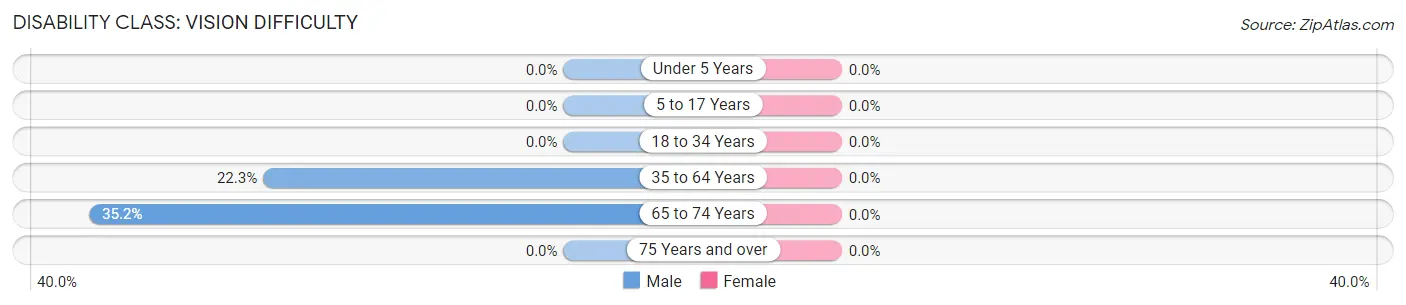
| Age Bracket | Male | Female |
| Under 5 Years | 0 (0.0%) | 0 (0.0%) |
| 5 to 17 Years | 0 (0.0%) | 0 (0.0%) |
| 18 to 34 Years | 0 (0.0%) | 0 (0.0%) |
| 35 to 64 Years | 31 (22.3%) | 0 (0.0%) |
| 65 to 74 Years | 25 (35.2%) | 0 (0.0%) |
| 75 Years and over | 0 (0.0%) | 0 (0.0%) |
Disability Class: Cognitive Difficulty
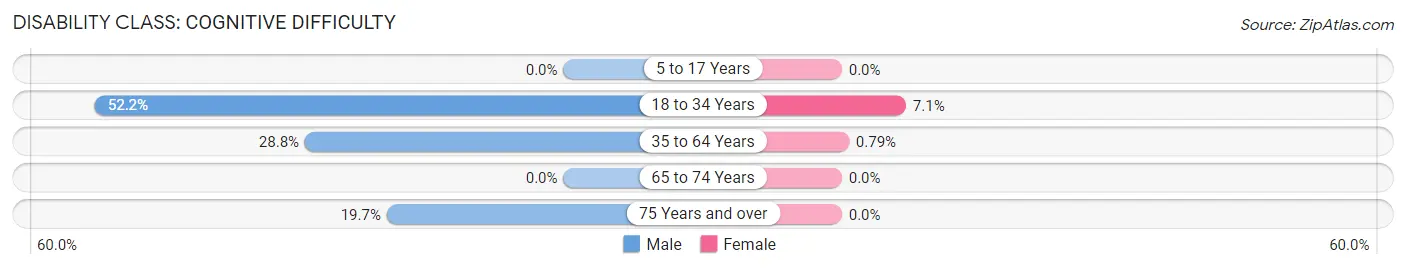
| Age Bracket | Male | Female |
| 5 to 17 Years | 0 (0.0%) | 0 (0.0%) |
| 18 to 34 Years | 48 (52.2%) | 2 (7.1%) |
| 35 to 64 Years | 40 (28.8%) | 1 (0.8%) |
| 65 to 74 Years | 0 (0.0%) | 0 (0.0%) |
| 75 Years and over | 12 (19.7%) | 0 (0.0%) |
Disability Class: Ambulatory Difficulty
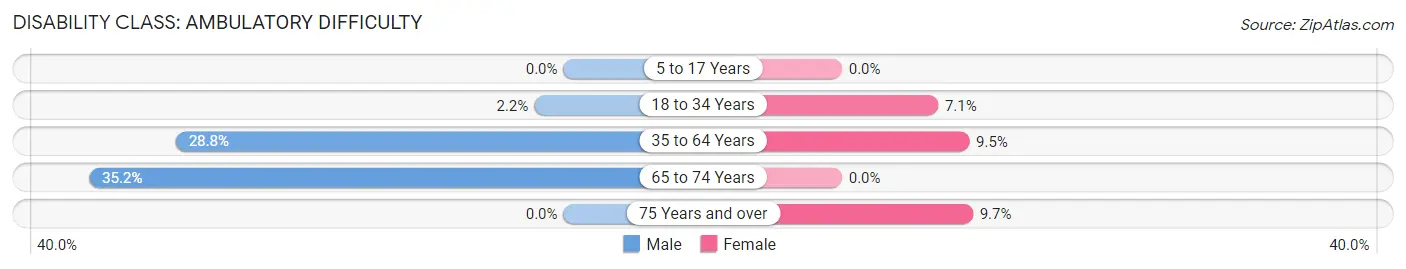
| Age Bracket | Male | Female |
| 5 to 17 Years | 0 (0.0%) | 0 (0.0%) |
| 18 to 34 Years | 2 (2.2%) | 2 (7.1%) |
| 35 to 64 Years | 40 (28.8%) | 12 (9.5%) |
| 65 to 74 Years | 25 (35.2%) | 0 (0.0%) |
| 75 Years and over | 0 (0.0%) | 7 (9.7%) |
Disability Class: Self-Care Difficulty
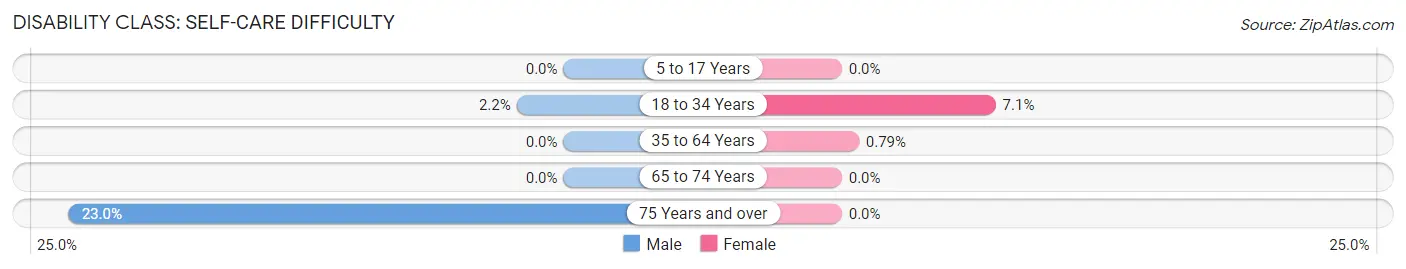
| Age Bracket | Male | Female |
| 5 to 17 Years | 0 (0.0%) | 0 (0.0%) |
| 18 to 34 Years | 2 (2.2%) | 2 (7.1%) |
| 35 to 64 Years | 0 (0.0%) | 1 (0.8%) |
| 65 to 74 Years | 0 (0.0%) | 0 (0.0%) |
| 75 Years and over | 14 (23.0%) | 0 (0.0%) |
Technology Access in Bassett
Computing Device Access in Bassett
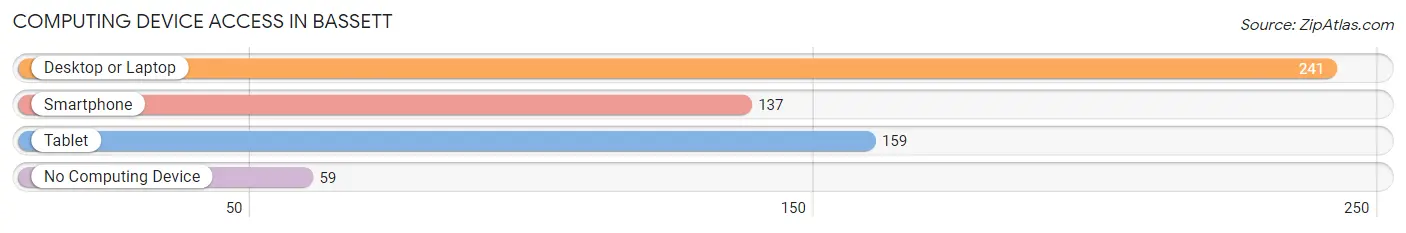
| Device Type | # Households | % Households |
| Desktop or Laptop | 241 | 75.8% |
| Smartphone | 137 | 43.1% |
| Tablet | 159 | 50.0% |
| No Computing Device | 59 | 18.5% |
| Total | 318 | 100.0% |
Internet Access in Bassett
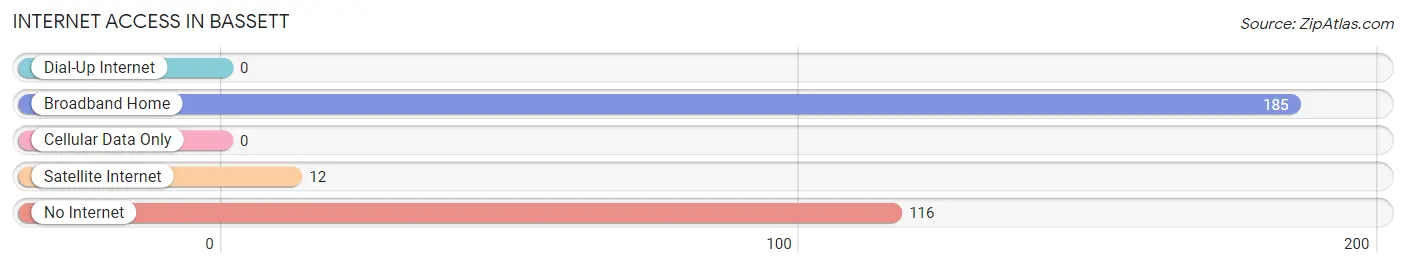
| Internet Type | # Households | % Households |
| Dial-Up Internet | 0 | 0.0% |
| Broadband Home | 185 | 58.2% |
| Cellular Data Only | 0 | 0.0% |
| Satellite Internet | 12 | 3.8% |
| No Internet | 116 | 36.5% |
| Total | 318 | 100.0% |
Bassett Summary
Bassett, Virginia is a small town located in Henry County, Virginia. It is situated in the foothills of the Blue Ridge Mountains and is part of the Martinsville-Henry County Metropolitan Statistical Area. The town has a population of 1,619 as of the 2010 census and is home to the Bassett Furniture Industries, Inc., the largest furniture manufacturer in the United States.
History
The area that is now Bassett was first settled in the late 1700s by the Bassett family, who were among the first settlers in the area. The town was officially established in 1892 and was named after the Bassett family. The town was originally a farming community, but in 1902, the Bassett Furniture Industries, Inc. was founded and the town began to grow. The company was founded by John D. Bassett, Sr. and his brother-in-law, J.D. Bassett, Jr. The company quickly became the largest furniture manufacturer in the United States and the town of Bassett grew with it.
Geography
Bassett is located in Henry County, Virginia, in the foothills of the Blue Ridge Mountains. The town is situated at the intersection of U.S. Route 58 and Virginia State Route 57. The town is located approximately 30 miles northeast of Roanoke and approximately 50 miles south of Lynchburg. The town has a total area of 1.3 square miles, all of which is land.
Economy
The economy of Bassett is largely based on the furniture industry. The town is home to the Bassett Furniture Industries, Inc., the largest furniture manufacturer in the United States. The company employs over 3,000 people and is the largest employer in the town. In addition to the furniture industry, the town also has a number of small businesses, including restaurants, retail stores, and other services.
Demographics
As of the 2010 census, the population of Bassett was 1,619. The racial makeup of the town was 87.3% White, 9.2% African American, 0.6% Native American, 0.4% Asian, 0.1% Pacific Islander, 0.9% from other races, and 1.5% from two or more races. Hispanic or Latino of any race were 2.2% of the population. The median household income was $35,938 and the median family income was $41,250. The per capita income was $17,945. About 17.2% of the population was below the poverty line.
Common Questions
What is Per Capita Income in Bassett?
Per Capita income in Bassett is $20,154.
What is the Median Family Income in Bassett?
Median Family Income in Bassett is $48,542.
What is the Median Household income in Bassett?
Median Household Income in Bassett is $38,611.
What is Income or Wage Gap in Bassett?
Income or Wage Gap in Bassett is 22.7%.
Women in Bassett earn 77.3 cents for every dollar earned by a man.
What is Inequality or Gini Index in Bassett?
Inequality or Gini Index in Bassett is 0.42.
What is the Total Population of Bassett?
Total Population of Bassett is 852.
What is the Total Male Population of Bassett?
Total Male Population of Bassett is 455.
What is the Total Female Population of Bassett?
Total Female Population of Bassett is 397.
What is the Ratio of Males per 100 Females in Bassett?
There are 114.61 Males per 100 Females in Bassett.
What is the Ratio of Females per 100 Males in Bassett?
There are 87.25 Females per 100 Males in Bassett.
What is the Median Population Age in Bassett?
Median Population Age in Bassett is 52.1 Years.
What is the Average Family Size in Bassett
Average Family Size in Bassett is 3.6 People.
What is the Average Household Size in Bassett
Average Household Size in Bassett is 2.4 People.
How Large is the Labor Force in Bassett?
There are 227 People in the Labor Forcein in Bassett.
What is the Percentage of People in the Labor Force in Bassett?
32.3% of People are in the Labor Force in Bassett.
What is the Unemployment Rate in Bassett?
Unemployment Rate in Bassett is 13.2%.