Zip Codes with the Highest Percentage of Population Employed in Administrative & Support Services in Leesburg, VA
RELATED REPORTS & OPTIONS
Administrative & Support Services
Leesburg
Compare Zip Codes
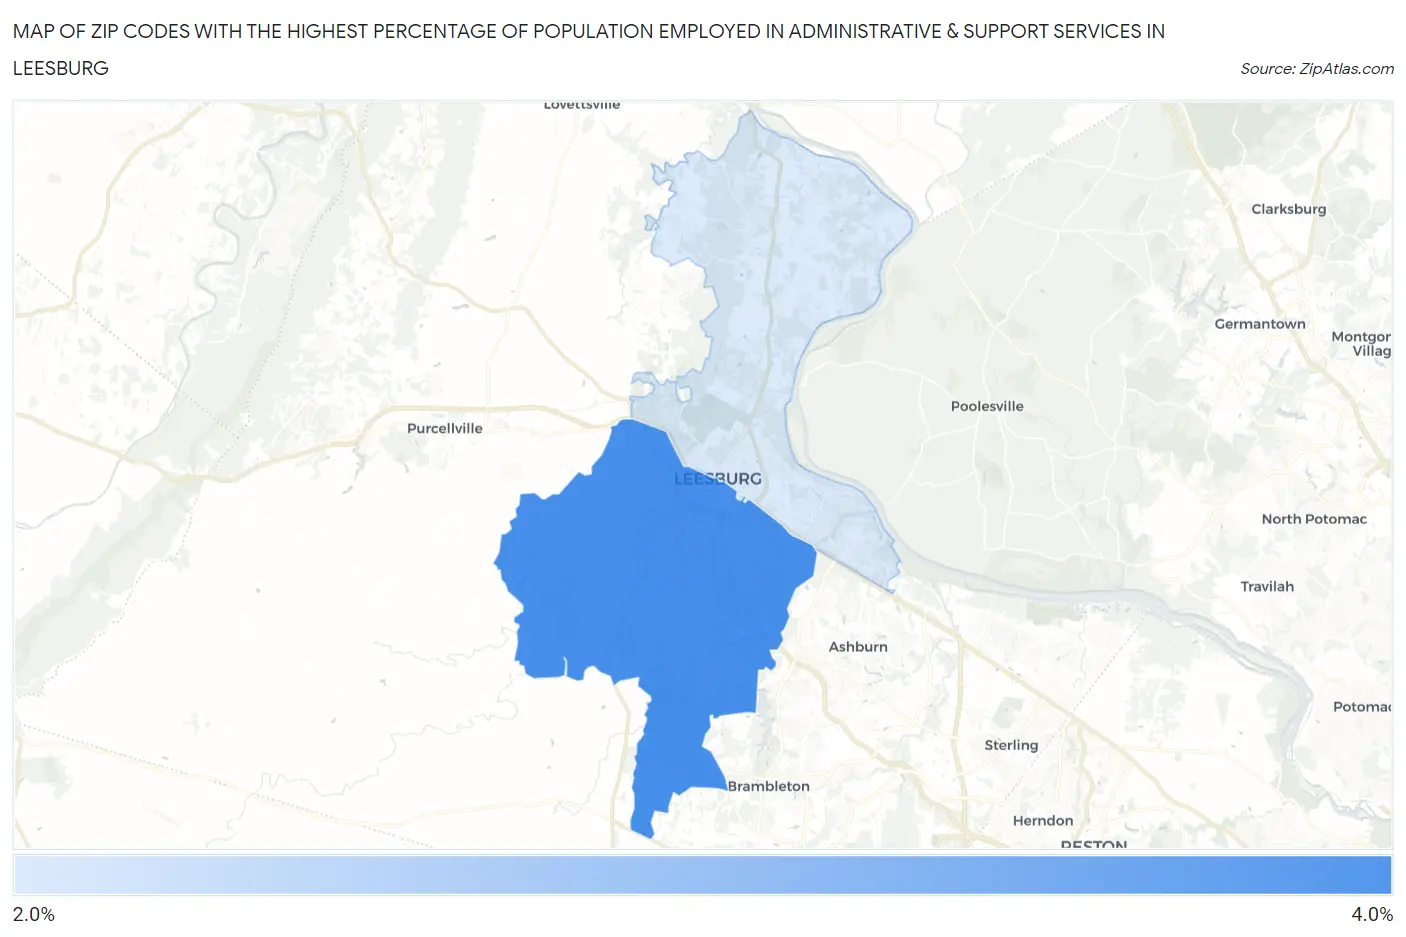
Map of Zip Codes with the Highest Percentage of Population Employed in Administrative & Support Services in Leesburg
2.8%
3.0%
Zip Codes with the Highest Percentage of Population Employed in Administrative & Support Services in Leesburg, VA
| Zip Code | % Employed | vs State | vs National | |
| 1. | 20175 | 3.0% | 4.1%(-1.09)#445 | 4.1%(-1.10)#15,260 |
| 2. | 20176 | 2.8% | 4.1%(-1.30)#477 | 4.1%(-1.31)#16,340 |
1
Common Questions
What are the Top Zip Codes with the Highest Percentage of Population Employed in Administrative & Support Services in Leesburg, VA?
Top Zip Codes with the Highest Percentage of Population Employed in Administrative & Support Services in Leesburg, VA are:
What zip code has the Highest Percentage of Population Employed in Administrative & Support Services in Leesburg, VA?
20175 has the Highest Percentage of Population Employed in Administrative & Support Services in Leesburg, VA with 3.0%.
What is the Percentage of Population Employed in Administrative & Support Services in Leesburg, VA?
Percentage of Population Employed in Administrative & Support Services in Leesburg is 2.6%.
What is the Percentage of Population Employed in Administrative & Support Services in Virginia?
Percentage of Population Employed in Administrative & Support Services in Virginia is 4.1%.
What is the Percentage of Population Employed in Administrative & Support Services in the United States?
Percentage of Population Employed in Administrative & Support Services in the United States is 4.1%.