Heathsville, VA Map & Demographics
Heathsville Map
Heathsville Overview
$11,840
PER CAPITA INCOME
0.65
INEQUALITY / GINI INDEX
126
TOTAL POPULATION
60
MALE POPULATION
66
FEMALE POPULATION
90.91
MALES / 100 FEMALES
110.00
FEMALES / 100 MALES
34.0
MEDIAN AGE
2.8
AVG FAMILY SIZE
2.2
AVG HOUSEHOLD SIZE
38
LABOR FORCE [ PEOPLE ]
42.7%
PERCENT IN LABOR FORCE
Heathsville Zip Codes
Heathsville Area Codes
Income in Heathsville
Income Overview in Heathsville
| Characteristic | Number | Measure |
| Per Capita Income | 126 | $11,840 |
| Median Family Income | 37 | $0 |
| Mean Family Income | 37 | $39,143 |
| Median Household Income | 58 | $0 |
| Mean Household Income | 58 | $24,971 |
| Income Deficit | 37 | $0 |
| Wage / Income Gap (%) | 126 | 0.00% |
| Wage / Income Gap ($) | 126 | 100.00¢ per $1 |
| Gini / Inequality Index | 126 | 0.65 |
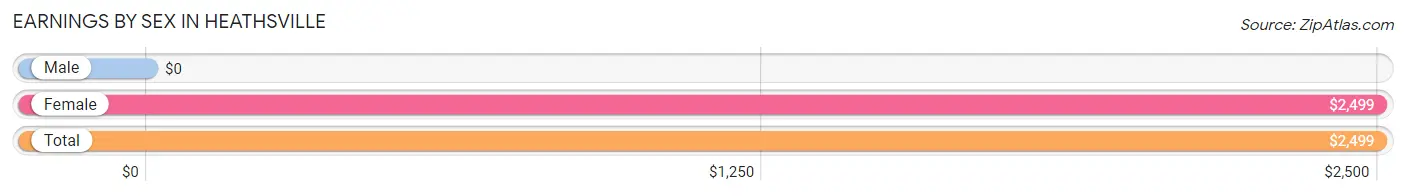
Earnings by Sex in Heathsville
| Sex | Number | Average Earnings |
| Male | 4 (10.5%) | $0 |
| Female | 34 (89.5%) | $2,499 |
| Total | 38 (100.0%) | $2,499 |
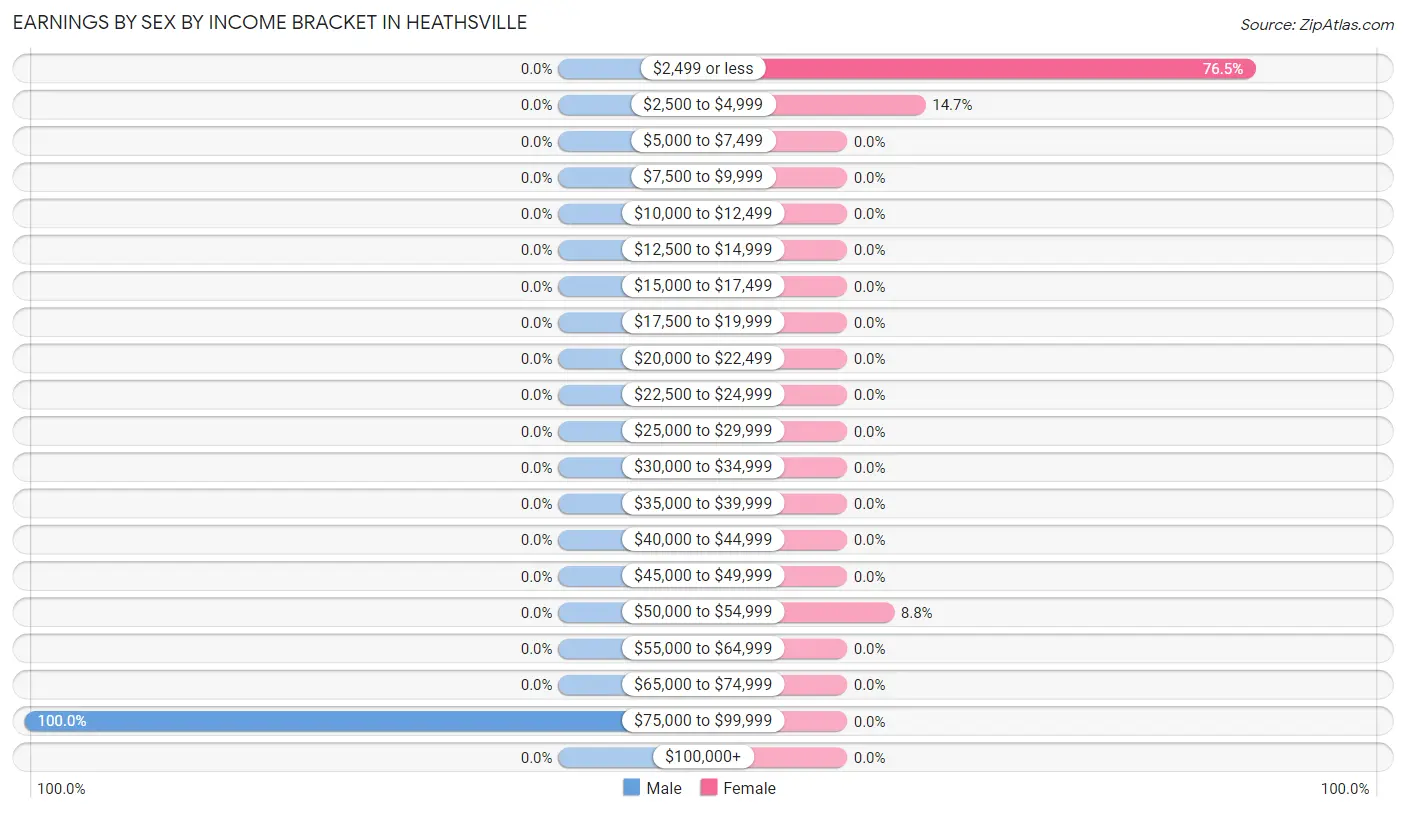
Earnings by Sex by Income Bracket in Heathsville
The most common earnings brackets in Heathsville are $75,000 to $99,999 for men (4 | 100.0%) and $2,499 or less for women (26 | 76.5%).
| Income | Male | Female |
| $2,499 or less | 0 (0.0%) | 26 (76.5%) |
| $2,500 to $4,999 | 0 (0.0%) | 5 (14.7%) |
| $5,000 to $7,499 | 0 (0.0%) | 0 (0.0%) |
| $7,500 to $9,999 | 0 (0.0%) | 0 (0.0%) |
| $10,000 to $12,499 | 0 (0.0%) | 0 (0.0%) |
| $12,500 to $14,999 | 0 (0.0%) | 0 (0.0%) |
| $15,000 to $17,499 | 0 (0.0%) | 0 (0.0%) |
| $17,500 to $19,999 | 0 (0.0%) | 0 (0.0%) |
| $20,000 to $22,499 | 0 (0.0%) | 0 (0.0%) |
| $22,500 to $24,999 | 0 (0.0%) | 0 (0.0%) |
| $25,000 to $29,999 | 0 (0.0%) | 0 (0.0%) |
| $30,000 to $34,999 | 0 (0.0%) | 0 (0.0%) |
| $35,000 to $39,999 | 0 (0.0%) | 0 (0.0%) |
| $40,000 to $44,999 | 0 (0.0%) | 0 (0.0%) |
| $45,000 to $49,999 | 0 (0.0%) | 0 (0.0%) |
| $50,000 to $54,999 | 0 (0.0%) | 3 (8.8%) |
| $55,000 to $64,999 | 0 (0.0%) | 0 (0.0%) |
| $65,000 to $74,999 | 0 (0.0%) | 0 (0.0%) |
| $75,000 to $99,999 | 4 (100.0%) | 0 (0.0%) |
| $100,000+ | 0 (0.0%) | 0 (0.0%) |
| Total | 4 (100.0%) | 34 (100.0%) |
Earnings by Sex by Educational Attainment in Heathsville
| Educational Attainment | Male Income | Female Income |
| Less than High School | - | - |
| High School Diploma | - | - |
| College or Associate's Degree | - | - |
| Bachelor's Degree | - | - |
| Graduate Degree | - | - |
| Total | - | - |
Family Income in Heathsville
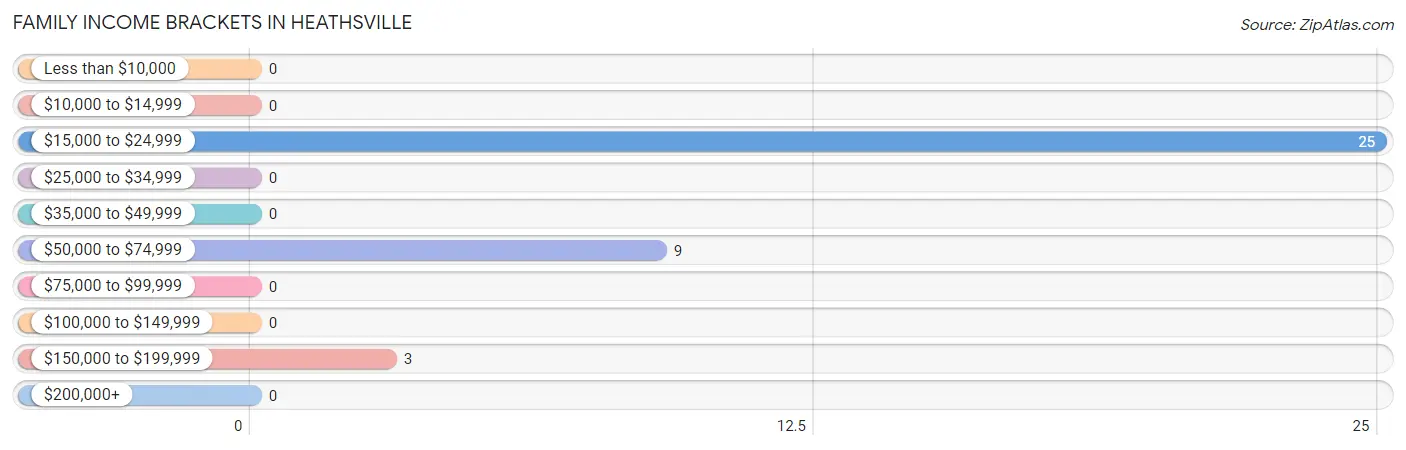
Family Income Brackets in Heathsville
According to the Heathsville family income data, there are 25 families falling into the $15,000 to $24,999 income range, which is the most common income bracket and makes up 67.6% of all families.
| Income Bracket | # Families | % Families |
| Less than $10,000 | 0 | 0.0% |
| $10,000 to $14,999 | 0 | 0.0% |
| $15,000 to $24,999 | 25 | 67.6% |
| $25,000 to $34,999 | 0 | 0.0% |
| $35,000 to $49,999 | 0 | 0.0% |
| $50,000 to $74,999 | 9 | 24.3% |
| $75,000 to $99,999 | 0 | 0.0% |
| $100,000 to $149,999 | 0 | 0.0% |
| $150,000 to $199,999 | 3 | 8.1% |
| $200,000+ | 0 | 0.0% |
Family Income by Famaliy Size in Heathsville
| Income Bracket | # Families | Median Income |
| 2-Person Families | 29 (78.4%) | $0 |
| 3-Person Families | 3 (8.1%) | $0 |
| 4-Person Families | 0 (0.0%) | $0 |
| 5-Person Families | 0 (0.0%) | $0 |
| 6-Person Families | 5 (13.5%) | $0 |
| 7+ Person Families | 0 (0.0%) | $0 |
| Total | 37 (100.0%) | $0 |
Family Income by Number of Earners in Heathsville
| Number of Earners | # Families | Median Income |
| No Earners | 9 (24.3%) | $0 |
| 1 Earner | 25 (67.6%) | $0 |
| 2 Earners | 0 (0.0%) | $0 |
| 3+ Earners | 3 (8.1%) | $0 |
| Total | 37 (100.0%) | $0 |
Household Income in Heathsville
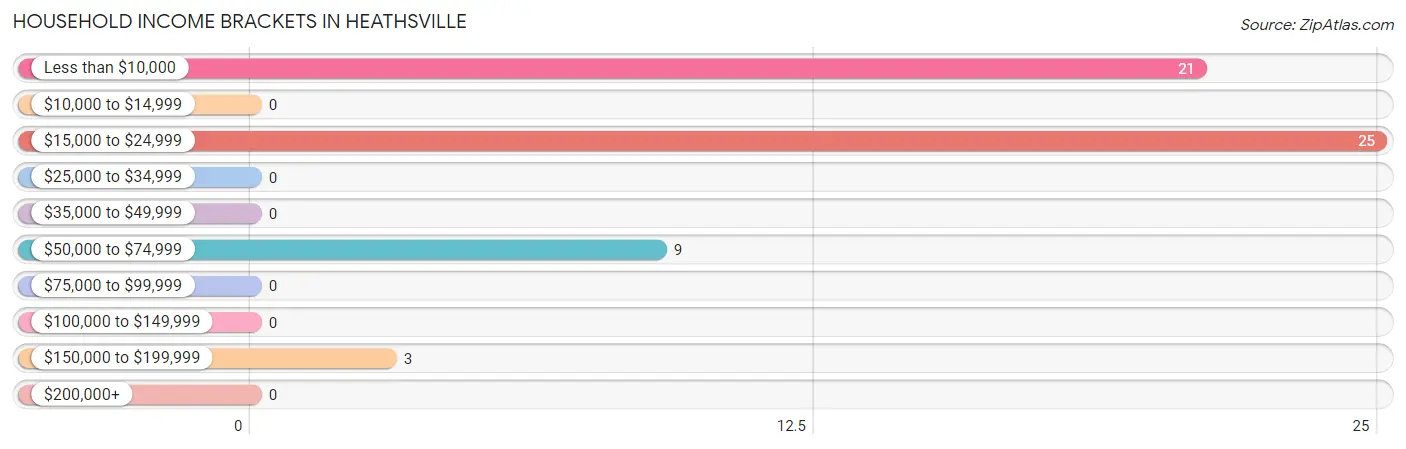
Household Income Brackets in Heathsville
With 25 households falling in the category, the $15,000 to $24,999 income range is the most frequent in Heathsville, accounting for 43.1% of all households.
| Income Bracket | # Households | % Households |
| Less than $10,000 | 21 | 36.2% |
| $10,000 to $14,999 | 0 | 0.0% |
| $15,000 to $24,999 | 25 | 43.1% |
| $25,000 to $34,999 | 0 | 0.0% |
| $35,000 to $49,999 | 0 | 0.0% |
| $50,000 to $74,999 | 9 | 15.5% |
| $75,000 to $99,999 | 0 | 0.0% |
| $100,000 to $149,999 | 0 | 0.0% |
| $150,000 to $199,999 | 3 | 5.2% |
| $200,000+ | 0 | 0.0% |
Household Income by Householder Age in Heathsville
The median household income in Heathsville is $0, with the highest median household income of $2,499 found in the 45 to 64 years age bracket for the primary householder. A total of 33 households (56.9%) fall into this category.
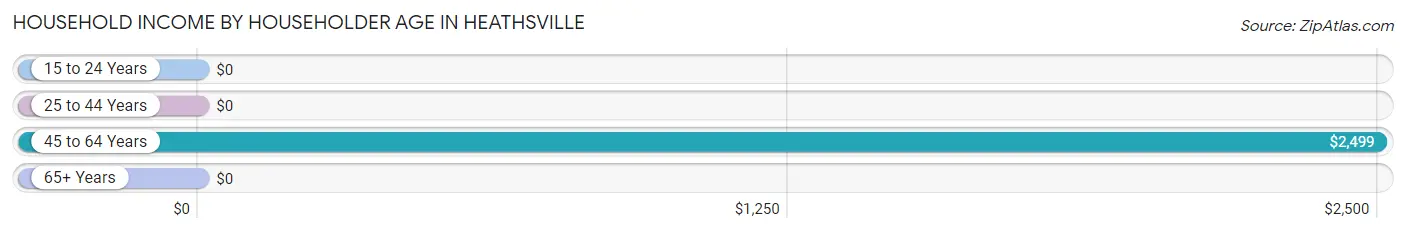
| Income Bracket | # Households | Median Income |
| 15 to 24 Years | 0 (0.0%) | $0 |
| 25 to 44 Years | 25 (43.1%) | $0 |
| 45 to 64 Years | 33 (56.9%) | $2,499 |
| 65+ Years | 0 (0.0%) | $0 |
| Total | 58 (100.0%) | $0 |
Poverty in Heathsville
Income Below Poverty by Sex and Age in Heathsville
With 75.0% poverty level for males and 72.7% for females among the residents of Heathsville, under 5 year old males and under 5 year old females are the most vulnerable to poverty, with 4 males (100.0%) and 2 females (100.0%) in their respective age groups living below the poverty level.
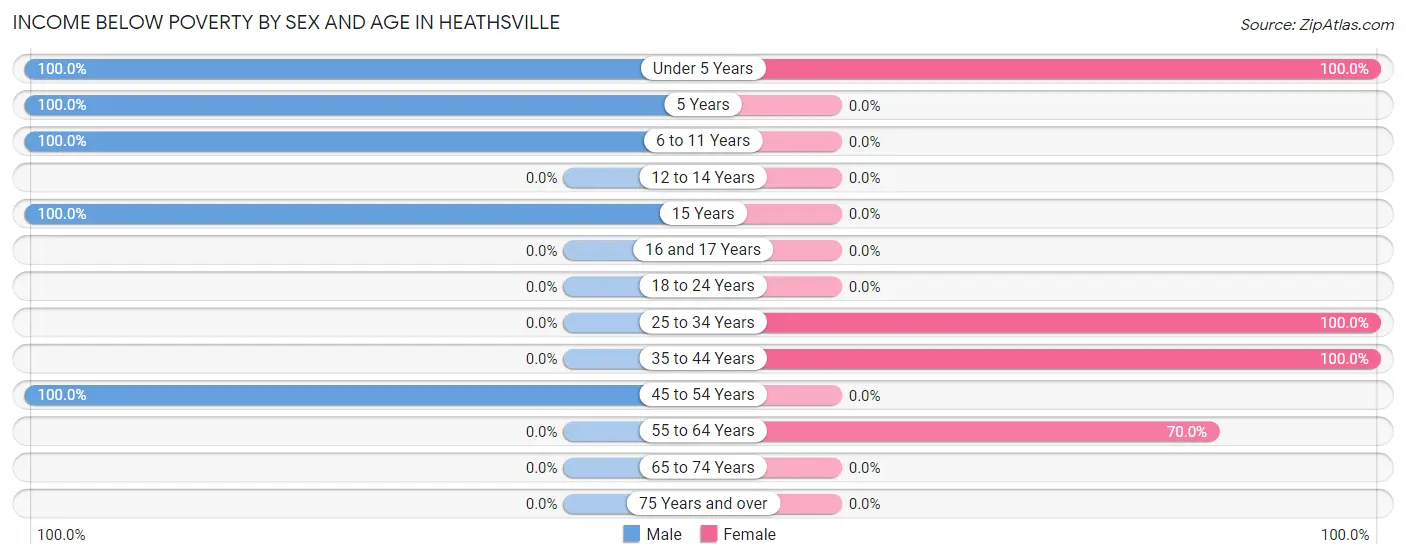
| Age Bracket | Male | Female |
| Under 5 Years | 4 (100.0%) | 2 (100.0%) |
| 5 Years | 5 (100.0%) | 0 (0.0%) |
| 6 to 11 Years | 12 (100.0%) | 0 (0.0%) |
| 12 to 14 Years | 0 (0.0%) | 0 (0.0%) |
| 15 Years | 14 (100.0%) | 0 (0.0%) |
| 16 and 17 Years | 0 (0.0%) | 0 (0.0%) |
| 18 to 24 Years | 0 (0.0%) | 0 (0.0%) |
| 25 to 34 Years | 0 (0.0%) | 20 (100.0%) |
| 35 to 44 Years | 0 (0.0%) | 5 (100.0%) |
| 45 to 54 Years | 10 (100.0%) | 0 (0.0%) |
| 55 to 64 Years | 0 (0.0%) | 21 (70.0%) |
| 65 to 74 Years | 0 (0.0%) | 0 (0.0%) |
| 75 Years and over | 0 (0.0%) | 0 (0.0%) |
| Total | 45 (75.0%) | 48 (72.7%) |
Income Above Poverty by Sex and Age in Heathsville
According to the poverty statistics in Heathsville, males aged 55 to 64 years and females aged 16 and 17 years are the age groups that are most secure financially, with 100.0% of males and 100.0% of females in these age groups living above the poverty line.
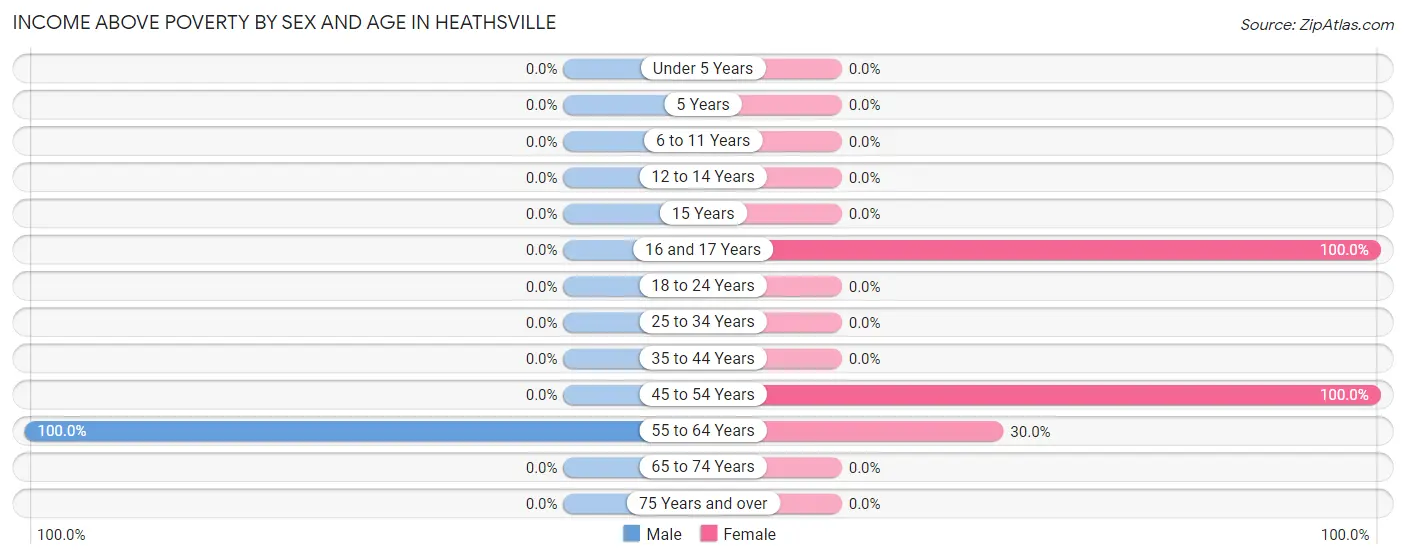
| Age Bracket | Male | Female |
| Under 5 Years | 0 (0.0%) | 0 (0.0%) |
| 5 Years | 0 (0.0%) | 0 (0.0%) |
| 6 to 11 Years | 0 (0.0%) | 0 (0.0%) |
| 12 to 14 Years | 0 (0.0%) | 0 (0.0%) |
| 15 Years | 0 (0.0%) | 0 (0.0%) |
| 16 and 17 Years | 0 (0.0%) | 6 (100.0%) |
| 18 to 24 Years | 0 (0.0%) | 0 (0.0%) |
| 25 to 34 Years | 0 (0.0%) | 0 (0.0%) |
| 35 to 44 Years | 0 (0.0%) | 0 (0.0%) |
| 45 to 54 Years | 0 (0.0%) | 3 (100.0%) |
| 55 to 64 Years | 15 (100.0%) | 9 (30.0%) |
| 65 to 74 Years | 0 (0.0%) | 0 (0.0%) |
| 75 Years and over | 0 (0.0%) | 0 (0.0%) |
| Total | 15 (25.0%) | 18 (27.3%) |
Income Below Poverty Among Married-Couple Families in Heathsville
The poverty statistics for married-couple families in Heathsville show that 62.5% or 20 of the total 32 families live below the poverty line. Families with no children have the highest poverty rate of 69.0%, comprising of 20 families. On the other hand, families with 1 or 2 children have the lowest poverty rate of 0.0%, which includes 0 families.
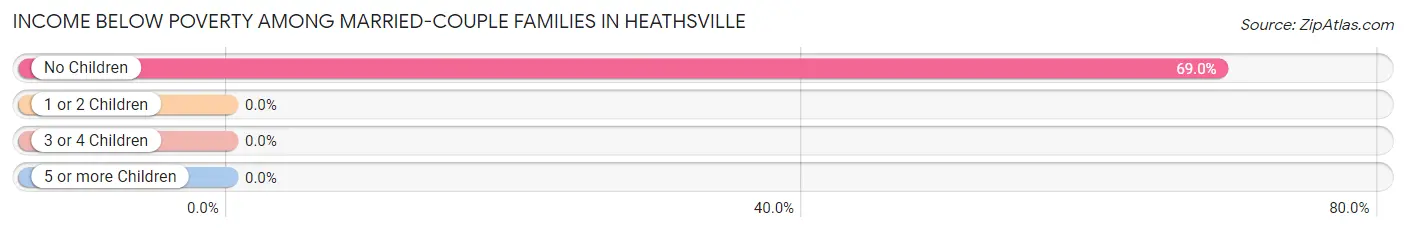
| Children | Above Poverty | Below Poverty |
| No Children | 9 (31.0%) | 20 (69.0%) |
| 1 or 2 Children | 3 (100.0%) | 0 (0.0%) |
| 3 or 4 Children | 0 (0.0%) | 0 (0.0%) |
| 5 or more Children | 0 (0.0%) | 0 (0.0%) |
| Total | 12 (37.5%) | 20 (62.5%) |
Income Below Poverty Among Single-Parent Households in Heathsville
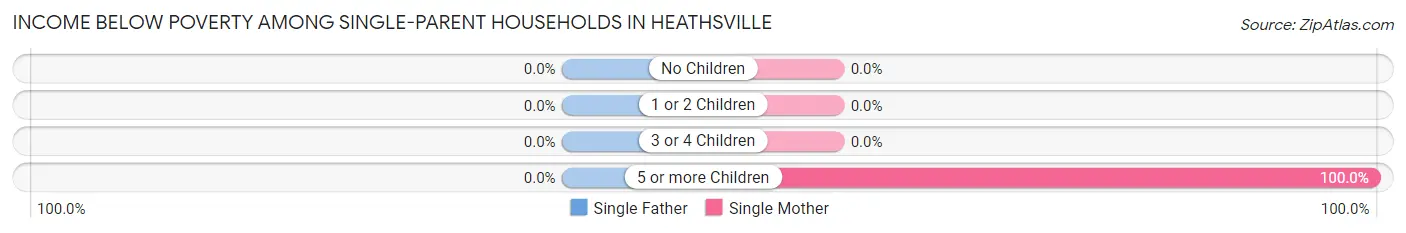
| Children | Single Father | Single Mother |
| No Children | 0 (0.0%) | 0 (0.0%) |
| 1 or 2 Children | 0 (0.0%) | 0 (0.0%) |
| 3 or 4 Children | 0 (0.0%) | 0 (0.0%) |
| 5 or more Children | 0 (0.0%) | 5 (100.0%) |
| Total | 0 (0.0%) | 5 (100.0%) |
Income Below Poverty Among Married-Couple vs Single-Parent Households in Heathsville
The poverty data for Heathsville shows that 20 of the married-couple family households (62.5%) and 5 of the single-parent households (100.0%) are living below the poverty level. Within the married-couple family households, those with no children have the highest poverty rate, with 20 households (69.0%) falling below the poverty line. Among the single-parent households, those with 5 or more children have the highest poverty rate, with 5 household (100.0%) living below poverty.
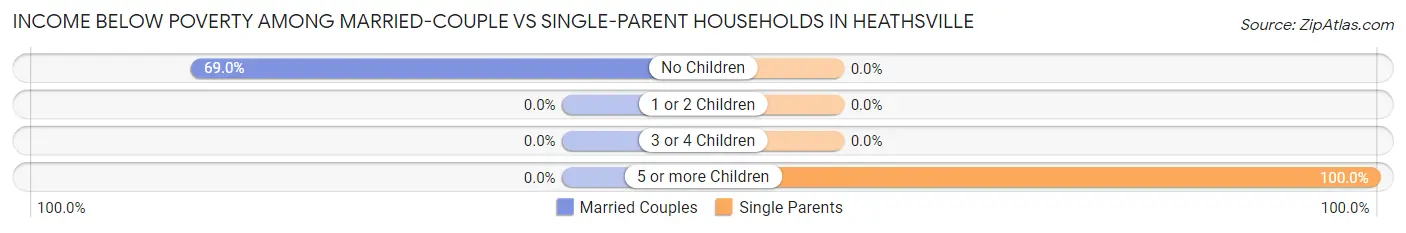
| Children | Married-Couple Families | Single-Parent Households |
| No Children | 20 (69.0%) | 0 (0.0%) |
| 1 or 2 Children | 0 (0.0%) | 0 (0.0%) |
| 3 or 4 Children | 0 (0.0%) | 0 (0.0%) |
| 5 or more Children | 0 (0.0%) | 5 (100.0%) |
| Total | 20 (62.5%) | 5 (100.0%) |
Race in Heathsville
The most populous races in Heathsville are White / Caucasian (104 | 82.5%), and Two or more Races (22 | 17.5%).
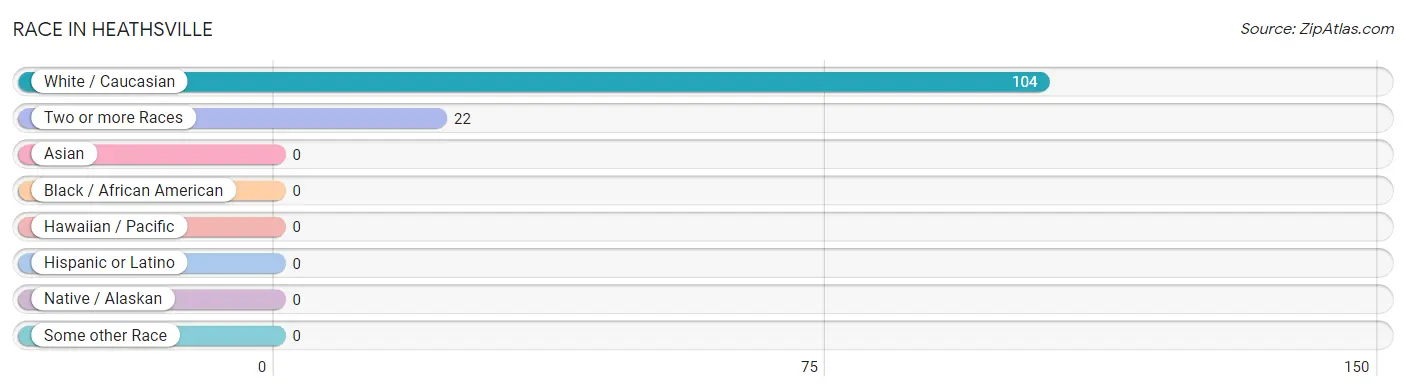
| Race | # Population | % Population |
| Asian | 0 | 0.0% |
| Black / African American | 0 | 0.0% |
| Hawaiian / Pacific | 0 | 0.0% |
| Hispanic or Latino | 0 | 0.0% |
| Native / Alaskan | 0 | 0.0% |
| White / Caucasian | 104 | 82.5% |
| Two or more Races | 22 | 17.5% |
| Some other Race | 0 | 0.0% |
| Total | 126 | 100.0% |
Ancestry in Heathsville
The most populous ancestries reported in Heathsville are English (54 | 42.9%), Cherokee (20 | 15.9%), Irish (20 | 15.9%), Italian (4 | 3.2%), and Scottish (3 | 2.4%), together accounting for 80.1% of all Heathsville residents.
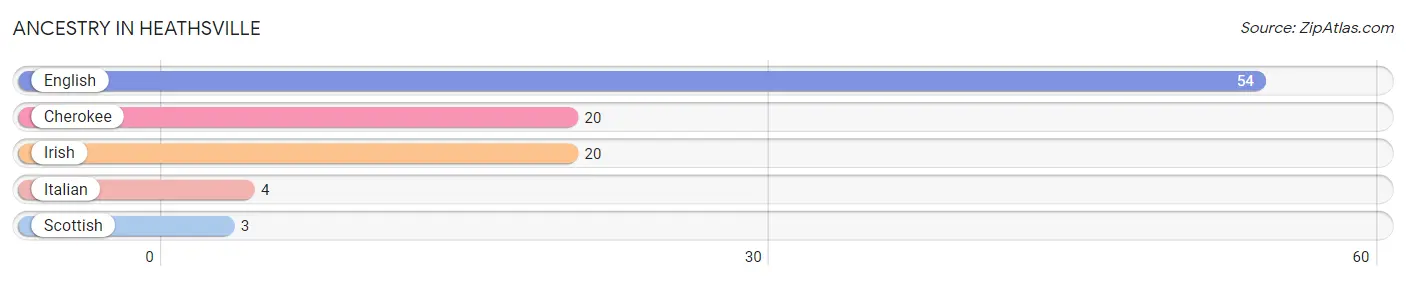
| Ancestry | # Population | % Population |
| Cherokee | 20 | 15.9% |
| English | 54 | 42.9% |
| Irish | 20 | 15.9% |
| Italian | 4 | 3.2% |
| Scottish | 3 | 2.4% | View All 5 Rows |
Immigrants in Heathsville

| Immigration Origin | # Population | % Population | View All 0 Rows |
Sex and Age in Heathsville
Sex and Age in Heathsville
The most populous age groups in Heathsville are 15 to 19 Years (14 | 23.3%) for men and 55 to 59 Years (21 | 31.8%) for women.
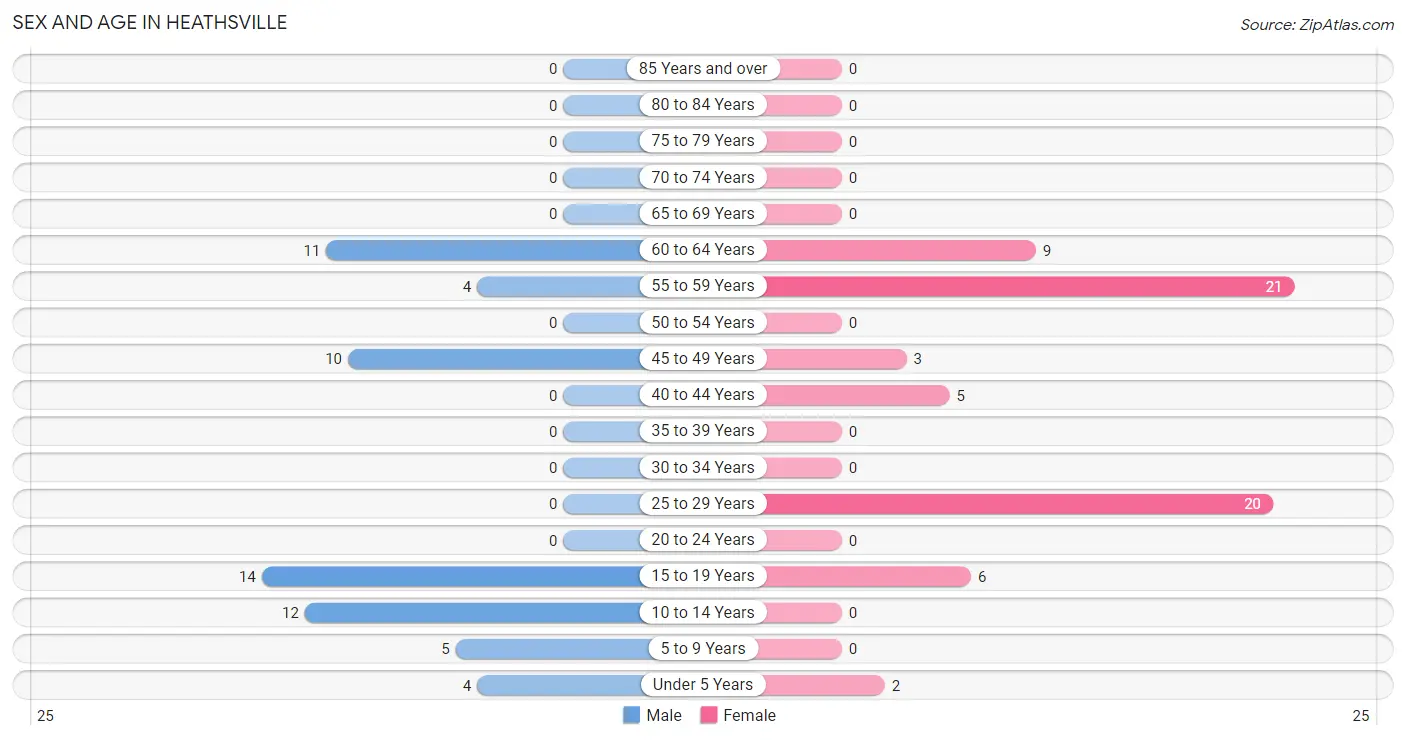
| Age Bracket | Male | Female |
| Under 5 Years | 4 (6.7%) | 2 (3.0%) |
| 5 to 9 Years | 5 (8.3%) | 0 (0.0%) |
| 10 to 14 Years | 12 (20.0%) | 0 (0.0%) |
| 15 to 19 Years | 14 (23.3%) | 6 (9.1%) |
| 20 to 24 Years | 0 (0.0%) | 0 (0.0%) |
| 25 to 29 Years | 0 (0.0%) | 20 (30.3%) |
| 30 to 34 Years | 0 (0.0%) | 0 (0.0%) |
| 35 to 39 Years | 0 (0.0%) | 0 (0.0%) |
| 40 to 44 Years | 0 (0.0%) | 5 (7.6%) |
| 45 to 49 Years | 10 (16.7%) | 3 (4.5%) |
| 50 to 54 Years | 0 (0.0%) | 0 (0.0%) |
| 55 to 59 Years | 4 (6.7%) | 21 (31.8%) |
| 60 to 64 Years | 11 (18.3%) | 9 (13.6%) |
| 65 to 69 Years | 0 (0.0%) | 0 (0.0%) |
| 70 to 74 Years | 0 (0.0%) | 0 (0.0%) |
| 75 to 79 Years | 0 (0.0%) | 0 (0.0%) |
| 80 to 84 Years | 0 (0.0%) | 0 (0.0%) |
| 85 Years and over | 0 (0.0%) | 0 (0.0%) |
| Total | 60 (100.0%) | 66 (100.0%) |
Families and Households in Heathsville
Median Family Size in Heathsville
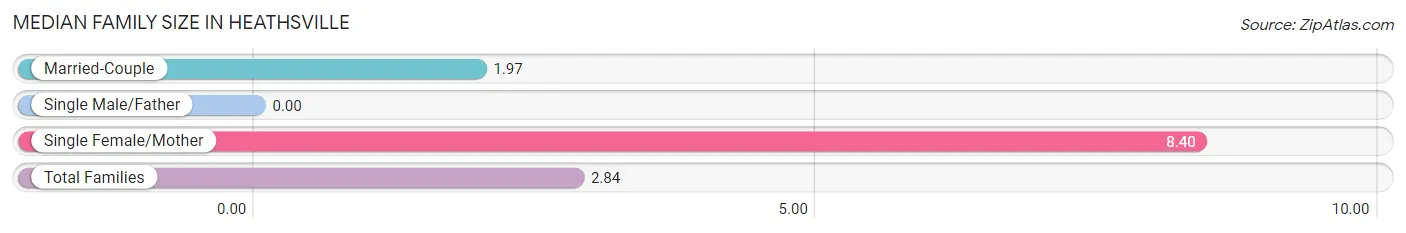
| Family Type | # Families | Family Size |
| Married-Couple | 32 (86.5%) | 1.97 |
| Single Male/Father | 0 (0.0%) | - |
| Single Female/Mother | 5 (13.5%) | 8.40 |
| Total Families | 37 (100.0%) | 2.84 |
Median Household Size in Heathsville
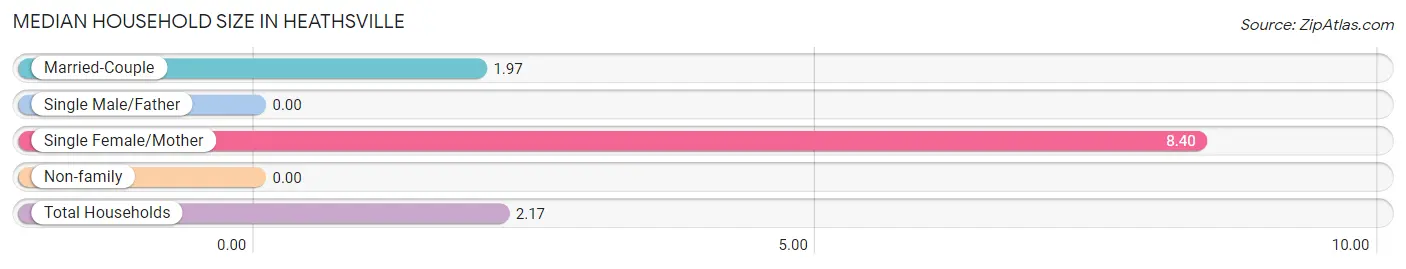
| Household Type | # Households | Household Size |
| Married-Couple | 32 (55.2%) | 1.97 |
| Single Male/Father | 0 (0.0%) | - |
| Single Female/Mother | 5 (8.6%) | 8.40 |
| Non-family | 21 (36.2%) | - |
| Total Households | 58 (100.0%) | 2.17 |
Household Size by Marriage Status in Heathsville
Out of a total of 58 households in Heathsville, 37 (63.8%) are family households, while 21 (36.2%) are nonfamily households. The most numerous type of family households are 2-person households, comprising 29, and the most common type of nonfamily households are 1-person households, comprising 21.
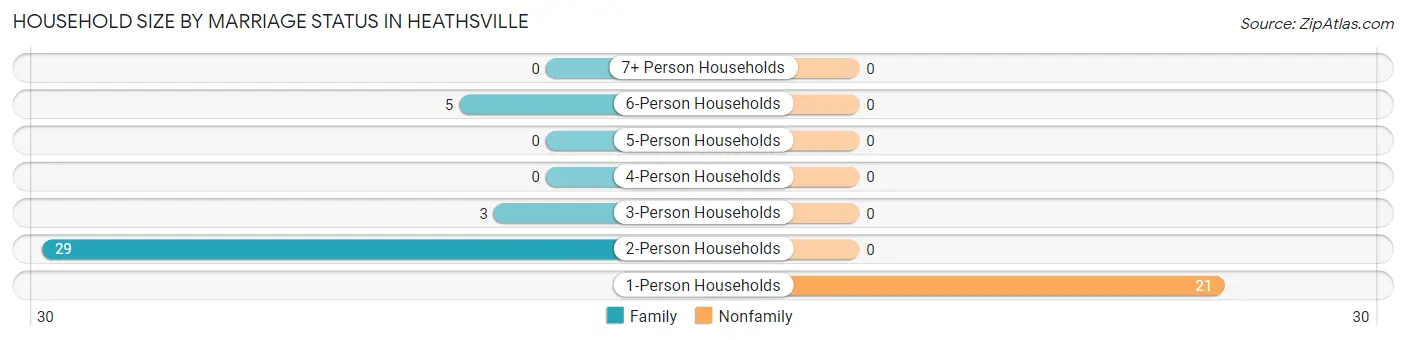
| Household Size | Family Households | Nonfamily Households |
| 1-Person Households | - | 21 (36.2%) |
| 2-Person Households | 29 (50.0%) | 0 (0.0%) |
| 3-Person Households | 3 (5.2%) | 0 (0.0%) |
| 4-Person Households | 0 (0.0%) | 0 (0.0%) |
| 5-Person Households | 0 (0.0%) | 0 (0.0%) |
| 6-Person Households | 5 (8.6%) | 0 (0.0%) |
| 7+ Person Households | 0 (0.0%) | 0 (0.0%) |
| Total | 37 (63.8%) | 21 (36.2%) |
Female Fertility in Heathsville
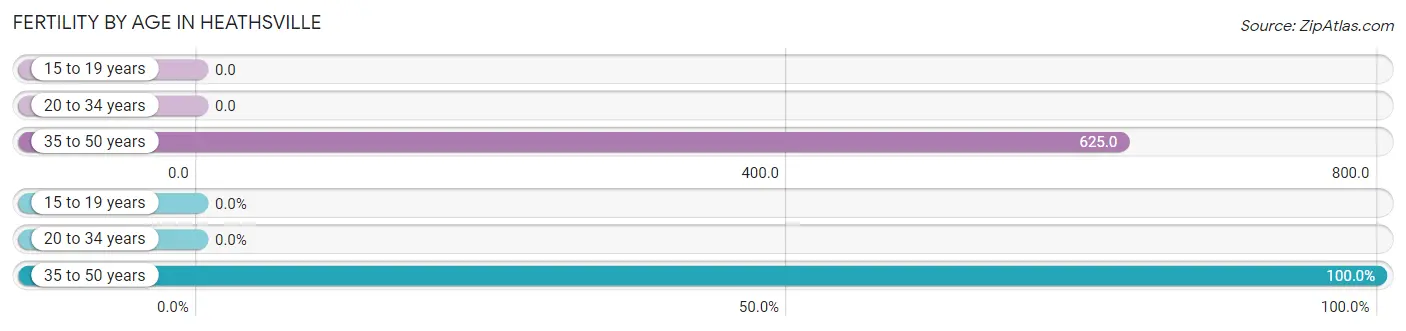
Fertility by Age in Heathsville
Average fertility rate in Heathsville is 147.0 births per 1,000 women. Women in the age bracket of 35 to 50 years have the highest fertility rate with 625.0 births per 1,000 women. Women in the age bracket of 35 to 50 years acount for 100.0% of all women with births.
| Age Bracket | Women with Births | Births / 1,000 Women |
| 15 to 19 years | 0 (0.0%) | 0.0 |
| 20 to 34 years | 0 (0.0%) | 0.0 |
| 35 to 50 years | 5 (100.0%) | 625.0 |
| Total | 5 (100.0%) | 147.0 |
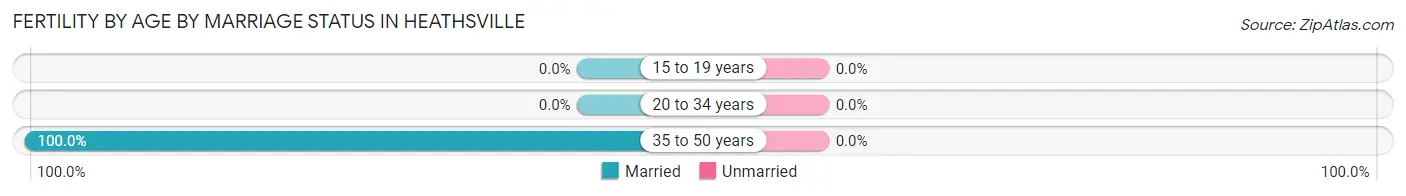
Fertility by Age by Marriage Status in Heathsville
| Age Bracket | Married | Unmarried |
| 15 to 19 years | 0 (0.0%) | 0 (0.0%) |
| 20 to 34 years | 0 (0.0%) | 0 (0.0%) |
| 35 to 50 years | 5 (100.0%) | 0 (0.0%) |
| Total | 5 (100.0%) | 0 (0.0%) |
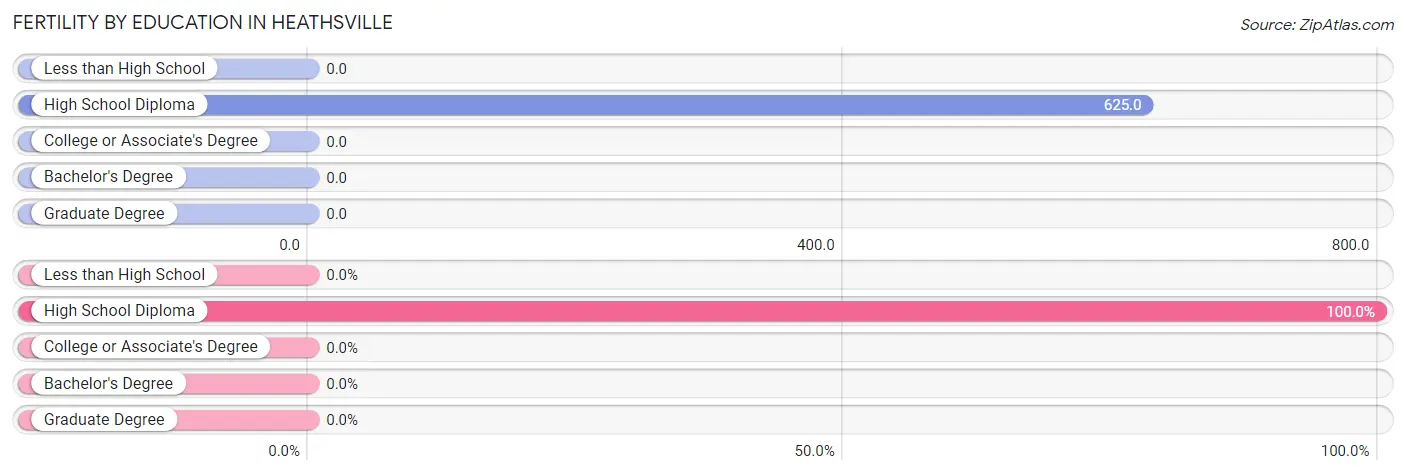
Fertility by Education in Heathsville
| Educational Attainment | Women with Births | Births / 1,000 Women |
| Less than High School | 0 (0.0%) | 0.0 |
| High School Diploma | 5 (100.0%) | 625.0 |
| College or Associate's Degree | 0 (0.0%) | 0.0 |
| Bachelor's Degree | 0 (0.0%) | 0.0 |
| Graduate Degree | 0 (0.0%) | 0.0 |
| Total | 5 (100.0%) | 147.0 |
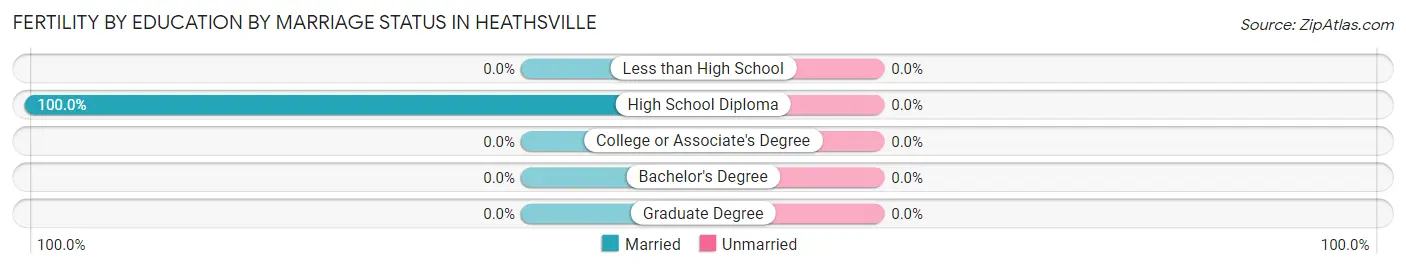
Fertility by Education by Marriage Status in Heathsville
| Educational Attainment | Married | Unmarried |
| Less than High School | 0 (0.0%) | 0 (0.0%) |
| High School Diploma | 5 (100.0%) | 0 (0.0%) |
| College or Associate's Degree | 0 (0.0%) | 0 (0.0%) |
| Bachelor's Degree | 0 (0.0%) | 0 (0.0%) |
| Graduate Degree | 0 (0.0%) | 0 (0.0%) |
| Total | 5 (100.0%) | 0 (0.0%) |
Employment Characteristics in Heathsville
Employment by Class of Employer in Heathsville
Among the 38 employed individuals in Heathsville, self-employed (incorporated) (20 | 52.6%), and private company employees (18 | 47.4%) make up the most common classes of employment.
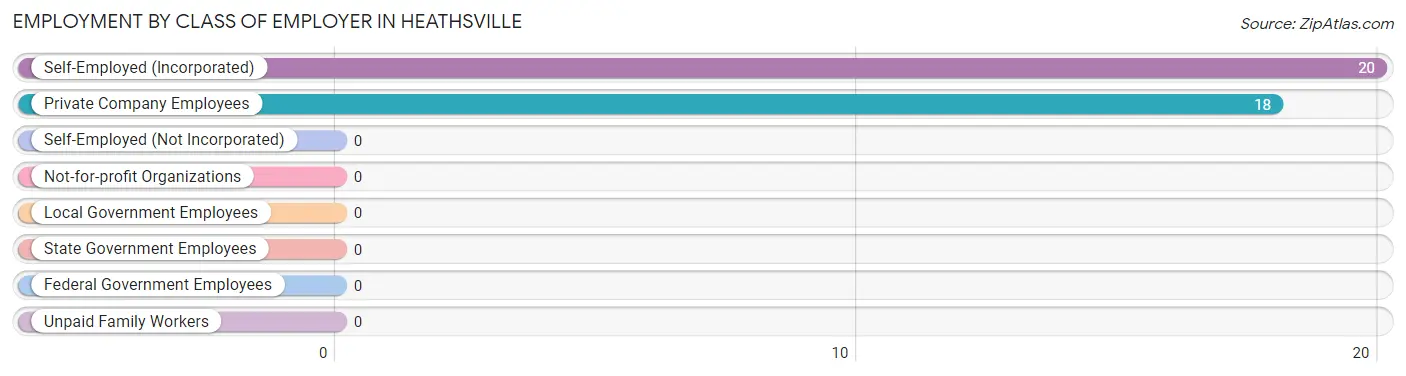
| Employer Class | # Employees | % Employees |
| Private Company Employees | 18 | 47.4% |
| Self-Employed (Incorporated) | 20 | 52.6% |
| Self-Employed (Not Incorporated) | 0 | 0.0% |
| Not-for-profit Organizations | 0 | 0.0% |
| Local Government Employees | 0 | 0.0% |
| State Government Employees | 0 | 0.0% |
| Federal Government Employees | 0 | 0.0% |
| Unpaid Family Workers | 0 | 0.0% |
| Total | 38 | 100.0% |
Employment Status by Age in Heathsville
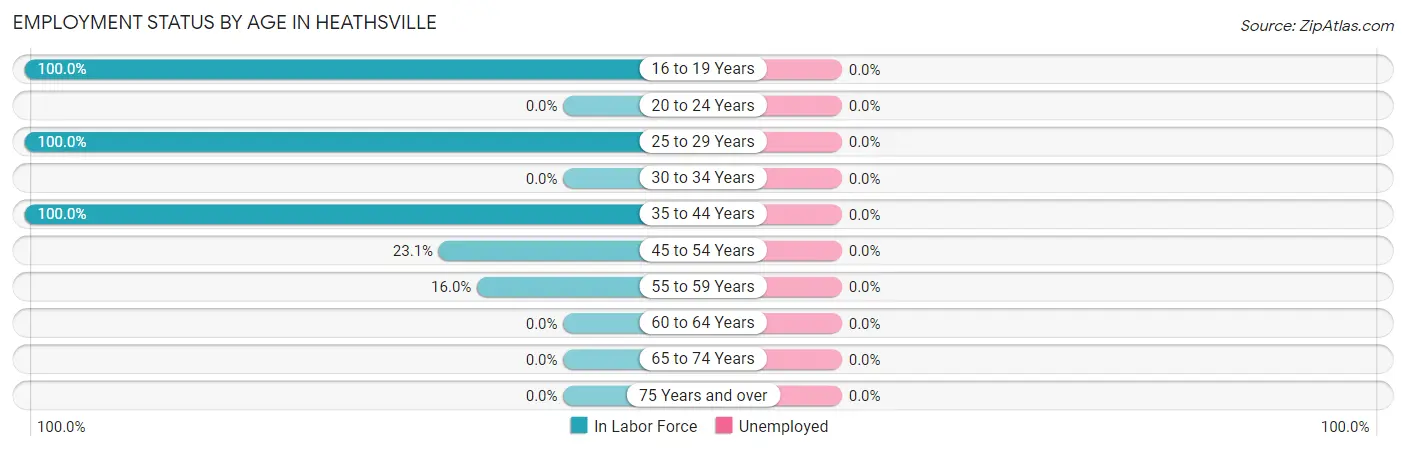
| Age Bracket | In Labor Force | Unemployed |
| 16 to 19 Years | 6 (100.0%) | 0 (0.0%) |
| 20 to 24 Years | 0 (0.0%) | 0 (0.0%) |
| 25 to 29 Years | 20 (100.0%) | 0 (0.0%) |
| 30 to 34 Years | 0 (0.0%) | 0 (0.0%) |
| 35 to 44 Years | 5 (100.0%) | 0 (0.0%) |
| 45 to 54 Years | 3 (23.1%) | 0 (0.0%) |
| 55 to 59 Years | 4 (16.0%) | 0 (0.0%) |
| 60 to 64 Years | 0 (0.0%) | 0 (0.0%) |
| 65 to 74 Years | 0 (0.0%) | 0 (0.0%) |
| 75 Years and over | 0 (0.0%) | 0 (0.0%) |
| Total | 38 (42.7%) | 0 (0.0%) |
Employment Status by Educational Attainment in Heathsville
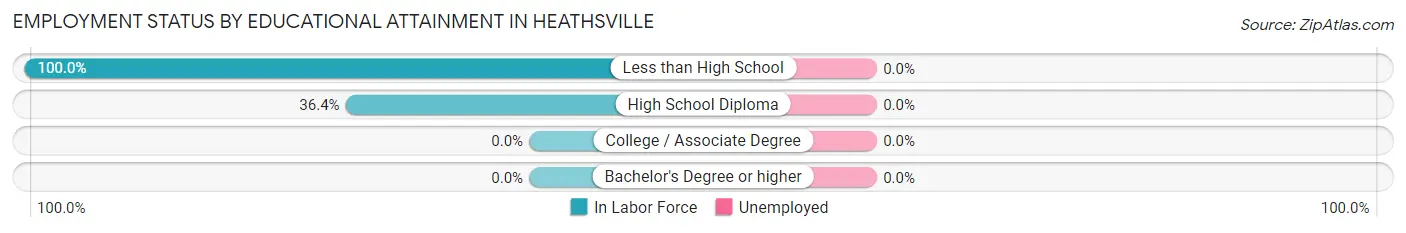
| Educational Attainment | In Labor Force | Unemployed |
| Less than High School | 20 (100.0%) | 0 (0.0%) |
| High School Diploma | 12 (36.4%) | 0 (0.0%) |
| College / Associate Degree | 0 (0.0%) | 0 (0.0%) |
| Bachelor's Degree or higher | 0 (0.0%) | 0 (0.0%) |
| Total | 32 (38.6%) | 0 (0.0%) |
Employment Occupations by Sex in Heathsville
Management, Business, Science and Arts Occupations
The most common Management, Business, Science and Arts occupations in Heathsville are , and Management (3 | 7.9%).
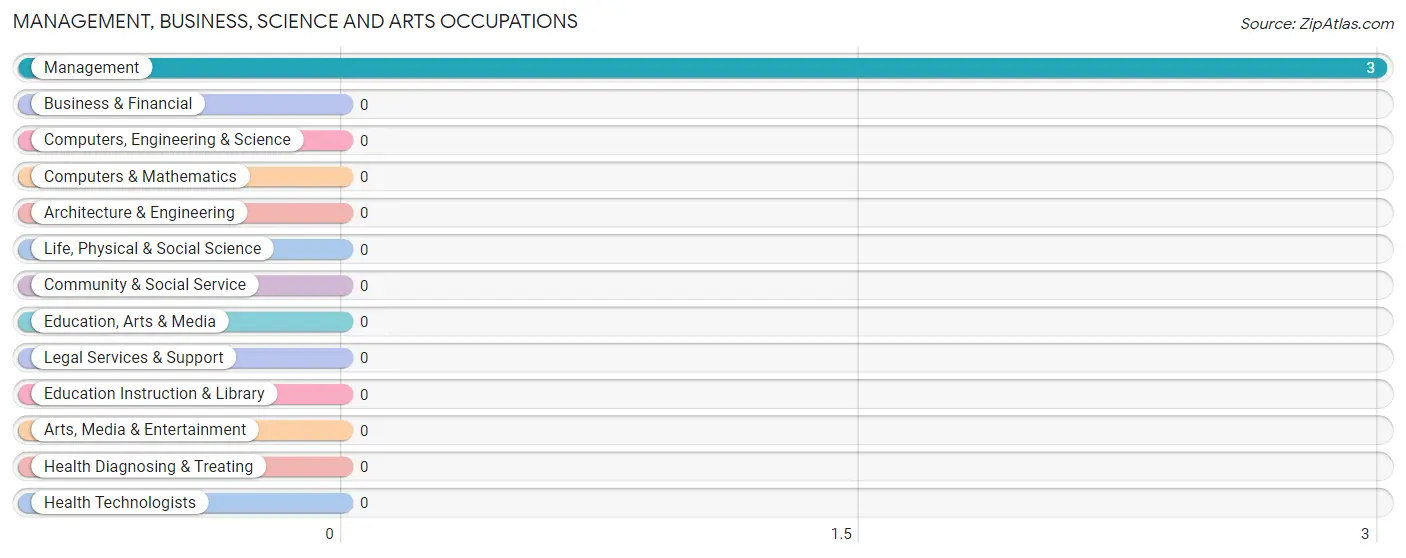
Management, Business, Science and Arts Occupations by Sex
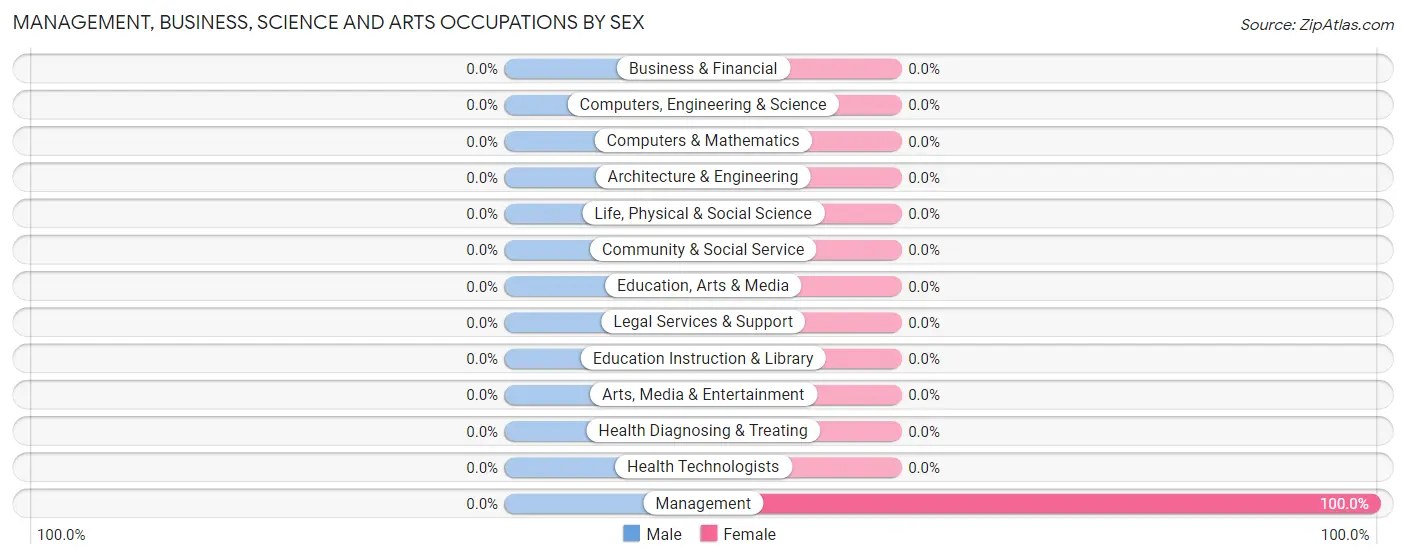
| Occupation | Male | Female |
| Management | 0 (0.0%) | 3 (100.0%) |
| Business & Financial | 0 (0.0%) | 0 (0.0%) |
| Computers, Engineering & Science | 0 (0.0%) | 0 (0.0%) |
| Computers & Mathematics | 0 (0.0%) | 0 (0.0%) |
| Architecture & Engineering | 0 (0.0%) | 0 (0.0%) |
| Life, Physical & Social Science | 0 (0.0%) | 0 (0.0%) |
| Community & Social Service | 0 (0.0%) | 0 (0.0%) |
| Education, Arts & Media | 0 (0.0%) | 0 (0.0%) |
| Legal Services & Support | 0 (0.0%) | 0 (0.0%) |
| Education Instruction & Library | 0 (0.0%) | 0 (0.0%) |
| Arts, Media & Entertainment | 0 (0.0%) | 0 (0.0%) |
| Health Diagnosing & Treating | 0 (0.0%) | 0 (0.0%) |
| Health Technologists | 0 (0.0%) | 0 (0.0%) |
| Total (Category) | 0 (0.0%) | 3 (100.0%) |
| Total (Overall) | 4 (10.5%) | 34 (89.5%) |
Services Occupations
The most common Services occupations in Heathsville are Cleaning & Maintenance (20 | 52.6%), Food Preparation & Serving (6 | 15.8%), and Healthcare Support (5 | 13.2%).
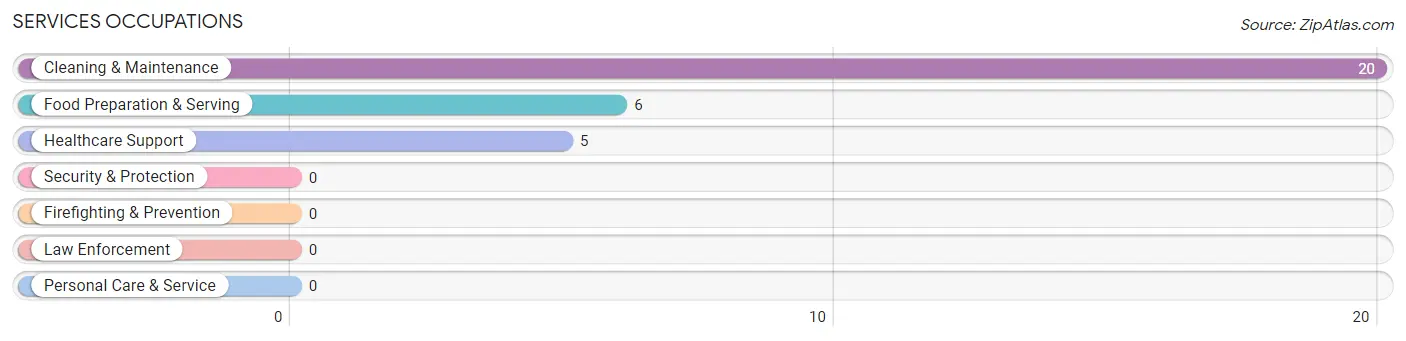
Services Occupations by Sex
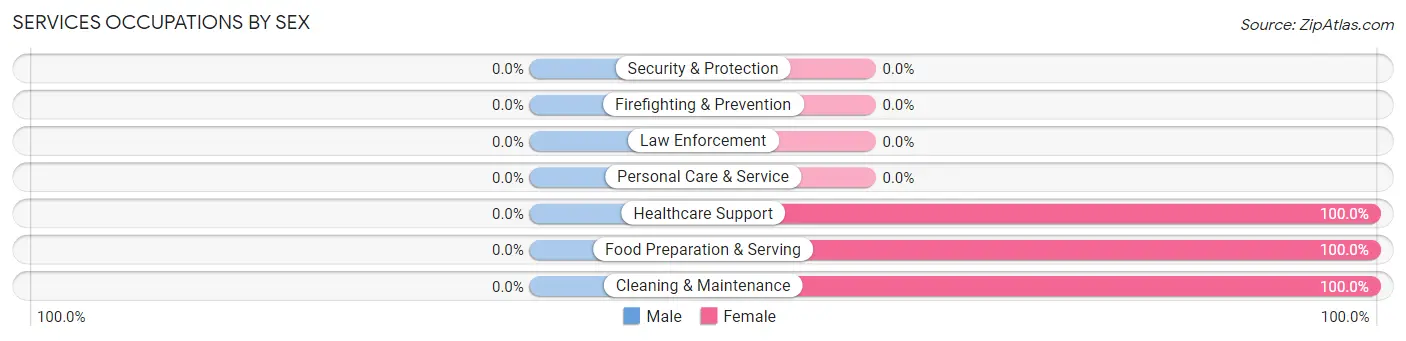
| Occupation | Male | Female |
| Healthcare Support | 0 (0.0%) | 5 (100.0%) |
| Security & Protection | 0 (0.0%) | 0 (0.0%) |
| Firefighting & Prevention | 0 (0.0%) | 0 (0.0%) |
| Law Enforcement | 0 (0.0%) | 0 (0.0%) |
| Food Preparation & Serving | 0 (0.0%) | 6 (100.0%) |
| Cleaning & Maintenance | 0 (0.0%) | 20 (100.0%) |
| Personal Care & Service | 0 (0.0%) | 0 (0.0%) |
| Total (Category) | 0 (0.0%) | 31 (100.0%) |
| Total (Overall) | 4 (10.5%) | 34 (89.5%) |
Sales and Office Occupations
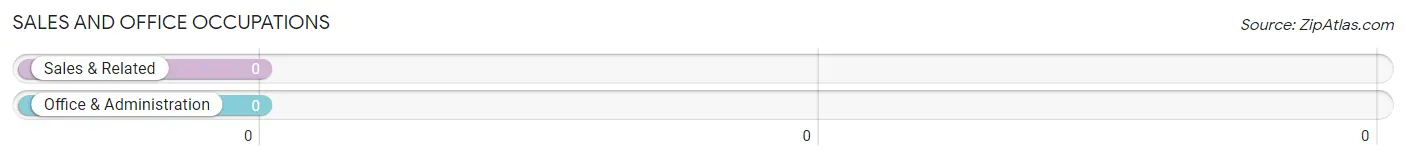
Sales and Office Occupations by Sex
| Occupation | Male | Female |
| Sales & Related | 0 (0.0%) | 0 (0.0%) |
| Office & Administration | 0 (0.0%) | 0 (0.0%) |
| Total (Category) | 0 (0.0%) | 0 (0.0%) |
| Total (Overall) | 4 (10.5%) | 34 (89.5%) |
Natural Resources, Construction and Maintenance Occupations
The most common Natural Resources, Construction and Maintenance occupations in Heathsville are , and Installation, Maintenance & Repair (4 | 10.5%).
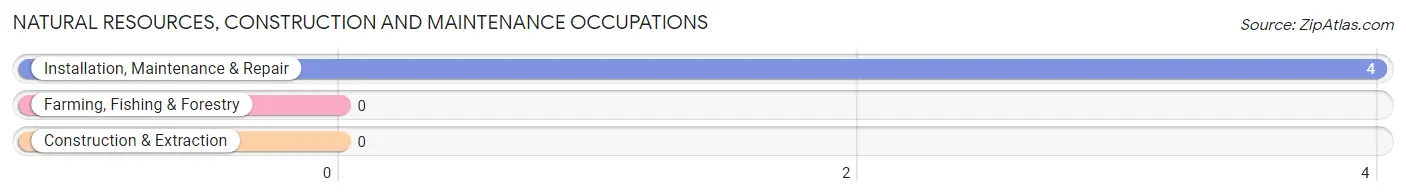
Natural Resources, Construction and Maintenance Occupations by Sex
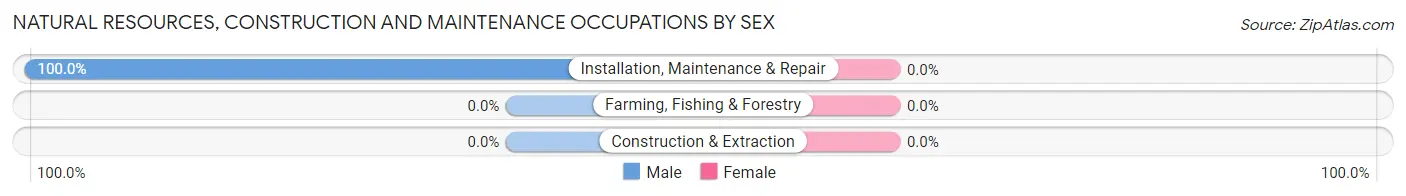
| Occupation | Male | Female |
| Farming, Fishing & Forestry | 0 (0.0%) | 0 (0.0%) |
| Construction & Extraction | 0 (0.0%) | 0 (0.0%) |
| Installation, Maintenance & Repair | 4 (100.0%) | 0 (0.0%) |
| Total (Category) | 4 (100.0%) | 0 (0.0%) |
| Total (Overall) | 4 (10.5%) | 34 (89.5%) |
Production, Transportation and Moving Occupations
Production, Transportation and Moving Occupations by Sex
| Occupation | Male | Female |
| Production | 0 (0.0%) | 0 (0.0%) |
| Transportation | 0 (0.0%) | 0 (0.0%) |
| Material Moving | 0 (0.0%) | 0 (0.0%) |
| Total (Category) | 0 (0.0%) | 0 (0.0%) |
| Total (Overall) | 4 (10.5%) | 34 (89.5%) |
Employment Industries by Sex in Heathsville
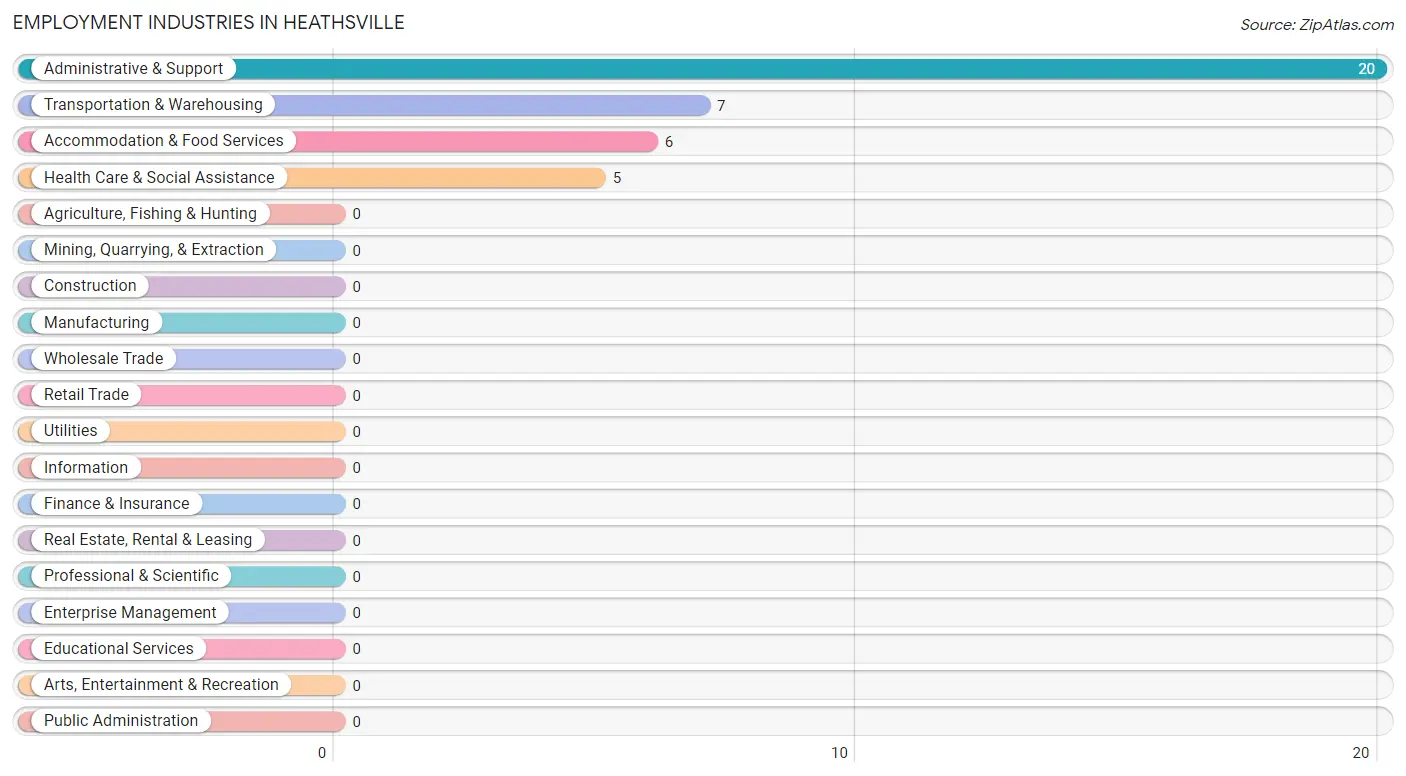
Employment Industries in Heathsville
The major employment industries in Heathsville include Administrative & Support (20 | 52.6%), Transportation & Warehousing (7 | 18.4%), Accommodation & Food Services (6 | 15.8%), and Health Care & Social Assistance (5 | 13.2%).
Employment Industries by Sex in Heathsville
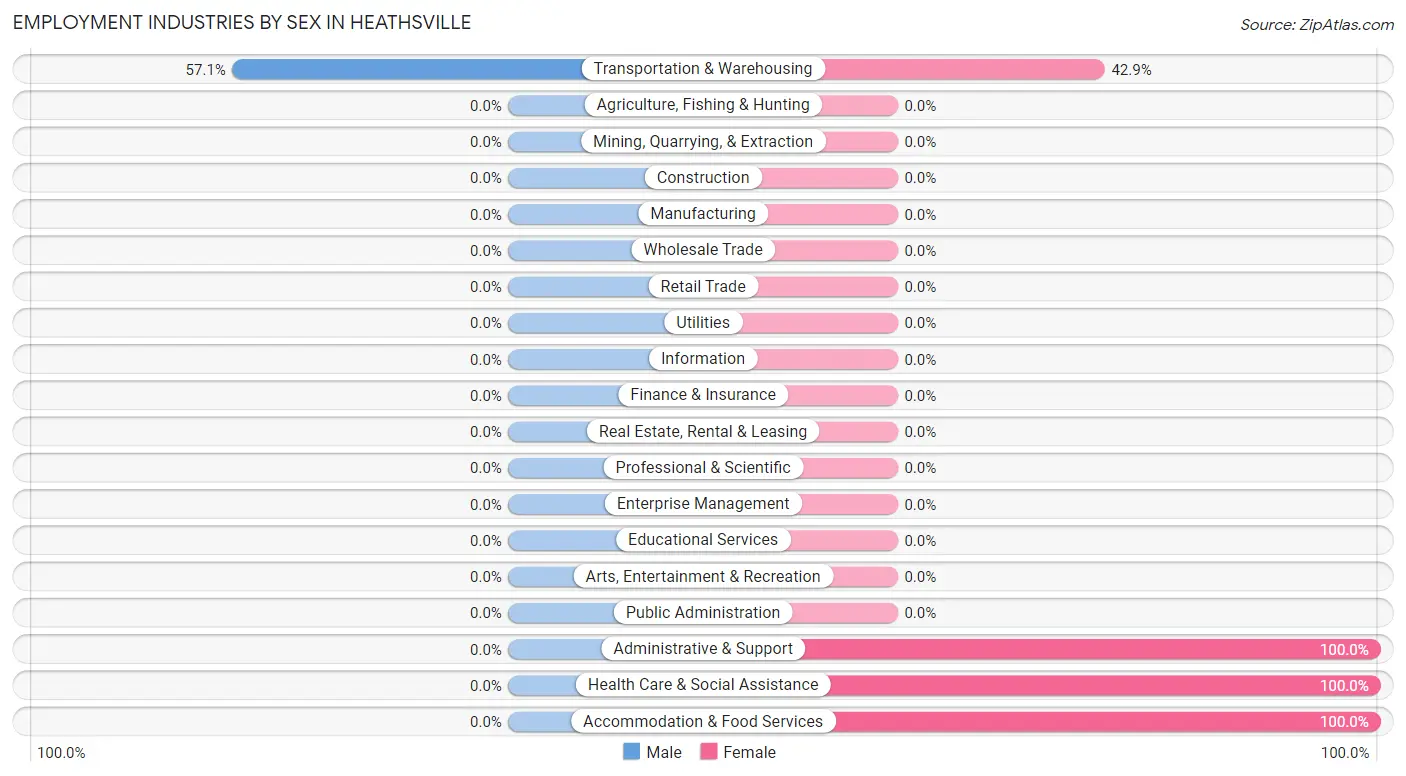
| Industry | Male | Female |
| Agriculture, Fishing & Hunting | 0 (0.0%) | 0 (0.0%) |
| Mining, Quarrying, & Extraction | 0 (0.0%) | 0 (0.0%) |
| Construction | 0 (0.0%) | 0 (0.0%) |
| Manufacturing | 0 (0.0%) | 0 (0.0%) |
| Wholesale Trade | 0 (0.0%) | 0 (0.0%) |
| Retail Trade | 0 (0.0%) | 0 (0.0%) |
| Transportation & Warehousing | 4 (57.1%) | 3 (42.9%) |
| Utilities | 0 (0.0%) | 0 (0.0%) |
| Information | 0 (0.0%) | 0 (0.0%) |
| Finance & Insurance | 0 (0.0%) | 0 (0.0%) |
| Real Estate, Rental & Leasing | 0 (0.0%) | 0 (0.0%) |
| Professional & Scientific | 0 (0.0%) | 0 (0.0%) |
| Enterprise Management | 0 (0.0%) | 0 (0.0%) |
| Administrative & Support | 0 (0.0%) | 20 (100.0%) |
| Educational Services | 0 (0.0%) | 0 (0.0%) |
| Health Care & Social Assistance | 0 (0.0%) | 5 (100.0%) |
| Arts, Entertainment & Recreation | 0 (0.0%) | 0 (0.0%) |
| Accommodation & Food Services | 0 (0.0%) | 6 (100.0%) |
| Public Administration | 0 (0.0%) | 0 (0.0%) |
| Total | 4 (10.5%) | 34 (89.5%) |
Education in Heathsville
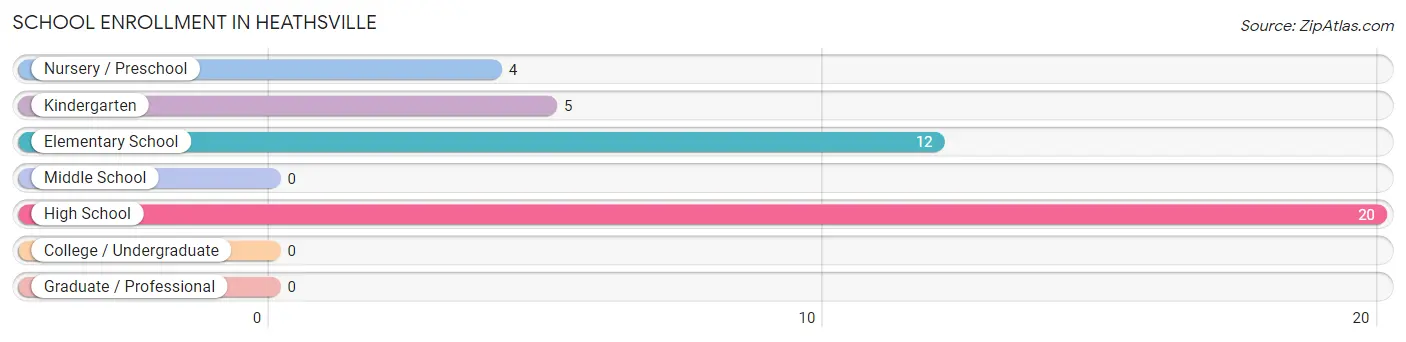
School Enrollment in Heathsville
The most common levels of schooling among the 41 students in Heathsville are high school (20 | 48.8%), elementary school (12 | 29.3%), and kindergarten (5 | 12.2%).
| School Level | # Students | % Students |
| Nursery / Preschool | 4 | 9.8% |
| Kindergarten | 5 | 12.2% |
| Elementary School | 12 | 29.3% |
| Middle School | 0 | 0.0% |
| High School | 20 | 48.8% |
| College / Undergraduate | 0 | 0.0% |
| Graduate / Professional | 0 | 0.0% |
| Total | 41 | 100.0% |
School Enrollment by Age by Funding Source in Heathsville
Out of a total of 41 students who are enrolled in schools in Heathsville, 4 (9.8%) attend a private institution, while the remaining 37 (90.2%) are enrolled in public schools. The age group of 3 to 4 year olds has the highest likelihood of being enrolled in private schools, with 4 (100.0% in the age bracket) enrolled. Conversely, the age group of 5 to 9 year old has the lowest likelihood of being enrolled in a private school, with 5 (100.0% in the age bracket) attending a public institution.
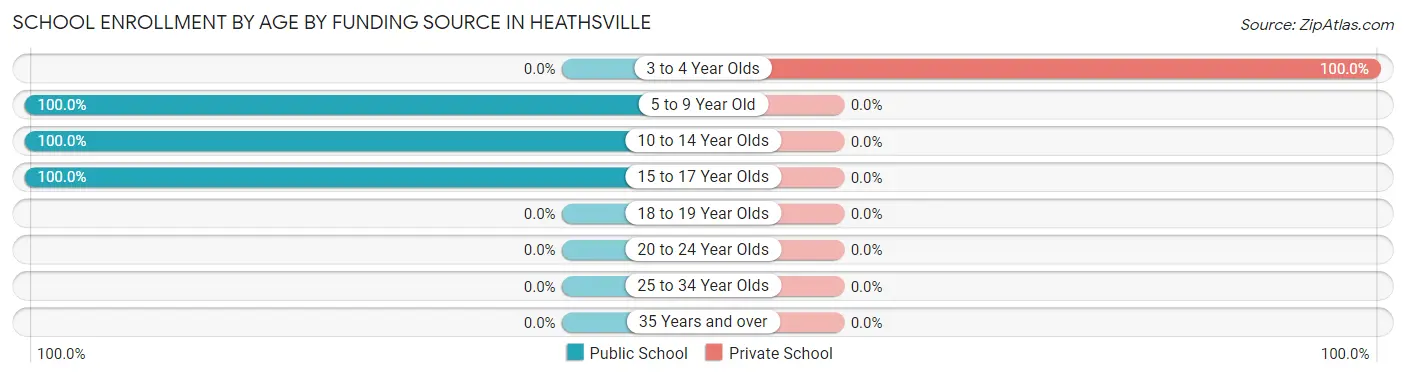
| Age Bracket | Public School | Private School |
| 3 to 4 Year Olds | 0 (0.0%) | 4 (100.0%) |
| 5 to 9 Year Old | 5 (100.0%) | 0 (0.0%) |
| 10 to 14 Year Olds | 12 (100.0%) | 0 (0.0%) |
| 15 to 17 Year Olds | 20 (100.0%) | 0 (0.0%) |
| 18 to 19 Year Olds | 0 (0.0%) | 0 (0.0%) |
| 20 to 24 Year Olds | 0 (0.0%) | 0 (0.0%) |
| 25 to 34 Year Olds | 0 (0.0%) | 0 (0.0%) |
| 35 Years and over | 0 (0.0%) | 0 (0.0%) |
| Total | 37 (90.2%) | 4 (9.8%) |
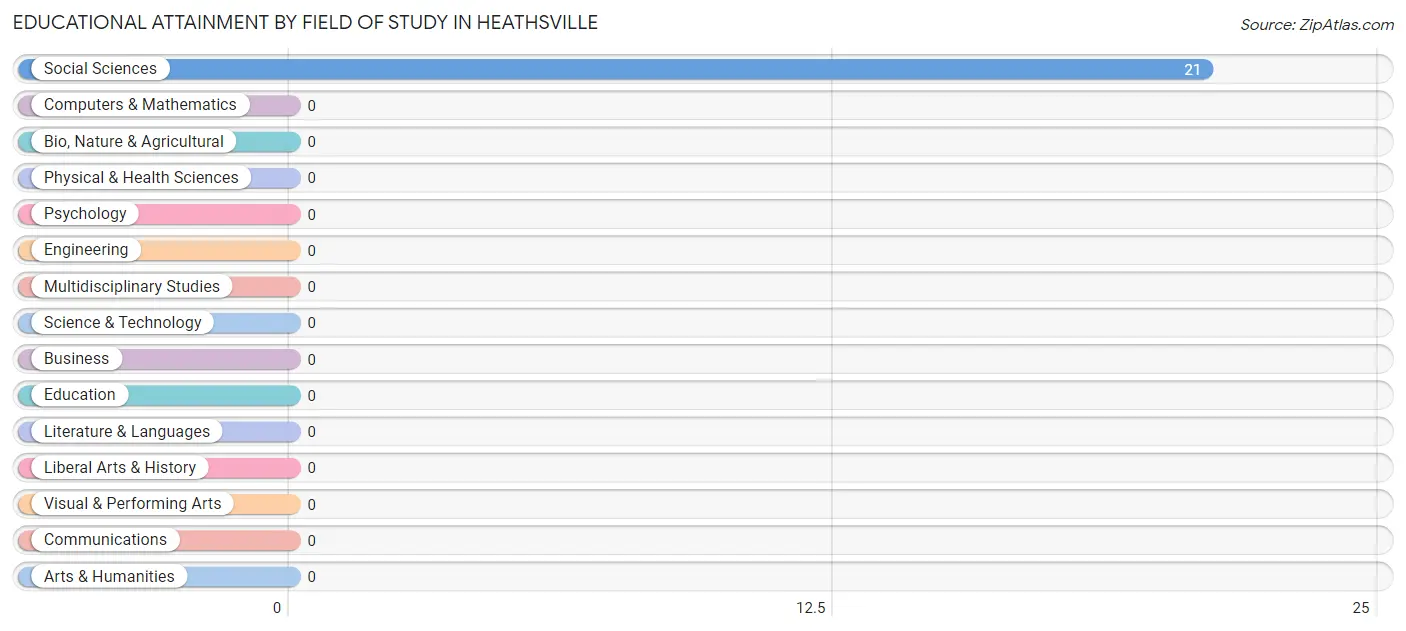
Educational Attainment by Field of Study in Heathsville
, and social sciences (21 | 100.0%) are the most common fields of study among 21 individuals in Heathsville who have obtained a bachelor's degree or higher.
| Field of Study | # Graduates | % Graduates |
| Computers & Mathematics | 0 | 0.0% |
| Bio, Nature & Agricultural | 0 | 0.0% |
| Physical & Health Sciences | 0 | 0.0% |
| Psychology | 0 | 0.0% |
| Social Sciences | 21 | 100.0% |
| Engineering | 0 | 0.0% |
| Multidisciplinary Studies | 0 | 0.0% |
| Science & Technology | 0 | 0.0% |
| Business | 0 | 0.0% |
| Education | 0 | 0.0% |
| Literature & Languages | 0 | 0.0% |
| Liberal Arts & History | 0 | 0.0% |
| Visual & Performing Arts | 0 | 0.0% |
| Communications | 0 | 0.0% |
| Arts & Humanities | 0 | 0.0% |
| Total | 21 | 100.0% |
Transportation & Commute in Heathsville
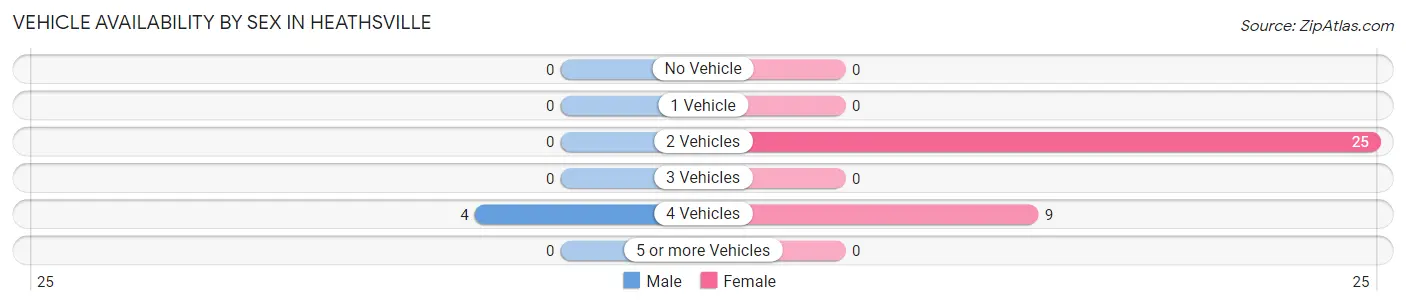
Vehicle Availability by Sex in Heathsville
The most prevalent vehicle ownership categories in Heathsville are males with 4 vehicles (4, accounting for 100.0%) and females with 4 vehicles (9, making up 11.8%).
| Vehicles Available | Male | Female |
| No Vehicle | 0 (0.0%) | 0 (0.0%) |
| 1 Vehicle | 0 (0.0%) | 0 (0.0%) |
| 2 Vehicles | 0 (0.0%) | 25 (73.5%) |
| 3 Vehicles | 0 (0.0%) | 0 (0.0%) |
| 4 Vehicles | 4 (100.0%) | 9 (26.5%) |
| 5 or more Vehicles | 0 (0.0%) | 0 (0.0%) |
| Total | 4 (100.0%) | 34 (100.0%) |
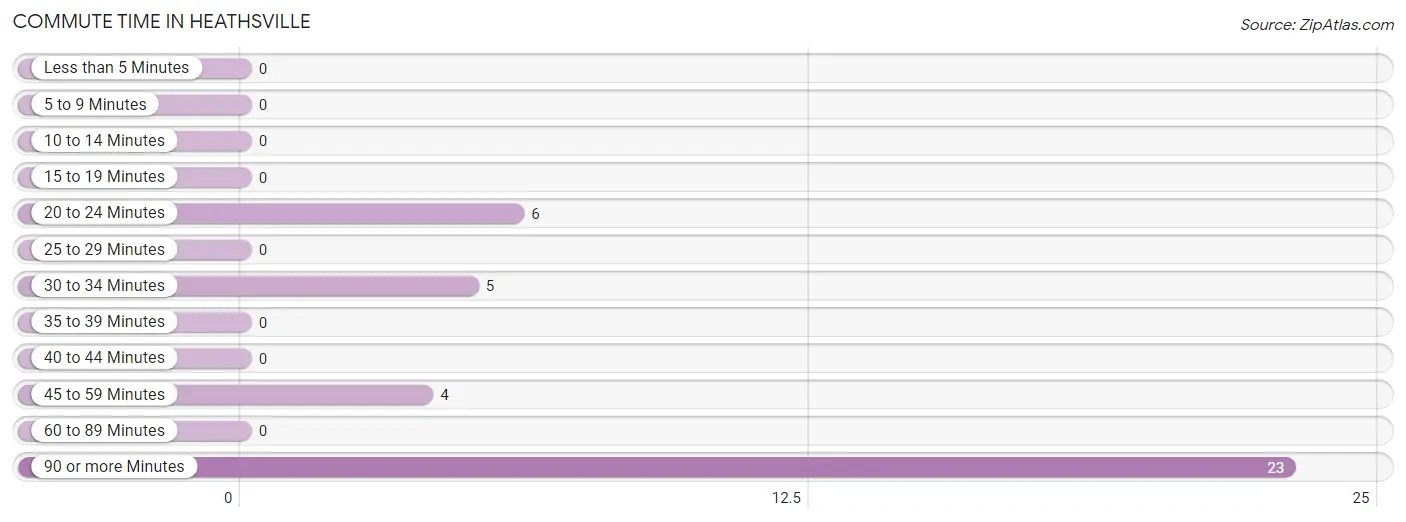
Commute Time in Heathsville
The most frequently occuring commute durations in Heathsville are 90 or more minutes (23 commuters, 60.5%), 20 to 24 minutes (6 commuters, 15.8%), and 30 to 34 minutes (5 commuters, 13.2%).
| Commute Time | # Commuters | % Commuters |
| Less than 5 Minutes | 0 | 0.0% |
| 5 to 9 Minutes | 0 | 0.0% |
| 10 to 14 Minutes | 0 | 0.0% |
| 15 to 19 Minutes | 0 | 0.0% |
| 20 to 24 Minutes | 6 | 15.8% |
| 25 to 29 Minutes | 0 | 0.0% |
| 30 to 34 Minutes | 5 | 13.2% |
| 35 to 39 Minutes | 0 | 0.0% |
| 40 to 44 Minutes | 0 | 0.0% |
| 45 to 59 Minutes | 4 | 10.5% |
| 60 to 89 Minutes | 0 | 0.0% |
| 90 or more Minutes | 23 | 60.5% |
Commute Time by Sex in Heathsville
The most common commute times in Heathsville are 45 to 59 minutes (4 commuters, 100.0%) for males and 90 or more minutes (23 commuters, 67.6%) for females.
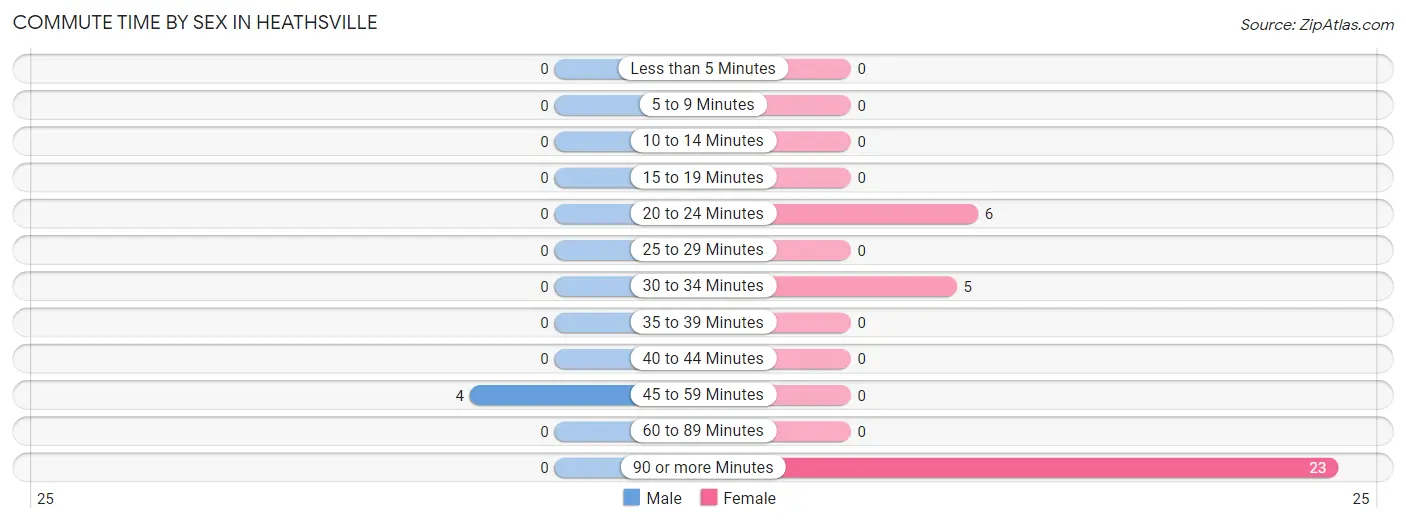
| Commute Time | Male | Female |
| Less than 5 Minutes | 0 (0.0%) | 0 (0.0%) |
| 5 to 9 Minutes | 0 (0.0%) | 0 (0.0%) |
| 10 to 14 Minutes | 0 (0.0%) | 0 (0.0%) |
| 15 to 19 Minutes | 0 (0.0%) | 0 (0.0%) |
| 20 to 24 Minutes | 0 (0.0%) | 6 (17.6%) |
| 25 to 29 Minutes | 0 (0.0%) | 0 (0.0%) |
| 30 to 34 Minutes | 0 (0.0%) | 5 (14.7%) |
| 35 to 39 Minutes | 0 (0.0%) | 0 (0.0%) |
| 40 to 44 Minutes | 0 (0.0%) | 0 (0.0%) |
| 45 to 59 Minutes | 4 (100.0%) | 0 (0.0%) |
| 60 to 89 Minutes | 0 (0.0%) | 0 (0.0%) |
| 90 or more Minutes | 0 (0.0%) | 23 (67.6%) |
Time of Departure to Work by Sex in Heathsville
The most frequent times of departure to work in Heathsville are 7:00 AM to 7:29 AM (4, 100.0%) for males and 10:00 AM to 10:59 AM (20, 58.8%) for females.
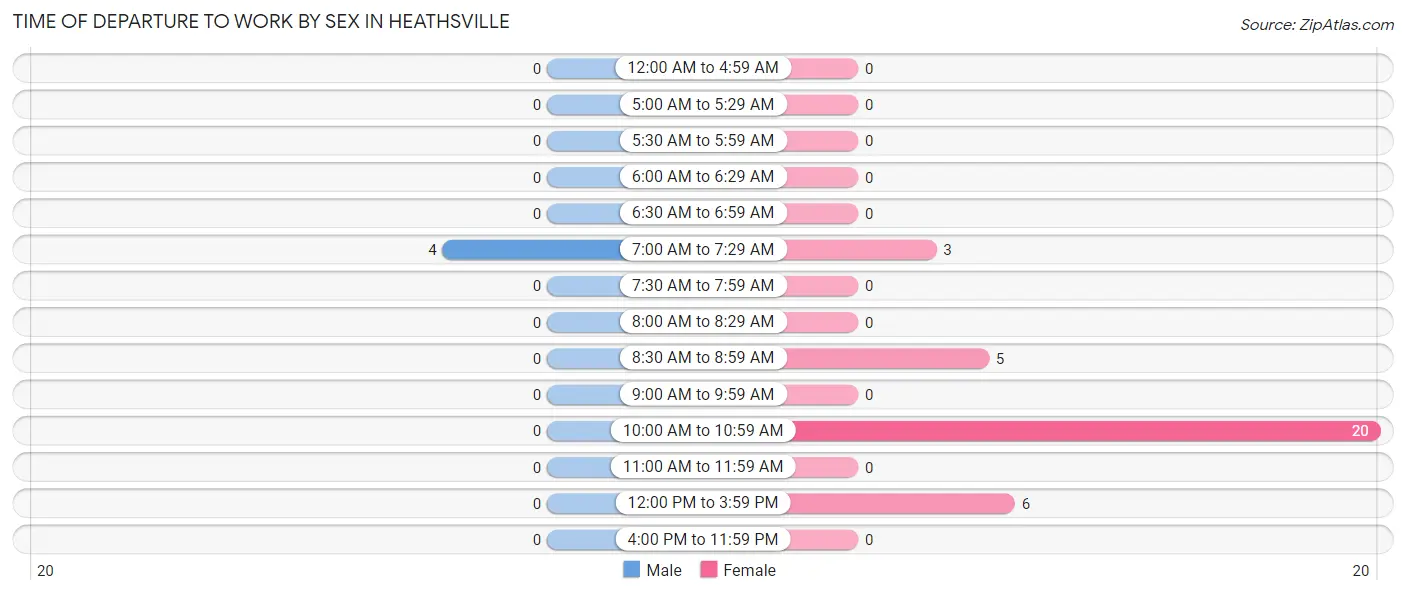
| Time of Departure | Male | Female |
| 12:00 AM to 4:59 AM | 0 (0.0%) | 0 (0.0%) |
| 5:00 AM to 5:29 AM | 0 (0.0%) | 0 (0.0%) |
| 5:30 AM to 5:59 AM | 0 (0.0%) | 0 (0.0%) |
| 6:00 AM to 6:29 AM | 0 (0.0%) | 0 (0.0%) |
| 6:30 AM to 6:59 AM | 0 (0.0%) | 0 (0.0%) |
| 7:00 AM to 7:29 AM | 4 (100.0%) | 3 (8.8%) |
| 7:30 AM to 7:59 AM | 0 (0.0%) | 0 (0.0%) |
| 8:00 AM to 8:29 AM | 0 (0.0%) | 0 (0.0%) |
| 8:30 AM to 8:59 AM | 0 (0.0%) | 5 (14.7%) |
| 9:00 AM to 9:59 AM | 0 (0.0%) | 0 (0.0%) |
| 10:00 AM to 10:59 AM | 0 (0.0%) | 20 (58.8%) |
| 11:00 AM to 11:59 AM | 0 (0.0%) | 0 (0.0%) |
| 12:00 PM to 3:59 PM | 0 (0.0%) | 6 (17.6%) |
| 4:00 PM to 11:59 PM | 0 (0.0%) | 0 (0.0%) |
| Total | 4 (100.0%) | 34 (100.0%) |
Housing Occupancy in Heathsville
Occupancy by Ownership in Heathsville
Of the total 58 dwellings in Heathsville, owner-occupied units account for 53 (91.4%), while renter-occupied units make up 5 (8.6%).
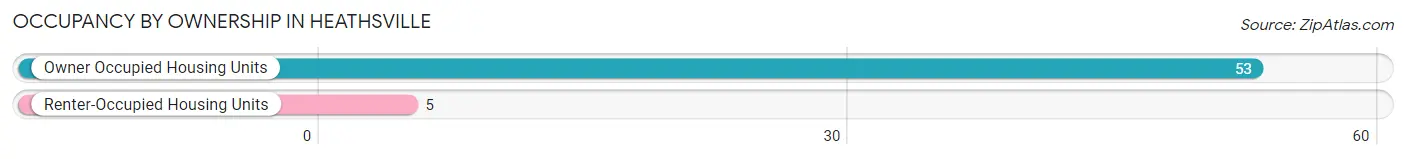
| Occupancy | # Housing Units | % Housing Units |
| Owner Occupied Housing Units | 53 | 91.4% |
| Renter-Occupied Housing Units | 5 | 8.6% |
| Total Occupied Housing Units | 58 | 100.0% |
Occupancy by Household Size in Heathsville
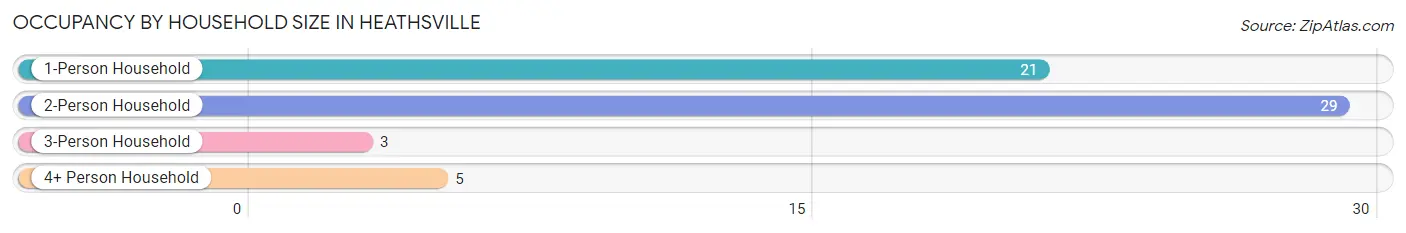
| Household Size | # Housing Units | % Housing Units |
| 1-Person Household | 21 | 36.2% |
| 2-Person Household | 29 | 50.0% |
| 3-Person Household | 3 | 5.2% |
| 4+ Person Household | 5 | 8.6% |
| Total Housing Units | 58 | 100.0% |
Occupancy by Ownership by Household Size in Heathsville
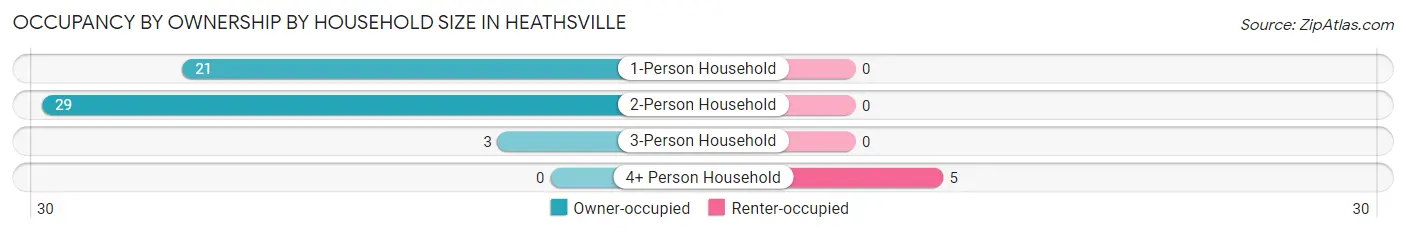
| Household Size | Owner-occupied | Renter-occupied |
| 1-Person Household | 21 (100.0%) | 0 (0.0%) |
| 2-Person Household | 29 (100.0%) | 0 (0.0%) |
| 3-Person Household | 3 (100.0%) | 0 (0.0%) |
| 4+ Person Household | 0 (0.0%) | 5 (100.0%) |
| Total Housing Units | 53 (91.4%) | 5 (8.6%) |
Occupancy by Educational Attainment in Heathsville
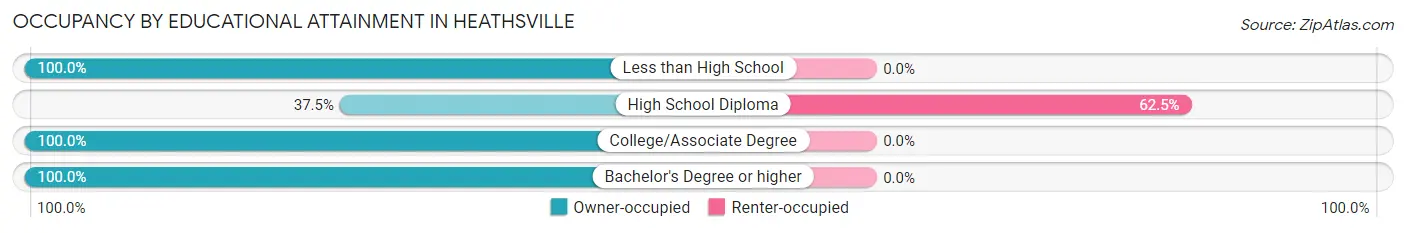
| Household Size | Owner-occupied | Renter-occupied |
| Less than High School | 20 (100.0%) | 0 (0.0%) |
| High School Diploma | 3 (37.5%) | 5 (62.5%) |
| College/Associate Degree | 9 (100.0%) | 0 (0.0%) |
| Bachelor's Degree or higher | 21 (100.0%) | 0 (0.0%) |
Occupancy by Age of Householder in Heathsville
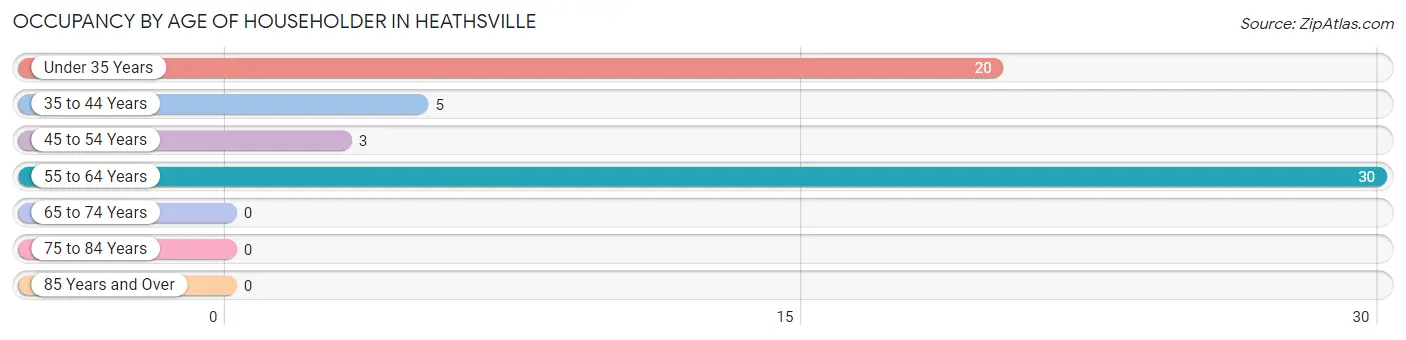
| Age Bracket | # Households | % Households |
| Under 35 Years | 20 | 34.5% |
| 35 to 44 Years | 5 | 8.6% |
| 45 to 54 Years | 3 | 5.2% |
| 55 to 64 Years | 30 | 51.7% |
| 65 to 74 Years | 0 | 0.0% |
| 75 to 84 Years | 0 | 0.0% |
| 85 Years and Over | 0 | 0.0% |
| Total | 58 | 100.0% |
Housing Finances in Heathsville
Median Income by Occupancy in Heathsville
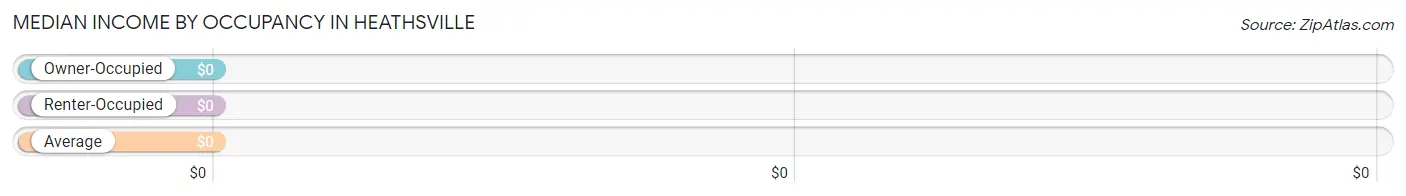
| Occupancy Type | # Households | Median Income |
| Owner-Occupied | 53 (91.4%) | $0 |
| Renter-Occupied | 5 (8.6%) | $0 |
| Average | 58 (100.0%) | $0 |
Occupancy by Householder Income Bracket in Heathsville
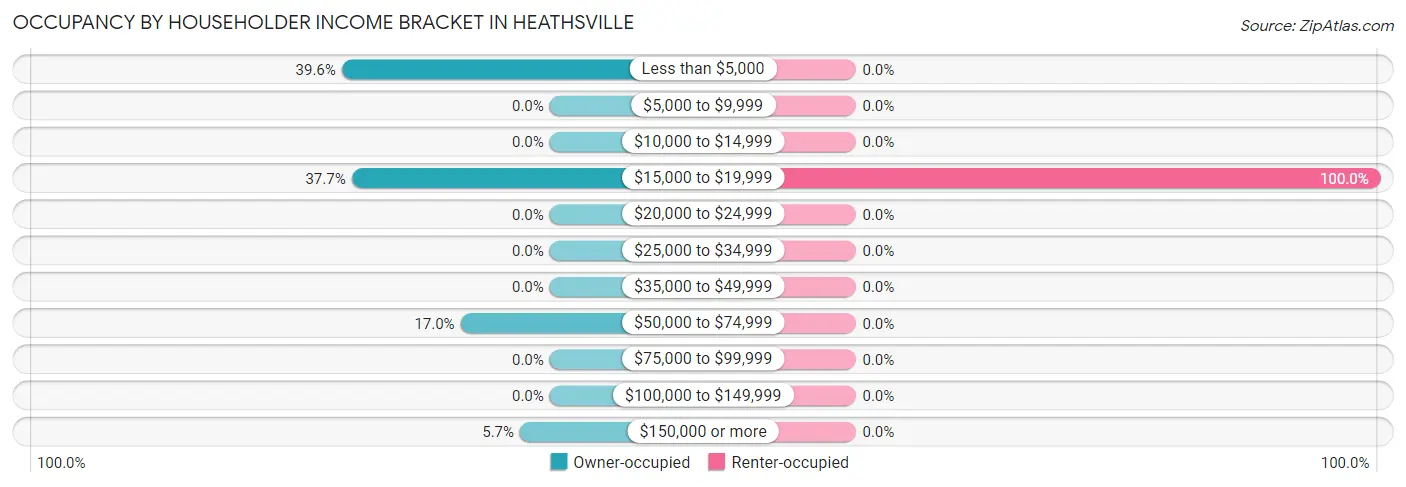
| Income Bracket | Owner-occupied | Renter-occupied |
| Less than $5,000 | 21 (39.6%) | 0 (0.0%) |
| $5,000 to $9,999 | 0 (0.0%) | 0 (0.0%) |
| $10,000 to $14,999 | 0 (0.0%) | 0 (0.0%) |
| $15,000 to $19,999 | 20 (37.7%) | 5 (100.0%) |
| $20,000 to $24,999 | 0 (0.0%) | 0 (0.0%) |
| $25,000 to $34,999 | 0 (0.0%) | 0 (0.0%) |
| $35,000 to $49,999 | 0 (0.0%) | 0 (0.0%) |
| $50,000 to $74,999 | 9 (17.0%) | 0 (0.0%) |
| $75,000 to $99,999 | 0 (0.0%) | 0 (0.0%) |
| $100,000 to $149,999 | 0 (0.0%) | 0 (0.0%) |
| $150,000 or more | 3 (5.7%) | 0 (0.0%) |
| Total | 53 (100.0%) | 5 (100.0%) |
Monthly Housing Cost Tiers in Heathsville
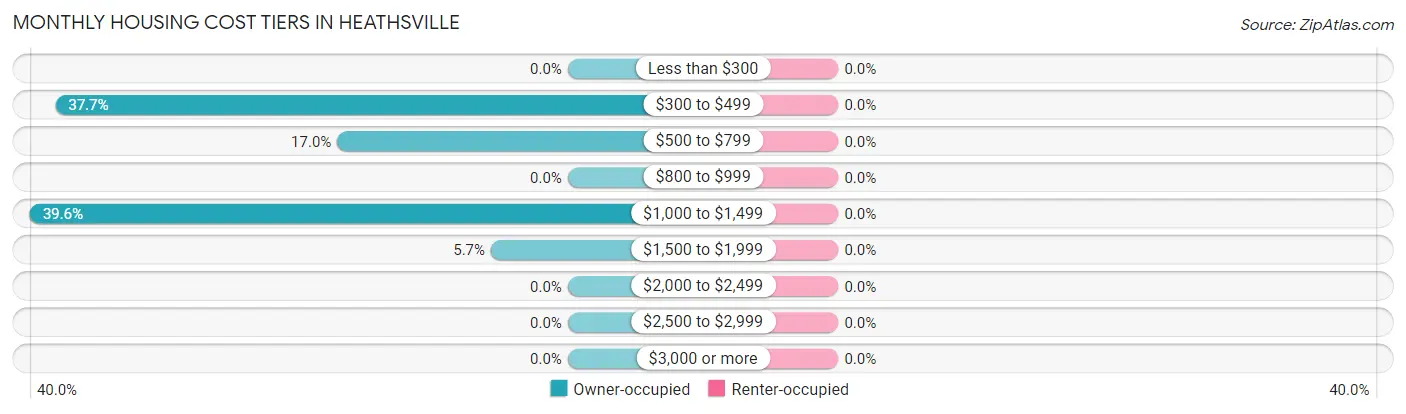
| Monthly Cost | Owner-occupied | Renter-occupied |
| Less than $300 | 0 (0.0%) | 0 (0.0%) |
| $300 to $499 | 20 (37.7%) | 0 (0.0%) |
| $500 to $799 | 9 (17.0%) | 0 (0.0%) |
| $800 to $999 | 0 (0.0%) | 0 (0.0%) |
| $1,000 to $1,499 | 21 (39.6%) | 0 (0.0%) |
| $1,500 to $1,999 | 3 (5.7%) | 0 (0.0%) |
| $2,000 to $2,499 | 0 (0.0%) | 0 (0.0%) |
| $2,500 to $2,999 | 0 (0.0%) | 0 (0.0%) |
| $3,000 or more | 0 (0.0%) | 0 (0.0%) |
| Total | 53 (100.0%) | 5 (100.0%) |
Physical Housing Characteristics in Heathsville
Housing Structures in Heathsville
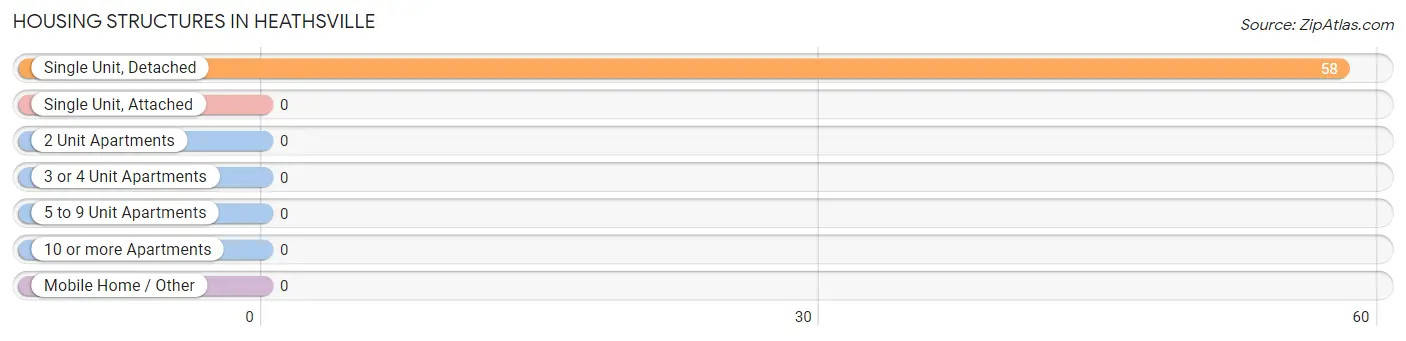
| Structure Type | # Housing Units | % Housing Units |
| Single Unit, Detached | 58 | 100.0% |
| Single Unit, Attached | 0 | 0.0% |
| 2 Unit Apartments | 0 | 0.0% |
| 3 or 4 Unit Apartments | 0 | 0.0% |
| 5 to 9 Unit Apartments | 0 | 0.0% |
| 10 or more Apartments | 0 | 0.0% |
| Mobile Home / Other | 0 | 0.0% |
| Total | 58 | 100.0% |
Housing Structures by Occupancy in Heathsville

| Structure Type | Owner-occupied | Renter-occupied |
| Single Unit, Detached | 53 (91.4%) | 5 (8.6%) |
| Single Unit, Attached | 0 (0.0%) | 0 (0.0%) |
| 2 Unit Apartments | 0 (0.0%) | 0 (0.0%) |
| 3 or 4 Unit Apartments | 0 (0.0%) | 0 (0.0%) |
| 5 to 9 Unit Apartments | 0 (0.0%) | 0 (0.0%) |
| 10 or more Apartments | 0 (0.0%) | 0 (0.0%) |
| Mobile Home / Other | 0 (0.0%) | 0 (0.0%) |
| Total | 53 (91.4%) | 5 (8.6%) |
Housing Structures by Number of Rooms in Heathsville
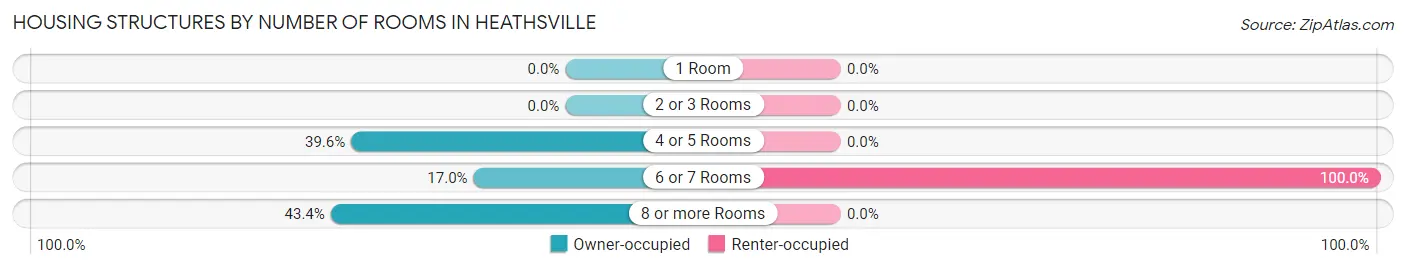
| Number of Rooms | Owner-occupied | Renter-occupied |
| 1 Room | 0 (0.0%) | 0 (0.0%) |
| 2 or 3 Rooms | 0 (0.0%) | 0 (0.0%) |
| 4 or 5 Rooms | 21 (39.6%) | 0 (0.0%) |
| 6 or 7 Rooms | 9 (17.0%) | 5 (100.0%) |
| 8 or more Rooms | 23 (43.4%) | 0 (0.0%) |
| Total | 53 (100.0%) | 5 (100.0%) |
Housing Structure by Heating Type in Heathsville
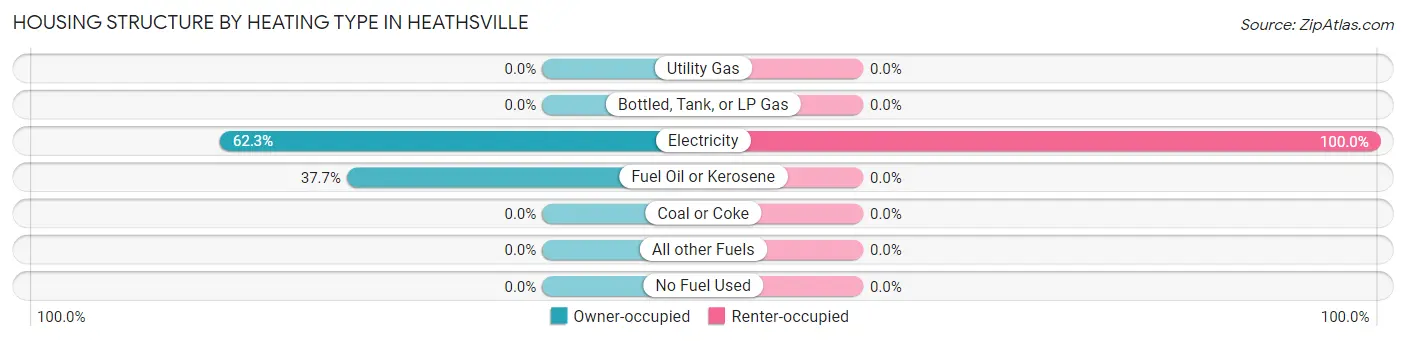
| Heating Type | Owner-occupied | Renter-occupied |
| Utility Gas | 0 (0.0%) | 0 (0.0%) |
| Bottled, Tank, or LP Gas | 0 (0.0%) | 0 (0.0%) |
| Electricity | 33 (62.3%) | 5 (100.0%) |
| Fuel Oil or Kerosene | 20 (37.7%) | 0 (0.0%) |
| Coal or Coke | 0 (0.0%) | 0 (0.0%) |
| All other Fuels | 0 (0.0%) | 0 (0.0%) |
| No Fuel Used | 0 (0.0%) | 0 (0.0%) |
| Total | 53 (100.0%) | 5 (100.0%) |
Household Vehicle Usage in Heathsville
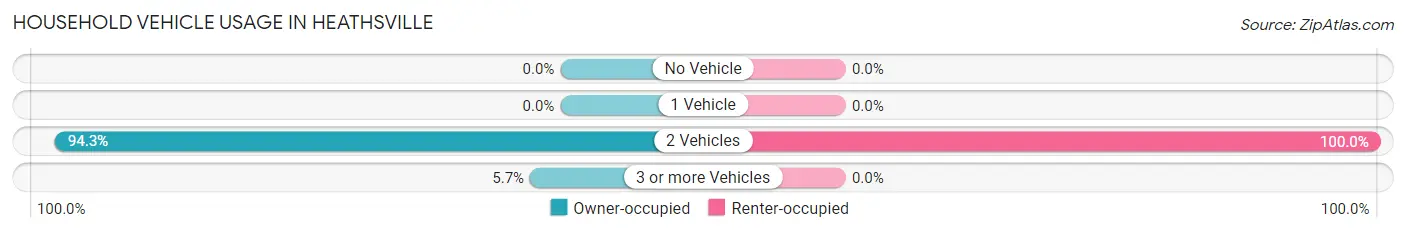
| Vehicles per Household | Owner-occupied | Renter-occupied |
| No Vehicle | 0 (0.0%) | 0 (0.0%) |
| 1 Vehicle | 0 (0.0%) | 0 (0.0%) |
| 2 Vehicles | 50 (94.3%) | 5 (100.0%) |
| 3 or more Vehicles | 3 (5.7%) | 0 (0.0%) |
| Total | 53 (100.0%) | 5 (100.0%) |
Real Estate & Mortgages in Heathsville
Real Estate and Mortgage Overview in Heathsville
| Characteristic | Without Mortgage | With Mortgage |
| Housing Units | 29 | 24 |
| Median Property Value | - | - |
| Median Household Income | - | - |
| Monthly Housing Costs | - | - |
| Real Estate Taxes | - | - |
Property Value by Mortgage Status in Heathsville
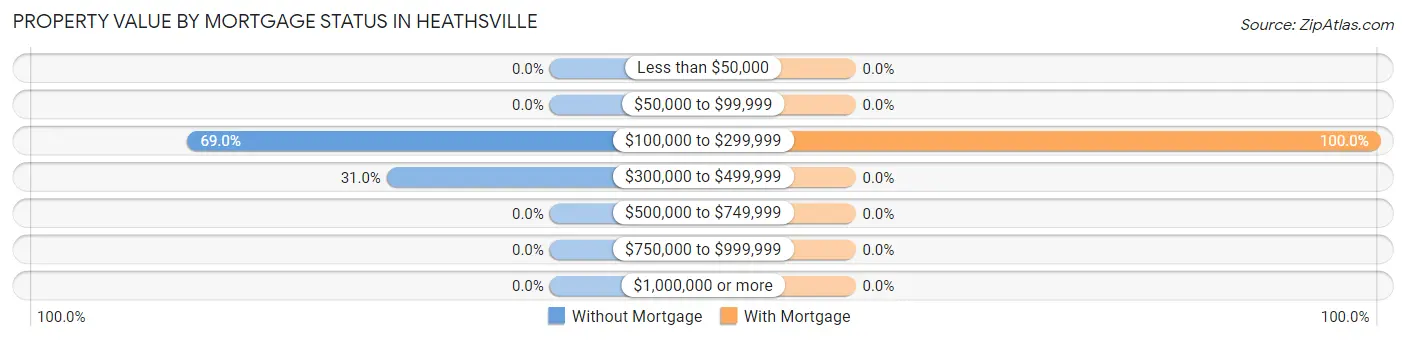
| Property Value | Without Mortgage | With Mortgage |
| Less than $50,000 | 0 (0.0%) | 0 (0.0%) |
| $50,000 to $99,999 | 0 (0.0%) | 0 (0.0%) |
| $100,000 to $299,999 | 20 (69.0%) | 24 (100.0%) |
| $300,000 to $499,999 | 9 (31.0%) | 0 (0.0%) |
| $500,000 to $749,999 | 0 (0.0%) | 0 (0.0%) |
| $750,000 to $999,999 | 0 (0.0%) | 0 (0.0%) |
| $1,000,000 or more | 0 (0.0%) | 0 (0.0%) |
| Total | 29 (100.0%) | 24 (100.0%) |
Household Income by Mortgage Status in Heathsville
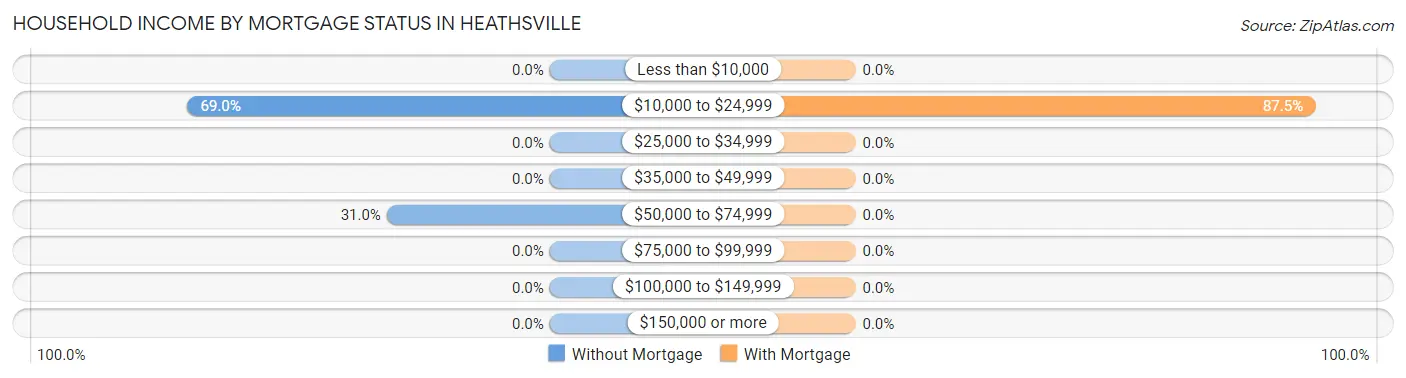
| Household Income | Without Mortgage | With Mortgage |
| Less than $10,000 | 0 (0.0%) | 0 (0.0%) |
| $10,000 to $24,999 | 20 (69.0%) | 21 (87.5%) |
| $25,000 to $34,999 | 0 (0.0%) | 0 (0.0%) |
| $35,000 to $49,999 | 0 (0.0%) | 0 (0.0%) |
| $50,000 to $74,999 | 9 (31.0%) | 0 (0.0%) |
| $75,000 to $99,999 | 0 (0.0%) | 0 (0.0%) |
| $100,000 to $149,999 | 0 (0.0%) | 0 (0.0%) |
| $150,000 or more | 0 (0.0%) | 0 (0.0%) |
| Total | 29 (100.0%) | 24 (100.0%) |
Property Value to Household Income Ratio in Heathsville
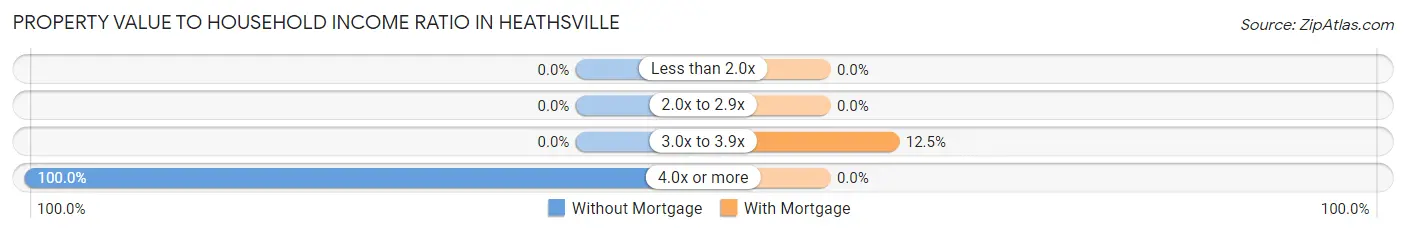
| Value-to-Income Ratio | Without Mortgage | With Mortgage |
| Less than 2.0x | 0 (0.0%) | 0 (0.0%) |
| 2.0x to 2.9x | 0 (0.0%) | 0 (0.0%) |
| 3.0x to 3.9x | 0 (0.0%) | 3 (12.5%) |
| 4.0x or more | 29 (100.0%) | 0 (0.0%) |
| Total | 29 (100.0%) | 24 (100.0%) |
Real Estate Taxes by Mortgage Status in Heathsville
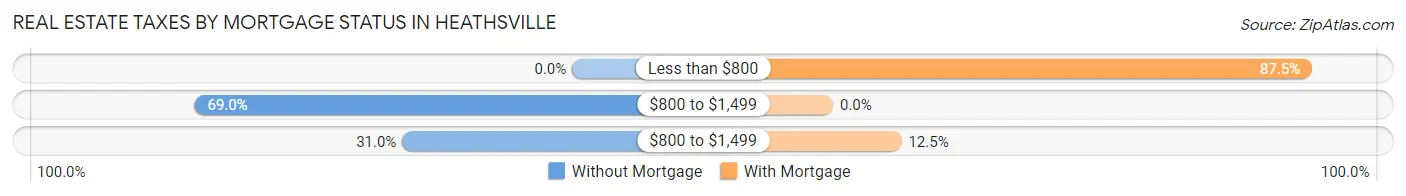
| Property Taxes | Without Mortgage | With Mortgage |
| Less than $800 | 0 (0.0%) | 21 (87.5%) |
| $800 to $1,499 | 20 (69.0%) | 0 (0.0%) |
| $800 to $1,499 | 9 (31.0%) | 3 (12.5%) |
| Total | 29 (100.0%) | 24 (100.0%) |
Health & Disability in Heathsville
Health Insurance Coverage by Age in Heathsville
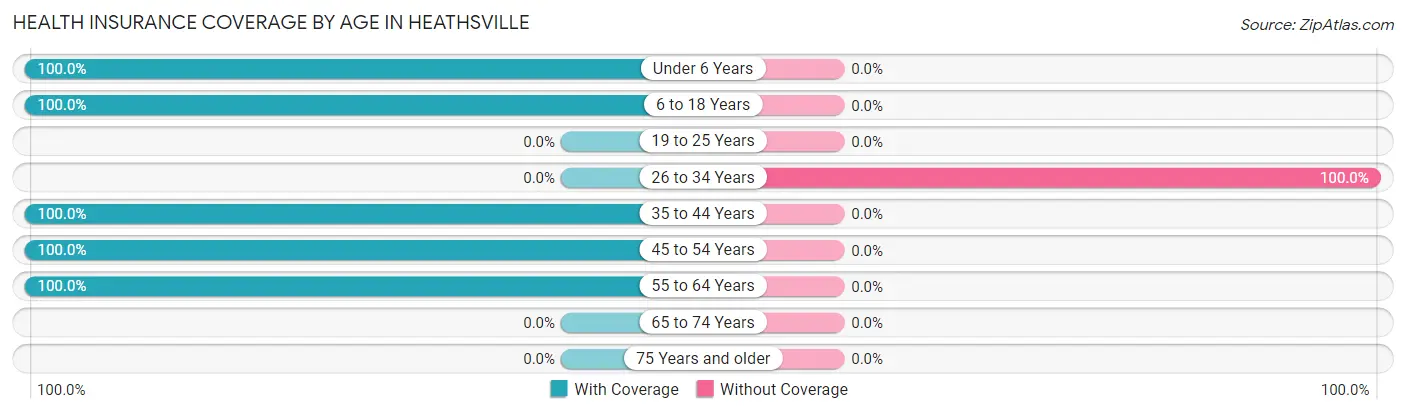
| Age Bracket | With Coverage | Without Coverage |
| Under 6 Years | 11 (100.0%) | 0 (0.0%) |
| 6 to 18 Years | 32 (100.0%) | 0 (0.0%) |
| 19 to 25 Years | 0 (0.0%) | 0 (0.0%) |
| 26 to 34 Years | 0 (0.0%) | 20 (100.0%) |
| 35 to 44 Years | 5 (100.0%) | 0 (0.0%) |
| 45 to 54 Years | 13 (100.0%) | 0 (0.0%) |
| 55 to 64 Years | 45 (100.0%) | 0 (0.0%) |
| 65 to 74 Years | 0 (0.0%) | 0 (0.0%) |
| 75 Years and older | 0 (0.0%) | 0 (0.0%) |
| Total | 106 (84.1%) | 20 (15.9%) |
Health Insurance Coverage by Citizenship Status in Heathsville
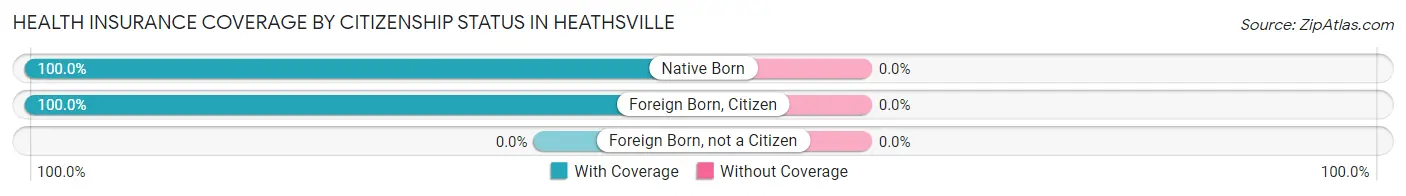
| Citizenship Status | With Coverage | Without Coverage |
| Native Born | 11 (100.0%) | 0 (0.0%) |
| Foreign Born, Citizen | 32 (100.0%) | 0 (0.0%) |
| Foreign Born, not a Citizen | 0 (0.0%) | 0 (0.0%) |
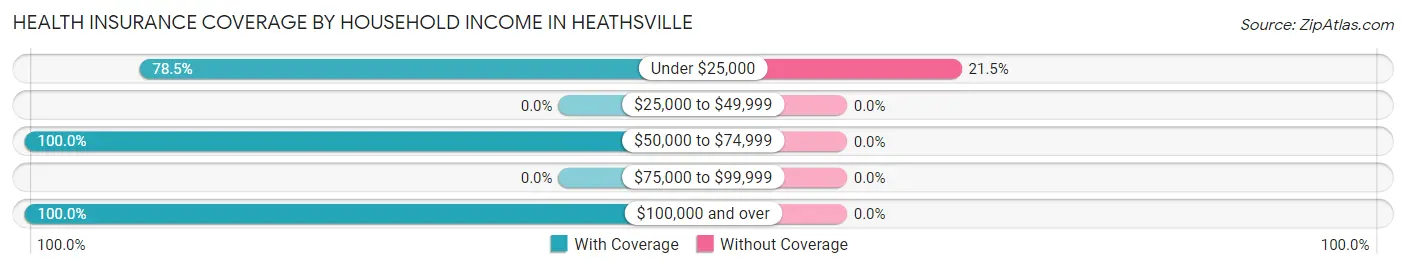
Health Insurance Coverage by Household Income in Heathsville
| Household Income | With Coverage | Without Coverage |
| Under $25,000 | 73 (78.5%) | 20 (21.5%) |
| $25,000 to $49,999 | 0 (0.0%) | 0 (0.0%) |
| $50,000 to $74,999 | 20 (100.0%) | 0 (0.0%) |
| $75,000 to $99,999 | 0 (0.0%) | 0 (0.0%) |
| $100,000 and over | 13 (100.0%) | 0 (0.0%) |
Public vs Private Health Insurance Coverage by Age in Heathsville
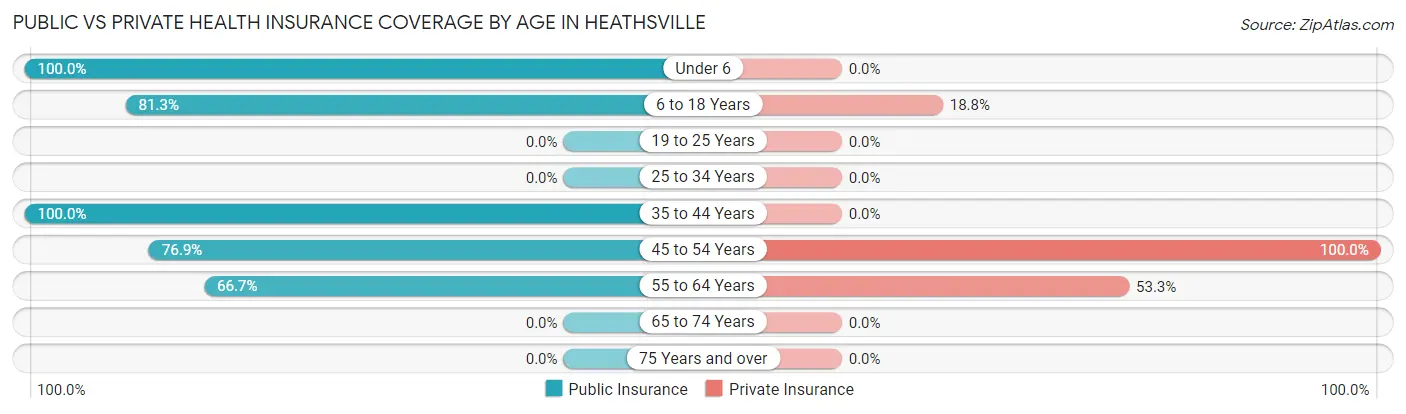
| Age Bracket | Public Insurance | Private Insurance |
| Under 6 | 11 (100.0%) | 0 (0.0%) |
| 6 to 18 Years | 26 (81.2%) | 6 (18.8%) |
| 19 to 25 Years | 0 (0.0%) | 0 (0.0%) |
| 25 to 34 Years | 0 (0.0%) | 0 (0.0%) |
| 35 to 44 Years | 5 (100.0%) | 0 (0.0%) |
| 45 to 54 Years | 10 (76.9%) | 13 (100.0%) |
| 55 to 64 Years | 30 (66.7%) | 24 (53.3%) |
| 65 to 74 Years | 0 (0.0%) | 0 (0.0%) |
| 75 Years and over | 0 (0.0%) | 0 (0.0%) |
| Total | 82 (65.1%) | 43 (34.1%) |
Disability Status by Sex by Age in Heathsville
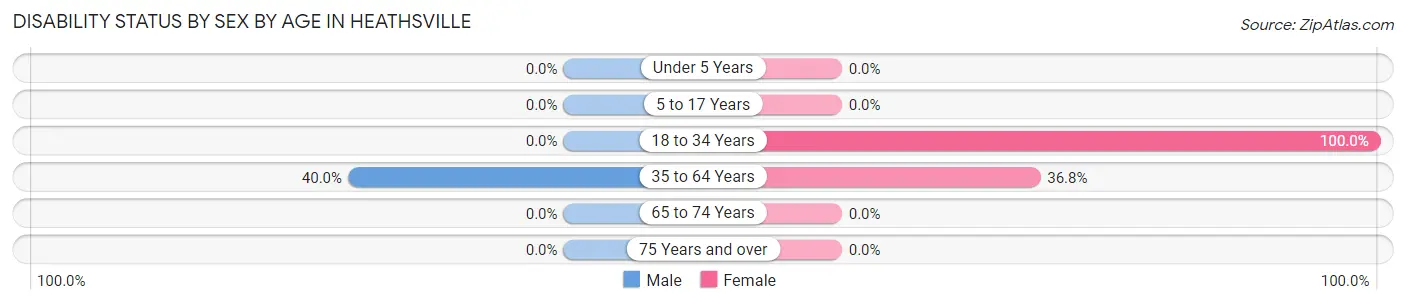
| Age Bracket | Male | Female |
| Under 5 Years | 0 (0.0%) | 0 (0.0%) |
| 5 to 17 Years | 0 (0.0%) | 0 (0.0%) |
| 18 to 34 Years | 0 (0.0%) | 20 (100.0%) |
| 35 to 64 Years | 10 (40.0%) | 14 (36.8%) |
| 65 to 74 Years | 0 (0.0%) | 0 (0.0%) |
| 75 Years and over | 0 (0.0%) | 0 (0.0%) |
Disability Class by Sex by Age in Heathsville
Disability Class: Hearing Difficulty
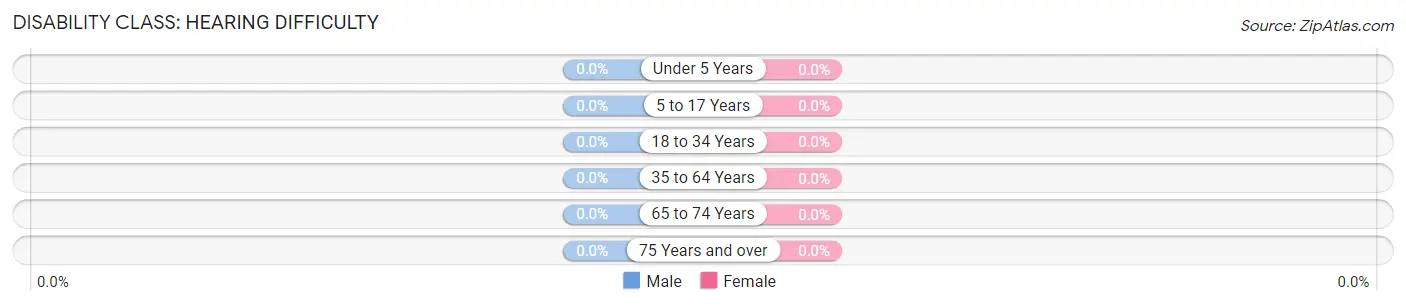
| Age Bracket | Male | Female |
| Under 5 Years | 0 (0.0%) | 0 (0.0%) |
| 5 to 17 Years | 0 (0.0%) | 0 (0.0%) |
| 18 to 34 Years | 0 (0.0%) | 0 (0.0%) |
| 35 to 64 Years | 0 (0.0%) | 0 (0.0%) |
| 65 to 74 Years | 0 (0.0%) | 0 (0.0%) |
| 75 Years and over | 0 (0.0%) | 0 (0.0%) |
Disability Class: Vision Difficulty
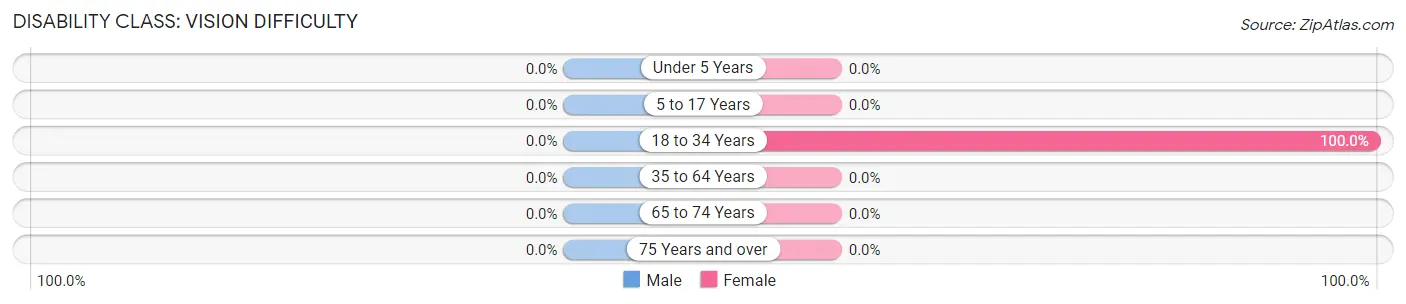
| Age Bracket | Male | Female |
| Under 5 Years | 0 (0.0%) | 0 (0.0%) |
| 5 to 17 Years | 0 (0.0%) | 0 (0.0%) |
| 18 to 34 Years | 0 (0.0%) | 20 (100.0%) |
| 35 to 64 Years | 0 (0.0%) | 0 (0.0%) |
| 65 to 74 Years | 0 (0.0%) | 0 (0.0%) |
| 75 Years and over | 0 (0.0%) | 0 (0.0%) |
Disability Class: Cognitive Difficulty
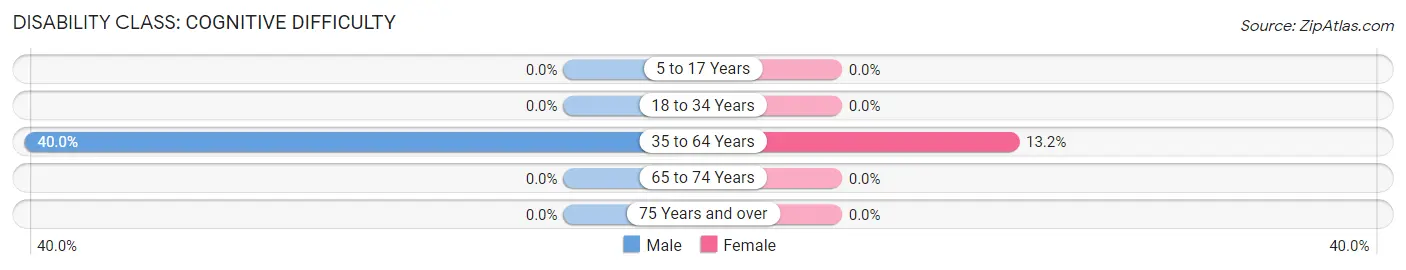
| Age Bracket | Male | Female |
| 5 to 17 Years | 0 (0.0%) | 0 (0.0%) |
| 18 to 34 Years | 0 (0.0%) | 0 (0.0%) |
| 35 to 64 Years | 10 (40.0%) | 5 (13.2%) |
| 65 to 74 Years | 0 (0.0%) | 0 (0.0%) |
| 75 Years and over | 0 (0.0%) | 0 (0.0%) |
Disability Class: Ambulatory Difficulty
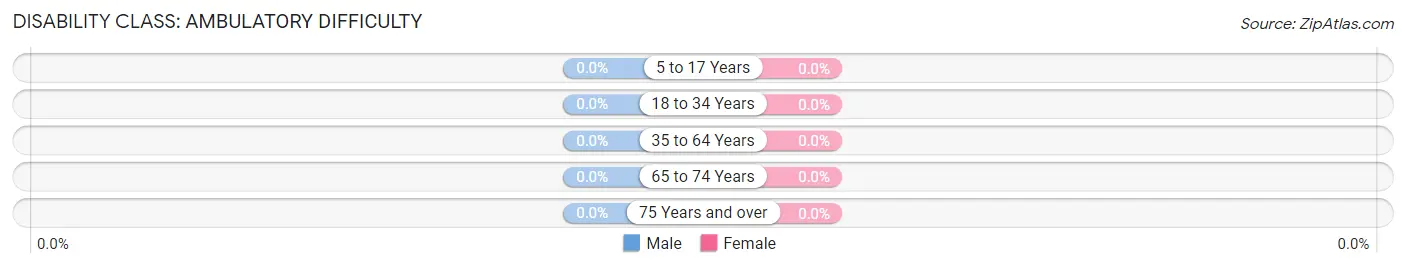
| Age Bracket | Male | Female |
| 5 to 17 Years | 0 (0.0%) | 0 (0.0%) |
| 18 to 34 Years | 0 (0.0%) | 0 (0.0%) |
| 35 to 64 Years | 0 (0.0%) | 0 (0.0%) |
| 65 to 74 Years | 0 (0.0%) | 0 (0.0%) |
| 75 Years and over | 0 (0.0%) | 0 (0.0%) |
Disability Class: Self-Care Difficulty
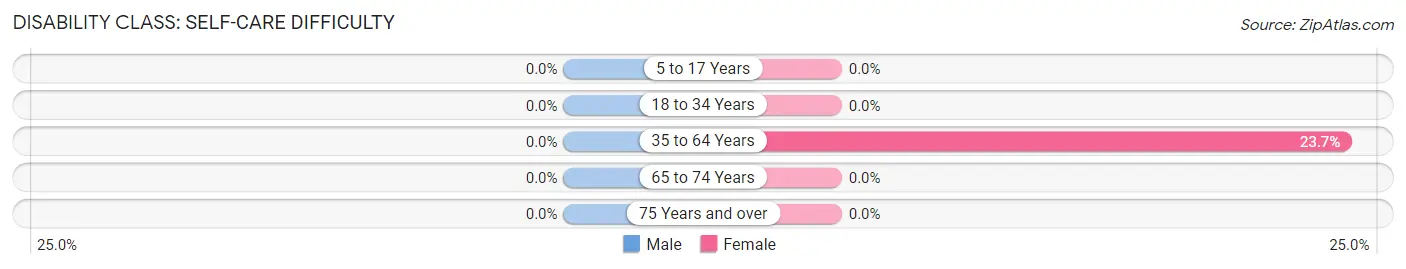
| Age Bracket | Male | Female |
| 5 to 17 Years | 0 (0.0%) | 0 (0.0%) |
| 18 to 34 Years | 0 (0.0%) | 0 (0.0%) |
| 35 to 64 Years | 0 (0.0%) | 9 (23.7%) |
| 65 to 74 Years | 0 (0.0%) | 0 (0.0%) |
| 75 Years and over | 0 (0.0%) | 0 (0.0%) |
Technology Access in Heathsville
Computing Device Access in Heathsville
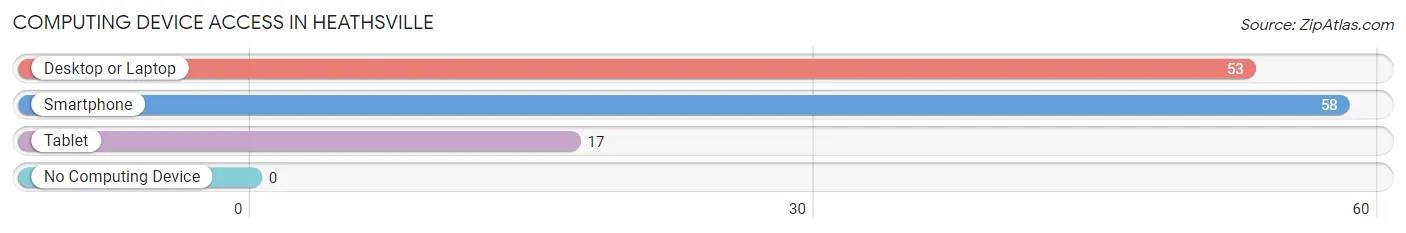
| Device Type | # Households | % Households |
| Desktop or Laptop | 53 | 91.4% |
| Smartphone | 58 | 100.0% |
| Tablet | 17 | 29.3% |
| No Computing Device | 0 | 0.0% |
| Total | 58 | 100.0% |
Internet Access in Heathsville
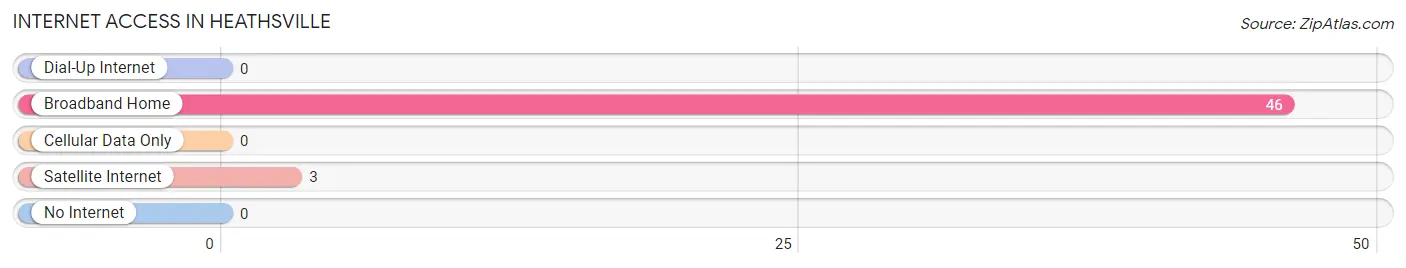
| Internet Type | # Households | % Households |
| Dial-Up Internet | 0 | 0.0% |
| Broadband Home | 46 | 79.3% |
| Cellular Data Only | 0 | 0.0% |
| Satellite Internet | 3 | 5.2% |
| No Internet | 0 | 0.0% |
| Total | 58 | 100.0% |
Heathsville Summary
Heathsville is a small unincorporated community located in Northumberland County, Virginia. It is situated on the banks of the Great Wicomico River, about 25 miles north of the Chesapeake Bay. The town is home to a population of approximately 1,000 people, and is the county seat of Northumberland County.
History
Heathsville was first settled in the early 1700s by English colonists. The town was named after the Heath family, who were among the first settlers. The town was officially established in 1742, and was incorporated in 1745.
Heathsville was an important port town during the colonial era, and was a major trading center for tobacco, grain, and other goods. During the American Revolution, the town was the site of several skirmishes between British and American forces.
In the 19th century, Heathsville became an important center for shipbuilding and fishing. The town was also home to several large plantations, and was a major producer of tobacco and other agricultural products.
Geography
Heathsville is located in Northumberland County, Virginia, on the banks of the Great Wicomico River. The town is situated about 25 miles north of the Chesapeake Bay. The town is surrounded by a number of small towns and villages, including Reedville, Burgess, and Wicomico Church.
The town is located in a rural area, and is surrounded by farmland and forests. The town is located in a humid subtropical climate zone, and experiences hot, humid summers and mild winters.
Economy
Heathsville’s economy is largely based on agriculture and tourism. The town is home to several large farms, which produce a variety of crops, including corn, soybeans, wheat, and tobacco. The town is also home to several small businesses, including restaurants, shops, and other services.
Tourism is an important part of the local economy, and the town is home to several popular attractions, including the Northumberland County Historical Society Museum, the Northumberland County Courthouse, and the Heathsville Historic District.
Demographics
As of the 2010 census, Heathsville had a population of 1,000 people. The town is predominantly white, with a small African American population. The median household income is $37,000, and the median home value is $150,000.
Heathsville is served by the Northumberland County Public Schools system. The town is home to one elementary school, one middle school, and one high school. The town is also home to a number of churches, including the Heathsville United Methodist Church and the Heathsville Baptist Church.
Common Questions
What is Per Capita Income in Heathsville?
Per Capita income in Heathsville is $11,840.
What is Inequality or Gini Index in Heathsville?
Inequality or Gini Index in Heathsville is 0.65.
What is the Total Population of Heathsville?
Total Population of Heathsville is 126.
What is the Total Male Population of Heathsville?
Total Male Population of Heathsville is 60.
What is the Total Female Population of Heathsville?
Total Female Population of Heathsville is 66.
What is the Ratio of Males per 100 Females in Heathsville?
There are 90.91 Males per 100 Females in Heathsville.
What is the Ratio of Females per 100 Males in Heathsville?
There are 110.00 Females per 100 Males in Heathsville.
What is the Median Population Age in Heathsville?
Median Population Age in Heathsville is 34.0 Years.
What is the Average Family Size in Heathsville
Average Family Size in Heathsville is 2.8 People.
What is the Average Household Size in Heathsville
Average Household Size in Heathsville is 2.2 People.
How Large is the Labor Force in Heathsville?
There are 38 People in the Labor Forcein in Heathsville.
What is the Percentage of People in the Labor Force in Heathsville?
42.7% of People are in the Labor Force in Heathsville.