Lake Land Or, VA Map & Demographics
Lake Land Or Map
Lake Land Or Overview
$41,915
PER CAPITA INCOME
$118,750
AVG FAMILY INCOME
$112,833
AVG HOUSEHOLD INCOME
56.8%
WAGE / INCOME GAP [ % ]
43.2¢/ $1
WAGE / INCOME GAP [ $ ]
0.30
INEQUALITY / GINI INDEX
3,179
TOTAL POPULATION
1,378
MALE POPULATION
1,801
FEMALE POPULATION
76.51
MALES / 100 FEMALES
130.70
FEMALES / 100 MALES
38.5
MEDIAN AGE
3.1
AVG FAMILY SIZE
2.8
AVG HOUSEHOLD SIZE
1,688
LABOR FORCE [ PEOPLE ]
68.9%
PERCENT IN LABOR FORCE
3.7%
UNEMPLOYMENT RATE
Income in Lake Land Or
Income Overview in Lake Land Or
Per Capita Income in Lake Land Or is $41,915, while median incomes of families and households are $118,750 and $112,833 respectively.
| Characteristic | Number | Measure |
| Per Capita Income | 3,179 | $41,915 |
| Median Family Income | 881 | $118,750 |
| Mean Family Income | 881 | $128,472 |
| Median Household Income | 1,148 | $112,833 |
| Mean Household Income | 1,148 | $114,408 |
| Income Deficit | 881 | $0 |
| Wage / Income Gap (%) | 3,179 | 56.76% |
| Wage / Income Gap ($) | 3,179 | 43.24¢ per $1 |
| Gini / Inequality Index | 3,179 | 0.30 |
Earnings by Sex in Lake Land Or
Average Earnings in Lake Land Or are $51,568, $75,583 for men and $32,679 for women, a difference of 56.8%.
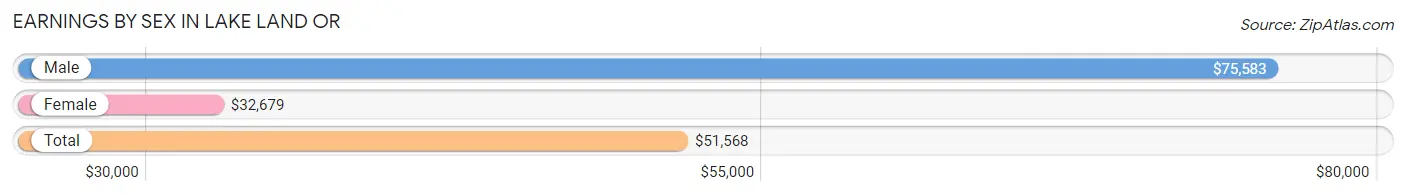
| Sex | Number | Average Earnings |
| Male | 862 (49.4%) | $75,583 |
| Female | 883 (50.6%) | $32,679 |
| Total | 1,745 (100.0%) | $51,568 |
Earnings by Sex by Income Bracket in Lake Land Or
The most common earnings brackets in Lake Land Or are $100,000+ for men (265 | 30.7%) and $55,000 to $64,999 for women (127 | 14.4%).
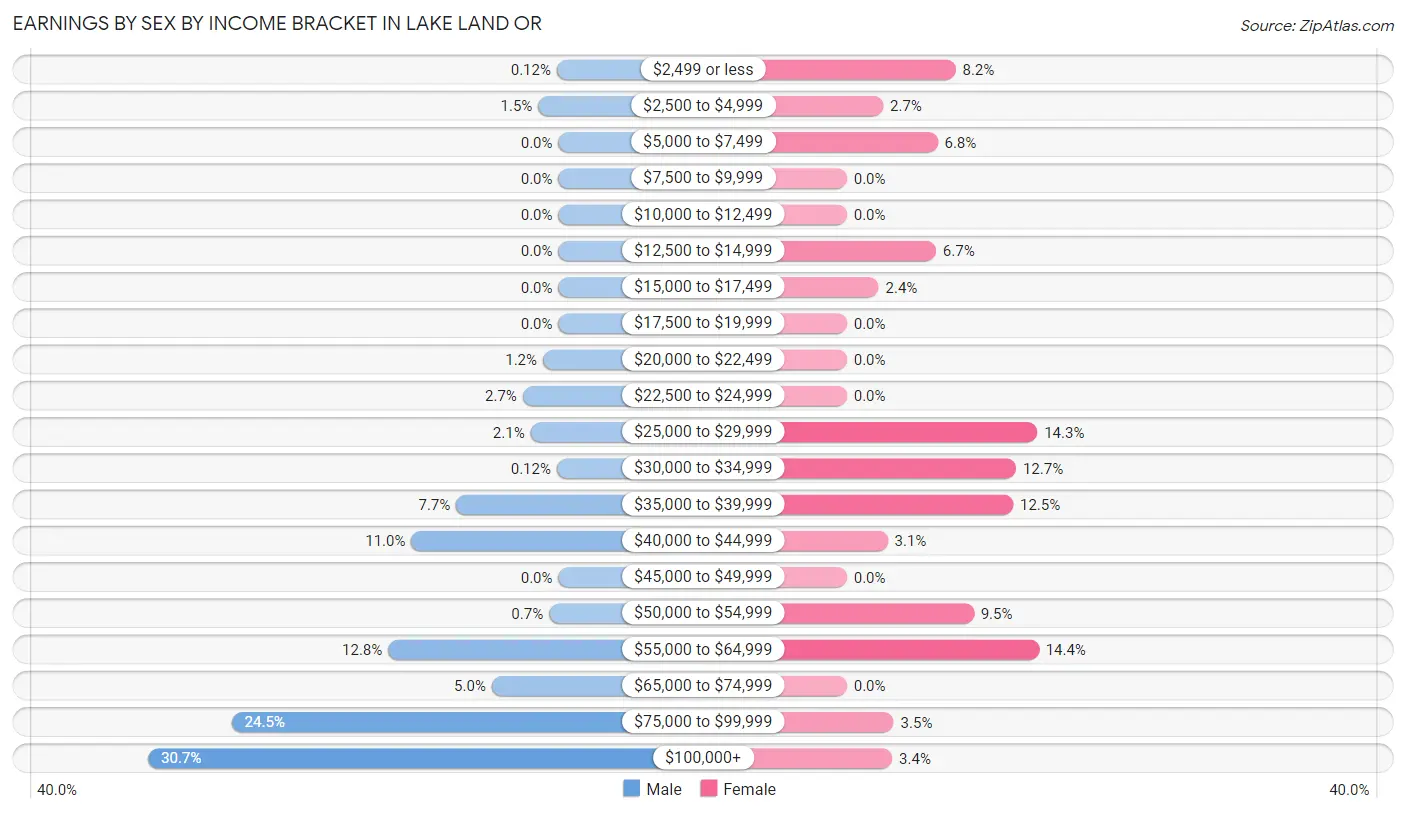
| Income | Male | Female |
| $2,499 or less | 1 (0.1%) | 72 (8.2%) |
| $2,500 to $4,999 | 13 (1.5%) | 24 (2.7%) |
| $5,000 to $7,499 | 0 (0.0%) | 60 (6.8%) |
| $7,500 to $9,999 | 0 (0.0%) | 0 (0.0%) |
| $10,000 to $12,499 | 0 (0.0%) | 0 (0.0%) |
| $12,500 to $14,999 | 0 (0.0%) | 59 (6.7%) |
| $15,000 to $17,499 | 0 (0.0%) | 21 (2.4%) |
| $17,500 to $19,999 | 0 (0.0%) | 0 (0.0%) |
| $20,000 to $22,499 | 10 (1.2%) | 0 (0.0%) |
| $22,500 to $24,999 | 23 (2.7%) | 0 (0.0%) |
| $25,000 to $29,999 | 18 (2.1%) | 126 (14.3%) |
| $30,000 to $34,999 | 1 (0.1%) | 112 (12.7%) |
| $35,000 to $39,999 | 66 (7.7%) | 110 (12.5%) |
| $40,000 to $44,999 | 95 (11.0%) | 27 (3.1%) |
| $45,000 to $49,999 | 0 (0.0%) | 0 (0.0%) |
| $50,000 to $54,999 | 6 (0.7%) | 84 (9.5%) |
| $55,000 to $64,999 | 110 (12.8%) | 127 (14.4%) |
| $65,000 to $74,999 | 43 (5.0%) | 0 (0.0%) |
| $75,000 to $99,999 | 211 (24.5%) | 31 (3.5%) |
| $100,000+ | 265 (30.7%) | 30 (3.4%) |
| Total | 862 (100.0%) | 883 (100.0%) |
Earnings by Sex by Educational Attainment in Lake Land Or
Average earnings in Lake Land Or are $75,771 for men and $38,548 for women, a difference of 49.1%. Men with an educational attainment of graduate degree enjoy the highest average annual earnings of $76,186, while those with high school diploma education earn the least with $40,948. Women with an educational attainment of college or associate's degree earn the most with the average annual earnings of $38,313, while those with college or associate's degree education have the smallest earnings of $38,313.
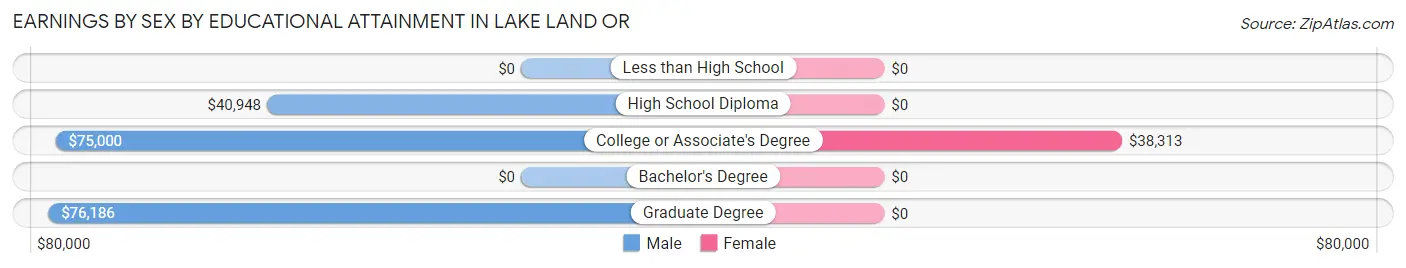
| Educational Attainment | Male Income | Female Income |
| Less than High School | - | - |
| High School Diploma | $40,948 | $0 |
| College or Associate's Degree | $75,000 | $38,313 |
| Bachelor's Degree | - | - |
| Graduate Degree | $76,186 | $0 |
| Total | $75,771 | $38,548 |
Family Income in Lake Land Or
Family Income Brackets in Lake Land Or
According to the Lake Land Or family income data, there are 368 families falling into the $100,000 to $149,999 income range, which is the most common income bracket and makes up 41.8% of all families.
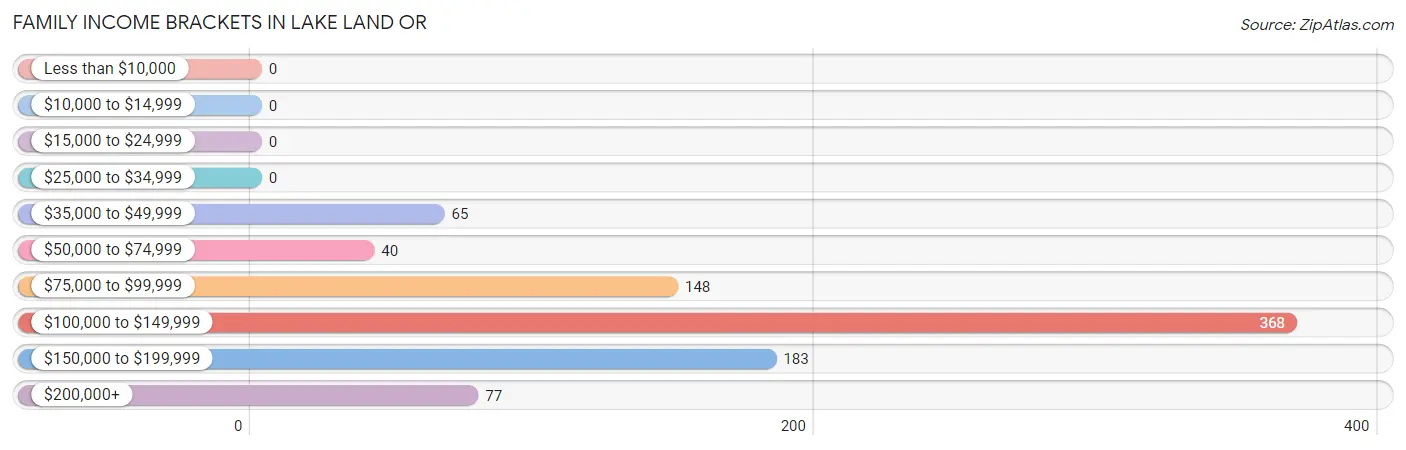
| Income Bracket | # Families | % Families |
| Less than $10,000 | 0 | 0.0% |
| $10,000 to $14,999 | 0 | 0.0% |
| $15,000 to $24,999 | 0 | 0.0% |
| $25,000 to $34,999 | 0 | 0.0% |
| $35,000 to $49,999 | 65 | 7.4% |
| $50,000 to $74,999 | 40 | 4.5% |
| $75,000 to $99,999 | 148 | 16.8% |
| $100,000 to $149,999 | 368 | 41.8% |
| $150,000 to $199,999 | 183 | 20.8% |
| $200,000+ | 77 | 8.7% |
Family Income by Famaliy Size in Lake Land Or
3-person families (423 | 48.0%) account for the highest median family income in Lake Land Or with $129,688 per family, while 2-person families (316 | 35.9%) have the highest median income of $59,276 per family member.
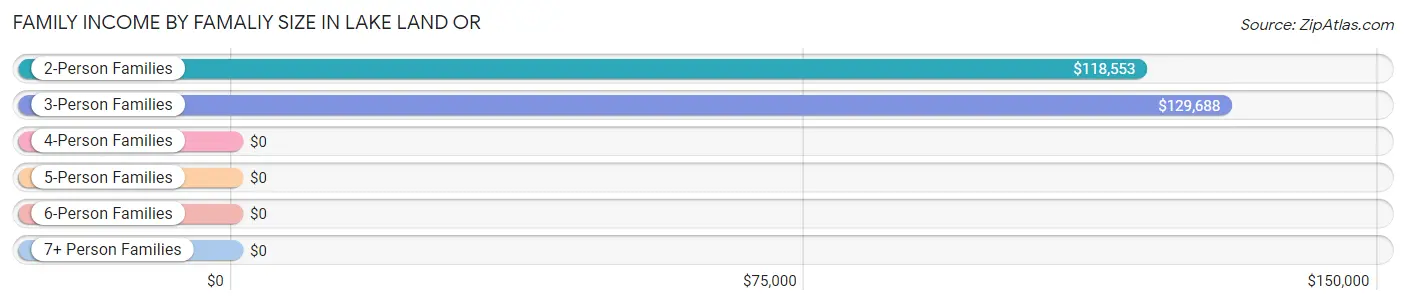
| Income Bracket | # Families | Median Income |
| 2-Person Families | 316 (35.9%) | $118,553 |
| 3-Person Families | 423 (48.0%) | $129,688 |
| 4-Person Families | 63 (7.1%) | $0 |
| 5-Person Families | 41 (4.6%) | $0 |
| 6-Person Families | 24 (2.7%) | $0 |
| 7+ Person Families | 14 (1.6%) | $0 |
| Total | 881 (100.0%) | $118,750 |
Family Income by Number of Earners in Lake Land Or
The median family income in Lake Land Or is $118,750, with families comprising 3+ earners (135) having the highest median family income of $166,326, while families with no earners (135) have the lowest median family income of $101,519, accounting for 15.3% and 15.3% of families, respectively.
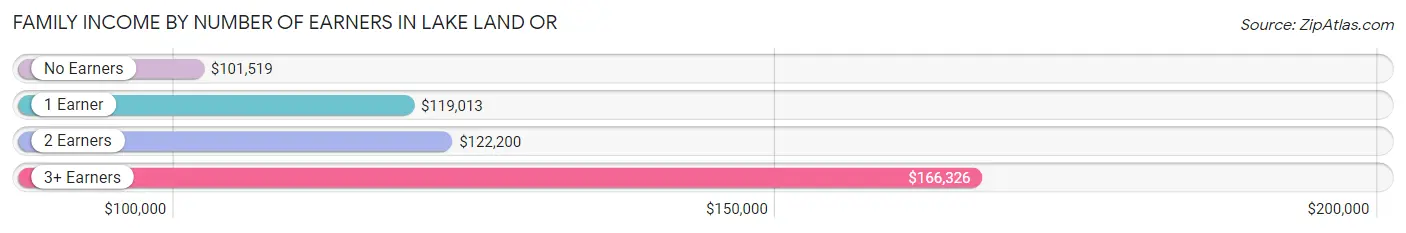
| Number of Earners | # Families | Median Income |
| No Earners | 135 (15.3%) | $101,519 |
| 1 Earner | 245 (27.8%) | $119,013 |
| 2 Earners | 366 (41.5%) | $122,200 |
| 3+ Earners | 135 (15.3%) | $166,326 |
| Total | 881 (100.0%) | $118,750 |
Household Income in Lake Land Or
Household Income Brackets in Lake Land Or
With 354 households falling in the category, the $100,000 to $149,999 income range is the most frequent in Lake Land Or, accounting for 30.8% of all households.
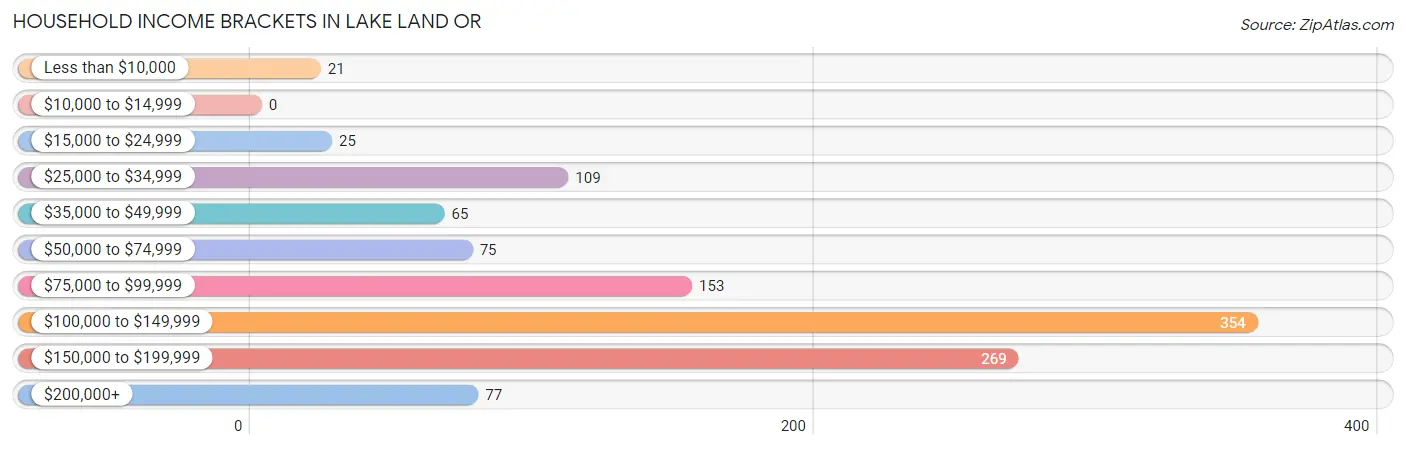
| Income Bracket | # Households | % Households |
| Less than $10,000 | 21 | 1.8% |
| $10,000 to $14,999 | 0 | 0.0% |
| $15,000 to $24,999 | 25 | 2.2% |
| $25,000 to $34,999 | 109 | 9.5% |
| $35,000 to $49,999 | 65 | 5.7% |
| $50,000 to $74,999 | 75 | 6.5% |
| $75,000 to $99,999 | 153 | 13.3% |
| $100,000 to $149,999 | 354 | 30.8% |
| $150,000 to $199,999 | 269 | 23.4% |
| $200,000+ | 77 | 6.7% |
Household Income by Householder Age in Lake Land Or
The median household income in Lake Land Or is $112,833, with the highest median household income of $144,594 found in the 45 to 64 years age bracket for the primary householder. A total of 615 households (53.6%) fall into this category. Meanwhile, the 15 to 24 years age bracket for the primary householder has the lowest median household income of $0, with 48 households (4.2%) in this group.
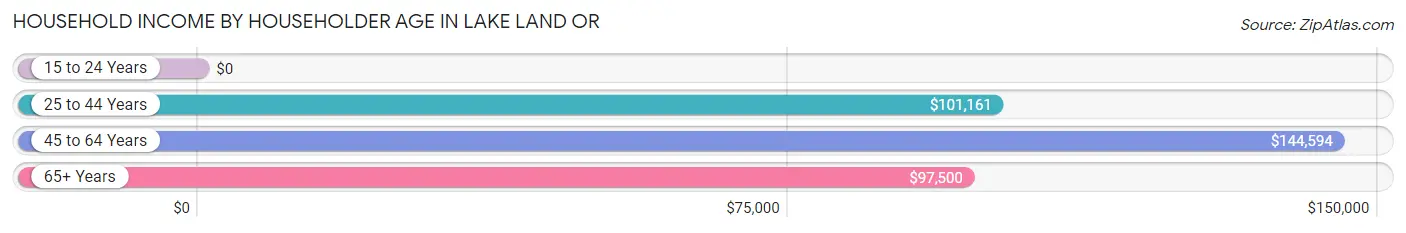
| Income Bracket | # Households | Median Income |
| 15 to 24 Years | 48 (4.2%) | $0 |
| 25 to 44 Years | 205 (17.9%) | $101,161 |
| 45 to 64 Years | 615 (53.6%) | $144,594 |
| 65+ Years | 280 (24.4%) | $97,500 |
| Total | 1,148 (100.0%) | $112,833 |
Poverty in Lake Land Or
Income Below Poverty by Sex and Age in Lake Land Or
With 0.2% poverty level for males and 3.2% for females among the residents of Lake Land Or, 55 to 64 year old males and 16 and 17 year old females are the most vulnerable to poverty, with 2 males (0.8%) and 35 females (72.9%) in their respective age groups living below the poverty level.
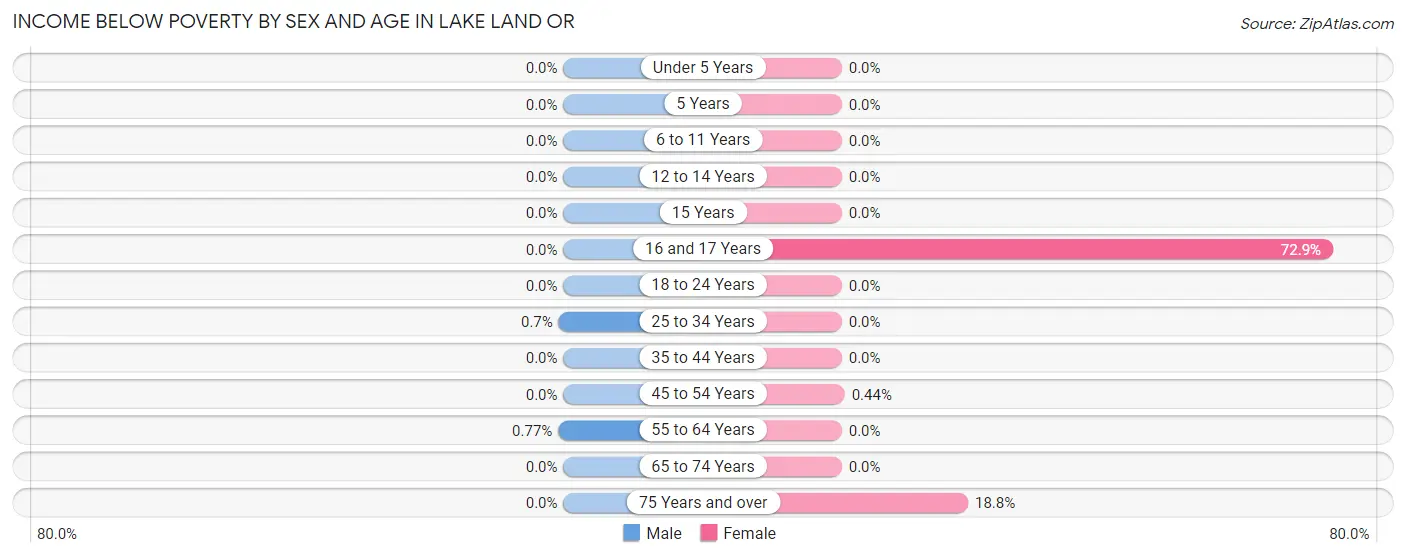
| Age Bracket | Male | Female |
| Under 5 Years | 0 (0.0%) | 0 (0.0%) |
| 5 Years | 0 (0.0%) | 0 (0.0%) |
| 6 to 11 Years | 0 (0.0%) | 0 (0.0%) |
| 12 to 14 Years | 0 (0.0%) | 0 (0.0%) |
| 15 Years | 0 (0.0%) | 0 (0.0%) |
| 16 and 17 Years | 0 (0.0%) | 35 (72.9%) |
| 18 to 24 Years | 0 (0.0%) | 0 (0.0%) |
| 25 to 34 Years | 1 (0.7%) | 0 (0.0%) |
| 35 to 44 Years | 0 (0.0%) | 0 (0.0%) |
| 45 to 54 Years | 0 (0.0%) | 1 (0.4%) |
| 55 to 64 Years | 2 (0.8%) | 0 (0.0%) |
| 65 to 74 Years | 0 (0.0%) | 0 (0.0%) |
| 75 Years and over | 0 (0.0%) | 21 (18.8%) |
| Total | 3 (0.2%) | 57 (3.2%) |
Income Above Poverty by Sex and Age in Lake Land Or
According to the poverty statistics in Lake Land Or, males aged under 5 years and females aged under 5 years are the age groups that are most secure financially, with 100.0% of males and 100.0% of females in these age groups living above the poverty line.
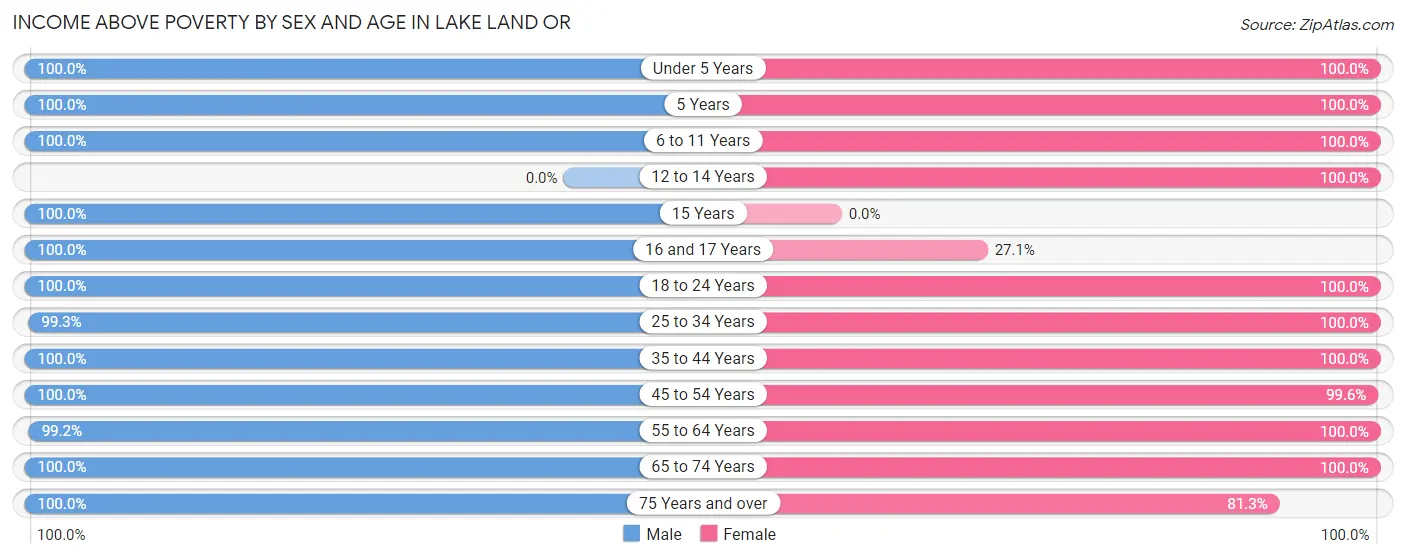
| Age Bracket | Male | Female |
| Under 5 Years | 142 (100.0%) | 207 (100.0%) |
| 5 Years | 26 (100.0%) | 2 (100.0%) |
| 6 to 11 Years | 26 (100.0%) | 111 (100.0%) |
| 12 to 14 Years | 0 (0.0%) | 159 (100.0%) |
| 15 Years | 56 (100.0%) | 0 (0.0%) |
| 16 and 17 Years | 13 (100.0%) | 13 (27.1%) |
| 18 to 24 Years | 28 (100.0%) | 211 (100.0%) |
| 25 to 34 Years | 141 (99.3%) | 112 (100.0%) |
| 35 to 44 Years | 232 (100.0%) | 158 (100.0%) |
| 45 to 54 Years | 166 (100.0%) | 226 (99.6%) |
| 55 to 64 Years | 259 (99.2%) | 344 (100.0%) |
| 65 to 74 Years | 244 (100.0%) | 110 (100.0%) |
| 75 Years and over | 42 (100.0%) | 91 (81.2%) |
| Total | 1,375 (99.8%) | 1,744 (96.8%) |
Income Below Poverty Among Married-Couple Families in Lake Land Or
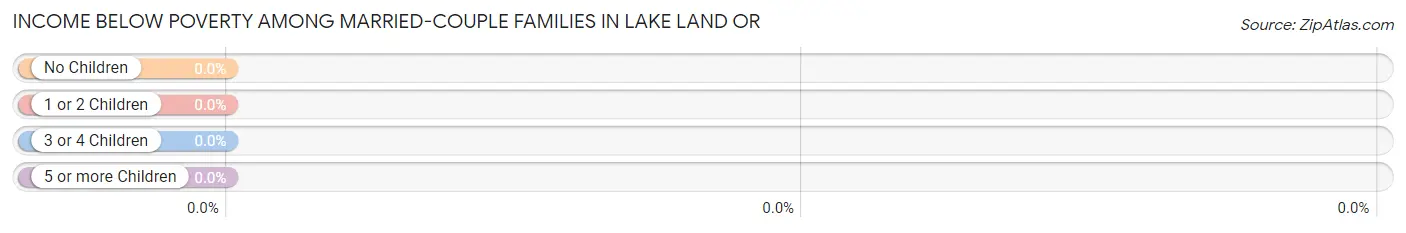
| Children | Above Poverty | Below Poverty |
| No Children | 469 (100.0%) | 0 (0.0%) |
| 1 or 2 Children | 238 (100.0%) | 0 (0.0%) |
| 3 or 4 Children | 55 (100.0%) | 0 (0.0%) |
| 5 or more Children | 0 (0.0%) | 0 (0.0%) |
| Total | 762 (100.0%) | 0 (0.0%) |
Income Below Poverty Among Single-Parent Households in Lake Land Or
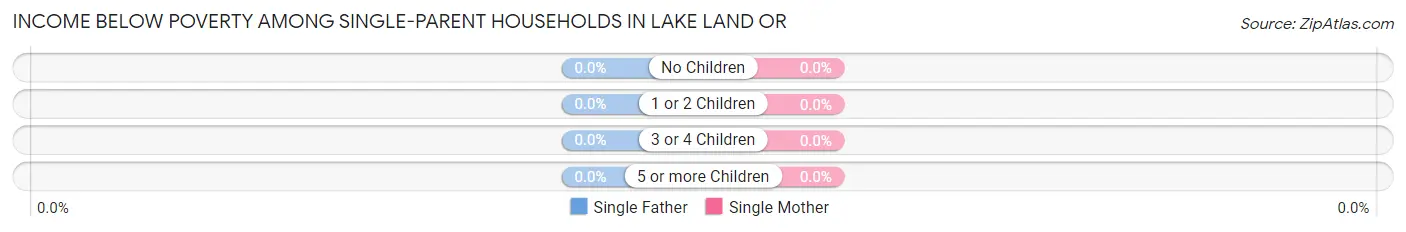
| Children | Single Father | Single Mother |
| No Children | 0 (0.0%) | 0 (0.0%) |
| 1 or 2 Children | 0 (0.0%) | 0 (0.0%) |
| 3 or 4 Children | 0 (0.0%) | 0 (0.0%) |
| 5 or more Children | 0 (0.0%) | 0 (0.0%) |
| Total | 0 (0.0%) | 0 (0.0%) |
Income Below Poverty Among Married-Couple vs Single-Parent Households in Lake Land Or
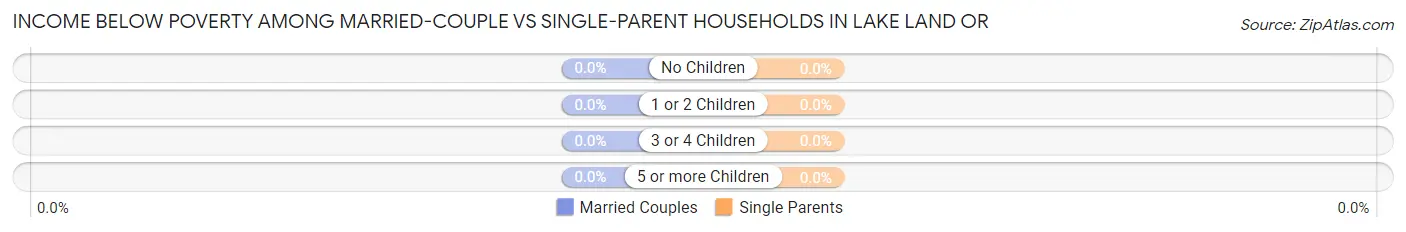
| Children | Married-Couple Families | Single-Parent Households |
| No Children | 0 (0.0%) | 0 (0.0%) |
| 1 or 2 Children | 0 (0.0%) | 0 (0.0%) |
| 3 or 4 Children | 0 (0.0%) | 0 (0.0%) |
| 5 or more Children | 0 (0.0%) | 0 (0.0%) |
| Total | 0 (0.0%) | 0 (0.0%) |
Race in Lake Land Or
The most populous races in Lake Land Or are White / Caucasian (2,677 | 84.2%), Two or more Races (229 | 7.2%), and Black / African American (214 | 6.7%).
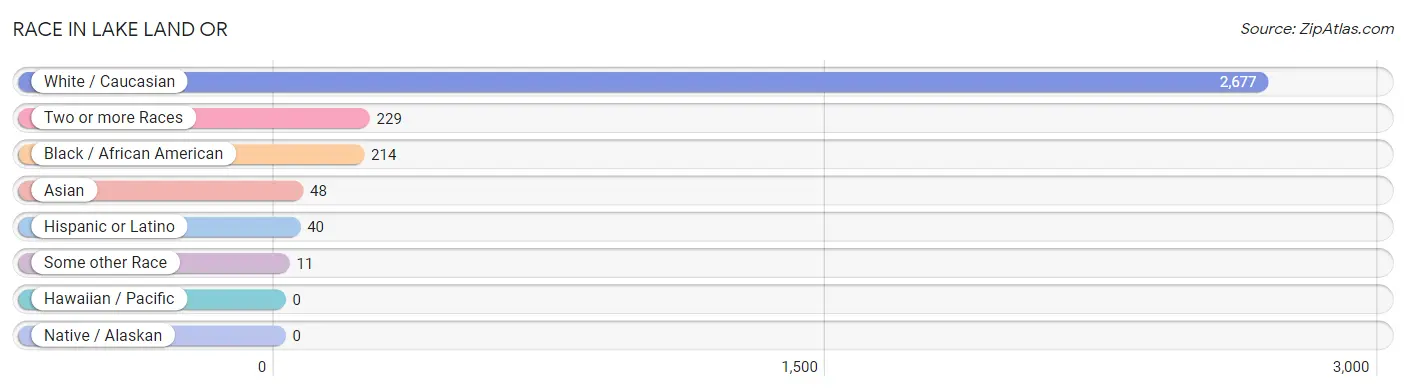
| Race | # Population | % Population |
| Asian | 48 | 1.5% |
| Black / African American | 214 | 6.7% |
| Hawaiian / Pacific | 0 | 0.0% |
| Hispanic or Latino | 40 | 1.3% |
| Native / Alaskan | 0 | 0.0% |
| White / Caucasian | 2,677 | 84.2% |
| Two or more Races | 229 | 7.2% |
| Some other Race | 11 | 0.4% |
| Total | 3,179 | 100.0% |
Ancestry in Lake Land Or
The most populous ancestries reported in Lake Land Or are Irish (729 | 22.9%), German (631 | 19.9%), American (556 | 17.5%), Italian (434 | 13.7%), and English (402 | 12.7%), together accounting for 86.6% of all Lake Land Or residents.
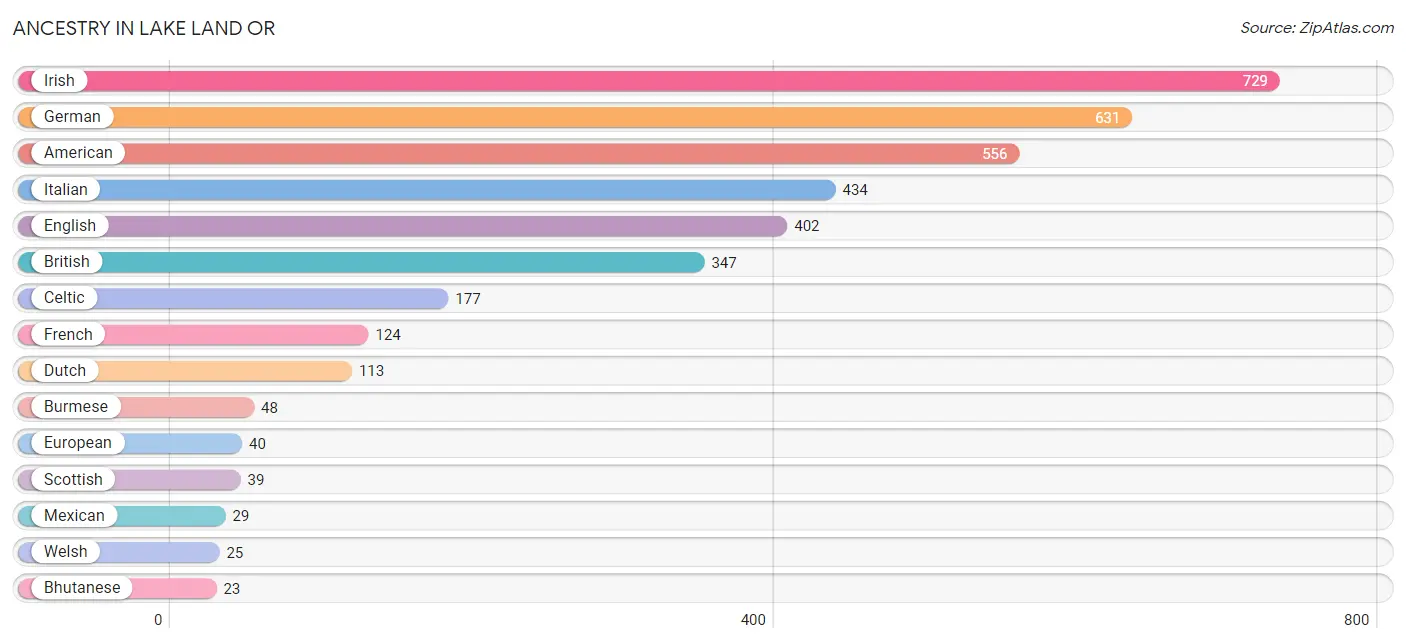
| Ancestry | # Population | % Population |
| African | 8 | 0.3% |
| American | 556 | 17.5% |
| Bhutanese | 23 | 0.7% |
| British | 347 | 10.9% |
| Burmese | 48 | 1.5% |
| Canadian | 2 | 0.1% |
| Celtic | 177 | 5.6% |
| Creek | 1 | 0.0% |
| Czechoslovakian | 20 | 0.6% |
| Dutch | 113 | 3.5% |
| English | 402 | 12.7% |
| European | 40 | 1.3% |
| French | 124 | 3.9% |
| German | 631 | 19.9% |
| Hungarian | 23 | 0.7% |
| Irish | 729 | 22.9% |
| Italian | 434 | 13.7% |
| Mexican | 29 | 0.9% |
| Polish | 6 | 0.2% |
| Puerto Rican | 11 | 0.4% |
| Scottish | 39 | 1.2% |
| Subsaharan African | 8 | 0.3% |
| Swedish | 2 | 0.1% |
| Welsh | 25 | 0.8% | View All 24 Rows |
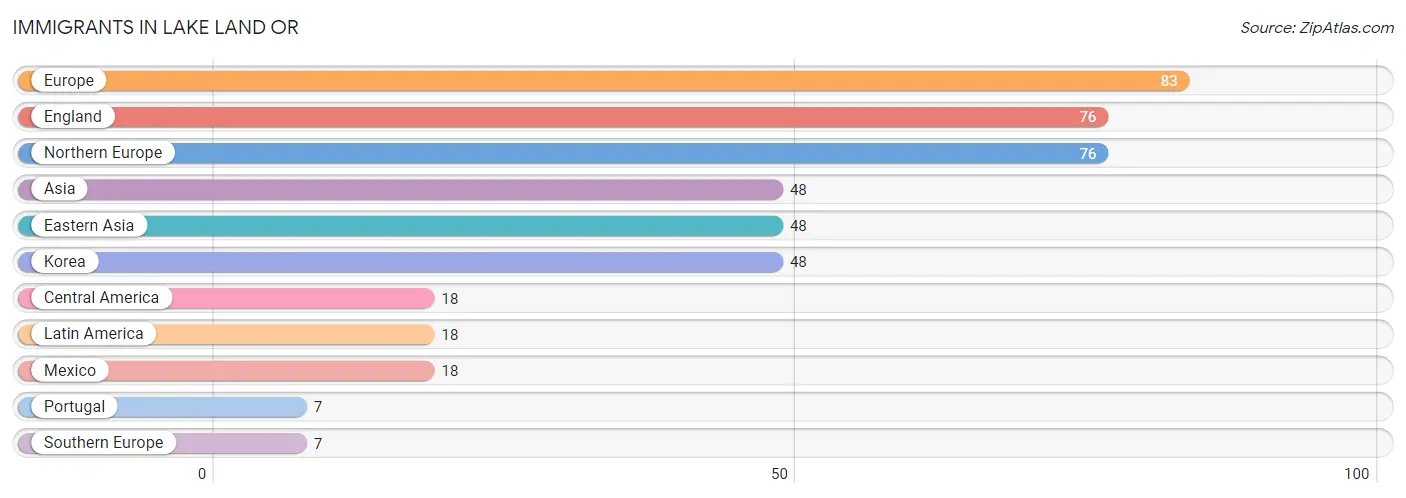
Immigrants in Lake Land Or
The most numerous immigrant groups reported in Lake Land Or came from Europe (83 | 2.6%), England (76 | 2.4%), Northern Europe (76 | 2.4%), Asia (48 | 1.5%), and Eastern Asia (48 | 1.5%), together accounting for 10.4% of all Lake Land Or residents.
| Immigration Origin | # Population | % Population |
| Asia | 48 | 1.5% |
| Central America | 18 | 0.6% |
| Eastern Asia | 48 | 1.5% |
| England | 76 | 2.4% |
| Europe | 83 | 2.6% |
| Korea | 48 | 1.5% |
| Latin America | 18 | 0.6% |
| Mexico | 18 | 0.6% |
| Northern Europe | 76 | 2.4% |
| Portugal | 7 | 0.2% |
| Southern Europe | 7 | 0.2% | View All 11 Rows |
Sex and Age in Lake Land Or
Sex and Age in Lake Land Or
The most populous age groups in Lake Land Or are 65 to 69 Years (228 | 16.6%) for men and 60 to 64 Years (254 | 14.1%) for women.
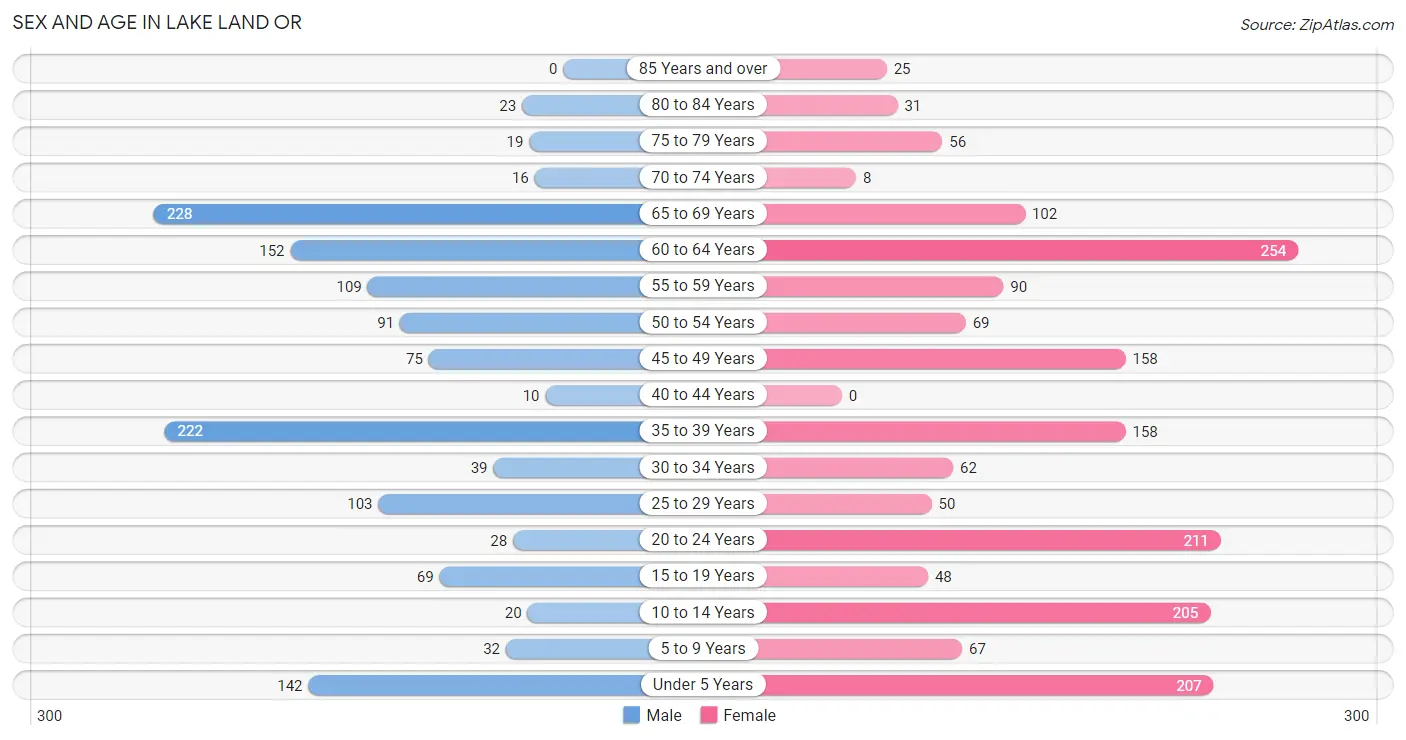
| Age Bracket | Male | Female |
| Under 5 Years | 142 (10.3%) | 207 (11.5%) |
| 5 to 9 Years | 32 (2.3%) | 67 (3.7%) |
| 10 to 14 Years | 20 (1.5%) | 205 (11.4%) |
| 15 to 19 Years | 69 (5.0%) | 48 (2.7%) |
| 20 to 24 Years | 28 (2.0%) | 211 (11.7%) |
| 25 to 29 Years | 103 (7.5%) | 50 (2.8%) |
| 30 to 34 Years | 39 (2.8%) | 62 (3.4%) |
| 35 to 39 Years | 222 (16.1%) | 158 (8.8%) |
| 40 to 44 Years | 10 (0.7%) | 0 (0.0%) |
| 45 to 49 Years | 75 (5.4%) | 158 (8.8%) |
| 50 to 54 Years | 91 (6.6%) | 69 (3.8%) |
| 55 to 59 Years | 109 (7.9%) | 90 (5.0%) |
| 60 to 64 Years | 152 (11.0%) | 254 (14.1%) |
| 65 to 69 Years | 228 (16.6%) | 102 (5.7%) |
| 70 to 74 Years | 16 (1.2%) | 8 (0.4%) |
| 75 to 79 Years | 19 (1.4%) | 56 (3.1%) |
| 80 to 84 Years | 23 (1.7%) | 31 (1.7%) |
| 85 Years and over | 0 (0.0%) | 25 (1.4%) |
| Total | 1,378 (100.0%) | 1,801 (100.0%) |
Families and Households in Lake Land Or
Median Family Size in Lake Land Or
The median family size in Lake Land Or is 3.11 persons per family, with single female/mother families (99 | 11.2%) accounting for the largest median family size of 3.79 persons per family. On the other hand, married-couple families (762 | 86.5%) represent the smallest median family size with 3.02 persons per family.
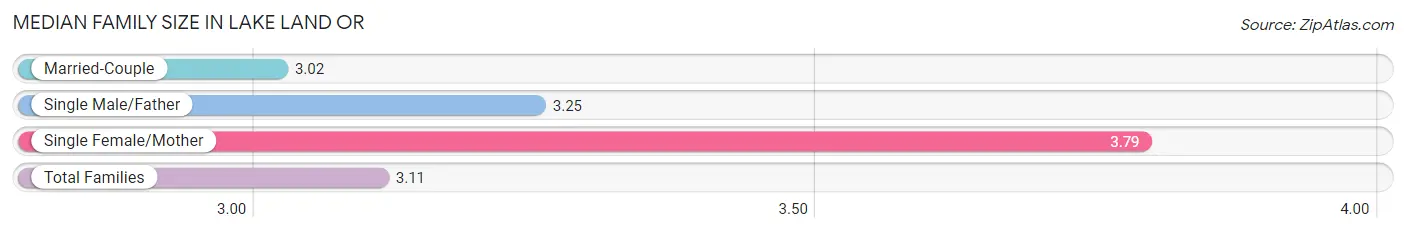
| Family Type | # Families | Family Size |
| Married-Couple | 762 (86.5%) | 3.02 |
| Single Male/Father | 20 (2.3%) | 3.25 |
| Single Female/Mother | 99 (11.2%) | 3.79 |
| Total Families | 881 (100.0%) | 3.11 |
Median Household Size in Lake Land Or
The median household size in Lake Land Or is 2.76 persons per household, with single female/mother households (99 | 8.6%) accounting for the largest median household size of 3.89 persons per household. non-family households (267 | 23.3%) represent the smallest median household size with 1.45 persons per household.
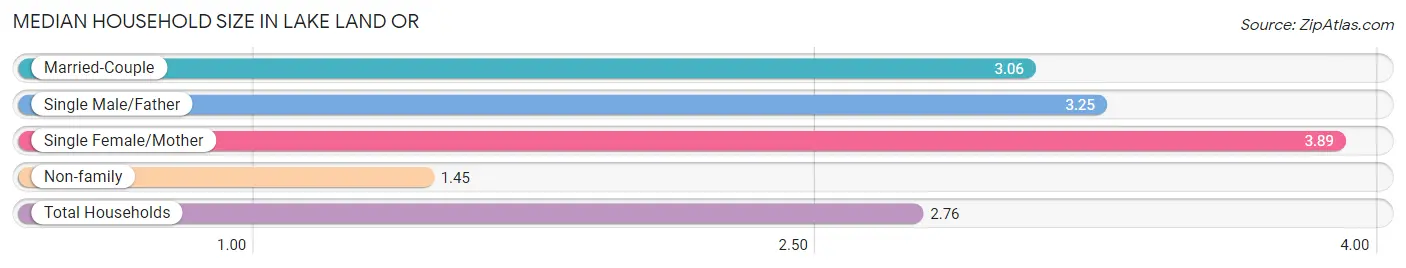
| Household Type | # Households | Household Size |
| Married-Couple | 762 (66.4%) | 3.06 |
| Single Male/Father | 20 (1.7%) | 3.25 |
| Single Female/Mother | 99 (8.6%) | 3.89 |
| Non-family | 267 (23.3%) | 1.45 |
| Total Households | 1,148 (100.0%) | 2.76 |
Household Size by Marriage Status in Lake Land Or
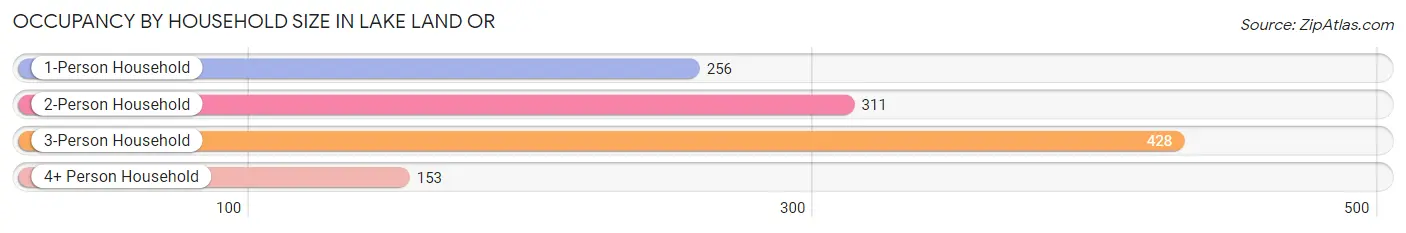
Out of a total of 1,148 households in Lake Land Or, 881 (76.7%) are family households, while 267 (23.3%) are nonfamily households. The most numerous type of family households are 3-person households, comprising 428, and the most common type of nonfamily households are 1-person households, comprising 256.
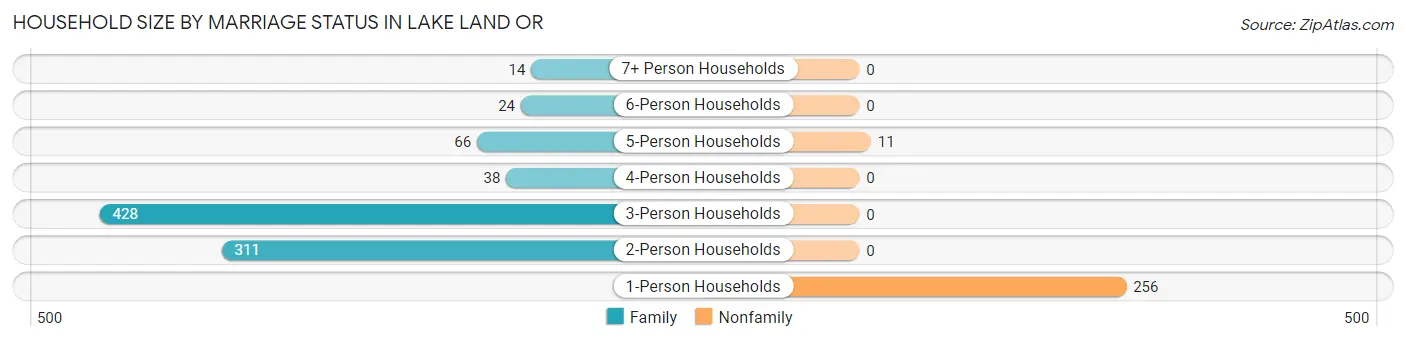
| Household Size | Family Households | Nonfamily Households |
| 1-Person Households | - | 256 (22.3%) |
| 2-Person Households | 311 (27.1%) | 0 (0.0%) |
| 3-Person Households | 428 (37.3%) | 0 (0.0%) |
| 4-Person Households | 38 (3.3%) | 0 (0.0%) |
| 5-Person Households | 66 (5.8%) | 11 (1.0%) |
| 6-Person Households | 24 (2.1%) | 0 (0.0%) |
| 7+ Person Households | 14 (1.2%) | 0 (0.0%) |
| Total | 881 (76.7%) | 267 (23.3%) |
Female Fertility in Lake Land Or
Fertility by Age in Lake Land Or
Average fertility rate in Lake Land Or is 87.0 births per 1,000 women. Women in the age bracket of 20 to 34 years have the highest fertility rate with 186.0 births per 1,000 women. Women in the age bracket of 20 to 34 years acount for 100.0% of all women with births.
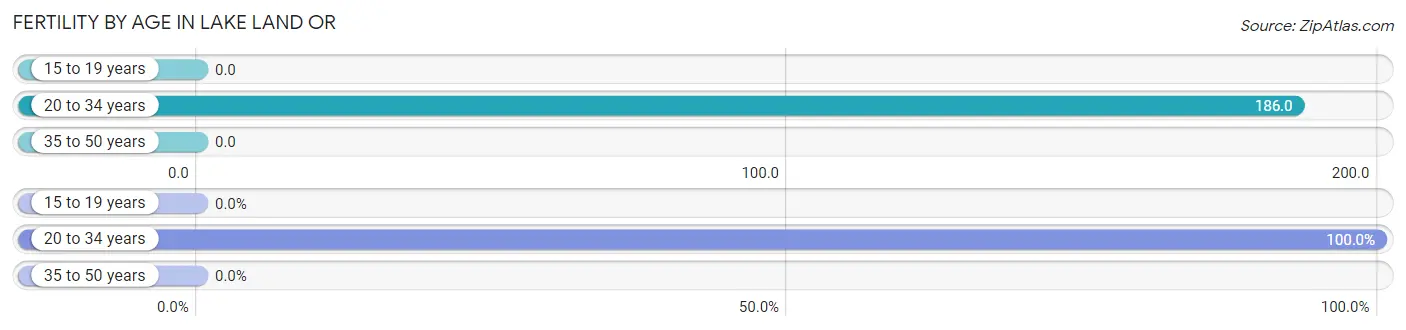
| Age Bracket | Women with Births | Births / 1,000 Women |
| 15 to 19 years | 0 (0.0%) | 0.0 |
| 20 to 34 years | 60 (100.0%) | 186.0 |
| 35 to 50 years | 0 (0.0%) | 0.0 |
| Total | 60 (100.0%) | 87.0 |
Fertility by Age by Marriage Status in Lake Land Or
41.7% of women with births (60) in Lake Land Or are married. The highest percentage of unmarried women with births falls into 20 to 34 years age bracket with 58.3% of them unmarried at the time of birth, while the lowest percentage of unmarried women with births belong to 20 to 34 years age bracket with 58.3% of them unmarried.
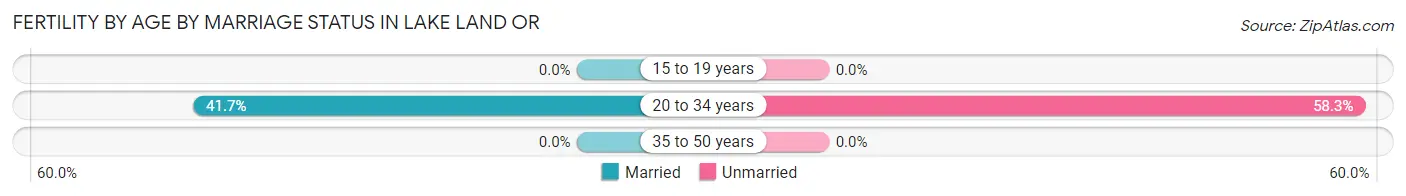
| Age Bracket | Married | Unmarried |
| 15 to 19 years | 0 (0.0%) | 0 (0.0%) |
| 20 to 34 years | 25 (41.7%) | 35 (58.3%) |
| 35 to 50 years | 0 (0.0%) | 0 (0.0%) |
| Total | 25 (41.7%) | 35 (58.3%) |
Fertility by Education in Lake Land Or
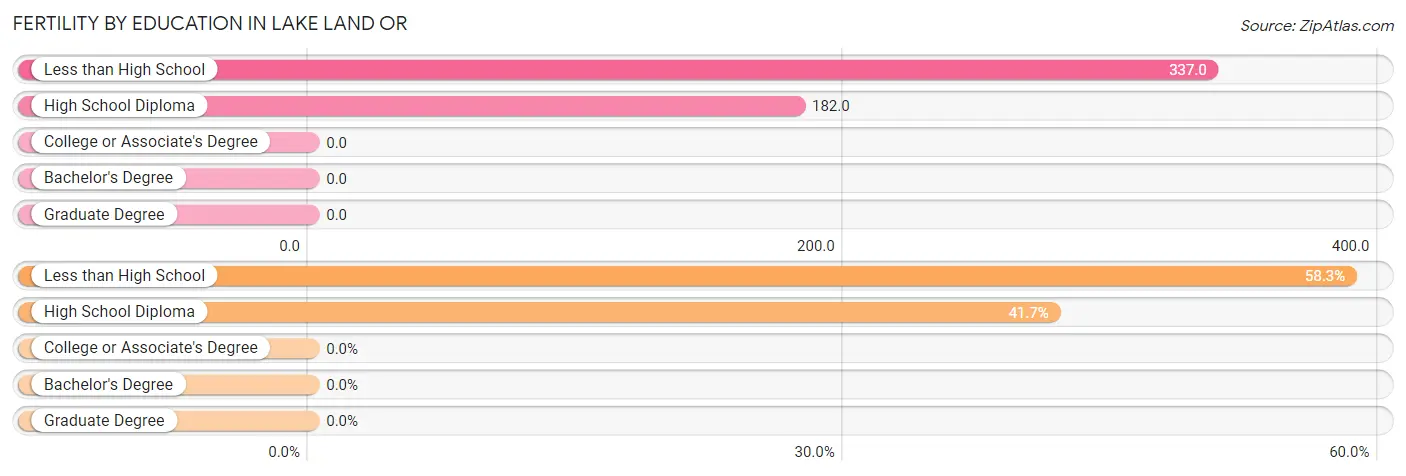
| Educational Attainment | Women with Births | Births / 1,000 Women |
| Less than High School | 35 (58.3%) | 337.0 |
| High School Diploma | 25 (41.7%) | 182.0 |
| College or Associate's Degree | 0 (0.0%) | 0.0 |
| Bachelor's Degree | 0 (0.0%) | 0.0 |
| Graduate Degree | 0 (0.0%) | 0.0 |
| Total | 60 (100.0%) | 87.0 |
Fertility by Education by Marriage Status in Lake Land Or
58.3% of women with births in Lake Land Or are unmarried. Women with the educational attainment of high school diploma are most likely to be married with 100.0% of them married at childbirth, while women with the educational attainment of less than high school are least likely to be married with 100.0% of them unmarried at childbirth.
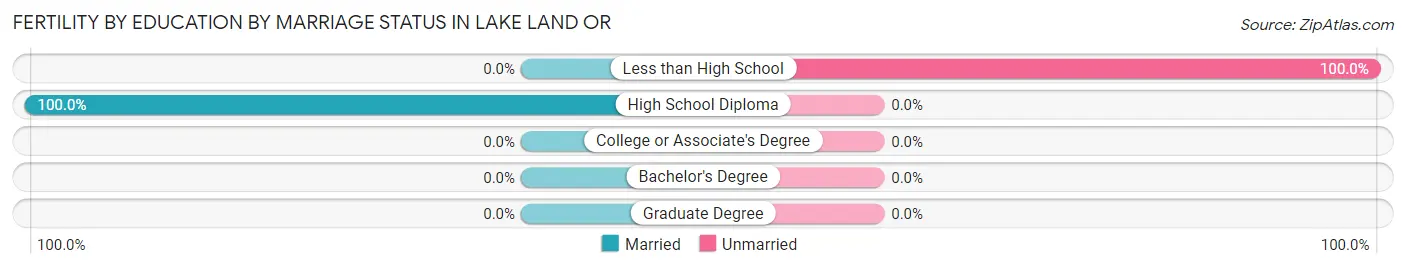
| Educational Attainment | Married | Unmarried |
| Less than High School | 0 (0.0%) | 35 (100.0%) |
| High School Diploma | 25 (100.0%) | 0 (0.0%) |
| College or Associate's Degree | 0 (0.0%) | 0 (0.0%) |
| Bachelor's Degree | 0 (0.0%) | 0 (0.0%) |
| Graduate Degree | 0 (0.0%) | 0 (0.0%) |
| Total | 25 (41.7%) | 35 (58.3%) |
Employment Characteristics in Lake Land Or
Employment by Class of Employer in Lake Land Or
Among the 1,625 employed individuals in Lake Land Or, private company employees (1,087 | 66.9%), federal government employees (202 | 12.4%), and local government employees (100 | 6.1%) make up the most common classes of employment.
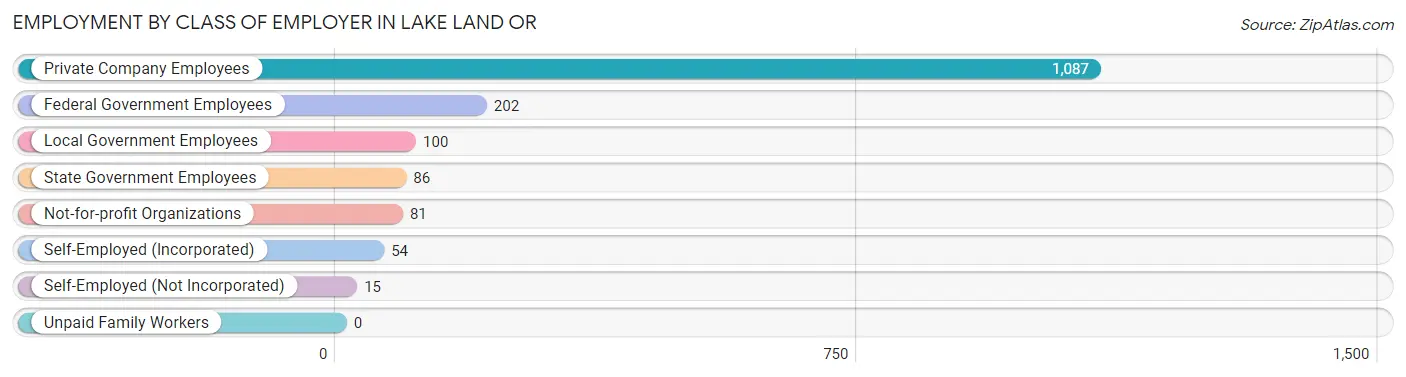
| Employer Class | # Employees | % Employees |
| Private Company Employees | 1,087 | 66.9% |
| Self-Employed (Incorporated) | 54 | 3.3% |
| Self-Employed (Not Incorporated) | 15 | 0.9% |
| Not-for-profit Organizations | 81 | 5.0% |
| Local Government Employees | 100 | 6.1% |
| State Government Employees | 86 | 5.3% |
| Federal Government Employees | 202 | 12.4% |
| Unpaid Family Workers | 0 | 0.0% |
| Total | 1,625 | 100.0% |
Employment Status by Age in Lake Land Or
According to the labor force statistics for Lake Land Or, out of the total population over 16 years of age (2,450), 68.9% or 1,688 individuals are in the labor force, with 3.7% or 62 of them unemployed. The age group with the highest labor force participation rate is 20 to 24 years, with 100.0% or 239 individuals in the labor force. Within the labor force, the 60 to 64 years age range has the highest percentage of unemployed individuals, with 23.0% or 62 of them being unemployed.
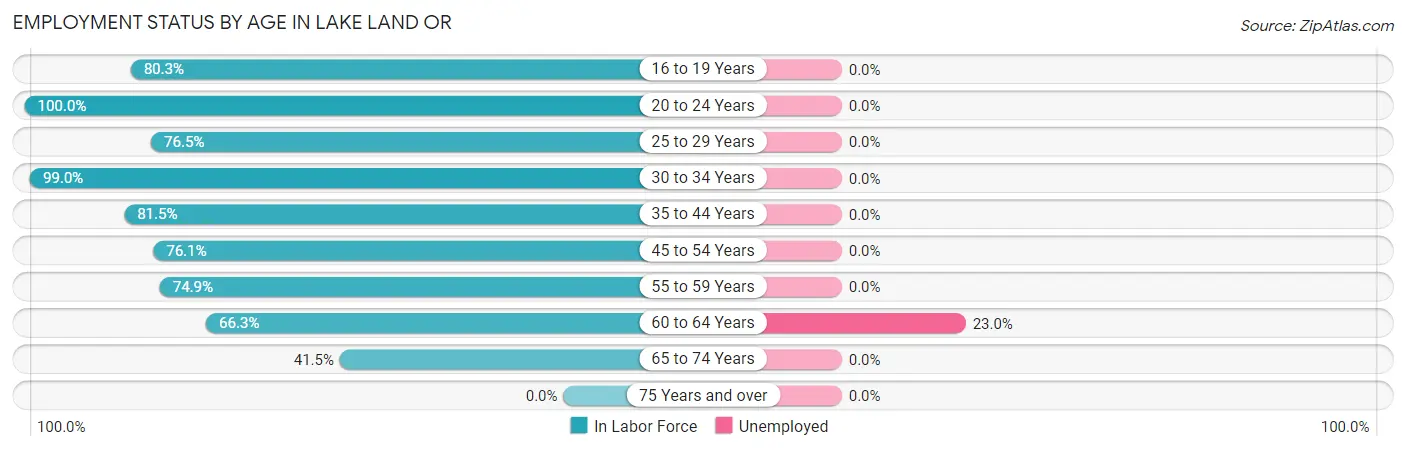
| Age Bracket | In Labor Force | Unemployed |
| 16 to 19 Years | 49 (80.3%) | 0 (0.0%) |
| 20 to 24 Years | 239 (100.0%) | 0 (0.0%) |
| 25 to 29 Years | 117 (76.5%) | 0 (0.0%) |
| 30 to 34 Years | 100 (99.0%) | 0 (0.0%) |
| 35 to 44 Years | 318 (81.5%) | 0 (0.0%) |
| 45 to 54 Years | 299 (76.1%) | 0 (0.0%) |
| 55 to 59 Years | 149 (74.9%) | 0 (0.0%) |
| 60 to 64 Years | 269 (66.3%) | 62 (23.0%) |
| 65 to 74 Years | 147 (41.5%) | 0 (0.0%) |
| 75 Years and over | 0 (0.0%) | 0 (0.0%) |
| Total | 1,688 (68.9%) | 62 (3.7%) |
Employment Status by Educational Attainment in Lake Land Or
According to labor force statistics for Lake Land Or, 76.2% of individuals (1,251) out of the total population between 25 and 64 years of age (1,642) are in the labor force, with 5.0% or 63 of them being unemployed. The group with the highest labor force participation rate are those with the educational attainment of college / associate degree, with 84.7% or 627 individuals in the labor force. Within the labor force, individuals with high school diploma education have the highest percentage of unemployment, with 27.8% or 62 of them being unemployed.
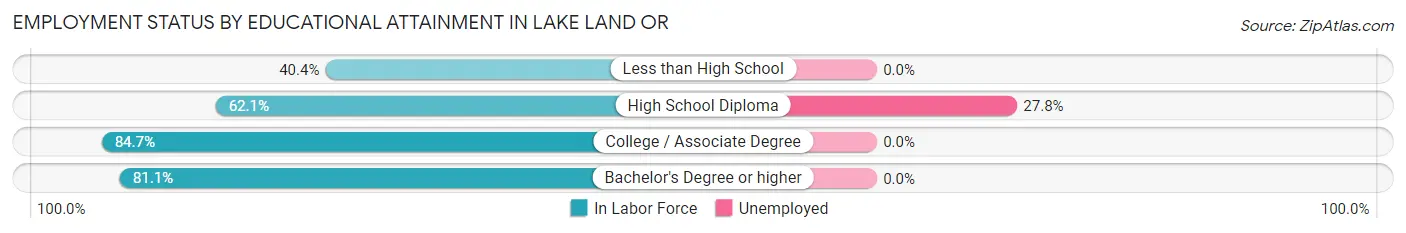
| Educational Attainment | In Labor Force | Unemployed |
| Less than High School | 38 (40.4%) | 0 (0.0%) |
| High School Diploma | 223 (62.1%) | 100 (27.8%) |
| College / Associate Degree | 627 (84.7%) | 0 (0.0%) |
| Bachelor's Degree or higher | 364 (81.1%) | 0 (0.0%) |
| Total | 1,251 (76.2%) | 82 (5.0%) |
Employment Occupations by Sex in Lake Land Or
Management, Business, Science and Arts Occupations
The most common Management, Business, Science and Arts occupations in Lake Land Or are Computers, Engineering & Science (298 | 18.3%), Computers & Mathematics (268 | 16.5%), Management (168 | 10.3%), Community & Social Service (151 | 9.3%), and Business & Financial (138 | 8.5%).
Management, Business, Science and Arts Occupations by Sex
Within the Management, Business, Science and Arts occupations in Lake Land Or, the most male-oriented occupations are Architecture & Engineering (100.0%), Life, Physical & Social Science (100.0%), and Education, Arts & Media (100.0%), while the most female-oriented occupations are Education Instruction & Library (94.8%), Community & Social Service (72.2%), and Management (39.3%).
| Occupation | Male | Female |
| Management | 102 (60.7%) | 66 (39.3%) |
| Business & Financial | 89 (64.5%) | 49 (35.5%) |
| Computers, Engineering & Science | 262 (87.9%) | 36 (12.1%) |
| Computers & Mathematics | 232 (86.6%) | 36 (13.4%) |
| Architecture & Engineering | 8 (100.0%) | 0 (0.0%) |
| Life, Physical & Social Science | 22 (100.0%) | 0 (0.0%) |
| Community & Social Service | 42 (27.8%) | 109 (72.2%) |
| Education, Arts & Media | 36 (100.0%) | 0 (0.0%) |
| Legal Services & Support | 0 (0.0%) | 0 (0.0%) |
| Education Instruction & Library | 6 (5.2%) | 109 (94.8%) |
| Arts, Media & Entertainment | 0 (0.0%) | 0 (0.0%) |
| Health Diagnosing & Treating | 0 (0.0%) | 0 (0.0%) |
| Health Technologists | 0 (0.0%) | 0 (0.0%) |
| Total (Category) | 495 (65.6%) | 260 (34.4%) |
| Total (Overall) | 800 (49.2%) | 825 (50.8%) |
Services Occupations
The most common Services occupations in Lake Land Or are Healthcare Support (82 | 5.1%), Food Preparation & Serving (69 | 4.3%), Cleaning & Maintenance (28 | 1.7%), Security & Protection (26 | 1.6%), and Firefighting & Prevention (26 | 1.6%).
Services Occupations by Sex
Within the Services occupations in Lake Land Or, the most male-oriented occupations are Healthcare Support (93.9%), Security & Protection (3.8%), and Firefighting & Prevention (3.8%), while the most female-oriented occupations are Food Preparation & Serving (100.0%), Cleaning & Maintenance (100.0%), and Personal Care & Service (100.0%).
| Occupation | Male | Female |
| Healthcare Support | 77 (93.9%) | 5 (6.1%) |
| Security & Protection | 1 (3.8%) | 25 (96.2%) |
| Firefighting & Prevention | 1 (3.8%) | 25 (96.2%) |
| Law Enforcement | 0 (0.0%) | 0 (0.0%) |
| Food Preparation & Serving | 0 (0.0%) | 69 (100.0%) |
| Cleaning & Maintenance | 0 (0.0%) | 28 (100.0%) |
| Personal Care & Service | 0 (0.0%) | 25 (100.0%) |
| Total (Category) | 78 (33.9%) | 152 (66.1%) |
| Total (Overall) | 800 (49.2%) | 825 (50.8%) |
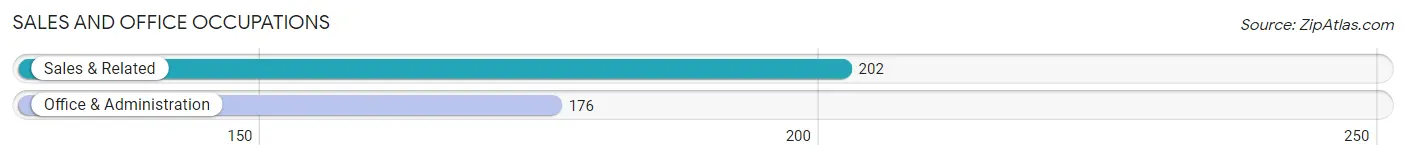
Sales and Office Occupations
The most common Sales and Office occupations in Lake Land Or are Sales & Related (202 | 12.4%), and Office & Administration (176 | 10.8%).
Sales and Office Occupations by Sex
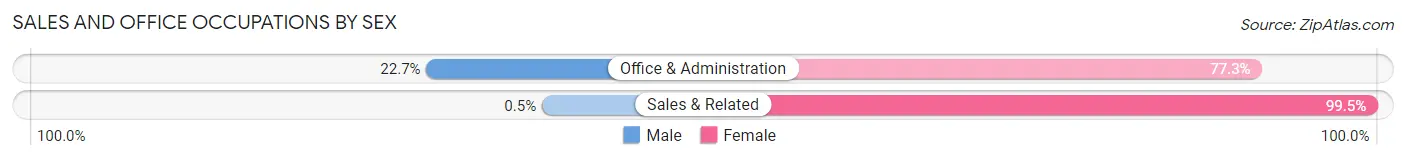
| Occupation | Male | Female |
| Sales & Related | 1 (0.5%) | 201 (99.5%) |
| Office & Administration | 40 (22.7%) | 136 (77.3%) |
| Total (Category) | 41 (10.8%) | 337 (89.1%) |
| Total (Overall) | 800 (49.2%) | 825 (50.8%) |
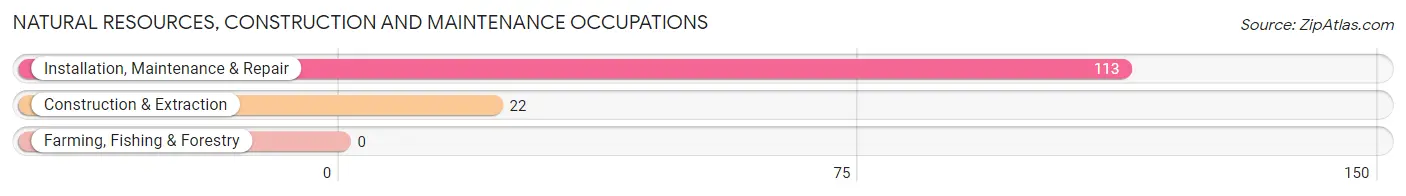
Natural Resources, Construction and Maintenance Occupations
The most common Natural Resources, Construction and Maintenance occupations in Lake Land Or are Installation, Maintenance & Repair (113 | 7.0%), and Construction & Extraction (22 | 1.3%).
Natural Resources, Construction and Maintenance Occupations by Sex
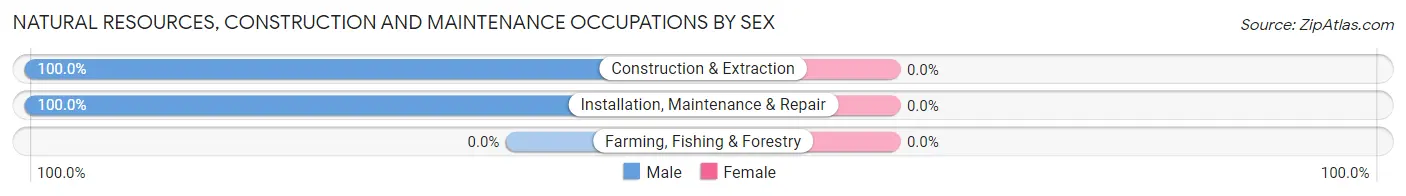
| Occupation | Male | Female |
| Farming, Fishing & Forestry | 0 (0.0%) | 0 (0.0%) |
| Construction & Extraction | 22 (100.0%) | 0 (0.0%) |
| Installation, Maintenance & Repair | 113 (100.0%) | 0 (0.0%) |
| Total (Category) | 135 (100.0%) | 0 (0.0%) |
| Total (Overall) | 800 (49.2%) | 825 (50.8%) |
Production, Transportation and Moving Occupations
The most common Production, Transportation and Moving occupations in Lake Land Or are Production (99 | 6.1%), Transportation (18 | 1.1%), and Material Moving (10 | 0.6%).
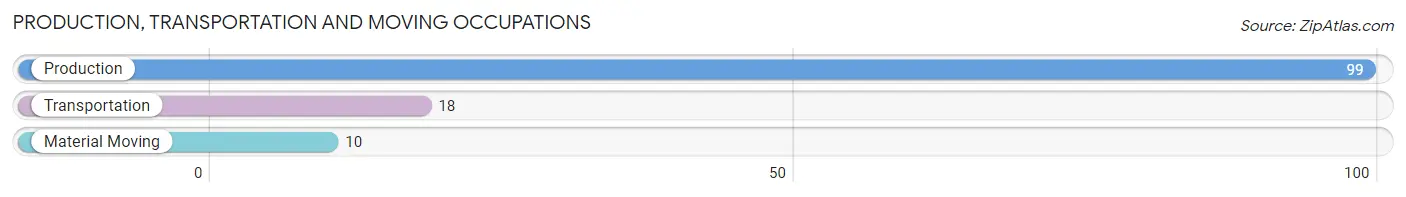
Production, Transportation and Moving Occupations by Sex
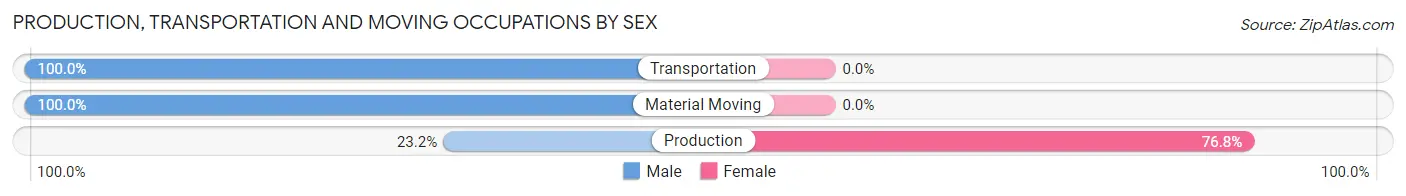
| Occupation | Male | Female |
| Production | 23 (23.2%) | 76 (76.8%) |
| Transportation | 18 (100.0%) | 0 (0.0%) |
| Material Moving | 10 (100.0%) | 0 (0.0%) |
| Total (Category) | 51 (40.2%) | 76 (59.8%) |
| Total (Overall) | 800 (49.2%) | 825 (50.8%) |
Employment Industries by Sex in Lake Land Or
Employment Industries in Lake Land Or
The major employment industries in Lake Land Or include Retail Trade (286 | 17.6%), Public Administration (205 | 12.6%), Accommodation & Food Services (203 | 12.5%), Administrative & Support (171 | 10.5%), and Educational Services (167 | 10.3%).
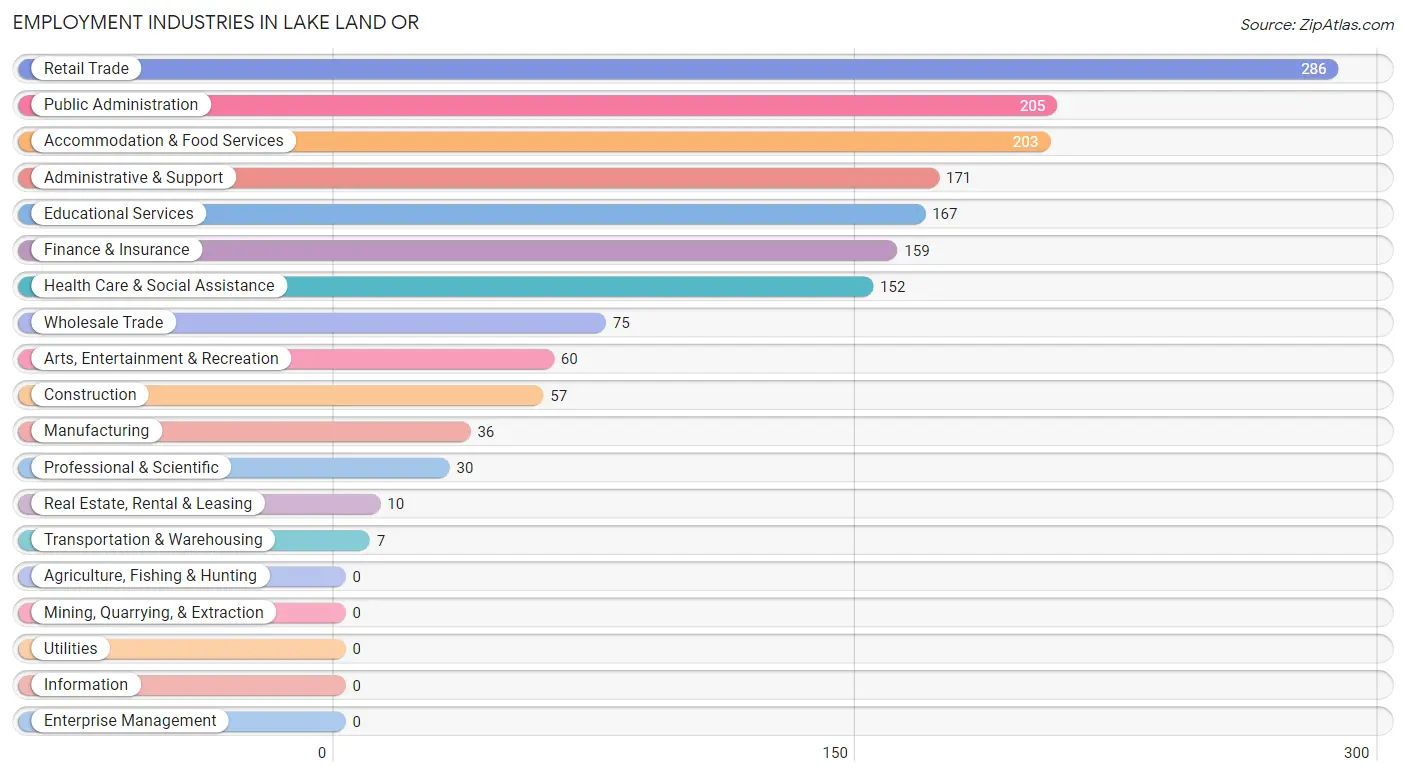
Employment Industries by Sex in Lake Land Or
The Lake Land Or industries that see more men than women are Wholesale Trade (100.0%), Health Care & Social Assistance (97.4%), and Public Administration (85.4%), whereas the industries that tend to have a higher number of women are Transportation & Warehousing (100.0%), Real Estate, Rental & Leasing (100.0%), and Professional & Scientific (100.0%).
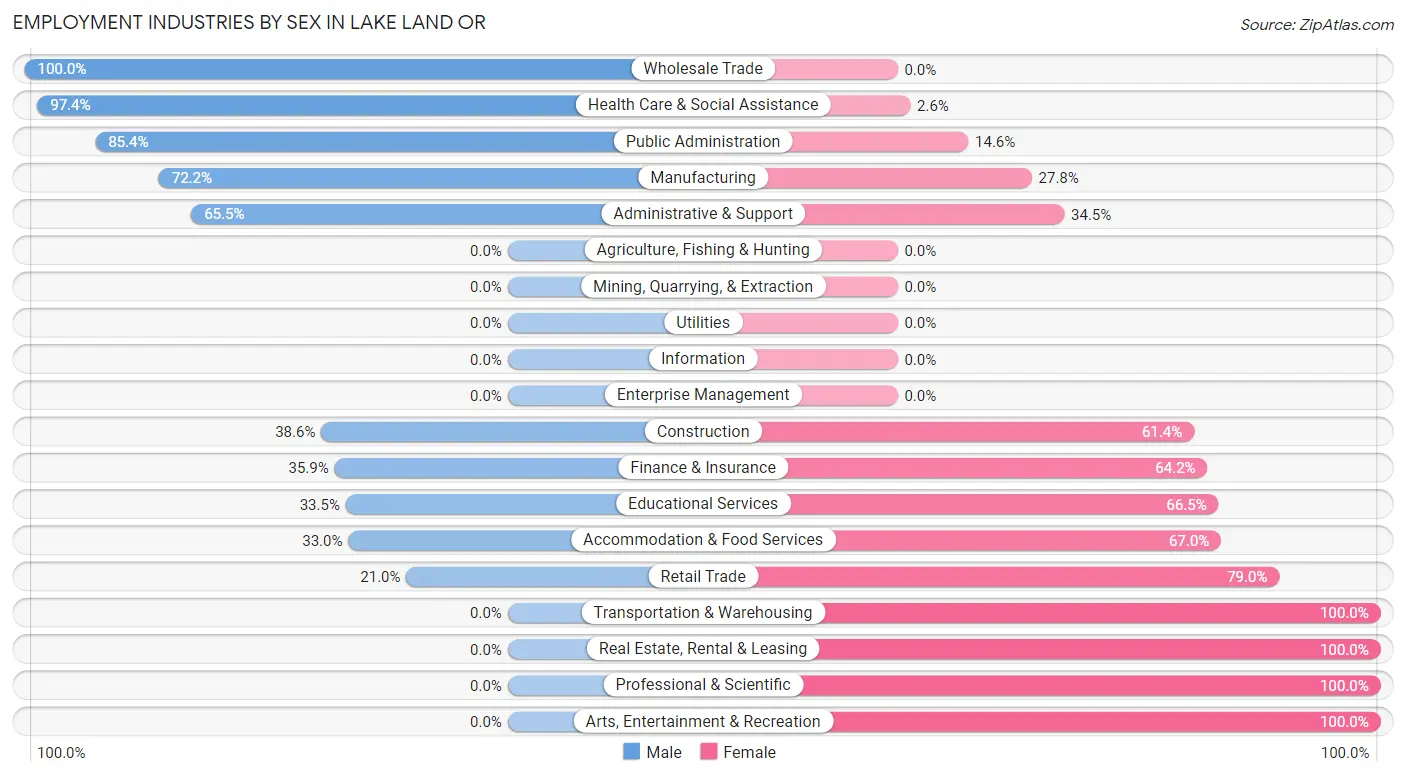
| Industry | Male | Female |
| Agriculture, Fishing & Hunting | 0 (0.0%) | 0 (0.0%) |
| Mining, Quarrying, & Extraction | 0 (0.0%) | 0 (0.0%) |
| Construction | 22 (38.6%) | 35 (61.4%) |
| Manufacturing | 26 (72.2%) | 10 (27.8%) |
| Wholesale Trade | 75 (100.0%) | 0 (0.0%) |
| Retail Trade | 60 (21.0%) | 226 (79.0%) |
| Transportation & Warehousing | 0 (0.0%) | 7 (100.0%) |
| Utilities | 0 (0.0%) | 0 (0.0%) |
| Information | 0 (0.0%) | 0 (0.0%) |
| Finance & Insurance | 57 (35.8%) | 102 (64.1%) |
| Real Estate, Rental & Leasing | 0 (0.0%) | 10 (100.0%) |
| Professional & Scientific | 0 (0.0%) | 30 (100.0%) |
| Enterprise Management | 0 (0.0%) | 0 (0.0%) |
| Administrative & Support | 112 (65.5%) | 59 (34.5%) |
| Educational Services | 56 (33.5%) | 111 (66.5%) |
| Health Care & Social Assistance | 148 (97.4%) | 4 (2.6%) |
| Arts, Entertainment & Recreation | 0 (0.0%) | 60 (100.0%) |
| Accommodation & Food Services | 67 (33.0%) | 136 (67.0%) |
| Public Administration | 175 (85.4%) | 30 (14.6%) |
| Total | 800 (49.2%) | 825 (50.8%) |
Education in Lake Land Or
School Enrollment in Lake Land Or
The most common levels of schooling among the 460 students in Lake Land Or are middle school (205 | 44.6%), high school (123 | 26.7%), and elementary school (75 | 16.3%).
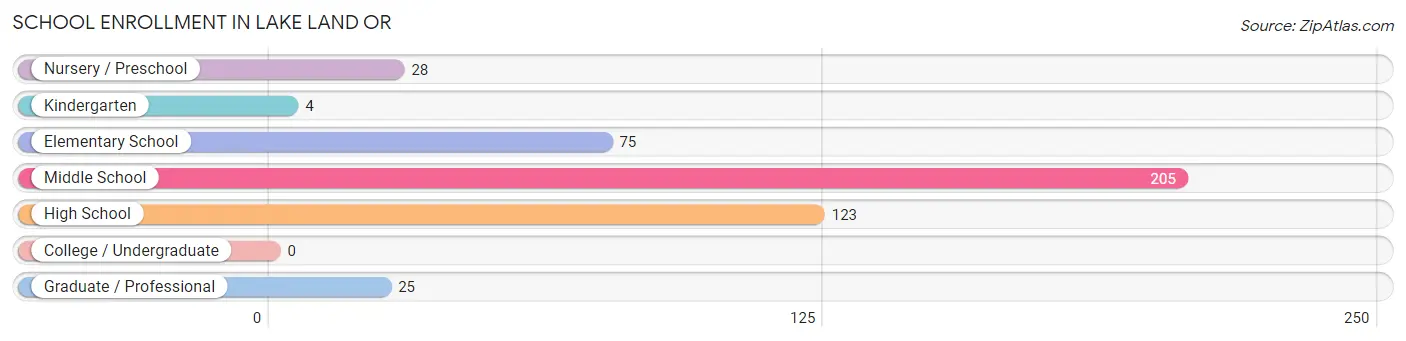
| School Level | # Students | % Students |
| Nursery / Preschool | 28 | 6.1% |
| Kindergarten | 4 | 0.9% |
| Elementary School | 75 | 16.3% |
| Middle School | 205 | 44.6% |
| High School | 123 | 26.7% |
| College / Undergraduate | 0 | 0.0% |
| Graduate / Professional | 25 | 5.4% |
| Total | 460 | 100.0% |
School Enrollment by Age by Funding Source in Lake Land Or
Out of a total of 460 students who are enrolled in schools in Lake Land Or, 9 (2.0%) attend a private institution, while the remaining 451 (98.0%) are enrolled in public schools. The age group of 3 to 4 year olds has the highest likelihood of being enrolled in private schools, with 4 (100.0% in the age bracket) enrolled. Conversely, the age group of 5 to 9 year old has the lowest likelihood of being enrolled in a private school, with 83 (100.0% in the age bracket) attending a public institution.
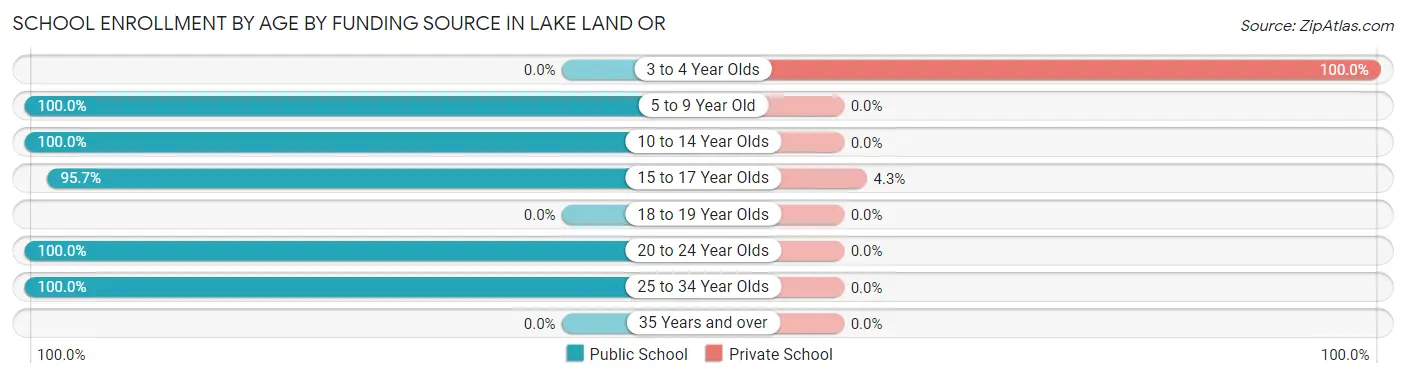
| Age Bracket | Public School | Private School |
| 3 to 4 Year Olds | 0 (0.0%) | 4 (100.0%) |
| 5 to 9 Year Old | 83 (100.0%) | 0 (0.0%) |
| 10 to 14 Year Olds | 225 (100.0%) | 0 (0.0%) |
| 15 to 17 Year Olds | 112 (95.7%) | 5 (4.3%) |
| 18 to 19 Year Olds | 0 (0.0%) | 0 (0.0%) |
| 20 to 24 Year Olds | 25 (100.0%) | 0 (0.0%) |
| 25 to 34 Year Olds | 6 (100.0%) | 0 (0.0%) |
| 35 Years and over | 0 (0.0%) | 0 (0.0%) |
| Total | 451 (98.0%) | 9 (2.0%) |
Educational Attainment by Field of Study in Lake Land Or
Education (193 | 35.7%), business (183 | 33.8%), computers & mathematics (45 | 8.3%), liberal arts & history (38 | 7.0%), and science & technology (30 | 5.6%) are the most common fields of study among 541 individuals in Lake Land Or who have obtained a bachelor's degree or higher.
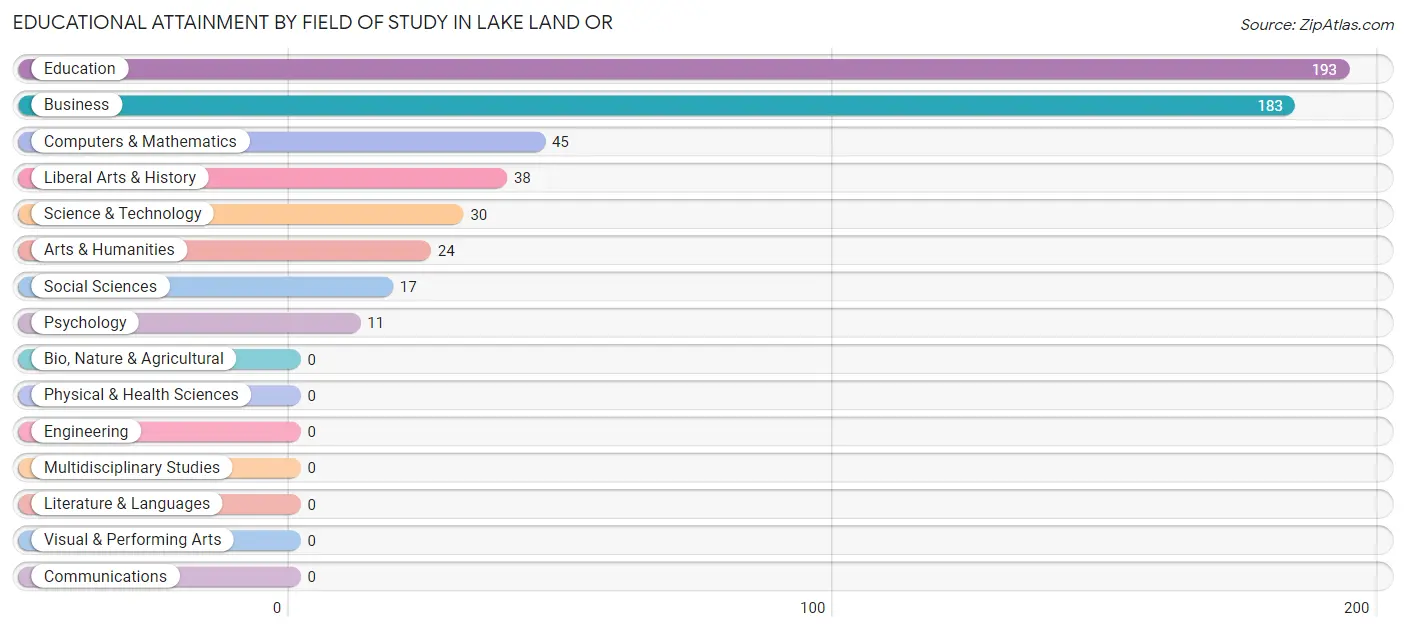
| Field of Study | # Graduates | % Graduates |
| Computers & Mathematics | 45 | 8.3% |
| Bio, Nature & Agricultural | 0 | 0.0% |
| Physical & Health Sciences | 0 | 0.0% |
| Psychology | 11 | 2.0% |
| Social Sciences | 17 | 3.1% |
| Engineering | 0 | 0.0% |
| Multidisciplinary Studies | 0 | 0.0% |
| Science & Technology | 30 | 5.6% |
| Business | 183 | 33.8% |
| Education | 193 | 35.7% |
| Literature & Languages | 0 | 0.0% |
| Liberal Arts & History | 38 | 7.0% |
| Visual & Performing Arts | 0 | 0.0% |
| Communications | 0 | 0.0% |
| Arts & Humanities | 24 | 4.4% |
| Total | 541 | 100.0% |
Transportation & Commute in Lake Land Or
Vehicle Availability by Sex in Lake Land Or
The most prevalent vehicle ownership categories in Lake Land Or are males with 3 vehicles (403, accounting for 50.4%) and females with 3 vehicles (333, making up 49.0%).
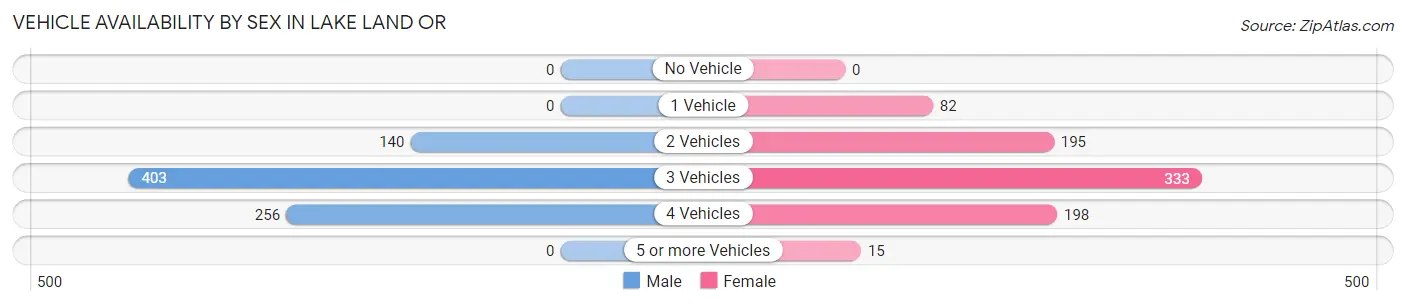
| Vehicles Available | Male | Female |
| No Vehicle | 0 (0.0%) | 0 (0.0%) |
| 1 Vehicle | 0 (0.0%) | 82 (10.0%) |
| 2 Vehicles | 140 (17.5%) | 195 (23.7%) |
| 3 Vehicles | 403 (50.4%) | 333 (40.5%) |
| 4 Vehicles | 256 (32.0%) | 198 (24.1%) |
| 5 or more Vehicles | 0 (0.0%) | 15 (1.8%) |
| Total | 799 (100.0%) | 823 (100.0%) |
Commute Time in Lake Land Or
The most frequently occuring commute durations in Lake Land Or are 45 to 59 minutes (408 commuters, 28.3%), 40 to 44 minutes (221 commuters, 15.3%), and 25 to 29 minutes (195 commuters, 13.5%).
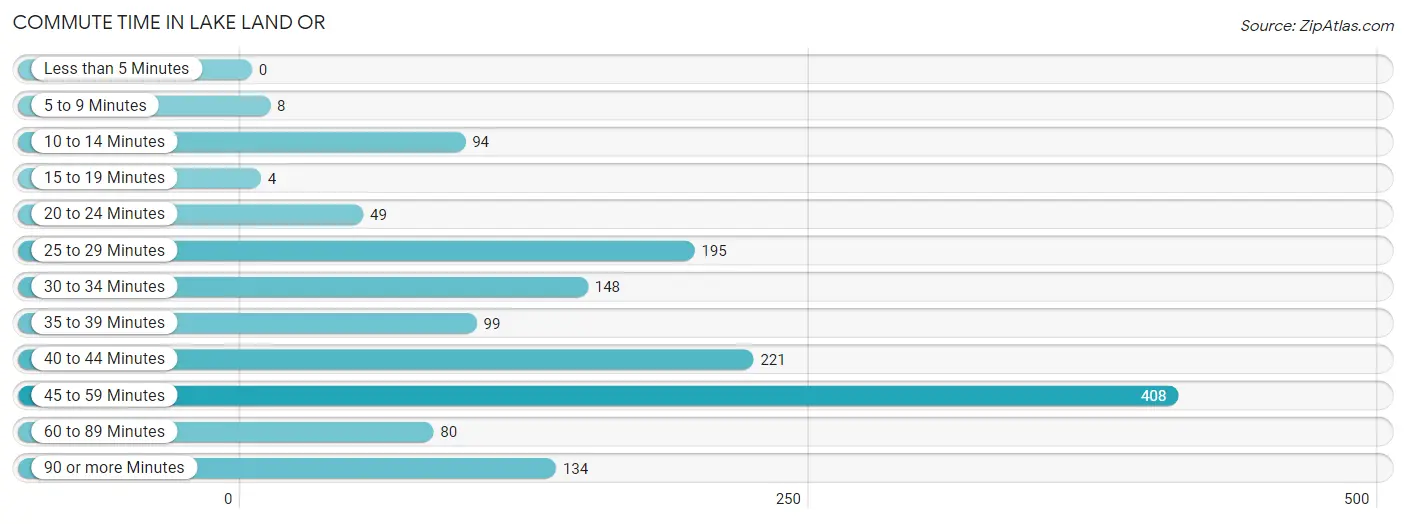
| Commute Time | # Commuters | % Commuters |
| Less than 5 Minutes | 0 | 0.0% |
| 5 to 9 Minutes | 8 | 0.6% |
| 10 to 14 Minutes | 94 | 6.5% |
| 15 to 19 Minutes | 4 | 0.3% |
| 20 to 24 Minutes | 49 | 3.4% |
| 25 to 29 Minutes | 195 | 13.5% |
| 30 to 34 Minutes | 148 | 10.3% |
| 35 to 39 Minutes | 99 | 6.9% |
| 40 to 44 Minutes | 221 | 15.3% |
| 45 to 59 Minutes | 408 | 28.3% |
| 60 to 89 Minutes | 80 | 5.6% |
| 90 or more Minutes | 134 | 9.3% |
Commute Time by Sex in Lake Land Or
The most common commute times in Lake Land Or are 90 or more minutes (134 commuters, 19.7%) for males and 45 to 59 minutes (282 commuters, 37.1%) for females.
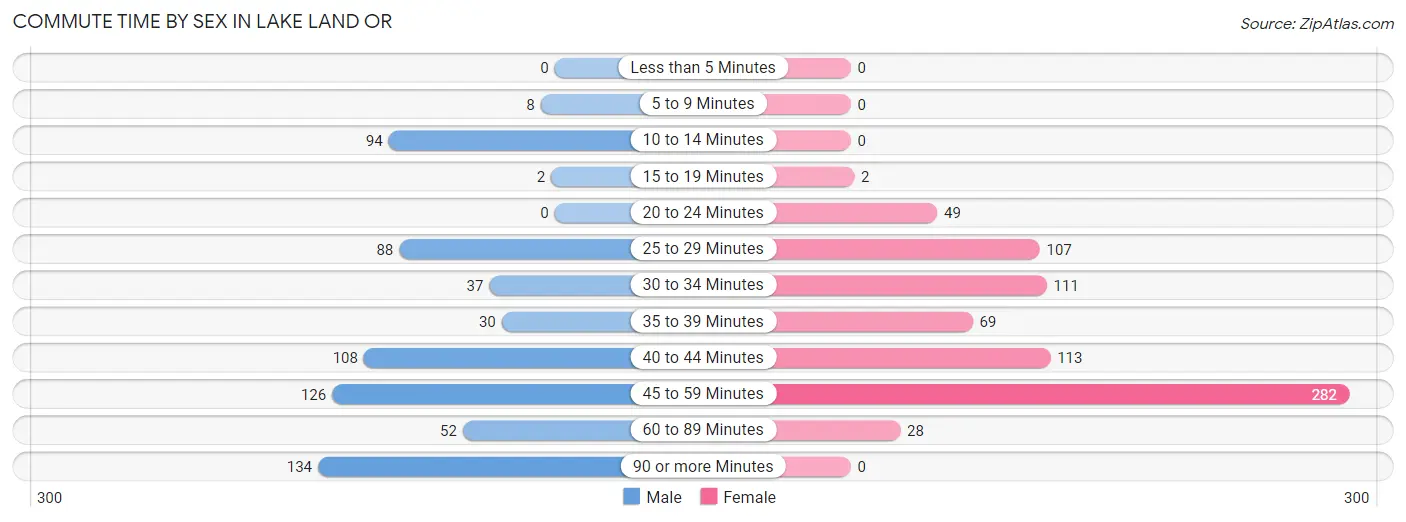
| Commute Time | Male | Female |
| Less than 5 Minutes | 0 (0.0%) | 0 (0.0%) |
| 5 to 9 Minutes | 8 (1.2%) | 0 (0.0%) |
| 10 to 14 Minutes | 94 (13.8%) | 0 (0.0%) |
| 15 to 19 Minutes | 2 (0.3%) | 2 (0.3%) |
| 20 to 24 Minutes | 0 (0.0%) | 49 (6.4%) |
| 25 to 29 Minutes | 88 (13.0%) | 107 (14.1%) |
| 30 to 34 Minutes | 37 (5.4%) | 111 (14.6%) |
| 35 to 39 Minutes | 30 (4.4%) | 69 (9.1%) |
| 40 to 44 Minutes | 108 (15.9%) | 113 (14.8%) |
| 45 to 59 Minutes | 126 (18.6%) | 282 (37.1%) |
| 60 to 89 Minutes | 52 (7.7%) | 28 (3.7%) |
| 90 or more Minutes | 134 (19.7%) | 0 (0.0%) |
Time of Departure to Work by Sex in Lake Land Or
The most frequent times of departure to work in Lake Land Or are 6:00 AM to 6:29 AM (208, 30.6%) for males and 7:30 AM to 7:59 AM (143, 18.8%) for females.
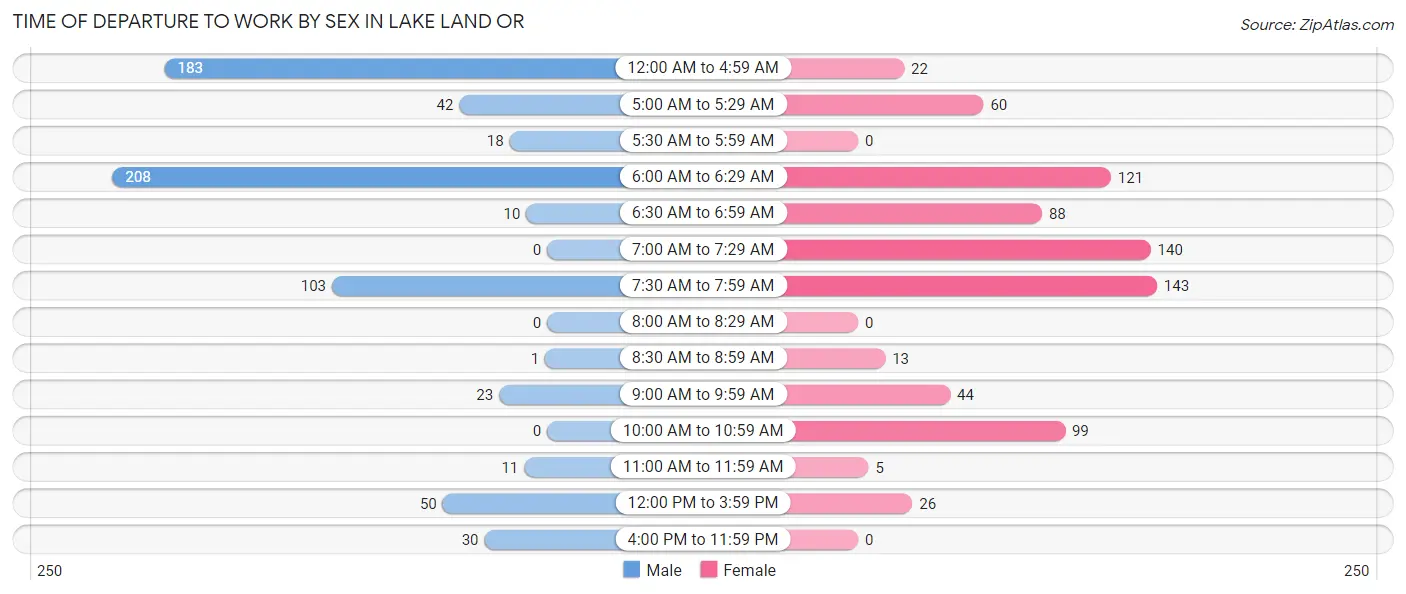
| Time of Departure | Male | Female |
| 12:00 AM to 4:59 AM | 183 (27.0%) | 22 (2.9%) |
| 5:00 AM to 5:29 AM | 42 (6.2%) | 60 (7.9%) |
| 5:30 AM to 5:59 AM | 18 (2.6%) | 0 (0.0%) |
| 6:00 AM to 6:29 AM | 208 (30.6%) | 121 (15.9%) |
| 6:30 AM to 6:59 AM | 10 (1.5%) | 88 (11.6%) |
| 7:00 AM to 7:29 AM | 0 (0.0%) | 140 (18.4%) |
| 7:30 AM to 7:59 AM | 103 (15.2%) | 143 (18.8%) |
| 8:00 AM to 8:29 AM | 0 (0.0%) | 0 (0.0%) |
| 8:30 AM to 8:59 AM | 1 (0.2%) | 13 (1.7%) |
| 9:00 AM to 9:59 AM | 23 (3.4%) | 44 (5.8%) |
| 10:00 AM to 10:59 AM | 0 (0.0%) | 99 (13.0%) |
| 11:00 AM to 11:59 AM | 11 (1.6%) | 5 (0.7%) |
| 12:00 PM to 3:59 PM | 50 (7.4%) | 26 (3.4%) |
| 4:00 PM to 11:59 PM | 30 (4.4%) | 0 (0.0%) |
| Total | 679 (100.0%) | 761 (100.0%) |
Housing Occupancy in Lake Land Or
Occupancy by Ownership in Lake Land Or
Of the total 1,148 dwellings in Lake Land Or, owner-occupied units account for 1,098 (95.6%), while renter-occupied units make up 50 (4.4%).
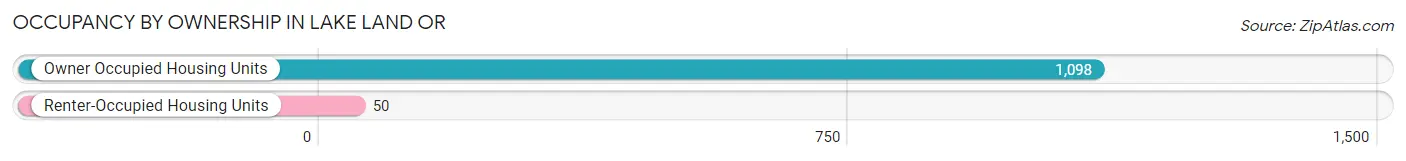
| Occupancy | # Housing Units | % Housing Units |
| Owner Occupied Housing Units | 1,098 | 95.6% |
| Renter-Occupied Housing Units | 50 | 4.4% |
| Total Occupied Housing Units | 1,148 | 100.0% |
Occupancy by Household Size in Lake Land Or
| Household Size | # Housing Units | % Housing Units |
| 1-Person Household | 256 | 22.3% |
| 2-Person Household | 311 | 27.1% |
| 3-Person Household | 428 | 37.3% |
| 4+ Person Household | 153 | 13.3% |
| Total Housing Units | 1,148 | 100.0% |
Occupancy by Ownership by Household Size in Lake Land Or
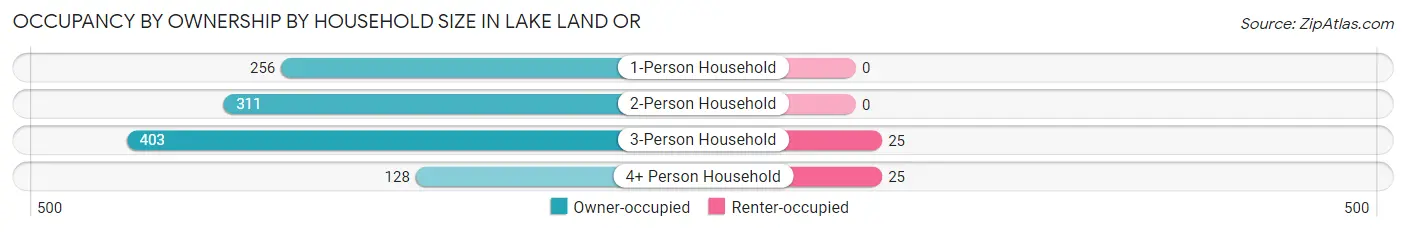
| Household Size | Owner-occupied | Renter-occupied |
| 1-Person Household | 256 (100.0%) | 0 (0.0%) |
| 2-Person Household | 311 (100.0%) | 0 (0.0%) |
| 3-Person Household | 403 (94.2%) | 25 (5.8%) |
| 4+ Person Household | 128 (83.7%) | 25 (16.3%) |
| Total Housing Units | 1,098 (95.6%) | 50 (4.4%) |
Occupancy by Educational Attainment in Lake Land Or
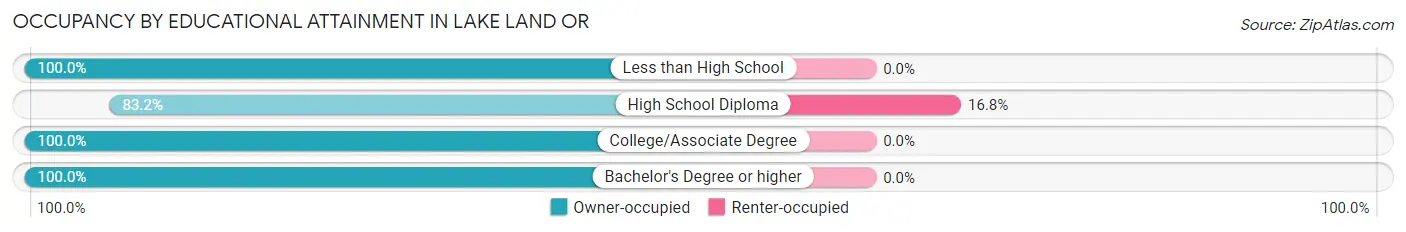
| Household Size | Owner-occupied | Renter-occupied |
| Less than High School | 17 (100.0%) | 0 (0.0%) |
| High School Diploma | 247 (83.2%) | 50 (16.8%) |
| College/Associate Degree | 463 (100.0%) | 0 (0.0%) |
| Bachelor's Degree or higher | 371 (100.0%) | 0 (0.0%) |
Occupancy by Age of Householder in Lake Land Or
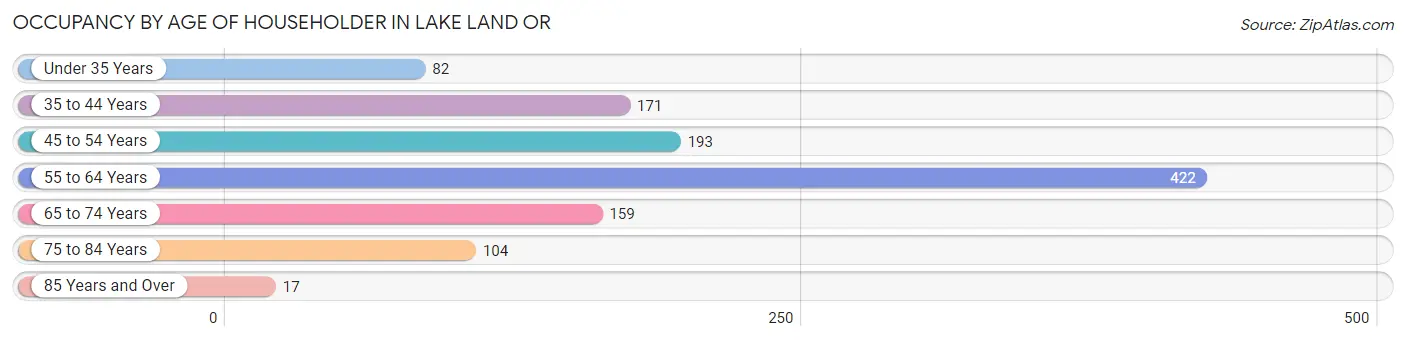
| Age Bracket | # Households | % Households |
| Under 35 Years | 82 | 7.1% |
| 35 to 44 Years | 171 | 14.9% |
| 45 to 54 Years | 193 | 16.8% |
| 55 to 64 Years | 422 | 36.8% |
| 65 to 74 Years | 159 | 13.9% |
| 75 to 84 Years | 104 | 9.1% |
| 85 Years and Over | 17 | 1.5% |
| Total | 1,148 | 100.0% |
Housing Finances in Lake Land Or
Median Income by Occupancy in Lake Land Or
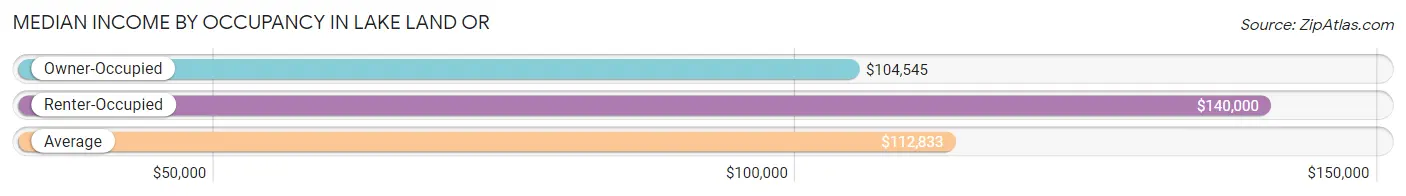
| Occupancy Type | # Households | Median Income |
| Owner-Occupied | 1,098 (95.6%) | $104,545 |
| Renter-Occupied | 50 (4.4%) | $140,000 |
| Average | 1,148 (100.0%) | $112,833 |
Occupancy by Householder Income Bracket in Lake Land Or
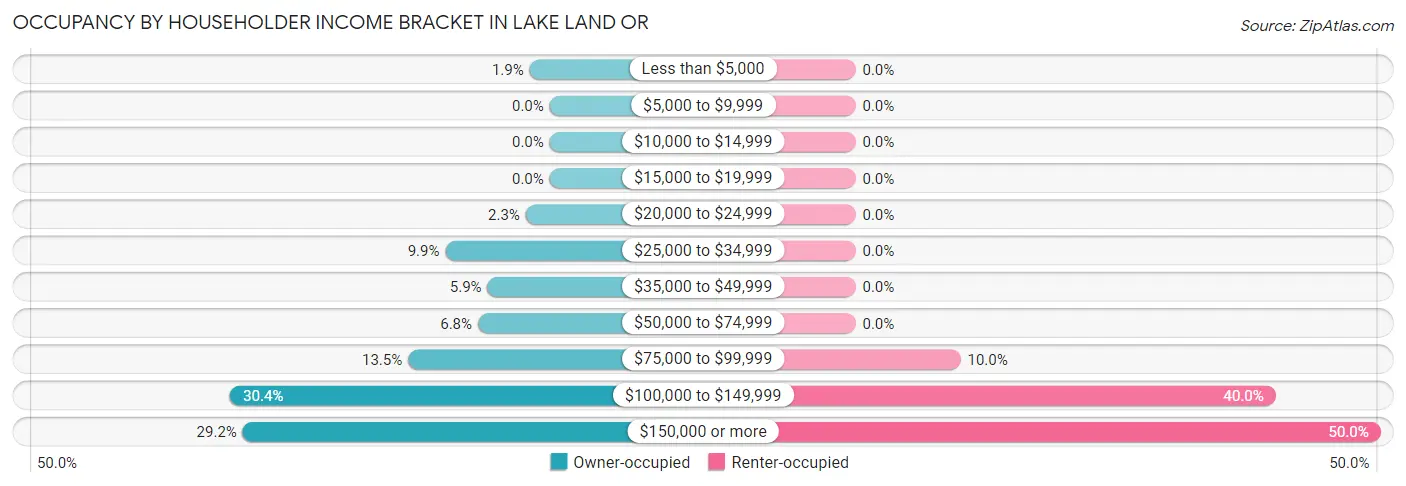
| Income Bracket | Owner-occupied | Renter-occupied |
| Less than $5,000 | 21 (1.9%) | 0 (0.0%) |
| $5,000 to $9,999 | 0 (0.0%) | 0 (0.0%) |
| $10,000 to $14,999 | 0 (0.0%) | 0 (0.0%) |
| $15,000 to $19,999 | 0 (0.0%) | 0 (0.0%) |
| $20,000 to $24,999 | 25 (2.3%) | 0 (0.0%) |
| $25,000 to $34,999 | 109 (9.9%) | 0 (0.0%) |
| $35,000 to $49,999 | 65 (5.9%) | 0 (0.0%) |
| $50,000 to $74,999 | 75 (6.8%) | 0 (0.0%) |
| $75,000 to $99,999 | 148 (13.5%) | 5 (10.0%) |
| $100,000 to $149,999 | 334 (30.4%) | 20 (40.0%) |
| $150,000 or more | 321 (29.2%) | 25 (50.0%) |
| Total | 1,098 (100.0%) | 50 (100.0%) |
Monthly Housing Cost Tiers in Lake Land Or
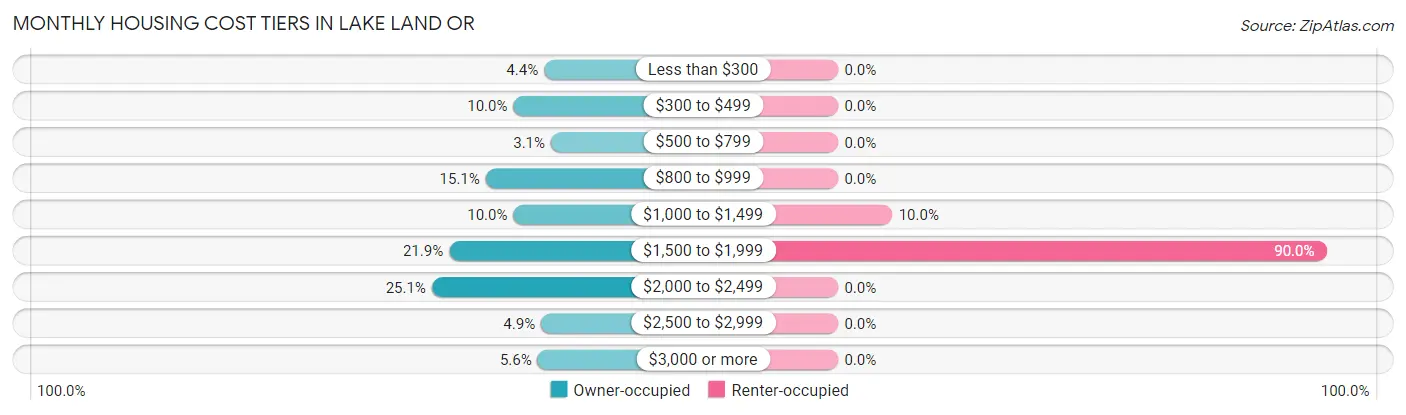
| Monthly Cost | Owner-occupied | Renter-occupied |
| Less than $300 | 48 (4.4%) | 0 (0.0%) |
| $300 to $499 | 110 (10.0%) | 0 (0.0%) |
| $500 to $799 | 34 (3.1%) | 0 (0.0%) |
| $800 to $999 | 166 (15.1%) | 0 (0.0%) |
| $1,000 to $1,499 | 110 (10.0%) | 5 (10.0%) |
| $1,500 to $1,999 | 240 (21.9%) | 45 (90.0%) |
| $2,000 to $2,499 | 275 (25.1%) | 0 (0.0%) |
| $2,500 to $2,999 | 54 (4.9%) | 0 (0.0%) |
| $3,000 or more | 61 (5.6%) | 0 (0.0%) |
| Total | 1,098 (100.0%) | 50 (100.0%) |
Physical Housing Characteristics in Lake Land Or
Housing Structures in Lake Land Or
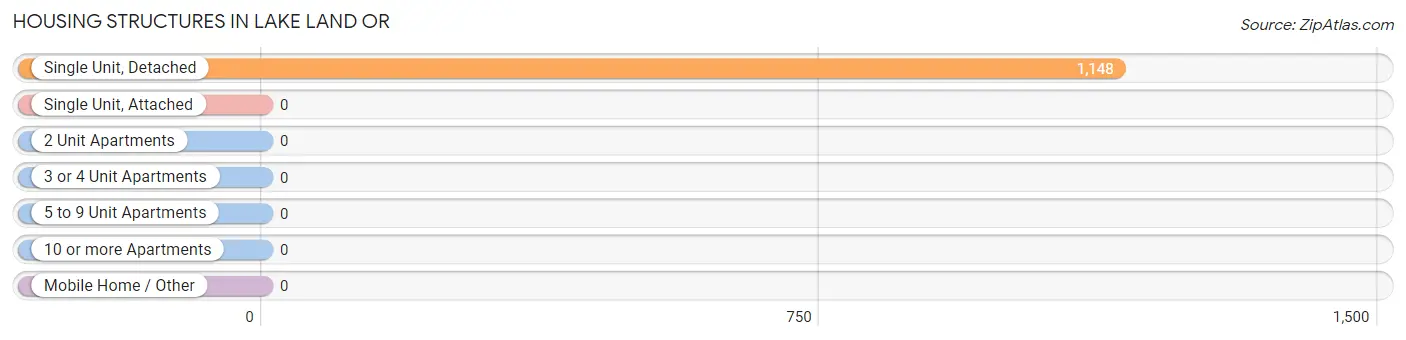
| Structure Type | # Housing Units | % Housing Units |
| Single Unit, Detached | 1,148 | 100.0% |
| Single Unit, Attached | 0 | 0.0% |
| 2 Unit Apartments | 0 | 0.0% |
| 3 or 4 Unit Apartments | 0 | 0.0% |
| 5 to 9 Unit Apartments | 0 | 0.0% |
| 10 or more Apartments | 0 | 0.0% |
| Mobile Home / Other | 0 | 0.0% |
| Total | 1,148 | 100.0% |
Housing Structures by Occupancy in Lake Land Or
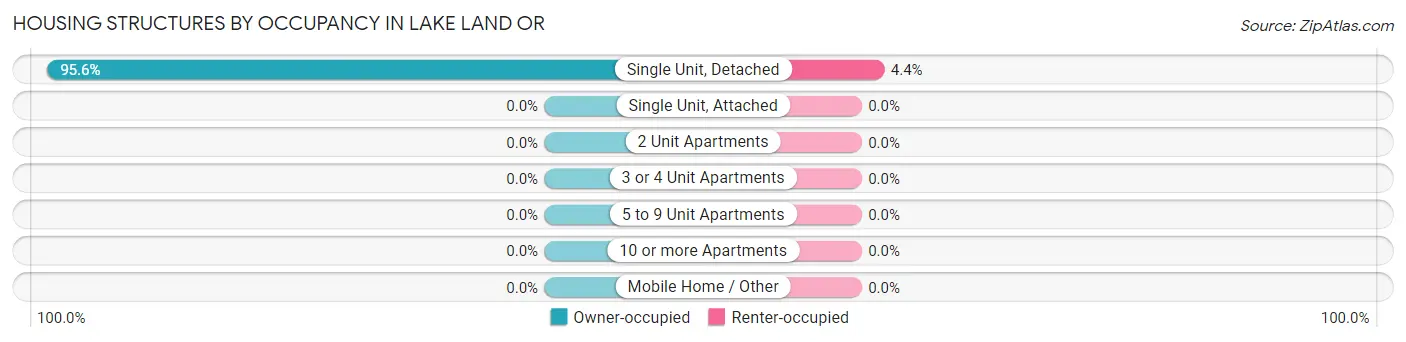
| Structure Type | Owner-occupied | Renter-occupied |
| Single Unit, Detached | 1,098 (95.6%) | 50 (4.4%) |
| Single Unit, Attached | 0 (0.0%) | 0 (0.0%) |
| 2 Unit Apartments | 0 (0.0%) | 0 (0.0%) |
| 3 or 4 Unit Apartments | 0 (0.0%) | 0 (0.0%) |
| 5 to 9 Unit Apartments | 0 (0.0%) | 0 (0.0%) |
| 10 or more Apartments | 0 (0.0%) | 0 (0.0%) |
| Mobile Home / Other | 0 (0.0%) | 0 (0.0%) |
| Total | 1,098 (95.6%) | 50 (4.4%) |
Housing Structures by Number of Rooms in Lake Land Or
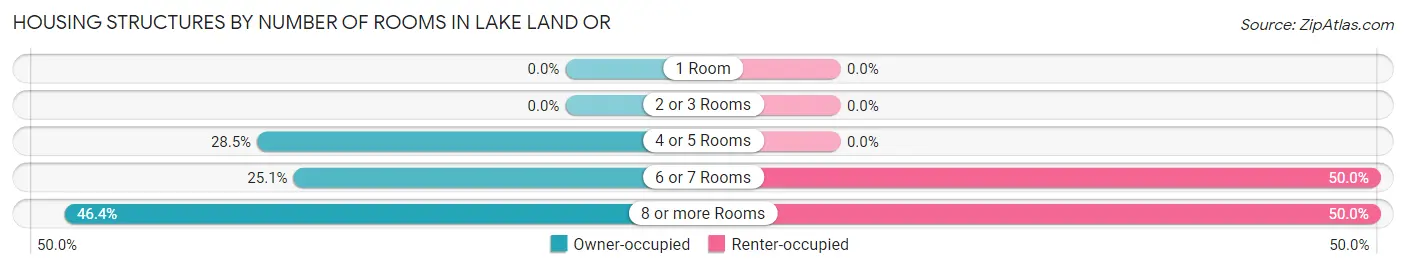
| Number of Rooms | Owner-occupied | Renter-occupied |
| 1 Room | 0 (0.0%) | 0 (0.0%) |
| 2 or 3 Rooms | 0 (0.0%) | 0 (0.0%) |
| 4 or 5 Rooms | 313 (28.5%) | 0 (0.0%) |
| 6 or 7 Rooms | 276 (25.1%) | 25 (50.0%) |
| 8 or more Rooms | 509 (46.4%) | 25 (50.0%) |
| Total | 1,098 (100.0%) | 50 (100.0%) |
Housing Structure by Heating Type in Lake Land Or
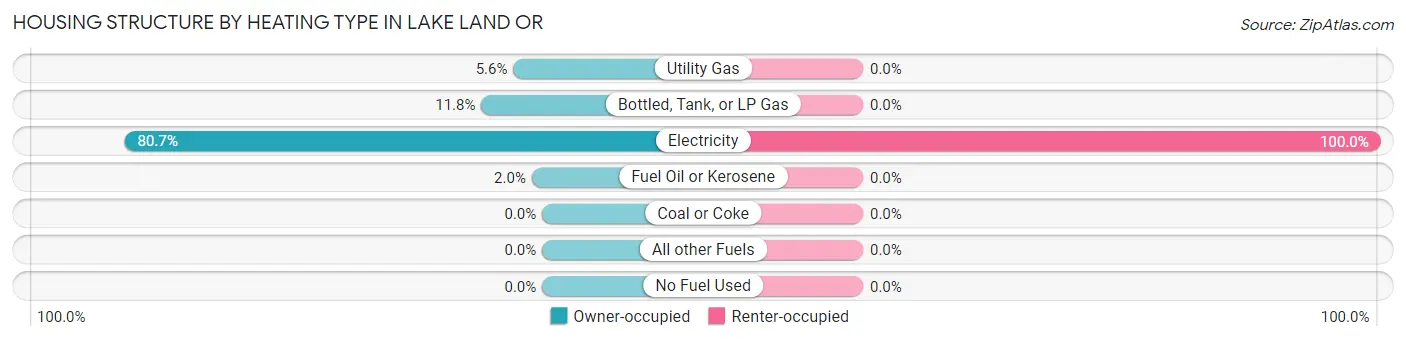
| Heating Type | Owner-occupied | Renter-occupied |
| Utility Gas | 61 (5.6%) | 0 (0.0%) |
| Bottled, Tank, or LP Gas | 129 (11.7%) | 0 (0.0%) |
| Electricity | 886 (80.7%) | 50 (100.0%) |
| Fuel Oil or Kerosene | 22 (2.0%) | 0 (0.0%) |
| Coal or Coke | 0 (0.0%) | 0 (0.0%) |
| All other Fuels | 0 (0.0%) | 0 (0.0%) |
| No Fuel Used | 0 (0.0%) | 0 (0.0%) |
| Total | 1,098 (100.0%) | 50 (100.0%) |
Household Vehicle Usage in Lake Land Or
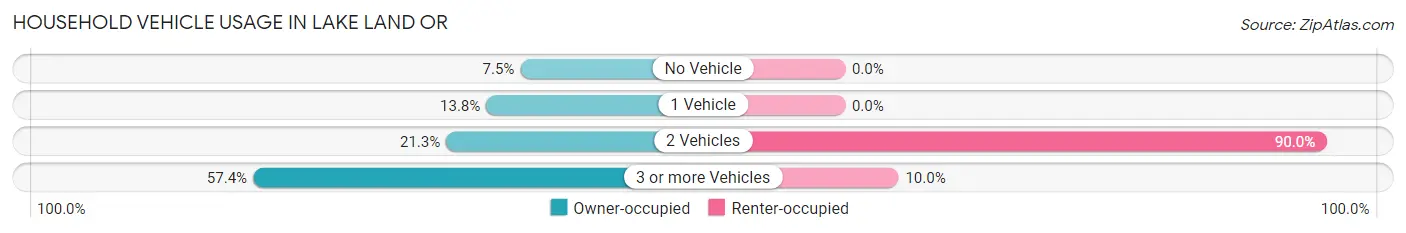
| Vehicles per Household | Owner-occupied | Renter-occupied |
| No Vehicle | 82 (7.5%) | 0 (0.0%) |
| 1 Vehicle | 152 (13.8%) | 0 (0.0%) |
| 2 Vehicles | 234 (21.3%) | 45 (90.0%) |
| 3 or more Vehicles | 630 (57.4%) | 5 (10.0%) |
| Total | 1,098 (100.0%) | 50 (100.0%) |
Real Estate & Mortgages in Lake Land Or
Real Estate and Mortgage Overview in Lake Land Or
| Characteristic | Without Mortgage | With Mortgage |
| Housing Units | 201 | 897 |
| Median Property Value | $282,100 | $267,800 |
| Median Household Income | - | - |
| Monthly Housing Costs | $357 | $61 |
| Real Estate Taxes | $1,429 | $0 |
Property Value by Mortgage Status in Lake Land Or
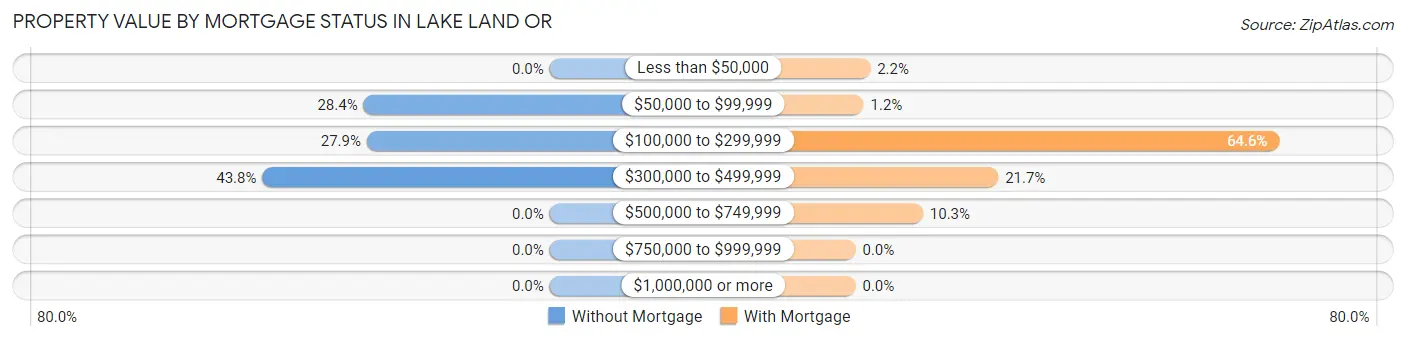
| Property Value | Without Mortgage | With Mortgage |
| Less than $50,000 | 0 (0.0%) | 20 (2.2%) |
| $50,000 to $99,999 | 57 (28.4%) | 11 (1.2%) |
| $100,000 to $299,999 | 56 (27.9%) | 579 (64.5%) |
| $300,000 to $499,999 | 88 (43.8%) | 195 (21.7%) |
| $500,000 to $749,999 | 0 (0.0%) | 92 (10.3%) |
| $750,000 to $999,999 | 0 (0.0%) | 0 (0.0%) |
| $1,000,000 or more | 0 (0.0%) | 0 (0.0%) |
| Total | 201 (100.0%) | 897 (100.0%) |
Household Income by Mortgage Status in Lake Land Or
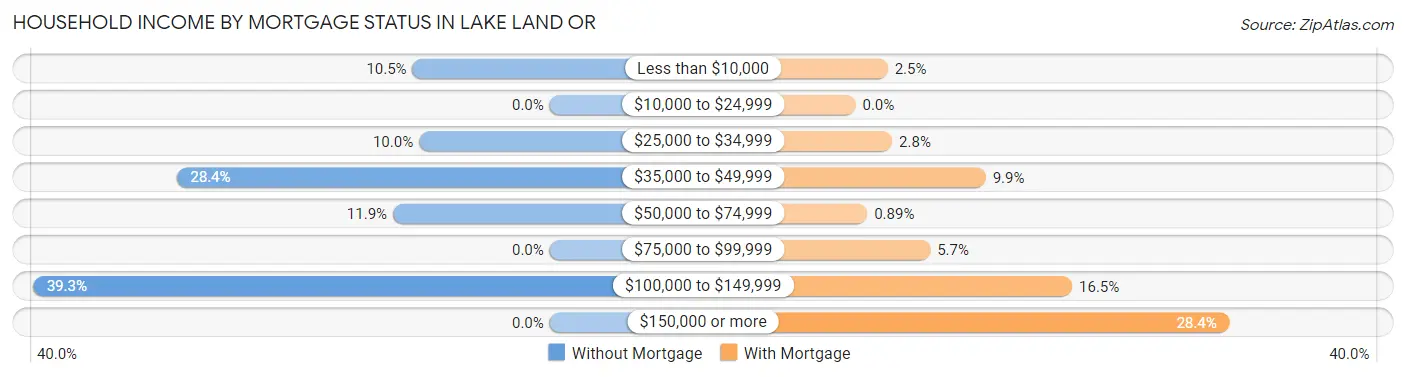
| Household Income | Without Mortgage | With Mortgage |
| Less than $10,000 | 21 (10.4%) | 22 (2.5%) |
| $10,000 to $24,999 | 0 (0.0%) | 0 (0.0%) |
| $25,000 to $34,999 | 20 (10.0%) | 25 (2.8%) |
| $35,000 to $49,999 | 57 (28.4%) | 89 (9.9%) |
| $50,000 to $74,999 | 24 (11.9%) | 8 (0.9%) |
| $75,000 to $99,999 | 0 (0.0%) | 51 (5.7%) |
| $100,000 to $149,999 | 79 (39.3%) | 148 (16.5%) |
| $150,000 or more | 0 (0.0%) | 255 (28.4%) |
| Total | 201 (100.0%) | 897 (100.0%) |
Property Value to Household Income Ratio in Lake Land Or
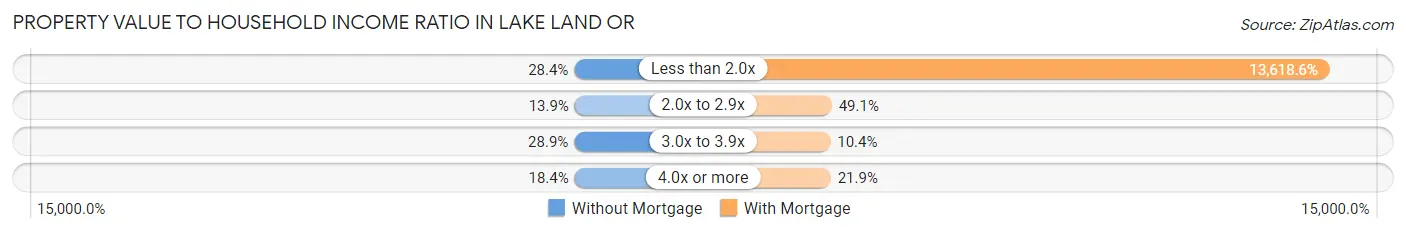
| Value-to-Income Ratio | Without Mortgage | With Mortgage |
| Less than 2.0x | 57 (28.4%) | 122,159 (13,618.6%) |
| 2.0x to 2.9x | 28 (13.9%) | 440 (49.0%) |
| 3.0x to 3.9x | 58 (28.9%) | 93 (10.4%) |
| 4.0x or more | 37 (18.4%) | 196 (21.8%) |
| Total | 201 (100.0%) | 897 (100.0%) |
Real Estate Taxes by Mortgage Status in Lake Land Or
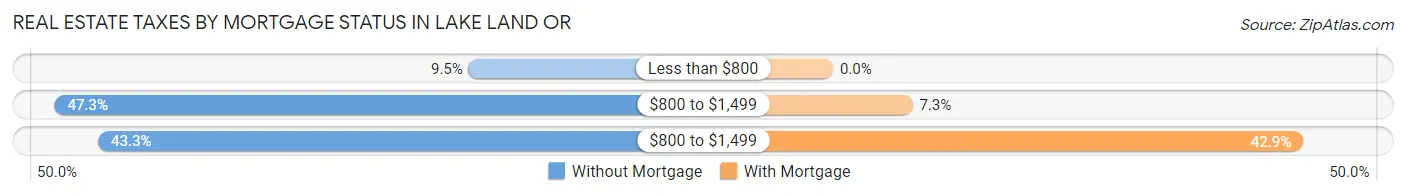
| Property Taxes | Without Mortgage | With Mortgage |
| Less than $800 | 19 (9.5%) | 0 (0.0%) |
| $800 to $1,499 | 95 (47.3%) | 65 (7.2%) |
| $800 to $1,499 | 87 (43.3%) | 385 (42.9%) |
| Total | 201 (100.0%) | 897 (100.0%) |
Health & Disability in Lake Land Or
Health Insurance Coverage by Age in Lake Land Or
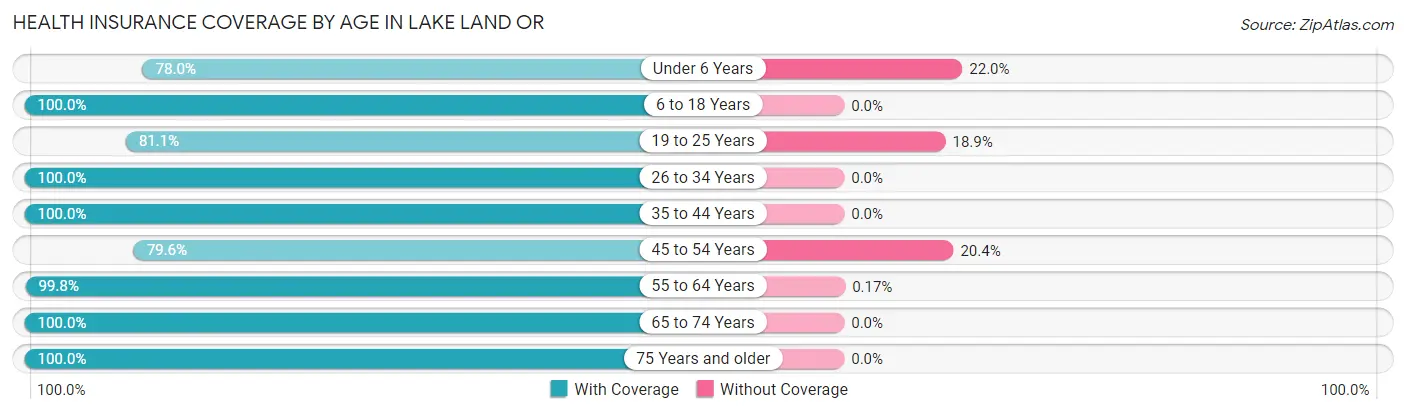
| Age Bracket | With Coverage | Without Coverage |
| Under 6 Years | 294 (78.0%) | 83 (22.0%) |
| 6 to 18 Years | 413 (100.0%) | 0 (0.0%) |
| 19 to 25 Years | 202 (81.1%) | 47 (18.9%) |
| 26 to 34 Years | 244 (100.0%) | 0 (0.0%) |
| 35 to 44 Years | 390 (100.0%) | 0 (0.0%) |
| 45 to 54 Years | 313 (79.6%) | 80 (20.4%) |
| 55 to 64 Years | 604 (99.8%) | 1 (0.2%) |
| 65 to 74 Years | 354 (100.0%) | 0 (0.0%) |
| 75 Years and older | 154 (100.0%) | 0 (0.0%) |
| Total | 2,968 (93.4%) | 211 (6.6%) |
Health Insurance Coverage by Citizenship Status in Lake Land Or
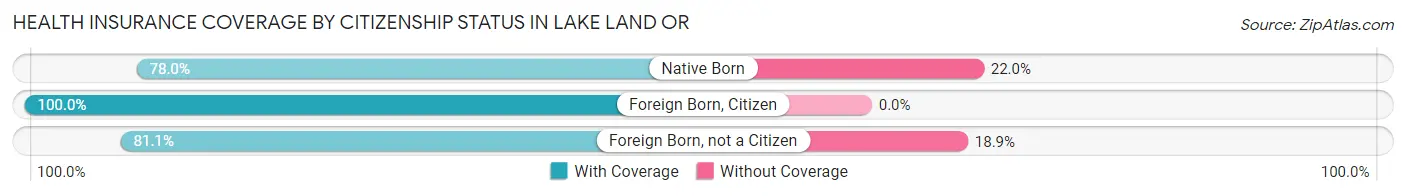
| Citizenship Status | With Coverage | Without Coverage |
| Native Born | 294 (78.0%) | 83 (22.0%) |
| Foreign Born, Citizen | 413 (100.0%) | 0 (0.0%) |
| Foreign Born, not a Citizen | 202 (81.1%) | 47 (18.9%) |
Health Insurance Coverage by Household Income in Lake Land Or
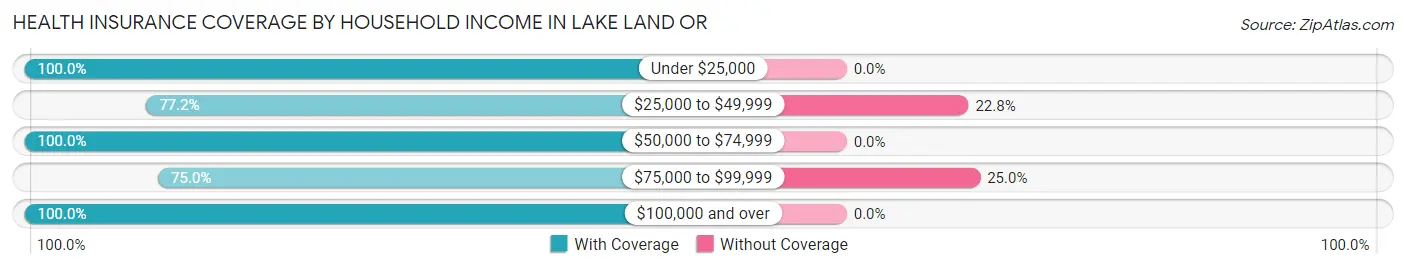
| Household Income | With Coverage | Without Coverage |
| Under $25,000 | 46 (100.0%) | 0 (0.0%) |
| $25,000 to $49,999 | 193 (77.2%) | 57 (22.8%) |
| $50,000 to $74,999 | 107 (100.0%) | 0 (0.0%) |
| $75,000 to $99,999 | 459 (75.0%) | 153 (25.0%) |
| $100,000 and over | 2,158 (100.0%) | 0 (0.0%) |
Public vs Private Health Insurance Coverage by Age in Lake Land Or
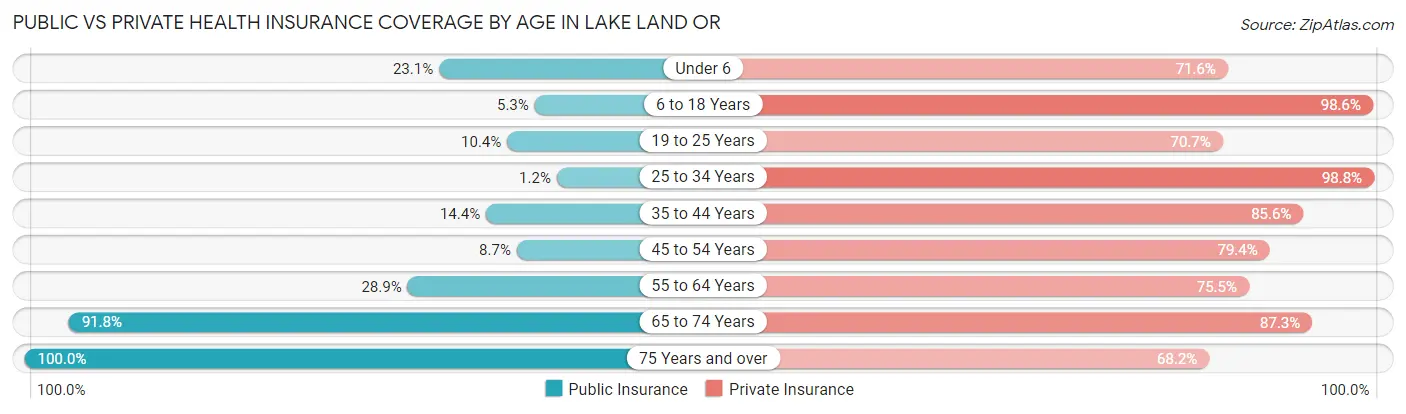
| Age Bracket | Public Insurance | Private Insurance |
| Under 6 | 87 (23.1%) | 270 (71.6%) |
| 6 to 18 Years | 22 (5.3%) | 407 (98.6%) |
| 19 to 25 Years | 26 (10.4%) | 176 (70.7%) |
| 25 to 34 Years | 3 (1.2%) | 241 (98.8%) |
| 35 to 44 Years | 56 (14.4%) | 334 (85.6%) |
| 45 to 54 Years | 34 (8.6%) | 312 (79.4%) |
| 55 to 64 Years | 175 (28.9%) | 457 (75.5%) |
| 65 to 74 Years | 325 (91.8%) | 309 (87.3%) |
| 75 Years and over | 154 (100.0%) | 105 (68.2%) |
| Total | 882 (27.7%) | 2,611 (82.1%) |
Disability Status by Sex by Age in Lake Land Or
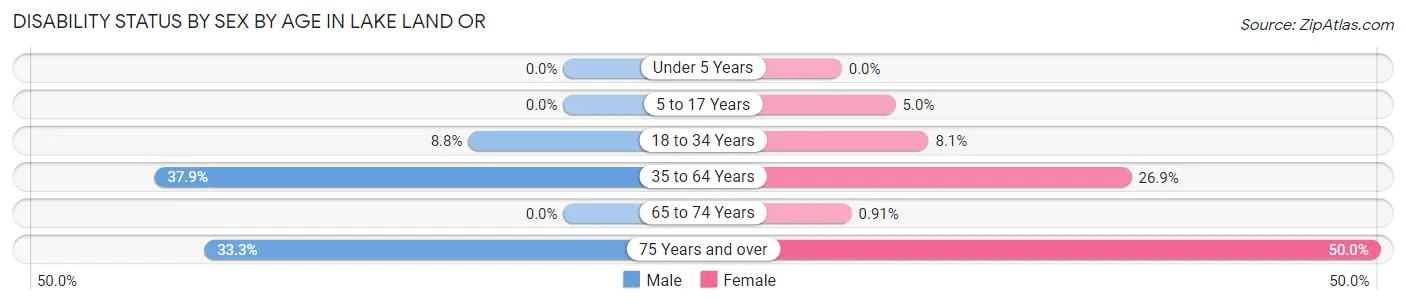
| Age Bracket | Male | Female |
| Under 5 Years | 0 (0.0%) | 0 (0.0%) |
| 5 to 17 Years | 0 (0.0%) | 16 (5.0%) |
| 18 to 34 Years | 15 (8.8%) | 26 (8.1%) |
| 35 to 64 Years | 250 (37.9%) | 196 (26.9%) |
| 65 to 74 Years | 0 (0.0%) | 1 (0.9%) |
| 75 Years and over | 14 (33.3%) | 56 (50.0%) |
Disability Class by Sex by Age in Lake Land Or
Disability Class: Hearing Difficulty
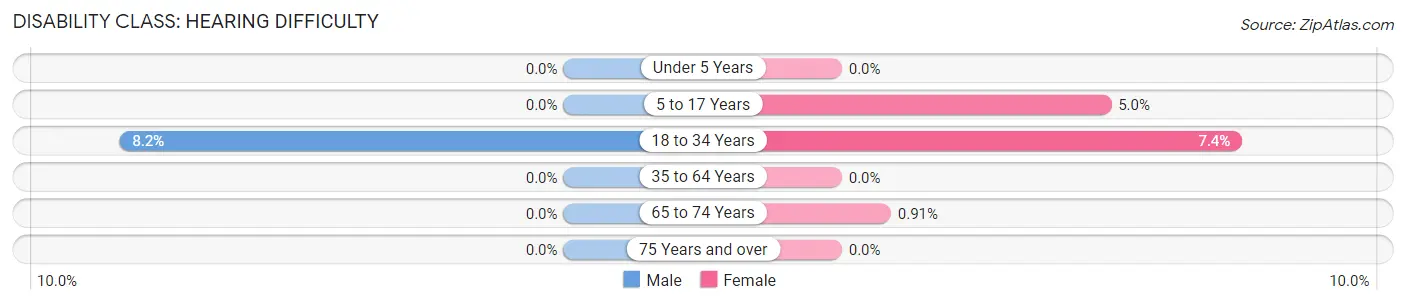
| Age Bracket | Male | Female |
| Under 5 Years | 0 (0.0%) | 0 (0.0%) |
| 5 to 17 Years | 0 (0.0%) | 16 (5.0%) |
| 18 to 34 Years | 14 (8.2%) | 24 (7.4%) |
| 35 to 64 Years | 0 (0.0%) | 0 (0.0%) |
| 65 to 74 Years | 0 (0.0%) | 1 (0.9%) |
| 75 Years and over | 0 (0.0%) | 0 (0.0%) |
Disability Class: Vision Difficulty
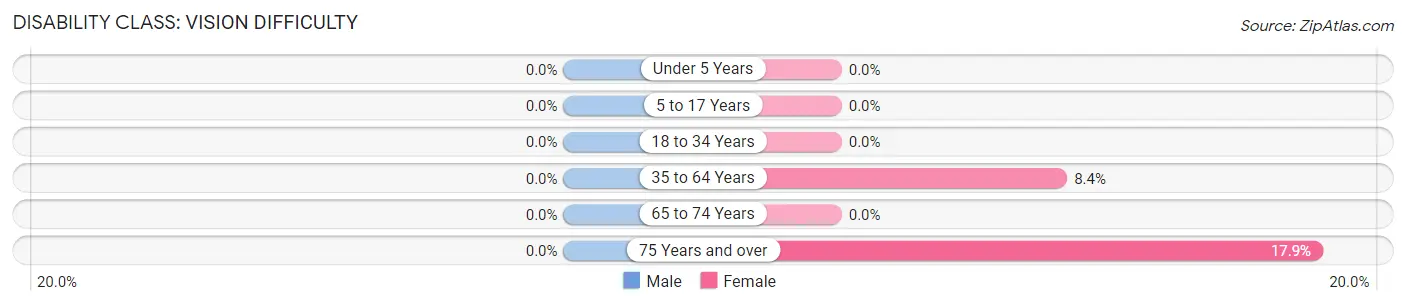
| Age Bracket | Male | Female |
| Under 5 Years | 0 (0.0%) | 0 (0.0%) |
| 5 to 17 Years | 0 (0.0%) | 0 (0.0%) |
| 18 to 34 Years | 0 (0.0%) | 0 (0.0%) |
| 35 to 64 Years | 0 (0.0%) | 61 (8.4%) |
| 65 to 74 Years | 0 (0.0%) | 0 (0.0%) |
| 75 Years and over | 0 (0.0%) | 20 (17.9%) |
Disability Class: Cognitive Difficulty
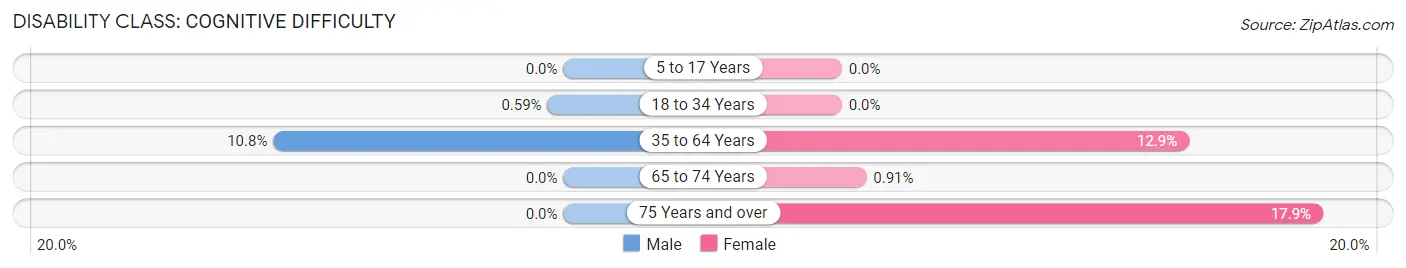
| Age Bracket | Male | Female |
| 5 to 17 Years | 0 (0.0%) | 0 (0.0%) |
| 18 to 34 Years | 1 (0.6%) | 0 (0.0%) |
| 35 to 64 Years | 71 (10.8%) | 94 (12.9%) |
| 65 to 74 Years | 0 (0.0%) | 1 (0.9%) |
| 75 Years and over | 0 (0.0%) | 20 (17.9%) |
Disability Class: Ambulatory Difficulty
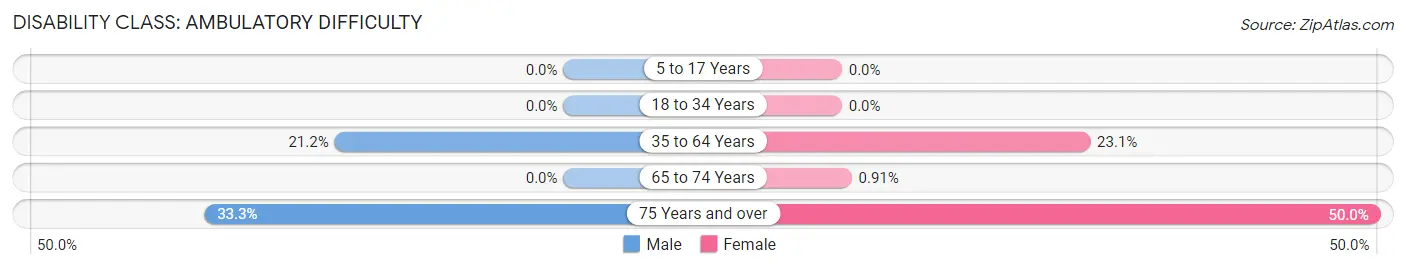
| Age Bracket | Male | Female |
| 5 to 17 Years | 0 (0.0%) | 0 (0.0%) |
| 18 to 34 Years | 0 (0.0%) | 0 (0.0%) |
| 35 to 64 Years | 140 (21.2%) | 168 (23.1%) |
| 65 to 74 Years | 0 (0.0%) | 1 (0.9%) |
| 75 Years and over | 14 (33.3%) | 56 (50.0%) |
Disability Class: Self-Care Difficulty
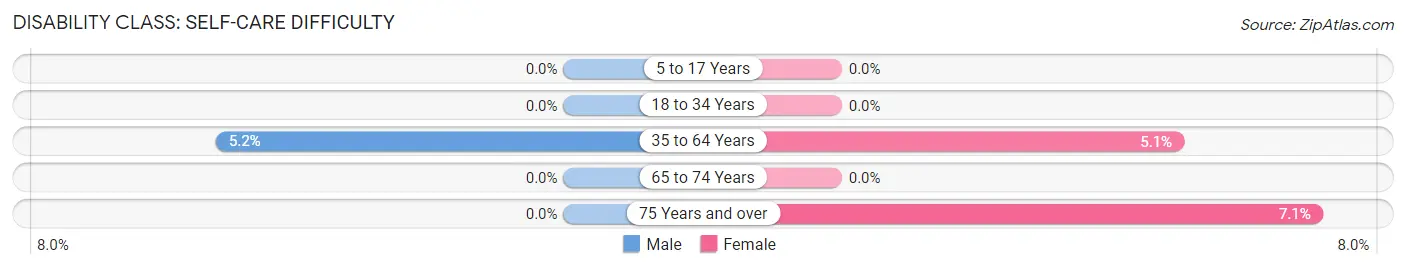
| Age Bracket | Male | Female |
| 5 to 17 Years | 0 (0.0%) | 0 (0.0%) |
| 18 to 34 Years | 0 (0.0%) | 0 (0.0%) |
| 35 to 64 Years | 34 (5.2%) | 37 (5.1%) |
| 65 to 74 Years | 0 (0.0%) | 0 (0.0%) |
| 75 Years and over | 0 (0.0%) | 8 (7.1%) |
Technology Access in Lake Land Or
Computing Device Access in Lake Land Or
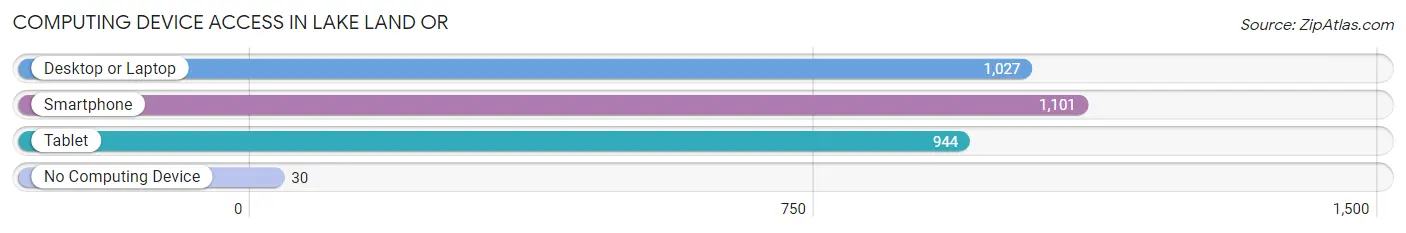
| Device Type | # Households | % Households |
| Desktop or Laptop | 1,027 | 89.5% |
| Smartphone | 1,101 | 95.9% |
| Tablet | 944 | 82.2% |
| No Computing Device | 30 | 2.6% |
| Total | 1,148 | 100.0% |
Internet Access in Lake Land Or
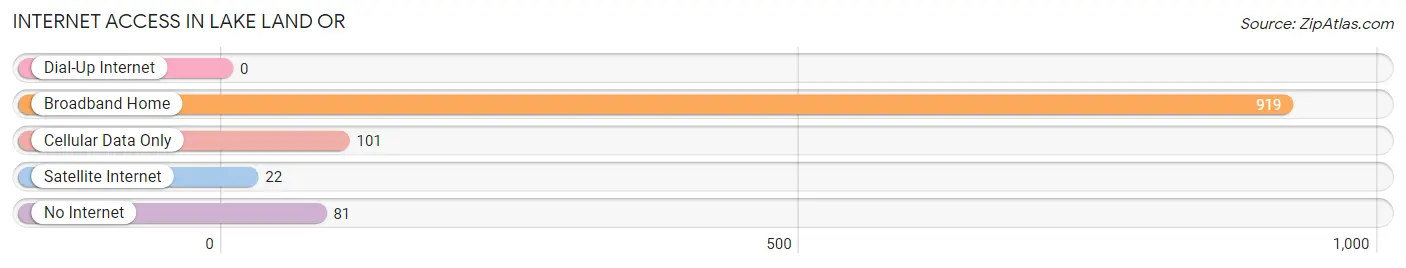
| Internet Type | # Households | % Households |
| Dial-Up Internet | 0 | 0.0% |
| Broadband Home | 919 | 80.0% |
| Cellular Data Only | 101 | 8.8% |
| Satellite Internet | 22 | 1.9% |
| No Internet | 81 | 7.1% |
| Total | 1,148 | 100.0% |
Lake Land Or Summary
Lake Land Or, Virginia is a small town located in the heart of the Shenandoah Valley in the United States. It is situated in the northern part of the state, just south of the Blue Ridge Mountains. The town is home to a population of just over 1,000 people, and is known for its rural charm and small-town atmosphere.
History
The area that is now Lake Land Or was first settled in the late 1700s by a group of German immigrants. The town was originally known as “Landsberg”, and was named after the German city of Landsberg am Lech. The town was officially incorporated in 1891, and the name was changed to Lake Land Or in 1895.
The town was originally a farming community, and the main crops grown were corn, wheat, and hay. The town also had a number of small businesses, including a general store, a blacksmith, and a sawmill.
In the early 1900s, the town began to grow and develop. The railroad came to town in 1906, and the town began to attract more visitors and businesses. The town also became a popular destination for tourists, and the town’s population began to grow.
Geography
Lake Land Or is located in the northern part of Virginia, just south of the Blue Ridge Mountains. The town is situated in the Shenandoah Valley, and is surrounded by rolling hills and lush forests. The town is located near the Shenandoah River, and is just a short drive from the Appalachian Trail.
The town is located in the Shenandoah Valley AVA, which is a designated American Viticultural Area. This area is known for its production of high-quality wines, and the town is home to several wineries.
Economy
The economy of Lake Land Or is largely based on tourism and agriculture. The town is home to several wineries, and the town’s economy is largely dependent on the wine industry. The town also has a number of small businesses, including restaurants, shops, and galleries.
The town is also home to a number of outdoor recreation activities, including hiking, fishing, and camping. The town is also home to a number of historic sites, including the Lake Land Or Historic District.
Demographics
As of the 2010 census, the population of Lake Land Or was 1,072. The town is predominantly white, with a population that is 97.2% white. The town also has a small Hispanic population, with a population that is 1.3% Hispanic. The town also has a small African American population, with a population that is 0.7% African American.
The median household income in Lake Land Or is $45,000, and the median home value is $150,000. The town has a low unemployment rate, with a rate of just 3.2%. The town also has a low poverty rate, with a rate of just 8.2%.
Conclusion
Lake Land Or is a small town located in the heart of the Shenandoah Valley in the United States. The town is known for its rural charm and small-town atmosphere, and is home to a population of just over 1,000 people. The town’s economy is largely based on tourism and agriculture, and the town is home to several wineries and outdoor recreation activities. The town is predominantly white, with a population that is 97.2% white. The median household income in Lake Land Or is $45,000, and the median home value is $150,000.
Common Questions
What is Per Capita Income in Lake Land Or?
Per Capita income in Lake Land Or is $41,915.
What is the Median Family Income in Lake Land Or?
Median Family Income in Lake Land Or is $118,750.
What is the Median Household income in Lake Land Or?
Median Household Income in Lake Land Or is $112,833.
What is Income or Wage Gap in Lake Land Or?
Income or Wage Gap in Lake Land Or is 56.8%.
Women in Lake Land Or earn 43.2 cents for every dollar earned by a man.
What is Inequality or Gini Index in Lake Land Or?
Inequality or Gini Index in Lake Land Or is 0.30.
What is the Total Population of Lake Land Or?
Total Population of Lake Land Or is 3,179.
What is the Total Male Population of Lake Land Or?
Total Male Population of Lake Land Or is 1,378.
What is the Total Female Population of Lake Land Or?
Total Female Population of Lake Land Or is 1,801.
What is the Ratio of Males per 100 Females in Lake Land Or?
There are 76.51 Males per 100 Females in Lake Land Or.
What is the Ratio of Females per 100 Males in Lake Land Or?
There are 130.70 Females per 100 Males in Lake Land Or.
What is the Median Population Age in Lake Land Or?
Median Population Age in Lake Land Or is 38.5 Years.
What is the Average Family Size in Lake Land Or
Average Family Size in Lake Land Or is 3.1 People.
What is the Average Household Size in Lake Land Or
Average Household Size in Lake Land Or is 2.8 People.
How Large is the Labor Force in Lake Land Or?
There are 1,688 People in the Labor Forcein in Lake Land Or.
What is the Percentage of People in the Labor Force in Lake Land Or?
68.9% of People are in the Labor Force in Lake Land Or.
What is the Unemployment Rate in Lake Land Or?
Unemployment Rate in Lake Land Or is 3.7%.