Amelia Court House, VA Map & Demographics
Amelia Court House Map
Amelia Court House Overview
$24,425
PER CAPITA INCOME
$70,950
AVG FAMILY INCOME
$39,186
AVG HOUSEHOLD INCOME
0.33
INEQUALITY / GINI INDEX
916
TOTAL POPULATION
460
MALE POPULATION
456
FEMALE POPULATION
100.88
MALES / 100 FEMALES
99.13
FEMALES / 100 MALES
35.4
MEDIAN AGE
4.5
AVG FAMILY SIZE
2.9
AVG HOUSEHOLD SIZE
382
LABOR FORCE [ PEOPLE ]
58.9%
PERCENT IN LABOR FORCE
17.0%
UNEMPLOYMENT RATE
Amelia Court House Zip Codes
Amelia Court House Area Codes
Income in Amelia Court House
Income Overview in Amelia Court House
Per Capita Income in Amelia Court House is $24,425, while median incomes of families and households are $70,950 and $39,186 respectively.
| Characteristic | Number | Measure |
| Per Capita Income | 916 | $24,425 |
| Median Family Income | 152 | $70,950 |
| Mean Family Income | 152 | $75,607 |
| Median Household Income | 279 | $39,186 |
| Mean Household Income | 279 | $58,032 |
| Income Deficit | 152 | $0 |
| Wage / Income Gap (%) | 916 | 0.00% |
| Wage / Income Gap ($) | 916 | 100.00¢ per $1 |
| Gini / Inequality Index | 916 | 0.33 |
Earnings by Sex in Amelia Court House
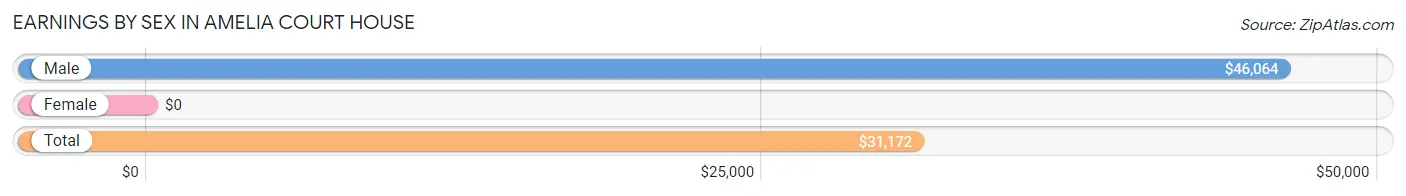
| Sex | Number | Average Earnings |
| Male | 222 (51.5%) | $46,064 |
| Female | 209 (48.5%) | $0 |
| Total | 431 (100.0%) | $31,172 |
Earnings by Sex by Income Bracket in Amelia Court House
The most common earnings brackets in Amelia Court House are $75,000 to $99,999 for men (72 | 32.4%) and $2,499 or less for women (49 | 23.4%).
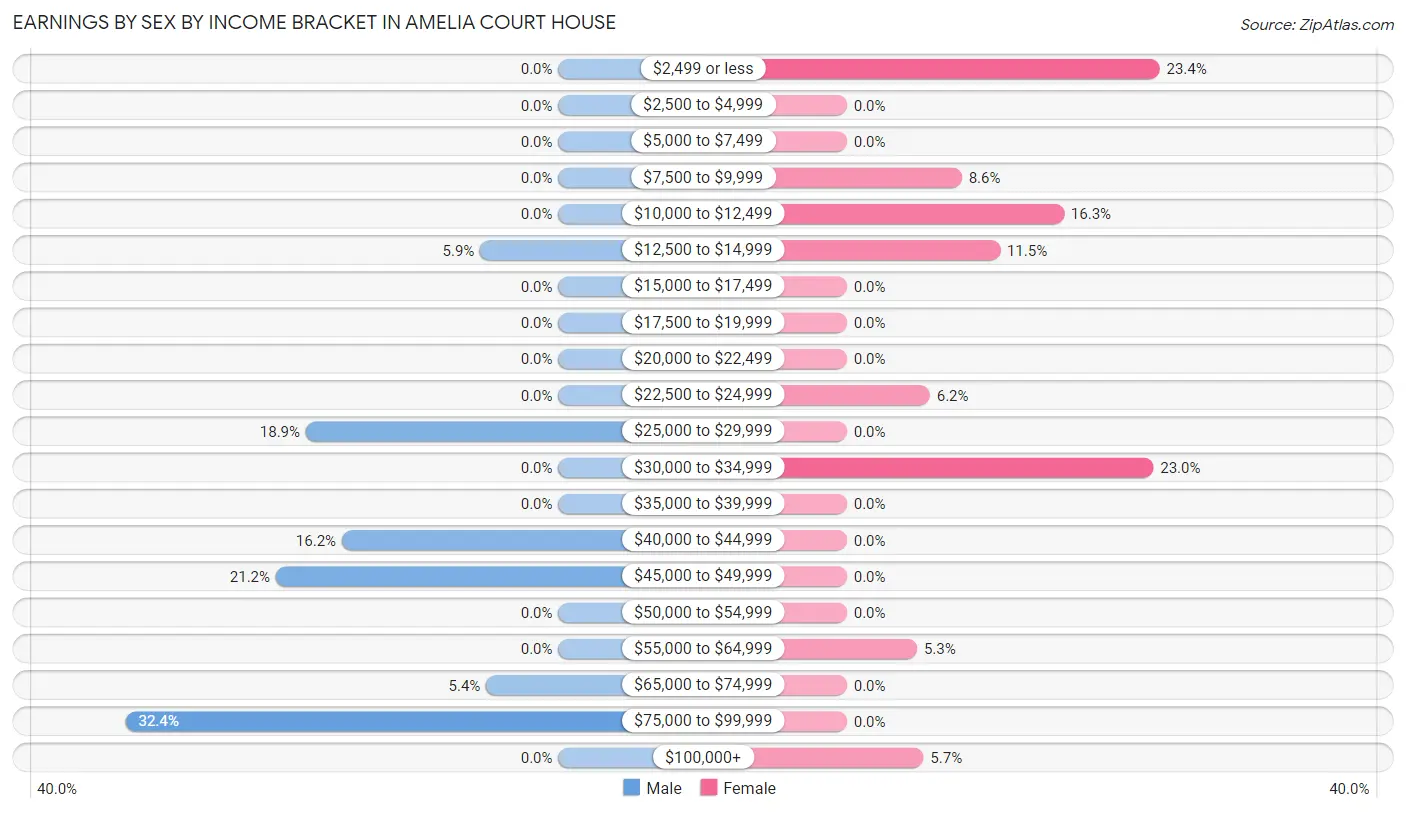
| Income | Male | Female |
| $2,499 or less | 0 (0.0%) | 49 (23.4%) |
| $2,500 to $4,999 | 0 (0.0%) | 0 (0.0%) |
| $5,000 to $7,499 | 0 (0.0%) | 0 (0.0%) |
| $7,500 to $9,999 | 0 (0.0%) | 18 (8.6%) |
| $10,000 to $12,499 | 0 (0.0%) | 34 (16.3%) |
| $12,500 to $14,999 | 13 (5.9%) | 24 (11.5%) |
| $15,000 to $17,499 | 0 (0.0%) | 0 (0.0%) |
| $17,500 to $19,999 | 0 (0.0%) | 0 (0.0%) |
| $20,000 to $22,499 | 0 (0.0%) | 0 (0.0%) |
| $22,500 to $24,999 | 0 (0.0%) | 13 (6.2%) |
| $25,000 to $29,999 | 42 (18.9%) | 0 (0.0%) |
| $30,000 to $34,999 | 0 (0.0%) | 48 (23.0%) |
| $35,000 to $39,999 | 0 (0.0%) | 0 (0.0%) |
| $40,000 to $44,999 | 36 (16.2%) | 0 (0.0%) |
| $45,000 to $49,999 | 47 (21.2%) | 0 (0.0%) |
| $50,000 to $54,999 | 0 (0.0%) | 0 (0.0%) |
| $55,000 to $64,999 | 0 (0.0%) | 11 (5.3%) |
| $65,000 to $74,999 | 12 (5.4%) | 0 (0.0%) |
| $75,000 to $99,999 | 72 (32.4%) | 0 (0.0%) |
| $100,000+ | 0 (0.0%) | 12 (5.7%) |
| Total | 222 (100.0%) | 209 (100.0%) |
Earnings by Sex by Educational Attainment in Amelia Court House
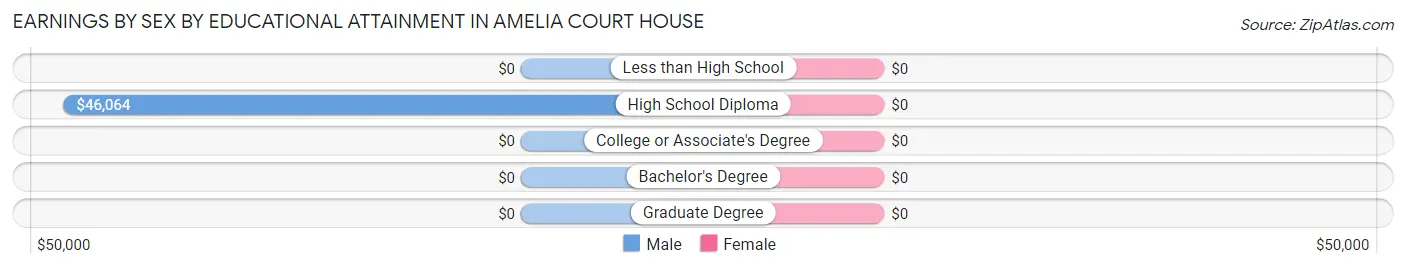
| Educational Attainment | Male Income | Female Income |
| Less than High School | - | - |
| High School Diploma | $46,064 | $0 |
| College or Associate's Degree | - | - |
| Bachelor's Degree | - | - |
| Graduate Degree | - | - |
| Total | $46,064 | $0 |
Family Income in Amelia Court House
Family Income Brackets in Amelia Court House
According to the Amelia Court House family income data, there are 50 families falling into the $50,000 to $74,999 income range, which is the most common income bracket and makes up 32.9% of all families.
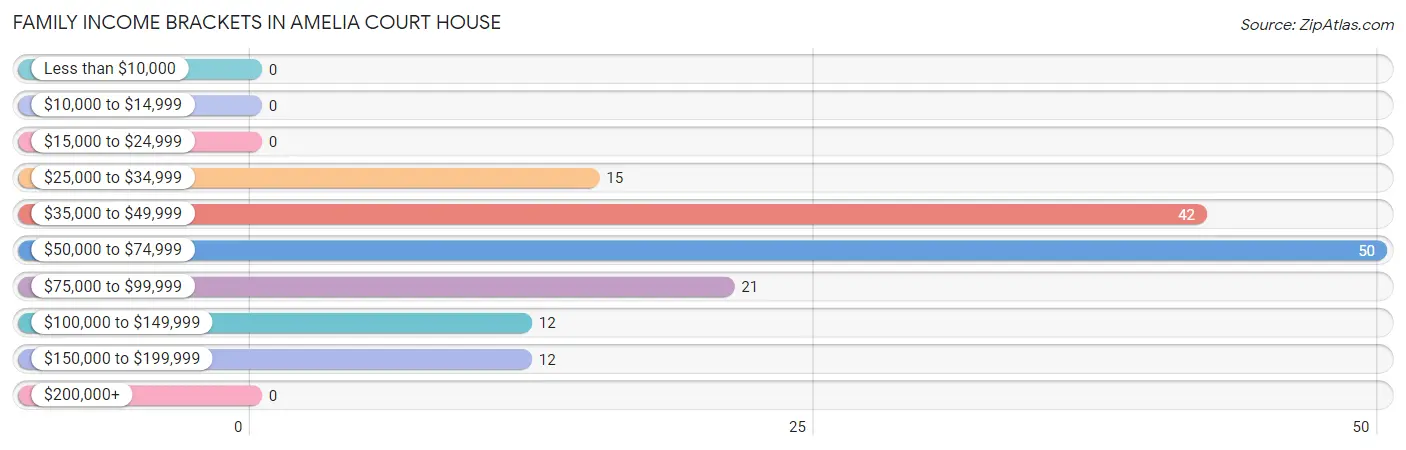
| Income Bracket | # Families | % Families |
| Less than $10,000 | 0 | 0.0% |
| $10,000 to $14,999 | 0 | 0.0% |
| $15,000 to $24,999 | 0 | 0.0% |
| $25,000 to $34,999 | 15 | 9.9% |
| $35,000 to $49,999 | 42 | 27.6% |
| $50,000 to $74,999 | 50 | 32.9% |
| $75,000 to $99,999 | 21 | 13.8% |
| $100,000 to $149,999 | 12 | 7.9% |
| $150,000 to $199,999 | 12 | 7.9% |
| $200,000+ | 0 | 0.0% |
Family Income by Famaliy Size in Amelia Court House
| Income Bracket | # Families | Median Income |
| 2-Person Families | 41 (27.0%) | $0 |
| 3-Person Families | 12 (7.9%) | $0 |
| 4-Person Families | 57 (37.5%) | $0 |
| 5-Person Families | 0 (0.0%) | $0 |
| 6-Person Families | 0 (0.0%) | $0 |
| 7+ Person Families | 42 (27.6%) | $0 |
| Total | 152 (100.0%) | $70,950 |
Family Income by Number of Earners in Amelia Court House
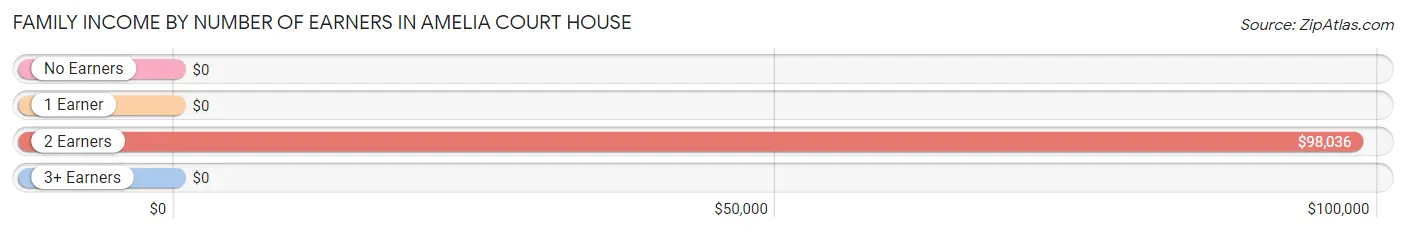
| Number of Earners | # Families | Median Income |
| No Earners | 29 (19.1%) | $0 |
| 1 Earner | 0 (0.0%) | $0 |
| 2 Earners | 81 (53.3%) | $98,036 |
| 3+ Earners | 42 (27.6%) | $0 |
| Total | 152 (100.0%) | $70,950 |
Household Income in Amelia Court House
Household Income Brackets in Amelia Court House
With 95 households falling in the category, the $25,000 to $34,999 income range is the most frequent in Amelia Court House, accounting for 34.1% of all households.
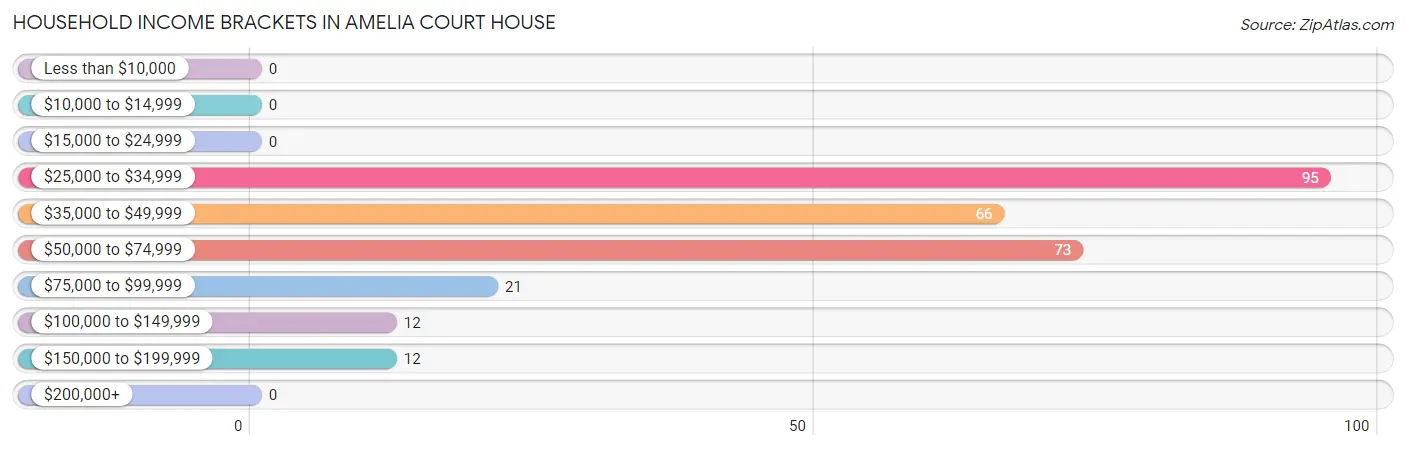
| Income Bracket | # Households | % Households |
| Less than $10,000 | 0 | 0.0% |
| $10,000 to $14,999 | 0 | 0.0% |
| $15,000 to $24,999 | 0 | 0.0% |
| $25,000 to $34,999 | 95 | 34.1% |
| $35,000 to $49,999 | 66 | 23.7% |
| $50,000 to $74,999 | 73 | 26.2% |
| $75,000 to $99,999 | 21 | 7.5% |
| $100,000 to $149,999 | 12 | 4.3% |
| $150,000 to $199,999 | 12 | 4.3% |
| $200,000+ | 0 | 0.0% |
Household Income by Householder Age in Amelia Court House
The median household income in Amelia Court House is $39,186, with the highest median household income of $38,883 found in the 45 to 64 years age bracket for the primary householder. A total of 129 households (46.2%) fall into this category.
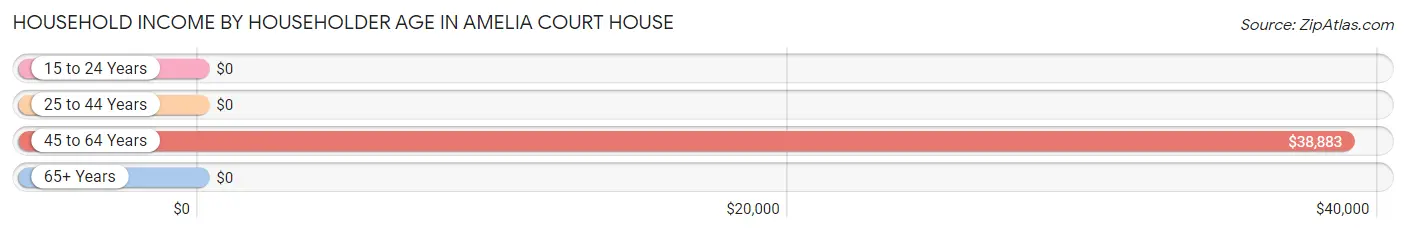
| Income Bracket | # Households | Median Income |
| 15 to 24 Years | 0 (0.0%) | $0 |
| 25 to 44 Years | 57 (20.4%) | $0 |
| 45 to 64 Years | 129 (46.2%) | $38,883 |
| 65+ Years | 93 (33.3%) | $0 |
| Total | 279 (100.0%) | $39,186 |
Poverty in Amelia Court House
Income Below Poverty by Sex and Age in Amelia Court House
With 46.7% poverty level for males and 18.9% for females among the residents of Amelia Court House, 5 year old males and 25 to 34 year old females are the most vulnerable to poverty, with 41 males (100.0%) and 34 females (65.4%) in their respective age groups living below the poverty level.
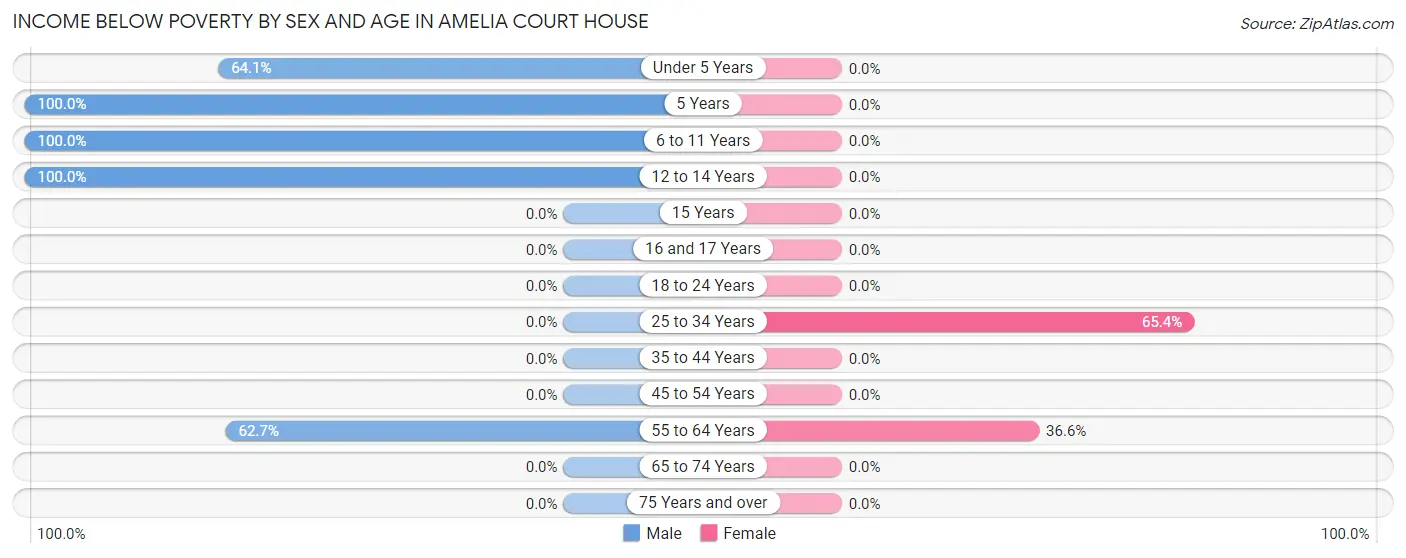
| Age Bracket | Male | Female |
| Under 5 Years | 41 (64.1%) | 0 (0.0%) |
| 5 Years | 41 (100.0%) | 0 (0.0%) |
| 6 to 11 Years | 41 (100.0%) | 0 (0.0%) |
| 12 to 14 Years | 40 (100.0%) | 0 (0.0%) |
| 15 Years | 0 (0.0%) | 0 (0.0%) |
| 16 and 17 Years | 0 (0.0%) | 0 (0.0%) |
| 18 to 24 Years | 0 (0.0%) | 0 (0.0%) |
| 25 to 34 Years | 0 (0.0%) | 34 (65.4%) |
| 35 to 44 Years | 0 (0.0%) | 0 (0.0%) |
| 45 to 54 Years | 0 (0.0%) | 0 (0.0%) |
| 55 to 64 Years | 42 (62.7%) | 37 (36.6%) |
| 65 to 74 Years | 0 (0.0%) | 0 (0.0%) |
| 75 Years and over | 0 (0.0%) | 0 (0.0%) |
| Total | 205 (46.7%) | 71 (18.9%) |
Income Above Poverty by Sex and Age in Amelia Court House
According to the poverty statistics in Amelia Court House, males aged 25 to 34 years and females aged under 5 years are the age groups that are most secure financially, with 100.0% of males and 100.0% of females in these age groups living above the poverty line.
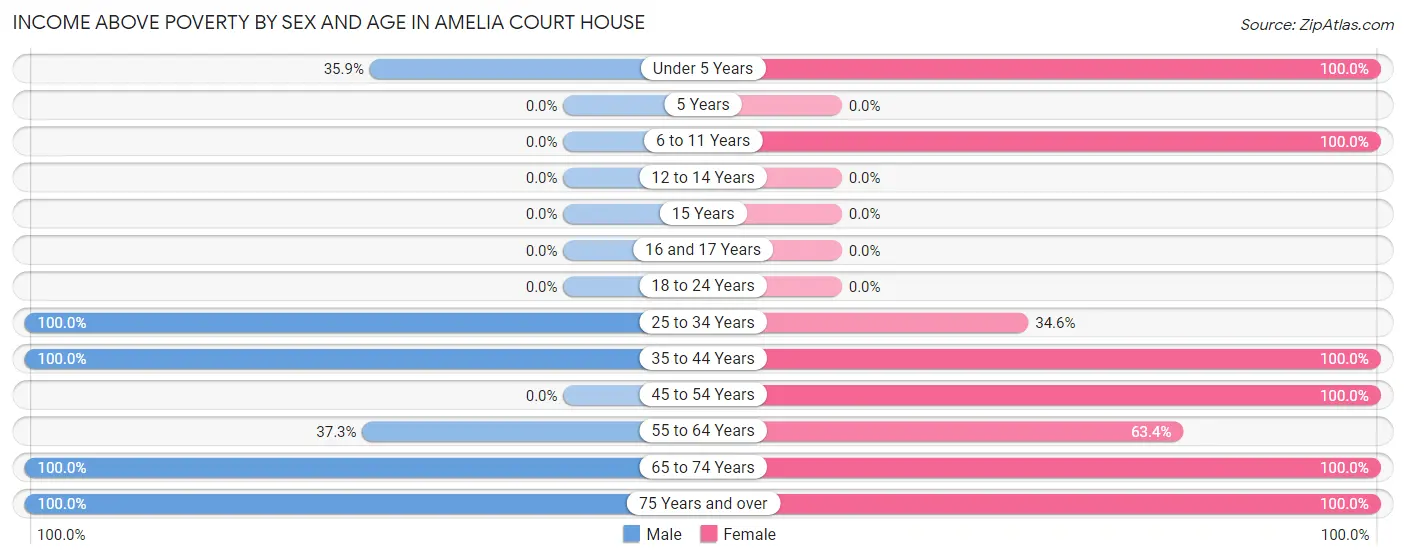
| Age Bracket | Male | Female |
| Under 5 Years | 23 (35.9%) | 24 (100.0%) |
| 5 Years | 0 (0.0%) | 0 (0.0%) |
| 6 to 11 Years | 0 (0.0%) | 57 (100.0%) |
| 12 to 14 Years | 0 (0.0%) | 0 (0.0%) |
| 15 Years | 0 (0.0%) | 0 (0.0%) |
| 16 and 17 Years | 0 (0.0%) | 0 (0.0%) |
| 18 to 24 Years | 0 (0.0%) | 0 (0.0%) |
| 25 to 34 Years | 119 (100.0%) | 18 (34.6%) |
| 35 to 44 Years | 36 (100.0%) | 48 (100.0%) |
| 45 to 54 Years | 0 (0.0%) | 11 (100.0%) |
| 55 to 64 Years | 25 (37.3%) | 64 (63.4%) |
| 65 to 74 Years | 21 (100.0%) | 14 (100.0%) |
| 75 Years and over | 10 (100.0%) | 69 (100.0%) |
| Total | 234 (53.3%) | 305 (81.1%) |
Income Below Poverty Among Married-Couple Families in Amelia Court House
The poverty statistics for married-couple families in Amelia Court House show that 30.0% or 42 of the total 140 families live below the poverty line. Families with 3 or 4 children have the highest poverty rate of 100.0%, comprising of 42 families. On the other hand, families with no children have the lowest poverty rate of 0.0%, which includes 0 families.
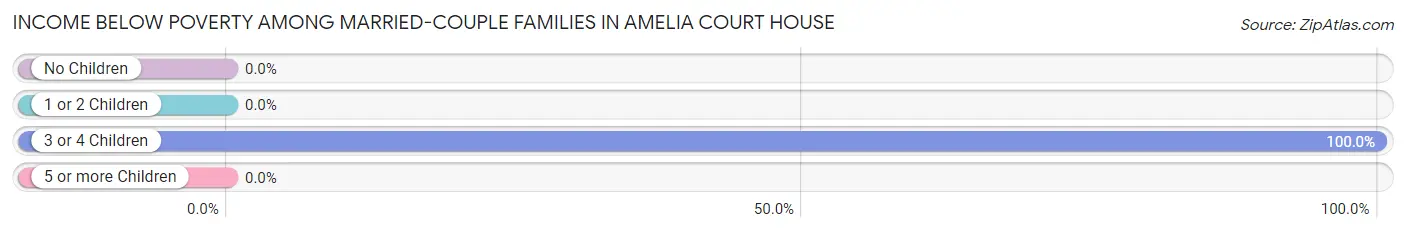
| Children | Above Poverty | Below Poverty |
| No Children | 41 (100.0%) | 0 (0.0%) |
| 1 or 2 Children | 57 (100.0%) | 0 (0.0%) |
| 3 or 4 Children | 0 (0.0%) | 42 (100.0%) |
| 5 or more Children | 0 (0.0%) | 0 (0.0%) |
| Total | 98 (70.0%) | 42 (30.0%) |
Income Below Poverty Among Single-Parent Households in Amelia Court House
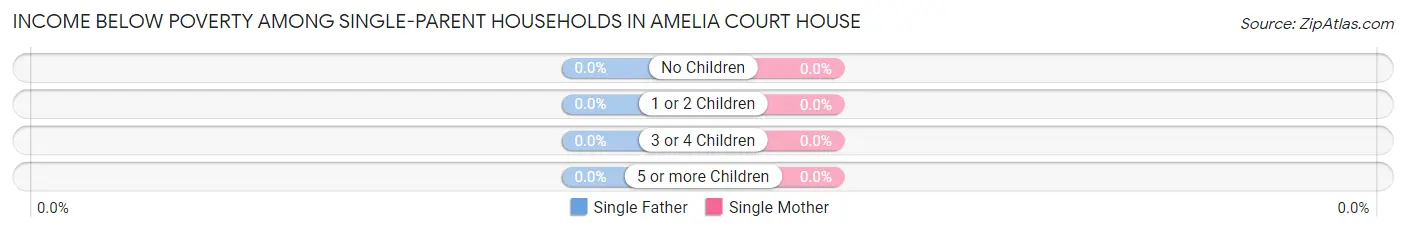
| Children | Single Father | Single Mother |
| No Children | 0 (0.0%) | 0 (0.0%) |
| 1 or 2 Children | 0 (0.0%) | 0 (0.0%) |
| 3 or 4 Children | 0 (0.0%) | 0 (0.0%) |
| 5 or more Children | 0 (0.0%) | 0 (0.0%) |
| Total | 0 (0.0%) | 0 (0.0%) |
Income Below Poverty Among Married-Couple vs Single-Parent Households in Amelia Court House
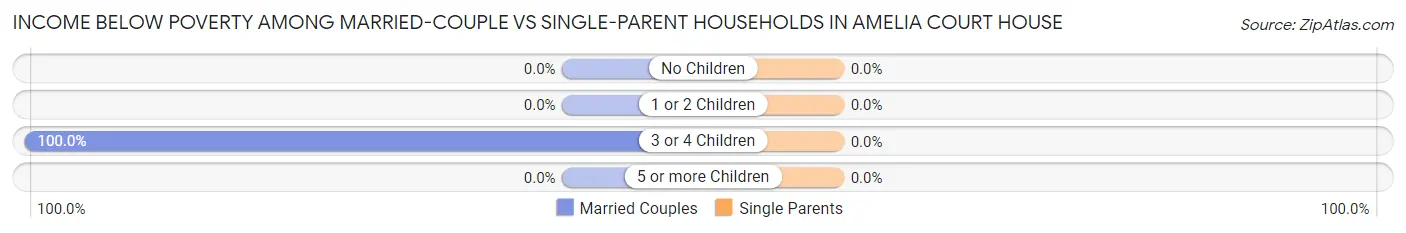
| Children | Married-Couple Families | Single-Parent Households |
| No Children | 0 (0.0%) | 0 (0.0%) |
| 1 or 2 Children | 0 (0.0%) | 0 (0.0%) |
| 3 or 4 Children | 42 (100.0%) | 0 (0.0%) |
| 5 or more Children | 0 (0.0%) | 0 (0.0%) |
| Total | 42 (30.0%) | 0 (0.0%) |
Race in Amelia Court House
The most populous races in Amelia Court House are White / Caucasian (462 | 50.4%), Black / African American (267 | 29.1%), and Two or more Races (187 | 20.4%).
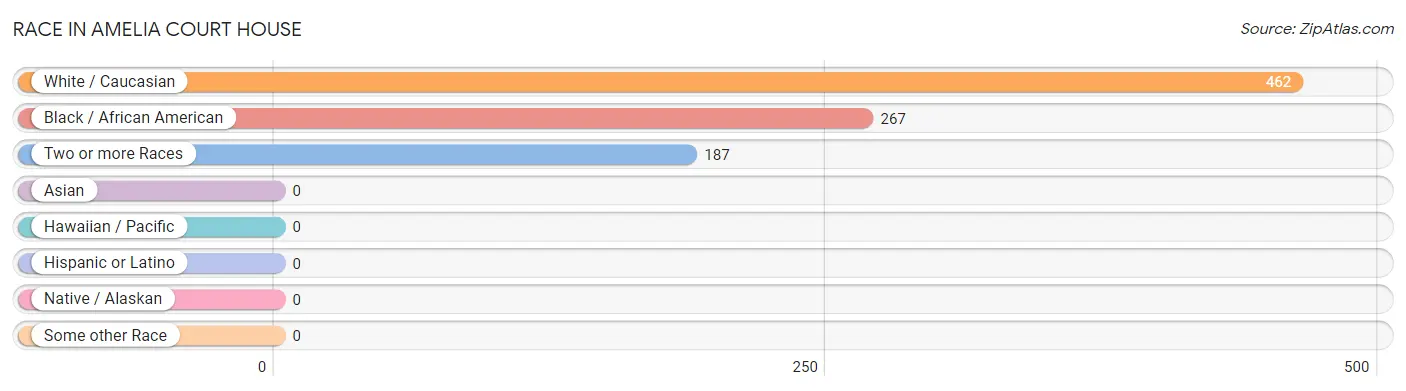
| Race | # Population | % Population |
| Asian | 0 | 0.0% |
| Black / African American | 267 | 29.1% |
| Hawaiian / Pacific | 0 | 0.0% |
| Hispanic or Latino | 0 | 0.0% |
| Native / Alaskan | 0 | 0.0% |
| White / Caucasian | 462 | 50.4% |
| Two or more Races | 187 | 20.4% |
| Some other Race | 0 | 0.0% |
| Total | 916 | 100.0% |
Ancestry in Amelia Court House
The most populous ancestries reported in Amelia Court House are Irish (301 | 32.9%), French (276 | 30.1%), American (84 | 9.2%), Cherokee (24 | 2.6%), and German (23 | 2.5%), together accounting for 77.3% of all Amelia Court House residents.
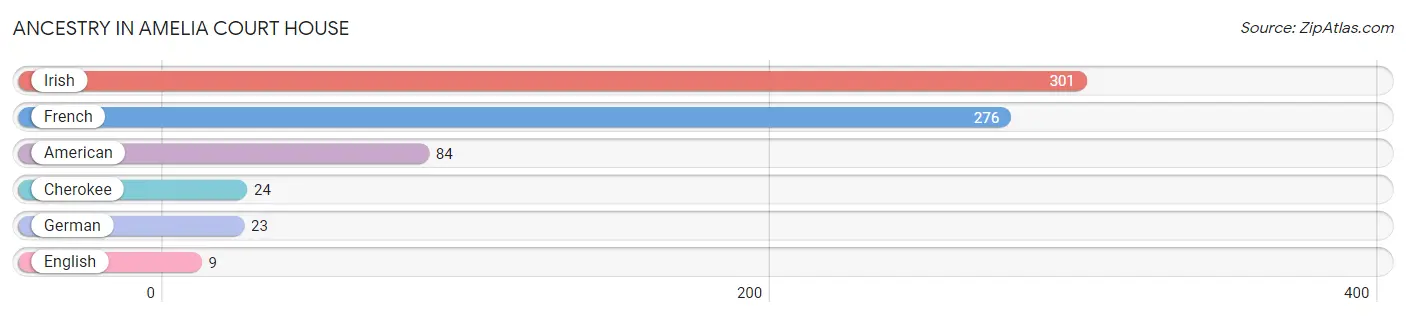
| Ancestry | # Population | % Population |
| American | 84 | 9.2% |
| Cherokee | 24 | 2.6% |
| English | 9 | 1.0% |
| French | 276 | 30.1% |
| German | 23 | 2.5% |
| Irish | 301 | 32.9% | View All 6 Rows |
Immigrants in Amelia Court House

| Immigration Origin | # Population | % Population | View All 0 Rows |
Sex and Age in Amelia Court House
Sex and Age in Amelia Court House
The most populous age groups in Amelia Court House are 30 to 34 Years (119 | 25.9%) for men and 55 to 59 Years (101 | 22.2%) for women.
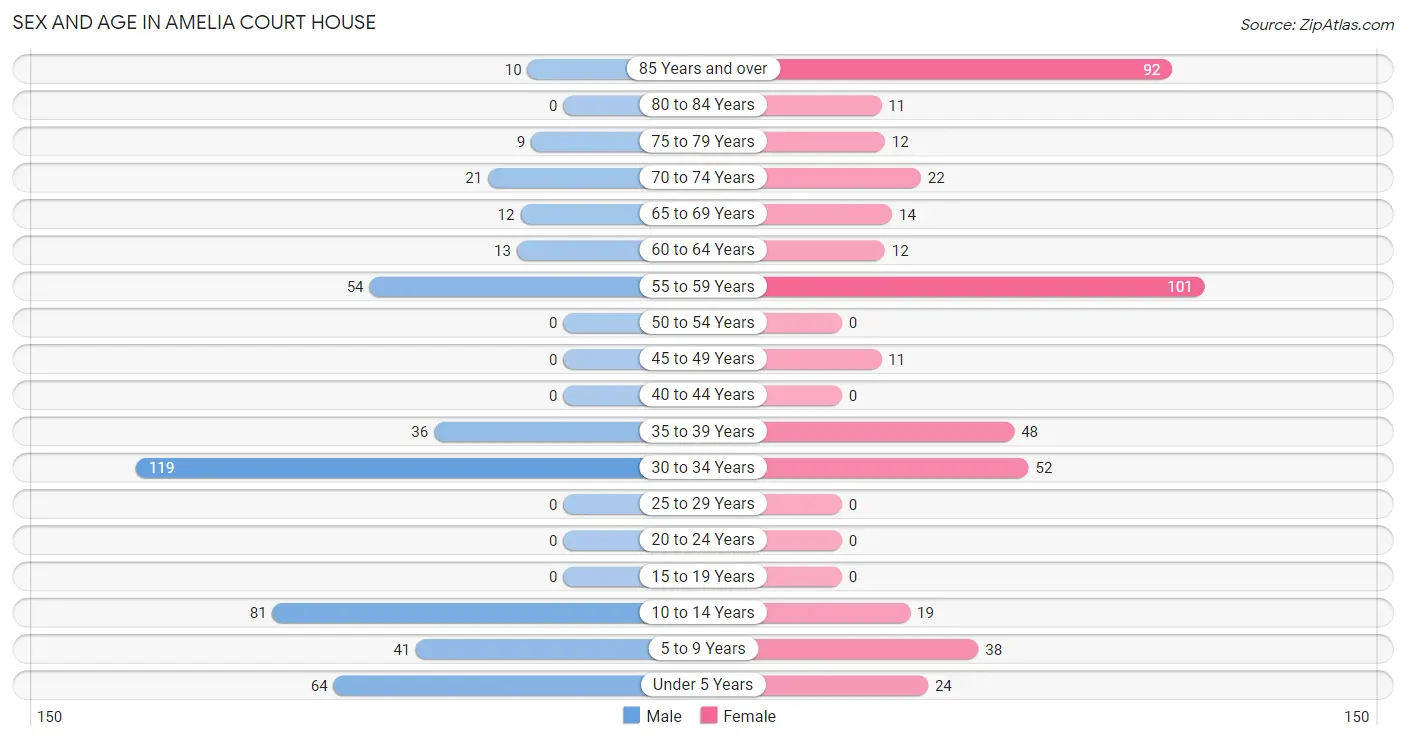
| Age Bracket | Male | Female |
| Under 5 Years | 64 (13.9%) | 24 (5.3%) |
| 5 to 9 Years | 41 (8.9%) | 38 (8.3%) |
| 10 to 14 Years | 81 (17.6%) | 19 (4.2%) |
| 15 to 19 Years | 0 (0.0%) | 0 (0.0%) |
| 20 to 24 Years | 0 (0.0%) | 0 (0.0%) |
| 25 to 29 Years | 0 (0.0%) | 0 (0.0%) |
| 30 to 34 Years | 119 (25.9%) | 52 (11.4%) |
| 35 to 39 Years | 36 (7.8%) | 48 (10.5%) |
| 40 to 44 Years | 0 (0.0%) | 0 (0.0%) |
| 45 to 49 Years | 0 (0.0%) | 11 (2.4%) |
| 50 to 54 Years | 0 (0.0%) | 0 (0.0%) |
| 55 to 59 Years | 54 (11.7%) | 101 (22.2%) |
| 60 to 64 Years | 13 (2.8%) | 12 (2.6%) |
| 65 to 69 Years | 12 (2.6%) | 14 (3.1%) |
| 70 to 74 Years | 21 (4.6%) | 22 (4.8%) |
| 75 to 79 Years | 9 (2.0%) | 12 (2.6%) |
| 80 to 84 Years | 0 (0.0%) | 11 (2.4%) |
| 85 Years and over | 10 (2.2%) | 92 (20.2%) |
| Total | 460 (100.0%) | 456 (100.0%) |
Families and Households in Amelia Court House
Median Family Size in Amelia Court House
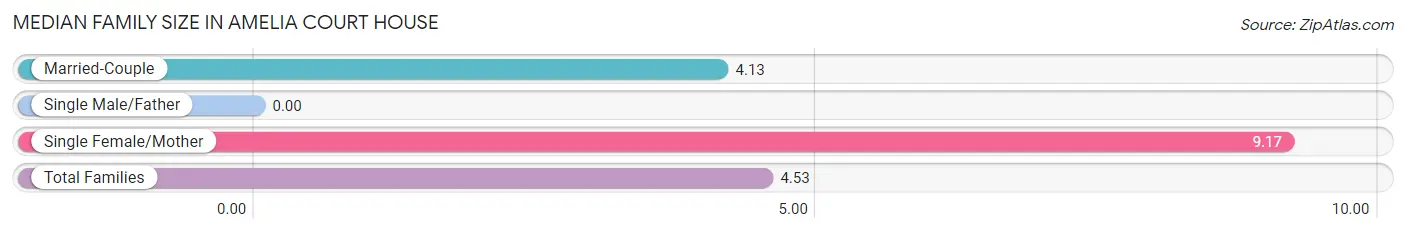
| Family Type | # Families | Family Size |
| Married-Couple | 140 (92.1%) | 4.13 |
| Single Male/Father | 0 (0.0%) | - |
| Single Female/Mother | 12 (7.9%) | 9.17 |
| Total Families | 152 (100.0%) | 4.53 |
Median Household Size in Amelia Court House
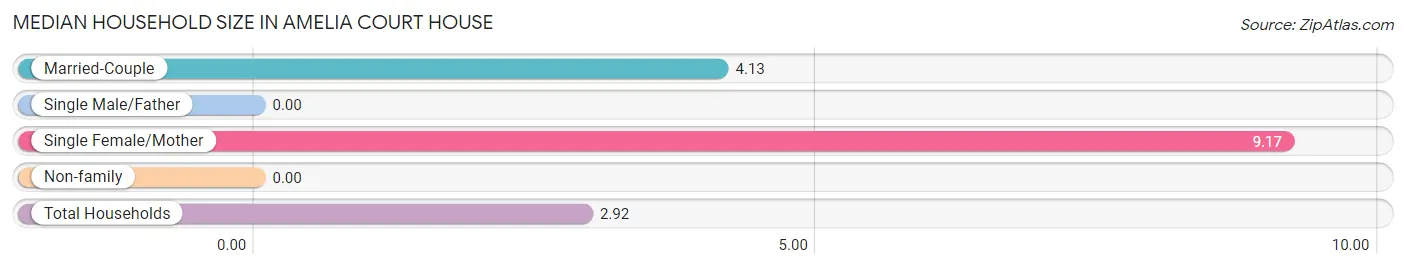
| Household Type | # Households | Household Size |
| Married-Couple | 140 (50.2%) | 4.13 |
| Single Male/Father | 0 (0.0%) | - |
| Single Female/Mother | 12 (4.3%) | 9.17 |
| Non-family | 127 (45.5%) | - |
| Total Households | 279 (100.0%) | 2.92 |
Household Size by Marriage Status in Amelia Court House
Out of a total of 279 households in Amelia Court House, 152 (54.5%) are family households, while 127 (45.5%) are nonfamily households. The most numerous type of family households are 4-person households, comprising 57, and the most common type of nonfamily households are 1-person households, comprising 127.
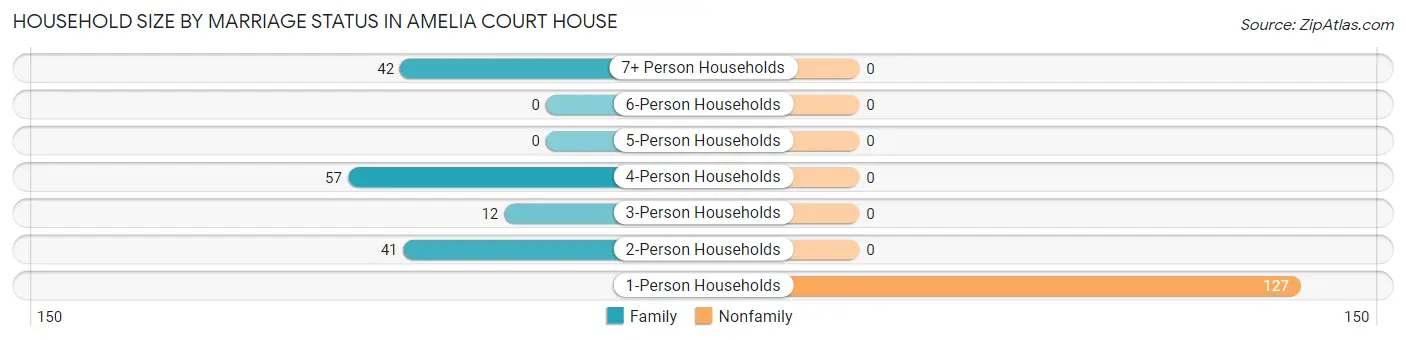
| Household Size | Family Households | Nonfamily Households |
| 1-Person Households | - | 127 (45.5%) |
| 2-Person Households | 41 (14.7%) | 0 (0.0%) |
| 3-Person Households | 12 (4.3%) | 0 (0.0%) |
| 4-Person Households | 57 (20.4%) | 0 (0.0%) |
| 5-Person Households | 0 (0.0%) | 0 (0.0%) |
| 6-Person Households | 0 (0.0%) | 0 (0.0%) |
| 7+ Person Households | 42 (15.0%) | 0 (0.0%) |
| Total | 152 (54.5%) | 127 (45.5%) |
Female Fertility in Amelia Court House
Fertility by Age in Amelia Court House
| Age Bracket | Women with Births | Births / 1,000 Women |
| 15 to 19 years | 0 (0.0%) | 0.0 |
| 20 to 34 years | 0 (0.0%) | 0.0 |
| 35 to 50 years | 0 (0.0%) | 0.0 |
| Total | 0 (0.0%) | 0.0 |
Fertility by Age by Marriage Status in Amelia Court House
| Age Bracket | Married | Unmarried |
| 15 to 19 years | 0 (0.0%) | 0 (0.0%) |
| 20 to 34 years | 0 (0.0%) | 0 (0.0%) |
| 35 to 50 years | 0 (0.0%) | 0 (0.0%) |
| Total | 0 (0.0%) | 0 (0.0%) |
Fertility by Education in Amelia Court House
| Educational Attainment | Women with Births | Births / 1,000 Women |
| Less than High School | 0 (0.0%) | 0.0 |
| High School Diploma | 0 (0.0%) | 0.0 |
| College or Associate's Degree | 0 (0.0%) | 0.0 |
| Bachelor's Degree | 0 (0.0%) | 0.0 |
| Graduate Degree | 0 (0.0%) | 0.0 |
| Total | 0 (0.0%) | 0.0 |
Fertility by Education by Marriage Status in Amelia Court House
| Educational Attainment | Married | Unmarried |
| Less than High School | 0 (0.0%) | 0 (0.0%) |
| High School Diploma | 0 (0.0%) | 0 (0.0%) |
| College or Associate's Degree | 0 (0.0%) | 0 (0.0%) |
| Bachelor's Degree | 0 (0.0%) | 0 (0.0%) |
| Graduate Degree | 0 (0.0%) | 0 (0.0%) |
| Total | 0 (0.0%) | 0 (0.0%) |
Employment Characteristics in Amelia Court House
Employment by Class of Employer in Amelia Court House
Among the 317 employed individuals in Amelia Court House, private company employees (247 | 77.9%), local government employees (45 | 14.2%), and self-employed (incorporated) (25 | 7.9%) make up the most common classes of employment.
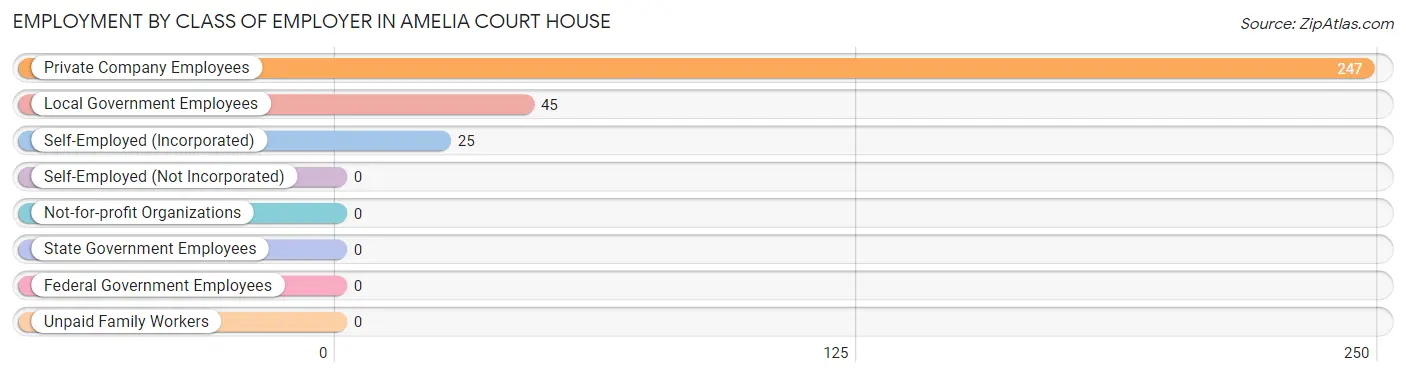
| Employer Class | # Employees | % Employees |
| Private Company Employees | 247 | 77.9% |
| Self-Employed (Incorporated) | 25 | 7.9% |
| Self-Employed (Not Incorporated) | 0 | 0.0% |
| Not-for-profit Organizations | 0 | 0.0% |
| Local Government Employees | 45 | 14.2% |
| State Government Employees | 0 | 0.0% |
| Federal Government Employees | 0 | 0.0% |
| Unpaid Family Workers | 0 | 0.0% |
| Total | 317 | 100.0% |
Employment Status by Age in Amelia Court House
According to the labor force statistics for Amelia Court House, out of the total population over 16 years of age (649), 58.9% or 382 individuals are in the labor force, with 17.0% or 65 of them unemployed. The age group with the highest labor force participation rate is 30 to 34 years, with 100.0% or 171 individuals in the labor force. Within the labor force, the 30 to 34 years age range has the highest percentage of unemployed individuals, with 38.0% or 65 of them being unemployed.
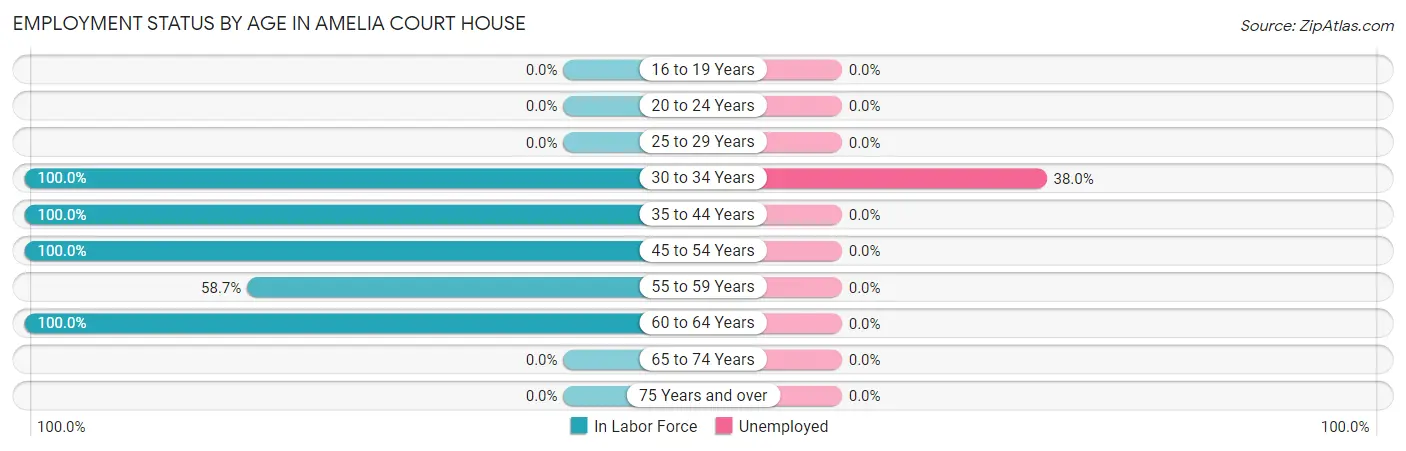
| Age Bracket | In Labor Force | Unemployed |
| 16 to 19 Years | 0 (0.0%) | 0 (0.0%) |
| 20 to 24 Years | 0 (0.0%) | 0 (0.0%) |
| 25 to 29 Years | 0 (0.0%) | 0 (0.0%) |
| 30 to 34 Years | 171 (100.0%) | 65 (38.0%) |
| 35 to 44 Years | 84 (100.0%) | 0 (0.0%) |
| 45 to 54 Years | 11 (100.0%) | 0 (0.0%) |
| 55 to 59 Years | 91 (58.7%) | 0 (0.0%) |
| 60 to 64 Years | 25 (100.0%) | 0 (0.0%) |
| 65 to 74 Years | 0 (0.0%) | 0 (0.0%) |
| 75 Years and over | 0 (0.0%) | 0 (0.0%) |
| Total | 382 (58.9%) | 65 (17.0%) |
Employment Status by Educational Attainment in Amelia Court House
According to labor force statistics for Amelia Court House, 85.7% of individuals (382) out of the total population between 25 and 64 years of age (446) are in the labor force, with 17.0% or 65 of them being unemployed. The group with the highest labor force participation rate are those with the educational attainment of bachelor's degree or higher, with 100.0% or 11 individuals in the labor force. Within the labor force, individuals with college / associate degree education have the highest percentage of unemployment, with 42.9% or 18 of them being unemployed.
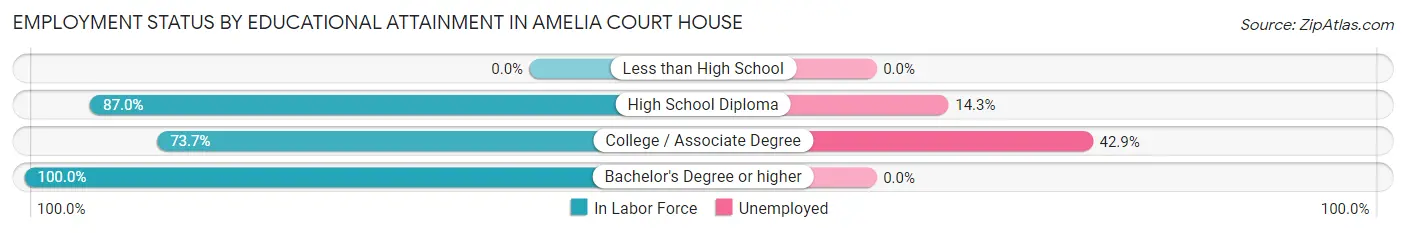
| Educational Attainment | In Labor Force | Unemployed |
| Less than High School | 0 (0.0%) | 0 (0.0%) |
| High School Diploma | 329 (87.0%) | 54 (14.3%) |
| College / Associate Degree | 42 (73.7%) | 24 (42.9%) |
| Bachelor's Degree or higher | 11 (100.0%) | 0 (0.0%) |
| Total | 382 (85.7%) | 76 (17.0%) |
Employment Occupations by Sex in Amelia Court House
Management, Business, Science and Arts Occupations
The most common Management, Business, Science and Arts occupations in Amelia Court House are Community & Social Service (83 | 26.2%), and Education Instruction & Library (83 | 26.2%).
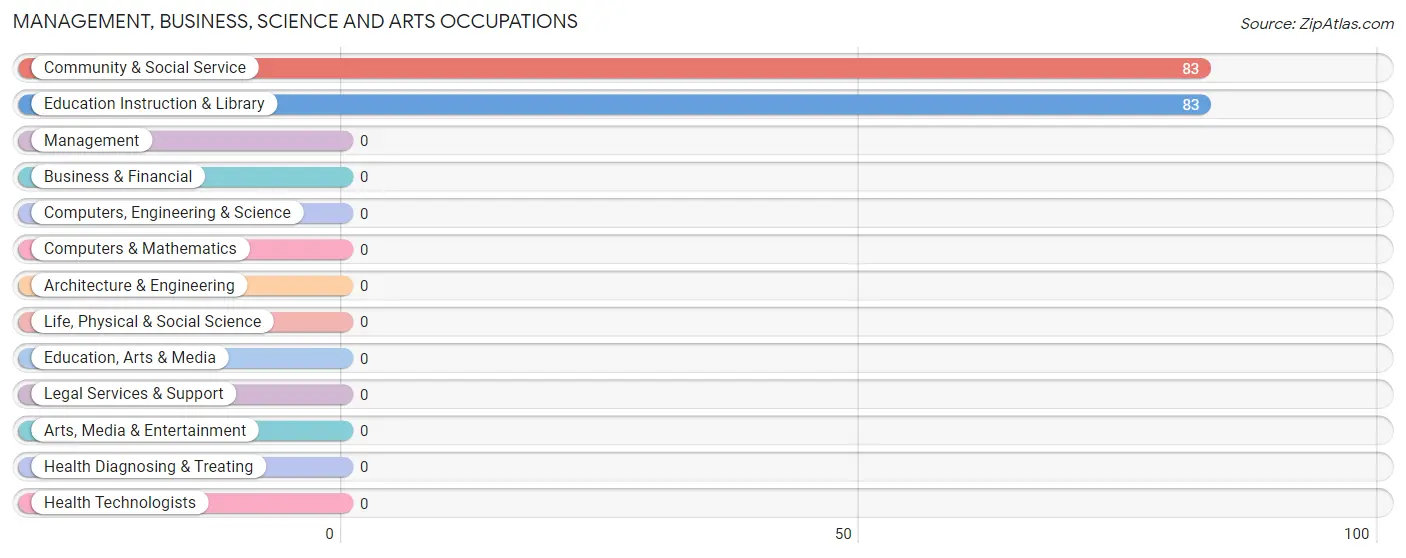
Management, Business, Science and Arts Occupations by Sex
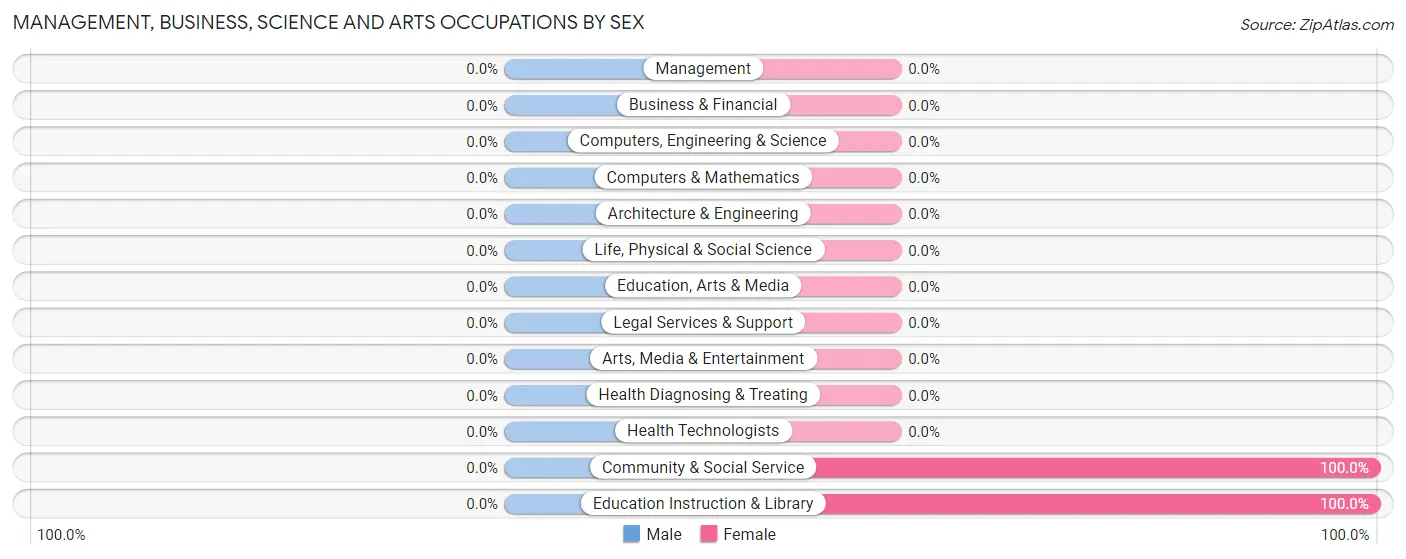
| Occupation | Male | Female |
| Management | 0 (0.0%) | 0 (0.0%) |
| Business & Financial | 0 (0.0%) | 0 (0.0%) |
| Computers, Engineering & Science | 0 (0.0%) | 0 (0.0%) |
| Computers & Mathematics | 0 (0.0%) | 0 (0.0%) |
| Architecture & Engineering | 0 (0.0%) | 0 (0.0%) |
| Life, Physical & Social Science | 0 (0.0%) | 0 (0.0%) |
| Community & Social Service | 0 (0.0%) | 83 (100.0%) |
| Education, Arts & Media | 0 (0.0%) | 0 (0.0%) |
| Legal Services & Support | 0 (0.0%) | 0 (0.0%) |
| Education Instruction & Library | 0 (0.0%) | 83 (100.0%) |
| Arts, Media & Entertainment | 0 (0.0%) | 0 (0.0%) |
| Health Diagnosing & Treating | 0 (0.0%) | 0 (0.0%) |
| Health Technologists | 0 (0.0%) | 0 (0.0%) |
| Total (Category) | 0 (0.0%) | 83 (100.0%) |
| Total (Overall) | 175 (55.2%) | 142 (44.8%) |
Services Occupations
Services Occupations by Sex
| Occupation | Male | Female |
| Healthcare Support | 0 (0.0%) | 0 (0.0%) |
| Security & Protection | 0 (0.0%) | 0 (0.0%) |
| Firefighting & Prevention | 0 (0.0%) | 0 (0.0%) |
| Law Enforcement | 0 (0.0%) | 0 (0.0%) |
| Food Preparation & Serving | 0 (0.0%) | 0 (0.0%) |
| Cleaning & Maintenance | 0 (0.0%) | 0 (0.0%) |
| Personal Care & Service | 0 (0.0%) | 0 (0.0%) |
| Total (Category) | 0 (0.0%) | 0 (0.0%) |
| Total (Overall) | 175 (55.2%) | 142 (44.8%) |
Sales and Office Occupations
The most common Sales and Office occupations in Amelia Court House are Office & Administration (25 | 7.9%), and Sales & Related (13 | 4.1%).

Sales and Office Occupations by Sex
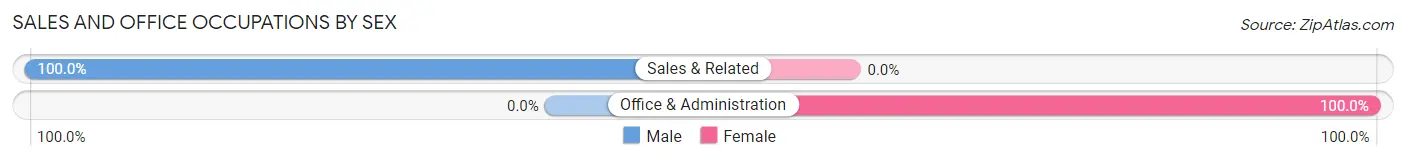
| Occupation | Male | Female |
| Sales & Related | 13 (100.0%) | 0 (0.0%) |
| Office & Administration | 0 (0.0%) | 25 (100.0%) |
| Total (Category) | 13 (34.2%) | 25 (65.8%) |
| Total (Overall) | 175 (55.2%) | 142 (44.8%) |
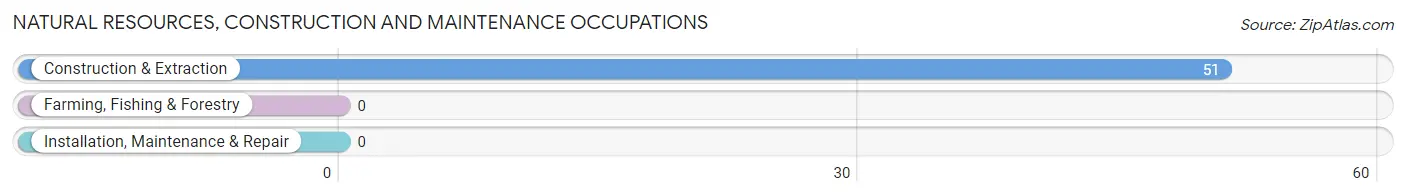
Natural Resources, Construction and Maintenance Occupations
The most common Natural Resources, Construction and Maintenance occupations in Amelia Court House are , and Construction & Extraction (51 | 16.1%).
Natural Resources, Construction and Maintenance Occupations by Sex
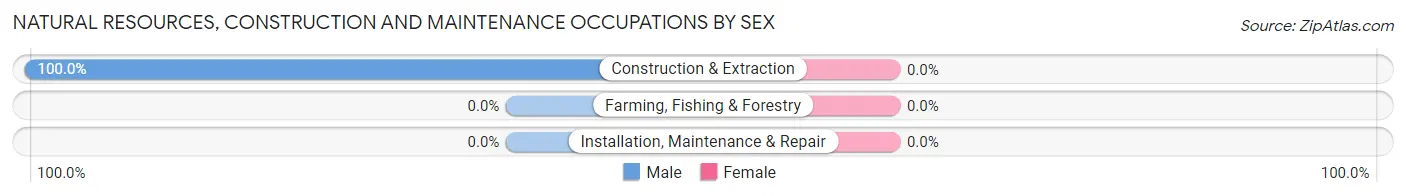
| Occupation | Male | Female |
| Farming, Fishing & Forestry | 0 (0.0%) | 0 (0.0%) |
| Construction & Extraction | 51 (100.0%) | 0 (0.0%) |
| Installation, Maintenance & Repair | 0 (0.0%) | 0 (0.0%) |
| Total (Category) | 51 (100.0%) | 0 (0.0%) |
| Total (Overall) | 175 (55.2%) | 142 (44.8%) |
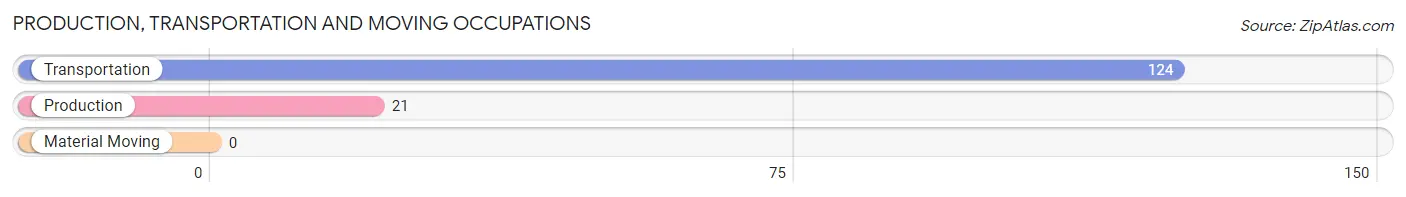
Production, Transportation and Moving Occupations
The most common Production, Transportation and Moving occupations in Amelia Court House are Transportation (124 | 39.1%), and Production (21 | 6.6%).
Production, Transportation and Moving Occupations by Sex
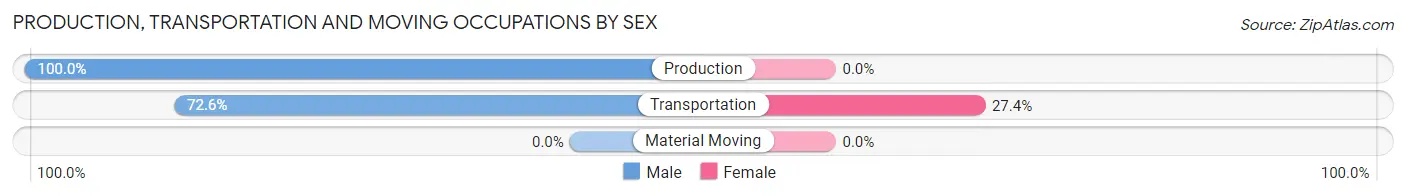
| Occupation | Male | Female |
| Production | 21 (100.0%) | 0 (0.0%) |
| Transportation | 90 (72.6%) | 34 (27.4%) |
| Material Moving | 0 (0.0%) | 0 (0.0%) |
| Total (Category) | 111 (76.5%) | 34 (23.4%) |
| Total (Overall) | 175 (55.2%) | 142 (44.8%) |
Employment Industries by Sex in Amelia Court House
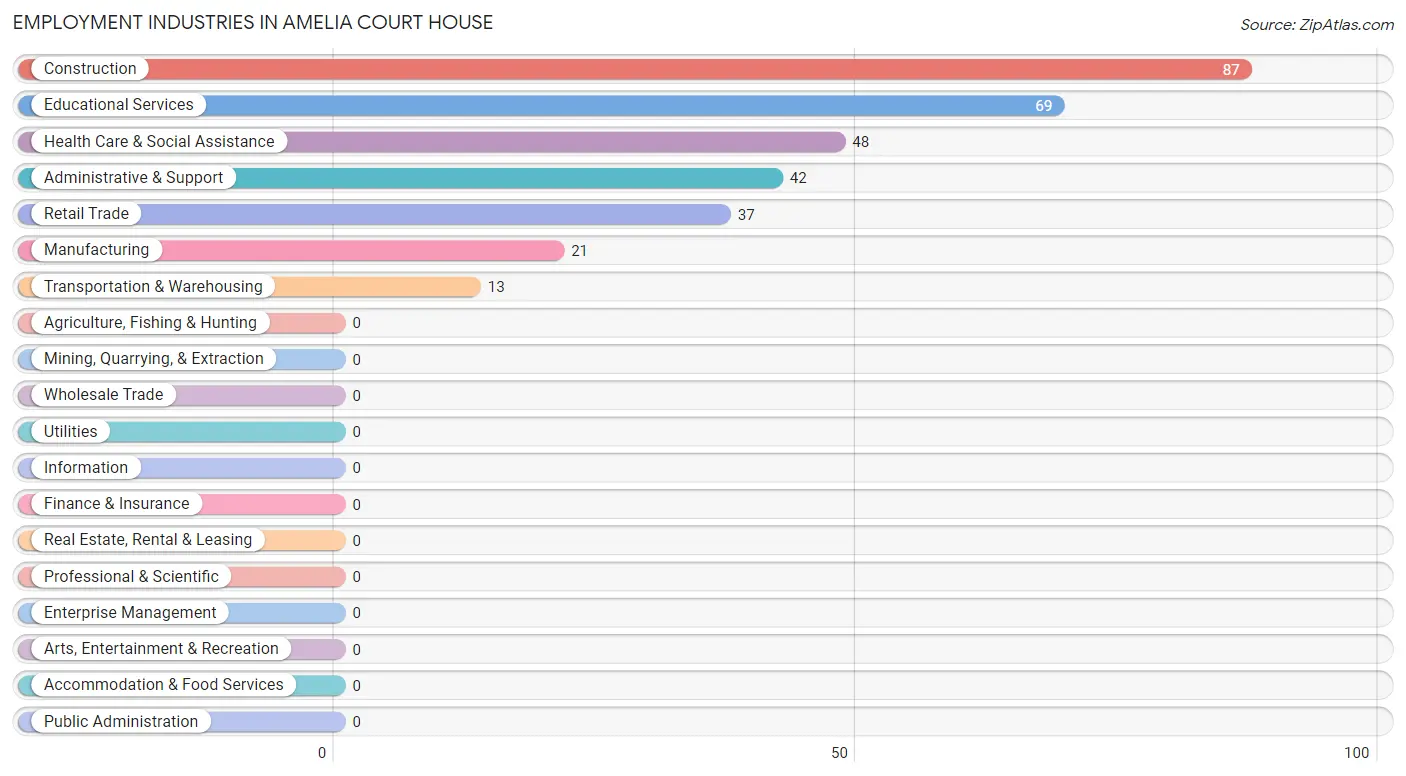
Employment Industries in Amelia Court House
The major employment industries in Amelia Court House include Construction (87 | 27.4%), Educational Services (69 | 21.8%), Health Care & Social Assistance (48 | 15.1%), Administrative & Support (42 | 13.3%), and Retail Trade (37 | 11.7%).
Employment Industries by Sex in Amelia Court House
The Amelia Court House industries that see more men than women are Construction (100.0%), Manufacturing (100.0%), and Administrative & Support (100.0%), whereas the industries that tend to have a higher number of women are Transportation & Warehousing (100.0%), Educational Services (100.0%), and Health Care & Social Assistance (100.0%).
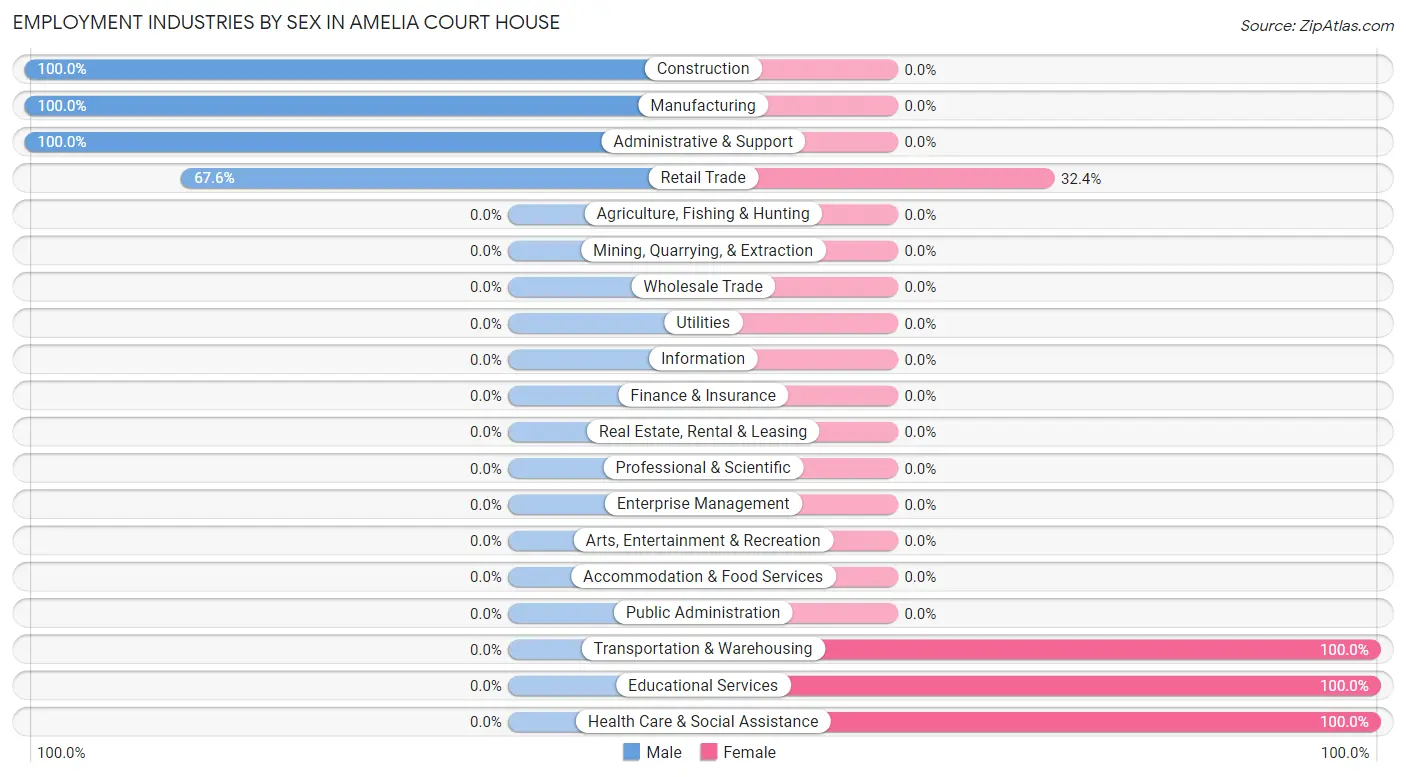
| Industry | Male | Female |
| Agriculture, Fishing & Hunting | 0 (0.0%) | 0 (0.0%) |
| Mining, Quarrying, & Extraction | 0 (0.0%) | 0 (0.0%) |
| Construction | 87 (100.0%) | 0 (0.0%) |
| Manufacturing | 21 (100.0%) | 0 (0.0%) |
| Wholesale Trade | 0 (0.0%) | 0 (0.0%) |
| Retail Trade | 25 (67.6%) | 12 (32.4%) |
| Transportation & Warehousing | 0 (0.0%) | 13 (100.0%) |
| Utilities | 0 (0.0%) | 0 (0.0%) |
| Information | 0 (0.0%) | 0 (0.0%) |
| Finance & Insurance | 0 (0.0%) | 0 (0.0%) |
| Real Estate, Rental & Leasing | 0 (0.0%) | 0 (0.0%) |
| Professional & Scientific | 0 (0.0%) | 0 (0.0%) |
| Enterprise Management | 0 (0.0%) | 0 (0.0%) |
| Administrative & Support | 42 (100.0%) | 0 (0.0%) |
| Educational Services | 0 (0.0%) | 69 (100.0%) |
| Health Care & Social Assistance | 0 (0.0%) | 48 (100.0%) |
| Arts, Entertainment & Recreation | 0 (0.0%) | 0 (0.0%) |
| Accommodation & Food Services | 0 (0.0%) | 0 (0.0%) |
| Public Administration | 0 (0.0%) | 0 (0.0%) |
| Total | 175 (55.2%) | 142 (44.8%) |
Education in Amelia Court House
School Enrollment in Amelia Court House
The most common levels of schooling among the 179 students in Amelia Court House are middle school (81 | 45.3%), kindergarten (79 | 44.1%), and elementary school (19 | 10.6%).
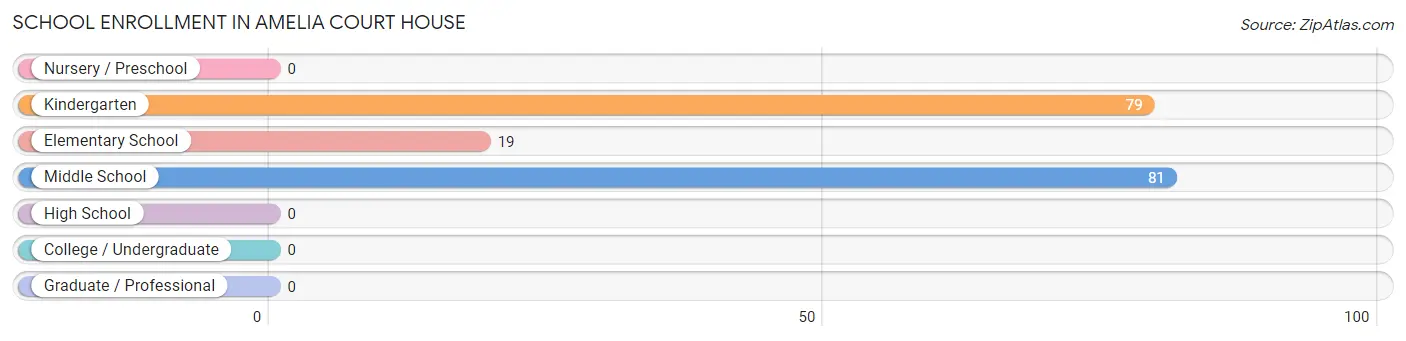
| School Level | # Students | % Students |
| Nursery / Preschool | 0 | 0.0% |
| Kindergarten | 79 | 44.1% |
| Elementary School | 19 | 10.6% |
| Middle School | 81 | 45.3% |
| High School | 0 | 0.0% |
| College / Undergraduate | 0 | 0.0% |
| Graduate / Professional | 0 | 0.0% |
| Total | 179 | 100.0% |
School Enrollment by Age by Funding Source in Amelia Court House
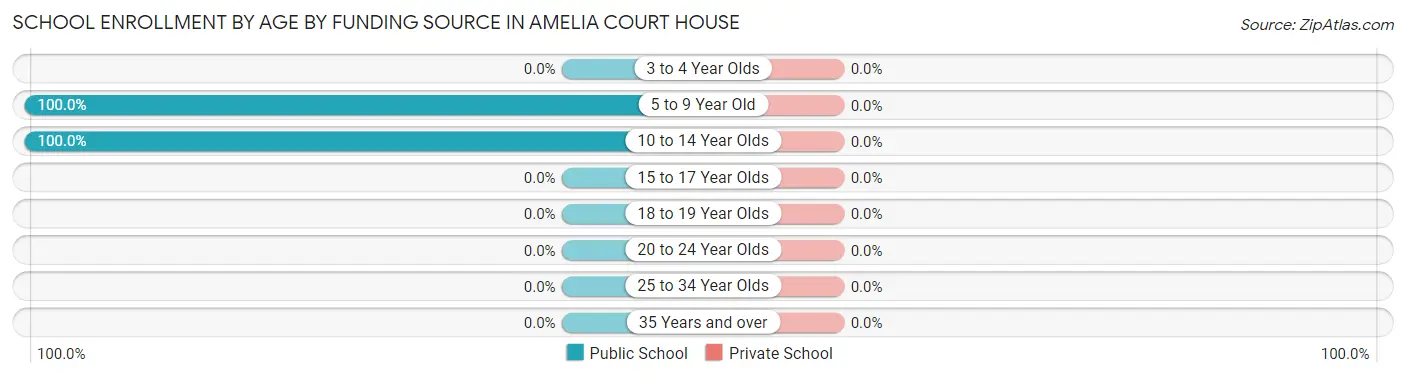
| Age Bracket | Public School | Private School |
| 3 to 4 Year Olds | 0 (0.0%) | 0 (0.0%) |
| 5 to 9 Year Old | 79 (100.0%) | 0 (0.0%) |
| 10 to 14 Year Olds | 100 (100.0%) | 0 (0.0%) |
| 15 to 17 Year Olds | 0 (0.0%) | 0 (0.0%) |
| 18 to 19 Year Olds | 0 (0.0%) | 0 (0.0%) |
| 20 to 24 Year Olds | 0 (0.0%) | 0 (0.0%) |
| 25 to 34 Year Olds | 0 (0.0%) | 0 (0.0%) |
| 35 Years and over | 0 (0.0%) | 0 (0.0%) |
| Total | 179 (100.0%) | 0 (0.0%) |
Educational Attainment by Field of Study in Amelia Court House
Education (14 | 25.5%), science & technology (12 | 21.8%), bio, nature & agricultural (11 | 20.0%), social sciences (9 | 16.4%), and liberal arts & history (9 | 16.4%) are the most common fields of study among 55 individuals in Amelia Court House who have obtained a bachelor's degree or higher.
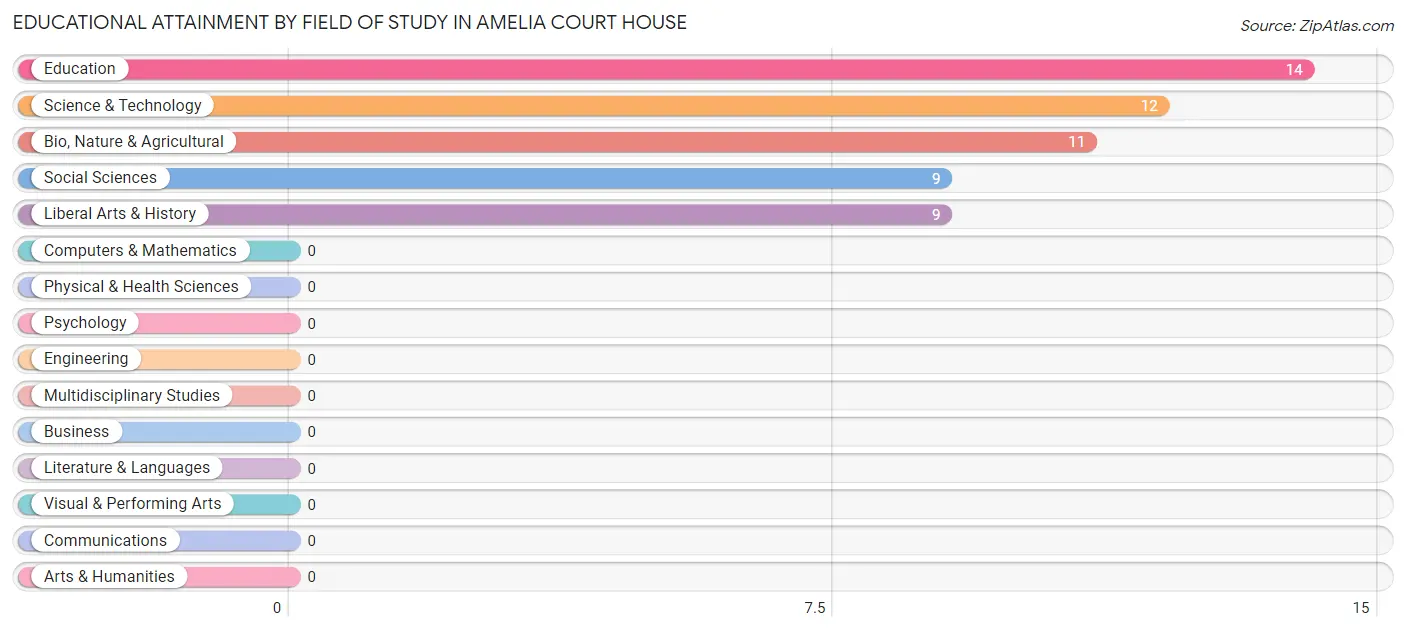
| Field of Study | # Graduates | % Graduates |
| Computers & Mathematics | 0 | 0.0% |
| Bio, Nature & Agricultural | 11 | 20.0% |
| Physical & Health Sciences | 0 | 0.0% |
| Psychology | 0 | 0.0% |
| Social Sciences | 9 | 16.4% |
| Engineering | 0 | 0.0% |
| Multidisciplinary Studies | 0 | 0.0% |
| Science & Technology | 12 | 21.8% |
| Business | 0 | 0.0% |
| Education | 14 | 25.5% |
| Literature & Languages | 0 | 0.0% |
| Liberal Arts & History | 9 | 16.4% |
| Visual & Performing Arts | 0 | 0.0% |
| Communications | 0 | 0.0% |
| Arts & Humanities | 0 | 0.0% |
| Total | 55 | 100.0% |
Transportation & Commute in Amelia Court House
Vehicle Availability by Sex in Amelia Court House
The most prevalent vehicle ownership categories in Amelia Court House are males with 3 vehicles (99, accounting for 56.6%) and females with 3 vehicles (82, making up 69.7%).
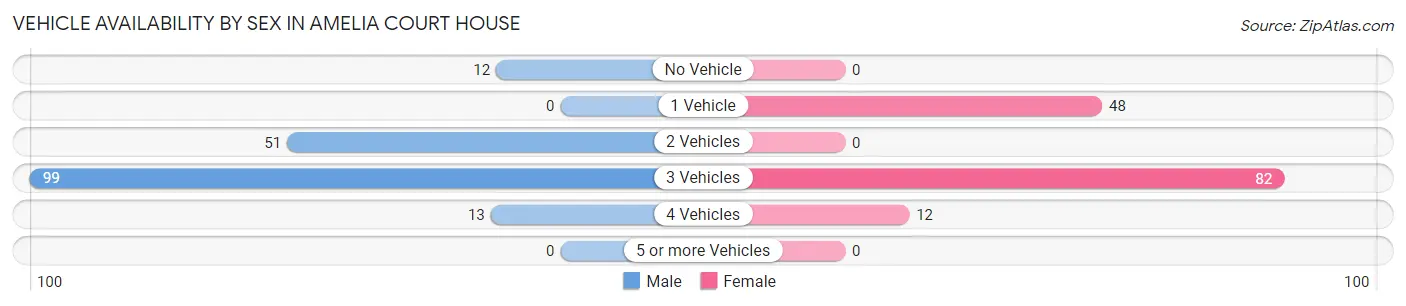
| Vehicles Available | Male | Female |
| No Vehicle | 12 (6.9%) | 0 (0.0%) |
| 1 Vehicle | 0 (0.0%) | 48 (33.8%) |
| 2 Vehicles | 51 (29.1%) | 0 (0.0%) |
| 3 Vehicles | 99 (56.6%) | 82 (57.8%) |
| 4 Vehicles | 13 (7.4%) | 12 (8.5%) |
| 5 or more Vehicles | 0 (0.0%) | 0 (0.0%) |
| Total | 175 (100.0%) | 142 (100.0%) |
Commute Time in Amelia Court House
The most frequently occuring commute durations in Amelia Court House are 45 to 59 minutes (72 commuters, 22.7%), 5 to 9 minutes (61 commuters, 19.2%), and 60 to 89 minutes (61 commuters, 19.2%).
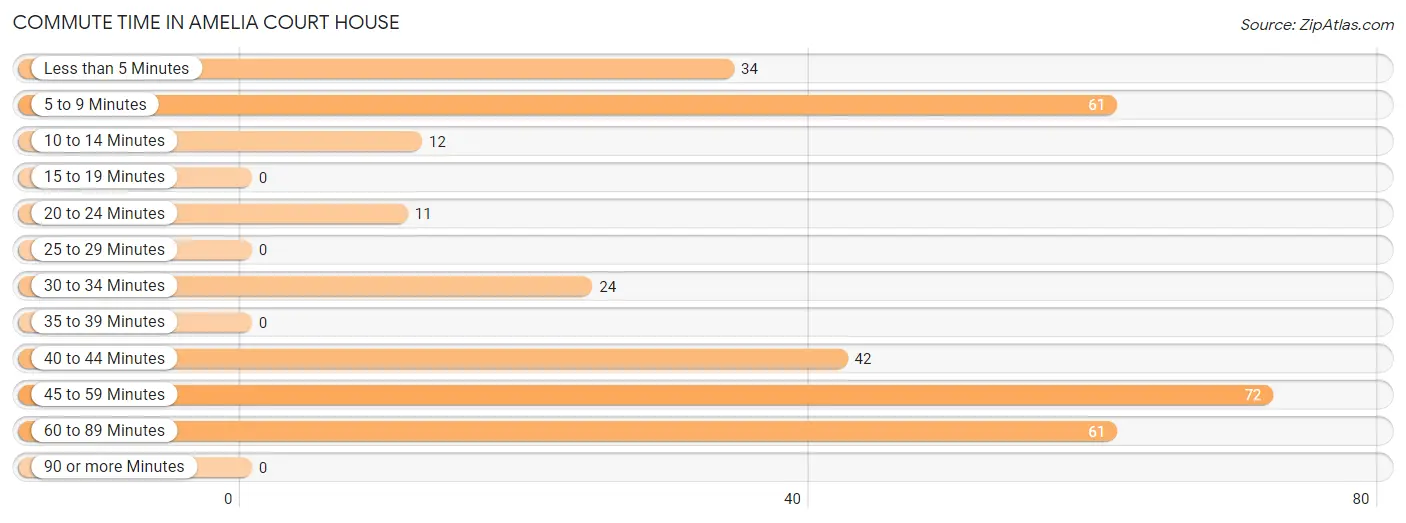
| Commute Time | # Commuters | % Commuters |
| Less than 5 Minutes | 34 | 10.7% |
| 5 to 9 Minutes | 61 | 19.2% |
| 10 to 14 Minutes | 12 | 3.8% |
| 15 to 19 Minutes | 0 | 0.0% |
| 20 to 24 Minutes | 11 | 3.5% |
| 25 to 29 Minutes | 0 | 0.0% |
| 30 to 34 Minutes | 24 | 7.6% |
| 35 to 39 Minutes | 0 | 0.0% |
| 40 to 44 Minutes | 42 | 13.3% |
| 45 to 59 Minutes | 72 | 22.7% |
| 60 to 89 Minutes | 61 | 19.2% |
| 90 or more Minutes | 0 | 0.0% |
Commute Time by Sex in Amelia Court House
The most common commute times in Amelia Court House are 45 to 59 minutes (72 commuters, 41.1%) for males and 5 to 9 minutes (61 commuters, 43.0%) for females.
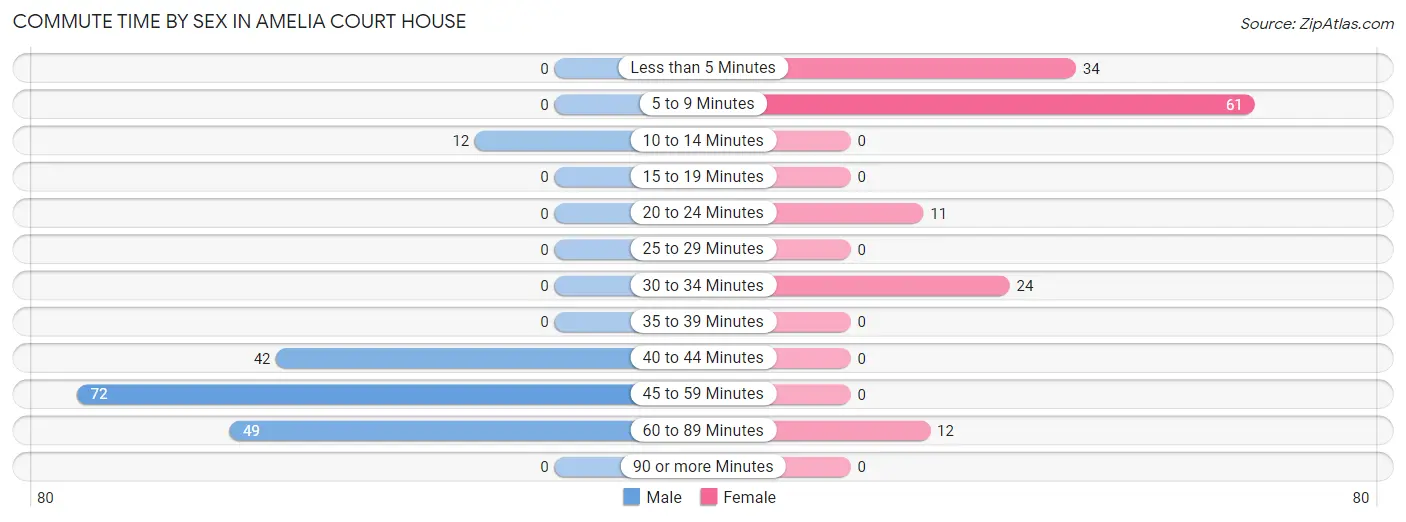
| Commute Time | Male | Female |
| Less than 5 Minutes | 0 (0.0%) | 34 (23.9%) |
| 5 to 9 Minutes | 0 (0.0%) | 61 (43.0%) |
| 10 to 14 Minutes | 12 (6.9%) | 0 (0.0%) |
| 15 to 19 Minutes | 0 (0.0%) | 0 (0.0%) |
| 20 to 24 Minutes | 0 (0.0%) | 11 (7.7%) |
| 25 to 29 Minutes | 0 (0.0%) | 0 (0.0%) |
| 30 to 34 Minutes | 0 (0.0%) | 24 (16.9%) |
| 35 to 39 Minutes | 0 (0.0%) | 0 (0.0%) |
| 40 to 44 Minutes | 42 (24.0%) | 0 (0.0%) |
| 45 to 59 Minutes | 72 (41.1%) | 0 (0.0%) |
| 60 to 89 Minutes | 49 (28.0%) | 12 (8.5%) |
| 90 or more Minutes | 0 (0.0%) | 0 (0.0%) |
Time of Departure to Work by Sex in Amelia Court House
The most frequent times of departure to work in Amelia Court House are 6:00 AM to 6:29 AM (72, 41.1%) for males and 7:30 AM to 7:59 AM (59, 41.5%) for females.
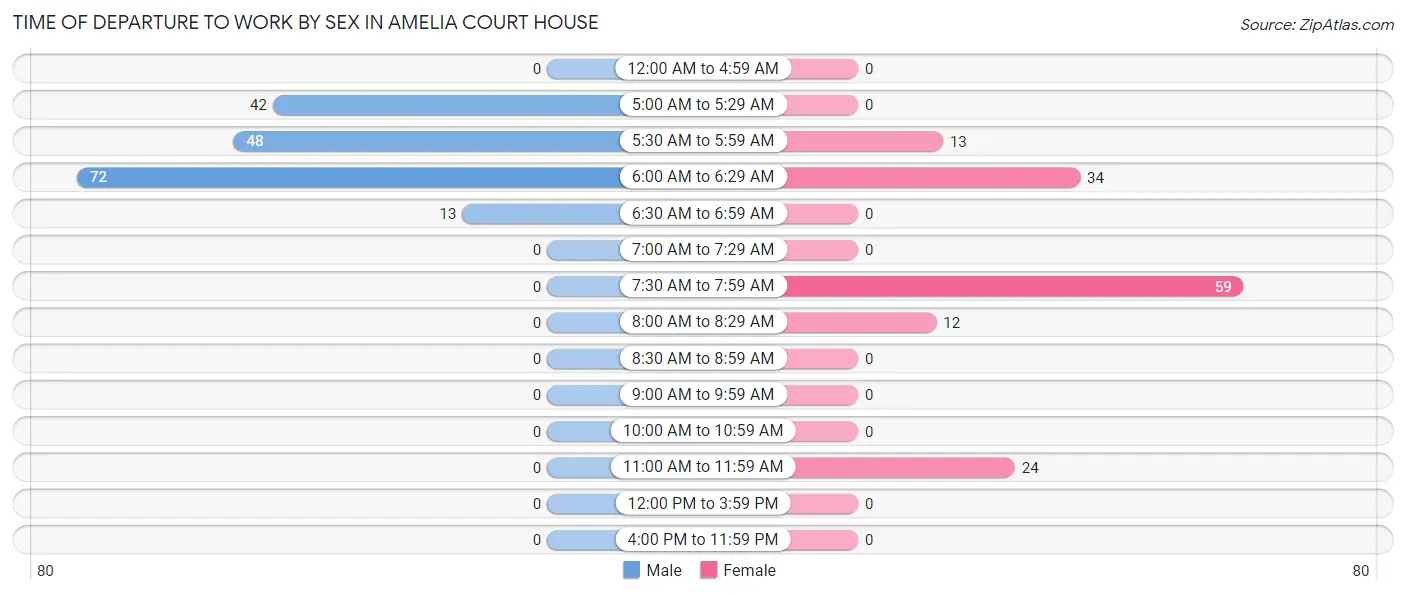
| Time of Departure | Male | Female |
| 12:00 AM to 4:59 AM | 0 (0.0%) | 0 (0.0%) |
| 5:00 AM to 5:29 AM | 42 (24.0%) | 0 (0.0%) |
| 5:30 AM to 5:59 AM | 48 (27.4%) | 13 (9.1%) |
| 6:00 AM to 6:29 AM | 72 (41.1%) | 34 (23.9%) |
| 6:30 AM to 6:59 AM | 13 (7.4%) | 0 (0.0%) |
| 7:00 AM to 7:29 AM | 0 (0.0%) | 0 (0.0%) |
| 7:30 AM to 7:59 AM | 0 (0.0%) | 59 (41.5%) |
| 8:00 AM to 8:29 AM | 0 (0.0%) | 12 (8.5%) |
| 8:30 AM to 8:59 AM | 0 (0.0%) | 0 (0.0%) |
| 9:00 AM to 9:59 AM | 0 (0.0%) | 0 (0.0%) |
| 10:00 AM to 10:59 AM | 0 (0.0%) | 0 (0.0%) |
| 11:00 AM to 11:59 AM | 0 (0.0%) | 24 (16.9%) |
| 12:00 PM to 3:59 PM | 0 (0.0%) | 0 (0.0%) |
| 4:00 PM to 11:59 PM | 0 (0.0%) | 0 (0.0%) |
| Total | 175 (100.0%) | 142 (100.0%) |
Housing Occupancy in Amelia Court House
Occupancy by Ownership in Amelia Court House
Of the total 279 dwellings in Amelia Court House, owner-occupied units account for 223 (79.9%), while renter-occupied units make up 56 (20.1%).
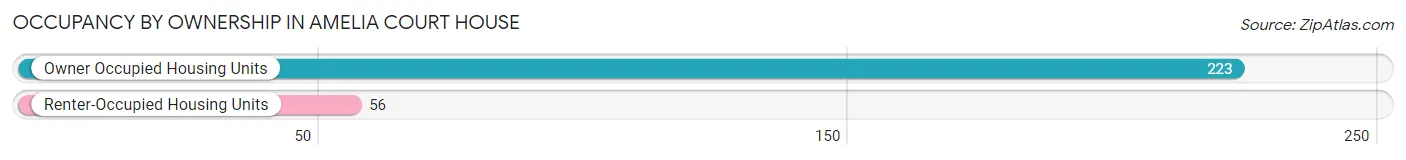
| Occupancy | # Housing Units | % Housing Units |
| Owner Occupied Housing Units | 223 | 79.9% |
| Renter-Occupied Housing Units | 56 | 20.1% |
| Total Occupied Housing Units | 279 | 100.0% |
Occupancy by Household Size in Amelia Court House
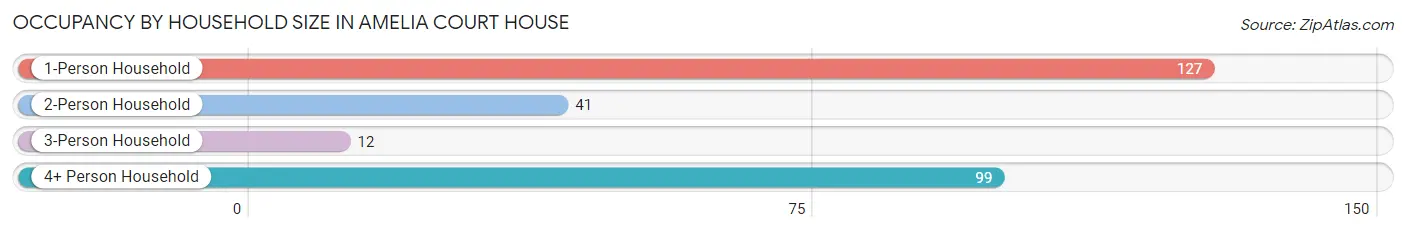
| Household Size | # Housing Units | % Housing Units |
| 1-Person Household | 127 | 45.5% |
| 2-Person Household | 41 | 14.7% |
| 3-Person Household | 12 | 4.3% |
| 4+ Person Household | 99 | 35.5% |
| Total Housing Units | 279 | 100.0% |
Occupancy by Ownership by Household Size in Amelia Court House
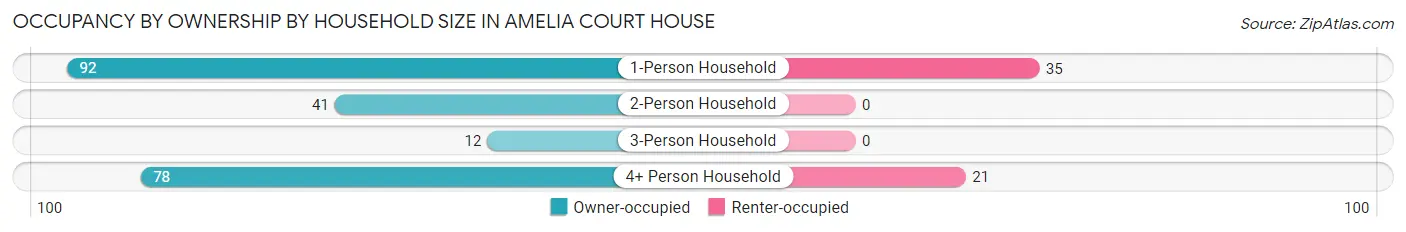
| Household Size | Owner-occupied | Renter-occupied |
| 1-Person Household | 92 (72.4%) | 35 (27.6%) |
| 2-Person Household | 41 (100.0%) | 0 (0.0%) |
| 3-Person Household | 12 (100.0%) | 0 (0.0%) |
| 4+ Person Household | 78 (78.8%) | 21 (21.2%) |
| Total Housing Units | 223 (79.9%) | 56 (20.1%) |
Occupancy by Educational Attainment in Amelia Court House
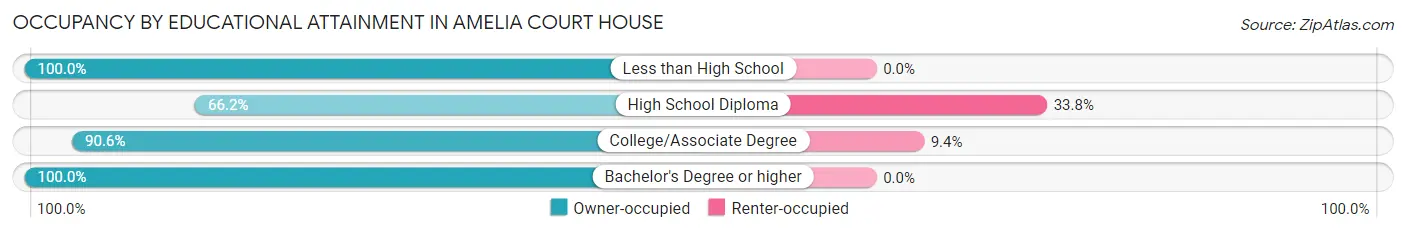
| Household Size | Owner-occupied | Renter-occupied |
| Less than High School | 12 (100.0%) | 0 (0.0%) |
| High School Diploma | 90 (66.2%) | 46 (33.8%) |
| College/Associate Degree | 96 (90.6%) | 10 (9.4%) |
| Bachelor's Degree or higher | 25 (100.0%) | 0 (0.0%) |
Occupancy by Age of Householder in Amelia Court House
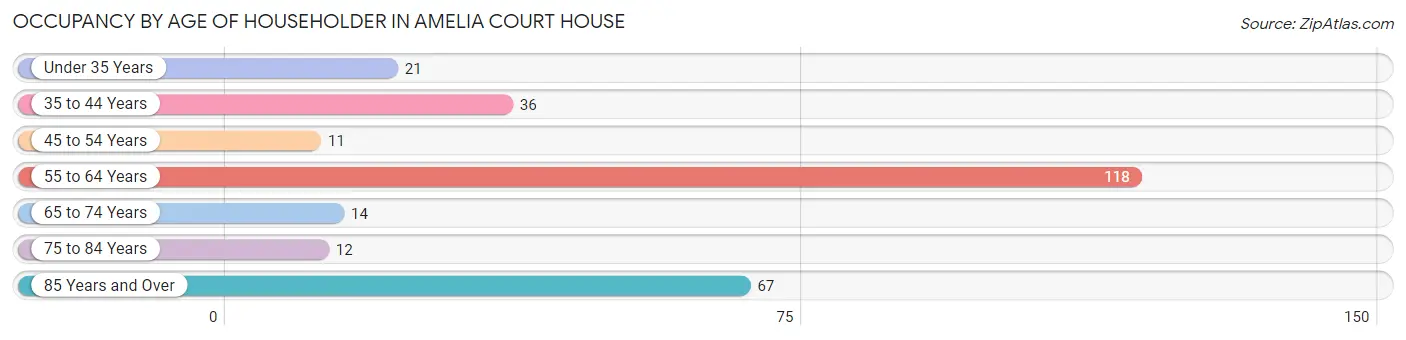
| Age Bracket | # Households | % Households |
| Under 35 Years | 21 | 7.5% |
| 35 to 44 Years | 36 | 12.9% |
| 45 to 54 Years | 11 | 3.9% |
| 55 to 64 Years | 118 | 42.3% |
| 65 to 74 Years | 14 | 5.0% |
| 75 to 84 Years | 12 | 4.3% |
| 85 Years and Over | 67 | 24.0% |
| Total | 279 | 100.0% |
Housing Finances in Amelia Court House
Median Income by Occupancy in Amelia Court House
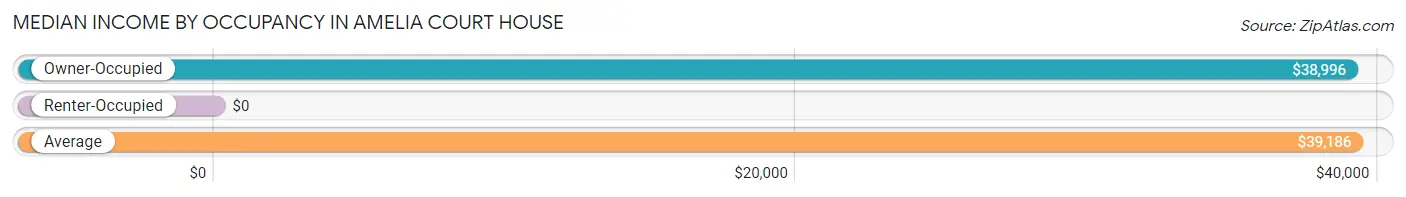
| Occupancy Type | # Households | Median Income |
| Owner-Occupied | 223 (79.9%) | $38,996 |
| Renter-Occupied | 56 (20.1%) | $0 |
| Average | 279 (100.0%) | $39,186 |
Occupancy by Householder Income Bracket in Amelia Court House
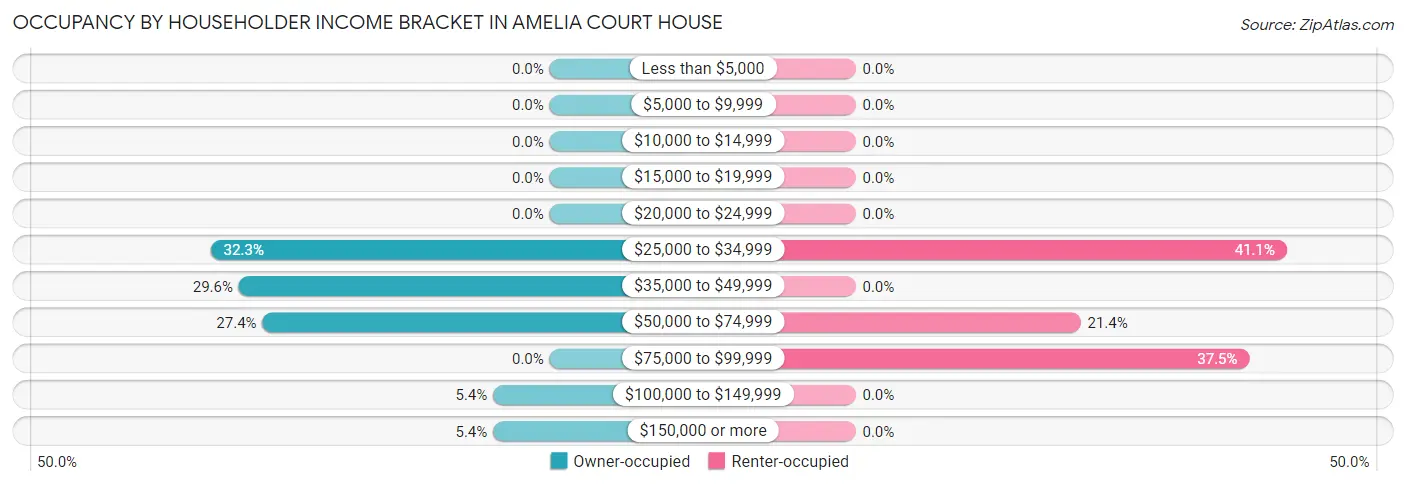
| Income Bracket | Owner-occupied | Renter-occupied |
| Less than $5,000 | 0 (0.0%) | 0 (0.0%) |
| $5,000 to $9,999 | 0 (0.0%) | 0 (0.0%) |
| $10,000 to $14,999 | 0 (0.0%) | 0 (0.0%) |
| $15,000 to $19,999 | 0 (0.0%) | 0 (0.0%) |
| $20,000 to $24,999 | 0 (0.0%) | 0 (0.0%) |
| $25,000 to $34,999 | 72 (32.3%) | 23 (41.1%) |
| $35,000 to $49,999 | 66 (29.6%) | 0 (0.0%) |
| $50,000 to $74,999 | 61 (27.4%) | 12 (21.4%) |
| $75,000 to $99,999 | 0 (0.0%) | 21 (37.5%) |
| $100,000 to $149,999 | 12 (5.4%) | 0 (0.0%) |
| $150,000 or more | 12 (5.4%) | 0 (0.0%) |
| Total | 223 (100.0%) | 56 (100.0%) |
Monthly Housing Cost Tiers in Amelia Court House
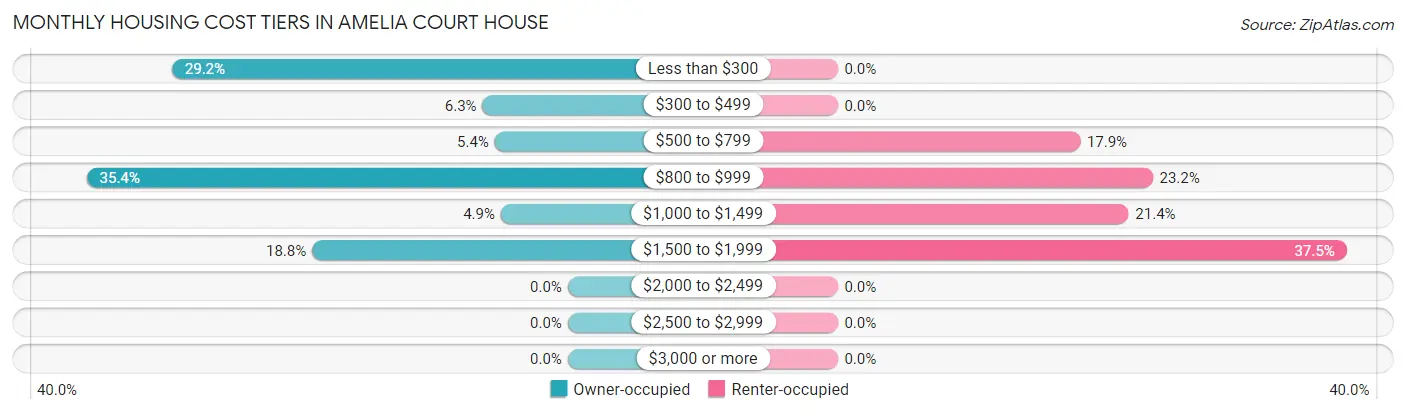
| Monthly Cost | Owner-occupied | Renter-occupied |
| Less than $300 | 65 (29.1%) | 0 (0.0%) |
| $300 to $499 | 14 (6.3%) | 0 (0.0%) |
| $500 to $799 | 12 (5.4%) | 10 (17.9%) |
| $800 to $999 | 79 (35.4%) | 13 (23.2%) |
| $1,000 to $1,499 | 11 (4.9%) | 12 (21.4%) |
| $1,500 to $1,999 | 42 (18.8%) | 21 (37.5%) |
| $2,000 to $2,499 | 0 (0.0%) | 0 (0.0%) |
| $2,500 to $2,999 | 0 (0.0%) | 0 (0.0%) |
| $3,000 or more | 0 (0.0%) | 0 (0.0%) |
| Total | 223 (100.0%) | 56 (100.0%) |
Physical Housing Characteristics in Amelia Court House
Housing Structures in Amelia Court House
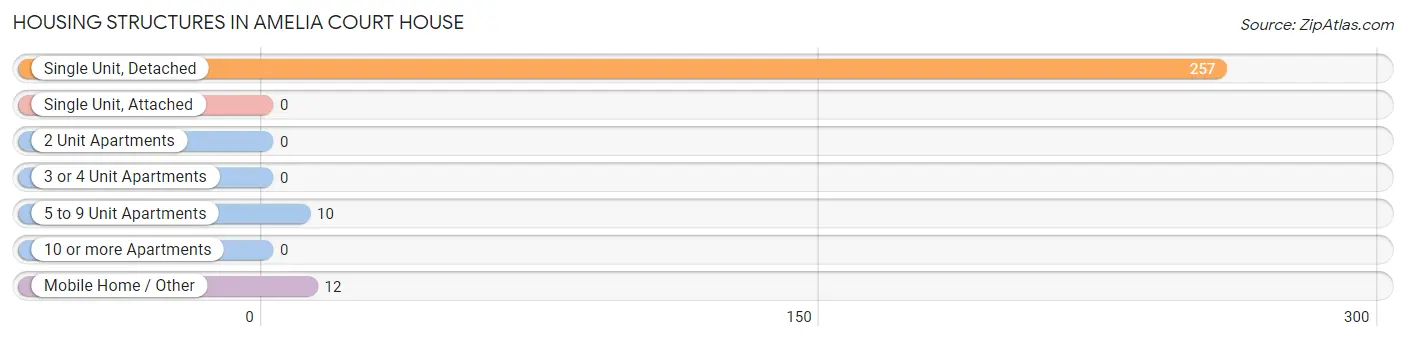
| Structure Type | # Housing Units | % Housing Units |
| Single Unit, Detached | 257 | 92.1% |
| Single Unit, Attached | 0 | 0.0% |
| 2 Unit Apartments | 0 | 0.0% |
| 3 or 4 Unit Apartments | 0 | 0.0% |
| 5 to 9 Unit Apartments | 10 | 3.6% |
| 10 or more Apartments | 0 | 0.0% |
| Mobile Home / Other | 12 | 4.3% |
| Total | 279 | 100.0% |
Housing Structures by Occupancy in Amelia Court House
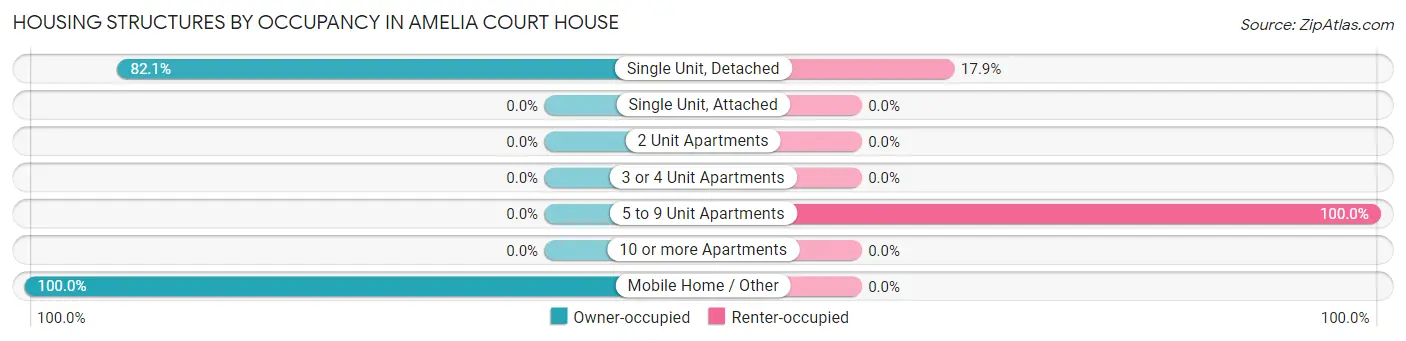
| Structure Type | Owner-occupied | Renter-occupied |
| Single Unit, Detached | 211 (82.1%) | 46 (17.9%) |
| Single Unit, Attached | 0 (0.0%) | 0 (0.0%) |
| 2 Unit Apartments | 0 (0.0%) | 0 (0.0%) |
| 3 or 4 Unit Apartments | 0 (0.0%) | 0 (0.0%) |
| 5 to 9 Unit Apartments | 0 (0.0%) | 10 (100.0%) |
| 10 or more Apartments | 0 (0.0%) | 0 (0.0%) |
| Mobile Home / Other | 12 (100.0%) | 0 (0.0%) |
| Total | 223 (79.9%) | 56 (20.1%) |
Housing Structures by Number of Rooms in Amelia Court House
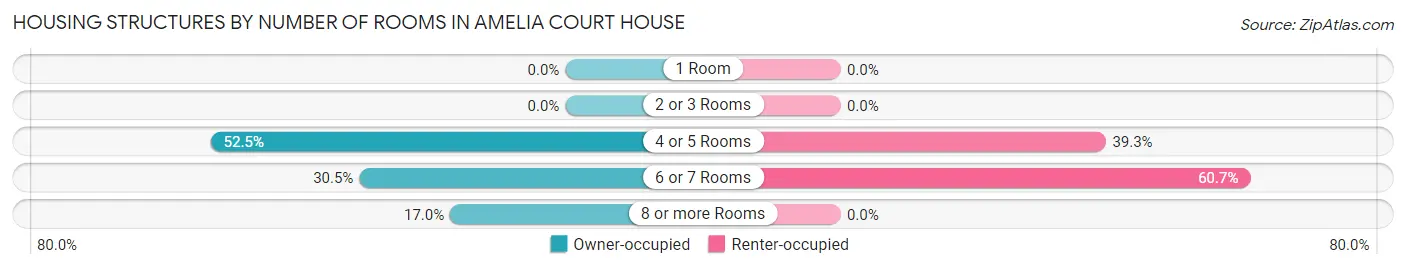
| Number of Rooms | Owner-occupied | Renter-occupied |
| 1 Room | 0 (0.0%) | 0 (0.0%) |
| 2 or 3 Rooms | 0 (0.0%) | 0 (0.0%) |
| 4 or 5 Rooms | 117 (52.5%) | 22 (39.3%) |
| 6 or 7 Rooms | 68 (30.5%) | 34 (60.7%) |
| 8 or more Rooms | 38 (17.0%) | 0 (0.0%) |
| Total | 223 (100.0%) | 56 (100.0%) |
Housing Structure by Heating Type in Amelia Court House
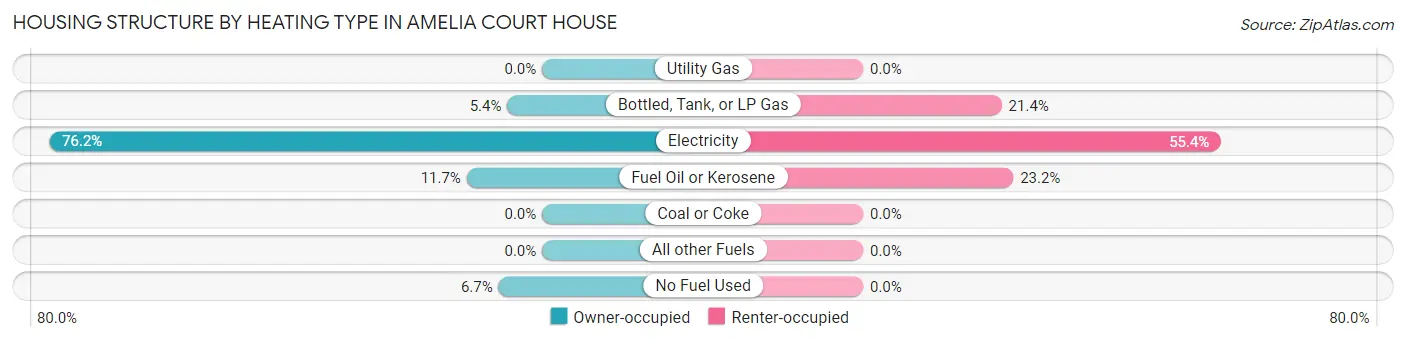
| Heating Type | Owner-occupied | Renter-occupied |
| Utility Gas | 0 (0.0%) | 0 (0.0%) |
| Bottled, Tank, or LP Gas | 12 (5.4%) | 12 (21.4%) |
| Electricity | 170 (76.2%) | 31 (55.4%) |
| Fuel Oil or Kerosene | 26 (11.7%) | 13 (23.2%) |
| Coal or Coke | 0 (0.0%) | 0 (0.0%) |
| All other Fuels | 0 (0.0%) | 0 (0.0%) |
| No Fuel Used | 15 (6.7%) | 0 (0.0%) |
| Total | 223 (100.0%) | 56 (100.0%) |
Household Vehicle Usage in Amelia Court House
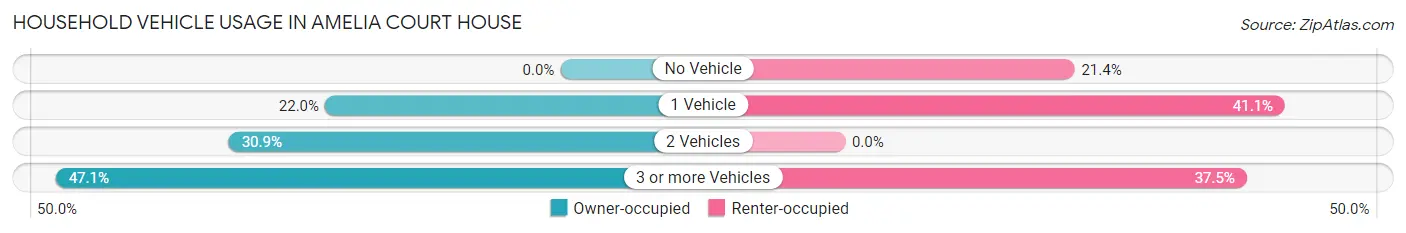
| Vehicles per Household | Owner-occupied | Renter-occupied |
| No Vehicle | 0 (0.0%) | 12 (21.4%) |
| 1 Vehicle | 49 (22.0%) | 23 (41.1%) |
| 2 Vehicles | 69 (30.9%) | 0 (0.0%) |
| 3 or more Vehicles | 105 (47.1%) | 21 (37.5%) |
| Total | 223 (100.0%) | 56 (100.0%) |
Real Estate & Mortgages in Amelia Court House
Real Estate and Mortgage Overview in Amelia Court House
| Characteristic | Without Mortgage | With Mortgage |
| Housing Units | 91 | 132 |
| Median Property Value | $225,000 | $0 |
| Median Household Income | - | - |
| Monthly Housing Costs | $240 | $0 |
| Real Estate Taxes | $722 | $0 |
Property Value by Mortgage Status in Amelia Court House
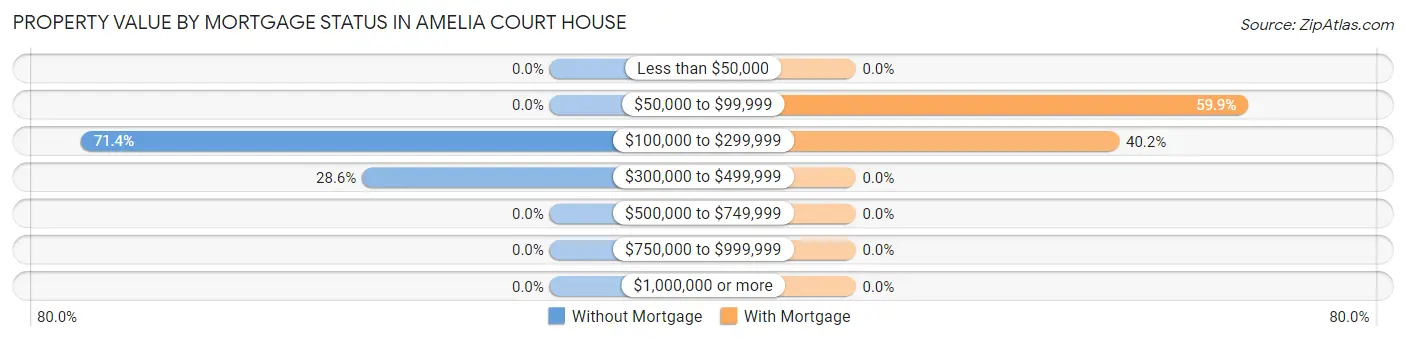
| Property Value | Without Mortgage | With Mortgage |
| Less than $50,000 | 0 (0.0%) | 0 (0.0%) |
| $50,000 to $99,999 | 0 (0.0%) | 79 (59.9%) |
| $100,000 to $299,999 | 65 (71.4%) | 53 (40.2%) |
| $300,000 to $499,999 | 26 (28.6%) | 0 (0.0%) |
| $500,000 to $749,999 | 0 (0.0%) | 0 (0.0%) |
| $750,000 to $999,999 | 0 (0.0%) | 0 (0.0%) |
| $1,000,000 or more | 0 (0.0%) | 0 (0.0%) |
| Total | 91 (100.0%) | 132 (100.0%) |
Household Income by Mortgage Status in Amelia Court House
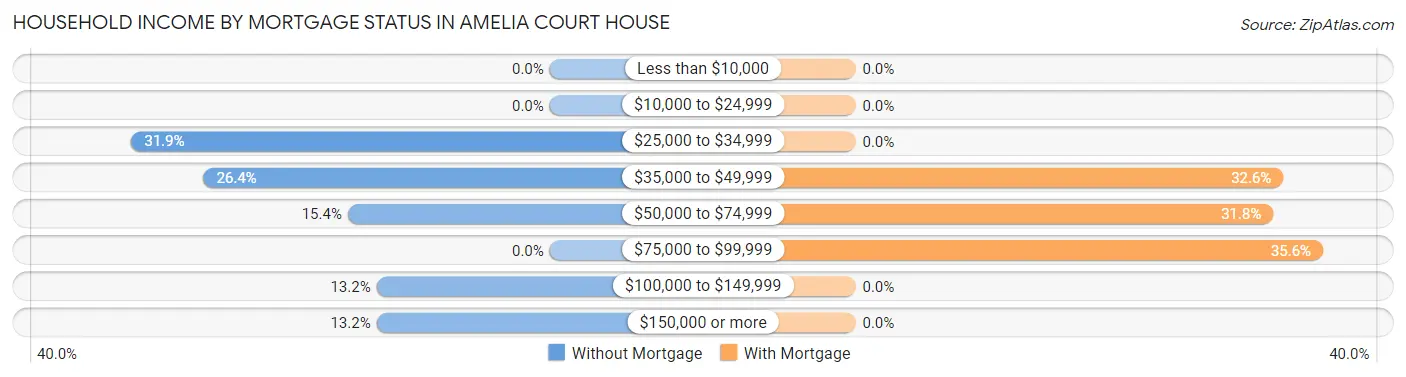
| Household Income | Without Mortgage | With Mortgage |
| Less than $10,000 | 0 (0.0%) | 0 (0.0%) |
| $10,000 to $24,999 | 0 (0.0%) | 0 (0.0%) |
| $25,000 to $34,999 | 29 (31.9%) | 0 (0.0%) |
| $35,000 to $49,999 | 24 (26.4%) | 43 (32.6%) |
| $50,000 to $74,999 | 14 (15.4%) | 42 (31.8%) |
| $75,000 to $99,999 | 0 (0.0%) | 47 (35.6%) |
| $100,000 to $149,999 | 12 (13.2%) | 0 (0.0%) |
| $150,000 or more | 12 (13.2%) | 0 (0.0%) |
| Total | 91 (100.0%) | 132 (100.0%) |
Property Value to Household Income Ratio in Amelia Court House
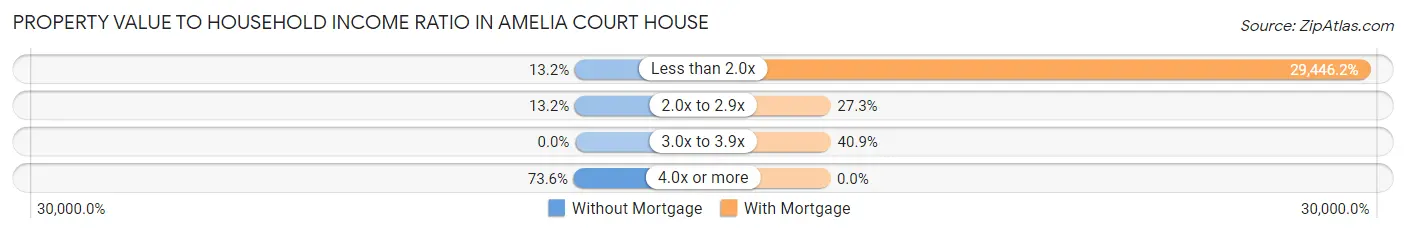
| Value-to-Income Ratio | Without Mortgage | With Mortgage |
| Less than 2.0x | 12 (13.2%) | 38,869 (29,446.2%) |
| 2.0x to 2.9x | 12 (13.2%) | 36 (27.3%) |
| 3.0x to 3.9x | 0 (0.0%) | 54 (40.9%) |
| 4.0x or more | 67 (73.6%) | 0 (0.0%) |
| Total | 91 (100.0%) | 132 (100.0%) |
Real Estate Taxes by Mortgage Status in Amelia Court House
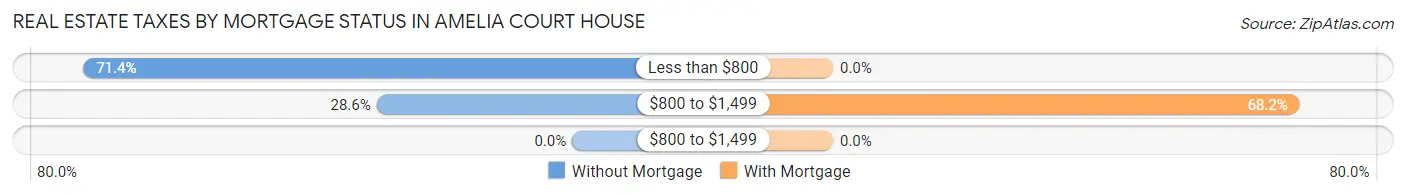
| Property Taxes | Without Mortgage | With Mortgage |
| Less than $800 | 65 (71.4%) | 0 (0.0%) |
| $800 to $1,499 | 26 (28.6%) | 90 (68.2%) |
| $800 to $1,499 | 0 (0.0%) | 0 (0.0%) |
| Total | 91 (100.0%) | 132 (100.0%) |
Health & Disability in Amelia Court House
Health Insurance Coverage by Age in Amelia Court House
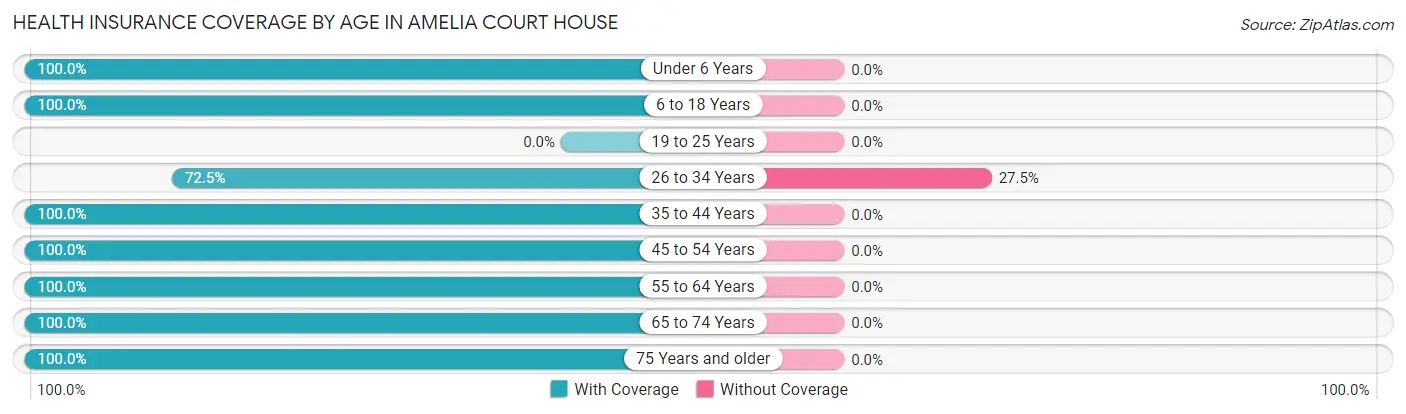
| Age Bracket | With Coverage | Without Coverage |
| Under 6 Years | 129 (100.0%) | 0 (0.0%) |
| 6 to 18 Years | 138 (100.0%) | 0 (0.0%) |
| 19 to 25 Years | 0 (0.0%) | 0 (0.0%) |
| 26 to 34 Years | 124 (72.5%) | 47 (27.5%) |
| 35 to 44 Years | 84 (100.0%) | 0 (0.0%) |
| 45 to 54 Years | 11 (100.0%) | 0 (0.0%) |
| 55 to 64 Years | 168 (100.0%) | 0 (0.0%) |
| 65 to 74 Years | 35 (100.0%) | 0 (0.0%) |
| 75 Years and older | 79 (100.0%) | 0 (0.0%) |
| Total | 768 (94.2%) | 47 (5.8%) |
Health Insurance Coverage by Citizenship Status in Amelia Court House
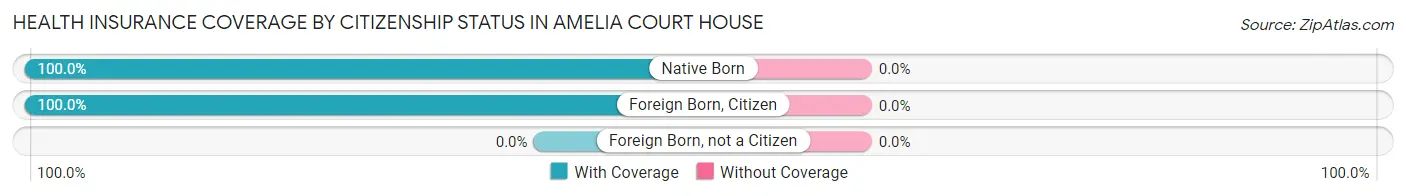
| Citizenship Status | With Coverage | Without Coverage |
| Native Born | 129 (100.0%) | 0 (0.0%) |
| Foreign Born, Citizen | 138 (100.0%) | 0 (0.0%) |
| Foreign Born, not a Citizen | 0 (0.0%) | 0 (0.0%) |
Health Insurance Coverage by Household Income in Amelia Court House
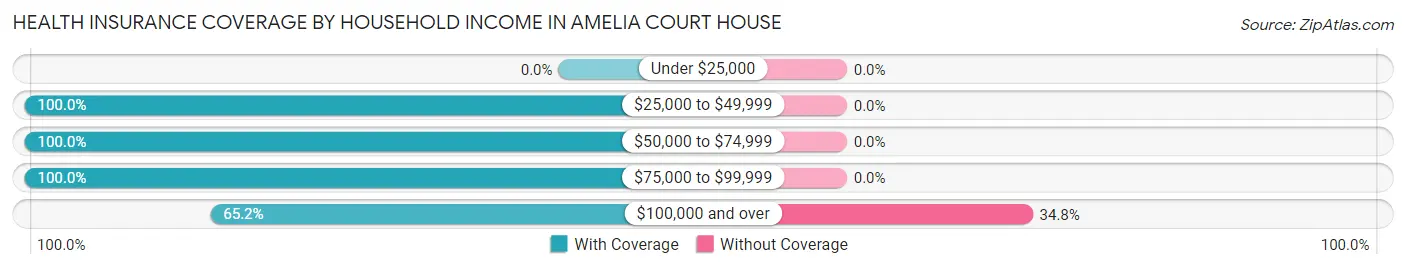
| Household Income | With Coverage | Without Coverage |
| Under $25,000 | 0 (0.0%) | 0 (0.0%) |
| $25,000 to $49,999 | 407 (100.0%) | 0 (0.0%) |
| $50,000 to $74,999 | 192 (100.0%) | 0 (0.0%) |
| $75,000 to $99,999 | 81 (100.0%) | 0 (0.0%) |
| $100,000 and over | 88 (65.2%) | 47 (34.8%) |
Public vs Private Health Insurance Coverage by Age in Amelia Court House
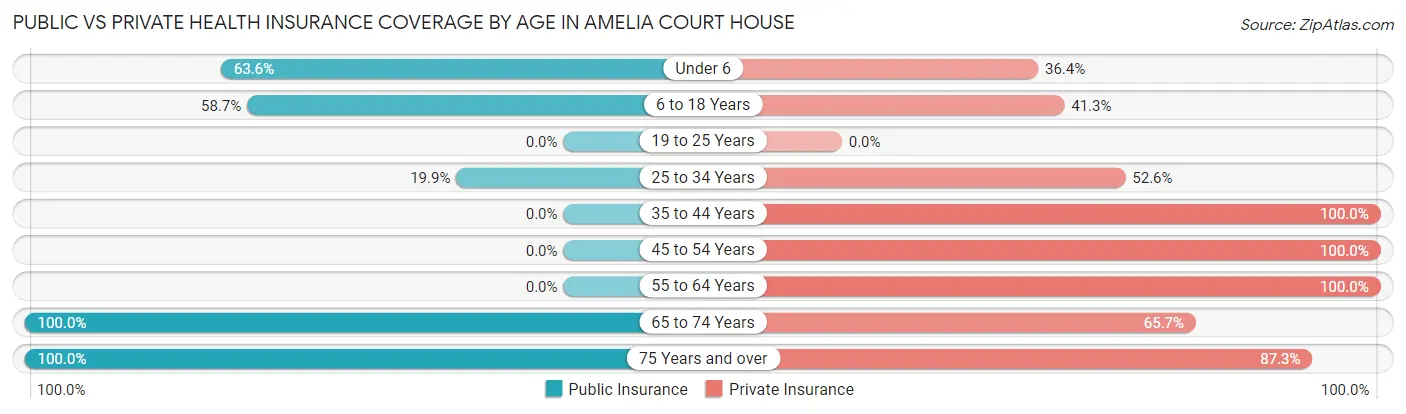
| Age Bracket | Public Insurance | Private Insurance |
| Under 6 | 82 (63.6%) | 47 (36.4%) |
| 6 to 18 Years | 81 (58.7%) | 57 (41.3%) |
| 19 to 25 Years | 0 (0.0%) | 0 (0.0%) |
| 25 to 34 Years | 34 (19.9%) | 90 (52.6%) |
| 35 to 44 Years | 0 (0.0%) | 84 (100.0%) |
| 45 to 54 Years | 0 (0.0%) | 11 (100.0%) |
| 55 to 64 Years | 0 (0.0%) | 168 (100.0%) |
| 65 to 74 Years | 35 (100.0%) | 23 (65.7%) |
| 75 Years and over | 79 (100.0%) | 69 (87.3%) |
| Total | 311 (38.2%) | 549 (67.4%) |
Disability Status by Sex by Age in Amelia Court House
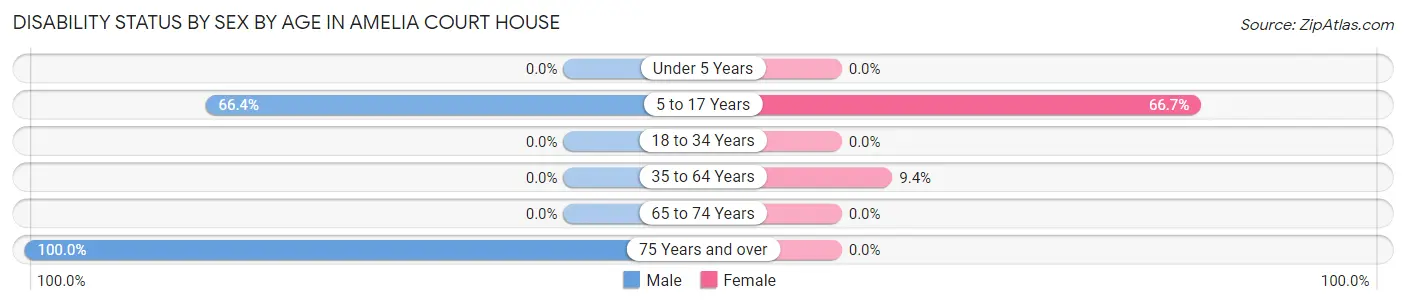
| Age Bracket | Male | Female |
| Under 5 Years | 0 (0.0%) | 0 (0.0%) |
| 5 to 17 Years | 81 (66.4%) | 38 (66.7%) |
| 18 to 34 Years | 0 (0.0%) | 0 (0.0%) |
| 35 to 64 Years | 0 (0.0%) | 15 (9.4%) |
| 65 to 74 Years | 0 (0.0%) | 0 (0.0%) |
| 75 Years and over | 10 (100.0%) | 0 (0.0%) |
Disability Class by Sex by Age in Amelia Court House
Disability Class: Hearing Difficulty
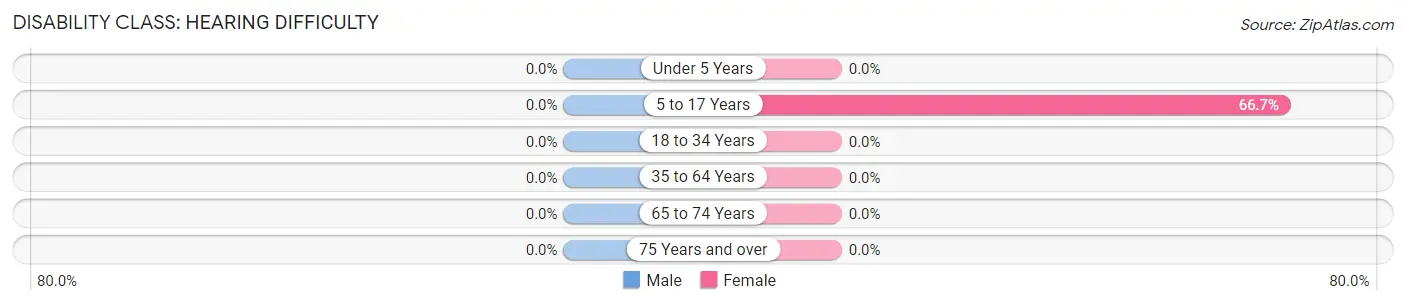
| Age Bracket | Male | Female |
| Under 5 Years | 0 (0.0%) | 0 (0.0%) |
| 5 to 17 Years | 0 (0.0%) | 38 (66.7%) |
| 18 to 34 Years | 0 (0.0%) | 0 (0.0%) |
| 35 to 64 Years | 0 (0.0%) | 0 (0.0%) |
| 65 to 74 Years | 0 (0.0%) | 0 (0.0%) |
| 75 Years and over | 0 (0.0%) | 0 (0.0%) |
Disability Class: Vision Difficulty
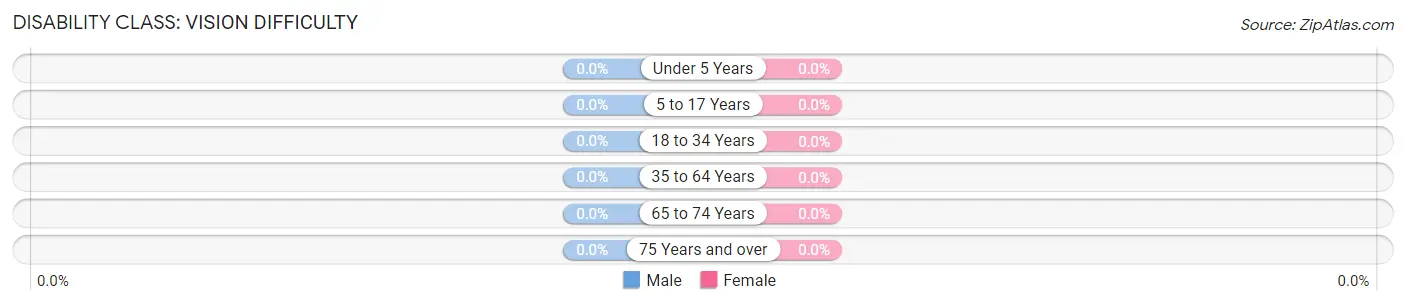
| Age Bracket | Male | Female |
| Under 5 Years | 0 (0.0%) | 0 (0.0%) |
| 5 to 17 Years | 0 (0.0%) | 0 (0.0%) |
| 18 to 34 Years | 0 (0.0%) | 0 (0.0%) |
| 35 to 64 Years | 0 (0.0%) | 0 (0.0%) |
| 65 to 74 Years | 0 (0.0%) | 0 (0.0%) |
| 75 Years and over | 0 (0.0%) | 0 (0.0%) |
Disability Class: Cognitive Difficulty
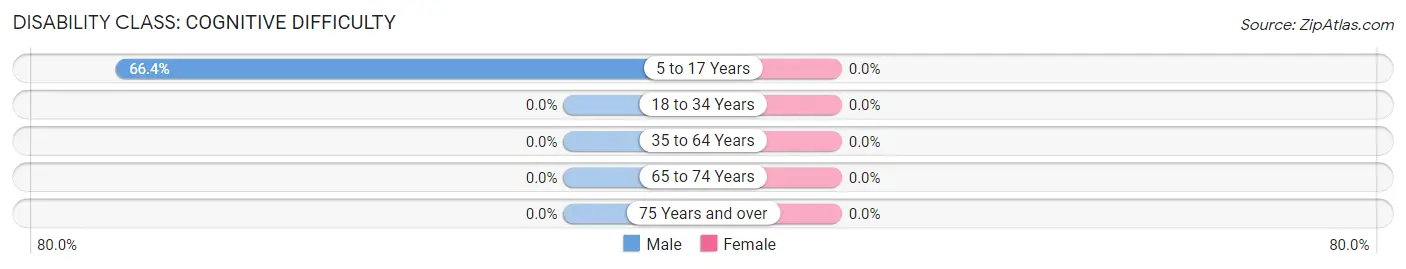
| Age Bracket | Male | Female |
| 5 to 17 Years | 81 (66.4%) | 0 (0.0%) |
| 18 to 34 Years | 0 (0.0%) | 0 (0.0%) |
| 35 to 64 Years | 0 (0.0%) | 0 (0.0%) |
| 65 to 74 Years | 0 (0.0%) | 0 (0.0%) |
| 75 Years and over | 0 (0.0%) | 0 (0.0%) |
Disability Class: Ambulatory Difficulty
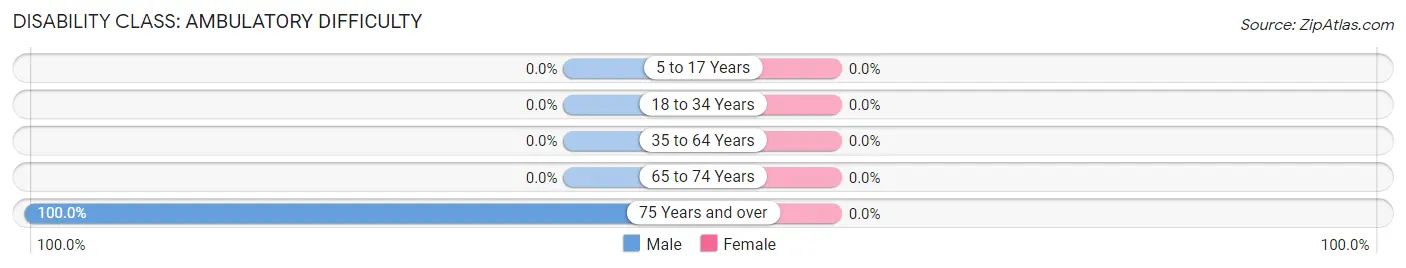
| Age Bracket | Male | Female |
| 5 to 17 Years | 0 (0.0%) | 0 (0.0%) |
| 18 to 34 Years | 0 (0.0%) | 0 (0.0%) |
| 35 to 64 Years | 0 (0.0%) | 0 (0.0%) |
| 65 to 74 Years | 0 (0.0%) | 0 (0.0%) |
| 75 Years and over | 10 (100.0%) | 0 (0.0%) |
Disability Class: Self-Care Difficulty
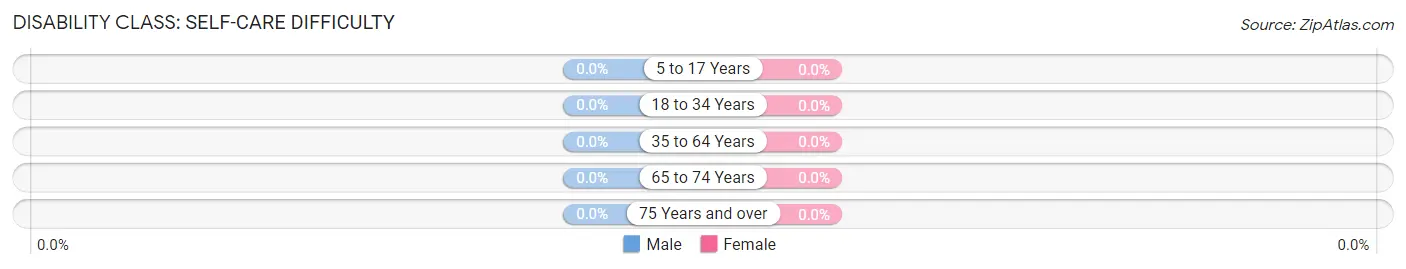
| Age Bracket | Male | Female |
| 5 to 17 Years | 0 (0.0%) | 0 (0.0%) |
| 18 to 34 Years | 0 (0.0%) | 0 (0.0%) |
| 35 to 64 Years | 0 (0.0%) | 0 (0.0%) |
| 65 to 74 Years | 0 (0.0%) | 0 (0.0%) |
| 75 Years and over | 0 (0.0%) | 0 (0.0%) |
Technology Access in Amelia Court House
Computing Device Access in Amelia Court House
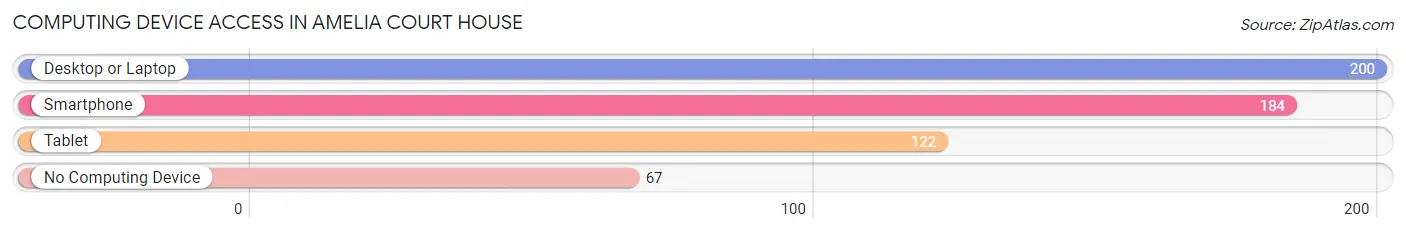
| Device Type | # Households | % Households |
| Desktop or Laptop | 200 | 71.7% |
| Smartphone | 184 | 65.9% |
| Tablet | 122 | 43.7% |
| No Computing Device | 67 | 24.0% |
| Total | 279 | 100.0% |
Internet Access in Amelia Court House
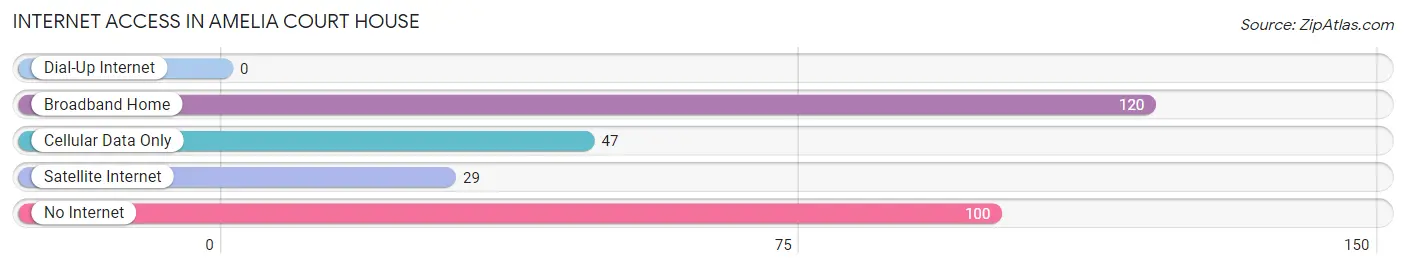
| Internet Type | # Households | % Households |
| Dial-Up Internet | 0 | 0.0% |
| Broadband Home | 120 | 43.0% |
| Cellular Data Only | 47 | 16.9% |
| Satellite Internet | 29 | 10.4% |
| No Internet | 100 | 35.8% |
| Total | 279 | 100.0% |
Amelia Court House Summary
Amelia Court House is a small unincorporated community located in Amelia County, Virginia. It is the county seat of Amelia County and is located approximately 30 miles south of Richmond, Virginia. The population of Amelia Court House was estimated to be 1,093 in 2019.
History
The area that is now Amelia Court House was first settled in the early 1700s by English colonists. The town was originally known as “The Fork” due to its location at the intersection of two major roads. In 1735, the town was officially established and named Amelia Court House after Princess Amelia, the daughter of King George II.
The town was an important center of commerce and government in the region. In 1745, the first courthouse was built in Amelia Court House. The courthouse was used for the county’s court sessions and other government business. In 1786, the town was officially incorporated as a town.
In the early 1800s, Amelia Court House was a bustling center of commerce and industry. The town was home to several stores, a post office, a bank, a hotel, and a variety of other businesses. The town was also home to several churches, including the Amelia Presbyterian Church, which was established in 1812.
In the mid-1800s, the town began to decline in importance as the railroad bypassed Amelia Court House. The town’s population began to decline as well, and by the early 1900s, the town was a small, quiet community.
Geography
Amelia Court House is located in Amelia County, Virginia. The town is situated in the Piedmont region of Virginia, which is characterized by rolling hills and valleys. The town is located approximately 30 miles south of Richmond, Virginia.
The town is located at the intersection of two major roads, US Route 360 and US Route 460. The town is also located near the Appomattox River, which flows through the county.
Economy
The economy of Amelia Court House is largely based on agriculture and tourism. The town is home to several farms, which produce a variety of crops, including corn, soybeans, and wheat. The town is also home to several wineries, which produce a variety of wines.
The town is also home to several small businesses, including restaurants, shops, and other services. The town is also home to several bed and breakfasts, which attract tourists from around the region.
Demographics
As of the 2019 census, the population of Amelia Court House was estimated to be 1,093. The town is predominantly white, with approximately 87.3% of the population identifying as white. The town is also home to a small African American population, with approximately 8.7% of the population identifying as African American. The town is also home to a small Hispanic population, with approximately 2.2% of the population identifying as Hispanic or Latino. The median household income in Amelia Court House is $45,938, and the median home value is $164,400.
Common Questions
What is Per Capita Income in Amelia Court House?
Per Capita income in Amelia Court House is $24,425.
What is the Median Family Income in Amelia Court House?
Median Family Income in Amelia Court House is $70,950.
What is the Median Household income in Amelia Court House?
Median Household Income in Amelia Court House is $39,186.
What is Inequality or Gini Index in Amelia Court House?
Inequality or Gini Index in Amelia Court House is 0.33.
What is the Total Population of Amelia Court House?
Total Population of Amelia Court House is 916.
What is the Total Male Population of Amelia Court House?
Total Male Population of Amelia Court House is 460.
What is the Total Female Population of Amelia Court House?
Total Female Population of Amelia Court House is 456.
What is the Ratio of Males per 100 Females in Amelia Court House?
There are 100.88 Males per 100 Females in Amelia Court House.
What is the Ratio of Females per 100 Males in Amelia Court House?
There are 99.13 Females per 100 Males in Amelia Court House.
What is the Median Population Age in Amelia Court House?
Median Population Age in Amelia Court House is 35.4 Years.
What is the Average Family Size in Amelia Court House
Average Family Size in Amelia Court House is 4.5 People.
What is the Average Household Size in Amelia Court House
Average Household Size in Amelia Court House is 2.9 People.
How Large is the Labor Force in Amelia Court House?
There are 382 People in the Labor Forcein in Amelia Court House.
What is the Percentage of People in the Labor Force in Amelia Court House?
58.9% of People are in the Labor Force in Amelia Court House.
What is the Unemployment Rate in Amelia Court House?
Unemployment Rate in Amelia Court House is 17.0%.