Castlewood, VA Map & Demographics
Castlewood Map
Castlewood Overview
$30,454
PER CAPITA INCOME
$57,601
AVG FAMILY INCOME
$48,750
AVG HOUSEHOLD INCOME
15.1%
WAGE / INCOME GAP [ % ]
84.9¢/ $1
WAGE / INCOME GAP [ $ ]
0.48
INEQUALITY / GINI INDEX
1,122
TOTAL POPULATION
454
MALE POPULATION
668
FEMALE POPULATION
67.96
MALES / 100 FEMALES
147.14
FEMALES / 100 MALES
61.1
MEDIAN AGE
2.1
AVG FAMILY SIZE
1.9
AVG HOUSEHOLD SIZE
347
LABOR FORCE [ PEOPLE ]
31.6%
PERCENT IN LABOR FORCE
2.0%
UNEMPLOYMENT RATE
Castlewood Zip Codes
Castlewood Area Codes
Income in Castlewood
Income Overview in Castlewood
Per Capita Income in Castlewood is $30,454, while median incomes of families and households are $57,601 and $48,750 respectively.
| Characteristic | Number | Measure |
| Per Capita Income | 1,122 | $30,454 |
| Median Family Income | 347 | $57,601 |
| Mean Family Income | 347 | $57,567 |
| Median Household Income | 570 | $48,750 |
| Mean Household Income | 570 | $59,534 |
| Income Deficit | 347 | $0 |
| Wage / Income Gap (%) | 1,122 | 15.09% |
| Wage / Income Gap ($) | 1,122 | 84.91¢ per $1 |
| Gini / Inequality Index | 1,122 | 0.48 |
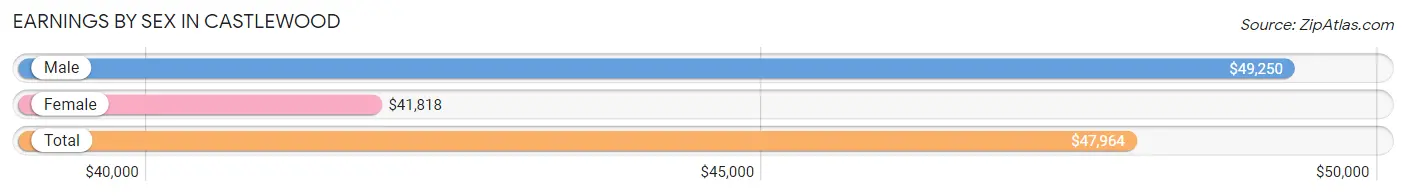
Earnings by Sex in Castlewood
Average Earnings in Castlewood are $47,964, $49,250 for men and $41,818 for women, a difference of 15.1%.
| Sex | Number | Average Earnings |
| Male | 195 (52.8%) | $49,250 |
| Female | 174 (47.1%) | $41,818 |
| Total | 369 (100.0%) | $47,964 |
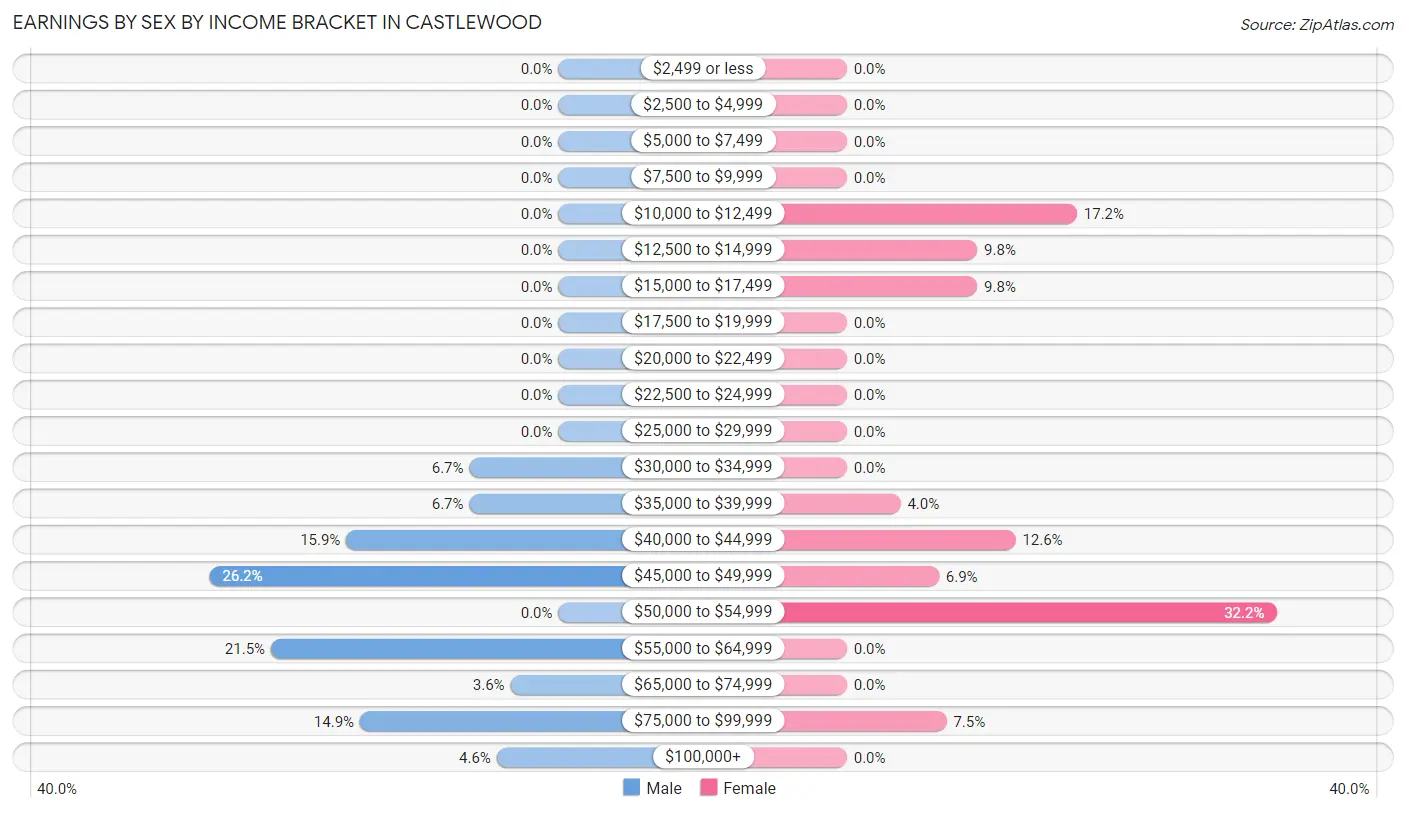
Earnings by Sex by Income Bracket in Castlewood
The most common earnings brackets in Castlewood are $45,000 to $49,999 for men (51 | 26.2%) and $50,000 to $54,999 for women (56 | 32.2%).
| Income | Male | Female |
| $2,499 or less | 0 (0.0%) | 0 (0.0%) |
| $2,500 to $4,999 | 0 (0.0%) | 0 (0.0%) |
| $5,000 to $7,499 | 0 (0.0%) | 0 (0.0%) |
| $7,500 to $9,999 | 0 (0.0%) | 0 (0.0%) |
| $10,000 to $12,499 | 0 (0.0%) | 30 (17.2%) |
| $12,500 to $14,999 | 0 (0.0%) | 17 (9.8%) |
| $15,000 to $17,499 | 0 (0.0%) | 17 (9.8%) |
| $17,500 to $19,999 | 0 (0.0%) | 0 (0.0%) |
| $20,000 to $22,499 | 0 (0.0%) | 0 (0.0%) |
| $22,500 to $24,999 | 0 (0.0%) | 0 (0.0%) |
| $25,000 to $29,999 | 0 (0.0%) | 0 (0.0%) |
| $30,000 to $34,999 | 13 (6.7%) | 0 (0.0%) |
| $35,000 to $39,999 | 13 (6.7%) | 7 (4.0%) |
| $40,000 to $44,999 | 31 (15.9%) | 22 (12.6%) |
| $45,000 to $49,999 | 51 (26.2%) | 12 (6.9%) |
| $50,000 to $54,999 | 0 (0.0%) | 56 (32.2%) |
| $55,000 to $64,999 | 42 (21.5%) | 0 (0.0%) |
| $65,000 to $74,999 | 7 (3.6%) | 0 (0.0%) |
| $75,000 to $99,999 | 29 (14.9%) | 13 (7.5%) |
| $100,000+ | 9 (4.6%) | 0 (0.0%) |
| Total | 195 (100.0%) | 174 (100.0%) |
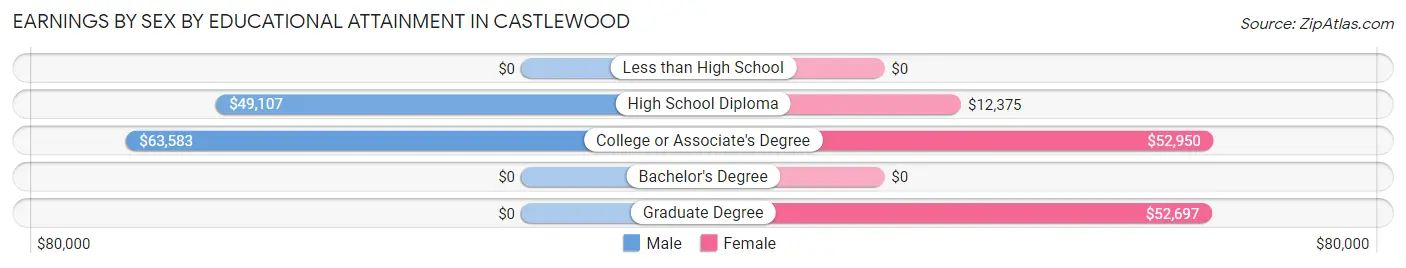
Earnings by Sex by Educational Attainment in Castlewood
Average earnings in Castlewood are $49,250 for men and $42,273 for women, a difference of 14.2%. Men with an educational attainment of college or associate's degree enjoy the highest average annual earnings of $63,583, while those with high school diploma education earn the least with $49,107. Women with an educational attainment of college or associate's degree earn the most with the average annual earnings of $52,950, while those with high school diploma education have the smallest earnings of $12,375.
| Educational Attainment | Male Income | Female Income |
| Less than High School | - | - |
| High School Diploma | $49,107 | $12,375 |
| College or Associate's Degree | $63,583 | $52,950 |
| Bachelor's Degree | - | - |
| Graduate Degree | - | - |
| Total | $49,250 | $42,273 |
Family Income in Castlewood
Family Income Brackets in Castlewood
According to the Castlewood family income data, there are 82 families falling into the $50,000 to $74,999 income range, which is the most common income bracket and makes up 23.6% of all families.
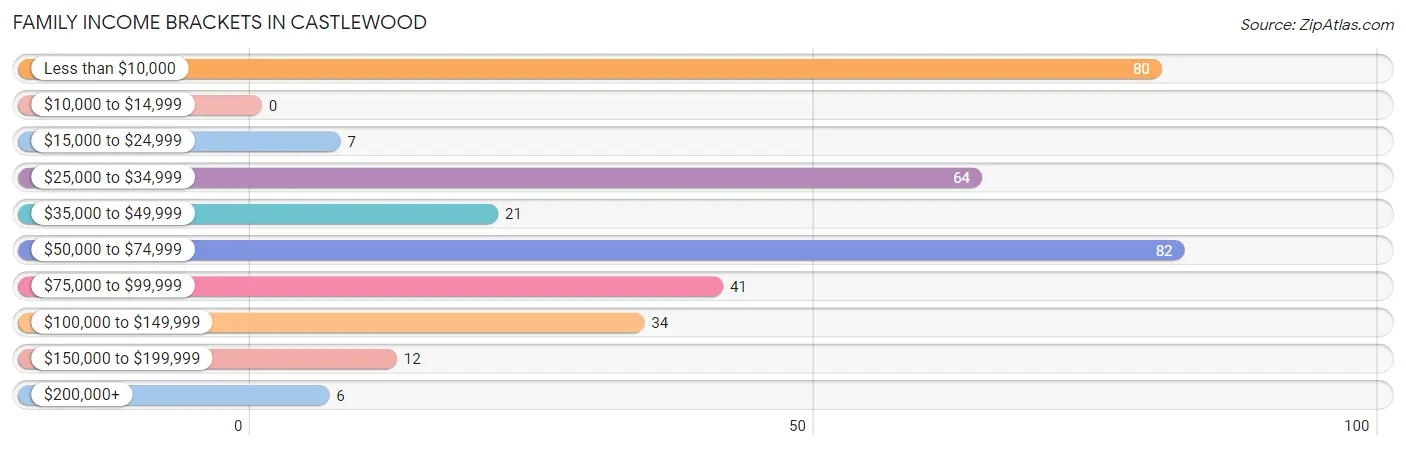
| Income Bracket | # Families | % Families |
| Less than $10,000 | 80 | 23.1% |
| $10,000 to $14,999 | 0 | 0.0% |
| $15,000 to $24,999 | 7 | 2.0% |
| $25,000 to $34,999 | 64 | 18.4% |
| $35,000 to $49,999 | 21 | 6.1% |
| $50,000 to $74,999 | 82 | 23.6% |
| $75,000 to $99,999 | 41 | 11.8% |
| $100,000 to $149,999 | 34 | 9.8% |
| $150,000 to $199,999 | 12 | 3.5% |
| $200,000+ | 6 | 1.7% |
Family Income by Famaliy Size in Castlewood
2-person families (326 | 94.0%) account for the highest median family income in Castlewood with $50,000 per family, while 2-person families (326 | 94.0%) have the highest median income of $25,000 per family member.
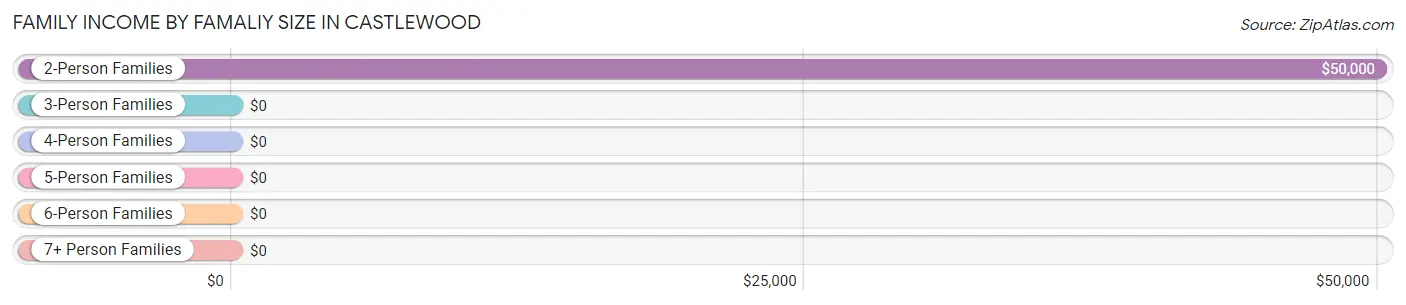
| Income Bracket | # Families | Median Income |
| 2-Person Families | 326 (94.0%) | $50,000 |
| 3-Person Families | 12 (3.5%) | $0 |
| 4-Person Families | 9 (2.6%) | $0 |
| 5-Person Families | 0 (0.0%) | $0 |
| 6-Person Families | 0 (0.0%) | $0 |
| 7+ Person Families | 0 (0.0%) | $0 |
| Total | 347 (100.0%) | $57,601 |
Family Income by Number of Earners in Castlewood
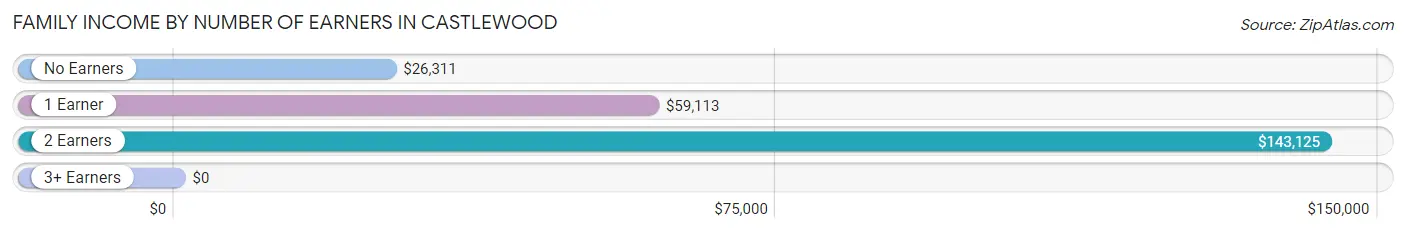
| Number of Earners | # Families | Median Income |
| No Earners | 217 (62.5%) | $26,311 |
| 1 Earner | 64 (18.4%) | $59,113 |
| 2 Earners | 54 (15.6%) | $143,125 |
| 3+ Earners | 12 (3.5%) | $0 |
| Total | 347 (100.0%) | $57,601 |
Household Income in Castlewood
Household Income Brackets in Castlewood
With 139 households falling in the category, the $50,000 to $74,999 income range is the most frequent in Castlewood, accounting for 24.4% of all households. In contrast, only 12 households (2.1%) fall into the $150,000 to $199,999 income bracket, making it the least populous group.
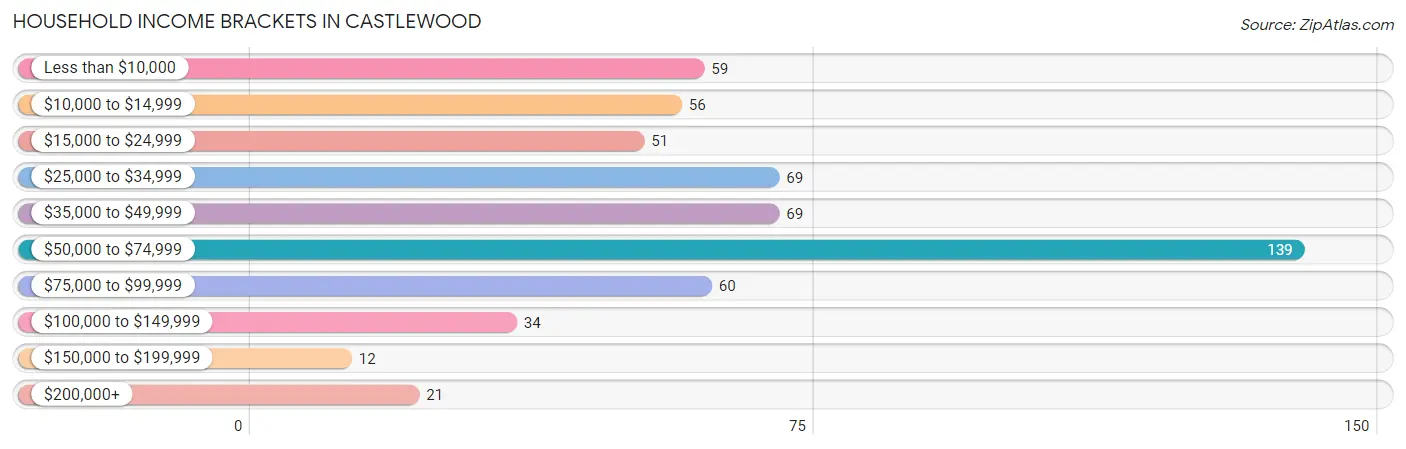
| Income Bracket | # Households | % Households |
| Less than $10,000 | 59 | 10.4% |
| $10,000 to $14,999 | 56 | 9.8% |
| $15,000 to $24,999 | 51 | 8.9% |
| $25,000 to $34,999 | 69 | 12.1% |
| $35,000 to $49,999 | 69 | 12.1% |
| $50,000 to $74,999 | 139 | 24.4% |
| $75,000 to $99,999 | 60 | 10.5% |
| $100,000 to $149,999 | 34 | 6.0% |
| $150,000 to $199,999 | 12 | 2.1% |
| $200,000+ | 21 | 3.7% |
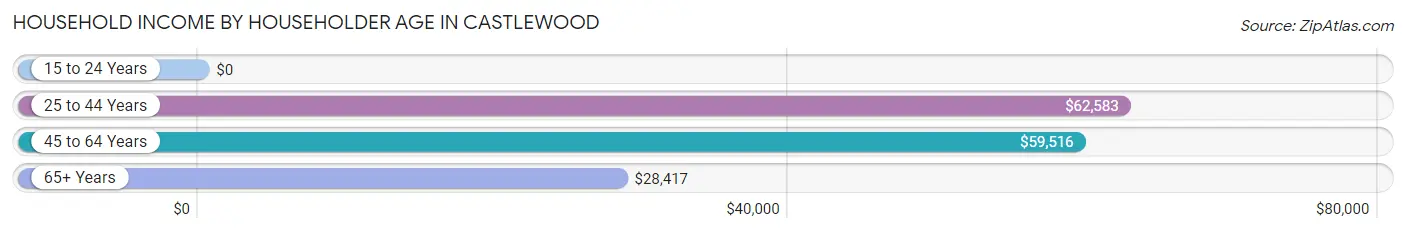
Household Income by Householder Age in Castlewood
The median household income in Castlewood is $48,750, with the highest median household income of $62,583 found in the 25 to 44 years age bracket for the primary householder. A total of 120 households (21.0%) fall into this category.
| Income Bracket | # Households | Median Income |
| 15 to 24 Years | 0 (0.0%) | $0 |
| 25 to 44 Years | 120 (21.0%) | $62,583 |
| 45 to 64 Years | 160 (28.1%) | $59,516 |
| 65+ Years | 290 (50.9%) | $28,417 |
| Total | 570 (100.0%) | $48,750 |
Poverty in Castlewood
Income Below Poverty by Sex and Age in Castlewood
With 20.9% poverty level for males and 37.3% for females among the residents of Castlewood, 55 to 64 year old males and 16 and 17 year old females are the most vulnerable to poverty, with 38 males (38.0%) and 28 females (100.0%) in their respective age groups living below the poverty level.
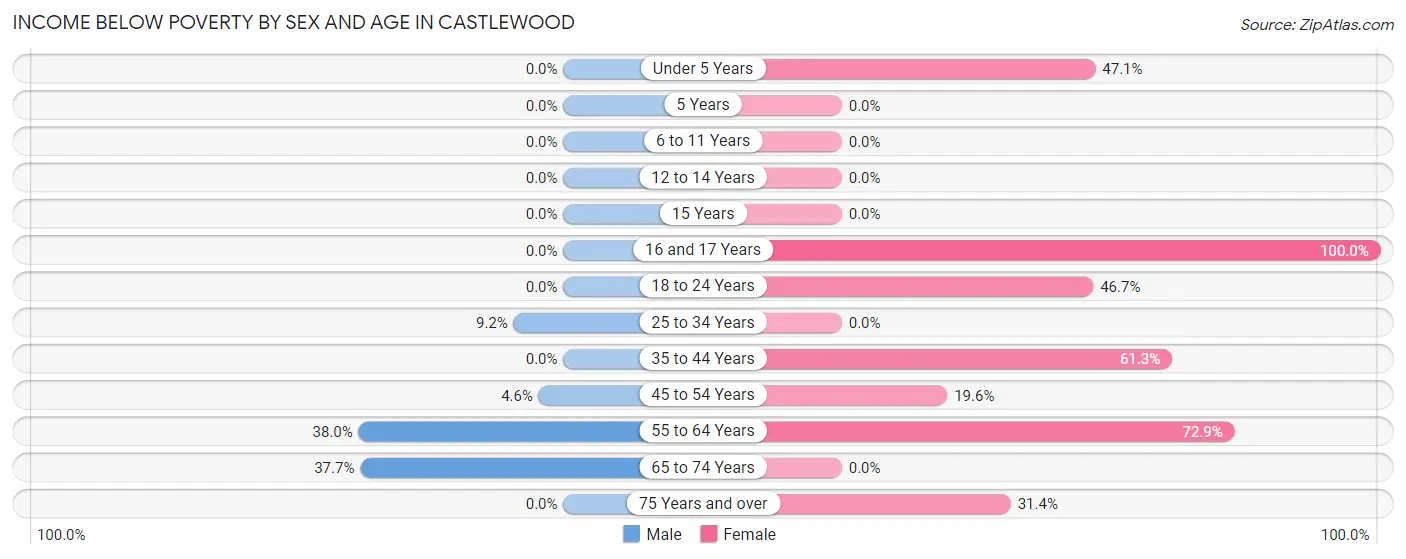
| Age Bracket | Male | Female |
| Under 5 Years | 0 (0.0%) | 8 (47.1%) |
| 5 Years | 0 (0.0%) | 0 (0.0%) |
| 6 to 11 Years | 0 (0.0%) | 0 (0.0%) |
| 12 to 14 Years | 0 (0.0%) | 0 (0.0%) |
| 15 Years | 0 (0.0%) | 0 (0.0%) |
| 16 and 17 Years | 0 (0.0%) | 28 (100.0%) |
| 18 to 24 Years | 0 (0.0%) | 7 (46.7%) |
| 25 to 34 Years | 6 (9.2%) | 0 (0.0%) |
| 35 to 44 Years | 0 (0.0%) | 38 (61.3%) |
| 45 to 54 Years | 3 (4.5%) | 9 (19.6%) |
| 55 to 64 Years | 38 (38.0%) | 121 (72.9%) |
| 65 to 74 Years | 46 (37.7%) | 0 (0.0%) |
| 75 Years and over | 0 (0.0%) | 37 (31.4%) |
| Total | 93 (20.9%) | 248 (37.3%) |
Income Above Poverty by Sex and Age in Castlewood
According to the poverty statistics in Castlewood, males aged 15 years and females aged 25 to 34 years are the age groups that are most secure financially, with 100.0% of males and 100.0% of females in these age groups living above the poverty line.
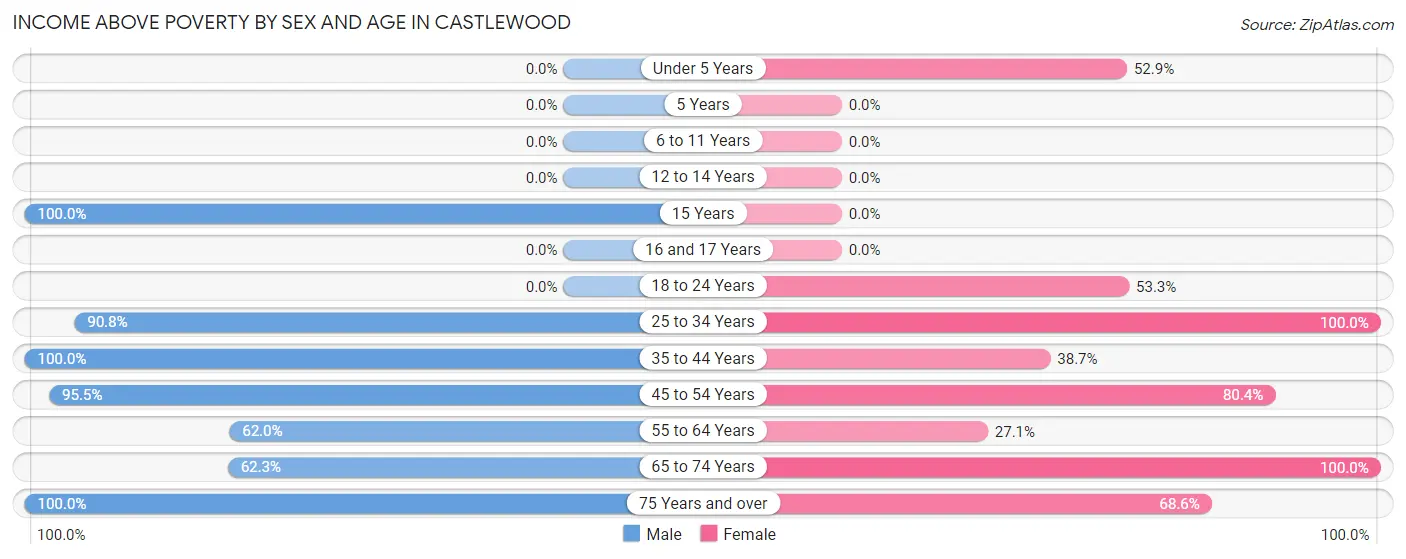
| Age Bracket | Male | Female |
| Under 5 Years | 0 (0.0%) | 9 (52.9%) |
| 5 Years | 0 (0.0%) | 0 (0.0%) |
| 6 to 11 Years | 0 (0.0%) | 0 (0.0%) |
| 12 to 14 Years | 0 (0.0%) | 0 (0.0%) |
| 15 Years | 8 (100.0%) | 0 (0.0%) |
| 16 and 17 Years | 0 (0.0%) | 0 (0.0%) |
| 18 to 24 Years | 0 (0.0%) | 8 (53.3%) |
| 25 to 34 Years | 59 (90.8%) | 50 (100.0%) |
| 35 to 44 Years | 46 (100.0%) | 24 (38.7%) |
| 45 to 54 Years | 63 (95.5%) | 37 (80.4%) |
| 55 to 64 Years | 62 (62.0%) | 45 (27.1%) |
| 65 to 74 Years | 76 (62.3%) | 163 (100.0%) |
| 75 Years and over | 37 (100.0%) | 81 (68.6%) |
| Total | 351 (79.0%) | 417 (62.7%) |
Income Below Poverty Among Married-Couple Families in Castlewood
The poverty statistics for married-couple families in Castlewood show that 17.5% or 42 of the total 240 families live below the poverty line. Families with 1 or 2 children have the highest poverty rate of 100.0%, comprising of 9 families. On the other hand, families with no children have the lowest poverty rate of 14.3%, which includes 33 families.
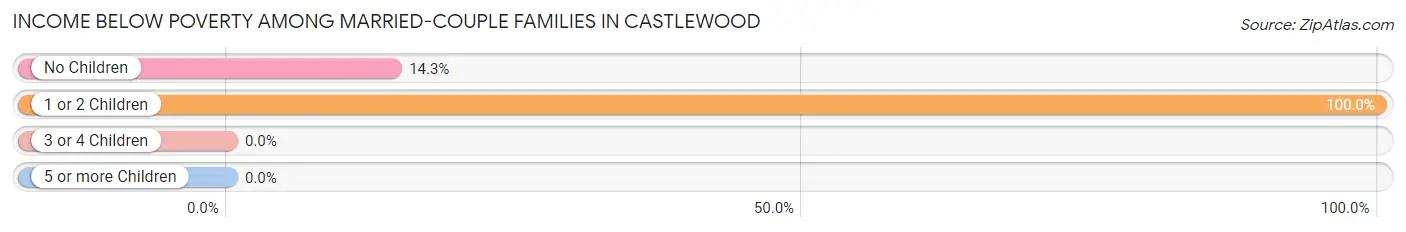
| Children | Above Poverty | Below Poverty |
| No Children | 198 (85.7%) | 33 (14.3%) |
| 1 or 2 Children | 0 (0.0%) | 9 (100.0%) |
| 3 or 4 Children | 0 (0.0%) | 0 (0.0%) |
| 5 or more Children | 0 (0.0%) | 0 (0.0%) |
| Total | 198 (82.5%) | 42 (17.5%) |
Income Below Poverty Among Single-Parent Households in Castlewood
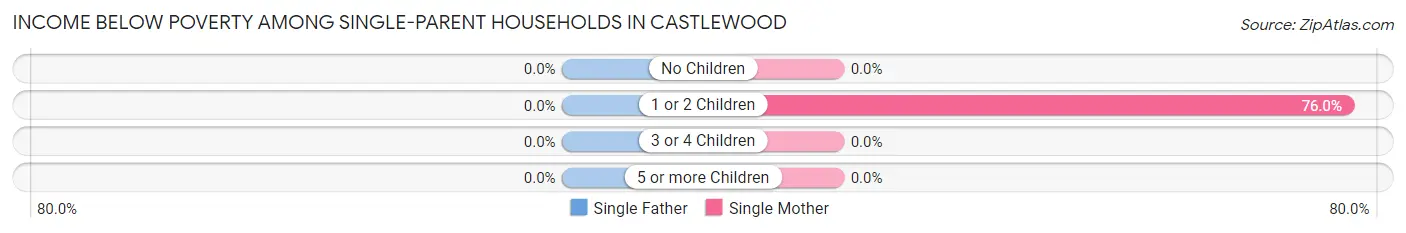
| Children | Single Father | Single Mother |
| No Children | 0 (0.0%) | 0 (0.0%) |
| 1 or 2 Children | 0 (0.0%) | 38 (76.0%) |
| 3 or 4 Children | 0 (0.0%) | 0 (0.0%) |
| 5 or more Children | 0 (0.0%) | 0 (0.0%) |
| Total | 0 (0.0%) | 38 (41.8%) |
Income Below Poverty Among Married-Couple vs Single-Parent Households in Castlewood
The poverty data for Castlewood shows that 42 of the married-couple family households (17.5%) and 38 of the single-parent households (35.5%) are living below the poverty level. Within the married-couple family households, those with 1 or 2 children have the highest poverty rate, with 9 households (100.0%) falling below the poverty line. Among the single-parent households, those with 1 or 2 children have the highest poverty rate, with 38 household (66.7%) living below poverty.
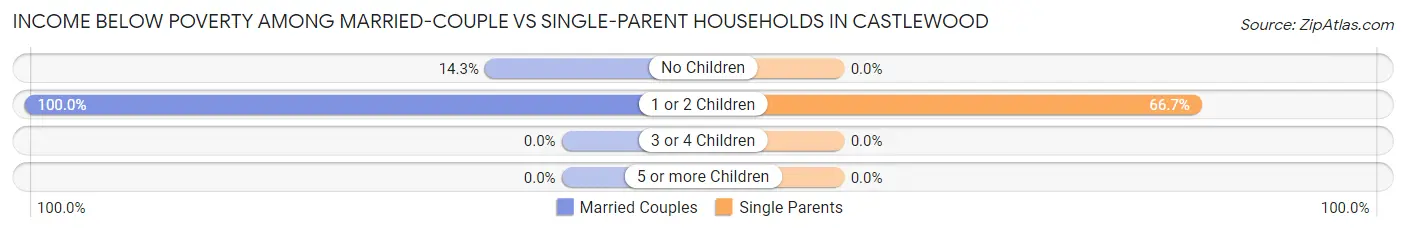
| Children | Married-Couple Families | Single-Parent Households |
| No Children | 33 (14.3%) | 0 (0.0%) |
| 1 or 2 Children | 9 (100.0%) | 38 (66.7%) |
| 3 or 4 Children | 0 (0.0%) | 0 (0.0%) |
| 5 or more Children | 0 (0.0%) | 0 (0.0%) |
| Total | 42 (17.5%) | 38 (35.5%) |
Race in Castlewood
The most populous races in Castlewood are White / Caucasian (1,121 | 99.9%), and Two or more Races (1 | 0.1%).
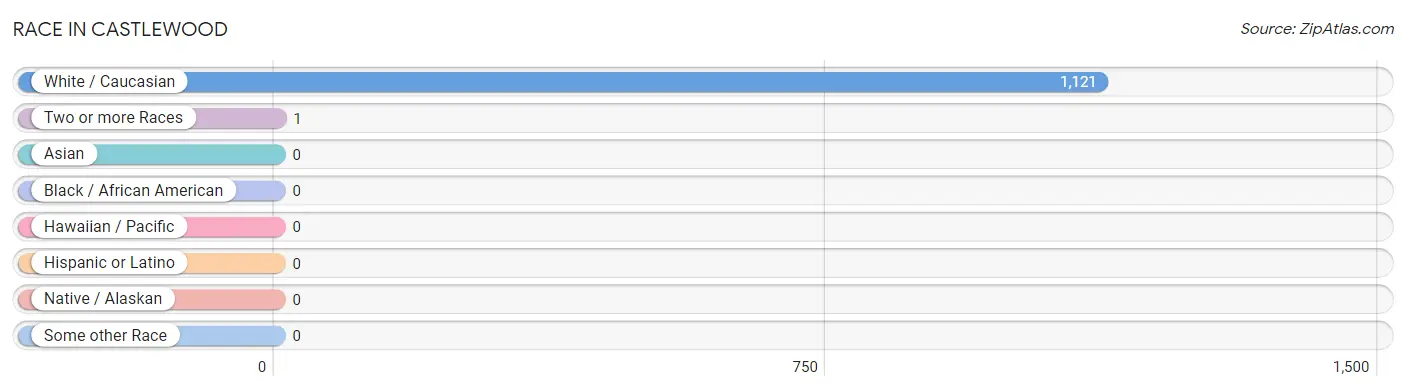
| Race | # Population | % Population |
| Asian | 0 | 0.0% |
| Black / African American | 0 | 0.0% |
| Hawaiian / Pacific | 0 | 0.0% |
| Hispanic or Latino | 0 | 0.0% |
| Native / Alaskan | 0 | 0.0% |
| White / Caucasian | 1,121 | 99.9% |
| Two or more Races | 1 | 0.1% |
| Some other Race | 0 | 0.0% |
| Total | 1,122 | 100.0% |
Ancestry in Castlewood
The most populous ancestries reported in Castlewood are American (750 | 66.8%), Irish (57 | 5.1%), English (53 | 4.7%), German (25 | 2.2%), and European (18 | 1.6%), together accounting for 80.5% of all Castlewood residents.
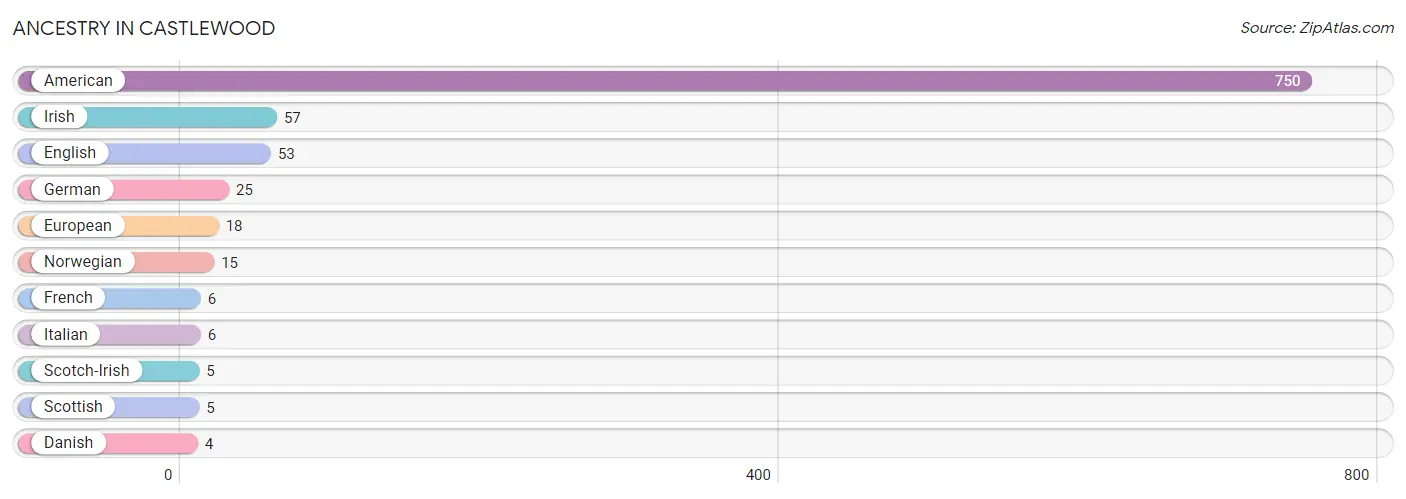
| Ancestry | # Population | % Population |
| American | 750 | 66.8% |
| Danish | 4 | 0.4% |
| English | 53 | 4.7% |
| European | 18 | 1.6% |
| French | 6 | 0.5% |
| German | 25 | 2.2% |
| Irish | 57 | 5.1% |
| Italian | 6 | 0.5% |
| Norwegian | 15 | 1.3% |
| Scotch-Irish | 5 | 0.4% |
| Scottish | 5 | 0.4% | View All 11 Rows |
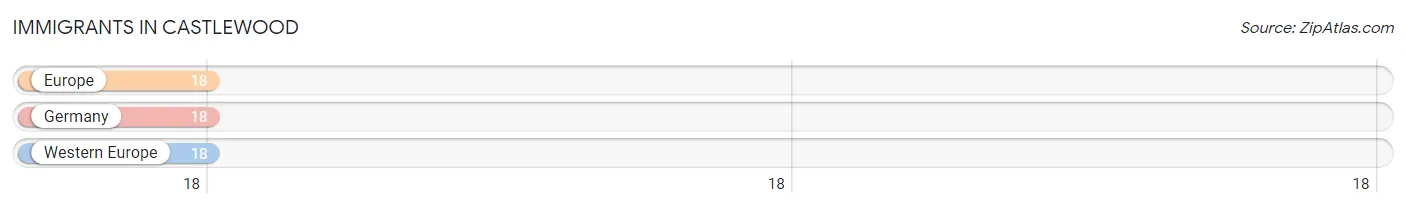
Immigrants in Castlewood
The most numerous immigrant groups reported in Castlewood came from Europe (18 | 1.6%), Germany (18 | 1.6%), and Western Europe (18 | 1.6%), together accounting for 4.8% of all Castlewood residents.
| Immigration Origin | # Population | % Population |
| Europe | 18 | 1.6% |
| Germany | 18 | 1.6% |
| Western Europe | 18 | 1.6% | View All 3 Rows |
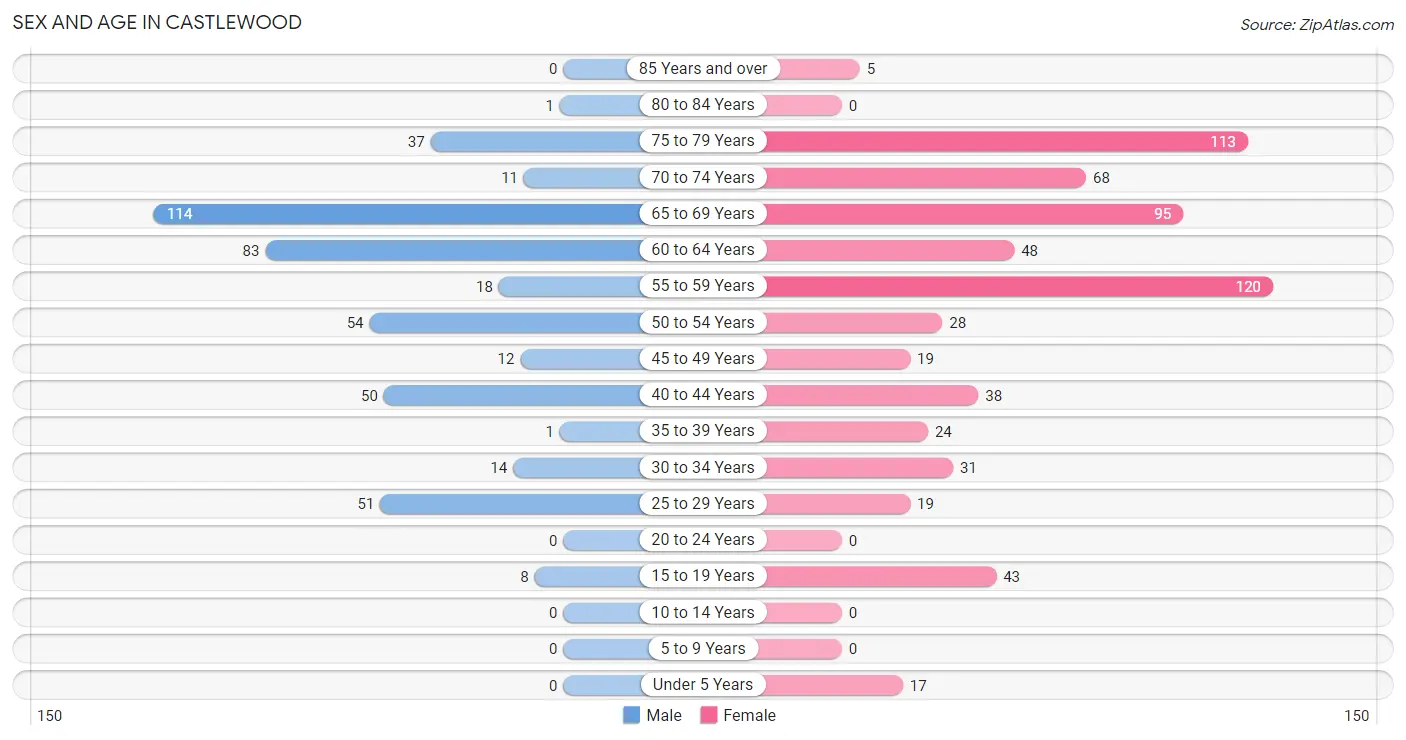
Sex and Age in Castlewood
Sex and Age in Castlewood
The most populous age groups in Castlewood are 65 to 69 Years (114 | 25.1%) for men and 55 to 59 Years (120 | 18.0%) for women.
| Age Bracket | Male | Female |
| Under 5 Years | 0 (0.0%) | 17 (2.5%) |
| 5 to 9 Years | 0 (0.0%) | 0 (0.0%) |
| 10 to 14 Years | 0 (0.0%) | 0 (0.0%) |
| 15 to 19 Years | 8 (1.8%) | 43 (6.4%) |
| 20 to 24 Years | 0 (0.0%) | 0 (0.0%) |
| 25 to 29 Years | 51 (11.2%) | 19 (2.8%) |
| 30 to 34 Years | 14 (3.1%) | 31 (4.6%) |
| 35 to 39 Years | 1 (0.2%) | 24 (3.6%) |
| 40 to 44 Years | 50 (11.0%) | 38 (5.7%) |
| 45 to 49 Years | 12 (2.6%) | 19 (2.8%) |
| 50 to 54 Years | 54 (11.9%) | 28 (4.2%) |
| 55 to 59 Years | 18 (4.0%) | 120 (18.0%) |
| 60 to 64 Years | 83 (18.3%) | 48 (7.2%) |
| 65 to 69 Years | 114 (25.1%) | 95 (14.2%) |
| 70 to 74 Years | 11 (2.4%) | 68 (10.2%) |
| 75 to 79 Years | 37 (8.2%) | 113 (16.9%) |
| 80 to 84 Years | 1 (0.2%) | 0 (0.0%) |
| 85 Years and over | 0 (0.0%) | 5 (0.7%) |
| Total | 454 (100.0%) | 668 (100.0%) |
Families and Households in Castlewood
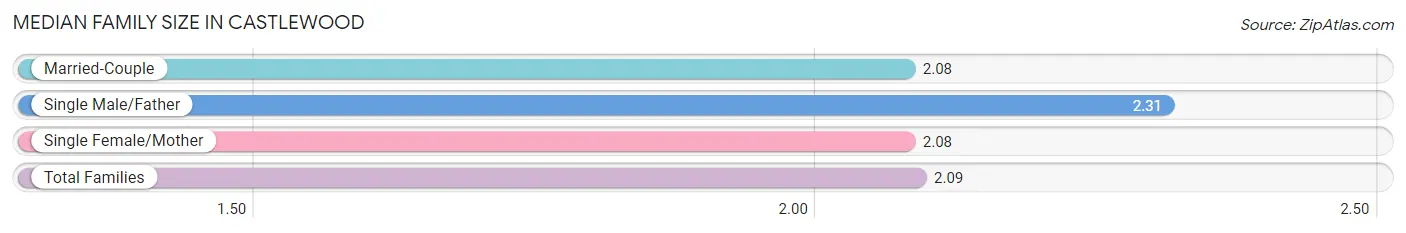
Median Family Size in Castlewood
The median family size in Castlewood is 2.09 persons per family, with single male/father families (16 | 4.6%) accounting for the largest median family size of 2.31 persons per family. On the other hand, married-couple families (240 | 69.2%) represent the smallest median family size with 2.08 persons per family.
| Family Type | # Families | Family Size |
| Married-Couple | 240 (69.2%) | 2.08 |
| Single Male/Father | 16 (4.6%) | 2.31 |
| Single Female/Mother | 91 (26.2%) | 2.08 |
| Total Families | 347 (100.0%) | 2.09 |
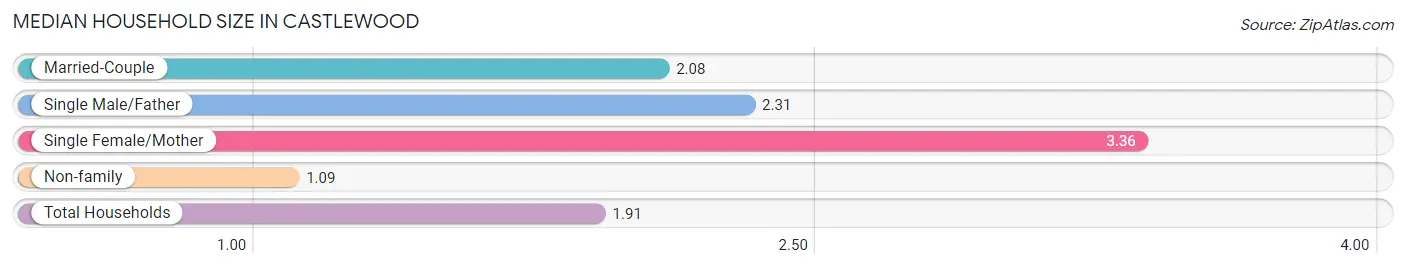
Median Household Size in Castlewood
The median household size in Castlewood is 1.91 persons per household, with single female/mother households (91 | 16.0%) accounting for the largest median household size of 3.36 persons per household. non-family households (223 | 39.1%) represent the smallest median household size with 1.09 persons per household.
| Household Type | # Households | Household Size |
| Married-Couple | 240 (42.1%) | 2.08 |
| Single Male/Father | 16 (2.8%) | 2.31 |
| Single Female/Mother | 91 (16.0%) | 3.36 |
| Non-family | 223 (39.1%) | 1.09 |
| Total Households | 570 (100.0%) | 1.91 |
Household Size by Marriage Status in Castlewood
Out of a total of 570 households in Castlewood, 347 (60.9%) are family households, while 223 (39.1%) are nonfamily households. The most numerous type of family households are 2-person households, comprising 263, and the most common type of nonfamily households are 1-person households, comprising 201.
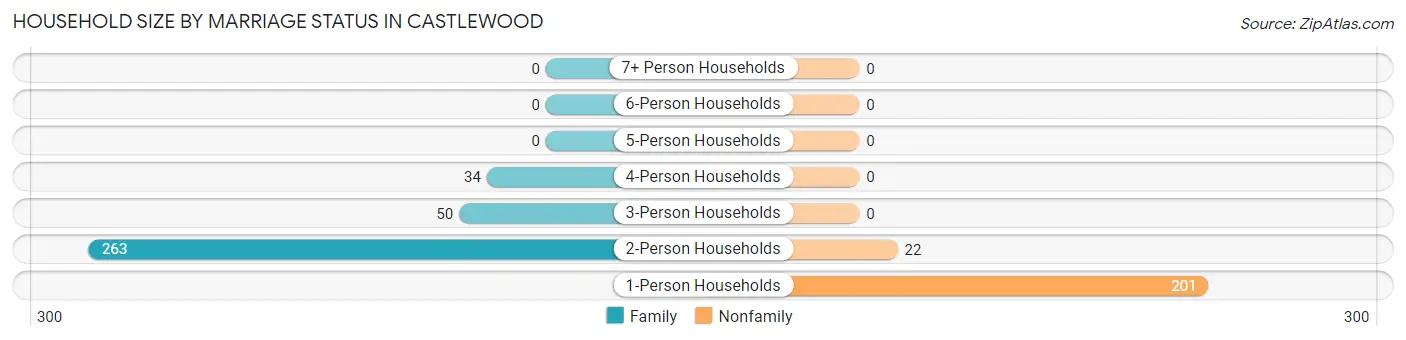
| Household Size | Family Households | Nonfamily Households |
| 1-Person Households | - | 201 (35.3%) |
| 2-Person Households | 263 (46.1%) | 22 (3.9%) |
| 3-Person Households | 50 (8.8%) | 0 (0.0%) |
| 4-Person Households | 34 (6.0%) | 0 (0.0%) |
| 5-Person Households | 0 (0.0%) | 0 (0.0%) |
| 6-Person Households | 0 (0.0%) | 0 (0.0%) |
| 7+ Person Households | 0 (0.0%) | 0 (0.0%) |
| Total | 347 (60.9%) | 223 (39.1%) |
Female Fertility in Castlewood
Fertility by Age in Castlewood
| Age Bracket | Women with Births | Births / 1,000 Women |
| 15 to 19 years | 0 (0.0%) | 0.0 |
| 20 to 34 years | 0 (0.0%) | 0.0 |
| 35 to 50 years | 0 (0.0%) | 0.0 |
| Total | 0 (0.0%) | 0.0 |
Fertility by Age by Marriage Status in Castlewood
| Age Bracket | Married | Unmarried |
| 15 to 19 years | 0 (0.0%) | 0 (0.0%) |
| 20 to 34 years | 0 (0.0%) | 0 (0.0%) |
| 35 to 50 years | 0 (0.0%) | 0 (0.0%) |
| Total | 0 (0.0%) | 0 (0.0%) |
Fertility by Education in Castlewood
| Educational Attainment | Women with Births | Births / 1,000 Women |
| Less than High School | 0 (0.0%) | 0.0 |
| High School Diploma | 0 (0.0%) | 0.0 |
| College or Associate's Degree | 0 (0.0%) | 0.0 |
| Bachelor's Degree | 0 (0.0%) | 0.0 |
| Graduate Degree | 0 (0.0%) | 0.0 |
| Total | 0 (0.0%) | 0.0 |
Fertility by Education by Marriage Status in Castlewood
| Educational Attainment | Married | Unmarried |
| Less than High School | 0 (0.0%) | 0 (0.0%) |
| High School Diploma | 0 (0.0%) | 0 (0.0%) |
| College or Associate's Degree | 0 (0.0%) | 0 (0.0%) |
| Bachelor's Degree | 0 (0.0%) | 0 (0.0%) |
| Graduate Degree | 0 (0.0%) | 0 (0.0%) |
| Total | 0 (0.0%) | 0 (0.0%) |
Employment Characteristics in Castlewood
Employment by Class of Employer in Castlewood
Among the 305 employed individuals in Castlewood, private company employees (146 | 47.9%), not-for-profit organizations (96 | 31.5%), and self-employed (incorporated) (30 | 9.8%) make up the most common classes of employment.
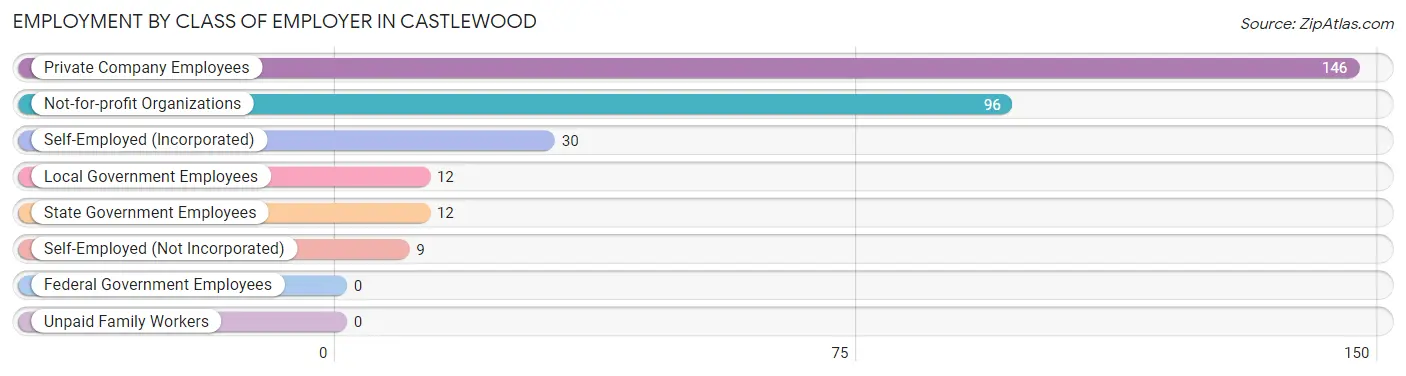
| Employer Class | # Employees | % Employees |
| Private Company Employees | 146 | 47.9% |
| Self-Employed (Incorporated) | 30 | 9.8% |
| Self-Employed (Not Incorporated) | 9 | 2.9% |
| Not-for-profit Organizations | 96 | 31.5% |
| Local Government Employees | 12 | 3.9% |
| State Government Employees | 12 | 3.9% |
| Federal Government Employees | 0 | 0.0% |
| Unpaid Family Workers | 0 | 0.0% |
| Total | 305 | 100.0% |
Employment Status by Age in Castlewood
According to the labor force statistics for Castlewood, out of the total population over 16 years of age (1,097), 31.6% or 347 individuals are in the labor force, with 2.0% or 7 of them unemployed. The age group with the highest labor force participation rate is 25 to 29 years, with 92.9% or 65 individuals in the labor force. Within the labor force, the 45 to 54 years age range has the highest percentage of unemployed individuals, with 7.3% or 7 of them being unemployed.
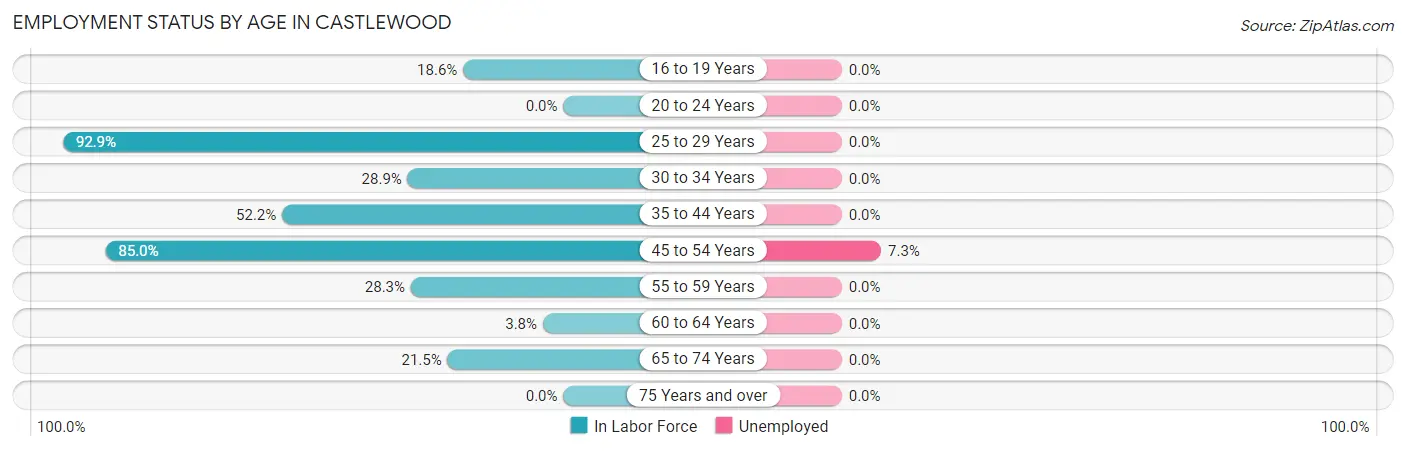
| Age Bracket | In Labor Force | Unemployed |
| 16 to 19 Years | 8 (18.6%) | 0 (0.0%) |
| 20 to 24 Years | 0 (0.0%) | 0 (0.0%) |
| 25 to 29 Years | 65 (92.9%) | 0 (0.0%) |
| 30 to 34 Years | 13 (28.9%) | 0 (0.0%) |
| 35 to 44 Years | 59 (52.2%) | 0 (0.0%) |
| 45 to 54 Years | 96 (85.0%) | 7 (7.3%) |
| 55 to 59 Years | 39 (28.3%) | 0 (0.0%) |
| 60 to 64 Years | 5 (3.8%) | 0 (0.0%) |
| 65 to 74 Years | 62 (21.5%) | 0 (0.0%) |
| 75 Years and over | 0 (0.0%) | 0 (0.0%) |
| Total | 347 (31.6%) | 7 (2.0%) |
Employment Status by Educational Attainment in Castlewood
According to labor force statistics for Castlewood, 45.4% of individuals (277) out of the total population between 25 and 64 years of age (610) are in the labor force, with 2.5% or 7 of them being unemployed. The group with the highest labor force participation rate are those with the educational attainment of bachelor's degree or higher, with 81.8% or 45 individuals in the labor force. Within the labor force, individuals with less than high school education have the highest percentage of unemployment, with 18.4% or 7 of them being unemployed.
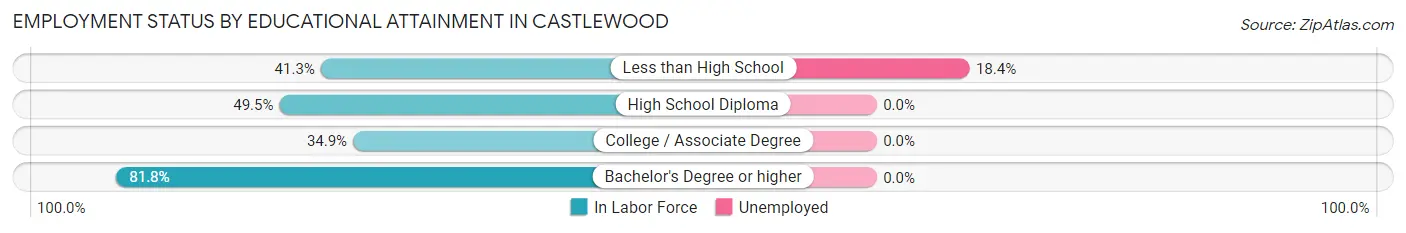
| Educational Attainment | In Labor Force | Unemployed |
| Less than High School | 38 (41.3%) | 17 (18.4%) |
| High School Diploma | 110 (49.5%) | 0 (0.0%) |
| College / Associate Degree | 84 (34.9%) | 0 (0.0%) |
| Bachelor's Degree or higher | 45 (81.8%) | 0 (0.0%) |
| Total | 277 (45.4%) | 15 (2.5%) |
Employment Occupations by Sex in Castlewood
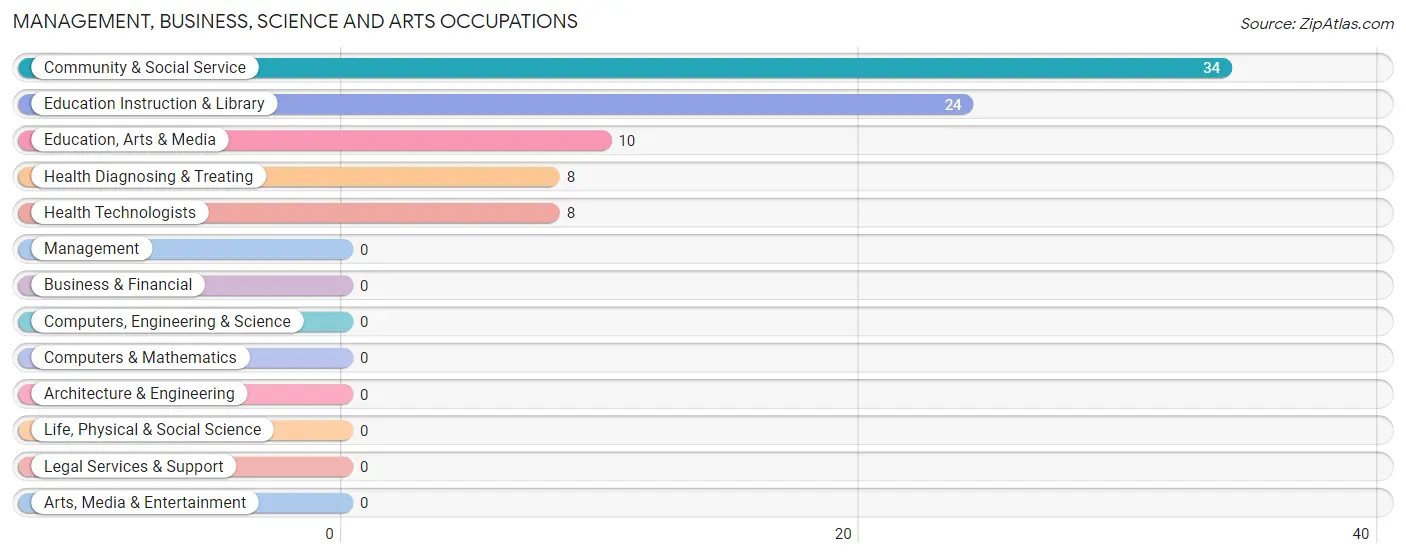
Management, Business, Science and Arts Occupations
The most common Management, Business, Science and Arts occupations in Castlewood are Community & Social Service (34 | 10.0%), Education Instruction & Library (24 | 7.1%), Education, Arts & Media (10 | 2.9%), Health Diagnosing & Treating (8 | 2.4%), and Health Technologists (8 | 2.4%).
Management, Business, Science and Arts Occupations by Sex
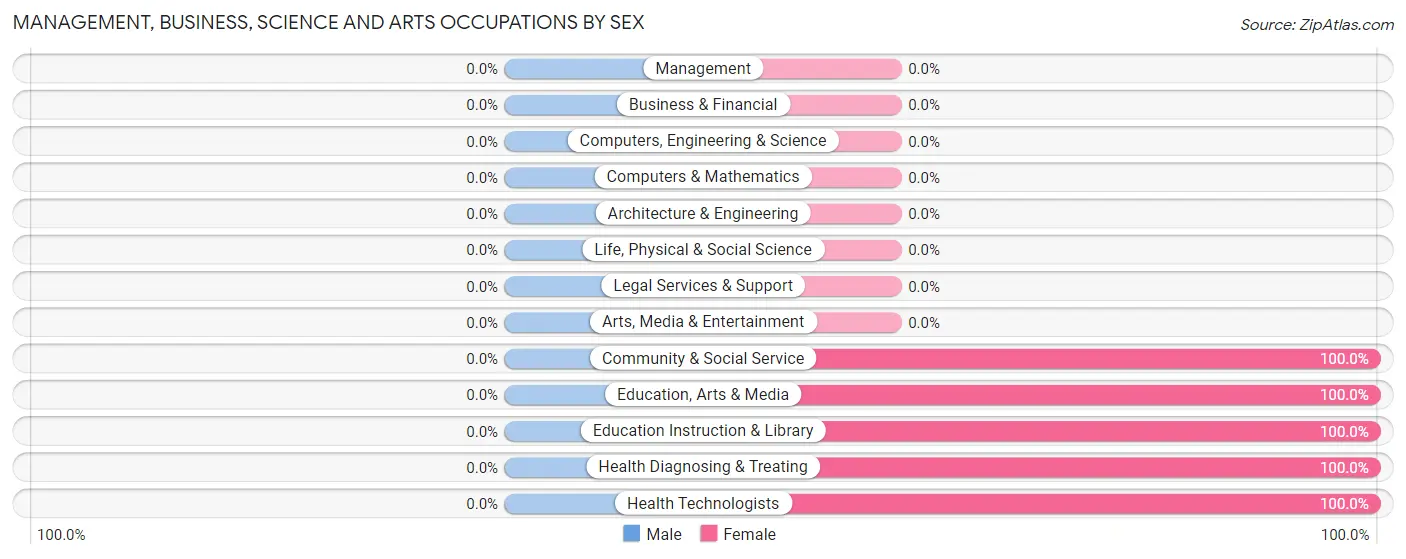
| Occupation | Male | Female |
| Management | 0 (0.0%) | 0 (0.0%) |
| Business & Financial | 0 (0.0%) | 0 (0.0%) |
| Computers, Engineering & Science | 0 (0.0%) | 0 (0.0%) |
| Computers & Mathematics | 0 (0.0%) | 0 (0.0%) |
| Architecture & Engineering | 0 (0.0%) | 0 (0.0%) |
| Life, Physical & Social Science | 0 (0.0%) | 0 (0.0%) |
| Community & Social Service | 0 (0.0%) | 34 (100.0%) |
| Education, Arts & Media | 0 (0.0%) | 10 (100.0%) |
| Legal Services & Support | 0 (0.0%) | 0 (0.0%) |
| Education Instruction & Library | 0 (0.0%) | 24 (100.0%) |
| Arts, Media & Entertainment | 0 (0.0%) | 0 (0.0%) |
| Health Diagnosing & Treating | 0 (0.0%) | 8 (100.0%) |
| Health Technologists | 0 (0.0%) | 8 (100.0%) |
| Total (Category) | 0 (0.0%) | 42 (100.0%) |
| Total (Overall) | 173 (50.9%) | 167 (49.1%) |
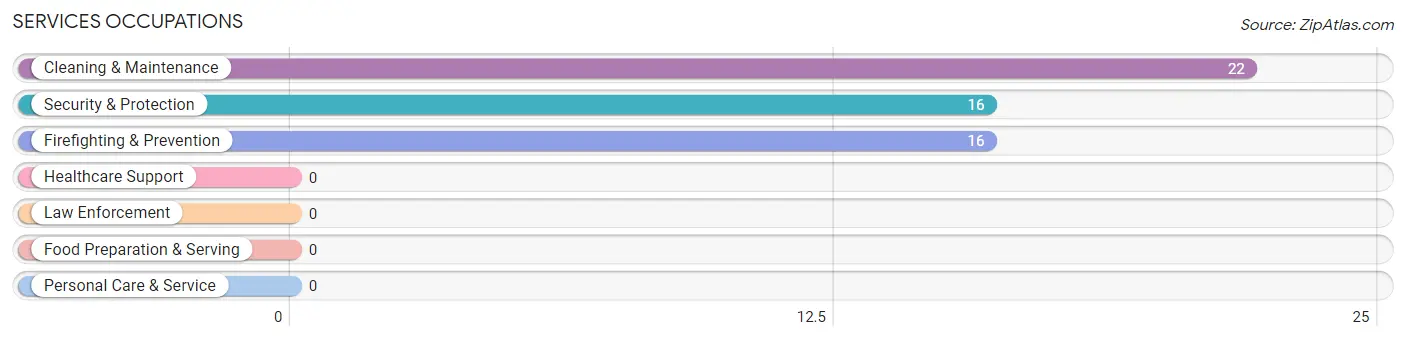
Services Occupations
The most common Services occupations in Castlewood are Cleaning & Maintenance (22 | 6.5%), Security & Protection (16 | 4.7%), and Firefighting & Prevention (16 | 4.7%).
Services Occupations by Sex
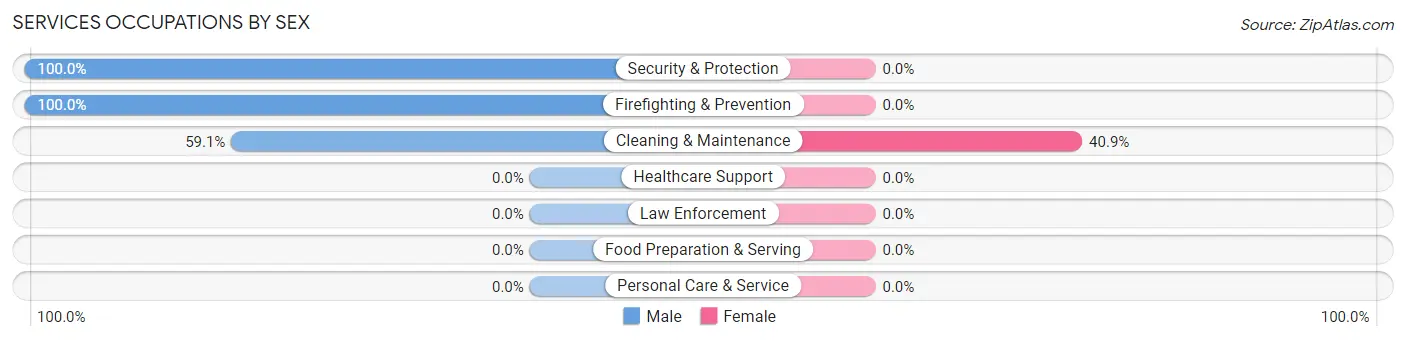
| Occupation | Male | Female |
| Healthcare Support | 0 (0.0%) | 0 (0.0%) |
| Security & Protection | 16 (100.0%) | 0 (0.0%) |
| Firefighting & Prevention | 16 (100.0%) | 0 (0.0%) |
| Law Enforcement | 0 (0.0%) | 0 (0.0%) |
| Food Preparation & Serving | 0 (0.0%) | 0 (0.0%) |
| Cleaning & Maintenance | 13 (59.1%) | 9 (40.9%) |
| Personal Care & Service | 0 (0.0%) | 0 (0.0%) |
| Total (Category) | 29 (76.3%) | 9 (23.7%) |
| Total (Overall) | 173 (50.9%) | 167 (49.1%) |
Sales and Office Occupations
The most common Sales and Office occupations in Castlewood are Sales & Related (45 | 13.2%), and Office & Administration (41 | 12.1%).
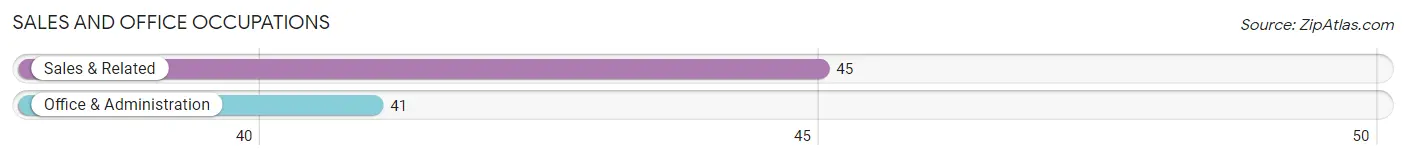
Sales and Office Occupations by Sex
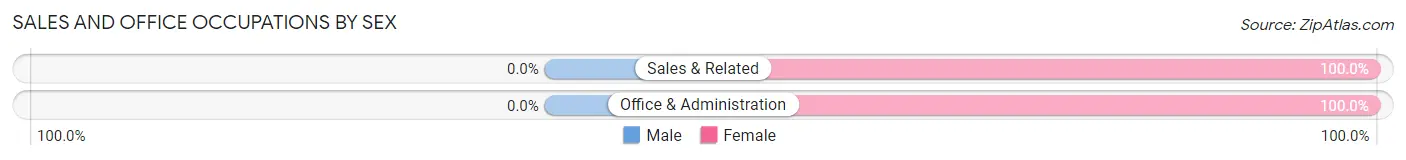
| Occupation | Male | Female |
| Sales & Related | 0 (0.0%) | 45 (100.0%) |
| Office & Administration | 0 (0.0%) | 41 (100.0%) |
| Total (Category) | 0 (0.0%) | 86 (100.0%) |
| Total (Overall) | 173 (50.9%) | 167 (49.1%) |
Natural Resources, Construction and Maintenance Occupations
The most common Natural Resources, Construction and Maintenance occupations in Castlewood are Construction & Extraction (30 | 8.8%), and Installation, Maintenance & Repair (29 | 8.5%).
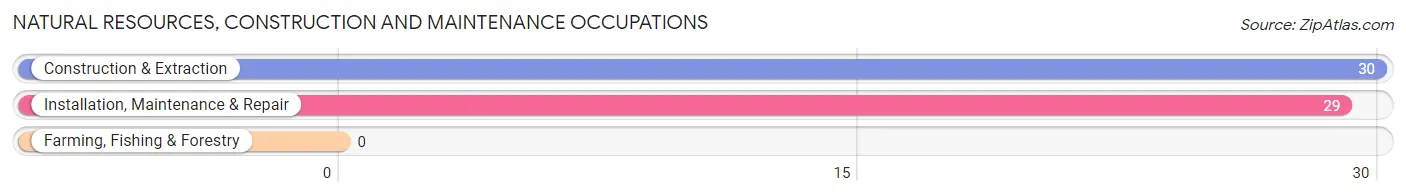
Natural Resources, Construction and Maintenance Occupations by Sex
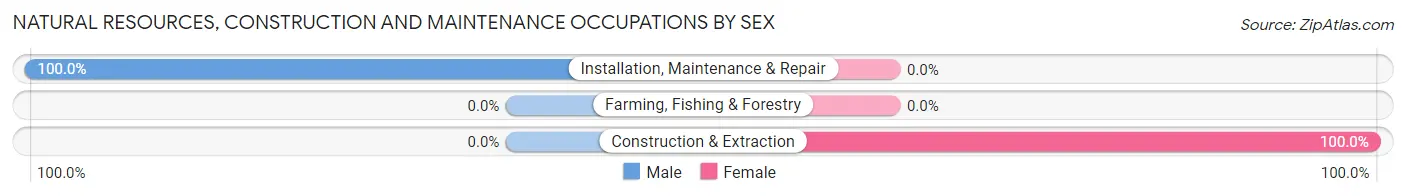
| Occupation | Male | Female |
| Farming, Fishing & Forestry | 0 (0.0%) | 0 (0.0%) |
| Construction & Extraction | 0 (0.0%) | 30 (100.0%) |
| Installation, Maintenance & Repair | 29 (100.0%) | 0 (0.0%) |
| Total (Category) | 29 (49.1%) | 30 (50.8%) |
| Total (Overall) | 173 (50.9%) | 167 (49.1%) |
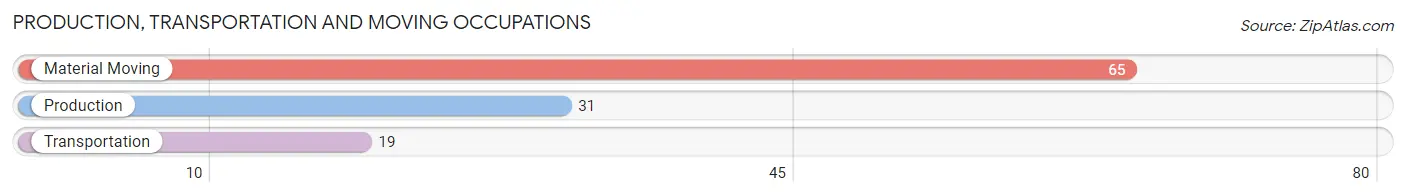
Production, Transportation and Moving Occupations
The most common Production, Transportation and Moving occupations in Castlewood are Material Moving (65 | 19.1%), Production (31 | 9.1%), and Transportation (19 | 5.6%).
Production, Transportation and Moving Occupations by Sex
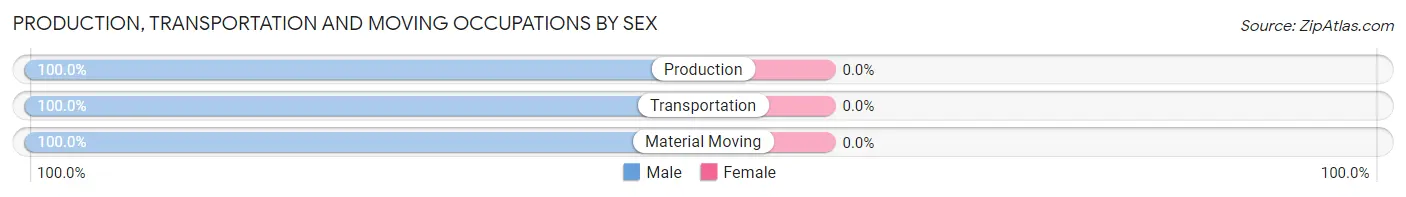
| Occupation | Male | Female |
| Production | 31 (100.0%) | 0 (0.0%) |
| Transportation | 19 (100.0%) | 0 (0.0%) |
| Material Moving | 65 (100.0%) | 0 (0.0%) |
| Total (Category) | 115 (100.0%) | 0 (0.0%) |
| Total (Overall) | 173 (50.9%) | 167 (49.1%) |
Employment Industries by Sex in Castlewood
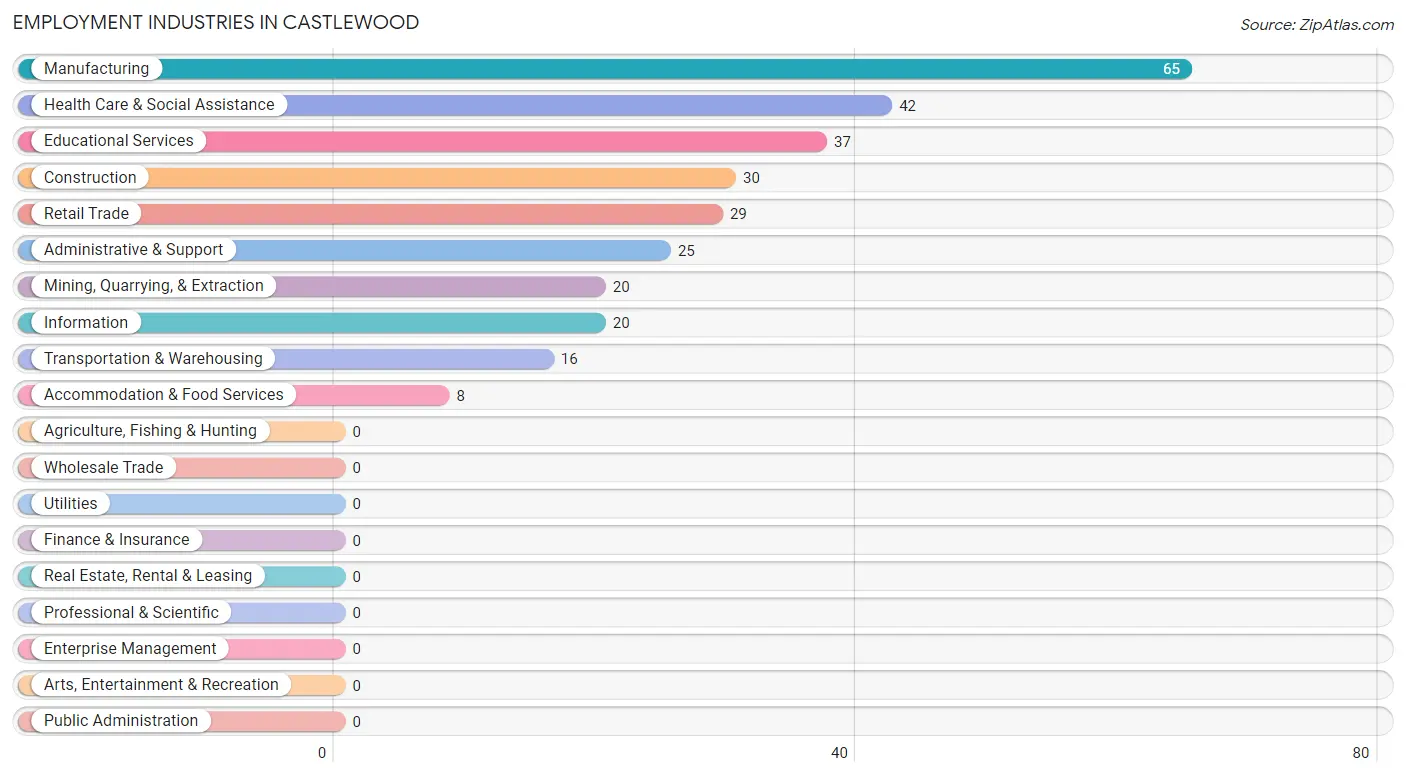
Employment Industries in Castlewood
The major employment industries in Castlewood include Manufacturing (65 | 19.1%), Health Care & Social Assistance (42 | 12.3%), Educational Services (37 | 10.9%), Construction (30 | 8.8%), and Retail Trade (29 | 8.5%).
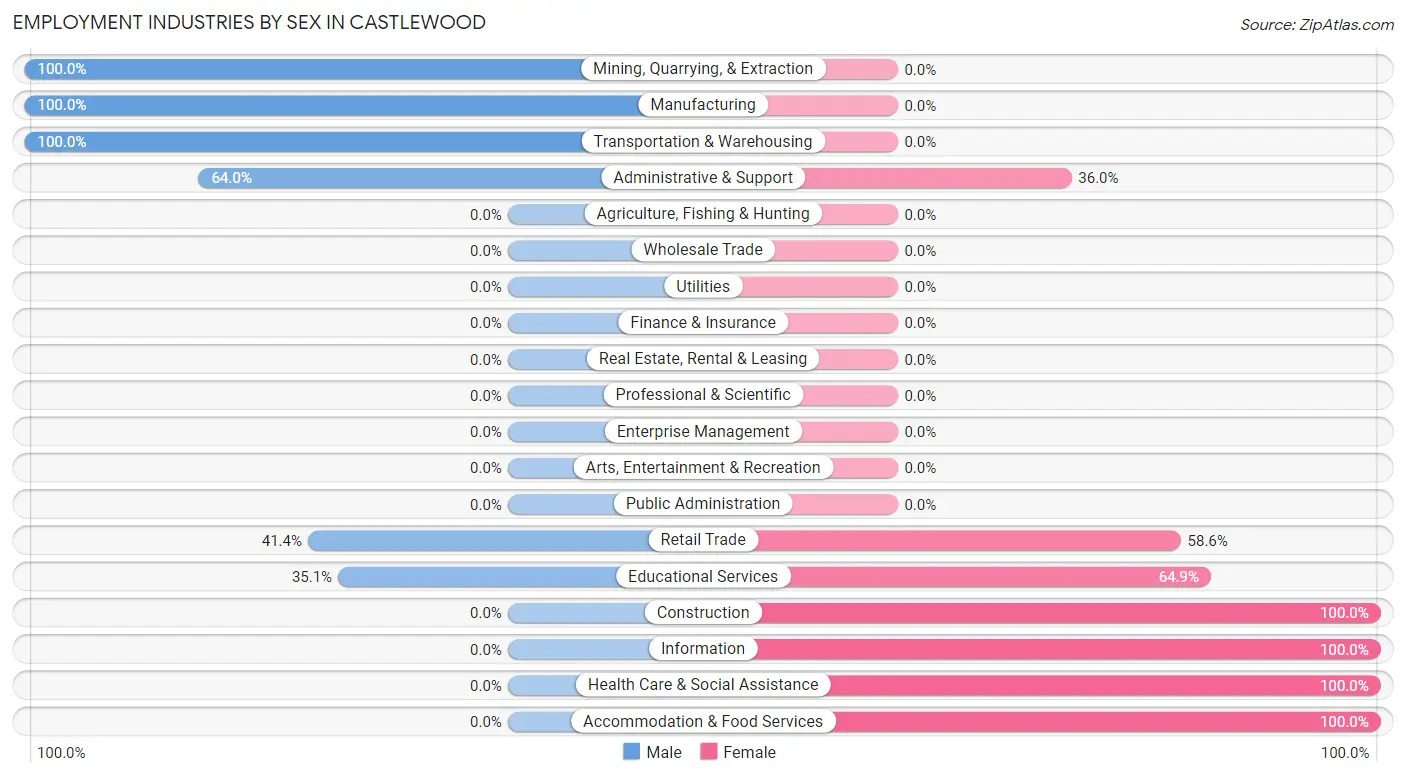
Employment Industries by Sex in Castlewood
The Castlewood industries that see more men than women are Mining, Quarrying, & Extraction (100.0%), Manufacturing (100.0%), and Transportation & Warehousing (100.0%), whereas the industries that tend to have a higher number of women are Construction (100.0%), Information (100.0%), and Health Care & Social Assistance (100.0%).
| Industry | Male | Female |
| Agriculture, Fishing & Hunting | 0 (0.0%) | 0 (0.0%) |
| Mining, Quarrying, & Extraction | 20 (100.0%) | 0 (0.0%) |
| Construction | 0 (0.0%) | 30 (100.0%) |
| Manufacturing | 65 (100.0%) | 0 (0.0%) |
| Wholesale Trade | 0 (0.0%) | 0 (0.0%) |
| Retail Trade | 12 (41.4%) | 17 (58.6%) |
| Transportation & Warehousing | 16 (100.0%) | 0 (0.0%) |
| Utilities | 0 (0.0%) | 0 (0.0%) |
| Information | 0 (0.0%) | 20 (100.0%) |
| Finance & Insurance | 0 (0.0%) | 0 (0.0%) |
| Real Estate, Rental & Leasing | 0 (0.0%) | 0 (0.0%) |
| Professional & Scientific | 0 (0.0%) | 0 (0.0%) |
| Enterprise Management | 0 (0.0%) | 0 (0.0%) |
| Administrative & Support | 16 (64.0%) | 9 (36.0%) |
| Educational Services | 13 (35.1%) | 24 (64.9%) |
| Health Care & Social Assistance | 0 (0.0%) | 42 (100.0%) |
| Arts, Entertainment & Recreation | 0 (0.0%) | 0 (0.0%) |
| Accommodation & Food Services | 0 (0.0%) | 8 (100.0%) |
| Public Administration | 0 (0.0%) | 0 (0.0%) |
| Total | 173 (50.9%) | 167 (49.1%) |
Education in Castlewood
School Enrollment in Castlewood
The most common levels of schooling among the 79 students in Castlewood are high school (43 | 54.4%), college / undergraduate (21 | 26.6%), and nursery / preschool (9 | 11.4%).
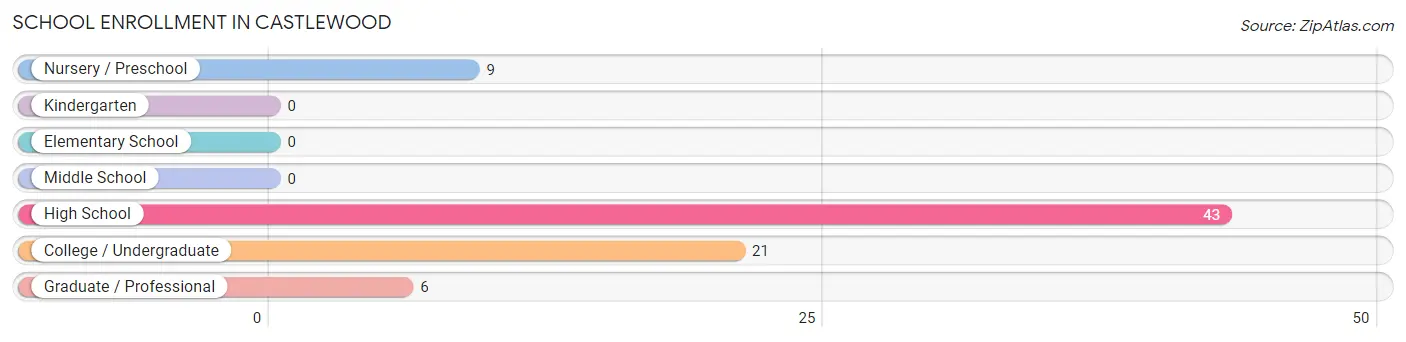
| School Level | # Students | % Students |
| Nursery / Preschool | 9 | 11.4% |
| Kindergarten | 0 | 0.0% |
| Elementary School | 0 | 0.0% |
| Middle School | 0 | 0.0% |
| High School | 43 | 54.4% |
| College / Undergraduate | 21 | 26.6% |
| Graduate / Professional | 6 | 7.6% |
| Total | 79 | 100.0% |
School Enrollment by Age by Funding Source in Castlewood
Out of a total of 79 students who are enrolled in schools in Castlewood, 43 (54.4%) attend a private institution, while the remaining 36 (45.6%) are enrolled in public schools. The age group of 3 to 4 year olds has the highest likelihood of being enrolled in private schools, with 9 (100.0% in the age bracket) enrolled. Conversely, the age group of 18 to 19 year olds has the lowest likelihood of being enrolled in a private school, with 15 (100.0% in the age bracket) attending a public institution.
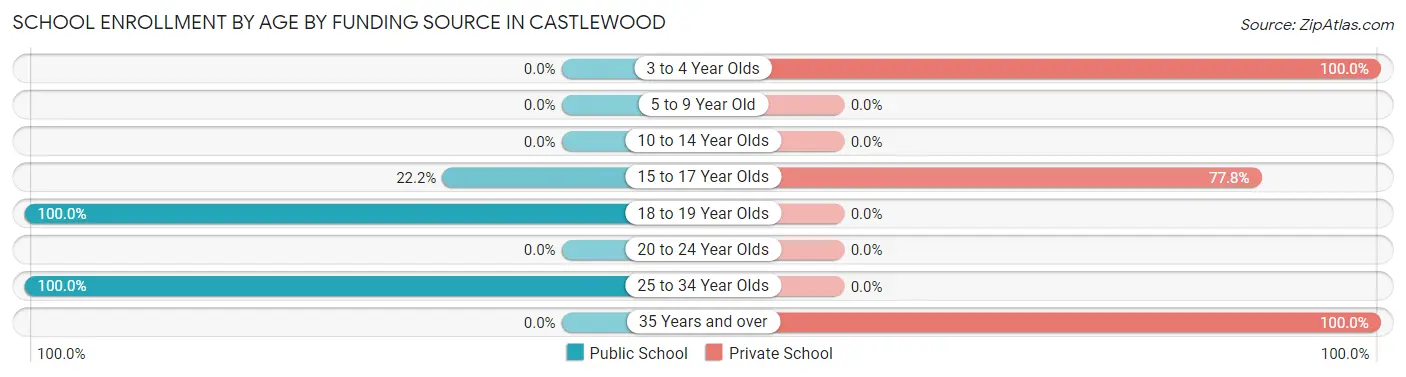
| Age Bracket | Public School | Private School |
| 3 to 4 Year Olds | 0 (0.0%) | 9 (100.0%) |
| 5 to 9 Year Old | 0 (0.0%) | 0 (0.0%) |
| 10 to 14 Year Olds | 0 (0.0%) | 0 (0.0%) |
| 15 to 17 Year Olds | 8 (22.2%) | 28 (77.8%) |
| 18 to 19 Year Olds | 15 (100.0%) | 0 (0.0%) |
| 20 to 24 Year Olds | 0 (0.0%) | 0 (0.0%) |
| 25 to 34 Year Olds | 13 (100.0%) | 0 (0.0%) |
| 35 Years and over | 0 (0.0%) | 6 (100.0%) |
| Total | 36 (45.6%) | 43 (54.4%) |
Educational Attainment by Field of Study in Castlewood
Liberal arts & history (30 | 25.4%), education (24 | 20.3%), arts & humanities (21 | 17.8%), psychology (19 | 16.1%), and business (14 | 11.9%) are the most common fields of study among 118 individuals in Castlewood who have obtained a bachelor's degree or higher.
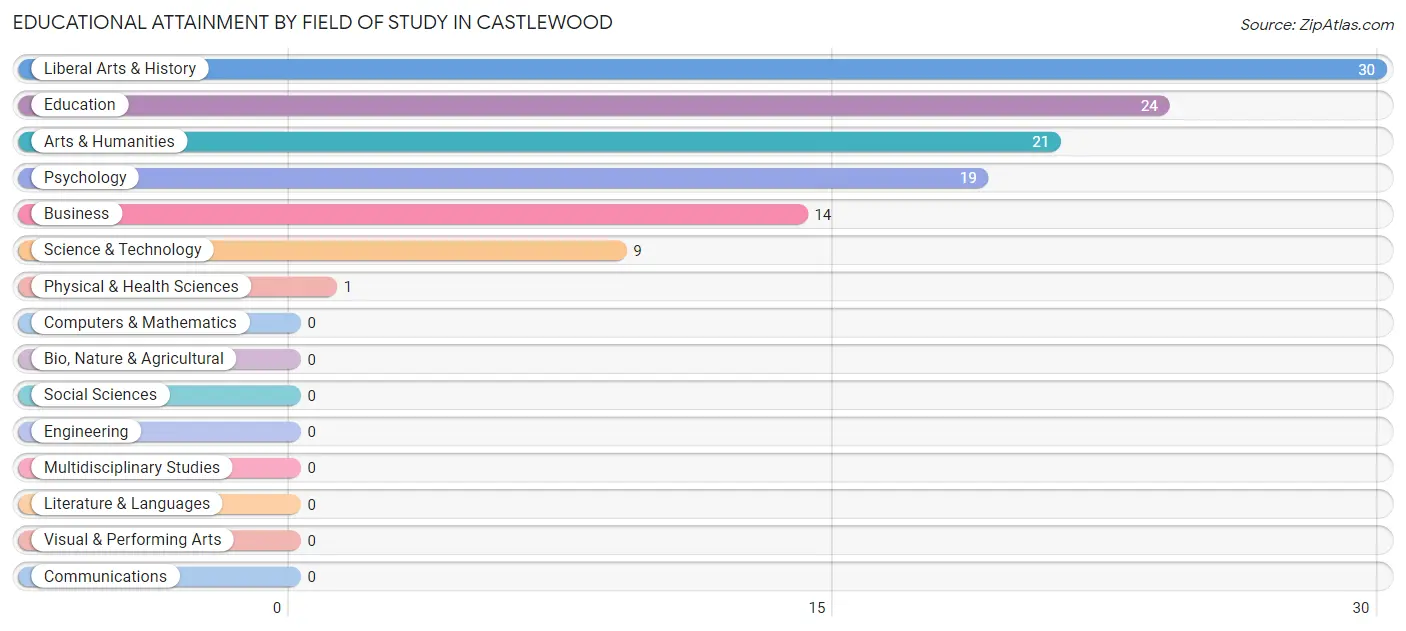
| Field of Study | # Graduates | % Graduates |
| Computers & Mathematics | 0 | 0.0% |
| Bio, Nature & Agricultural | 0 | 0.0% |
| Physical & Health Sciences | 1 | 0.9% |
| Psychology | 19 | 16.1% |
| Social Sciences | 0 | 0.0% |
| Engineering | 0 | 0.0% |
| Multidisciplinary Studies | 0 | 0.0% |
| Science & Technology | 9 | 7.6% |
| Business | 14 | 11.9% |
| Education | 24 | 20.3% |
| Literature & Languages | 0 | 0.0% |
| Liberal Arts & History | 30 | 25.4% |
| Visual & Performing Arts | 0 | 0.0% |
| Communications | 0 | 0.0% |
| Arts & Humanities | 21 | 17.8% |
| Total | 118 | 100.0% |
Transportation & Commute in Castlewood
Vehicle Availability by Sex in Castlewood
The most prevalent vehicle ownership categories in Castlewood are males with 3 vehicles (53, accounting for 38.4%) and females with 3 vehicles (56, making up 31.7%).
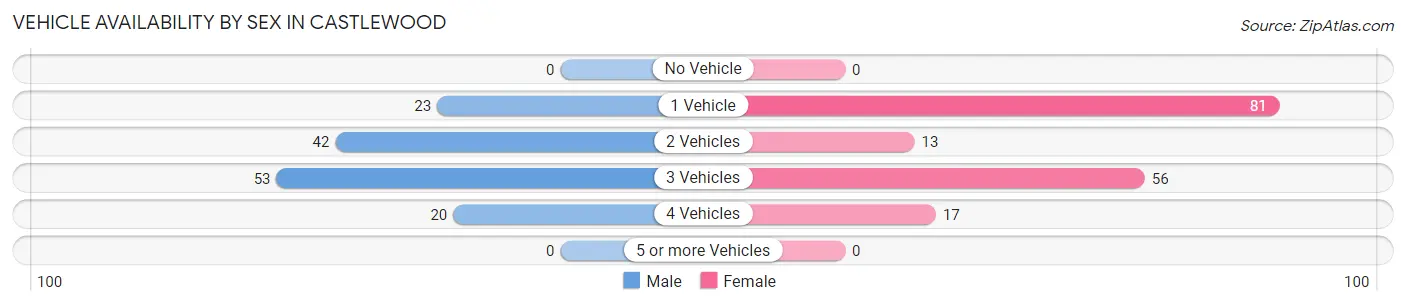
| Vehicles Available | Male | Female |
| No Vehicle | 0 (0.0%) | 0 (0.0%) |
| 1 Vehicle | 23 (16.7%) | 81 (48.5%) |
| 2 Vehicles | 42 (30.4%) | 13 (7.8%) |
| 3 Vehicles | 53 (38.4%) | 56 (33.5%) |
| 4 Vehicles | 20 (14.5%) | 17 (10.2%) |
| 5 or more Vehicles | 0 (0.0%) | 0 (0.0%) |
| Total | 138 (100.0%) | 167 (100.0%) |
Commute Time in Castlewood
The most frequently occuring commute durations in Castlewood are 30 to 34 minutes (98 commuters, 32.1%), 45 to 59 minutes (50 commuters, 16.4%), and 15 to 19 minutes (36 commuters, 11.8%).
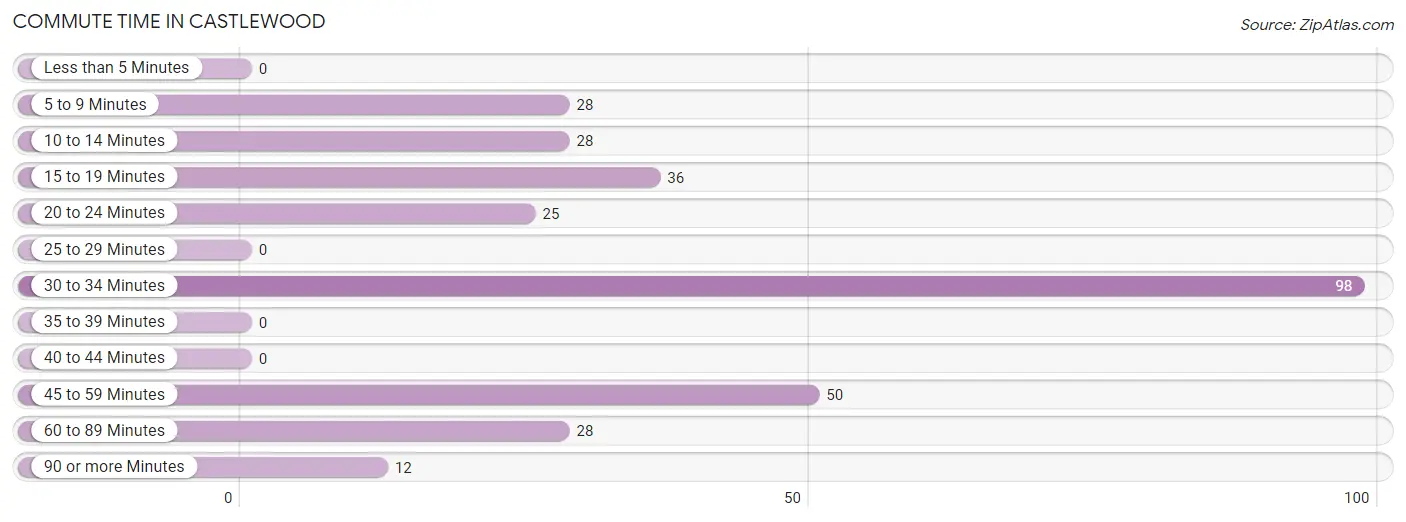
| Commute Time | # Commuters | % Commuters |
| Less than 5 Minutes | 0 | 0.0% |
| 5 to 9 Minutes | 28 | 9.2% |
| 10 to 14 Minutes | 28 | 9.2% |
| 15 to 19 Minutes | 36 | 11.8% |
| 20 to 24 Minutes | 25 | 8.2% |
| 25 to 29 Minutes | 0 | 0.0% |
| 30 to 34 Minutes | 98 | 32.1% |
| 35 to 39 Minutes | 0 | 0.0% |
| 40 to 44 Minutes | 0 | 0.0% |
| 45 to 59 Minutes | 50 | 16.4% |
| 60 to 89 Minutes | 28 | 9.2% |
| 90 or more Minutes | 12 | 3.9% |
Commute Time by Sex in Castlewood
The most common commute times in Castlewood are 45 to 59 minutes (37 commuters, 26.8%) for males and 30 to 34 minutes (98 commuters, 58.7%) for females.
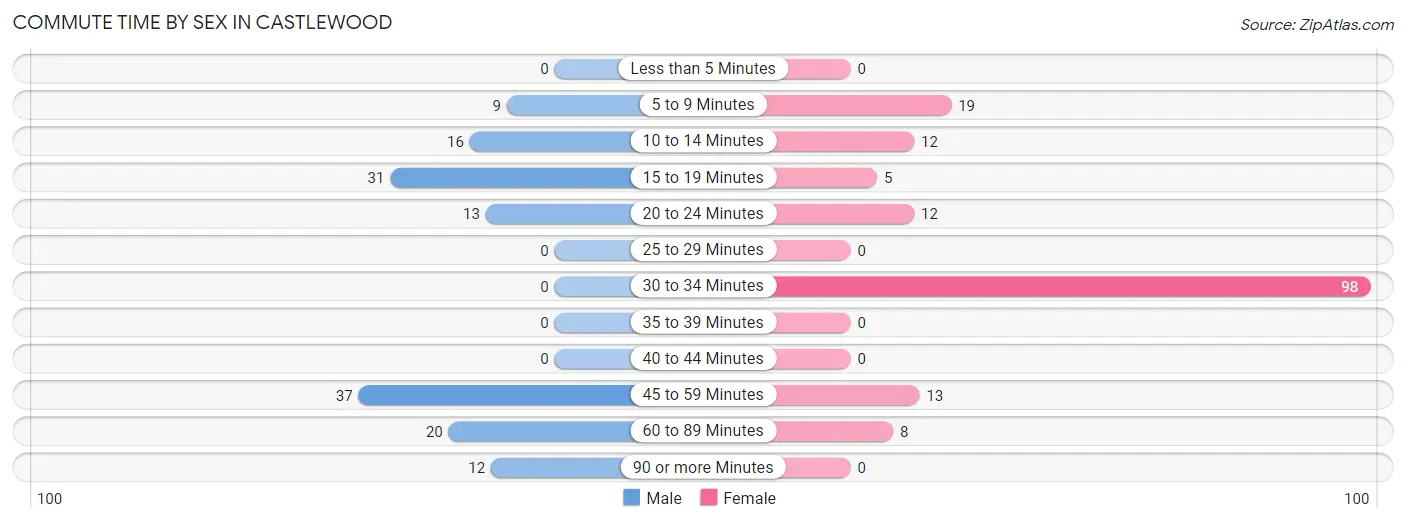
| Commute Time | Male | Female |
| Less than 5 Minutes | 0 (0.0%) | 0 (0.0%) |
| 5 to 9 Minutes | 9 (6.5%) | 19 (11.4%) |
| 10 to 14 Minutes | 16 (11.6%) | 12 (7.2%) |
| 15 to 19 Minutes | 31 (22.5%) | 5 (3.0%) |
| 20 to 24 Minutes | 13 (9.4%) | 12 (7.2%) |
| 25 to 29 Minutes | 0 (0.0%) | 0 (0.0%) |
| 30 to 34 Minutes | 0 (0.0%) | 98 (58.7%) |
| 35 to 39 Minutes | 0 (0.0%) | 0 (0.0%) |
| 40 to 44 Minutes | 0 (0.0%) | 0 (0.0%) |
| 45 to 59 Minutes | 37 (26.8%) | 13 (7.8%) |
| 60 to 89 Minutes | 20 (14.5%) | 8 (4.8%) |
| 90 or more Minutes | 12 (8.7%) | 0 (0.0%) |
Time of Departure to Work by Sex in Castlewood
The most frequent times of departure to work in Castlewood are 5:00 AM to 5:29 AM (51, 37.0%) for males and 7:30 AM to 7:59 AM (54, 32.3%) for females.
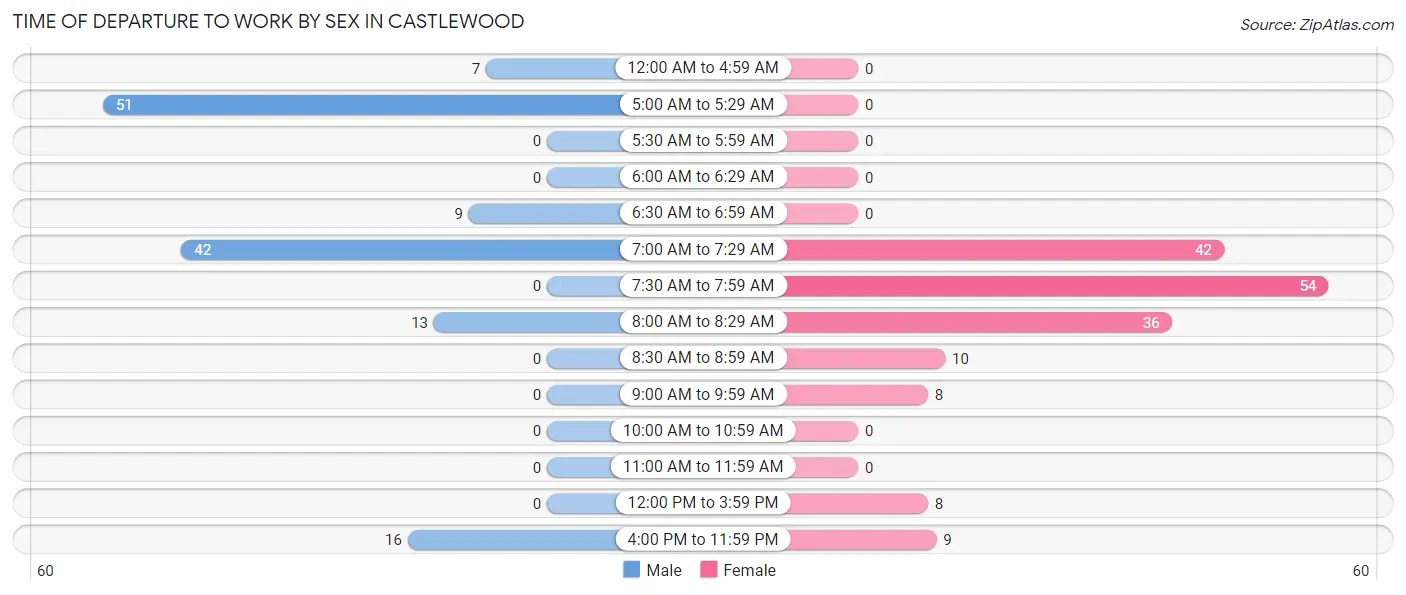
| Time of Departure | Male | Female |
| 12:00 AM to 4:59 AM | 7 (5.1%) | 0 (0.0%) |
| 5:00 AM to 5:29 AM | 51 (37.0%) | 0 (0.0%) |
| 5:30 AM to 5:59 AM | 0 (0.0%) | 0 (0.0%) |
| 6:00 AM to 6:29 AM | 0 (0.0%) | 0 (0.0%) |
| 6:30 AM to 6:59 AM | 9 (6.5%) | 0 (0.0%) |
| 7:00 AM to 7:29 AM | 42 (30.4%) | 42 (25.2%) |
| 7:30 AM to 7:59 AM | 0 (0.0%) | 54 (32.3%) |
| 8:00 AM to 8:29 AM | 13 (9.4%) | 36 (21.6%) |
| 8:30 AM to 8:59 AM | 0 (0.0%) | 10 (6.0%) |
| 9:00 AM to 9:59 AM | 0 (0.0%) | 8 (4.8%) |
| 10:00 AM to 10:59 AM | 0 (0.0%) | 0 (0.0%) |
| 11:00 AM to 11:59 AM | 0 (0.0%) | 0 (0.0%) |
| 12:00 PM to 3:59 PM | 0 (0.0%) | 8 (4.8%) |
| 4:00 PM to 11:59 PM | 16 (11.6%) | 9 (5.4%) |
| Total | 138 (100.0%) | 167 (100.0%) |
Housing Occupancy in Castlewood
Occupancy by Ownership in Castlewood
Of the total 570 dwellings in Castlewood, owner-occupied units account for 367 (64.4%), while renter-occupied units make up 203 (35.6%).
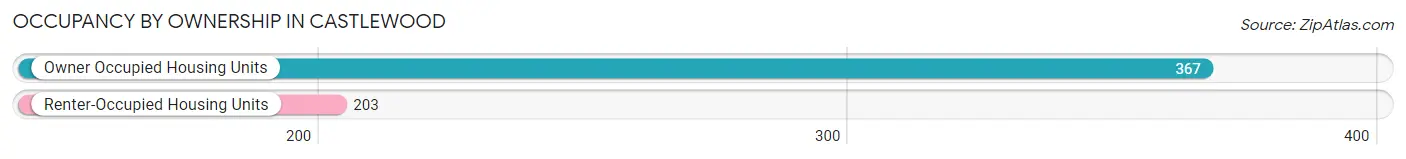
| Occupancy | # Housing Units | % Housing Units |
| Owner Occupied Housing Units | 367 | 64.4% |
| Renter-Occupied Housing Units | 203 | 35.6% |
| Total Occupied Housing Units | 570 | 100.0% |
Occupancy by Household Size in Castlewood
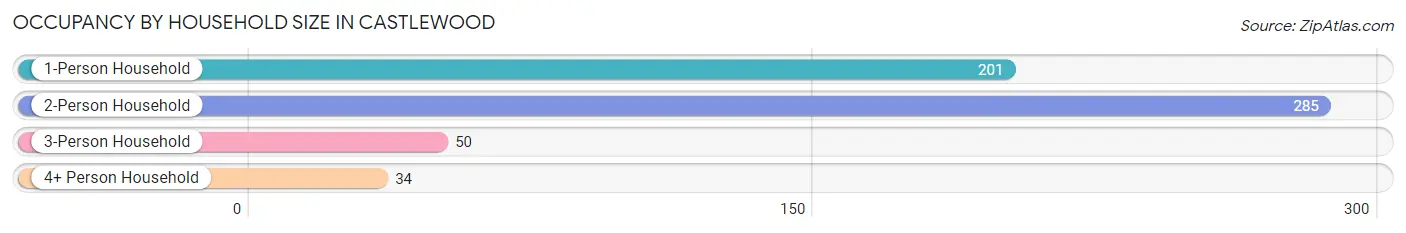
| Household Size | # Housing Units | % Housing Units |
| 1-Person Household | 201 | 35.3% |
| 2-Person Household | 285 | 50.0% |
| 3-Person Household | 50 | 8.8% |
| 4+ Person Household | 34 | 6.0% |
| Total Housing Units | 570 | 100.0% |
Occupancy by Ownership by Household Size in Castlewood
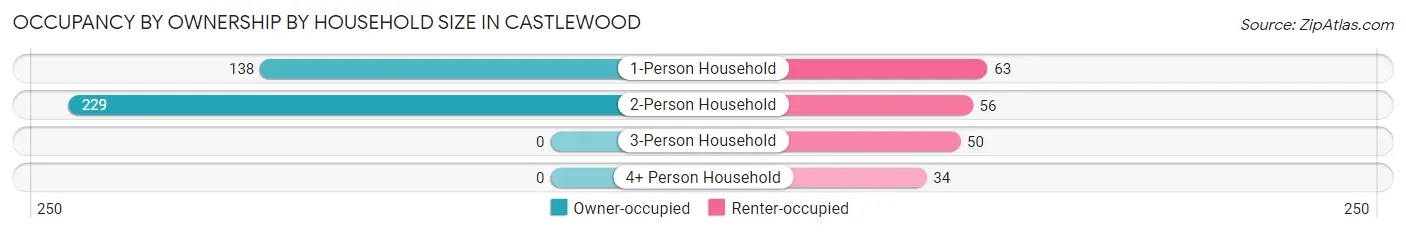
| Household Size | Owner-occupied | Renter-occupied |
| 1-Person Household | 138 (68.7%) | 63 (31.3%) |
| 2-Person Household | 229 (80.3%) | 56 (19.7%) |
| 3-Person Household | 0 (0.0%) | 50 (100.0%) |
| 4+ Person Household | 0 (0.0%) | 34 (100.0%) |
| Total Housing Units | 367 (64.4%) | 203 (35.6%) |
Occupancy by Educational Attainment in Castlewood
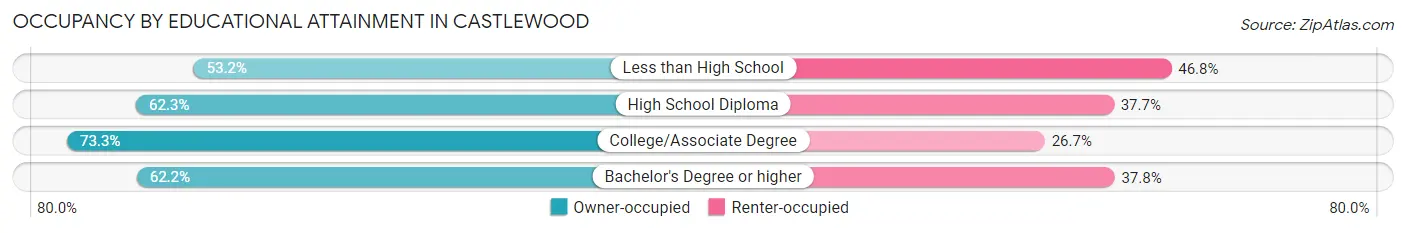
| Household Size | Owner-occupied | Renter-occupied |
| Less than High School | 50 (53.2%) | 44 (46.8%) |
| High School Diploma | 129 (62.3%) | 78 (37.7%) |
| College/Associate Degree | 137 (73.3%) | 50 (26.7%) |
| Bachelor's Degree or higher | 51 (62.2%) | 31 (37.8%) |
Occupancy by Age of Householder in Castlewood
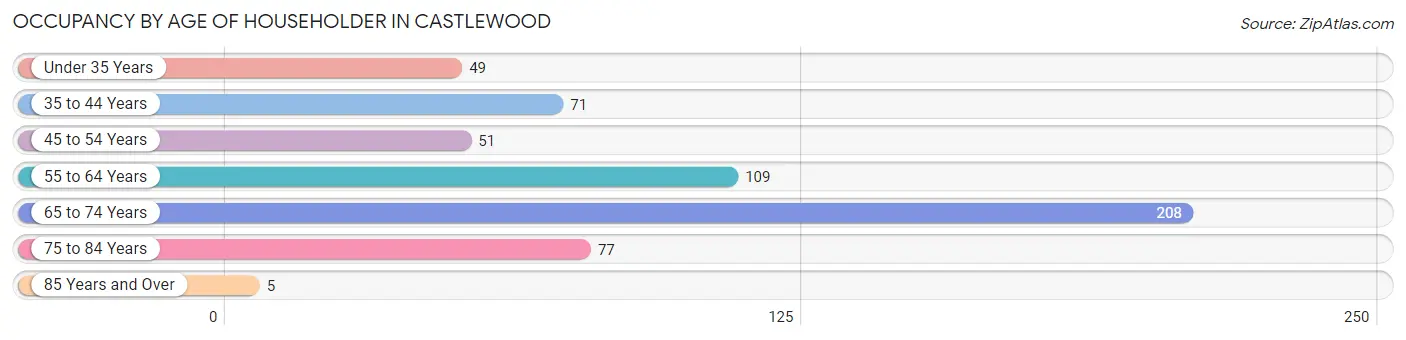
| Age Bracket | # Households | % Households |
| Under 35 Years | 49 | 8.6% |
| 35 to 44 Years | 71 | 12.5% |
| 45 to 54 Years | 51 | 8.9% |
| 55 to 64 Years | 109 | 19.1% |
| 65 to 74 Years | 208 | 36.5% |
| 75 to 84 Years | 77 | 13.5% |
| 85 Years and Over | 5 | 0.9% |
| Total | 570 | 100.0% |
Housing Finances in Castlewood
Median Income by Occupancy in Castlewood
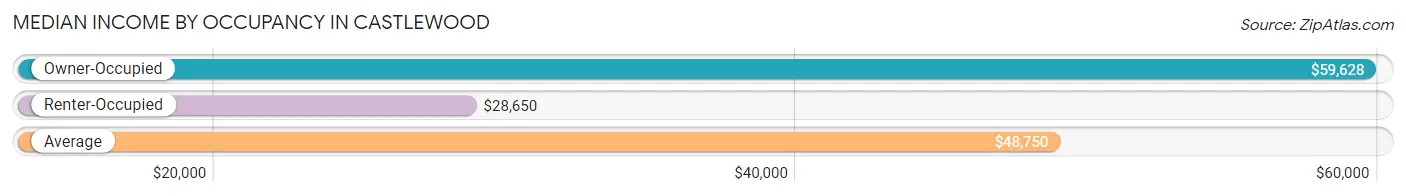
| Occupancy Type | # Households | Median Income |
| Owner-Occupied | 367 (64.4%) | $59,628 |
| Renter-Occupied | 203 (35.6%) | $28,650 |
| Average | 570 (100.0%) | $48,750 |
Occupancy by Householder Income Bracket in Castlewood
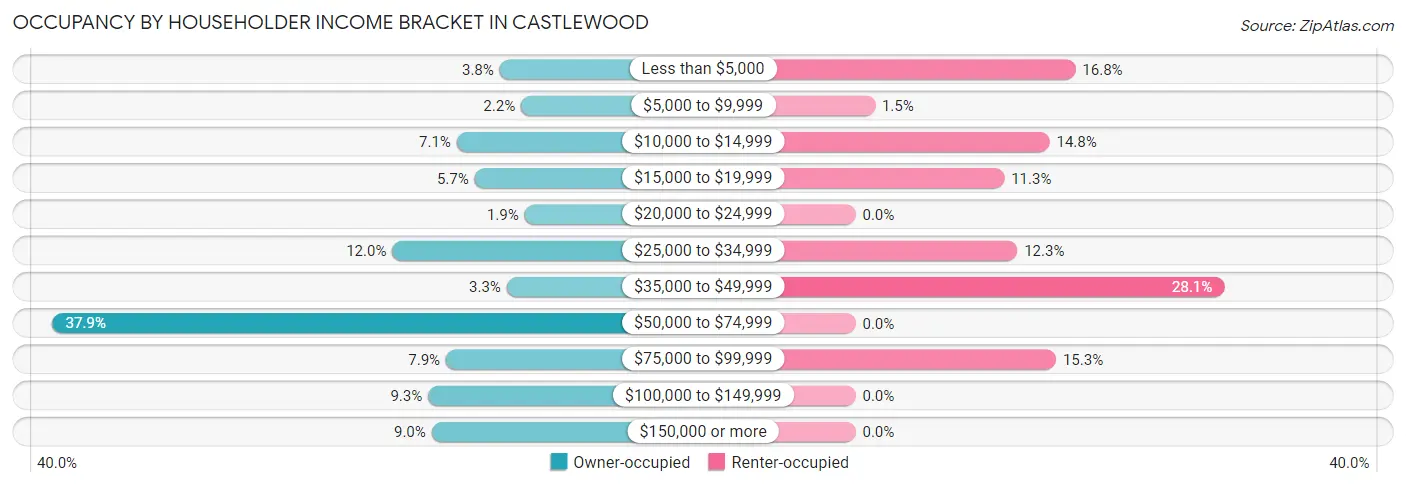
| Income Bracket | Owner-occupied | Renter-occupied |
| Less than $5,000 | 14 (3.8%) | 34 (16.8%) |
| $5,000 to $9,999 | 8 (2.2%) | 3 (1.5%) |
| $10,000 to $14,999 | 26 (7.1%) | 30 (14.8%) |
| $15,000 to $19,999 | 21 (5.7%) | 23 (11.3%) |
| $20,000 to $24,999 | 7 (1.9%) | 0 (0.0%) |
| $25,000 to $34,999 | 44 (12.0%) | 25 (12.3%) |
| $35,000 to $49,999 | 12 (3.3%) | 57 (28.1%) |
| $50,000 to $74,999 | 139 (37.9%) | 0 (0.0%) |
| $75,000 to $99,999 | 29 (7.9%) | 31 (15.3%) |
| $100,000 to $149,999 | 34 (9.3%) | 0 (0.0%) |
| $150,000 or more | 33 (9.0%) | 0 (0.0%) |
| Total | 367 (100.0%) | 203 (100.0%) |
Monthly Housing Cost Tiers in Castlewood
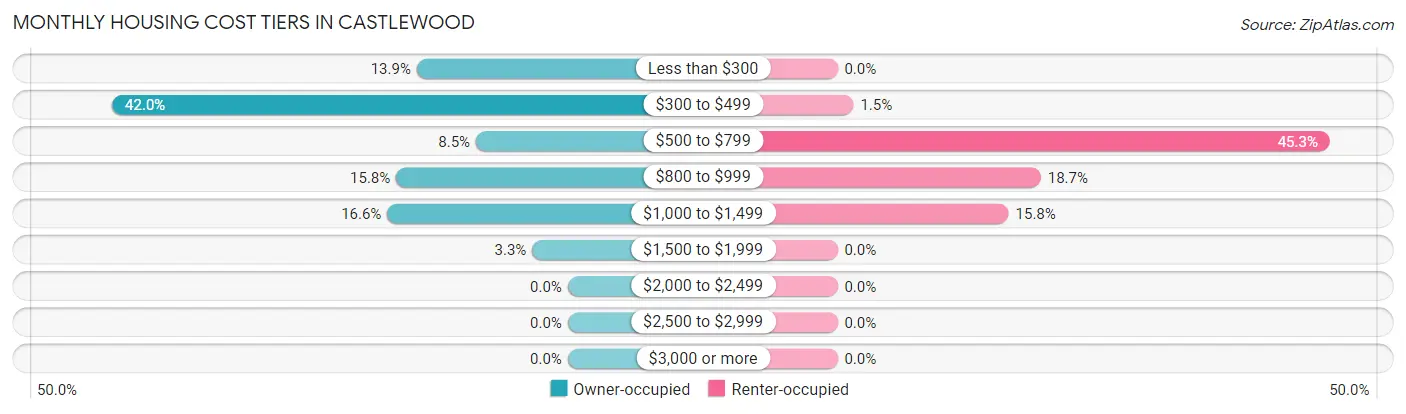
| Monthly Cost | Owner-occupied | Renter-occupied |
| Less than $300 | 51 (13.9%) | 0 (0.0%) |
| $300 to $499 | 154 (42.0%) | 3 (1.5%) |
| $500 to $799 | 31 (8.5%) | 92 (45.3%) |
| $800 to $999 | 58 (15.8%) | 38 (18.7%) |
| $1,000 to $1,499 | 61 (16.6%) | 32 (15.8%) |
| $1,500 to $1,999 | 12 (3.3%) | 0 (0.0%) |
| $2,000 to $2,499 | 0 (0.0%) | 0 (0.0%) |
| $2,500 to $2,999 | 0 (0.0%) | 0 (0.0%) |
| $3,000 or more | 0 (0.0%) | 0 (0.0%) |
| Total | 367 (100.0%) | 203 (100.0%) |
Physical Housing Characteristics in Castlewood
Housing Structures in Castlewood
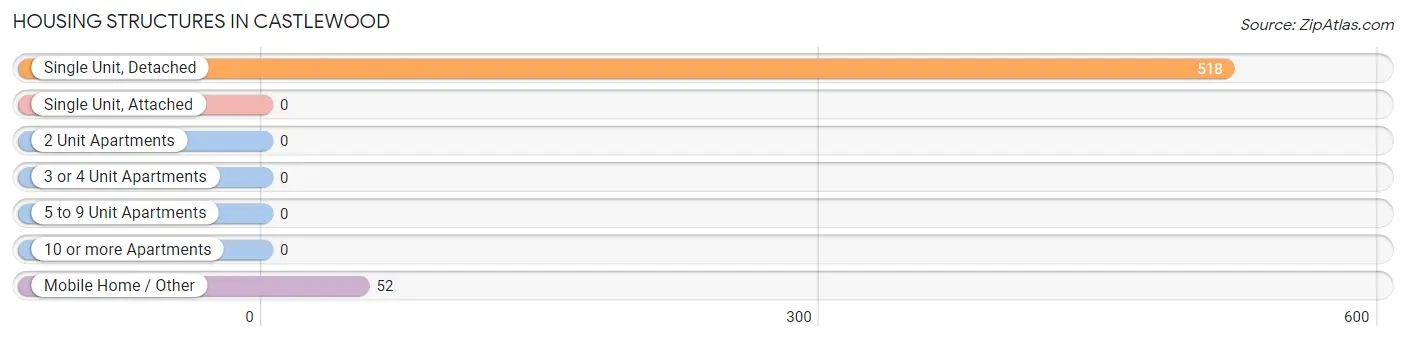
| Structure Type | # Housing Units | % Housing Units |
| Single Unit, Detached | 518 | 90.9% |
| Single Unit, Attached | 0 | 0.0% |
| 2 Unit Apartments | 0 | 0.0% |
| 3 or 4 Unit Apartments | 0 | 0.0% |
| 5 to 9 Unit Apartments | 0 | 0.0% |
| 10 or more Apartments | 0 | 0.0% |
| Mobile Home / Other | 52 | 9.1% |
| Total | 570 | 100.0% |
Housing Structures by Occupancy in Castlewood
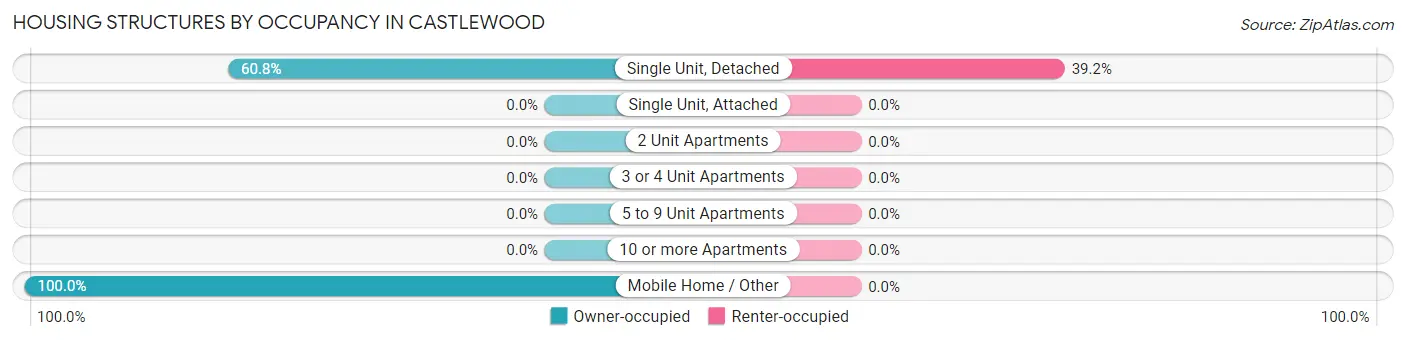
| Structure Type | Owner-occupied | Renter-occupied |
| Single Unit, Detached | 315 (60.8%) | 203 (39.2%) |
| Single Unit, Attached | 0 (0.0%) | 0 (0.0%) |
| 2 Unit Apartments | 0 (0.0%) | 0 (0.0%) |
| 3 or 4 Unit Apartments | 0 (0.0%) | 0 (0.0%) |
| 5 to 9 Unit Apartments | 0 (0.0%) | 0 (0.0%) |
| 10 or more Apartments | 0 (0.0%) | 0 (0.0%) |
| Mobile Home / Other | 52 (100.0%) | 0 (0.0%) |
| Total | 367 (64.4%) | 203 (35.6%) |
Housing Structures by Number of Rooms in Castlewood
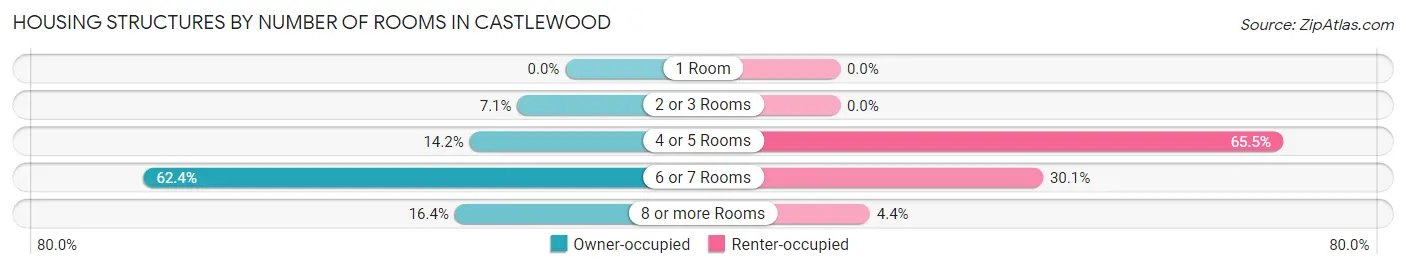
| Number of Rooms | Owner-occupied | Renter-occupied |
| 1 Room | 0 (0.0%) | 0 (0.0%) |
| 2 or 3 Rooms | 26 (7.1%) | 0 (0.0%) |
| 4 or 5 Rooms | 52 (14.2%) | 133 (65.5%) |
| 6 or 7 Rooms | 229 (62.4%) | 61 (30.0%) |
| 8 or more Rooms | 60 (16.4%) | 9 (4.4%) |
| Total | 367 (100.0%) | 203 (100.0%) |
Housing Structure by Heating Type in Castlewood
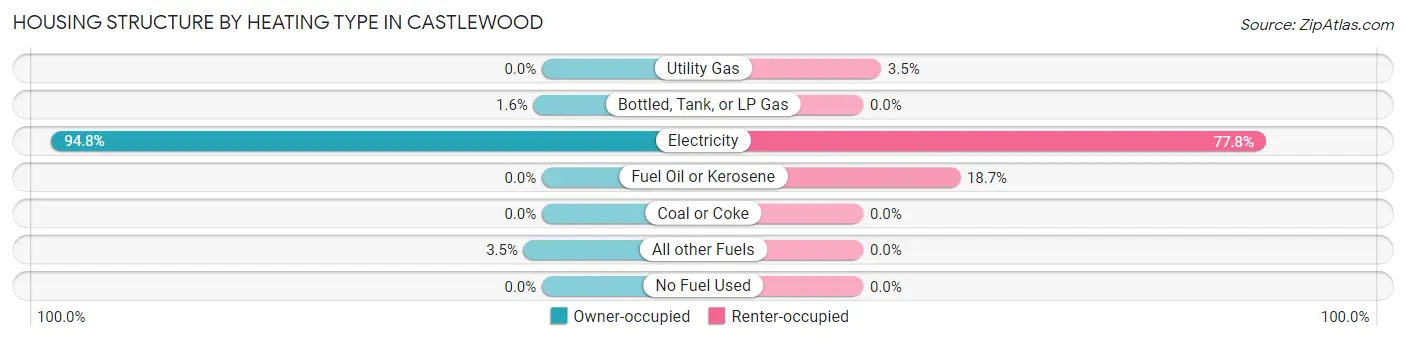
| Heating Type | Owner-occupied | Renter-occupied |
| Utility Gas | 0 (0.0%) | 7 (3.5%) |
| Bottled, Tank, or LP Gas | 6 (1.6%) | 0 (0.0%) |
| Electricity | 348 (94.8%) | 158 (77.8%) |
| Fuel Oil or Kerosene | 0 (0.0%) | 38 (18.7%) |
| Coal or Coke | 0 (0.0%) | 0 (0.0%) |
| All other Fuels | 13 (3.5%) | 0 (0.0%) |
| No Fuel Used | 0 (0.0%) | 0 (0.0%) |
| Total | 367 (100.0%) | 203 (100.0%) |
Household Vehicle Usage in Castlewood
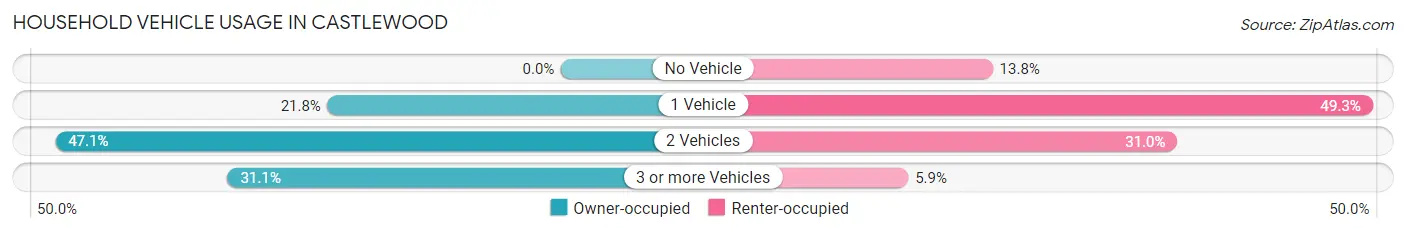
| Vehicles per Household | Owner-occupied | Renter-occupied |
| No Vehicle | 0 (0.0%) | 28 (13.8%) |
| 1 Vehicle | 80 (21.8%) | 100 (49.3%) |
| 2 Vehicles | 173 (47.1%) | 63 (31.0%) |
| 3 or more Vehicles | 114 (31.1%) | 12 (5.9%) |
| Total | 367 (100.0%) | 203 (100.0%) |
Real Estate & Mortgages in Castlewood
Real Estate and Mortgage Overview in Castlewood
| Characteristic | Without Mortgage | With Mortgage |
| Housing Units | 228 | 139 |
| Median Property Value | $107,100 | $170,500 |
| Median Household Income | $57,568 | $12 |
| Monthly Housing Costs | $345 | $0 |
| Real Estate Taxes | $736 | $0 |
Property Value by Mortgage Status in Castlewood
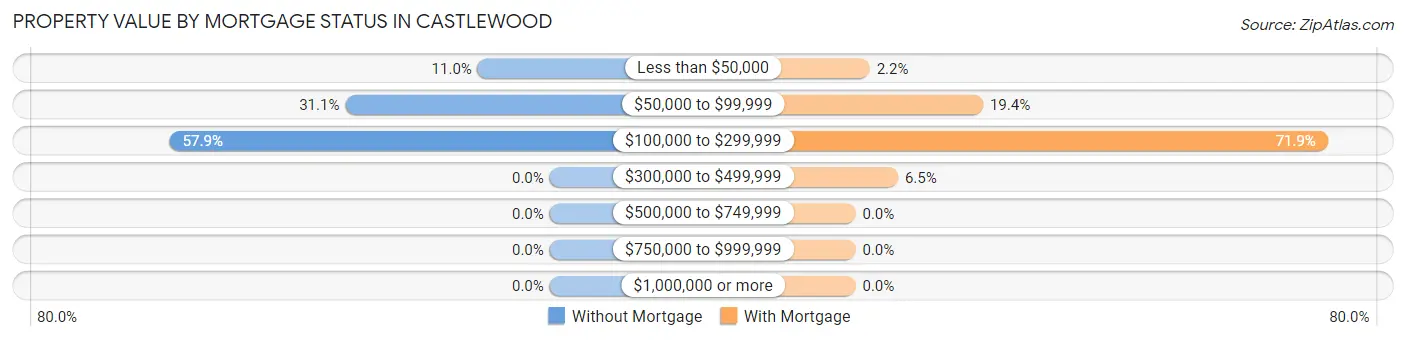
| Property Value | Without Mortgage | With Mortgage |
| Less than $50,000 | 25 (11.0%) | 3 (2.2%) |
| $50,000 to $99,999 | 71 (31.1%) | 27 (19.4%) |
| $100,000 to $299,999 | 132 (57.9%) | 100 (71.9%) |
| $300,000 to $499,999 | 0 (0.0%) | 9 (6.5%) |
| $500,000 to $749,999 | 0 (0.0%) | 0 (0.0%) |
| $750,000 to $999,999 | 0 (0.0%) | 0 (0.0%) |
| $1,000,000 or more | 0 (0.0%) | 0 (0.0%) |
| Total | 228 (100.0%) | 139 (100.0%) |
Household Income by Mortgage Status in Castlewood
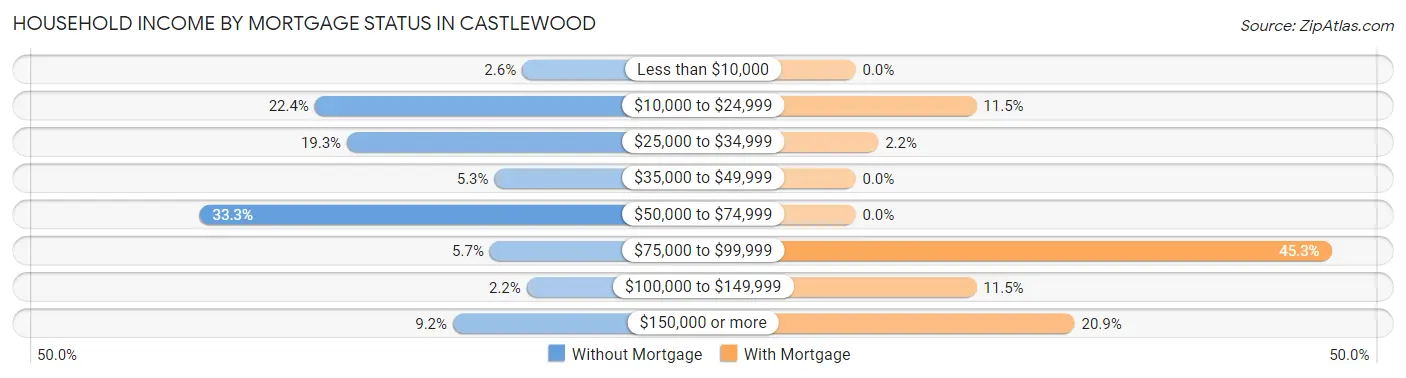
| Household Income | Without Mortgage | With Mortgage |
| Less than $10,000 | 6 (2.6%) | 0 (0.0%) |
| $10,000 to $24,999 | 51 (22.4%) | 16 (11.5%) |
| $25,000 to $34,999 | 44 (19.3%) | 3 (2.2%) |
| $35,000 to $49,999 | 12 (5.3%) | 0 (0.0%) |
| $50,000 to $74,999 | 76 (33.3%) | 0 (0.0%) |
| $75,000 to $99,999 | 13 (5.7%) | 63 (45.3%) |
| $100,000 to $149,999 | 5 (2.2%) | 16 (11.5%) |
| $150,000 or more | 21 (9.2%) | 29 (20.9%) |
| Total | 228 (100.0%) | 139 (100.0%) |
Property Value to Household Income Ratio in Castlewood
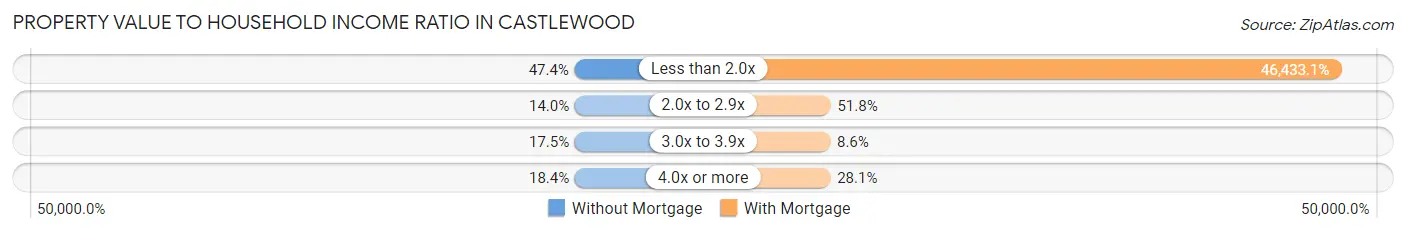
| Value-to-Income Ratio | Without Mortgage | With Mortgage |
| Less than 2.0x | 108 (47.4%) | 64,542 (46,433.1%) |
| 2.0x to 2.9x | 32 (14.0%) | 72 (51.8%) |
| 3.0x to 3.9x | 40 (17.5%) | 12 (8.6%) |
| 4.0x or more | 42 (18.4%) | 39 (28.1%) |
| Total | 228 (100.0%) | 139 (100.0%) |
Real Estate Taxes by Mortgage Status in Castlewood
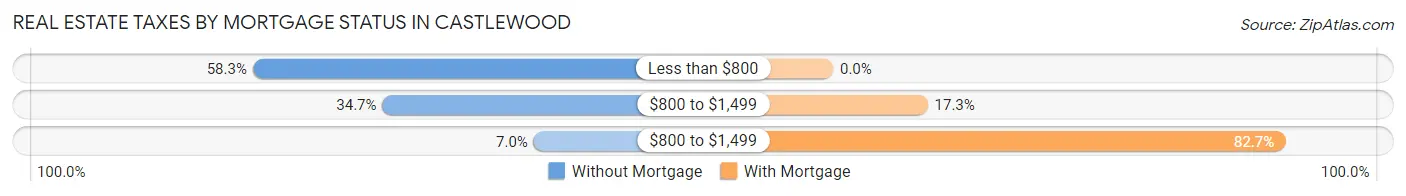
| Property Taxes | Without Mortgage | With Mortgage |
| Less than $800 | 133 (58.3%) | 0 (0.0%) |
| $800 to $1,499 | 79 (34.6%) | 24 (17.3%) |
| $800 to $1,499 | 16 (7.0%) | 115 (82.7%) |
| Total | 228 (100.0%) | 139 (100.0%) |
Health & Disability in Castlewood
Health Insurance Coverage by Age in Castlewood
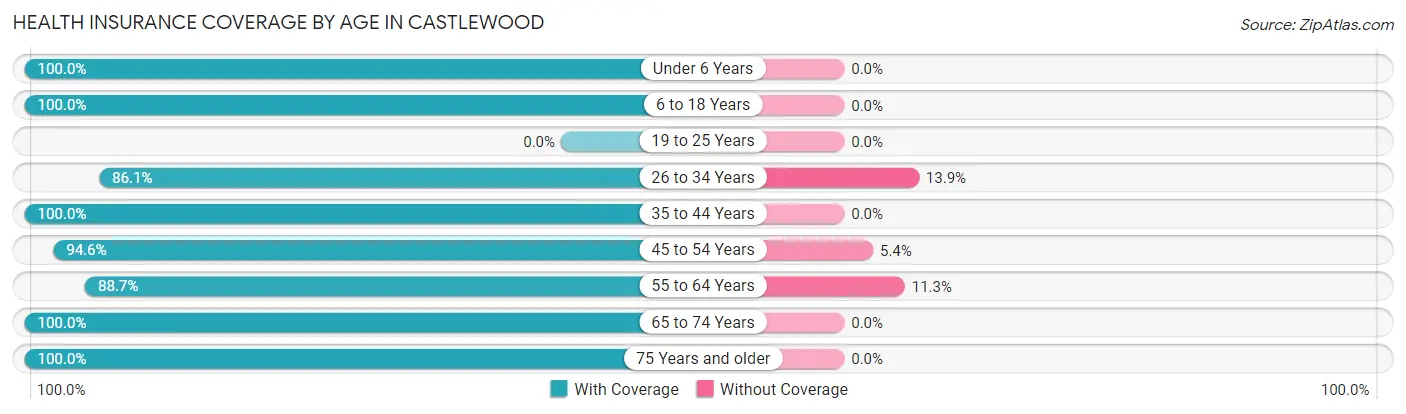
| Age Bracket | With Coverage | Without Coverage |
| Under 6 Years | 17 (100.0%) | 0 (0.0%) |
| 6 to 18 Years | 51 (100.0%) | 0 (0.0%) |
| 19 to 25 Years | 0 (0.0%) | 0 (0.0%) |
| 26 to 34 Years | 99 (86.1%) | 16 (13.9%) |
| 35 to 44 Years | 108 (100.0%) | 0 (0.0%) |
| 45 to 54 Years | 106 (94.6%) | 6 (5.4%) |
| 55 to 64 Years | 236 (88.7%) | 30 (11.3%) |
| 65 to 74 Years | 285 (100.0%) | 0 (0.0%) |
| 75 Years and older | 155 (100.0%) | 0 (0.0%) |
| Total | 1,057 (95.3%) | 52 (4.7%) |
Health Insurance Coverage by Citizenship Status in Castlewood
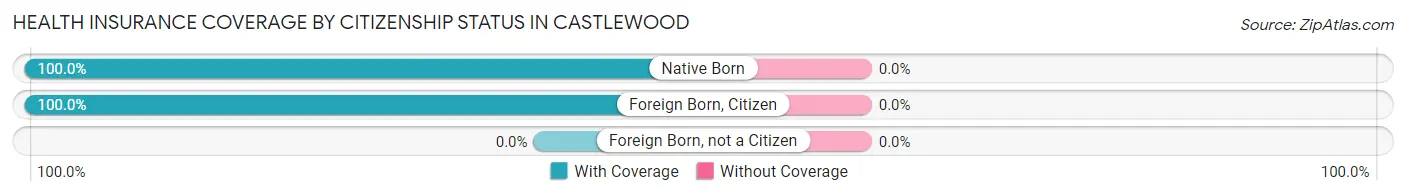
| Citizenship Status | With Coverage | Without Coverage |
| Native Born | 17 (100.0%) | 0 (0.0%) |
| Foreign Born, Citizen | 51 (100.0%) | 0 (0.0%) |
| Foreign Born, not a Citizen | 0 (0.0%) | 0 (0.0%) |
Health Insurance Coverage by Household Income in Castlewood
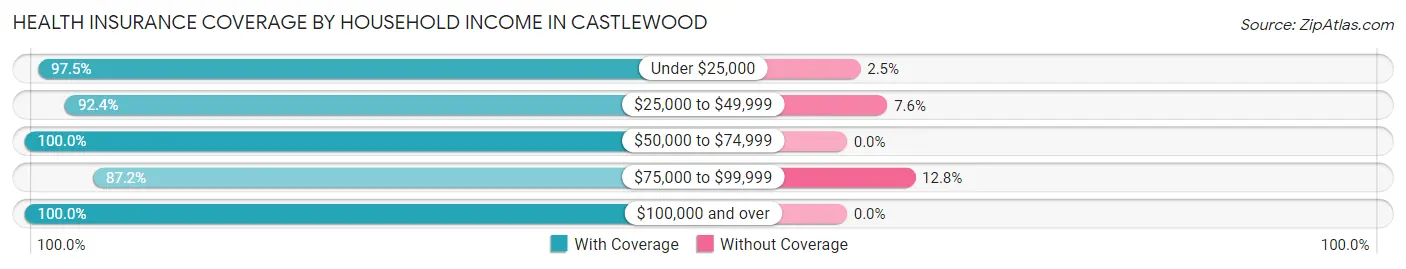
| Household Income | With Coverage | Without Coverage |
| Under $25,000 | 231 (97.5%) | 6 (2.5%) |
| $25,000 to $49,999 | 366 (92.4%) | 30 (7.6%) |
| $50,000 to $74,999 | 217 (100.0%) | 0 (0.0%) |
| $75,000 to $99,999 | 109 (87.2%) | 16 (12.8%) |
| $100,000 and over | 112 (100.0%) | 0 (0.0%) |
Public vs Private Health Insurance Coverage by Age in Castlewood
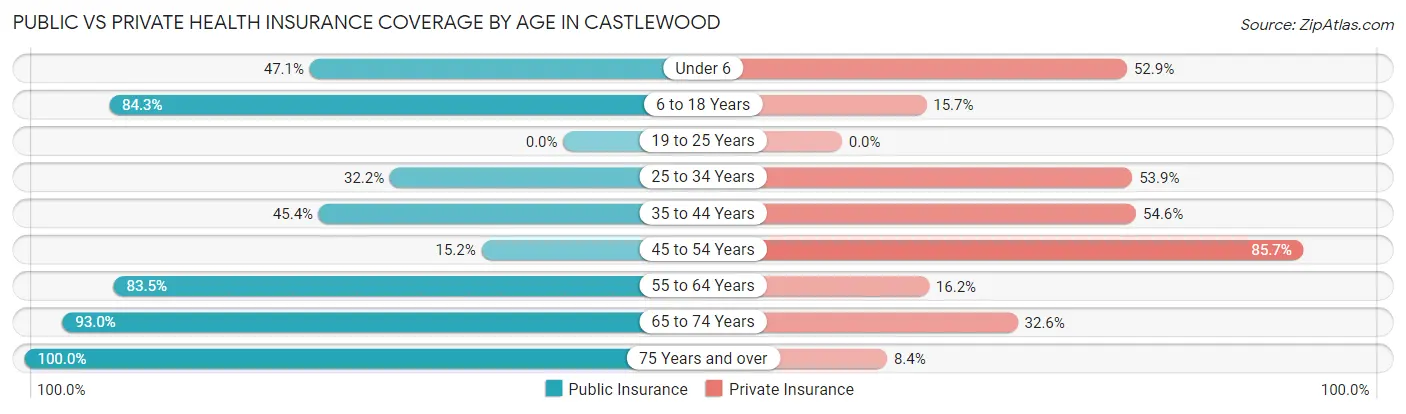
| Age Bracket | Public Insurance | Private Insurance |
| Under 6 | 8 (47.1%) | 9 (52.9%) |
| 6 to 18 Years | 43 (84.3%) | 8 (15.7%) |
| 19 to 25 Years | 0 (0.0%) | 0 (0.0%) |
| 25 to 34 Years | 37 (32.2%) | 62 (53.9%) |
| 35 to 44 Years | 49 (45.4%) | 59 (54.6%) |
| 45 to 54 Years | 17 (15.2%) | 96 (85.7%) |
| 55 to 64 Years | 222 (83.5%) | 43 (16.2%) |
| 65 to 74 Years | 265 (93.0%) | 93 (32.6%) |
| 75 Years and over | 155 (100.0%) | 13 (8.4%) |
| Total | 796 (71.8%) | 383 (34.5%) |
Disability Status by Sex by Age in Castlewood
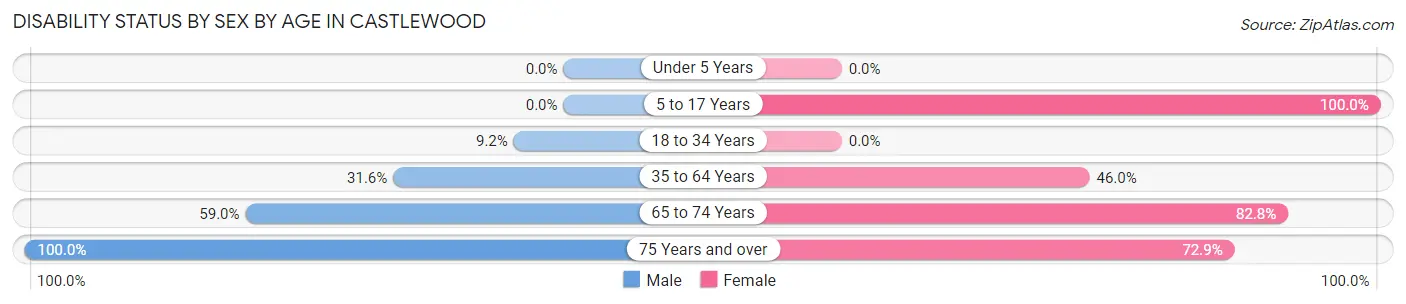
| Age Bracket | Male | Female |
| Under 5 Years | 0 (0.0%) | 0 (0.0%) |
| 5 to 17 Years | 0 (0.0%) | 28 (100.0%) |
| 18 to 34 Years | 6 (9.2%) | 0 (0.0%) |
| 35 to 64 Years | 67 (31.6%) | 126 (46.0%) |
| 65 to 74 Years | 72 (59.0%) | 135 (82.8%) |
| 75 Years and over | 37 (100.0%) | 86 (72.9%) |
Disability Class by Sex by Age in Castlewood
Disability Class: Hearing Difficulty
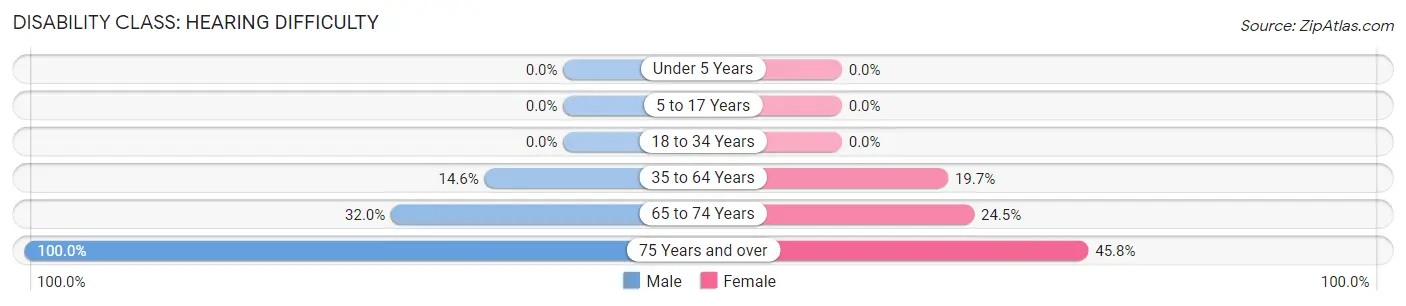
| Age Bracket | Male | Female |
| Under 5 Years | 0 (0.0%) | 0 (0.0%) |
| 5 to 17 Years | 0 (0.0%) | 0 (0.0%) |
| 18 to 34 Years | 0 (0.0%) | 0 (0.0%) |
| 35 to 64 Years | 31 (14.6%) | 54 (19.7%) |
| 65 to 74 Years | 39 (32.0%) | 40 (24.5%) |
| 75 Years and over | 37 (100.0%) | 54 (45.8%) |
Disability Class: Vision Difficulty
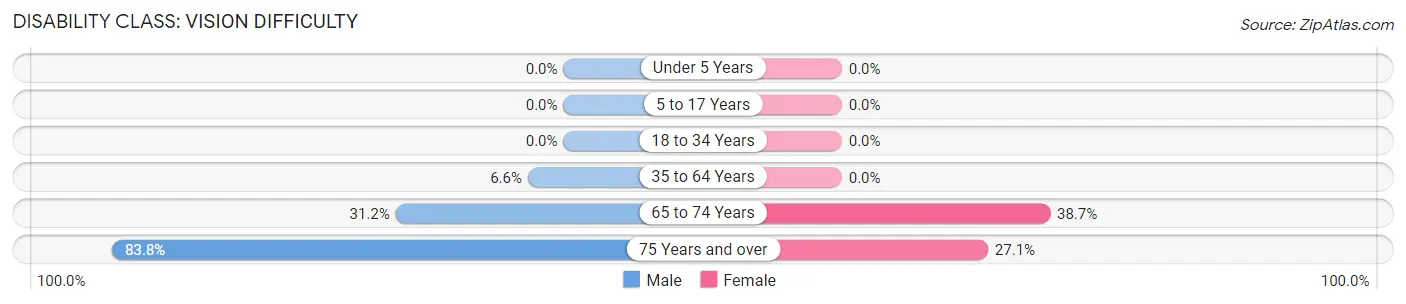
| Age Bracket | Male | Female |
| Under 5 Years | 0 (0.0%) | 0 (0.0%) |
| 5 to 17 Years | 0 (0.0%) | 0 (0.0%) |
| 18 to 34 Years | 0 (0.0%) | 0 (0.0%) |
| 35 to 64 Years | 14 (6.6%) | 0 (0.0%) |
| 65 to 74 Years | 38 (31.1%) | 63 (38.7%) |
| 75 Years and over | 31 (83.8%) | 32 (27.1%) |
Disability Class: Cognitive Difficulty
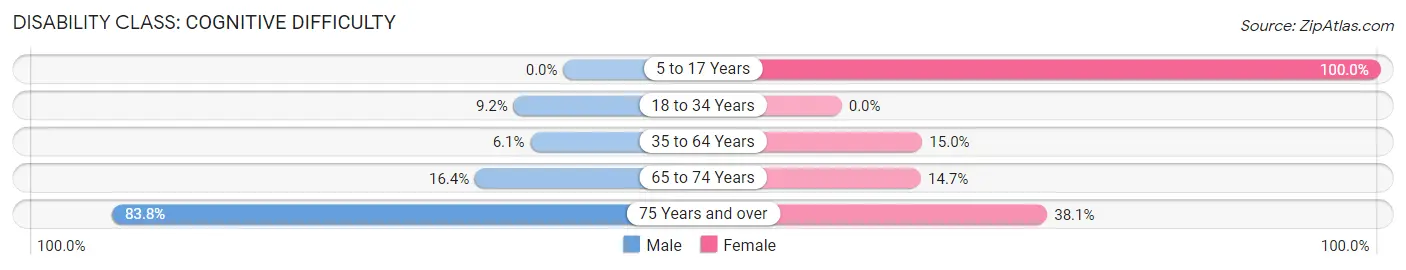
| Age Bracket | Male | Female |
| 5 to 17 Years | 0 (0.0%) | 28 (100.0%) |
| 18 to 34 Years | 6 (9.2%) | 0 (0.0%) |
| 35 to 64 Years | 13 (6.1%) | 41 (15.0%) |
| 65 to 74 Years | 20 (16.4%) | 24 (14.7%) |
| 75 Years and over | 31 (83.8%) | 45 (38.1%) |
Disability Class: Ambulatory Difficulty
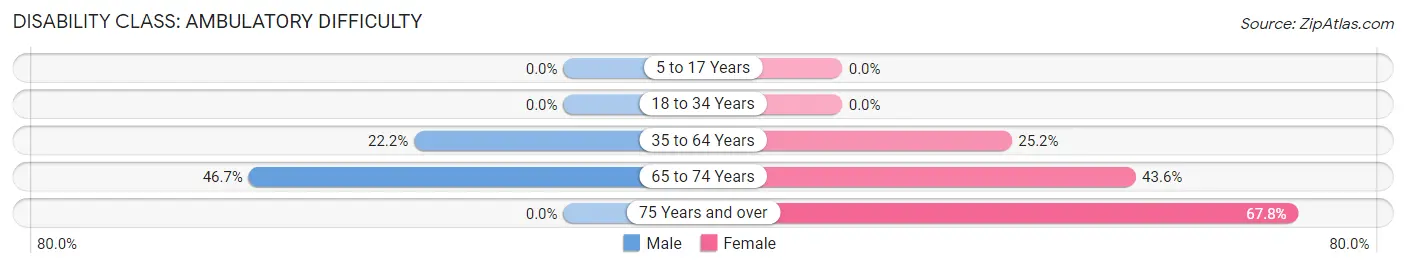
| Age Bracket | Male | Female |
| 5 to 17 Years | 0 (0.0%) | 0 (0.0%) |
| 18 to 34 Years | 0 (0.0%) | 0 (0.0%) |
| 35 to 64 Years | 47 (22.2%) | 69 (25.2%) |
| 65 to 74 Years | 57 (46.7%) | 71 (43.6%) |
| 75 Years and over | 0 (0.0%) | 80 (67.8%) |
Disability Class: Self-Care Difficulty
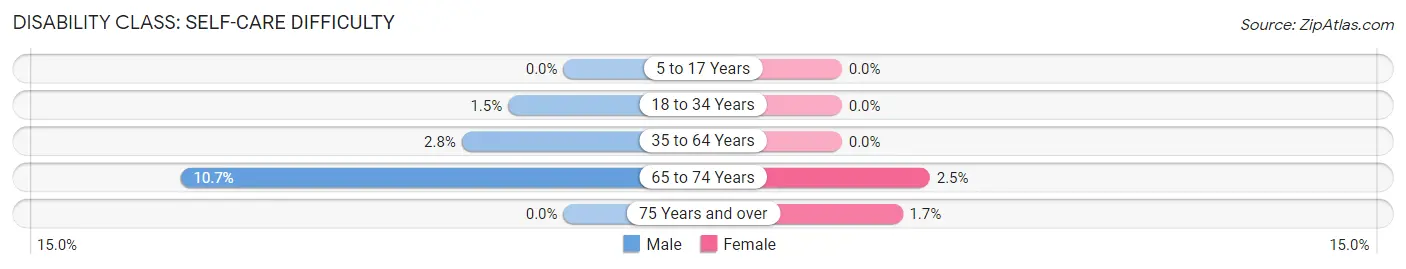
| Age Bracket | Male | Female |
| 5 to 17 Years | 0 (0.0%) | 0 (0.0%) |
| 18 to 34 Years | 1 (1.5%) | 0 (0.0%) |
| 35 to 64 Years | 6 (2.8%) | 0 (0.0%) |
| 65 to 74 Years | 13 (10.7%) | 4 (2.5%) |
| 75 Years and over | 0 (0.0%) | 2 (1.7%) |
Technology Access in Castlewood
Computing Device Access in Castlewood
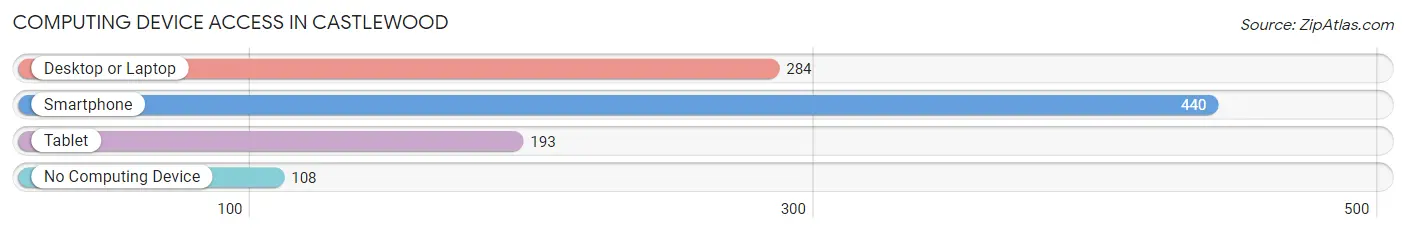
| Device Type | # Households | % Households |
| Desktop or Laptop | 284 | 49.8% |
| Smartphone | 440 | 77.2% |
| Tablet | 193 | 33.9% |
| No Computing Device | 108 | 19.0% |
| Total | 570 | 100.0% |
Internet Access in Castlewood
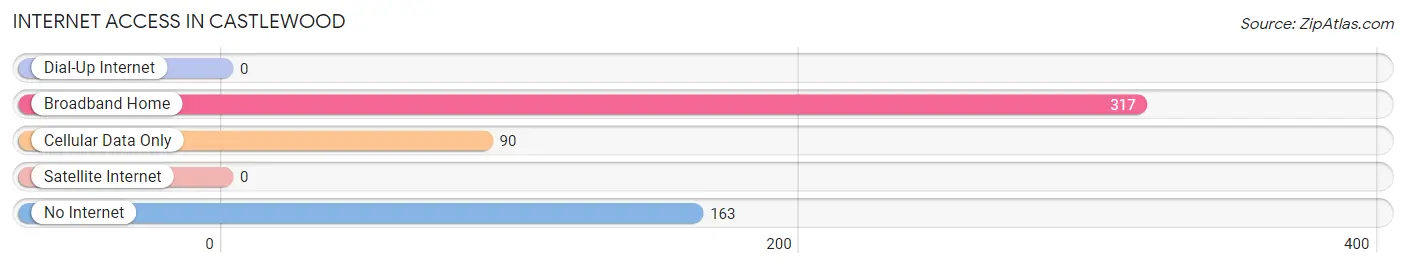
| Internet Type | # Households | % Households |
| Dial-Up Internet | 0 | 0.0% |
| Broadband Home | 317 | 55.6% |
| Cellular Data Only | 90 | 15.8% |
| Satellite Internet | 0 | 0.0% |
| No Internet | 163 | 28.6% |
| Total | 570 | 100.0% |
Castlewood Summary
Castlewood is a small town located in Russell County, Virginia, United States. It is situated in the Appalachian Mountains, near the border of Kentucky and West Virginia. The town has a population of approximately 1,000 people and is the county seat of Russell County.
History
Castlewood was first settled in the late 1700s by a group of settlers from North Carolina. The town was originally known as “Castlewood Station” and was a stop on the Virginia and Tennessee Railroad. The town was officially incorporated in 1891 and was named after the nearby Castlewood Mountain.
In the early 1900s, Castlewood was a thriving coal mining town. The coal industry was the main source of employment for the town’s residents. The town also had a number of other businesses, including a sawmill, a gristmill, and a general store.
In the 1950s, the coal industry began to decline and many of the town’s residents moved away in search of work. The town’s population decreased significantly and the town’s economy suffered.
In the late 1970s, the town began to experience a resurgence. The town’s economy was revitalized by the opening of a new shopping center and the construction of a new hospital. The town also began to attract new businesses, such as a furniture store and a restaurant.
Geography
Castlewood is located in the Appalachian Mountains in southwestern Virginia. The town is situated in the Clinch River Valley, near the border of Kentucky and West Virginia. The town is surrounded by rolling hills and mountains, and is located at an elevation of 1,400 feet.
The town is located approximately 30 miles from the city of Bristol, Tennessee, and is approximately 90 miles from the city of Roanoke, Virginia.
Economy
The economy of Castlewood is largely based on tourism and agriculture. The town is home to a number of tourist attractions, including the Castlewood Mountain State Park, the Clinch River, and the Russell County Historical Museum.
The town is also home to a number of agricultural businesses, including a dairy farm, a beef cattle farm, and a poultry farm.
Demographics
As of the 2010 census, the population of Castlewood was 1,000 people. The town has a population that is predominantly white (97.2%) and has a median household income of $30,000. The town also has a poverty rate of 22.2%.
Conclusion
Castlewood is a small town located in Russell County, Virginia. The town has a population of approximately 1,000 people and is the county seat of Russell County. The town’s economy is largely based on tourism and agriculture, and the town is home to a number of tourist attractions and agricultural businesses. The town has a predominantly white population and a median household income of $30,000.
Common Questions
What is Per Capita Income in Castlewood?
Per Capita income in Castlewood is $30,454.
What is the Median Family Income in Castlewood?
Median Family Income in Castlewood is $57,601.
What is the Median Household income in Castlewood?
Median Household Income in Castlewood is $48,750.
What is Income or Wage Gap in Castlewood?
Income or Wage Gap in Castlewood is 15.1%.
Women in Castlewood earn 84.9 cents for every dollar earned by a man.
What is Inequality or Gini Index in Castlewood?
Inequality or Gini Index in Castlewood is 0.48.
What is the Total Population of Castlewood?
Total Population of Castlewood is 1,122.
What is the Total Male Population of Castlewood?
Total Male Population of Castlewood is 454.
What is the Total Female Population of Castlewood?
Total Female Population of Castlewood is 668.
What is the Ratio of Males per 100 Females in Castlewood?
There are 67.96 Males per 100 Females in Castlewood.
What is the Ratio of Females per 100 Males in Castlewood?
There are 147.14 Females per 100 Males in Castlewood.
What is the Median Population Age in Castlewood?
Median Population Age in Castlewood is 61.1 Years.
What is the Average Family Size in Castlewood
Average Family Size in Castlewood is 2.1 People.
What is the Average Household Size in Castlewood
Average Household Size in Castlewood is 1.9 People.
How Large is the Labor Force in Castlewood?
There are 347 People in the Labor Forcein in Castlewood.
What is the Percentage of People in the Labor Force in Castlewood?
31.6% of People are in the Labor Force in Castlewood.
What is the Unemployment Rate in Castlewood?
Unemployment Rate in Castlewood is 2.0%.