Zip Codes with the Highest Percentage of Population Employed in Administrative & Support Services in Sterling, VA
RELATED REPORTS & OPTIONS
Administrative & Support Services
Sterling
Compare Zip Codes
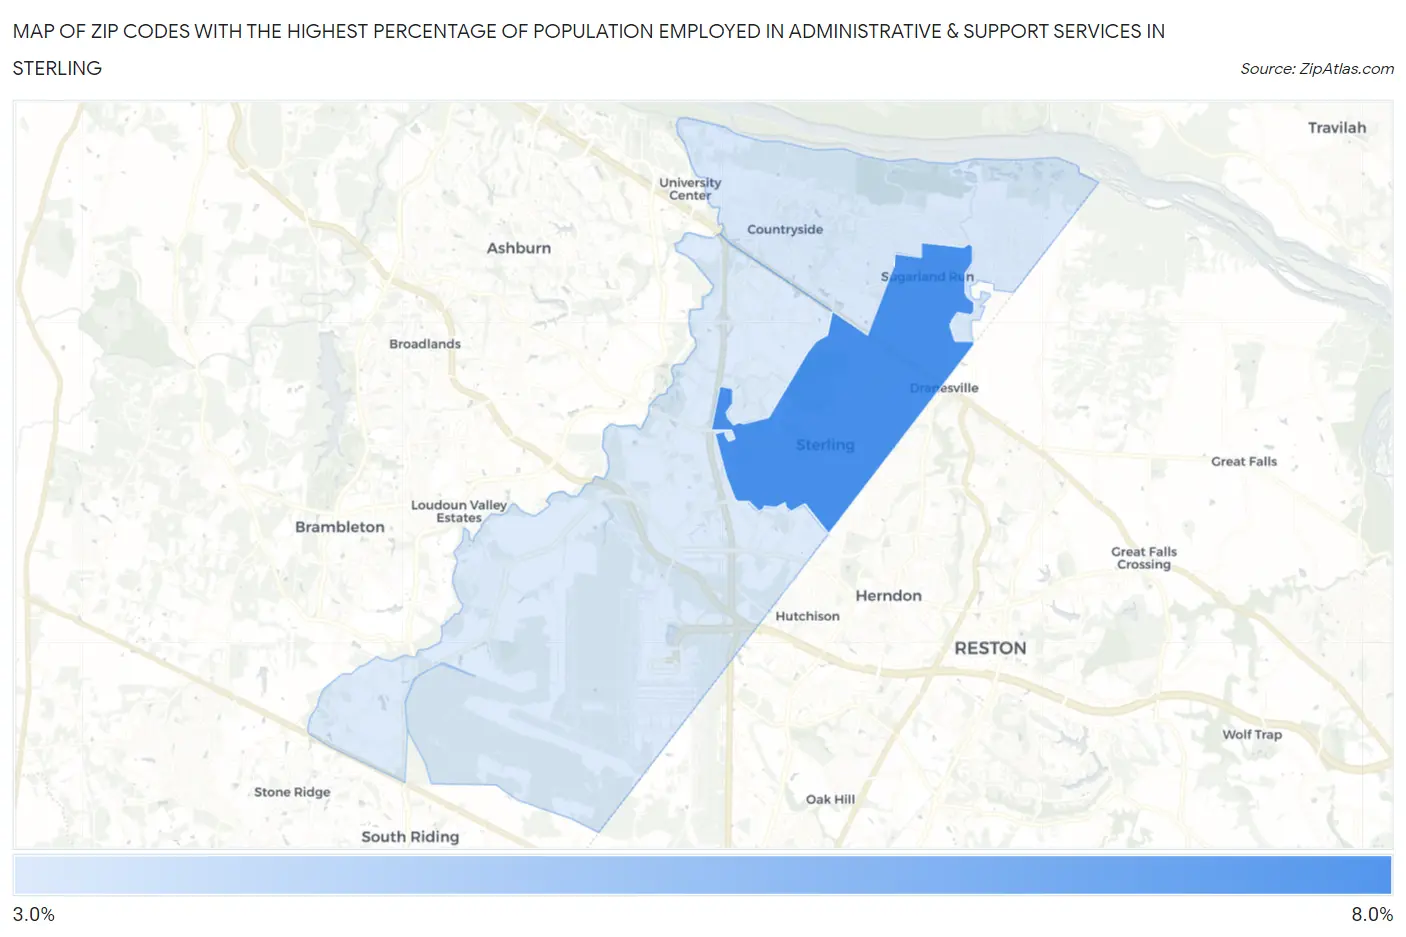
Map of Zip Codes with the Highest Percentage of Population Employed in Administrative & Support Services in Sterling
3.9%
7.9%
Zip Codes with the Highest Percentage of Population Employed in Administrative & Support Services in Sterling, VA
| Zip Code | % Employed | vs State | vs National | |
| 1. | 20164 | 7.9% | 4.1%(+3.73)#88 | 4.1%(+3.71)#2,379 |
| 2. | 20165 | 4.1% | 4.1%(-0.047)#303 | 4.1%(-0.060)#10,285 |
| 3. | 20166 | 3.9% | 4.1%(-0.190)#323 | 4.1%(-0.203)#10,909 |
1
Common Questions
What are the Top Zip Codes with the Highest Percentage of Population Employed in Administrative & Support Services in Sterling, VA?
Top Zip Codes with the Highest Percentage of Population Employed in Administrative & Support Services in Sterling, VA are:
What zip code has the Highest Percentage of Population Employed in Administrative & Support Services in Sterling, VA?
20164 has the Highest Percentage of Population Employed in Administrative & Support Services in Sterling, VA with 7.9%.
What is the Percentage of Population Employed in Administrative & Support Services in Sterling, VA?
Percentage of Population Employed in Administrative & Support Services in Sterling is 8.6%.
What is the Percentage of Population Employed in Administrative & Support Services in Virginia?
Percentage of Population Employed in Administrative & Support Services in Virginia is 4.1%.
What is the Percentage of Population Employed in Administrative & Support Services in the United States?
Percentage of Population Employed in Administrative & Support Services in the United States is 4.1%.