Mountain Road, VA Map & Demographics
Mountain Road Map
Mountain Road Overview
$14,239
PER CAPITA INCOME
$35,000
AVG FAMILY INCOME
$33,056
AVG HOUSEHOLD INCOME
21.3%
WAGE / INCOME GAP [ % ]
78.7¢/ $1
WAGE / INCOME GAP [ $ ]
0.34
INEQUALITY / GINI INDEX
1,419
TOTAL POPULATION
691
MALE POPULATION
728
FEMALE POPULATION
94.92
MALES / 100 FEMALES
105.35
FEMALES / 100 MALES
41.8
MEDIAN AGE
3.9
AVG FAMILY SIZE
3.7
AVG HOUSEHOLD SIZE
441
LABOR FORCE [ PEOPLE ]
35.7%
PERCENT IN LABOR FORCE
Income in Mountain Road
Income Overview in Mountain Road
Per Capita Income in Mountain Road is $14,239, while median incomes of families and households are $35,000 and $33,056 respectively.
| Characteristic | Number | Measure |
| Per Capita Income | 1,419 | $14,239 |
| Median Family Income | 334 | $35,000 |
| Mean Family Income | 334 | $48,190 |
| Median Household Income | 386 | $33,056 |
| Mean Household Income | 386 | $44,612 |
| Income Deficit | 334 | $0 |
| Wage / Income Gap (%) | 1,419 | 21.30% |
| Wage / Income Gap ($) | 1,419 | 78.70¢ per $1 |
| Gini / Inequality Index | 1,419 | 0.34 |
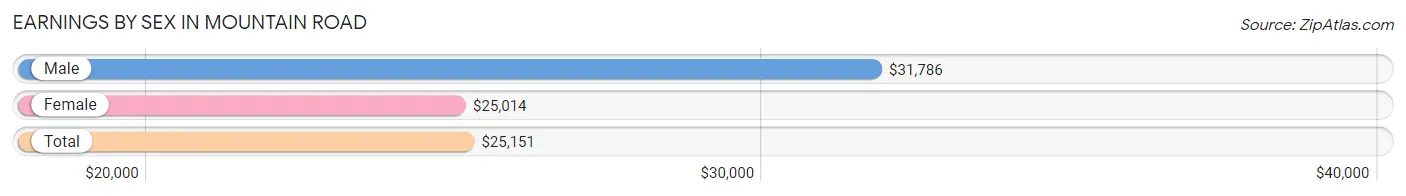
Earnings by Sex in Mountain Road
Average Earnings in Mountain Road are $25,151, $31,786 for men and $25,014 for women, a difference of 21.3%.
| Sex | Number | Average Earnings |
| Male | 178 (39.8%) | $31,786 |
| Female | 269 (60.2%) | $25,014 |
| Total | 447 (100.0%) | $25,151 |
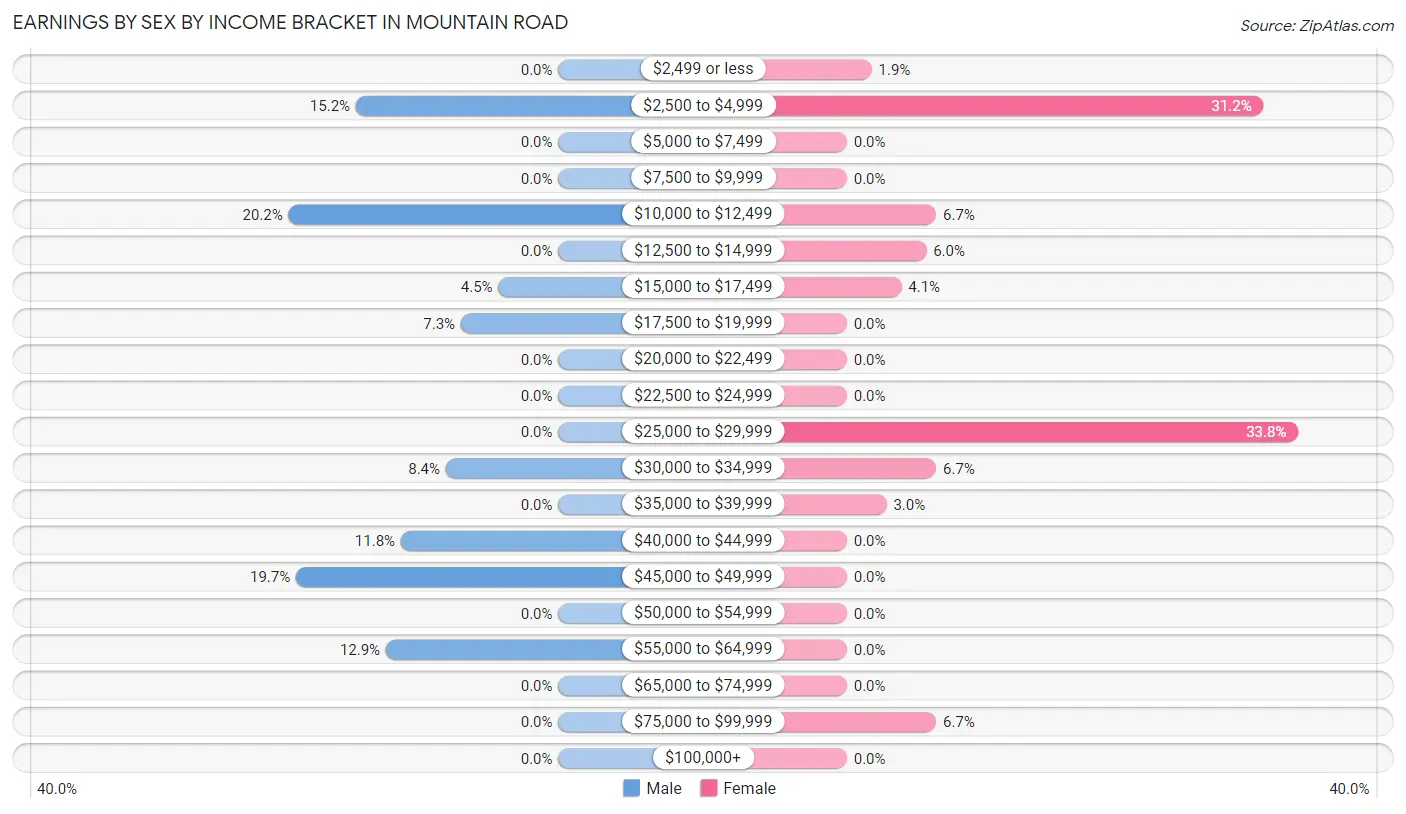
Earnings by Sex by Income Bracket in Mountain Road
The most common earnings brackets in Mountain Road are $10,000 to $12,499 for men (36 | 20.2%) and $25,000 to $29,999 for women (91 | 33.8%).
| Income | Male | Female |
| $2,499 or less | 0 (0.0%) | 5 (1.9%) |
| $2,500 to $4,999 | 27 (15.2%) | 84 (31.2%) |
| $5,000 to $7,499 | 0 (0.0%) | 0 (0.0%) |
| $7,500 to $9,999 | 0 (0.0%) | 0 (0.0%) |
| $10,000 to $12,499 | 36 (20.2%) | 18 (6.7%) |
| $12,500 to $14,999 | 0 (0.0%) | 16 (5.9%) |
| $15,000 to $17,499 | 8 (4.5%) | 11 (4.1%) |
| $17,500 to $19,999 | 13 (7.3%) | 0 (0.0%) |
| $20,000 to $22,499 | 0 (0.0%) | 0 (0.0%) |
| $22,500 to $24,999 | 0 (0.0%) | 0 (0.0%) |
| $25,000 to $29,999 | 0 (0.0%) | 91 (33.8%) |
| $30,000 to $34,999 | 15 (8.4%) | 18 (6.7%) |
| $35,000 to $39,999 | 0 (0.0%) | 8 (3.0%) |
| $40,000 to $44,999 | 21 (11.8%) | 0 (0.0%) |
| $45,000 to $49,999 | 35 (19.7%) | 0 (0.0%) |
| $50,000 to $54,999 | 0 (0.0%) | 0 (0.0%) |
| $55,000 to $64,999 | 23 (12.9%) | 0 (0.0%) |
| $65,000 to $74,999 | 0 (0.0%) | 0 (0.0%) |
| $75,000 to $99,999 | 0 (0.0%) | 18 (6.7%) |
| $100,000+ | 0 (0.0%) | 0 (0.0%) |
| Total | 178 (100.0%) | 269 (100.0%) |
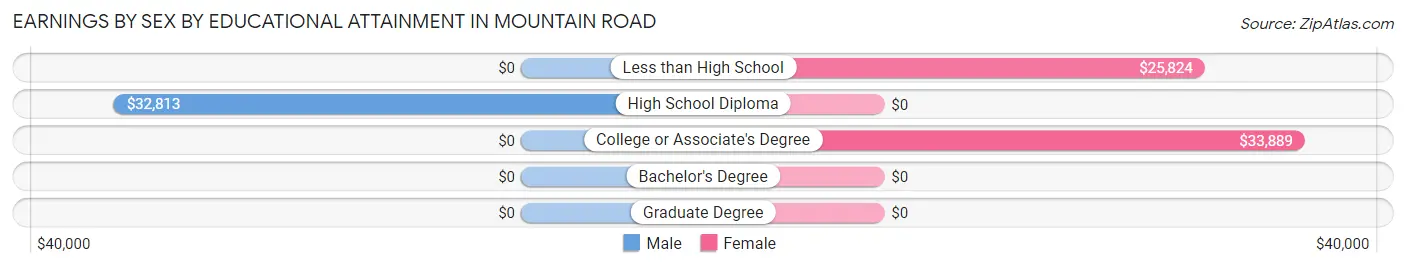
Earnings by Sex by Educational Attainment in Mountain Road
Average earnings in Mountain Road are $43,452 for men and $26,168 for women, a difference of 39.8%. Men with an educational attainment of high school diploma enjoy the highest average annual earnings of $32,813, while those with high school diploma education earn the least with $32,813. Women with an educational attainment of college or associate's degree earn the most with the average annual earnings of $33,889, while those with less than high school education have the smallest earnings of $25,824.
| Educational Attainment | Male Income | Female Income |
| Less than High School | - | - |
| High School Diploma | $32,813 | $0 |
| College or Associate's Degree | - | - |
| Bachelor's Degree | - | - |
| Graduate Degree | - | - |
| Total | $43,452 | $26,168 |
Family Income in Mountain Road
Family Income Brackets in Mountain Road
According to the Mountain Road family income data, there are 133 families falling into the $25,000 to $34,999 income range, which is the most common income bracket and makes up 39.8% of all families.
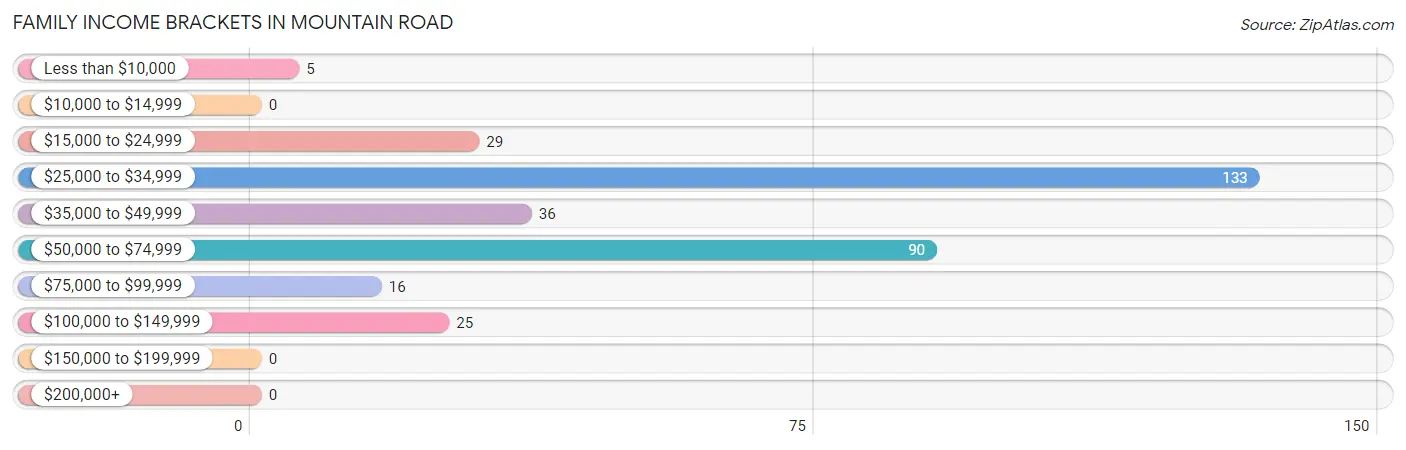
| Income Bracket | # Families | % Families |
| Less than $10,000 | 5 | 1.5% |
| $10,000 to $14,999 | 0 | 0.0% |
| $15,000 to $24,999 | 29 | 8.7% |
| $25,000 to $34,999 | 133 | 39.8% |
| $35,000 to $49,999 | 36 | 10.8% |
| $50,000 to $74,999 | 90 | 26.9% |
| $75,000 to $99,999 | 16 | 4.8% |
| $100,000 to $149,999 | 25 | 7.5% |
| $150,000 to $199,999 | 0 | 0.0% |
| $200,000+ | 0 | 0.0% |
Family Income by Famaliy Size in Mountain Road
2-person families (151 | 45.2%) account for the highest median family income in Mountain Road with $56,473 per family, while 2-person families (151 | 45.2%) have the highest median income of $28,236 per family member.
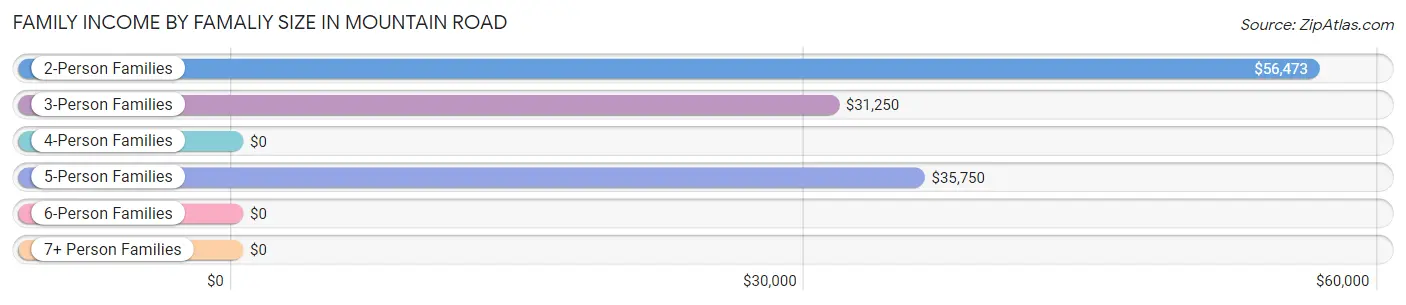
| Income Bracket | # Families | Median Income |
| 2-Person Families | 151 (45.2%) | $56,473 |
| 3-Person Families | 100 (29.9%) | $31,250 |
| 4-Person Families | 29 (8.7%) | $0 |
| 5-Person Families | 54 (16.2%) | $35,750 |
| 6-Person Families | 0 (0.0%) | $0 |
| 7+ Person Families | 0 (0.0%) | $0 |
| Total | 334 (100.0%) | $35,000 |
Family Income by Number of Earners in Mountain Road
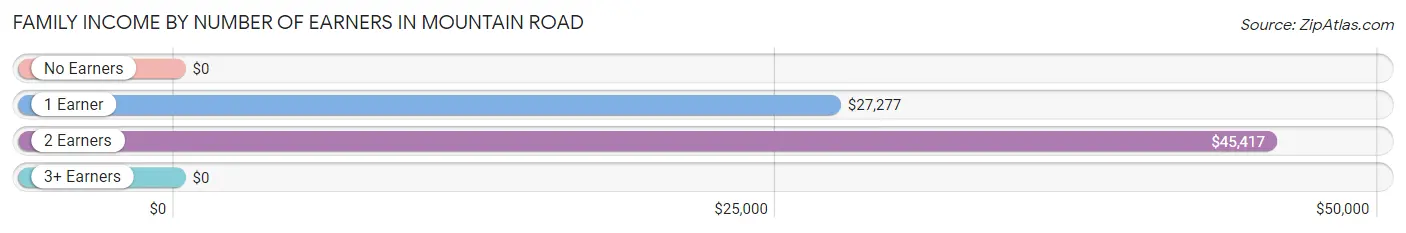
| Number of Earners | # Families | Median Income |
| No Earners | 107 (32.0%) | $0 |
| 1 Earner | 109 (32.6%) | $27,277 |
| 2 Earners | 100 (29.9%) | $45,417 |
| 3+ Earners | 18 (5.4%) | $0 |
| Total | 334 (100.0%) | $35,000 |
Household Income in Mountain Road
Household Income Brackets in Mountain Road
With 142 households falling in the category, the $25,000 to $34,999 income range is the most frequent in Mountain Road, accounting for 36.8% of all households.
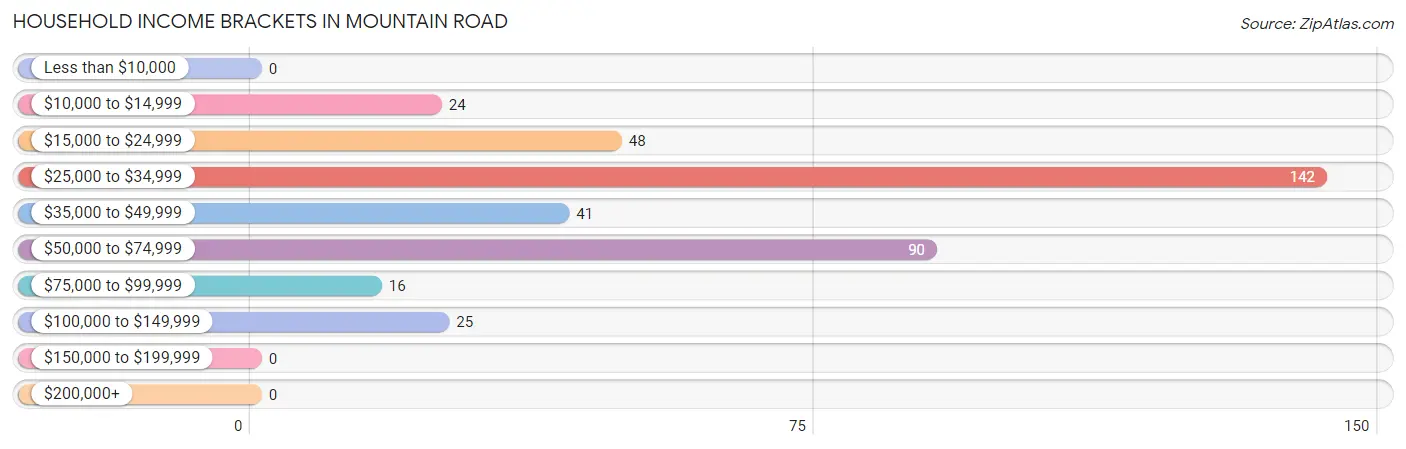
| Income Bracket | # Households | % Households |
| Less than $10,000 | 0 | 0.0% |
| $10,000 to $14,999 | 24 | 6.2% |
| $15,000 to $24,999 | 48 | 12.4% |
| $25,000 to $34,999 | 142 | 36.8% |
| $35,000 to $49,999 | 41 | 10.6% |
| $50,000 to $74,999 | 90 | 23.3% |
| $75,000 to $99,999 | 16 | 4.1% |
| $100,000 to $149,999 | 25 | 6.5% |
| $150,000 to $199,999 | 0 | 0.0% |
| $200,000+ | 0 | 0.0% |
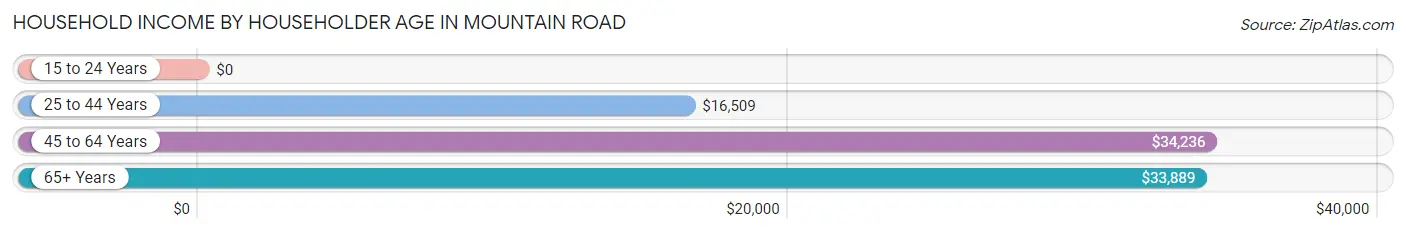
Household Income by Householder Age in Mountain Road
The median household income in Mountain Road is $33,056, with the highest median household income of $34,236 found in the 45 to 64 years age bracket for the primary householder. A total of 113 households (29.3%) fall into this category.
| Income Bracket | # Households | Median Income |
| 15 to 24 Years | 0 (0.0%) | $0 |
| 25 to 44 Years | 35 (9.1%) | $16,509 |
| 45 to 64 Years | 113 (29.3%) | $34,236 |
| 65+ Years | 238 (61.7%) | $33,889 |
| Total | 386 (100.0%) | $33,056 |
Poverty in Mountain Road
Income Below Poverty by Sex and Age in Mountain Road
With 19.4% poverty level for males and 12.6% for females among the residents of Mountain Road, 6 to 11 year old males and 35 to 44 year old females are the most vulnerable to poverty, with 19 males (100.0%) and 11 females (64.7%) in their respective age groups living below the poverty level.
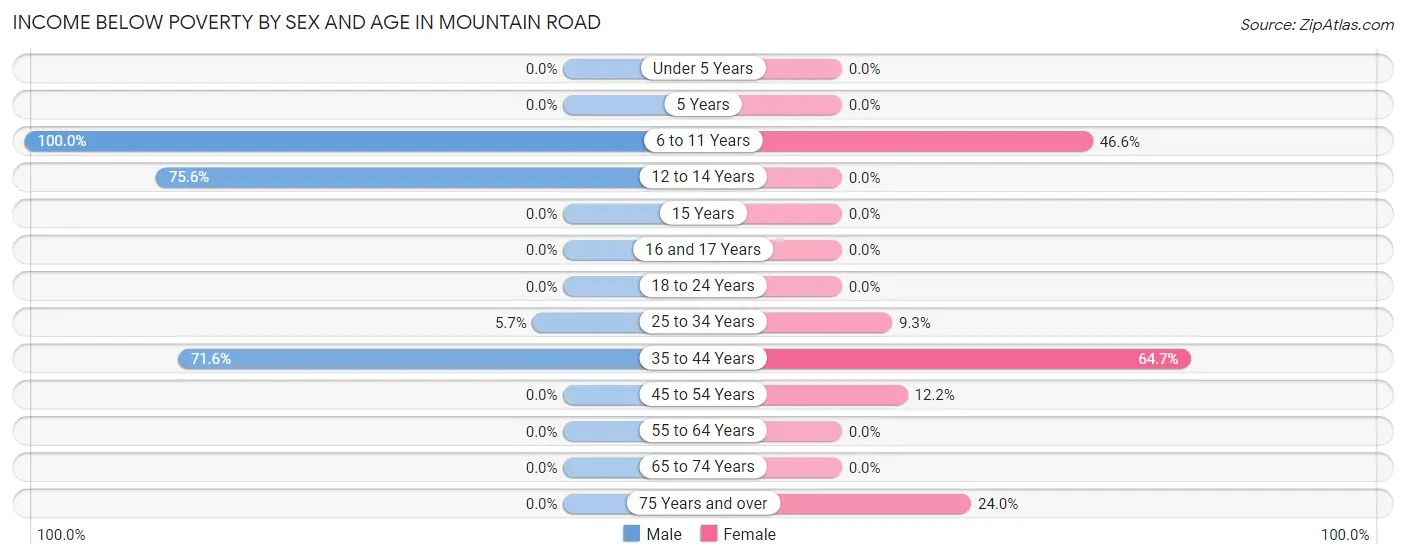
| Age Bracket | Male | Female |
| Under 5 Years | 0 (0.0%) | 0 (0.0%) |
| 5 Years | 0 (0.0%) | 0 (0.0%) |
| 6 to 11 Years | 19 (100.0%) | 34 (46.6%) |
| 12 to 14 Years | 31 (75.6%) | 0 (0.0%) |
| 15 Years | 0 (0.0%) | 0 (0.0%) |
| 16 and 17 Years | 0 (0.0%) | 0 (0.0%) |
| 18 to 24 Years | 0 (0.0%) | 0 (0.0%) |
| 25 to 34 Years | 6 (5.7%) | 18 (9.3%) |
| 35 to 44 Years | 78 (71.6%) | 11 (64.7%) |
| 45 to 54 Years | 0 (0.0%) | 5 (12.2%) |
| 55 to 64 Years | 0 (0.0%) | 0 (0.0%) |
| 65 to 74 Years | 0 (0.0%) | 0 (0.0%) |
| 75 Years and over | 0 (0.0%) | 24 (24.0%) |
| Total | 134 (19.4%) | 92 (12.6%) |
Income Above Poverty by Sex and Age in Mountain Road
According to the poverty statistics in Mountain Road, males aged 18 to 24 years and females aged 12 to 14 years are the age groups that are most secure financially, with 100.0% of males and 100.0% of females in these age groups living above the poverty line.
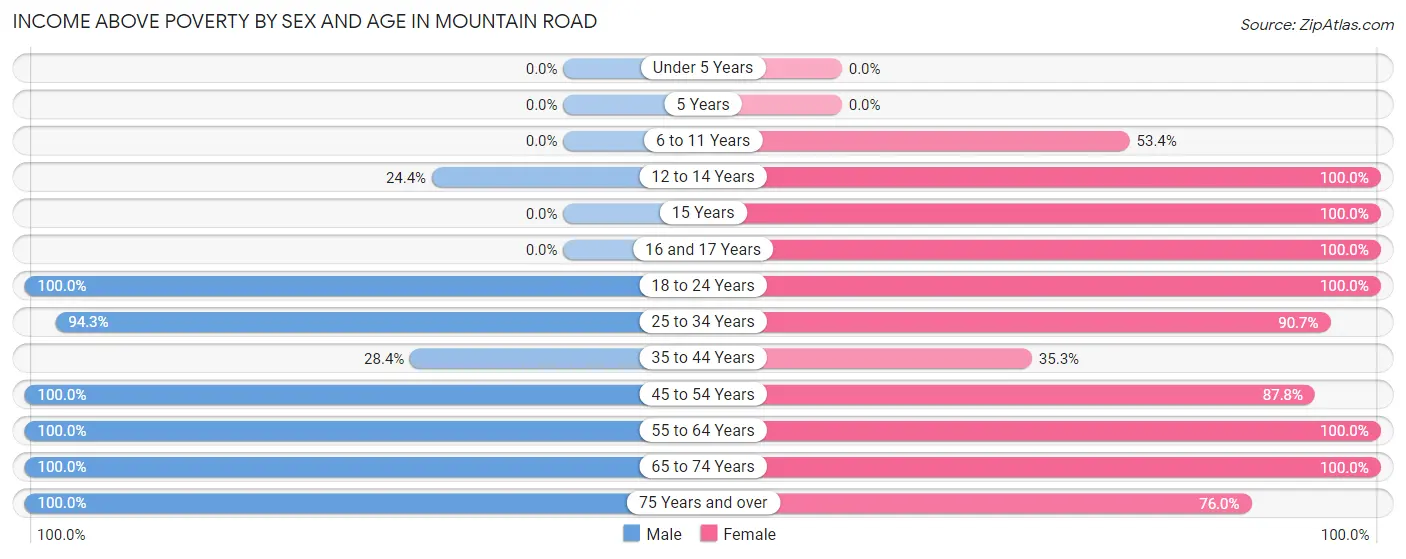
| Age Bracket | Male | Female |
| Under 5 Years | 0 (0.0%) | 0 (0.0%) |
| 5 Years | 0 (0.0%) | 0 (0.0%) |
| 6 to 11 Years | 0 (0.0%) | 39 (53.4%) |
| 12 to 14 Years | 10 (24.4%) | 47 (100.0%) |
| 15 Years | 0 (0.0%) | 3 (100.0%) |
| 16 and 17 Years | 0 (0.0%) | 17 (100.0%) |
| 18 to 24 Years | 36 (100.0%) | 84 (100.0%) |
| 25 to 34 Years | 99 (94.3%) | 175 (90.7%) |
| 35 to 44 Years | 31 (28.4%) | 6 (35.3%) |
| 45 to 54 Years | 35 (100.0%) | 36 (87.8%) |
| 55 to 64 Years | 215 (100.0%) | 85 (100.0%) |
| 65 to 74 Years | 49 (100.0%) | 68 (100.0%) |
| 75 Years and over | 82 (100.0%) | 76 (76.0%) |
| Total | 557 (80.6%) | 636 (87.4%) |
Income Below Poverty Among Married-Couple Families in Mountain Road
The poverty statistics for married-couple families in Mountain Road show that 6.8% or 11 of the total 163 families live below the poverty line. Families with 1 or 2 children have the highest poverty rate of 100.0%, comprising of 11 families. On the other hand, families with no children have the lowest poverty rate of 0.0%, which includes 0 families.
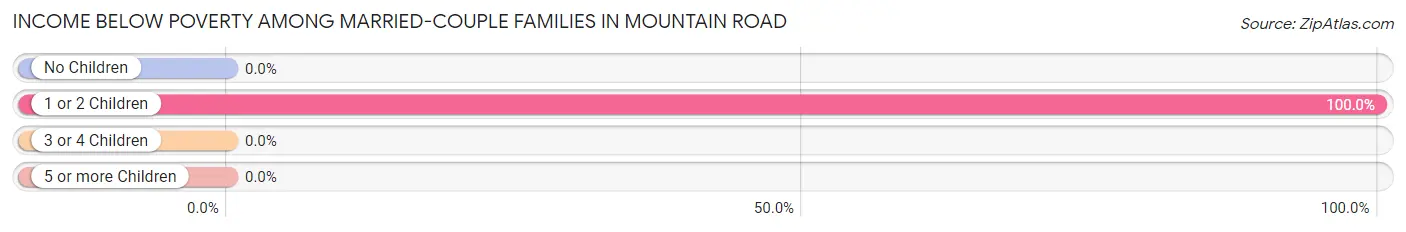
| Children | Above Poverty | Below Poverty |
| No Children | 146 (100.0%) | 0 (0.0%) |
| 1 or 2 Children | 0 (0.0%) | 11 (100.0%) |
| 3 or 4 Children | 6 (100.0%) | 0 (0.0%) |
| 5 or more Children | 0 (0.0%) | 0 (0.0%) |
| Total | 152 (93.2%) | 11 (6.8%) |
Income Below Poverty Among Single-Parent Households in Mountain Road
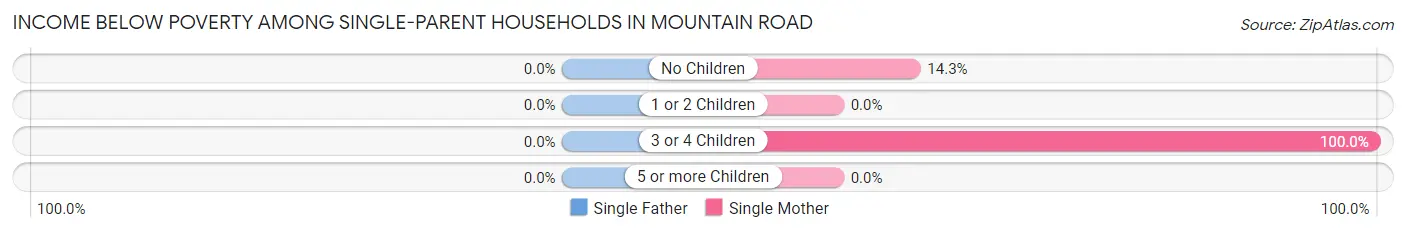
| Children | Single Father | Single Mother |
| No Children | 0 (0.0%) | 5 (14.3%) |
| 1 or 2 Children | 0 (0.0%) | 0 (0.0%) |
| 3 or 4 Children | 0 (0.0%) | 18 (100.0%) |
| 5 or more Children | 0 (0.0%) | 0 (0.0%) |
| Total | 0 (0.0%) | 23 (16.1%) |
Income Below Poverty Among Married-Couple vs Single-Parent Households in Mountain Road
The poverty data for Mountain Road shows that 11 of the married-couple family households (6.8%) and 23 of the single-parent households (13.5%) are living below the poverty level. Within the married-couple family households, those with 1 or 2 children have the highest poverty rate, with 11 households (100.0%) falling below the poverty line. Among the single-parent households, those with 3 or 4 children have the highest poverty rate, with 18 household (100.0%) living below poverty.
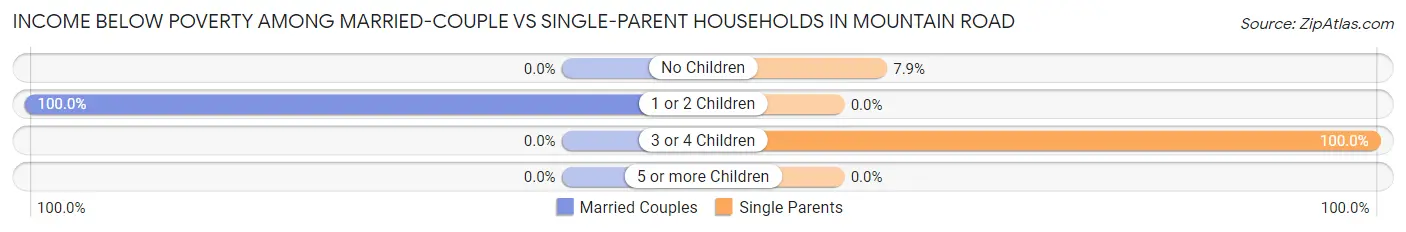
| Children | Married-Couple Families | Single-Parent Households |
| No Children | 0 (0.0%) | 5 (7.9%) |
| 1 or 2 Children | 11 (100.0%) | 0 (0.0%) |
| 3 or 4 Children | 0 (0.0%) | 18 (100.0%) |
| 5 or more Children | 0 (0.0%) | 0 (0.0%) |
| Total | 11 (6.8%) | 23 (13.5%) |
Race in Mountain Road
The most populous races in Mountain Road are Black / African American (1,014 | 71.5%), White / Caucasian (297 | 20.9%), and Hispanic or Latino (108 | 7.6%).
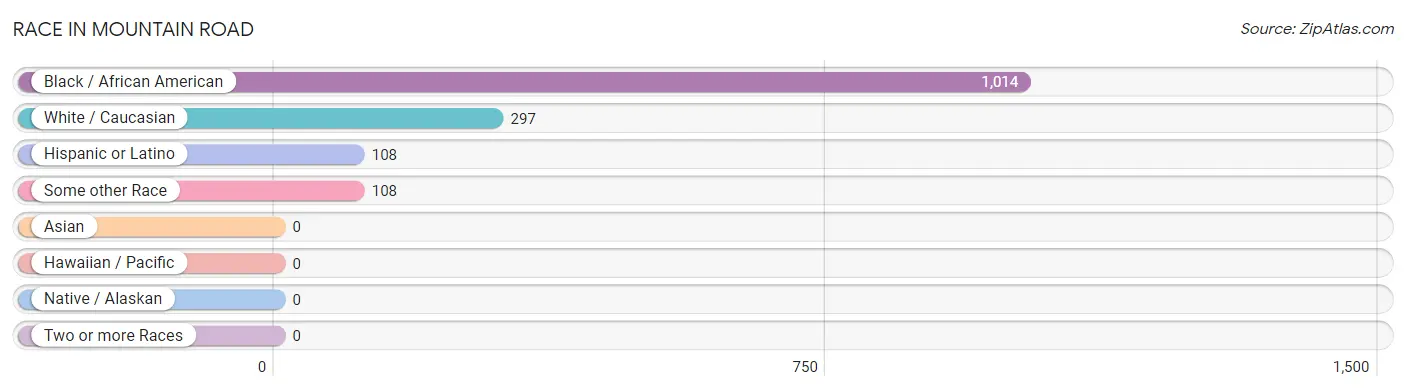
| Race | # Population | % Population |
| Asian | 0 | 0.0% |
| Black / African American | 1,014 | 71.5% |
| Hawaiian / Pacific | 0 | 0.0% |
| Hispanic or Latino | 108 | 7.6% |
| Native / Alaskan | 0 | 0.0% |
| White / Caucasian | 297 | 20.9% |
| Two or more Races | 0 | 0.0% |
| Some other Race | 108 | 7.6% |
| Total | 1,419 | 100.0% |
Ancestry in Mountain Road
The most populous ancestries reported in Mountain Road are American (184 | 13.0%), and Mexican (108 | 7.6%), together accounting for 20.6% of all Mountain Road residents.
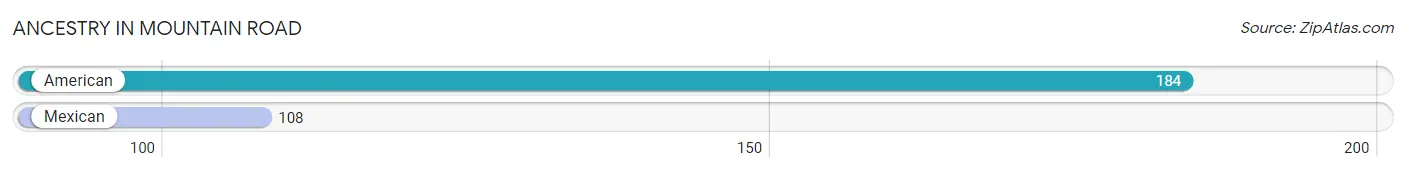
| Ancestry | # Population | % Population |
| American | 184 | 13.0% |
| Mexican | 108 | 7.6% | View All 2 Rows |
Immigrants in Mountain Road
The most numerous immigrant groups reported in Mountain Road came from Central America (61 | 4.3%), Latin America (61 | 4.3%), and Mexico (61 | 4.3%), together accounting for 12.9% of all Mountain Road residents.
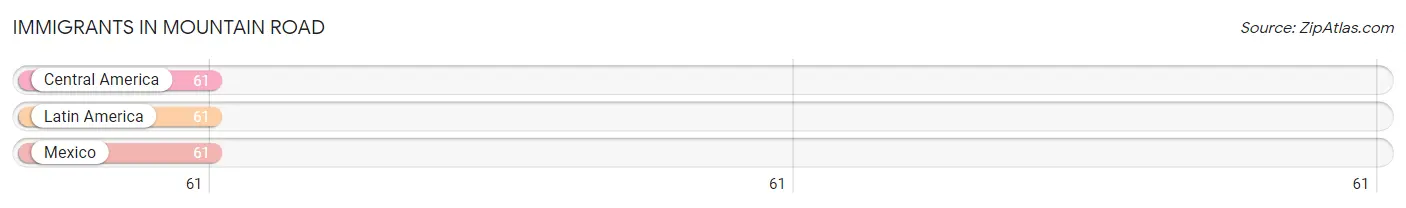
| Immigration Origin | # Population | % Population |
| Central America | 61 | 4.3% |
| Latin America | 61 | 4.3% |
| Mexico | 61 | 4.3% | View All 3 Rows |
Sex and Age in Mountain Road
Sex and Age in Mountain Road
The most populous age groups in Mountain Road are 55 to 59 Years (123 | 17.8%) for men and 25 to 29 Years (175 | 24.0%) for women.
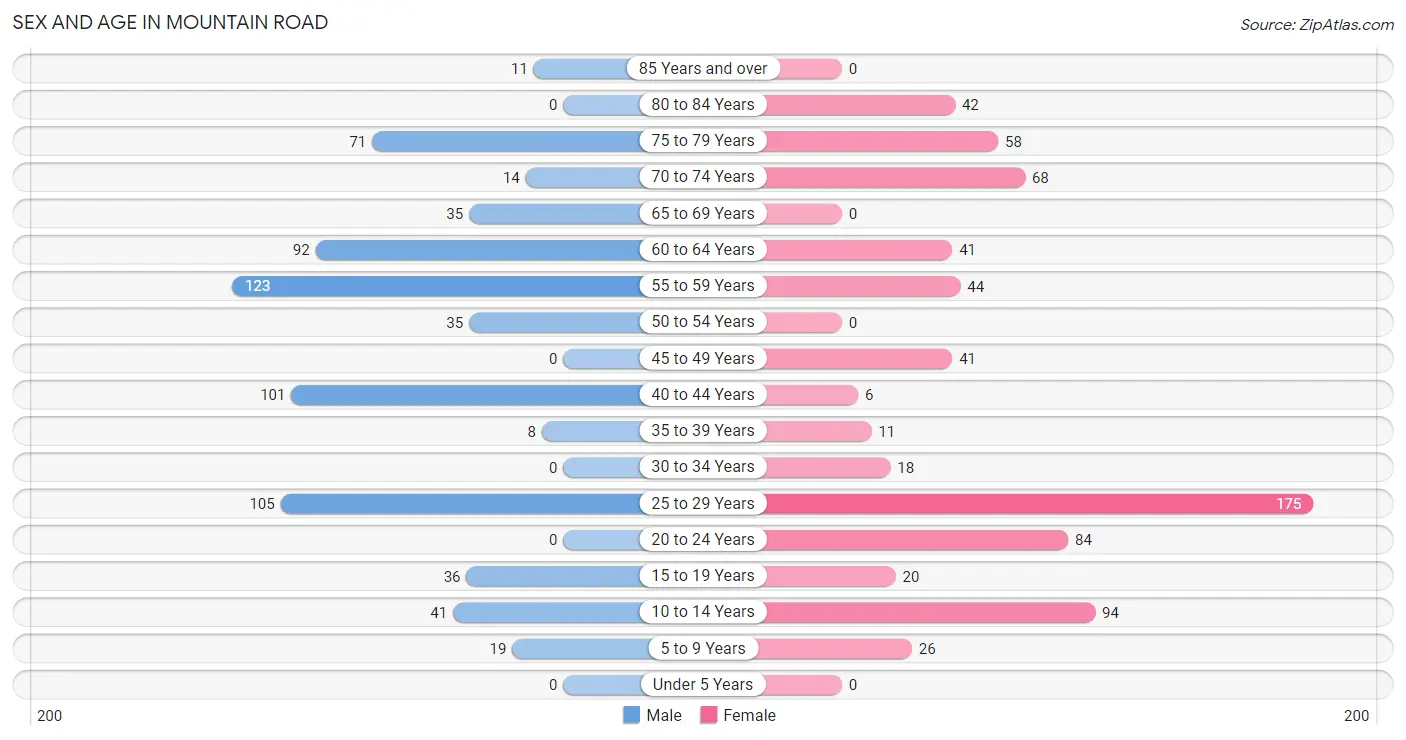
| Age Bracket | Male | Female |
| Under 5 Years | 0 (0.0%) | 0 (0.0%) |
| 5 to 9 Years | 19 (2.8%) | 26 (3.6%) |
| 10 to 14 Years | 41 (5.9%) | 94 (12.9%) |
| 15 to 19 Years | 36 (5.2%) | 20 (2.8%) |
| 20 to 24 Years | 0 (0.0%) | 84 (11.5%) |
| 25 to 29 Years | 105 (15.2%) | 175 (24.0%) |
| 30 to 34 Years | 0 (0.0%) | 18 (2.5%) |
| 35 to 39 Years | 8 (1.2%) | 11 (1.5%) |
| 40 to 44 Years | 101 (14.6%) | 6 (0.8%) |
| 45 to 49 Years | 0 (0.0%) | 41 (5.6%) |
| 50 to 54 Years | 35 (5.1%) | 0 (0.0%) |
| 55 to 59 Years | 123 (17.8%) | 44 (6.0%) |
| 60 to 64 Years | 92 (13.3%) | 41 (5.6%) |
| 65 to 69 Years | 35 (5.1%) | 0 (0.0%) |
| 70 to 74 Years | 14 (2.0%) | 68 (9.3%) |
| 75 to 79 Years | 71 (10.3%) | 58 (8.0%) |
| 80 to 84 Years | 0 (0.0%) | 42 (5.8%) |
| 85 Years and over | 11 (1.6%) | 0 (0.0%) |
| Total | 691 (100.0%) | 728 (100.0%) |
Families and Households in Mountain Road
Median Family Size in Mountain Road
The median family size in Mountain Road is 3.86 persons per family, with single female/mother families (143 | 42.8%) accounting for the largest median family size of 5.94 persons per family. On the other hand, single male/father families (28 | 8.4%) represent the smallest median family size with 2.29 persons per family.
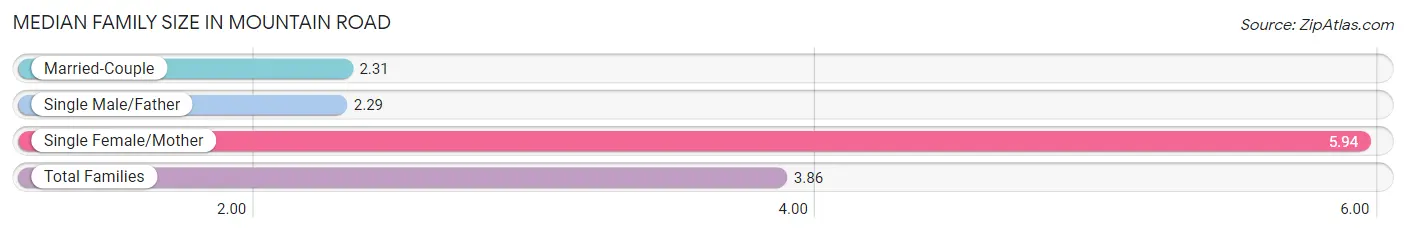
| Family Type | # Families | Family Size |
| Married-Couple | 163 (48.8%) | 2.31 |
| Single Male/Father | 28 (8.4%) | 2.29 |
| Single Female/Mother | 143 (42.8%) | 5.94 |
| Total Families | 334 (100.0%) | 3.86 |
Median Household Size in Mountain Road
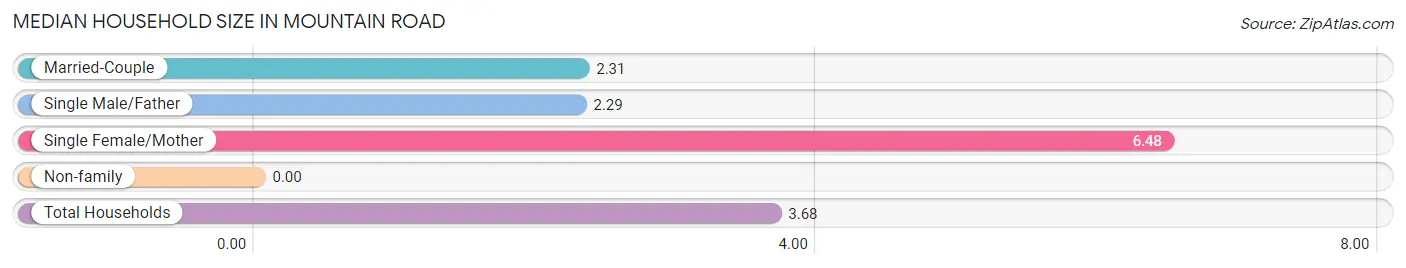
| Household Type | # Households | Household Size |
| Married-Couple | 163 (42.2%) | 2.31 |
| Single Male/Father | 28 (7.2%) | 2.29 |
| Single Female/Mother | 143 (37.0%) | 6.48 |
| Non-family | 52 (13.5%) | - |
| Total Households | 386 (100.0%) | 3.68 |
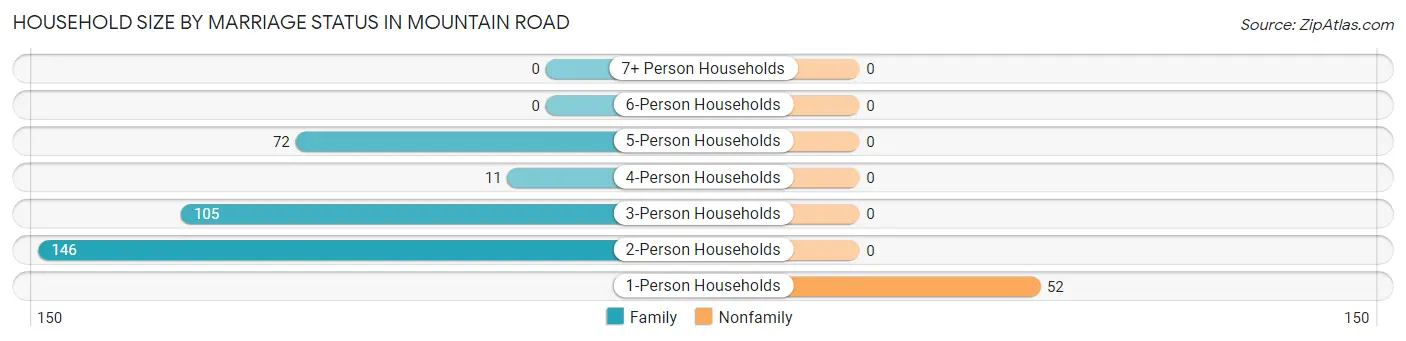
Household Size by Marriage Status in Mountain Road
Out of a total of 386 households in Mountain Road, 334 (86.5%) are family households, while 52 (13.5%) are nonfamily households. The most numerous type of family households are 2-person households, comprising 146, and the most common type of nonfamily households are 1-person households, comprising 52.
| Household Size | Family Households | Nonfamily Households |
| 1-Person Households | - | 52 (13.5%) |
| 2-Person Households | 146 (37.8%) | 0 (0.0%) |
| 3-Person Households | 105 (27.2%) | 0 (0.0%) |
| 4-Person Households | 11 (2.9%) | 0 (0.0%) |
| 5-Person Households | 72 (18.6%) | 0 (0.0%) |
| 6-Person Households | 0 (0.0%) | 0 (0.0%) |
| 7+ Person Households | 0 (0.0%) | 0 (0.0%) |
| Total | 334 (86.5%) | 52 (13.5%) |
Female Fertility in Mountain Road
Fertility by Age in Mountain Road
| Age Bracket | Women with Births | Births / 1,000 Women |
| 15 to 19 years | 0 (0.0%) | 0.0 |
| 20 to 34 years | 0 (0.0%) | 0.0 |
| 35 to 50 years | 0 (0.0%) | 0.0 |
| Total | 0 (0.0%) | 0.0 |
Fertility by Age by Marriage Status in Mountain Road
| Age Bracket | Married | Unmarried |
| 15 to 19 years | 0 (0.0%) | 0 (0.0%) |
| 20 to 34 years | 0 (0.0%) | 0 (0.0%) |
| 35 to 50 years | 0 (0.0%) | 0 (0.0%) |
| Total | 0 (0.0%) | 0 (0.0%) |
Fertility by Education in Mountain Road
| Educational Attainment | Women with Births | Births / 1,000 Women |
| Less than High School | 0 (0.0%) | 0.0 |
| High School Diploma | 0 (0.0%) | 0.0 |
| College or Associate's Degree | 0 (0.0%) | 0.0 |
| Bachelor's Degree | 0 (0.0%) | 0.0 |
| Graduate Degree | 0 (0.0%) | 0.0 |
| Total | 0 (0.0%) | 0.0 |
Fertility by Education by Marriage Status in Mountain Road
| Educational Attainment | Married | Unmarried |
| Less than High School | 0 (0.0%) | 0 (0.0%) |
| High School Diploma | 0 (0.0%) | 0 (0.0%) |
| College or Associate's Degree | 0 (0.0%) | 0 (0.0%) |
| Bachelor's Degree | 0 (0.0%) | 0 (0.0%) |
| Graduate Degree | 0 (0.0%) | 0 (0.0%) |
| Total | 0 (0.0%) | 0 (0.0%) |
Employment Characteristics in Mountain Road
Employment by Class of Employer in Mountain Road
Among the 423 employed individuals in Mountain Road, private company employees (259 | 61.2%), federal government employees (84 | 19.9%), and local government employees (52 | 12.3%) make up the most common classes of employment.
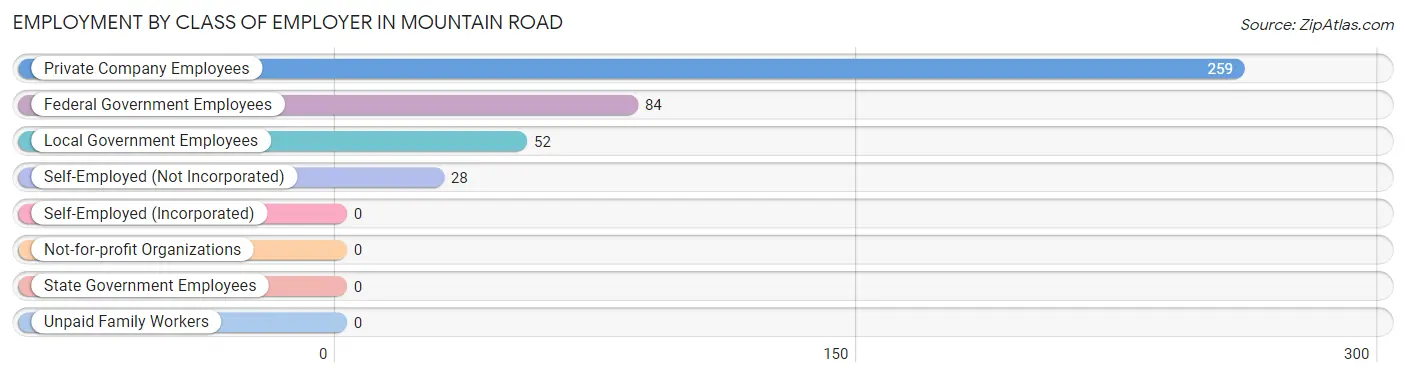
| Employer Class | # Employees | % Employees |
| Private Company Employees | 259 | 61.2% |
| Self-Employed (Incorporated) | 0 | 0.0% |
| Self-Employed (Not Incorporated) | 28 | 6.6% |
| Not-for-profit Organizations | 0 | 0.0% |
| Local Government Employees | 52 | 12.3% |
| State Government Employees | 0 | 0.0% |
| Federal Government Employees | 84 | 19.9% |
| Unpaid Family Workers | 0 | 0.0% |
| Total | 423 | 100.0% |
Employment Status by Age in Mountain Road
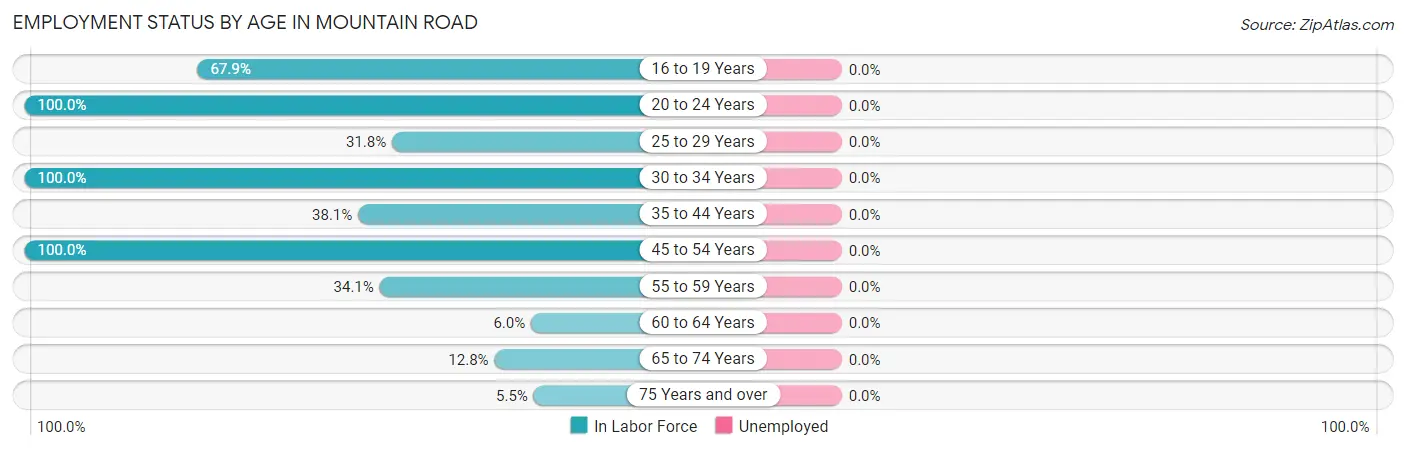
| Age Bracket | In Labor Force | Unemployed |
| 16 to 19 Years | 36 (67.9%) | 0 (0.0%) |
| 20 to 24 Years | 84 (100.0%) | 0 (0.0%) |
| 25 to 29 Years | 89 (31.8%) | 0 (0.0%) |
| 30 to 34 Years | 18 (100.0%) | 0 (0.0%) |
| 35 to 44 Years | 48 (38.1%) | 0 (0.0%) |
| 45 to 54 Years | 76 (100.0%) | 0 (0.0%) |
| 55 to 59 Years | 57 (34.1%) | 0 (0.0%) |
| 60 to 64 Years | 8 (6.0%) | 0 (0.0%) |
| 65 to 74 Years | 15 (12.8%) | 0 (0.0%) |
| 75 Years and over | 10 (5.5%) | 0 (0.0%) |
| Total | 441 (35.7%) | 0 (0.0%) |
Employment Status by Educational Attainment in Mountain Road
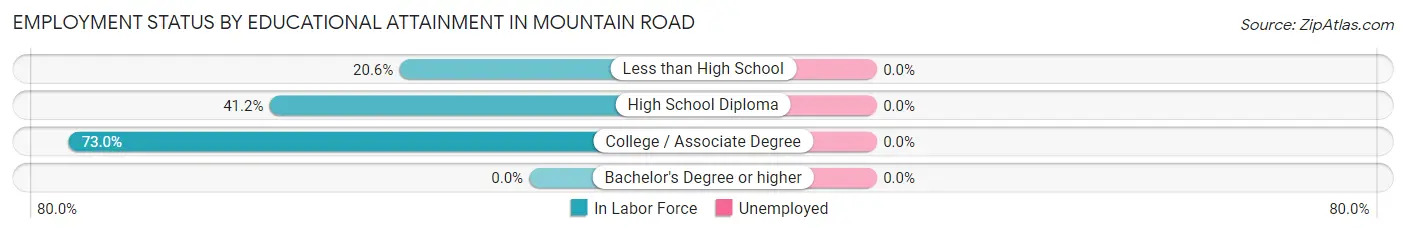
| Educational Attainment | In Labor Force | Unemployed |
| Less than High School | 72 (20.6%) | 0 (0.0%) |
| High School Diploma | 135 (41.2%) | 0 (0.0%) |
| College / Associate Degree | 89 (73.0%) | 0 (0.0%) |
| Bachelor's Degree or higher | 0 (0.0%) | 0 (0.0%) |
| Total | 296 (37.0%) | 0 (0.0%) |
Employment Occupations by Sex in Mountain Road
Management, Business, Science and Arts Occupations
The most common Management, Business, Science and Arts occupations in Mountain Road are Management (74 | 16.8%), Community & Social Service (6 | 1.4%), and Education Instruction & Library (6 | 1.4%).
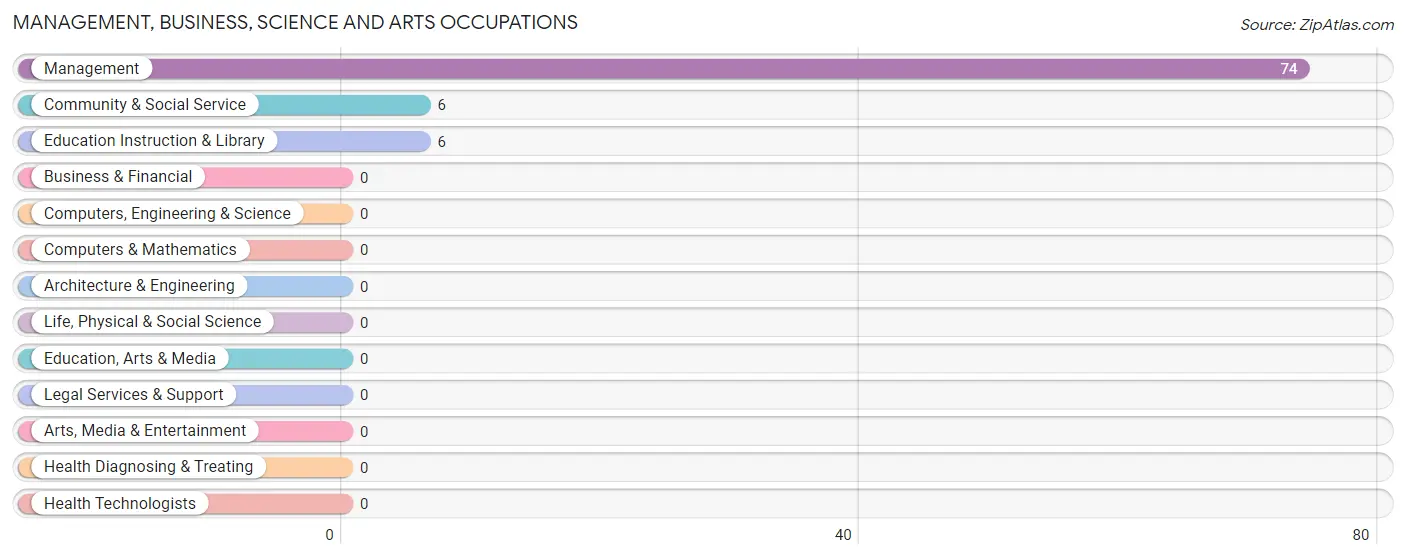
Management, Business, Science and Arts Occupations by Sex
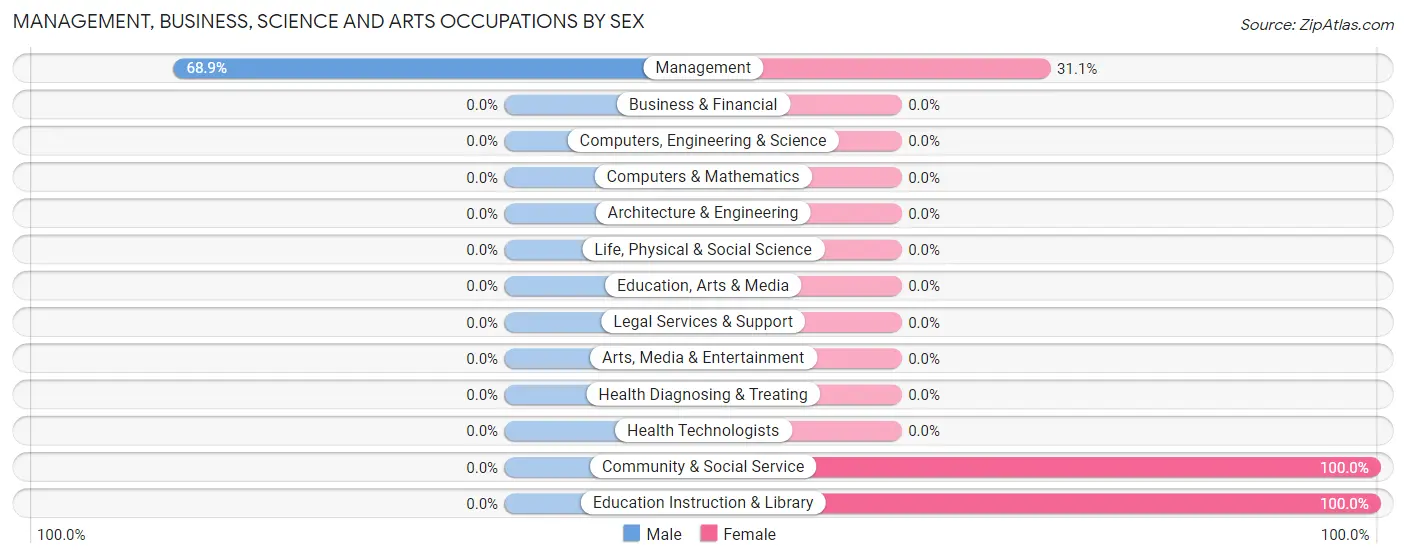
| Occupation | Male | Female |
| Management | 51 (68.9%) | 23 (31.1%) |
| Business & Financial | 0 (0.0%) | 0 (0.0%) |
| Computers, Engineering & Science | 0 (0.0%) | 0 (0.0%) |
| Computers & Mathematics | 0 (0.0%) | 0 (0.0%) |
| Architecture & Engineering | 0 (0.0%) | 0 (0.0%) |
| Life, Physical & Social Science | 0 (0.0%) | 0 (0.0%) |
| Community & Social Service | 0 (0.0%) | 6 (100.0%) |
| Education, Arts & Media | 0 (0.0%) | 0 (0.0%) |
| Legal Services & Support | 0 (0.0%) | 0 (0.0%) |
| Education Instruction & Library | 0 (0.0%) | 6 (100.0%) |
| Arts, Media & Entertainment | 0 (0.0%) | 0 (0.0%) |
| Health Diagnosing & Treating | 0 (0.0%) | 0 (0.0%) |
| Health Technologists | 0 (0.0%) | 0 (0.0%) |
| Total (Category) | 51 (63.7%) | 29 (36.2%) |
| Total (Overall) | 172 (39.0%) | 269 (61.0%) |
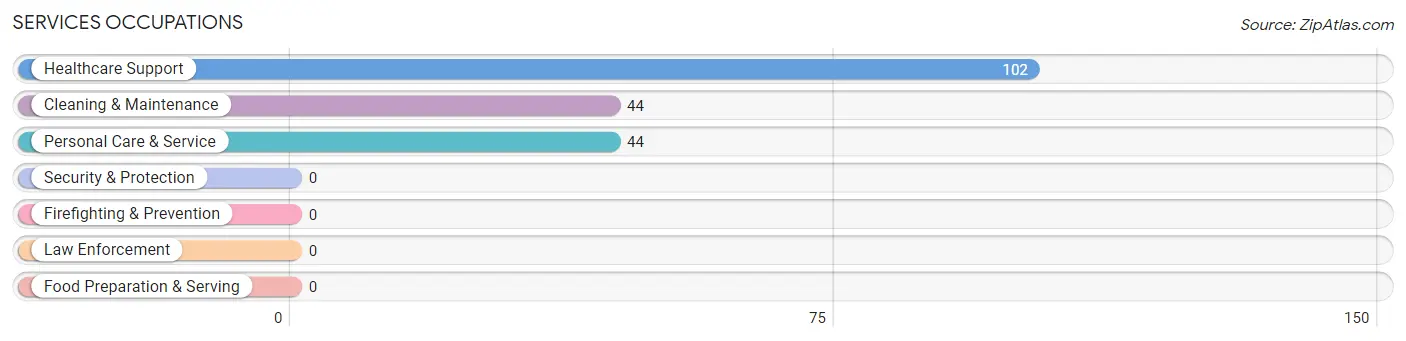
Services Occupations
The most common Services occupations in Mountain Road are Healthcare Support (102 | 23.1%), Cleaning & Maintenance (44 | 10.0%), and Personal Care & Service (44 | 10.0%).
Services Occupations by Sex
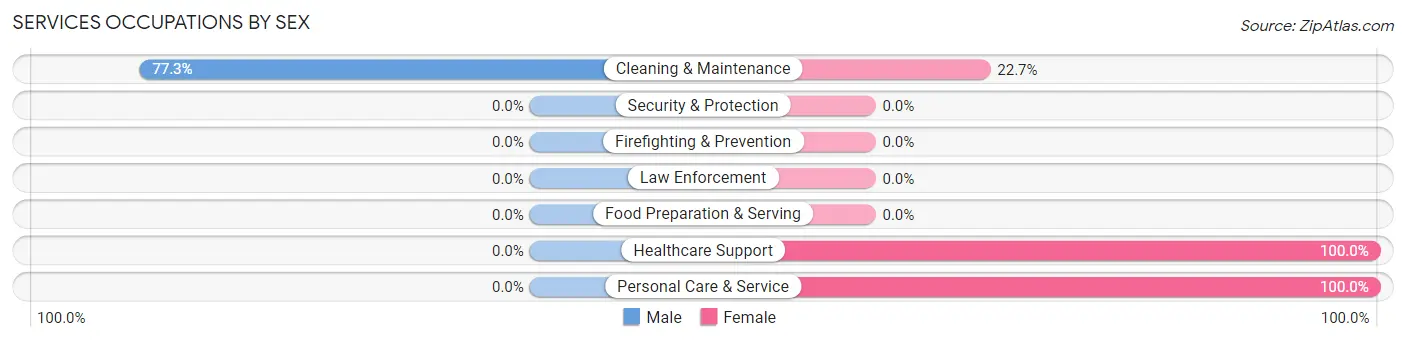
| Occupation | Male | Female |
| Healthcare Support | 0 (0.0%) | 102 (100.0%) |
| Security & Protection | 0 (0.0%) | 0 (0.0%) |
| Firefighting & Prevention | 0 (0.0%) | 0 (0.0%) |
| Law Enforcement | 0 (0.0%) | 0 (0.0%) |
| Food Preparation & Serving | 0 (0.0%) | 0 (0.0%) |
| Cleaning & Maintenance | 34 (77.3%) | 10 (22.7%) |
| Personal Care & Service | 0 (0.0%) | 44 (100.0%) |
| Total (Category) | 34 (17.9%) | 156 (82.1%) |
| Total (Overall) | 172 (39.0%) | 269 (61.0%) |
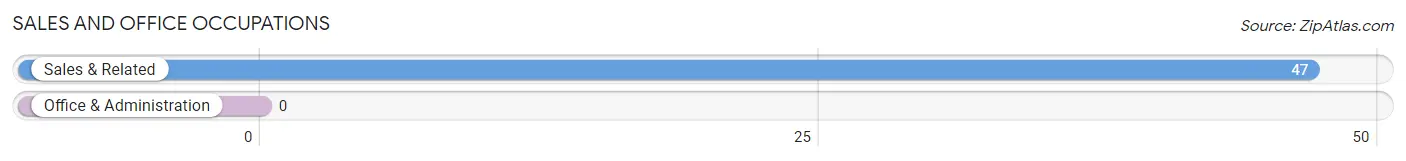
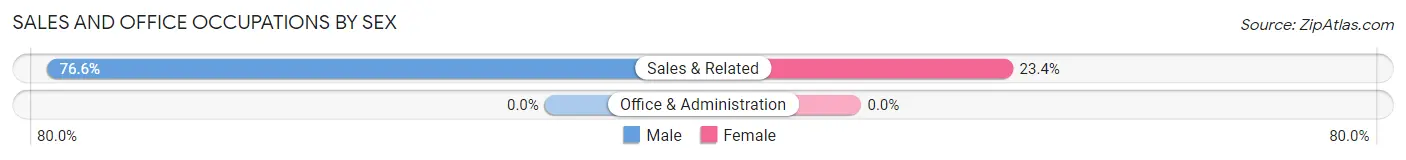
Sales and Office Occupations
The most common Sales and Office occupations in Mountain Road are , and Sales & Related (47 | 10.7%).
Sales and Office Occupations by Sex
| Occupation | Male | Female |
| Sales & Related | 36 (76.6%) | 11 (23.4%) |
| Office & Administration | 0 (0.0%) | 0 (0.0%) |
| Total (Category) | 36 (76.6%) | 11 (23.4%) |
| Total (Overall) | 172 (39.0%) | 269 (61.0%) |
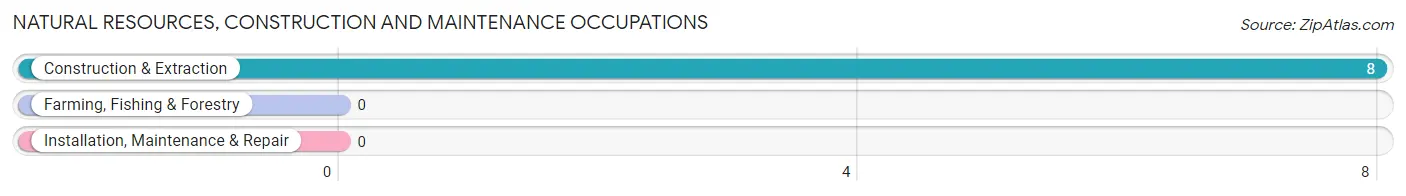
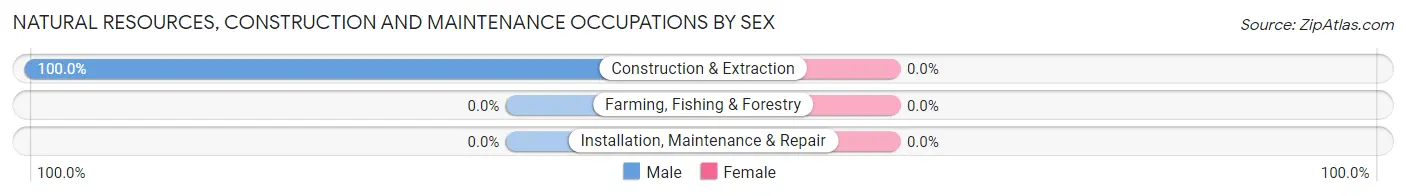
Natural Resources, Construction and Maintenance Occupations
The most common Natural Resources, Construction and Maintenance occupations in Mountain Road are , and Construction & Extraction (8 | 1.8%).
Natural Resources, Construction and Maintenance Occupations by Sex
| Occupation | Male | Female |
| Farming, Fishing & Forestry | 0 (0.0%) | 0 (0.0%) |
| Construction & Extraction | 8 (100.0%) | 0 (0.0%) |
| Installation, Maintenance & Repair | 0 (0.0%) | 0 (0.0%) |
| Total (Category) | 8 (100.0%) | 0 (0.0%) |
| Total (Overall) | 172 (39.0%) | 269 (61.0%) |
Production, Transportation and Moving Occupations
The most common Production, Transportation and Moving occupations in Mountain Road are Production (76 | 17.2%), Transportation (33 | 7.5%), and Material Moving (7 | 1.6%).
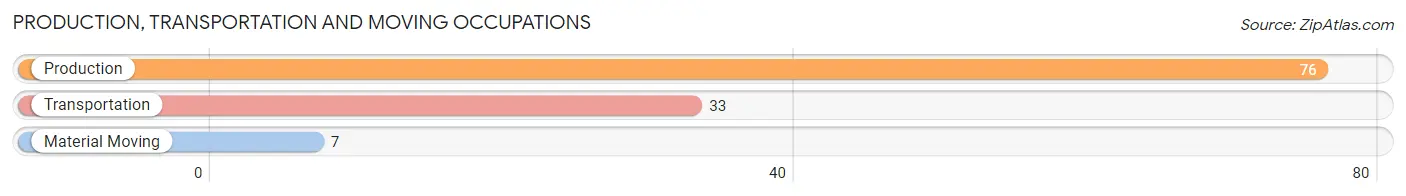
Production, Transportation and Moving Occupations by Sex
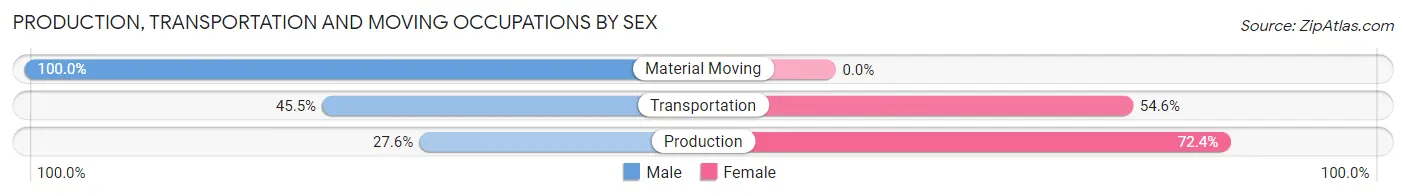
| Occupation | Male | Female |
| Production | 21 (27.6%) | 55 (72.4%) |
| Transportation | 15 (45.5%) | 18 (54.5%) |
| Material Moving | 7 (100.0%) | 0 (0.0%) |
| Total (Category) | 43 (37.1%) | 73 (62.9%) |
| Total (Overall) | 172 (39.0%) | 269 (61.0%) |
Employment Industries by Sex in Mountain Road
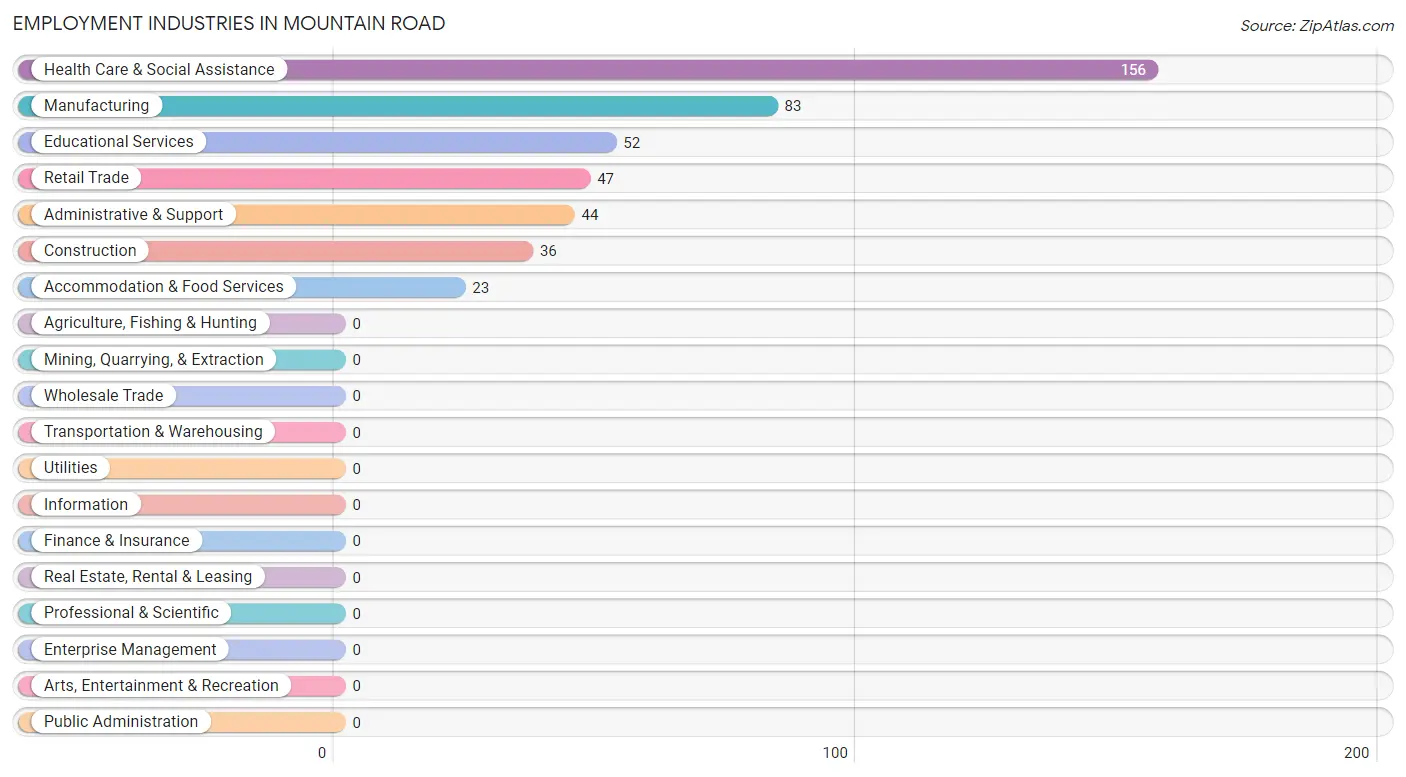
Employment Industries in Mountain Road
The major employment industries in Mountain Road include Health Care & Social Assistance (156 | 35.4%), Manufacturing (83 | 18.8%), Educational Services (52 | 11.8%), Retail Trade (47 | 10.7%), and Administrative & Support (44 | 10.0%).
Employment Industries by Sex in Mountain Road
The Mountain Road industries that see more men than women are Construction (100.0%), Administrative & Support (100.0%), and Retail Trade (76.6%), whereas the industries that tend to have a higher number of women are Health Care & Social Assistance (100.0%), Accommodation & Food Services (100.0%), and Manufacturing (66.3%).
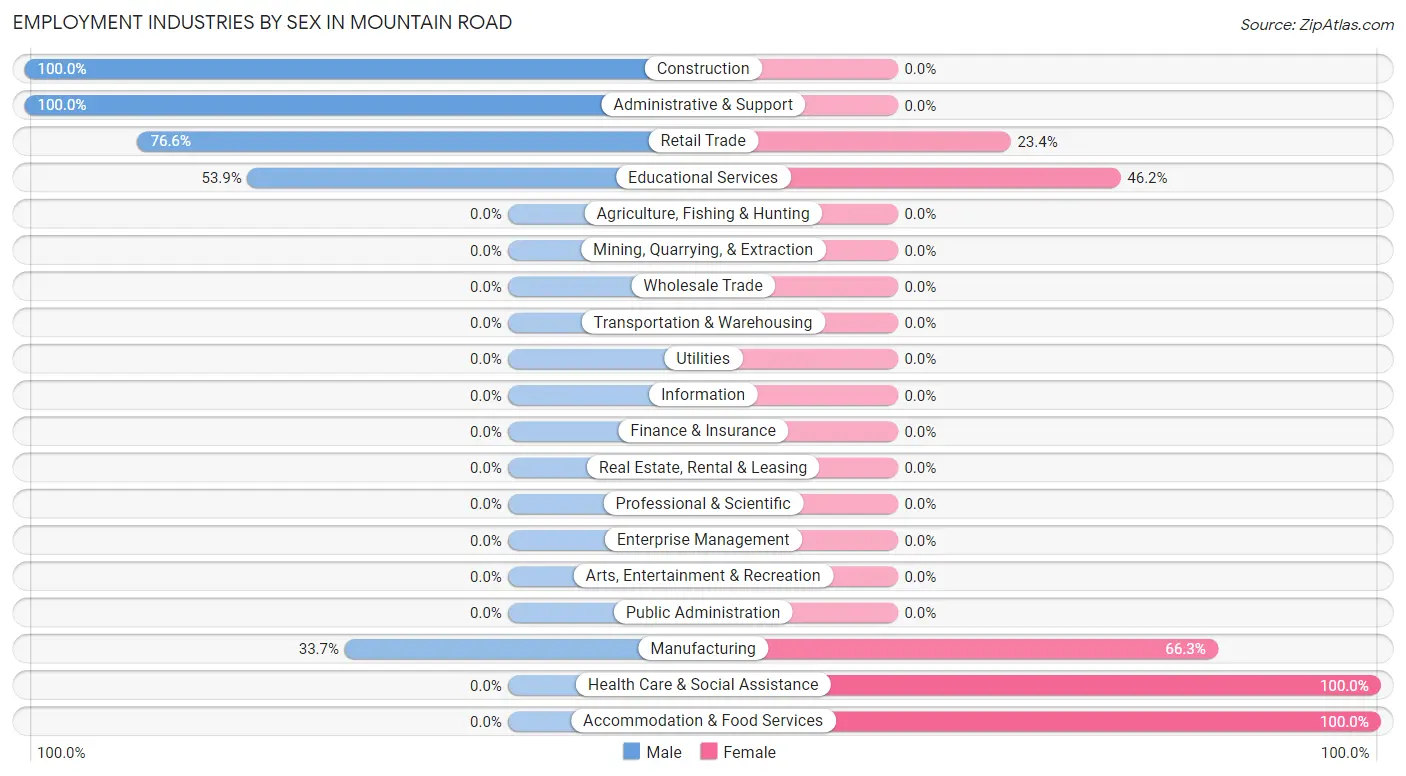
| Industry | Male | Female |
| Agriculture, Fishing & Hunting | 0 (0.0%) | 0 (0.0%) |
| Mining, Quarrying, & Extraction | 0 (0.0%) | 0 (0.0%) |
| Construction | 36 (100.0%) | 0 (0.0%) |
| Manufacturing | 28 (33.7%) | 55 (66.3%) |
| Wholesale Trade | 0 (0.0%) | 0 (0.0%) |
| Retail Trade | 36 (76.6%) | 11 (23.4%) |
| Transportation & Warehousing | 0 (0.0%) | 0 (0.0%) |
| Utilities | 0 (0.0%) | 0 (0.0%) |
| Information | 0 (0.0%) | 0 (0.0%) |
| Finance & Insurance | 0 (0.0%) | 0 (0.0%) |
| Real Estate, Rental & Leasing | 0 (0.0%) | 0 (0.0%) |
| Professional & Scientific | 0 (0.0%) | 0 (0.0%) |
| Enterprise Management | 0 (0.0%) | 0 (0.0%) |
| Administrative & Support | 44 (100.0%) | 0 (0.0%) |
| Educational Services | 28 (53.8%) | 24 (46.2%) |
| Health Care & Social Assistance | 0 (0.0%) | 156 (100.0%) |
| Arts, Entertainment & Recreation | 0 (0.0%) | 0 (0.0%) |
| Accommodation & Food Services | 0 (0.0%) | 23 (100.0%) |
| Public Administration | 0 (0.0%) | 0 (0.0%) |
| Total | 172 (39.0%) | 269 (61.0%) |
Education in Mountain Road
School Enrollment in Mountain Road
The most common levels of schooling among the 256 students in Mountain Road are middle school (135 | 52.7%), elementary school (45 | 17.6%), and high school (40 | 15.6%).
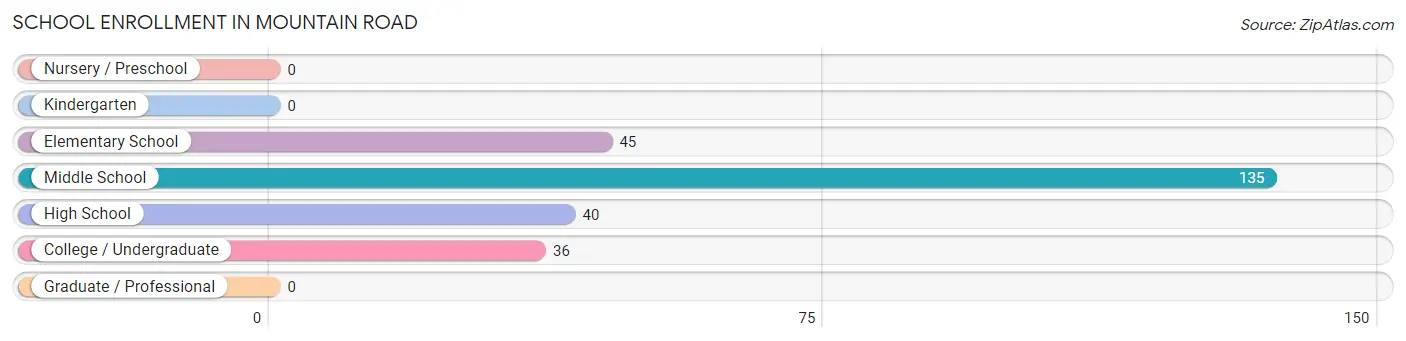
| School Level | # Students | % Students |
| Nursery / Preschool | 0 | 0.0% |
| Kindergarten | 0 | 0.0% |
| Elementary School | 45 | 17.6% |
| Middle School | 135 | 52.7% |
| High School | 40 | 15.6% |
| College / Undergraduate | 36 | 14.1% |
| Graduate / Professional | 0 | 0.0% |
| Total | 256 | 100.0% |
School Enrollment by Age by Funding Source in Mountain Road
Out of a total of 256 students who are enrolled in schools in Mountain Road, 56 (21.9%) attend a private institution, while the remaining 200 (78.1%) are enrolled in public schools. The age group of 18 to 19 year olds has the highest likelihood of being enrolled in private schools, with 36 (100.0% in the age bracket) enrolled. Conversely, the age group of 5 to 9 year old has the lowest likelihood of being enrolled in a private school, with 45 (100.0% in the age bracket) attending a public institution.
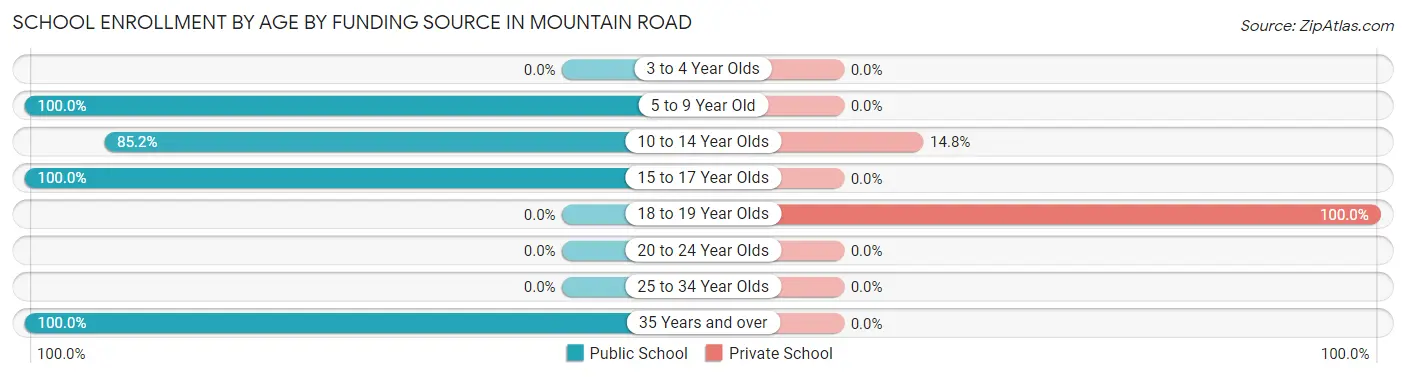
| Age Bracket | Public School | Private School |
| 3 to 4 Year Olds | 0 (0.0%) | 0 (0.0%) |
| 5 to 9 Year Old | 45 (100.0%) | 0 (0.0%) |
| 10 to 14 Year Olds | 115 (85.2%) | 20 (14.8%) |
| 15 to 17 Year Olds | 20 (100.0%) | 0 (0.0%) |
| 18 to 19 Year Olds | 0 (0.0%) | 36 (100.0%) |
| 20 to 24 Year Olds | 0 (0.0%) | 0 (0.0%) |
| 25 to 34 Year Olds | 0 (0.0%) | 0 (0.0%) |
| 35 Years and over | 20 (100.0%) | 0 (0.0%) |
| Total | 200 (78.1%) | 56 (21.9%) |
Educational Attainment by Field of Study in Mountain Road
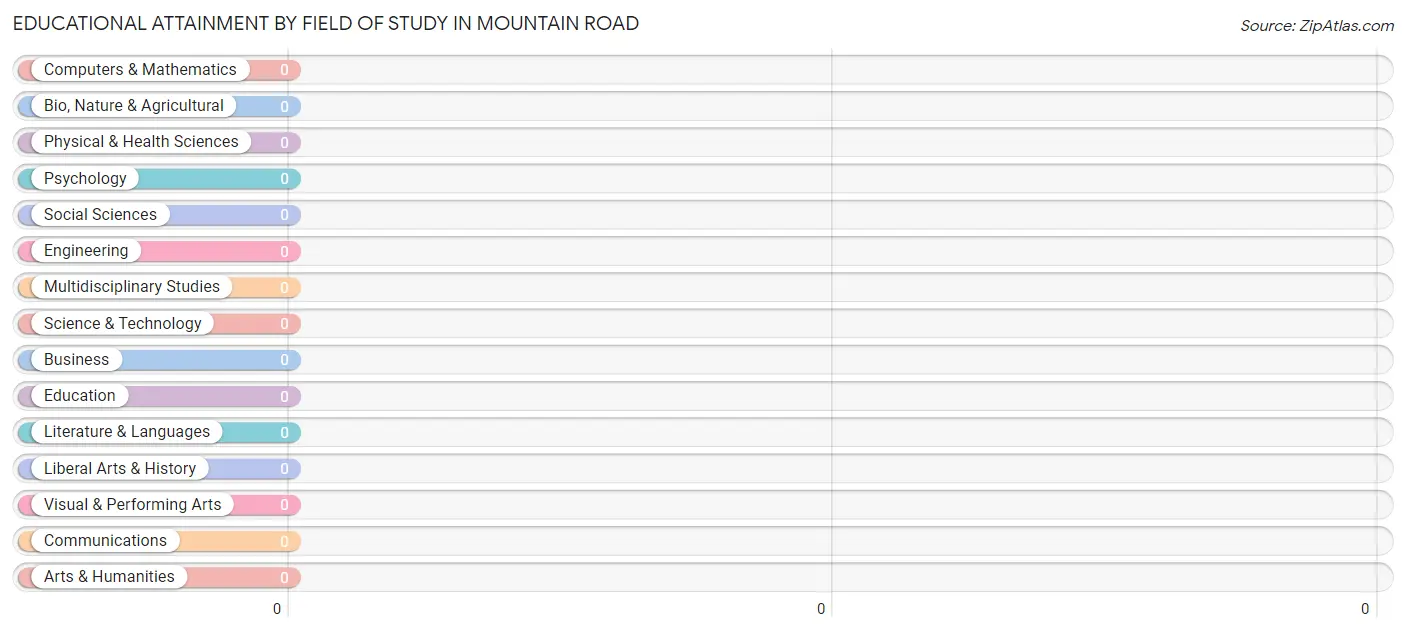
| Field of Study | # Graduates | % Graduates |
| Computers & Mathematics | 0 | 0.0% |
| Bio, Nature & Agricultural | 0 | 0.0% |
| Physical & Health Sciences | 0 | 0.0% |
| Psychology | 0 | 0.0% |
| Social Sciences | 0 | 0.0% |
| Engineering | 0 | 0.0% |
| Multidisciplinary Studies | 0 | 0.0% |
| Science & Technology | 0 | 0.0% |
| Business | 0 | 0.0% |
| Education | 0 | 0.0% |
| Literature & Languages | 0 | 0.0% |
| Liberal Arts & History | 0 | 0.0% |
| Visual & Performing Arts | 0 | 0.0% |
| Communications | 0 | 0.0% |
| Arts & Humanities | 0 | 0.0% |
| Total | 0 | 0.0% |
Transportation & Commute in Mountain Road
Vehicle Availability by Sex in Mountain Road
The most prevalent vehicle ownership categories in Mountain Road are males with 2 vehicles (81, accounting for 47.1%) and females with 2 vehicles (63, making up 32.3%).
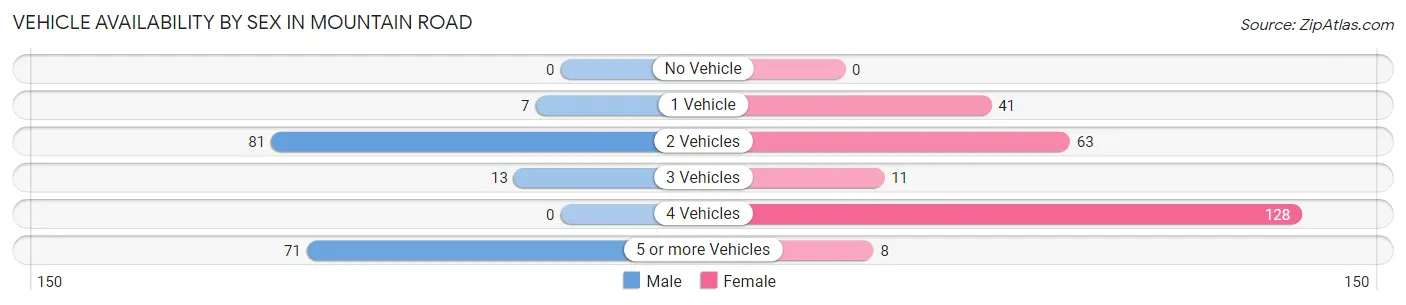
| Vehicles Available | Male | Female |
| No Vehicle | 0 (0.0%) | 0 (0.0%) |
| 1 Vehicle | 7 (4.1%) | 41 (16.3%) |
| 2 Vehicles | 81 (47.1%) | 63 (25.1%) |
| 3 Vehicles | 13 (7.6%) | 11 (4.4%) |
| 4 Vehicles | 0 (0.0%) | 128 (51.0%) |
| 5 or more Vehicles | 71 (41.3%) | 8 (3.2%) |
| Total | 172 (100.0%) | 251 (100.0%) |
Commute Time in Mountain Road
The most frequently occuring commute durations in Mountain Road are 10 to 14 minutes (196 commuters, 49.6%), 45 to 59 minutes (62 commuters, 15.7%), and 20 to 24 minutes (53 commuters, 13.4%).
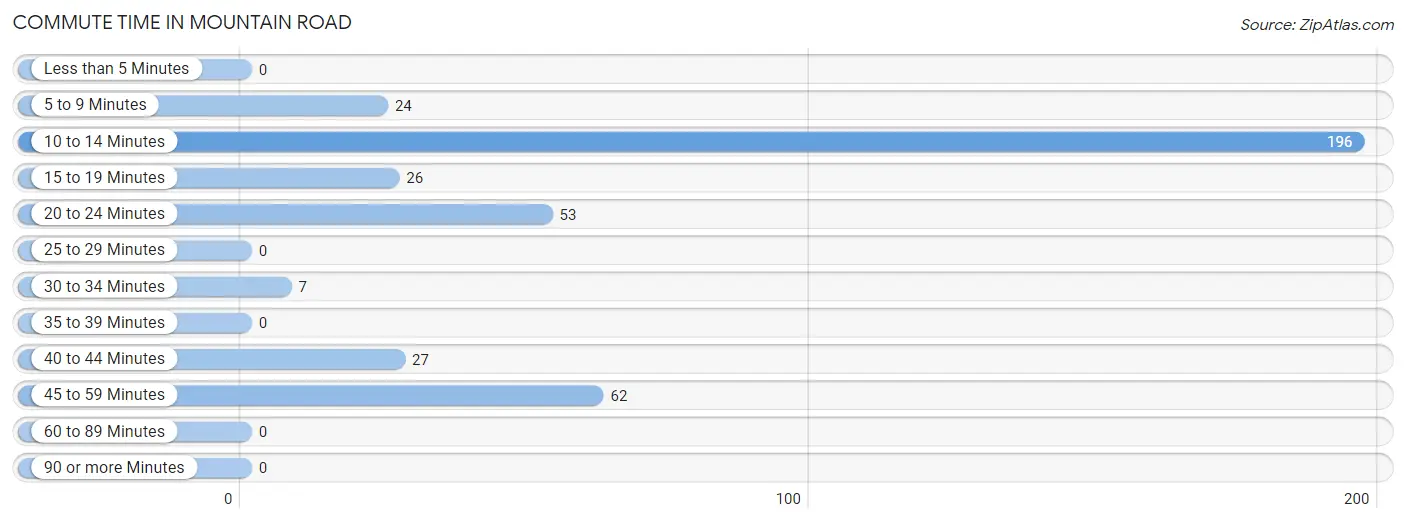
| Commute Time | # Commuters | % Commuters |
| Less than 5 Minutes | 0 | 0.0% |
| 5 to 9 Minutes | 24 | 6.1% |
| 10 to 14 Minutes | 196 | 49.6% |
| 15 to 19 Minutes | 26 | 6.6% |
| 20 to 24 Minutes | 53 | 13.4% |
| 25 to 29 Minutes | 0 | 0.0% |
| 30 to 34 Minutes | 7 | 1.8% |
| 35 to 39 Minutes | 0 | 0.0% |
| 40 to 44 Minutes | 27 | 6.8% |
| 45 to 59 Minutes | 62 | 15.7% |
| 60 to 89 Minutes | 0 | 0.0% |
| 90 or more Minutes | 0 | 0.0% |
Commute Time by Sex in Mountain Road
The most common commute times in Mountain Road are 10 to 14 minutes (65 commuters, 45.1%) for males and 10 to 14 minutes (131 commuters, 52.2%) for females.
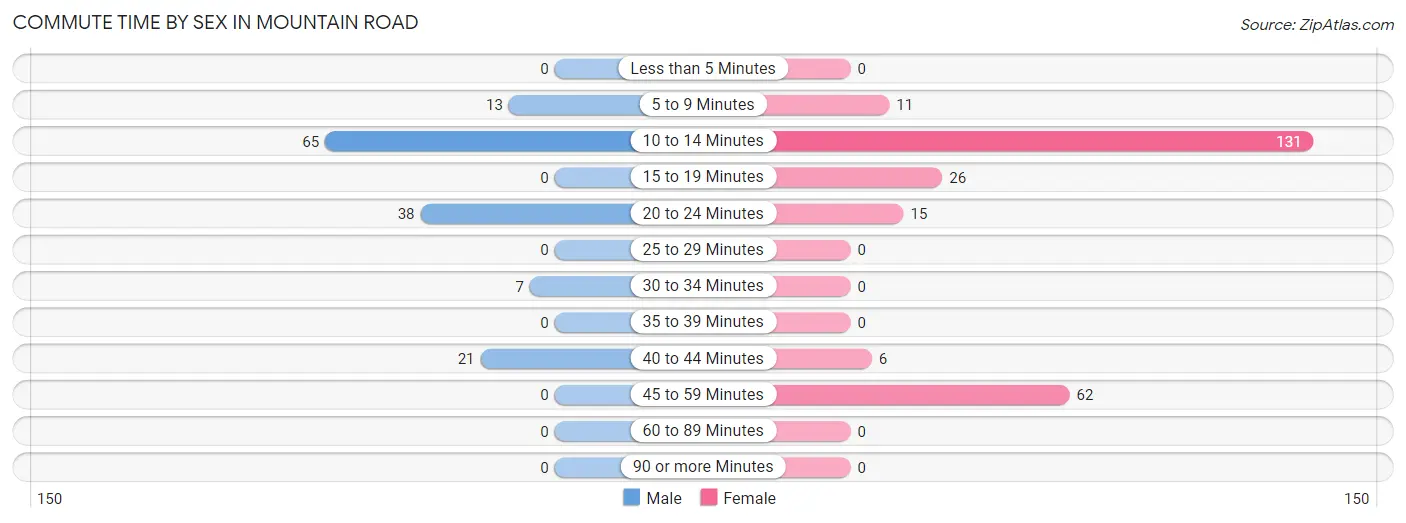
| Commute Time | Male | Female |
| Less than 5 Minutes | 0 (0.0%) | 0 (0.0%) |
| 5 to 9 Minutes | 13 (9.0%) | 11 (4.4%) |
| 10 to 14 Minutes | 65 (45.1%) | 131 (52.2%) |
| 15 to 19 Minutes | 0 (0.0%) | 26 (10.4%) |
| 20 to 24 Minutes | 38 (26.4%) | 15 (6.0%) |
| 25 to 29 Minutes | 0 (0.0%) | 0 (0.0%) |
| 30 to 34 Minutes | 7 (4.9%) | 0 (0.0%) |
| 35 to 39 Minutes | 0 (0.0%) | 0 (0.0%) |
| 40 to 44 Minutes | 21 (14.6%) | 6 (2.4%) |
| 45 to 59 Minutes | 0 (0.0%) | 62 (24.7%) |
| 60 to 89 Minutes | 0 (0.0%) | 0 (0.0%) |
| 90 or more Minutes | 0 (0.0%) | 0 (0.0%) |
Time of Departure to Work by Sex in Mountain Road
The most frequent times of departure to work in Mountain Road are 4:00 PM to 11:59 PM (51, 35.4%) for males and 8:30 AM to 8:59 AM (84, 33.5%) for females.
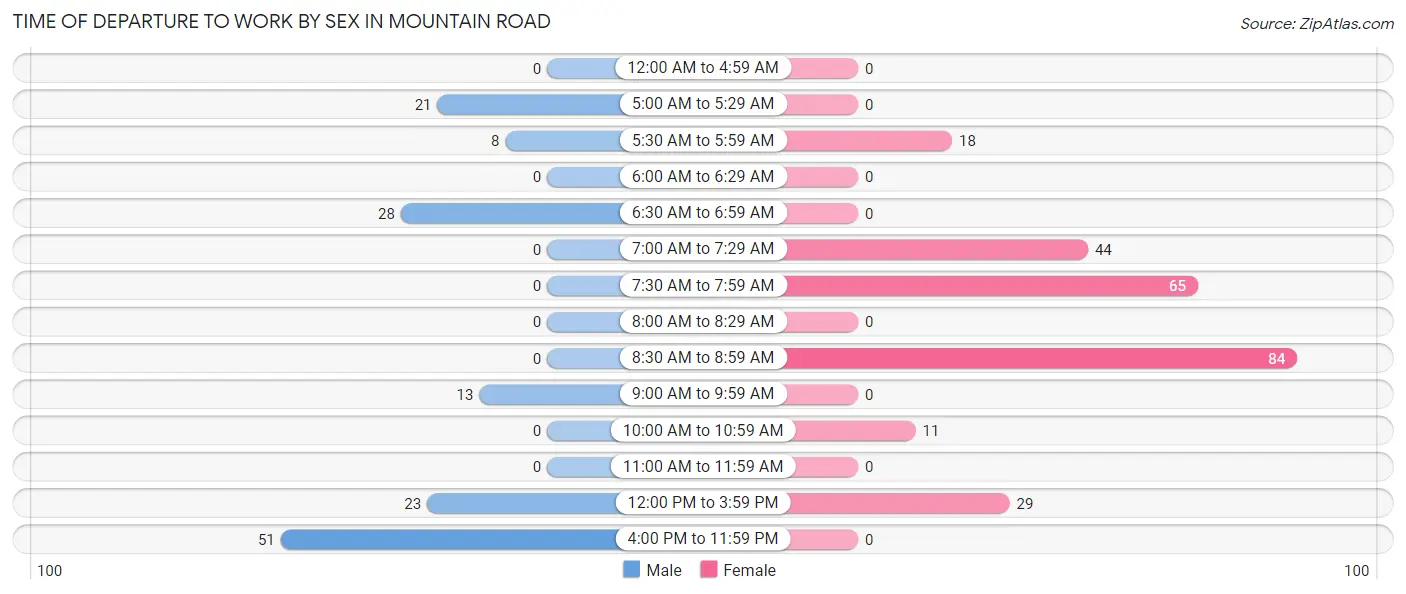
| Time of Departure | Male | Female |
| 12:00 AM to 4:59 AM | 0 (0.0%) | 0 (0.0%) |
| 5:00 AM to 5:29 AM | 21 (14.6%) | 0 (0.0%) |
| 5:30 AM to 5:59 AM | 8 (5.6%) | 18 (7.2%) |
| 6:00 AM to 6:29 AM | 0 (0.0%) | 0 (0.0%) |
| 6:30 AM to 6:59 AM | 28 (19.4%) | 0 (0.0%) |
| 7:00 AM to 7:29 AM | 0 (0.0%) | 44 (17.5%) |
| 7:30 AM to 7:59 AM | 0 (0.0%) | 65 (25.9%) |
| 8:00 AM to 8:29 AM | 0 (0.0%) | 0 (0.0%) |
| 8:30 AM to 8:59 AM | 0 (0.0%) | 84 (33.5%) |
| 9:00 AM to 9:59 AM | 13 (9.0%) | 0 (0.0%) |
| 10:00 AM to 10:59 AM | 0 (0.0%) | 11 (4.4%) |
| 11:00 AM to 11:59 AM | 0 (0.0%) | 0 (0.0%) |
| 12:00 PM to 3:59 PM | 23 (16.0%) | 29 (11.6%) |
| 4:00 PM to 11:59 PM | 51 (35.4%) | 0 (0.0%) |
| Total | 144 (100.0%) | 251 (100.0%) |
Housing Occupancy in Mountain Road
Occupancy by Ownership in Mountain Road
Of the total 386 dwellings in Mountain Road, owner-occupied units account for 335 (86.8%), while renter-occupied units make up 51 (13.2%).
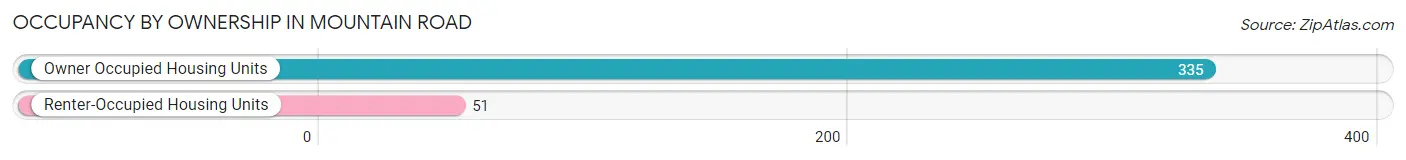
| Occupancy | # Housing Units | % Housing Units |
| Owner Occupied Housing Units | 335 | 86.8% |
| Renter-Occupied Housing Units | 51 | 13.2% |
| Total Occupied Housing Units | 386 | 100.0% |
Occupancy by Household Size in Mountain Road
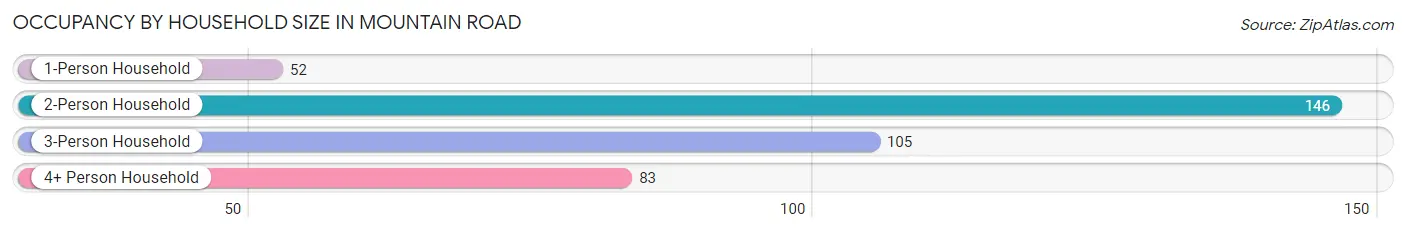
| Household Size | # Housing Units | % Housing Units |
| 1-Person Household | 52 | 13.5% |
| 2-Person Household | 146 | 37.8% |
| 3-Person Household | 105 | 27.2% |
| 4+ Person Household | 83 | 21.5% |
| Total Housing Units | 386 | 100.0% |
Occupancy by Ownership by Household Size in Mountain Road
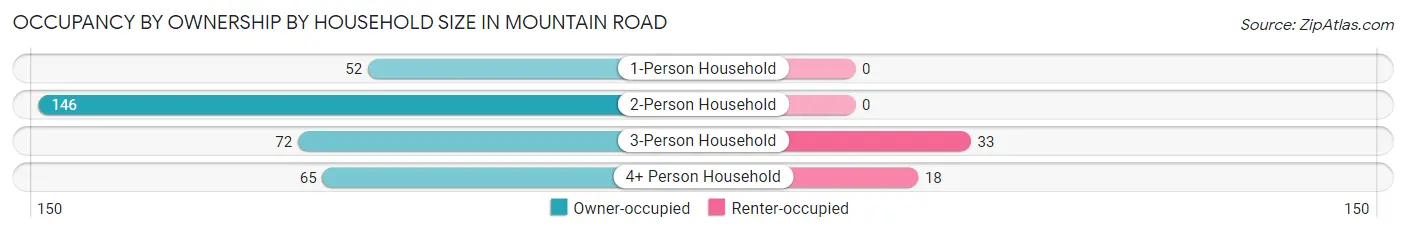
| Household Size | Owner-occupied | Renter-occupied |
| 1-Person Household | 52 (100.0%) | 0 (0.0%) |
| 2-Person Household | 146 (100.0%) | 0 (0.0%) |
| 3-Person Household | 72 (68.6%) | 33 (31.4%) |
| 4+ Person Household | 65 (78.3%) | 18 (21.7%) |
| Total Housing Units | 335 (86.8%) | 51 (13.2%) |
Occupancy by Educational Attainment in Mountain Road
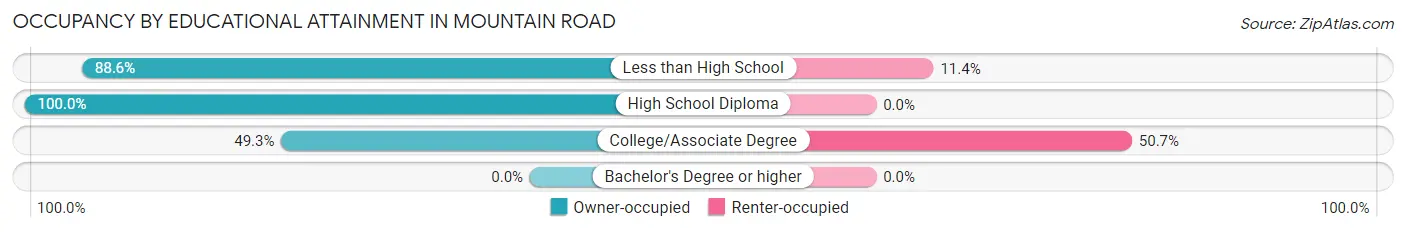
| Household Size | Owner-occupied | Renter-occupied |
| Less than High School | 117 (88.6%) | 15 (11.4%) |
| High School Diploma | 183 (100.0%) | 0 (0.0%) |
| College/Associate Degree | 35 (49.3%) | 36 (50.7%) |
| Bachelor's Degree or higher | 0 (0.0%) | 0 (0.0%) |
Occupancy by Age of Householder in Mountain Road
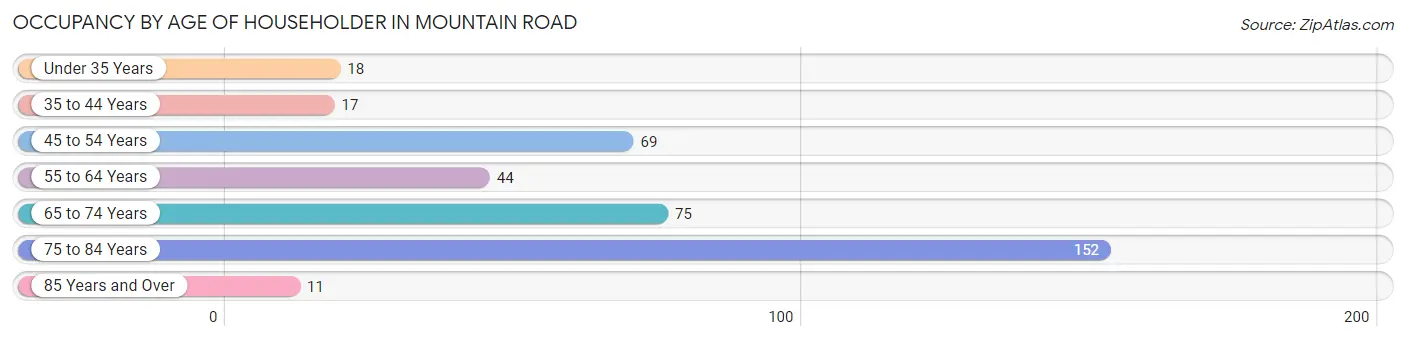
| Age Bracket | # Households | % Households |
| Under 35 Years | 18 | 4.7% |
| 35 to 44 Years | 17 | 4.4% |
| 45 to 54 Years | 69 | 17.9% |
| 55 to 64 Years | 44 | 11.4% |
| 65 to 74 Years | 75 | 19.4% |
| 75 to 84 Years | 152 | 39.4% |
| 85 Years and Over | 11 | 2.9% |
| Total | 386 | 100.0% |
Housing Finances in Mountain Road
Median Income by Occupancy in Mountain Road
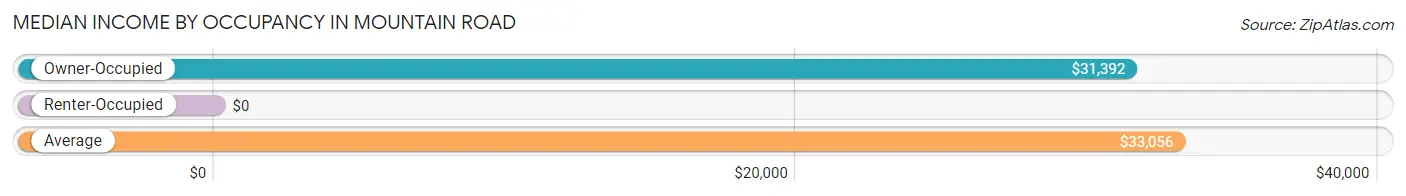
| Occupancy Type | # Households | Median Income |
| Owner-Occupied | 335 (86.8%) | $31,392 |
| Renter-Occupied | 51 (13.2%) | $0 |
| Average | 386 (100.0%) | $33,056 |
Occupancy by Householder Income Bracket in Mountain Road
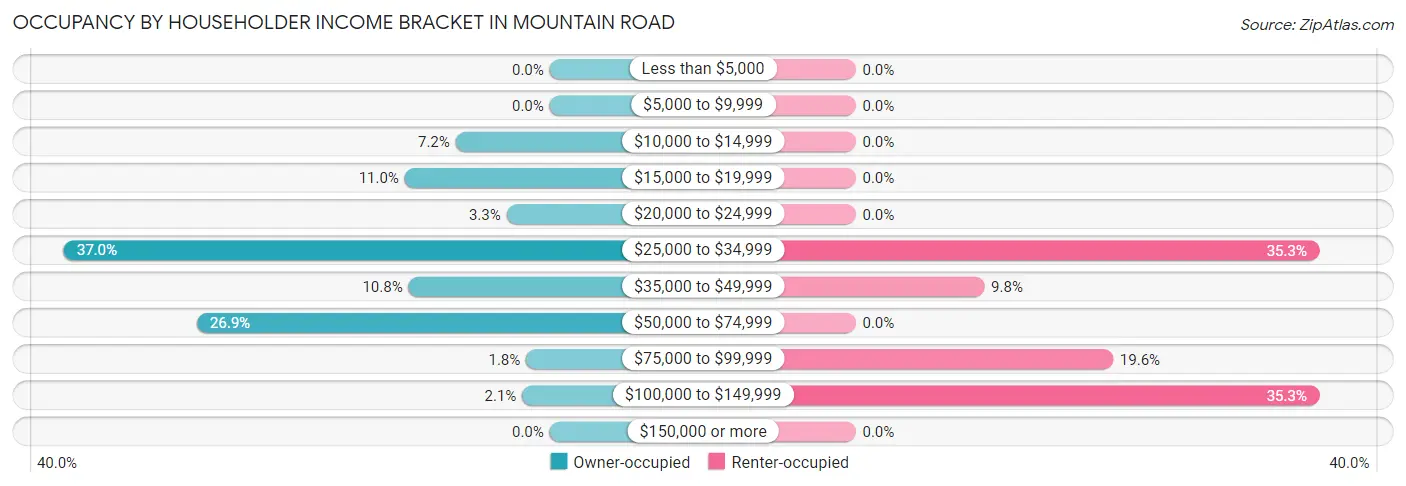
| Income Bracket | Owner-occupied | Renter-occupied |
| Less than $5,000 | 0 (0.0%) | 0 (0.0%) |
| $5,000 to $9,999 | 0 (0.0%) | 0 (0.0%) |
| $10,000 to $14,999 | 24 (7.2%) | 0 (0.0%) |
| $15,000 to $19,999 | 37 (11.0%) | 0 (0.0%) |
| $20,000 to $24,999 | 11 (3.3%) | 0 (0.0%) |
| $25,000 to $34,999 | 124 (37.0%) | 18 (35.3%) |
| $35,000 to $49,999 | 36 (10.7%) | 5 (9.8%) |
| $50,000 to $74,999 | 90 (26.9%) | 0 (0.0%) |
| $75,000 to $99,999 | 6 (1.8%) | 10 (19.6%) |
| $100,000 to $149,999 | 7 (2.1%) | 18 (35.3%) |
| $150,000 or more | 0 (0.0%) | 0 (0.0%) |
| Total | 335 (100.0%) | 51 (100.0%) |
Monthly Housing Cost Tiers in Mountain Road
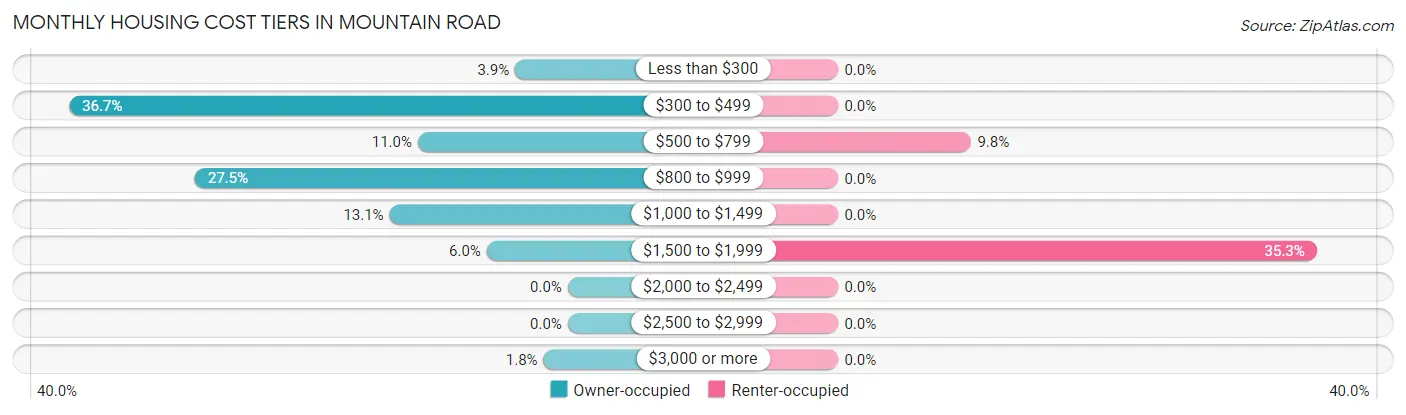
| Monthly Cost | Owner-occupied | Renter-occupied |
| Less than $300 | 13 (3.9%) | 0 (0.0%) |
| $300 to $499 | 123 (36.7%) | 0 (0.0%) |
| $500 to $799 | 37 (11.0%) | 5 (9.8%) |
| $800 to $999 | 92 (27.5%) | 0 (0.0%) |
| $1,000 to $1,499 | 44 (13.1%) | 0 (0.0%) |
| $1,500 to $1,999 | 20 (6.0%) | 18 (35.3%) |
| $2,000 to $2,499 | 0 (0.0%) | 0 (0.0%) |
| $2,500 to $2,999 | 0 (0.0%) | 0 (0.0%) |
| $3,000 or more | 6 (1.8%) | 0 (0.0%) |
| Total | 335 (100.0%) | 51 (100.0%) |
Physical Housing Characteristics in Mountain Road
Housing Structures in Mountain Road
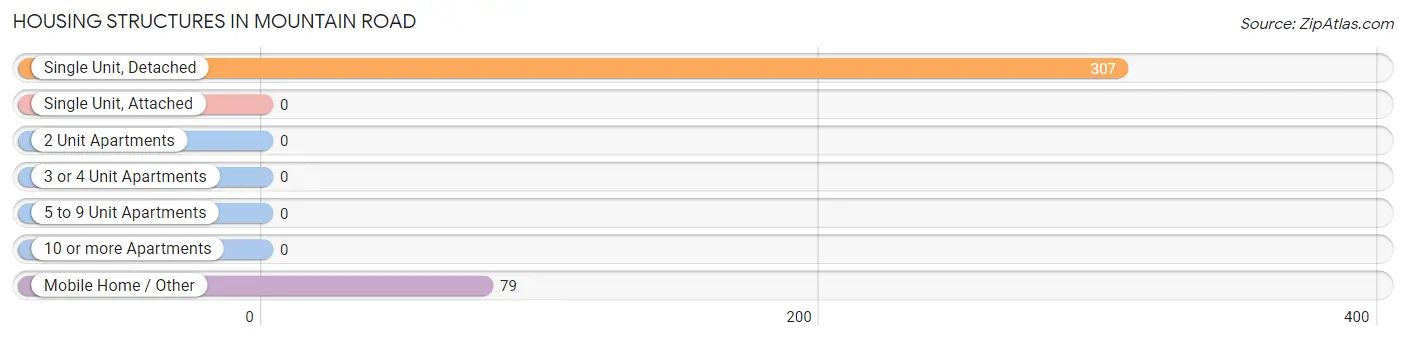
| Structure Type | # Housing Units | % Housing Units |
| Single Unit, Detached | 307 | 79.5% |
| Single Unit, Attached | 0 | 0.0% |
| 2 Unit Apartments | 0 | 0.0% |
| 3 or 4 Unit Apartments | 0 | 0.0% |
| 5 to 9 Unit Apartments | 0 | 0.0% |
| 10 or more Apartments | 0 | 0.0% |
| Mobile Home / Other | 79 | 20.5% |
| Total | 386 | 100.0% |
Housing Structures by Occupancy in Mountain Road
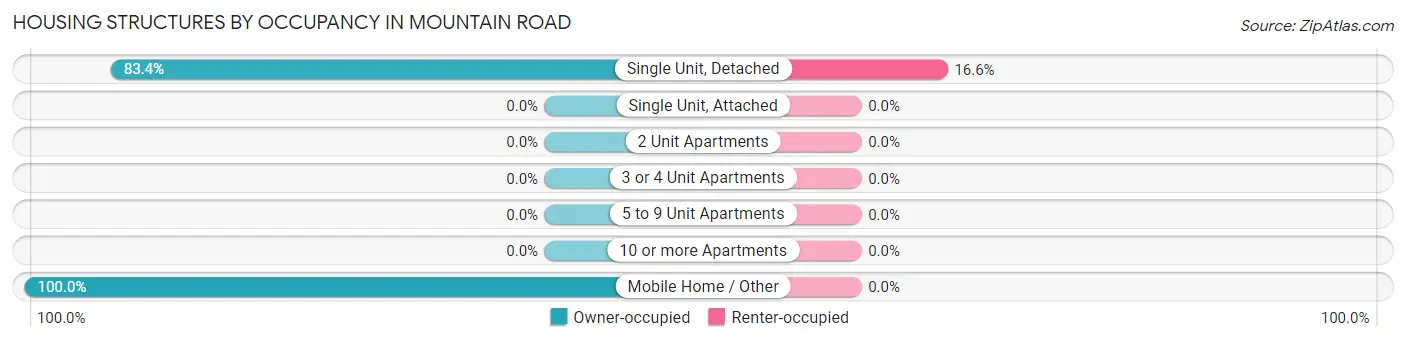
| Structure Type | Owner-occupied | Renter-occupied |
| Single Unit, Detached | 256 (83.4%) | 51 (16.6%) |
| Single Unit, Attached | 0 (0.0%) | 0 (0.0%) |
| 2 Unit Apartments | 0 (0.0%) | 0 (0.0%) |
| 3 or 4 Unit Apartments | 0 (0.0%) | 0 (0.0%) |
| 5 to 9 Unit Apartments | 0 (0.0%) | 0 (0.0%) |
| 10 or more Apartments | 0 (0.0%) | 0 (0.0%) |
| Mobile Home / Other | 79 (100.0%) | 0 (0.0%) |
| Total | 335 (86.8%) | 51 (13.2%) |
Housing Structures by Number of Rooms in Mountain Road
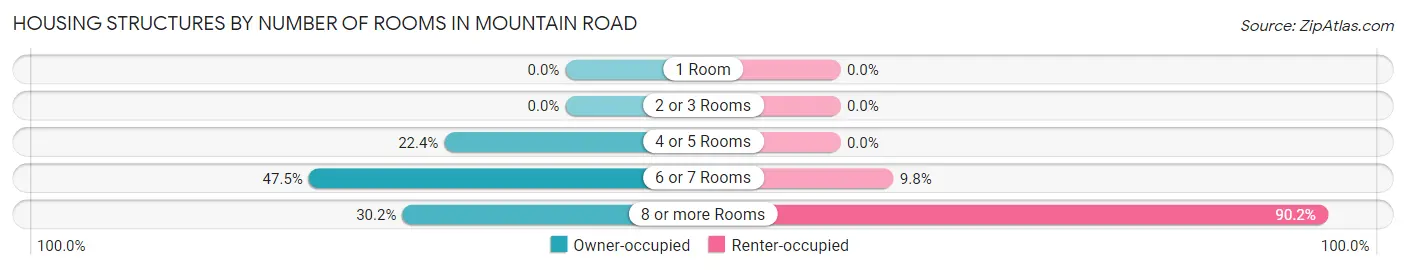
| Number of Rooms | Owner-occupied | Renter-occupied |
| 1 Room | 0 (0.0%) | 0 (0.0%) |
| 2 or 3 Rooms | 0 (0.0%) | 0 (0.0%) |
| 4 or 5 Rooms | 75 (22.4%) | 0 (0.0%) |
| 6 or 7 Rooms | 159 (47.5%) | 5 (9.8%) |
| 8 or more Rooms | 101 (30.1%) | 46 (90.2%) |
| Total | 335 (100.0%) | 51 (100.0%) |
Housing Structure by Heating Type in Mountain Road
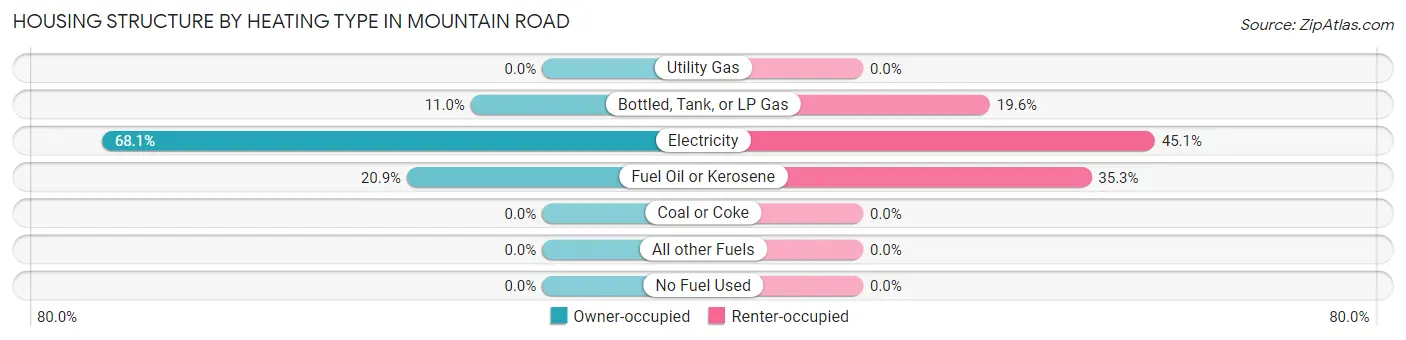
| Heating Type | Owner-occupied | Renter-occupied |
| Utility Gas | 0 (0.0%) | 0 (0.0%) |
| Bottled, Tank, or LP Gas | 37 (11.0%) | 10 (19.6%) |
| Electricity | 228 (68.1%) | 23 (45.1%) |
| Fuel Oil or Kerosene | 70 (20.9%) | 18 (35.3%) |
| Coal or Coke | 0 (0.0%) | 0 (0.0%) |
| All other Fuels | 0 (0.0%) | 0 (0.0%) |
| No Fuel Used | 0 (0.0%) | 0 (0.0%) |
| Total | 335 (100.0%) | 51 (100.0%) |
Household Vehicle Usage in Mountain Road
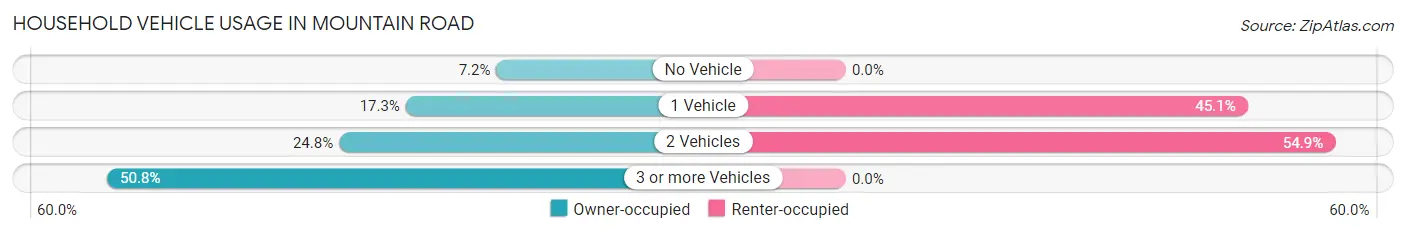
| Vehicles per Household | Owner-occupied | Renter-occupied |
| No Vehicle | 24 (7.2%) | 0 (0.0%) |
| 1 Vehicle | 58 (17.3%) | 23 (45.1%) |
| 2 Vehicles | 83 (24.8%) | 28 (54.9%) |
| 3 or more Vehicles | 170 (50.7%) | 0 (0.0%) |
| Total | 335 (100.0%) | 51 (100.0%) |
Real Estate & Mortgages in Mountain Road
Real Estate and Mortgage Overview in Mountain Road
| Characteristic | Without Mortgage | With Mortgage |
| Housing Units | 147 | 188 |
| Median Property Value | $209,200 | $126,100 |
| Median Household Income | - | - |
| Monthly Housing Costs | $417 | $6 |
| Real Estate Taxes | $857 | $0 |
Property Value by Mortgage Status in Mountain Road
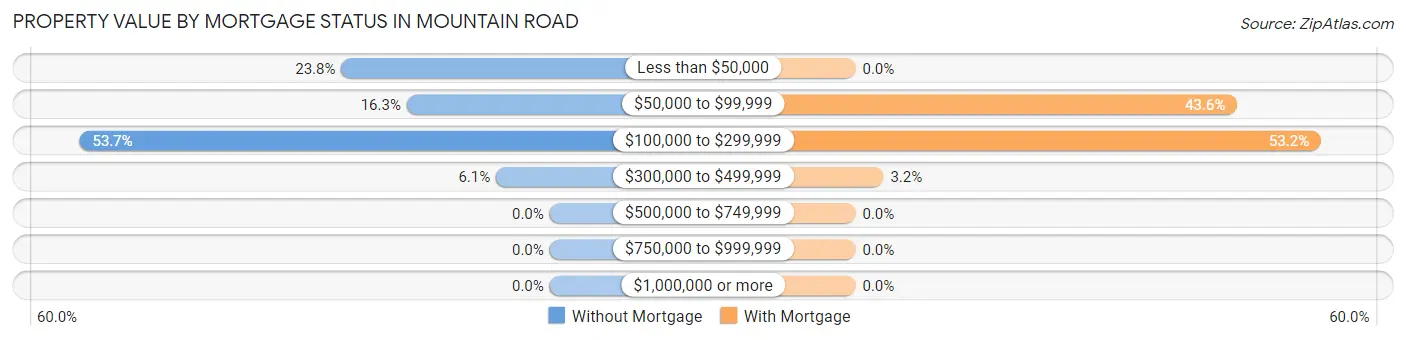
| Property Value | Without Mortgage | With Mortgage |
| Less than $50,000 | 35 (23.8%) | 0 (0.0%) |
| $50,000 to $99,999 | 24 (16.3%) | 82 (43.6%) |
| $100,000 to $299,999 | 79 (53.7%) | 100 (53.2%) |
| $300,000 to $499,999 | 9 (6.1%) | 6 (3.2%) |
| $500,000 to $749,999 | 0 (0.0%) | 0 (0.0%) |
| $750,000 to $999,999 | 0 (0.0%) | 0 (0.0%) |
| $1,000,000 or more | 0 (0.0%) | 0 (0.0%) |
| Total | 147 (100.0%) | 188 (100.0%) |
Household Income by Mortgage Status in Mountain Road
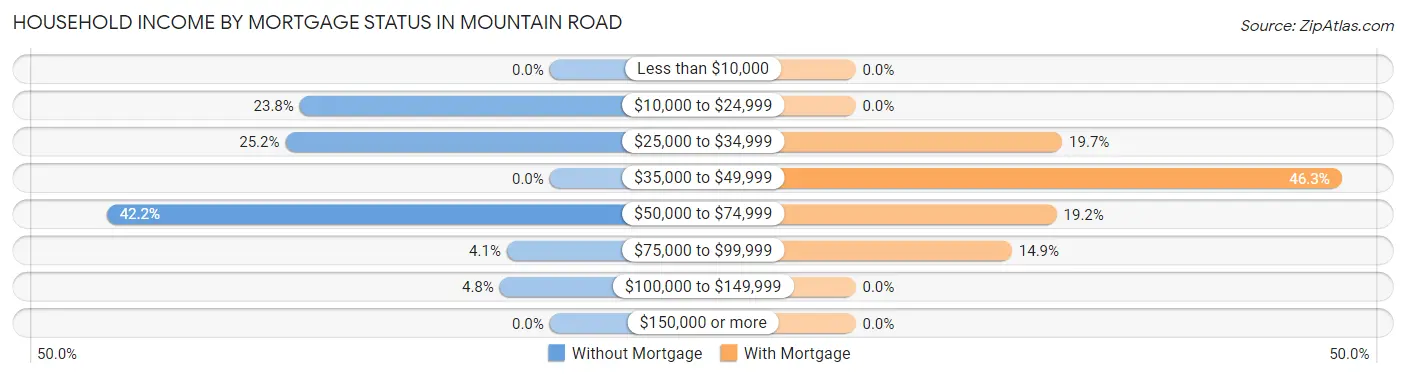
| Household Income | Without Mortgage | With Mortgage |
| Less than $10,000 | 0 (0.0%) | 0 (0.0%) |
| $10,000 to $24,999 | 35 (23.8%) | 0 (0.0%) |
| $25,000 to $34,999 | 37 (25.2%) | 37 (19.7%) |
| $35,000 to $49,999 | 0 (0.0%) | 87 (46.3%) |
| $50,000 to $74,999 | 62 (42.2%) | 36 (19.2%) |
| $75,000 to $99,999 | 6 (4.1%) | 28 (14.9%) |
| $100,000 to $149,999 | 7 (4.8%) | 0 (0.0%) |
| $150,000 or more | 0 (0.0%) | 0 (0.0%) |
| Total | 147 (100.0%) | 188 (100.0%) |
Property Value to Household Income Ratio in Mountain Road
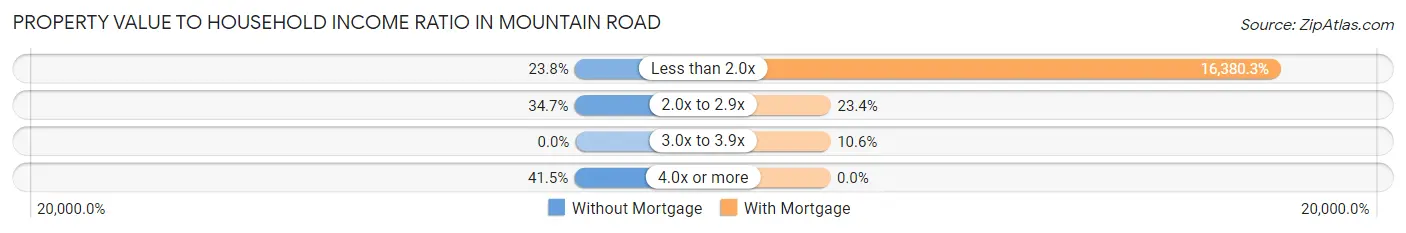
| Value-to-Income Ratio | Without Mortgage | With Mortgage |
| Less than 2.0x | 35 (23.8%) | 30,795 (16,380.3%) |
| 2.0x to 2.9x | 51 (34.7%) | 44 (23.4%) |
| 3.0x to 3.9x | 0 (0.0%) | 20 (10.6%) |
| 4.0x or more | 61 (41.5%) | 0 (0.0%) |
| Total | 147 (100.0%) | 188 (100.0%) |
Real Estate Taxes by Mortgage Status in Mountain Road
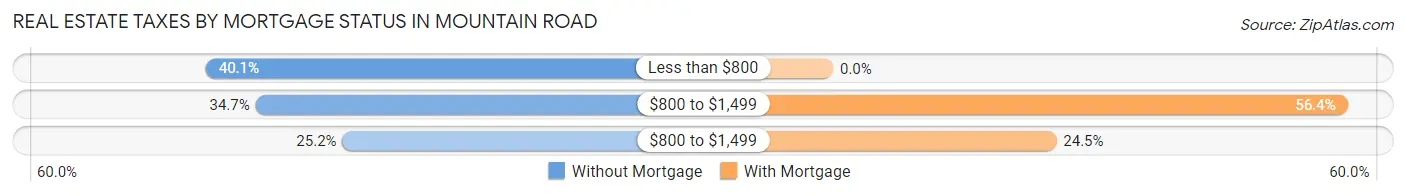
| Property Taxes | Without Mortgage | With Mortgage |
| Less than $800 | 59 (40.1%) | 0 (0.0%) |
| $800 to $1,499 | 51 (34.7%) | 106 (56.4%) |
| $800 to $1,499 | 37 (25.2%) | 46 (24.5%) |
| Total | 147 (100.0%) | 188 (100.0%) |
Health & Disability in Mountain Road
Health Insurance Coverage by Age in Mountain Road
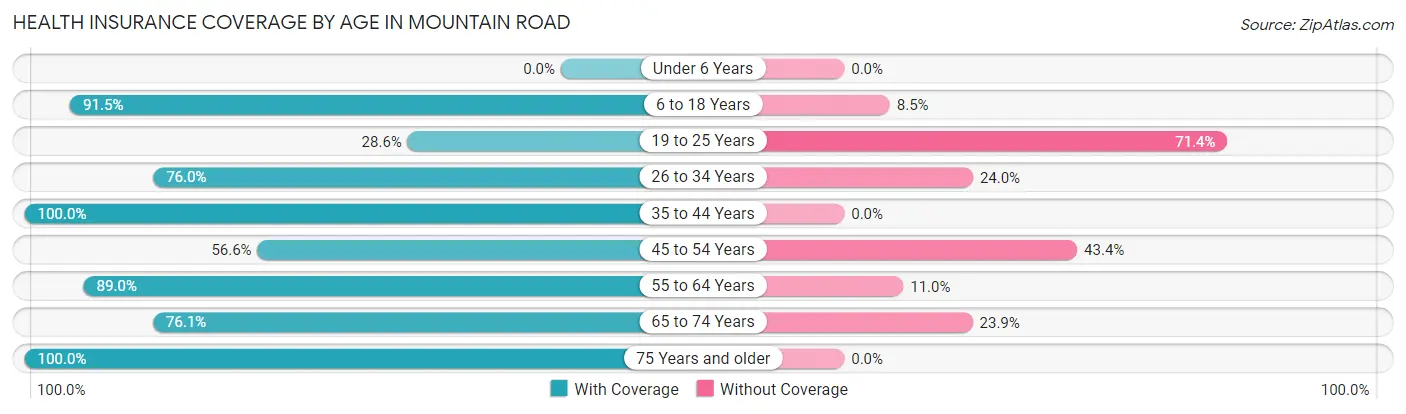
| Age Bracket | With Coverage | Without Coverage |
| Under 6 Years | 0 (0.0%) | 0 (0.0%) |
| 6 to 18 Years | 183 (91.5%) | 17 (8.5%) |
| 19 to 25 Years | 42 (28.6%) | 105 (71.4%) |
| 26 to 34 Years | 206 (76.0%) | 65 (24.0%) |
| 35 to 44 Years | 126 (100.0%) | 0 (0.0%) |
| 45 to 54 Years | 43 (56.6%) | 33 (43.4%) |
| 55 to 64 Years | 267 (89.0%) | 33 (11.0%) |
| 65 to 74 Years | 89 (76.1%) | 28 (23.9%) |
| 75 Years and older | 182 (100.0%) | 0 (0.0%) |
| Total | 1,138 (80.2%) | 281 (19.8%) |
Health Insurance Coverage by Citizenship Status in Mountain Road
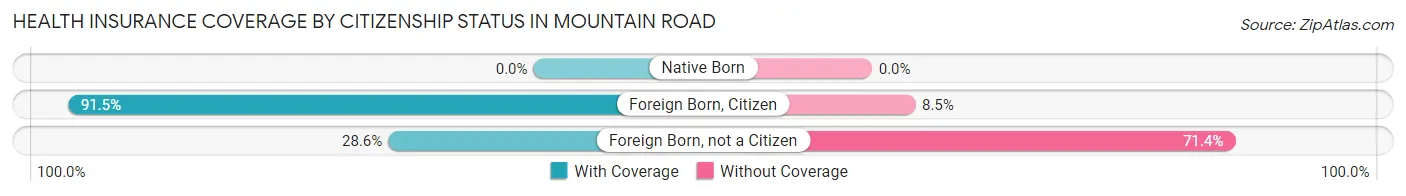
| Citizenship Status | With Coverage | Without Coverage |
| Native Born | 0 (0.0%) | 0 (0.0%) |
| Foreign Born, Citizen | 183 (91.5%) | 17 (8.5%) |
| Foreign Born, not a Citizen | 42 (28.6%) | 105 (71.4%) |
Health Insurance Coverage by Household Income in Mountain Road
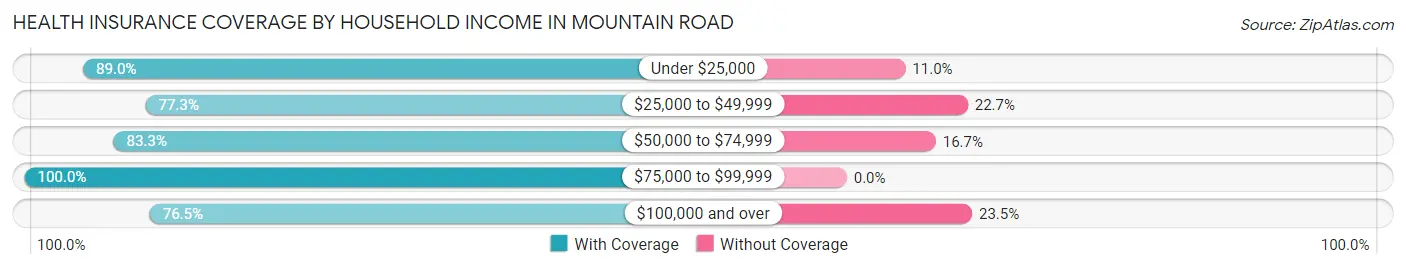
| Household Income | With Coverage | Without Coverage |
| Under $25,000 | 146 (89.0%) | 18 (11.0%) |
| $25,000 to $49,999 | 672 (77.3%) | 197 (22.7%) |
| $50,000 to $74,999 | 140 (83.3%) | 28 (16.7%) |
| $75,000 to $99,999 | 56 (100.0%) | 0 (0.0%) |
| $100,000 and over | 124 (76.5%) | 38 (23.5%) |
Public vs Private Health Insurance Coverage by Age in Mountain Road
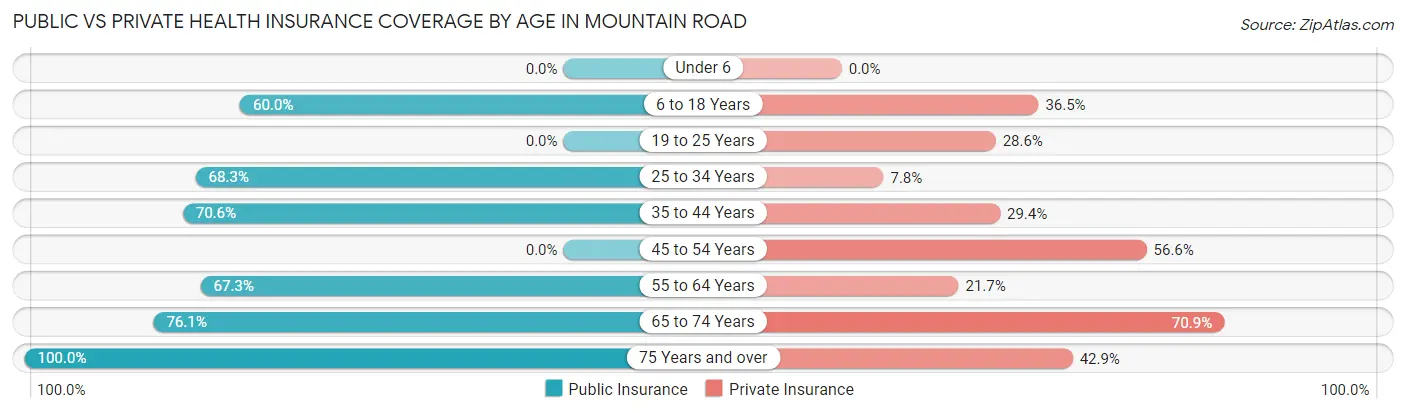
| Age Bracket | Public Insurance | Private Insurance |
| Under 6 | 0 (0.0%) | 0 (0.0%) |
| 6 to 18 Years | 120 (60.0%) | 73 (36.5%) |
| 19 to 25 Years | 0 (0.0%) | 42 (28.6%) |
| 25 to 34 Years | 185 (68.3%) | 21 (7.7%) |
| 35 to 44 Years | 89 (70.6%) | 37 (29.4%) |
| 45 to 54 Years | 0 (0.0%) | 43 (56.6%) |
| 55 to 64 Years | 202 (67.3%) | 65 (21.7%) |
| 65 to 74 Years | 89 (76.1%) | 83 (70.9%) |
| 75 Years and over | 182 (100.0%) | 78 (42.9%) |
| Total | 867 (61.1%) | 442 (31.1%) |
Disability Status by Sex by Age in Mountain Road
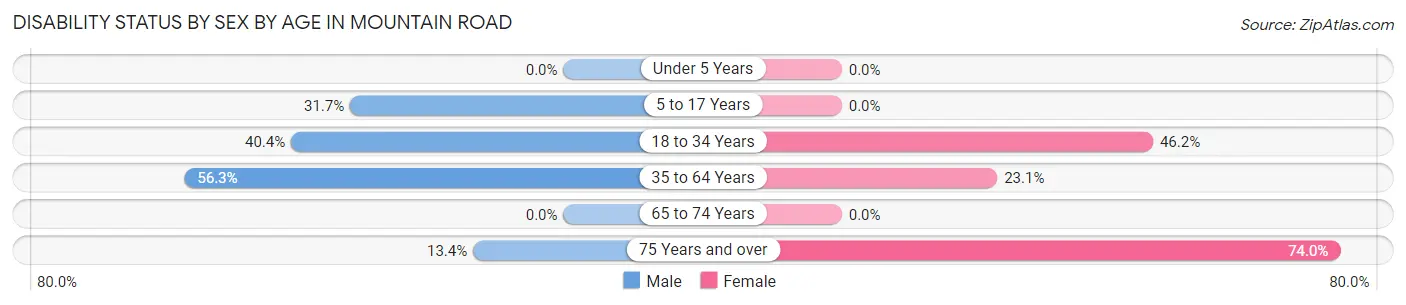
| Age Bracket | Male | Female |
| Under 5 Years | 0 (0.0%) | 0 (0.0%) |
| 5 to 17 Years | 19 (31.7%) | 0 (0.0%) |
| 18 to 34 Years | 57 (40.4%) | 128 (46.2%) |
| 35 to 64 Years | 202 (56.3%) | 33 (23.1%) |
| 65 to 74 Years | 0 (0.0%) | 0 (0.0%) |
| 75 Years and over | 11 (13.4%) | 74 (74.0%) |
Disability Class by Sex by Age in Mountain Road
Disability Class: Hearing Difficulty
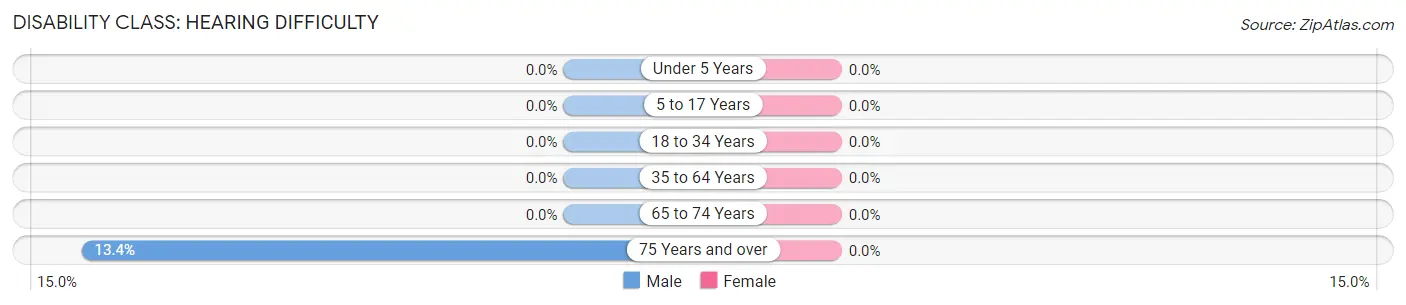
| Age Bracket | Male | Female |
| Under 5 Years | 0 (0.0%) | 0 (0.0%) |
| 5 to 17 Years | 0 (0.0%) | 0 (0.0%) |
| 18 to 34 Years | 0 (0.0%) | 0 (0.0%) |
| 35 to 64 Years | 0 (0.0%) | 0 (0.0%) |
| 65 to 74 Years | 0 (0.0%) | 0 (0.0%) |
| 75 Years and over | 11 (13.4%) | 0 (0.0%) |
Disability Class: Vision Difficulty
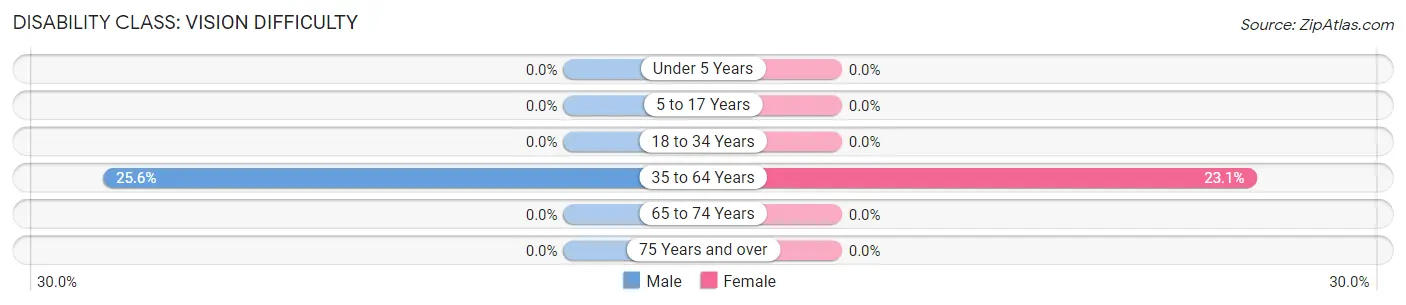
| Age Bracket | Male | Female |
| Under 5 Years | 0 (0.0%) | 0 (0.0%) |
| 5 to 17 Years | 0 (0.0%) | 0 (0.0%) |
| 18 to 34 Years | 0 (0.0%) | 0 (0.0%) |
| 35 to 64 Years | 92 (25.6%) | 33 (23.1%) |
| 65 to 74 Years | 0 (0.0%) | 0 (0.0%) |
| 75 Years and over | 0 (0.0%) | 0 (0.0%) |
Disability Class: Cognitive Difficulty
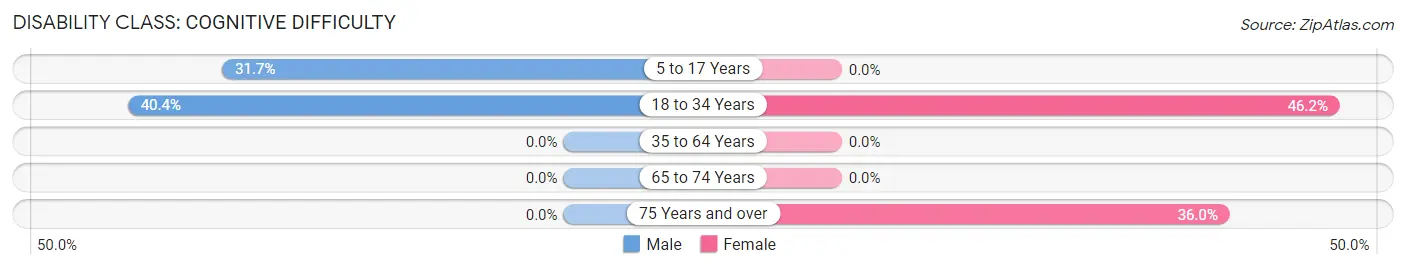
| Age Bracket | Male | Female |
| 5 to 17 Years | 19 (31.7%) | 0 (0.0%) |
| 18 to 34 Years | 57 (40.4%) | 128 (46.2%) |
| 35 to 64 Years | 0 (0.0%) | 0 (0.0%) |
| 65 to 74 Years | 0 (0.0%) | 0 (0.0%) |
| 75 Years and over | 0 (0.0%) | 36 (36.0%) |
Disability Class: Ambulatory Difficulty
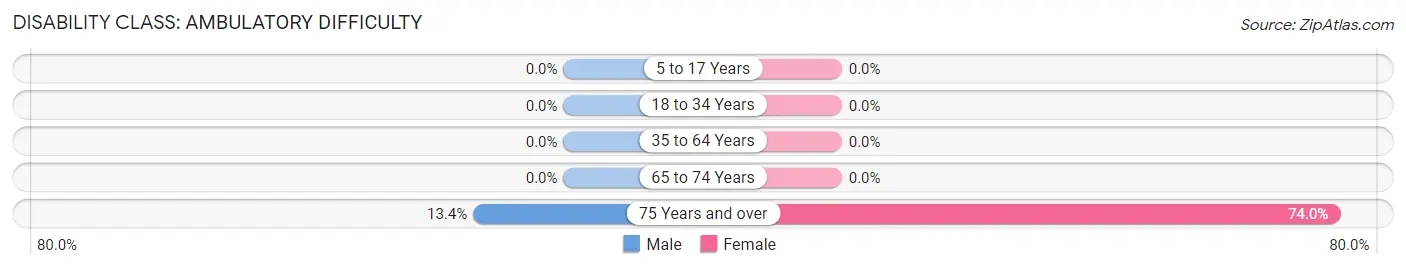
| Age Bracket | Male | Female |
| 5 to 17 Years | 0 (0.0%) | 0 (0.0%) |
| 18 to 34 Years | 0 (0.0%) | 0 (0.0%) |
| 35 to 64 Years | 0 (0.0%) | 0 (0.0%) |
| 65 to 74 Years | 0 (0.0%) | 0 (0.0%) |
| 75 Years and over | 11 (13.4%) | 74 (74.0%) |
Disability Class: Self-Care Difficulty
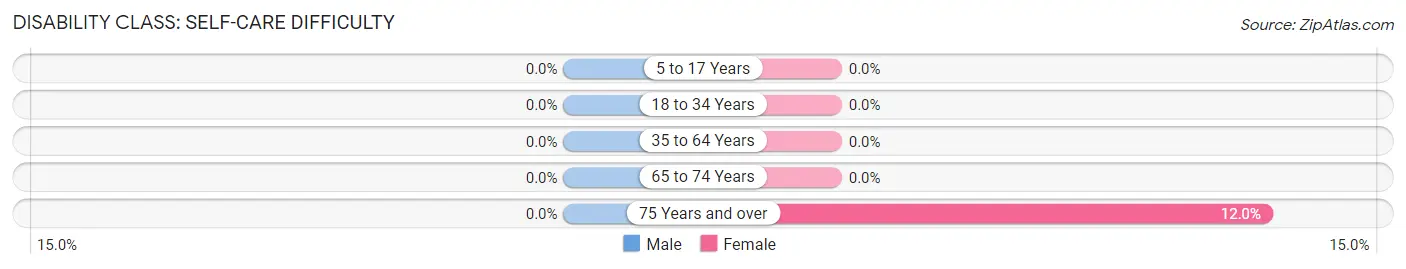
| Age Bracket | Male | Female |
| 5 to 17 Years | 0 (0.0%) | 0 (0.0%) |
| 18 to 34 Years | 0 (0.0%) | 0 (0.0%) |
| 35 to 64 Years | 0 (0.0%) | 0 (0.0%) |
| 65 to 74 Years | 0 (0.0%) | 0 (0.0%) |
| 75 Years and over | 0 (0.0%) | 12 (12.0%) |
Technology Access in Mountain Road
Computing Device Access in Mountain Road
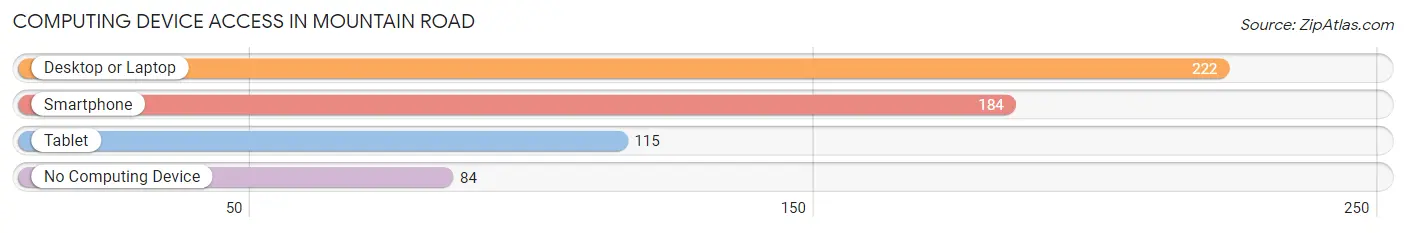
| Device Type | # Households | % Households |
| Desktop or Laptop | 222 | 57.5% |
| Smartphone | 184 | 47.7% |
| Tablet | 115 | 29.8% |
| No Computing Device | 84 | 21.8% |
| Total | 386 | 100.0% |
Internet Access in Mountain Road
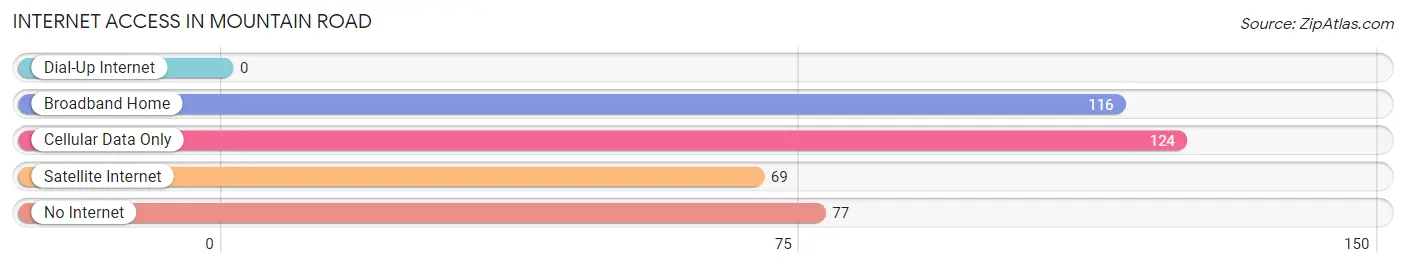
| Internet Type | # Households | % Households |
| Dial-Up Internet | 0 | 0.0% |
| Broadband Home | 116 | 30.0% |
| Cellular Data Only | 124 | 32.1% |
| Satellite Internet | 69 | 17.9% |
| No Internet | 77 | 20.0% |
| Total | 386 | 100.0% |
Mountain Road Summary
Mountain Road is a census-designated place (CDP) located in the state of Virginia in the United States. It is located in the northern part of the state, in the Shenandoah Valley region. The population of Mountain Road was 1,845 at the 2010 census.
History
Mountain Road was first settled in the late 1700s by German immigrants. The area was originally known as "Mountain Road" due to its location on a road that ran through the mountains. The area was primarily used for farming and logging, and the population remained small until the mid-1800s when the railroad was built through the area. This allowed for the development of the area and the population began to grow.
In the early 1900s, the area began to develop into a small town. The town was incorporated in 1921 and the population continued to grow. The town was home to several businesses, including a general store, a post office, a blacksmith shop, and a hotel.
Geography
Mountain Road is located in the northern part of Virginia in the Shenandoah Valley region. The town is situated in the foothills of the Blue Ridge Mountains and is surrounded by rolling hills and forests. The town is located near the Shenandoah River and is approximately 30 miles from the city of Winchester.
The climate in Mountain Road is temperate, with hot summers and cold winters. The average temperature in the summer is around 75 degrees Fahrenheit and the average temperature in the winter is around 35 degrees Fahrenheit.
Economy
Mountain Road is primarily a rural community and the economy is based on agriculture and tourism. The town is home to several farms, which produce a variety of crops, including corn, soybeans, and hay. The town is also home to several wineries, which produce a variety of wines.
Tourism is an important part of the economy in Mountain Road. The town is home to several attractions, including the Shenandoah National Park, the Luray Caverns, and the Skyline Drive. The town is also home to several festivals, including the Mountain Road Apple Festival and the Mountain Road Wine Festival.
Demographics
As of the 2010 census, the population of Mountain Road was 1,845. The racial makeup of the town was 95.3% White, 1.2% African American, 0.7% Native American, 0.4% Asian, 0.1% Pacific Islander, and 1.3% from other races. The median household income was $45,000 and the median family income was $50,000. The per capita income was $20,000.
Conclusion
Mountain Road is a small rural town located in the northern part of Virginia in the Shenandoah Valley region. The town has a long history and is home to several farms and wineries. The economy of the town is based on agriculture and tourism and the population is primarily white. The town is home to several attractions and festivals and is a popular destination for tourists.
Common Questions
What is Per Capita Income in Mountain Road?
Per Capita income in Mountain Road is $14,239.
What is the Median Family Income in Mountain Road?
Median Family Income in Mountain Road is $35,000.
What is the Median Household income in Mountain Road?
Median Household Income in Mountain Road is $33,056.
What is Income or Wage Gap in Mountain Road?
Income or Wage Gap in Mountain Road is 21.3%.
Women in Mountain Road earn 78.7 cents for every dollar earned by a man.
What is Inequality or Gini Index in Mountain Road?
Inequality or Gini Index in Mountain Road is 0.34.
What is the Total Population of Mountain Road?
Total Population of Mountain Road is 1,419.
What is the Total Male Population of Mountain Road?
Total Male Population of Mountain Road is 691.
What is the Total Female Population of Mountain Road?
Total Female Population of Mountain Road is 728.
What is the Ratio of Males per 100 Females in Mountain Road?
There are 94.92 Males per 100 Females in Mountain Road.
What is the Ratio of Females per 100 Males in Mountain Road?
There are 105.35 Females per 100 Males in Mountain Road.
What is the Median Population Age in Mountain Road?
Median Population Age in Mountain Road is 41.8 Years.
What is the Average Family Size in Mountain Road
Average Family Size in Mountain Road is 3.9 People.
What is the Average Household Size in Mountain Road
Average Household Size in Mountain Road is 3.7 People.
How Large is the Labor Force in Mountain Road?
There are 441 People in the Labor Forcein in Mountain Road.
What is the Percentage of People in the Labor Force in Mountain Road?
35.7% of People are in the Labor Force in Mountain Road.