Cities with the Highest Percentage of French American Indian Population in Oregon

RELATED REPORTS & OPTIONS

French American Indian
Population
Families and Households
Female Fertility
Female Fertility (Unmarried)
Race (Community Size)
Race (Percentage)
Ancestry (Community Size)
AfghanAfricanAlaska NativeAlaskan AthabascanAlbanianAleutAlsatianAmericanApacheArabArapahoArgentineanArmenianAssyrian / Chaldean / SyriacAustralianAustrianBahamianBangladeshiBarbadianBasqueBelgianBelizeanBermudanBhutaneseBlackfeetBolivianBrazilianBritishBritish West IndianBulgarianBurmeseCajunCambodianCanadianCape VerdeanCarpatho RusynCelticCentral AmericanCentral American IndianCherokeeCheyenneChickasawChileanChineseChippewaChoctawColombianColvilleComancheCosta RicanCreeCreekCroatianCrowCubanCypriotCzechCzechoslovakianDanishDelawareDominicanDutchDutch West IndianEastern EuropeanEcuadorianEgyptianEnglishEstonianEthiopianEuropeanFijianFilipinoFinnishFrenchFrench American IndianFrench CanadianGermanGerman RussianGhanaianGreekGuamanian / ChamorroGuatemalanGuyaneseHaitianHmongHonduranHopiHoumaHungarianIcelanderIndian (Asian)IndonesianInupiatIranianIraqiIrishIroquoisIsraeliItalianJamaicanJapaneseJordanianKenyanKiowaKoreanLaotianLatvianLebaneseLiberianLithuanianLumbeeLuxembourgerMacedonianMalaysianMalteseMarshalleseMenomineeMexicanMexican American IndianMongolianMoroccanNative HawaiianNavajoNepaleseNew ZealanderNicaraguanNigerianNorthern EuropeanNorwegianOkinawanOsageOttawaPaiutePakistaniPalestinianPanamanianParaguayanPennsylvania GermanPeruvianPimaPolishPortuguesePotawatomiPuebloPuerto RicanPuget Sound SalishRomanianRussianSalvadoranSamoanScandinavianScotch-IrishScottishSeminoleSenegaleseSerbianShoshoneSierra LeoneanSiouxSlavicSlovakSloveneSomaliSouth AfricanSouth AmericanSouth American IndianSoviet UnionSpaniardSpanishSpanish AmericanSpanish American IndianSri LankanSubsaharan AfricanSudaneseSwedishSwissSyrianTaiwaneseThaiTlingit-HaidaTohono O'OdhamTonganTrinidadian and TobagonianTsimshianTurkishU.S. Virgin IslanderUgandanUkrainianUruguayanUteVenezuelanVietnameseWelshWest IndianYakamaYaquiYugoslavianYumanYup'ikZimbabwean
Ancestry (Percentage)
AfghanAfricanAlaska NativeAlaskan AthabascanAlbanianAleutAlsatianAmericanApacheArabArapahoArgentineanArmenianAssyrian / Chaldean / SyriacAustralianAustrianBahamianBangladeshiBarbadianBasqueBelgianBelizeanBermudanBhutaneseBlackfeetBolivianBrazilianBritishBritish West IndianBulgarianBurmeseCajunCambodianCanadianCape VerdeanCarpatho RusynCelticCentral AmericanCentral American IndianCherokeeCheyenneChickasawChileanChineseChippewaChoctawColombianColvilleComancheCosta RicanCreeCreekCroatianCrowCubanCypriotCzechCzechoslovakianDanishDelawareDominicanDutchDutch West IndianEastern EuropeanEcuadorianEgyptianEnglishEstonianEthiopianEuropeanFijianFilipinoFinnishFrenchFrench American IndianFrench CanadianGermanGerman RussianGhanaianGreekGuamanian / ChamorroGuatemalanGuyaneseHaitianHmongHonduranHopiHoumaHungarianIcelanderIndian (Asian)IndonesianInupiatIranianIraqiIrishIroquoisIsraeliItalianJamaicanJapaneseJordanianKenyanKiowaKoreanLaotianLatvianLebaneseLiberianLithuanianLumbeeLuxembourgerMacedonianMalaysianMalteseMarshalleseMenomineeMexicanMexican American IndianMongolianMoroccanNative HawaiianNavajoNepaleseNew ZealanderNicaraguanNigerianNorthern EuropeanNorwegianOkinawanOsageOttawaPaiutePakistaniPalestinianPanamanianParaguayanPennsylvania GermanPeruvianPimaPolishPortuguesePotawatomiPuebloPuerto RicanPuget Sound SalishRomanianRussianSalvadoranSamoanScandinavianScotch-IrishScottishSeminoleSenegaleseSerbianShoshoneSierra LeoneanSiouxSlavicSlovakSloveneSomaliSouth AfricanSouth AmericanSouth American IndianSoviet UnionSpaniardSpanishSpanish AmericanSpanish American IndianSri LankanSubsaharan AfricanSudaneseSwedishSwissSyrianTaiwaneseThaiTlingit-HaidaTohono O'OdhamTonganTrinidadian and TobagonianTsimshianTurkishU.S. Virgin IslanderUgandanUkrainianUruguayanUteVenezuelanVietnameseWelshWest IndianYakamaYaquiYugoslavianYumanYup'ikZimbabwean
Immigrant Origin (Total)
AfghanistanAfricaAlbaniaArgentinaArmeniaAsiaAustraliaAustriaAzoresBahamasBangladeshBarbadosBelarusBelgiumBelizeBoliviaBosnia and HerzegovinaBrazilBulgariaBurma / MyanmarCabo VerdeCambodiaCameroonCanadaCaribbeanCentral AmericaChileChinaColombiaCongoCosta RicaCroatiaCubaCzechoslovakiaDenmarkDominicaDominican RepublicEastern AfricaEastern AsiaEastern EuropeEcuadorEgyptEl SalvadorEnglandEritreaEthiopiaEuropeFijiFranceGermanyGhanaGreeceGrenadaGuatemalaGuyanaHaitiHondurasHong KongHungaryIndiaIndonesiaIranIraqIrelandIsraelItalyJamaicaJapanJordanKazakhstanKenyaKoreaKuwaitLaosLatin AmericaLatviaLebanonLiberiaLithuaniaMalaysiaMexicoMicronesiaMiddle AfricaMoldovaMoroccoNepalNetherlandsNicaraguaNigeriaNorth MacedoniaNorthern AfricaNorthern EuropeNorwayOceaniaPakistanPanamaPeruPhilippinesPolandPortugalRomaniaRussiaSaudi ArabiaScotlandSenegalSerbiaSierra LeoneSingaporeSomaliaSouth AfricaSouth AmericaSouth Central AsiaSouth Eastern AsiaSouthern EuropeSpainSri LankaSt. Vincent and the GrenadinesSudanSwedenSwitzerlandSyriaTaiwanThailandTrinidad and TobagoTurkeyUgandaUkraineUruguayUzbekistanVenezuelaVietnamWest IndiesWestern AfricaWestern AsiaWestern EuropeYemenZaireZimbabwe
Immigrant Origin (Percentage)
AfghanistanAfricaAlbaniaArgentinaArmeniaAsiaAustraliaAustriaAzoresBahamasBangladeshBarbadosBelarusBelgiumBelizeBoliviaBosnia and HerzegovinaBrazilBulgariaBurma / MyanmarCabo VerdeCambodiaCameroonCanadaCaribbeanCentral AmericaChileChinaColombiaCongoCosta RicaCroatiaCubaCzechoslovakiaDenmarkDominicaDominican RepublicEastern AfricaEastern AsiaEastern EuropeEcuadorEgyptEl SalvadorEnglandEritreaEthiopiaEuropeFijiFranceGermanyGhanaGreeceGrenadaGuatemalaGuyanaHaitiHondurasHong KongHungaryIndiaIndonesiaIranIraqIrelandIsraelItalyJamaicaJapanJordanKazakhstanKenyaKoreaKuwaitLaosLatin AmericaLatviaLebanonLiberiaLithuaniaMalaysiaMexicoMicronesiaMiddle AfricaMoldovaMoroccoNepalNetherlandsNicaraguaNigeriaNorth MacedoniaNorthern AfricaNorthern EuropeNorwayOceaniaPakistanPanamaPeruPhilippinesPolandPortugalRomaniaRussiaSaudi ArabiaScotlandSenegalSerbiaSierra LeoneSingaporeSomaliaSouth AfricaSouth AmericaSouth Central AsiaSouth Eastern AsiaSouthern EuropeSpainSri LankaSt. Vincent and the GrenadinesSudanSwedenSwitzerlandSyriaTaiwanThailandTrinidad and TobagoTurkeyUgandaUkraineUruguayUzbekistanVenezuelaVietnamWest IndiesWestern AfricaWestern AsiaWestern EuropeYemenZaireZimbabwe
Income
Income (Families)
Income (Households)
Poverty
Poverty (Families)
Unemployment
Employment Occupations
Employment Industries
Employer Class
Commute Time
Commute Means
School Enrollment
Education by Degree Field
Occupancy
Finances
Physical Characteristics
Oregon
Compare Cities
Comparison Subject

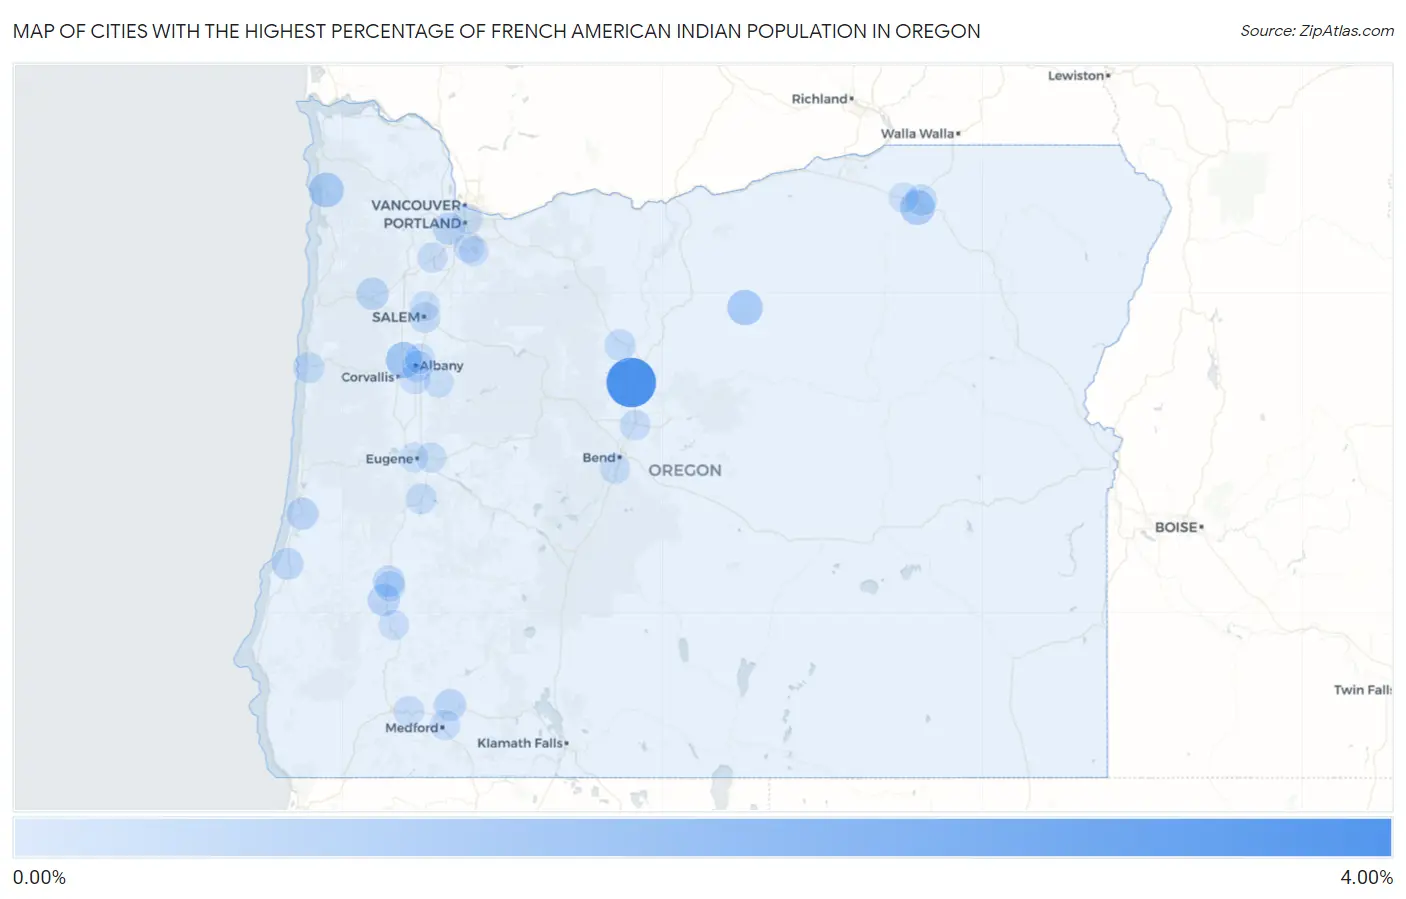
Map of Cities with the Highest Percentage of French American Indian Population in Oregon

0.00%
4.00%
Cities with the Highest Percentage of French American Indian Population in Oregon Map

Cities with the Highest Percentage of French American Indian Population in Oregon

City French American Indian vs State vs National
1.Culver3.22%0.030%(+3.19)#10.010%(+3.21)#21
2.Adair Village0.93%0.030%(+0.898)#20.010%(+0.918)#104
3.Fossil0.82%0.030%(+0.795)#30.010%(+0.815)#121
4.Tutuilla0.76%0.030%(+0.729)#40.010%(+0.749)#131
5.Nehalem0.74%0.030%(+0.713)#50.010%(+0.733)#136
6.Green0.36%0.030%(+0.326)#60.010%(+0.346)#251
7.Santa Clara0.35%0.030%(+0.321)#70.010%(+0.341)#256
8.Willamina0.35%0.030%(+0.320)#80.010%(+0.340)#257
9.Beaverton0.34%0.030%(+0.313)#90.010%(+0.333)#262
10.Reedsport0.30%0.030%(+0.272)#100.010%(+0.292)#287
11.Eagle Point0.29%0.030%(+0.257)#110.010%(+0.278)#295
12.Coos Bay0.28%0.030%(+0.246)#120.010%(+0.266)#311
13.Roseburg North0.25%0.030%(+0.215)#130.010%(+0.236)#336
14.Warm Springs0.20%0.030%(+0.174)#140.010%(+0.194)#387
15.Mission0.20%0.030%(+0.165)#150.010%(+0.185)#395
16.Albany0.18%0.030%(+0.145)#160.010%(+0.166)#418
17.Newport0.16%0.030%(+0.125)#170.010%(+0.145)#443
18.Roseburg0.11%0.030%(+0.084)#180.010%(+0.104)#521
19.Rogue River0.10%0.030%(+0.070)#190.010%(+0.090)#549
20.Salem0.091%0.030%(+0.061)#200.010%(+0.081)#567
21.West Linn0.088%0.030%(+0.058)#210.010%(+0.078)#574
22.Redmond0.088%0.030%(+0.058)#220.010%(+0.078)#576
23.Cottage Grove0.085%0.030%(+0.055)#230.010%(+0.075)#582
24.Tangent0.077%0.030%(+0.047)#240.010%(+0.067)#604
25.River Road0.069%0.030%(+0.039)#250.010%(+0.059)#628
26.Millersburg0.067%0.030%(+0.037)#260.010%(+0.057)#636
27.Medford0.062%0.030%(+0.032)#270.010%(+0.052)#659
28.Tri City0.052%0.030%(+0.022)#280.010%(+0.042)#697
29.Newberg0.039%0.030%(+0.009)#290.010%(+0.029)#755
30.Deschutes River Woods0.036%0.030%(+0.006)#300.010%(+0.026)#781
31.Springfield0.019%0.030%(-0.011)#310.010%(+0.009)#911
32.Portland0.0068%0.030%(-0.023)#320.010%(-0.003)#1,048
33.Pendleton0.0059%0.030%(-0.024)#330.010%(-0.004)#1,063
34.Lebanon0.0054%0.030%(-0.025)#340.010%(-0.005)#1,068
35.Oregon City0.0053%0.030%(-0.025)#350.010%(-0.005)#1,069
36.Eugene0.0034%0.030%(-0.027)#360.010%(-0.007)#1,115
37.Keizer0.0026%0.030%(-0.028)#370.010%(-0.008)#1,128

Common Questions

What are the Top 10 Cities with the Highest Percentage of French American Indian Population in Oregon?
Top 10 Cities with the Highest Percentage of French American Indian Population in Oregon are:
#1
3.22%
#2
0.93%
#3
0.82%
#4
0.76%
#5
0.74%
#6
0.36%
#7
0.35%
#8
0.34%
#9
0.30%
#10
0.29%
What city has the Highest Percentage of French American Indian Population in Oregon?
Culver has the Highest Percentage of French American Indian Population in Oregon with 3.22%.
What is the Percentage of French American Indian Population in the State of Oregon?
Percentage of French American Indian Population in Oregon is 0.030%.
What is the Percentage of French American Indian Population in the United States?
Percentage of French American Indian Population in the United States is 0.010%.