Riverdale Park, MD Map & Demographics
Riverdale Park Map
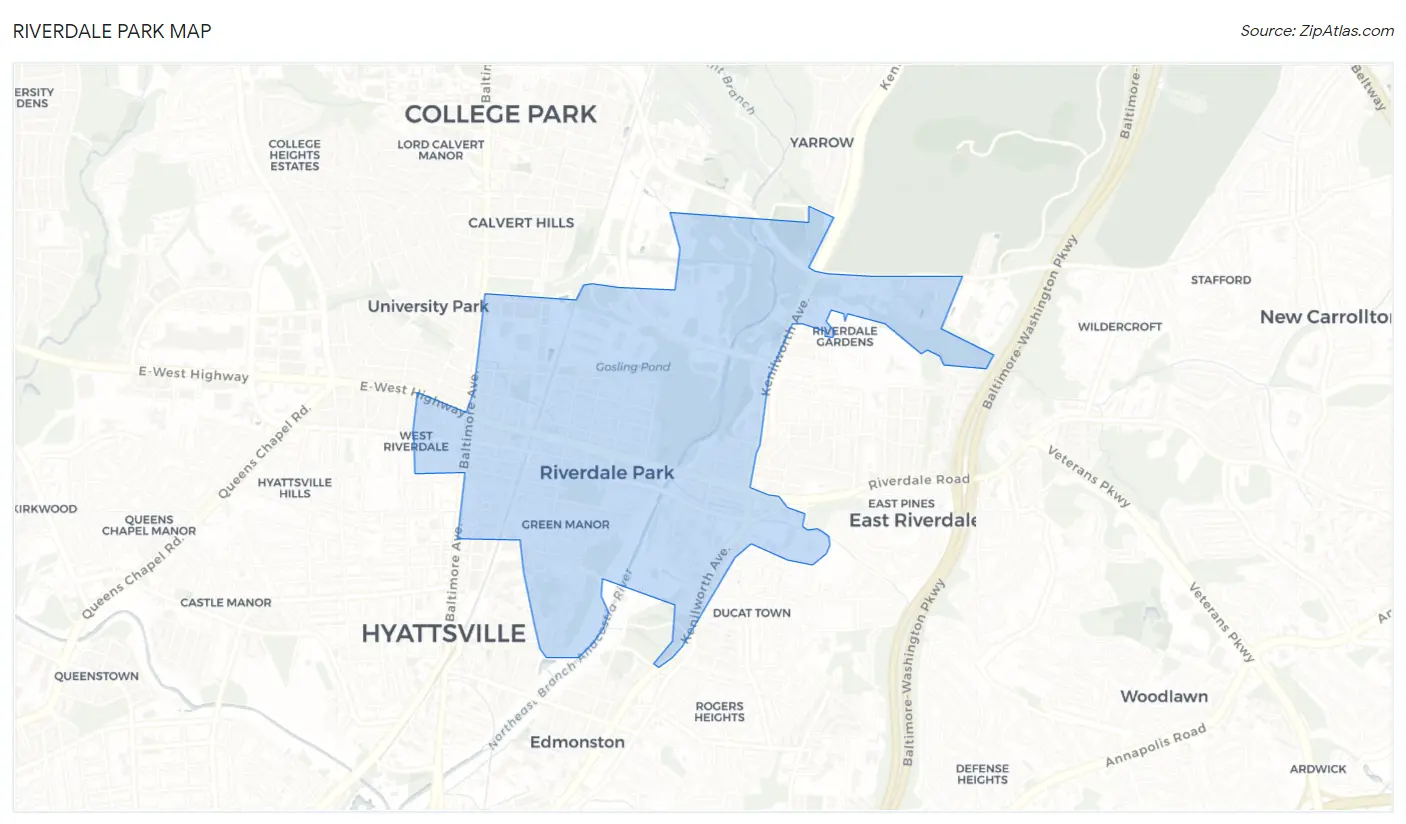
Riverdale Park Overview
$37,995
PER CAPITA INCOME
$113,393
AVG FAMILY INCOME
$105,250
AVG HOUSEHOLD INCOME
10.3%
WAGE / INCOME GAP [ % ]
89.7¢/ $1
WAGE / INCOME GAP [ $ ]
0.41
INEQUALITY / GINI INDEX
7,284
TOTAL POPULATION
4,040
MALE POPULATION
3,244
FEMALE POPULATION
124.54
MALES / 100 FEMALES
80.30
FEMALES / 100 MALES
38.6
MEDIAN AGE
3.9
AVG FAMILY SIZE
3.4
AVG HOUSEHOLD SIZE
4,174
LABOR FORCE [ PEOPLE ]
71.7%
PERCENT IN LABOR FORCE
3.6%
UNEMPLOYMENT RATE
Income in Riverdale Park
Income Overview in Riverdale Park
Per Capita Income in Riverdale Park is $37,995, while median incomes of families and households are $113,393 and $105,250 respectively.
| Characteristic | Number | Measure |
| Per Capita Income | 7,284 | $37,995 |
| Median Family Income | 1,535 | $113,393 |
| Mean Family Income | 1,535 | $136,399 |
| Median Household Income | 2,122 | $105,250 |
| Mean Household Income | 2,122 | $123,341 |
| Income Deficit | 1,535 | $0 |
| Wage / Income Gap (%) | 7,284 | 10.30% |
| Wage / Income Gap ($) | 7,284 | 89.70¢ per $1 |
| Gini / Inequality Index | 7,284 | 0.41 |
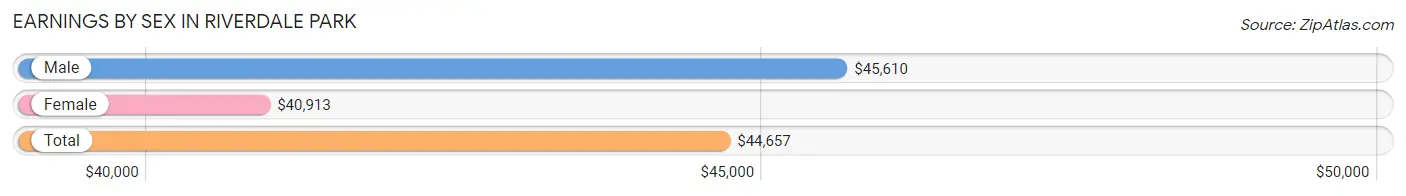
Earnings by Sex in Riverdale Park
Average Earnings in Riverdale Park are $44,657, $45,610 for men and $40,913 for women, a difference of 10.3%.
| Sex | Number | Average Earnings |
| Male | 2,694 (62.7%) | $45,610 |
| Female | 1,605 (37.3%) | $40,913 |
| Total | 4,299 (100.0%) | $44,657 |
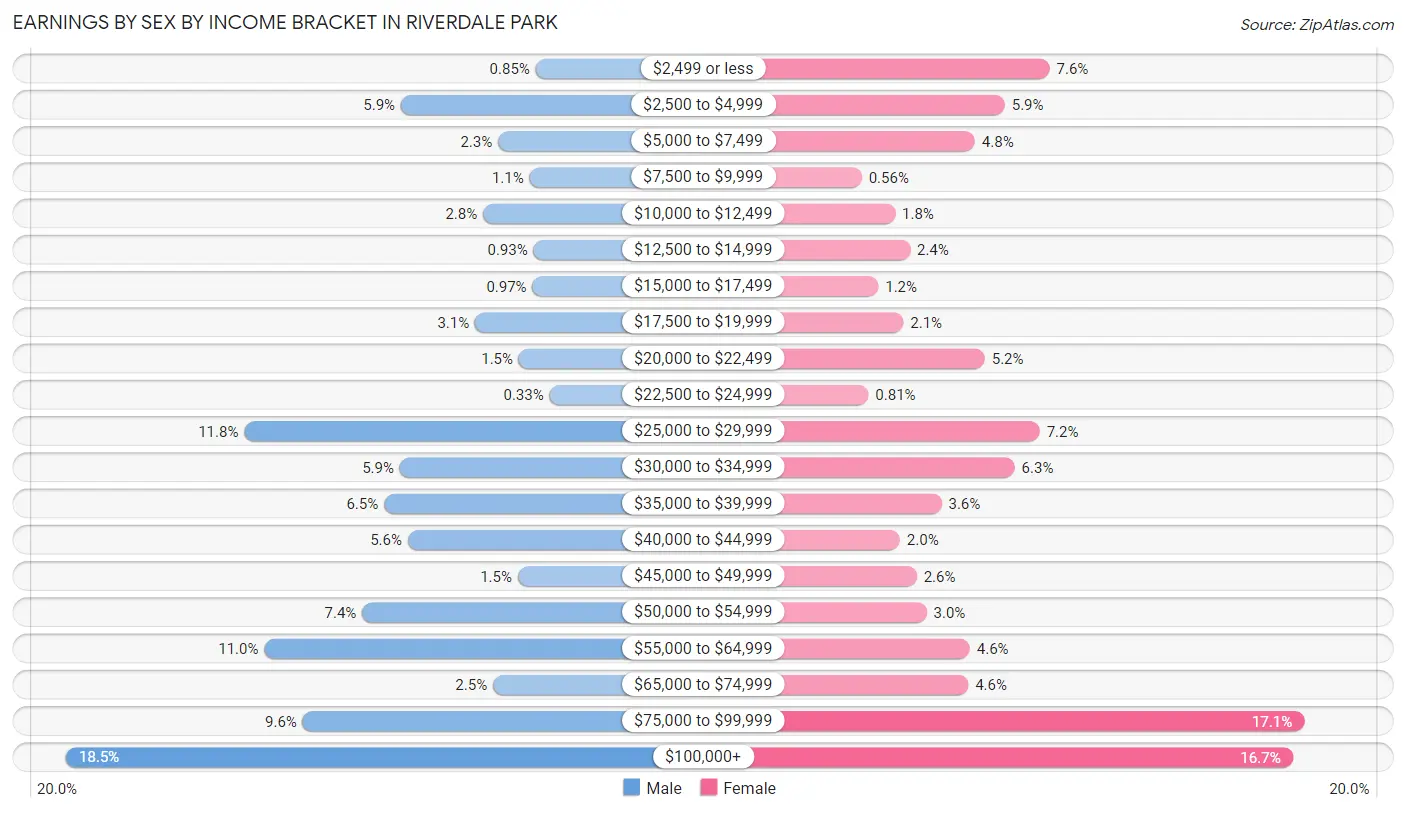
Earnings by Sex by Income Bracket in Riverdale Park
The most common earnings brackets in Riverdale Park are $100,000+ for men (497 | 18.4%) and $75,000 to $99,999 for women (275 | 17.1%).
| Income | Male | Female |
| $2,499 or less | 23 (0.9%) | 122 (7.6%) |
| $2,500 to $4,999 | 159 (5.9%) | 95 (5.9%) |
| $5,000 to $7,499 | 61 (2.3%) | 77 (4.8%) |
| $7,500 to $9,999 | 29 (1.1%) | 9 (0.6%) |
| $10,000 to $12,499 | 76 (2.8%) | 29 (1.8%) |
| $12,500 to $14,999 | 25 (0.9%) | 38 (2.4%) |
| $15,000 to $17,499 | 26 (1.0%) | 19 (1.2%) |
| $17,500 to $19,999 | 84 (3.1%) | 34 (2.1%) |
| $20,000 to $22,499 | 40 (1.5%) | 83 (5.2%) |
| $22,500 to $24,999 | 9 (0.3%) | 13 (0.8%) |
| $25,000 to $29,999 | 317 (11.8%) | 116 (7.2%) |
| $30,000 to $34,999 | 160 (5.9%) | 101 (6.3%) |
| $35,000 to $39,999 | 176 (6.5%) | 57 (3.5%) |
| $40,000 to $44,999 | 152 (5.6%) | 32 (2.0%) |
| $45,000 to $49,999 | 41 (1.5%) | 42 (2.6%) |
| $50,000 to $54,999 | 198 (7.3%) | 48 (3.0%) |
| $55,000 to $64,999 | 297 (11.0%) | 74 (4.6%) |
| $65,000 to $74,999 | 66 (2.5%) | 73 (4.5%) |
| $75,000 to $99,999 | 258 (9.6%) | 275 (17.1%) |
| $100,000+ | 497 (18.4%) | 268 (16.7%) |
| Total | 2,694 (100.0%) | 1,605 (100.0%) |
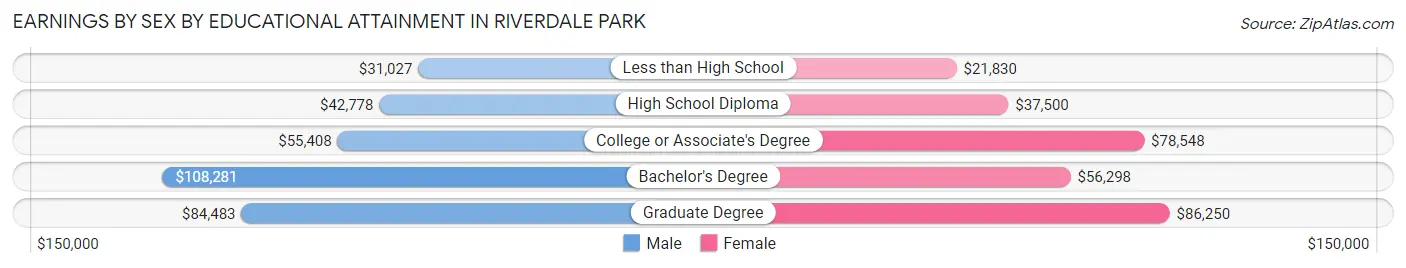
Earnings by Sex by Educational Attainment in Riverdale Park
Average earnings in Riverdale Park are $52,102 for men and $55,391 for women, a difference of 5.9%. Men with an educational attainment of bachelor's degree enjoy the highest average annual earnings of $108,281, while those with less than high school education earn the least with $31,027. Women with an educational attainment of graduate degree earn the most with the average annual earnings of $86,250, while those with less than high school education have the smallest earnings of $21,830.
| Educational Attainment | Male Income | Female Income |
| Less than High School | $31,027 | $21,830 |
| High School Diploma | $42,778 | $37,500 |
| College or Associate's Degree | $55,408 | $78,548 |
| Bachelor's Degree | $108,281 | $56,298 |
| Graduate Degree | $84,483 | $86,250 |
| Total | $52,102 | $55,391 |
Family Income in Riverdale Park
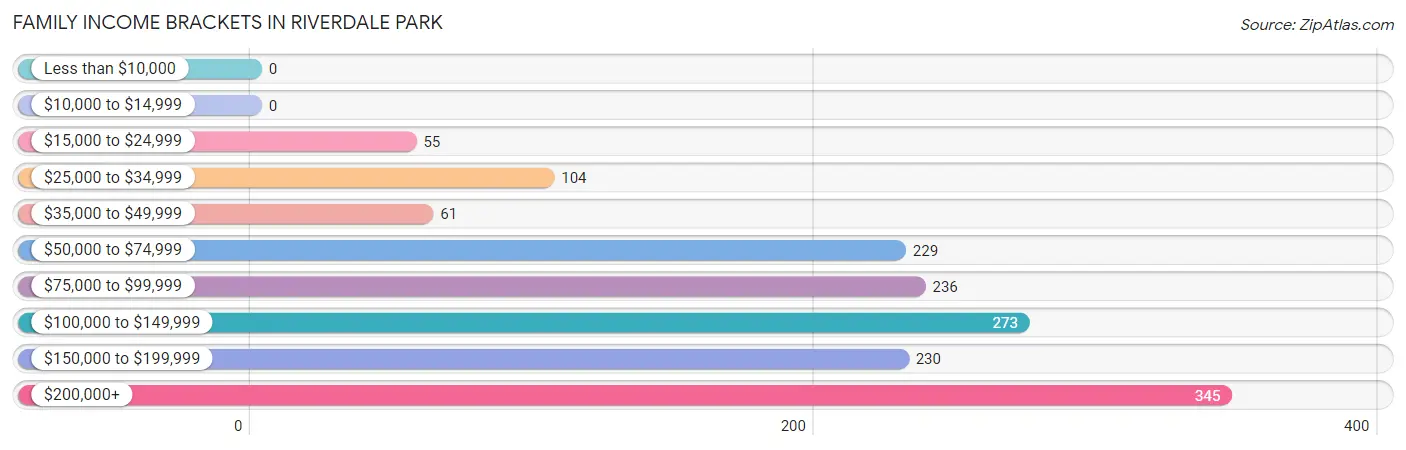
Family Income Brackets in Riverdale Park
According to the Riverdale Park family income data, there are 345 families falling into the $200,000+ income range, which is the most common income bracket and makes up 22.5% of all families.
| Income Bracket | # Families | % Families |
| Less than $10,000 | 0 | 0.0% |
| $10,000 to $14,999 | 0 | 0.0% |
| $15,000 to $24,999 | 55 | 3.6% |
| $25,000 to $34,999 | 104 | 6.8% |
| $35,000 to $49,999 | 61 | 4.0% |
| $50,000 to $74,999 | 229 | 14.9% |
| $75,000 to $99,999 | 236 | 15.4% |
| $100,000 to $149,999 | 273 | 17.8% |
| $150,000 to $199,999 | 230 | 15.0% |
| $200,000+ | 345 | 22.5% |
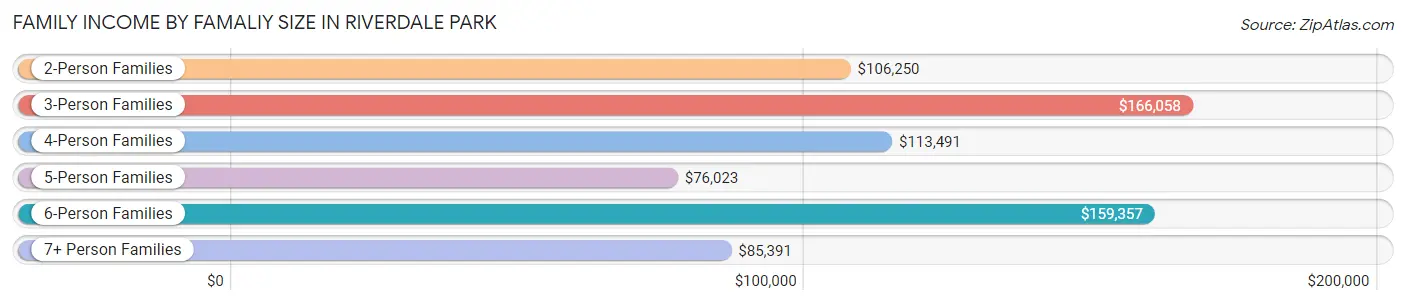
Family Income by Famaliy Size in Riverdale Park
3-person families (321 | 20.9%) account for the highest median family income in Riverdale Park with $166,058 per family, while 3-person families (321 | 20.9%) have the highest median income of $55,353 per family member.
| Income Bracket | # Families | Median Income |
| 2-Person Families | 386 (25.2%) | $106,250 |
| 3-Person Families | 321 (20.9%) | $166,058 |
| 4-Person Families | 361 (23.5%) | $113,491 |
| 5-Person Families | 299 (19.5%) | $76,023 |
| 6-Person Families | 101 (6.6%) | $159,357 |
| 7+ Person Families | 67 (4.4%) | $85,391 |
| Total | 1,535 (100.0%) | $113,393 |
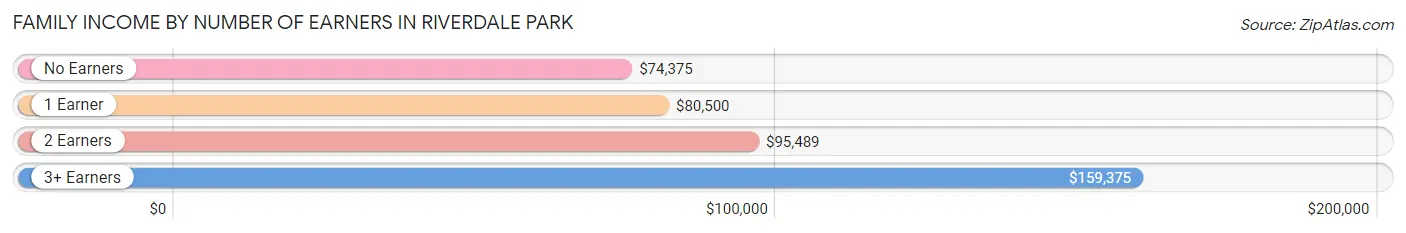
Family Income by Number of Earners in Riverdale Park
The median family income in Riverdale Park is $113,393, with families comprising 3+ earners (566) having the highest median family income of $159,375, while families with no earners (50) have the lowest median family income of $74,375, accounting for 36.9% and 3.3% of families, respectively.
| Number of Earners | # Families | Median Income |
| No Earners | 50 (3.3%) | $74,375 |
| 1 Earner | 310 (20.2%) | $80,500 |
| 2 Earners | 609 (39.7%) | $95,489 |
| 3+ Earners | 566 (36.9%) | $159,375 |
| Total | 1,535 (100.0%) | $113,393 |
Household Income in Riverdale Park
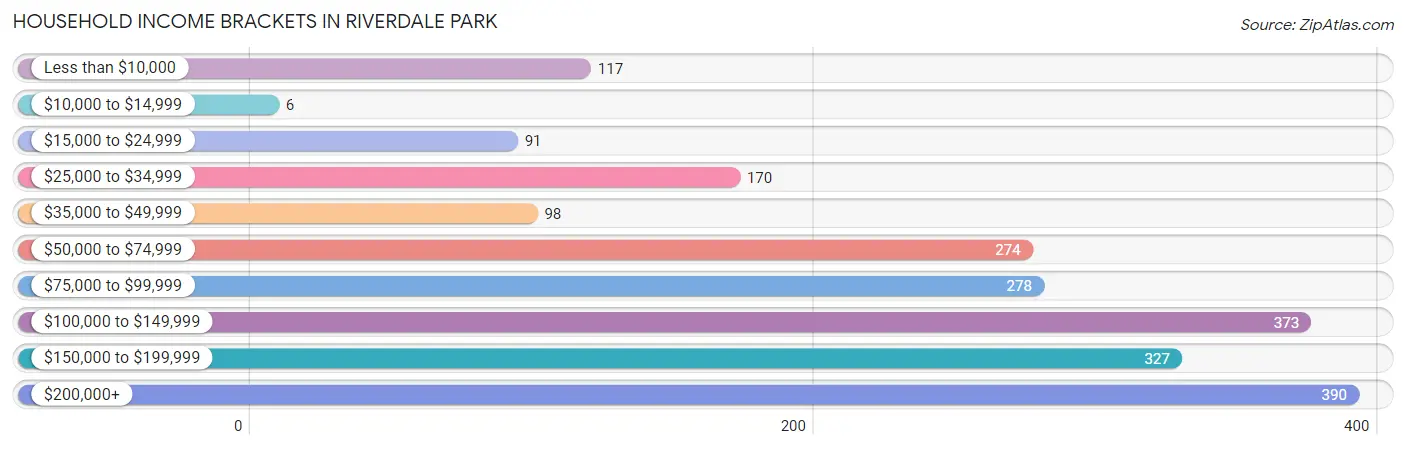
Household Income Brackets in Riverdale Park
With 390 households falling in the category, the $200,000+ income range is the most frequent in Riverdale Park, accounting for 18.4% of all households. In contrast, only 6 households (0.3%) fall into the $10,000 to $14,999 income bracket, making it the least populous group.
| Income Bracket | # Households | % Households |
| Less than $10,000 | 117 | 5.5% |
| $10,000 to $14,999 | 6 | 0.3% |
| $15,000 to $24,999 | 91 | 4.3% |
| $25,000 to $34,999 | 170 | 8.0% |
| $35,000 to $49,999 | 98 | 4.6% |
| $50,000 to $74,999 | 274 | 12.9% |
| $75,000 to $99,999 | 278 | 13.1% |
| $100,000 to $149,999 | 373 | 17.6% |
| $150,000 to $199,999 | 327 | 15.4% |
| $200,000+ | 390 | 18.4% |
Household Income by Householder Age in Riverdale Park
The median household income in Riverdale Park is $105,250, with the highest median household income of $158,603 found in the 15 to 24 years age bracket for the primary householder. A total of 100 households (4.7%) fall into this category. Meanwhile, the 25 to 44 years age bracket for the primary householder has the lowest median household income of $75,027, with 763 households (36.0%) in this group.
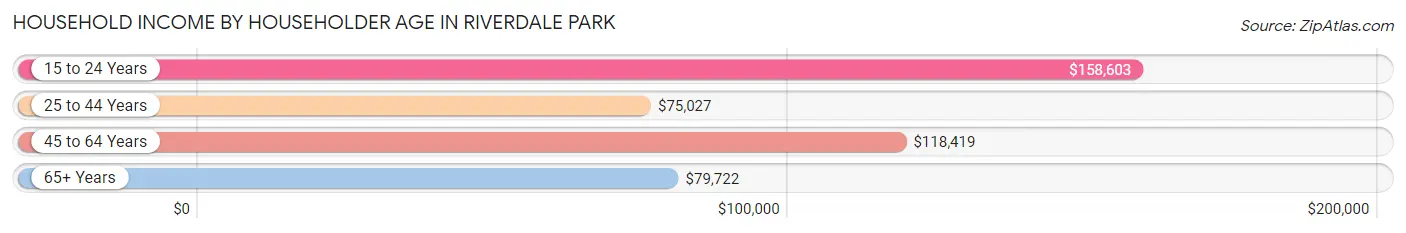
| Income Bracket | # Households | Median Income |
| 15 to 24 Years | 100 (4.7%) | $158,603 |
| 25 to 44 Years | 763 (36.0%) | $75,027 |
| 45 to 64 Years | 1,057 (49.8%) | $118,419 |
| 65+ Years | 202 (9.5%) | $79,722 |
| Total | 2,122 (100.0%) | $105,250 |
Poverty in Riverdale Park
Income Below Poverty by Sex and Age in Riverdale Park
With 12.3% poverty level for males and 15.5% for females among the residents of Riverdale Park, 12 to 14 year old males and 12 to 14 year old females are the most vulnerable to poverty, with 62 males (44.6%) and 28 females (38.4%) in their respective age groups living below the poverty level.
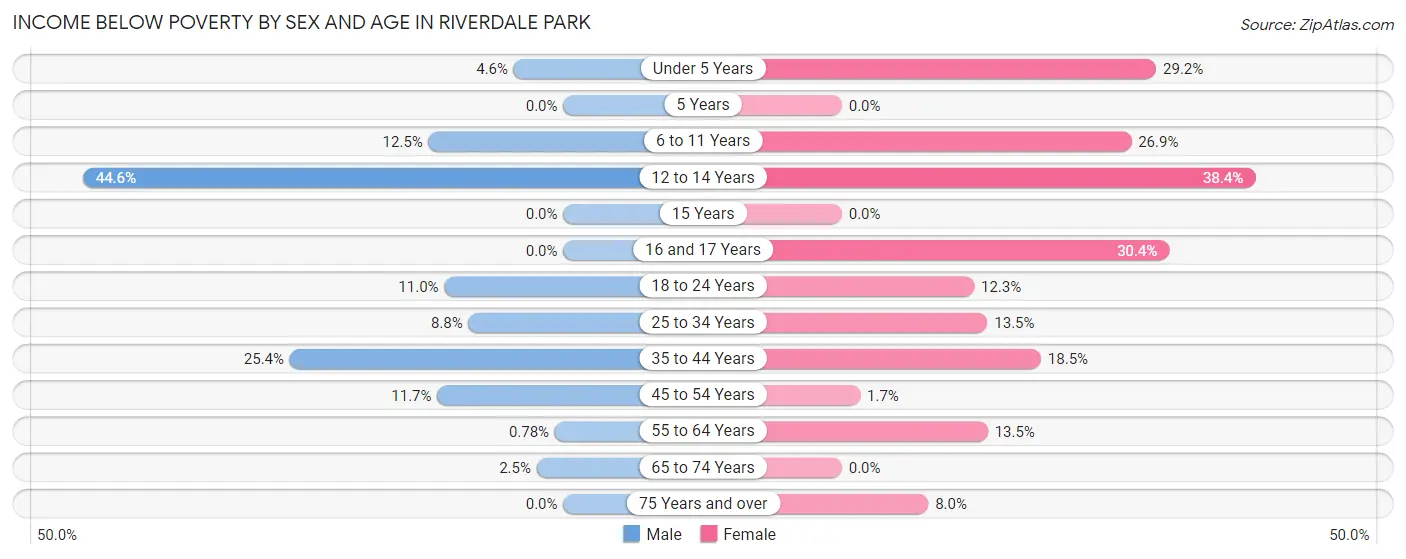
| Age Bracket | Male | Female |
| Under 5 Years | 9 (4.6%) | 56 (29.2%) |
| 5 Years | 0 (0.0%) | 0 (0.0%) |
| 6 to 11 Years | 43 (12.5%) | 101 (26.9%) |
| 12 to 14 Years | 62 (44.6%) | 28 (38.4%) |
| 15 Years | 0 (0.0%) | 0 (0.0%) |
| 16 and 17 Years | 0 (0.0%) | 48 (30.4%) |
| 18 to 24 Years | 49 (11.0%) | 34 (12.3%) |
| 25 to 34 Years | 41 (8.8%) | 47 (13.5%) |
| 35 to 44 Years | 198 (25.4%) | 97 (18.5%) |
| 45 to 54 Years | 83 (11.7%) | 8 (1.7%) |
| 55 to 64 Years | 4 (0.8%) | 47 (13.5%) |
| 65 to 74 Years | 3 (2.5%) | 0 (0.0%) |
| 75 Years and over | 0 (0.0%) | 15 (8.0%) |
| Total | 492 (12.3%) | 481 (15.5%) |
Income Above Poverty by Sex and Age in Riverdale Park
According to the poverty statistics in Riverdale Park, males aged 5 years and females aged 5 years are the age groups that are most secure financially, with 100.0% of males and 100.0% of females in these age groups living above the poverty line.
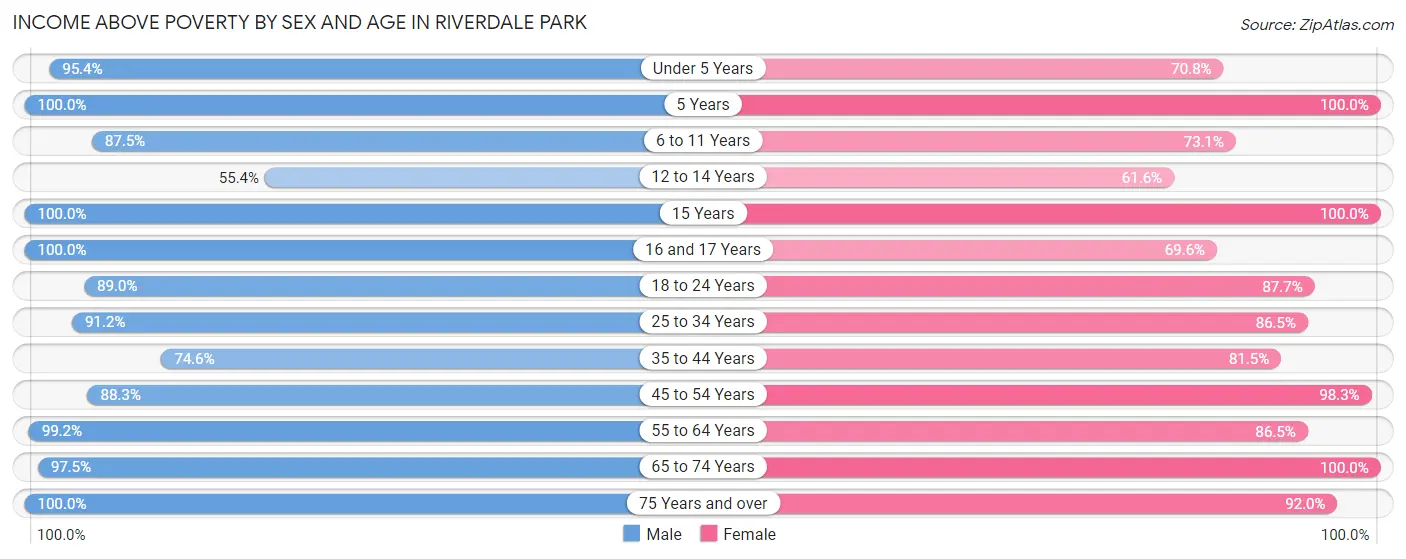
| Age Bracket | Male | Female |
| Under 5 Years | 187 (95.4%) | 136 (70.8%) |
| 5 Years | 22 (100.0%) | 5 (100.0%) |
| 6 to 11 Years | 301 (87.5%) | 275 (73.1%) |
| 12 to 14 Years | 77 (55.4%) | 45 (61.6%) |
| 15 Years | 74 (100.0%) | 9 (100.0%) |
| 16 and 17 Years | 153 (100.0%) | 110 (69.6%) |
| 18 to 24 Years | 395 (89.0%) | 243 (87.7%) |
| 25 to 34 Years | 425 (91.2%) | 301 (86.5%) |
| 35 to 44 Years | 582 (74.6%) | 428 (81.5%) |
| 45 to 54 Years | 627 (88.3%) | 463 (98.3%) |
| 55 to 64 Years | 511 (99.2%) | 300 (86.5%) |
| 65 to 74 Years | 119 (97.5%) | 129 (100.0%) |
| 75 Years and over | 40 (100.0%) | 172 (92.0%) |
| Total | 3,513 (87.7%) | 2,616 (84.5%) |
Income Below Poverty Among Married-Couple Families in Riverdale Park
The poverty statistics for married-couple families in Riverdale Park show that 6.6% or 72 of the total 1,088 families live below the poverty line. Families with 3 or 4 children have the highest poverty rate of 16.6%, comprising of 23 families. On the other hand, families with no children have the lowest poverty rate of 0.0%, which includes 0 families.
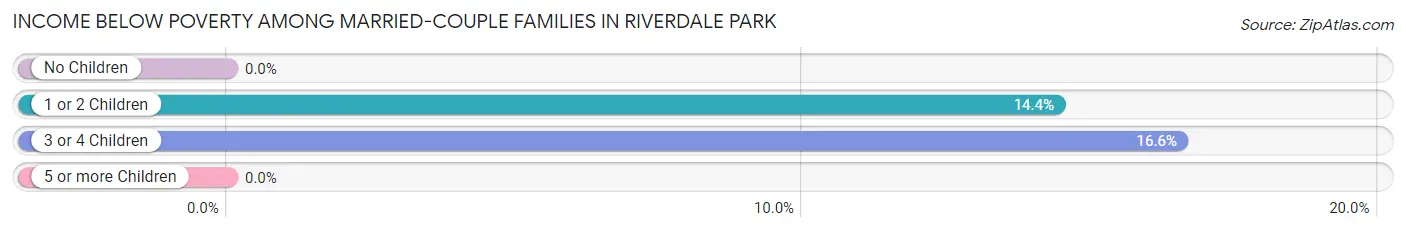
| Children | Above Poverty | Below Poverty |
| No Children | 609 (100.0%) | 0 (0.0%) |
| 1 or 2 Children | 291 (85.6%) | 49 (14.4%) |
| 3 or 4 Children | 116 (83.5%) | 23 (16.6%) |
| 5 or more Children | 0 (0.0%) | 0 (0.0%) |
| Total | 1,016 (93.4%) | 72 (6.6%) |
Income Below Poverty Among Single-Parent Households in Riverdale Park
According to the poverty data in Riverdale Park, 21.1% or 55 single-father households and 14.5% or 27 single-mother households are living below the poverty line. Among single-father households, those with 1 or 2 children have the highest poverty rate, with 55 households (28.1%) experiencing poverty. Likewise, among single-mother households, those with 3 or 4 children have the highest poverty rate, with 8 households (100.0%) falling below the poverty line.
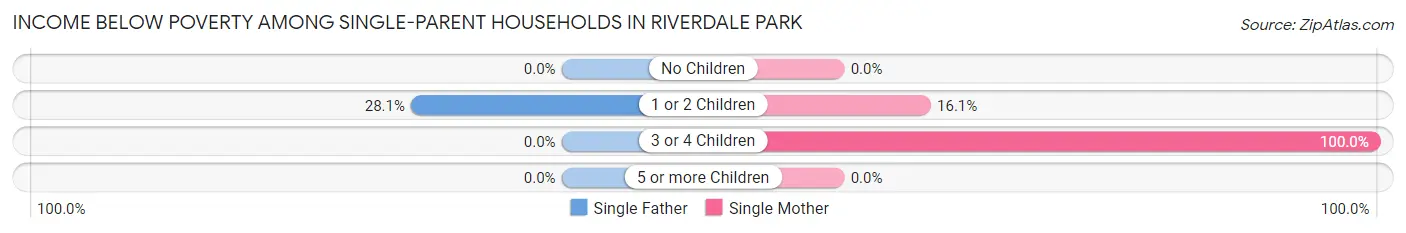
| Children | Single Father | Single Mother |
| No Children | 0 (0.0%) | 0 (0.0%) |
| 1 or 2 Children | 55 (28.1%) | 19 (16.1%) |
| 3 or 4 Children | 0 (0.0%) | 8 (100.0%) |
| 5 or more Children | 0 (0.0%) | 0 (0.0%) |
| Total | 55 (21.1%) | 27 (14.5%) |
Income Below Poverty Among Married-Couple vs Single-Parent Households in Riverdale Park
The poverty data for Riverdale Park shows that 72 of the married-couple family households (6.6%) and 82 of the single-parent households (18.3%) are living below the poverty level. Within the married-couple family households, those with 3 or 4 children have the highest poverty rate, with 23 households (16.6%) falling below the poverty line. Among the single-parent households, those with 3 or 4 children have the highest poverty rate, with 8 household (25.8%) living below poverty.
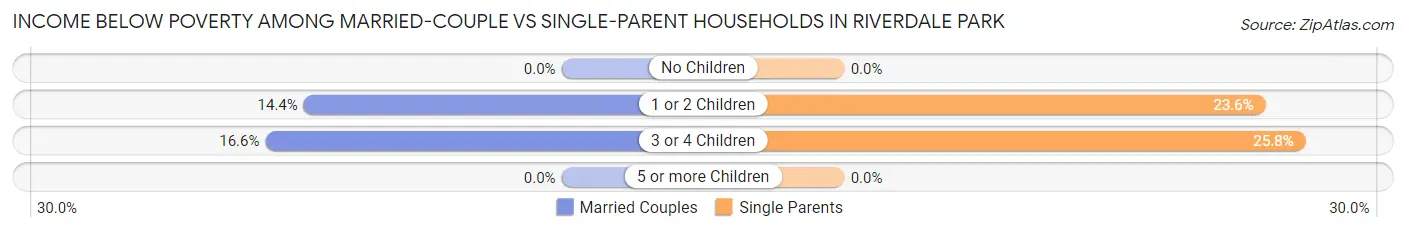
| Children | Married-Couple Families | Single-Parent Households |
| No Children | 0 (0.0%) | 0 (0.0%) |
| 1 or 2 Children | 49 (14.4%) | 74 (23.6%) |
| 3 or 4 Children | 23 (16.6%) | 8 (25.8%) |
| 5 or more Children | 0 (0.0%) | 0 (0.0%) |
| Total | 72 (6.6%) | 82 (18.3%) |
Race in Riverdale Park
The most populous races in Riverdale Park are Hispanic or Latino (3,986 | 54.7%), Some other Race (3,238 | 44.5%), and White / Caucasian (1,782 | 24.5%).
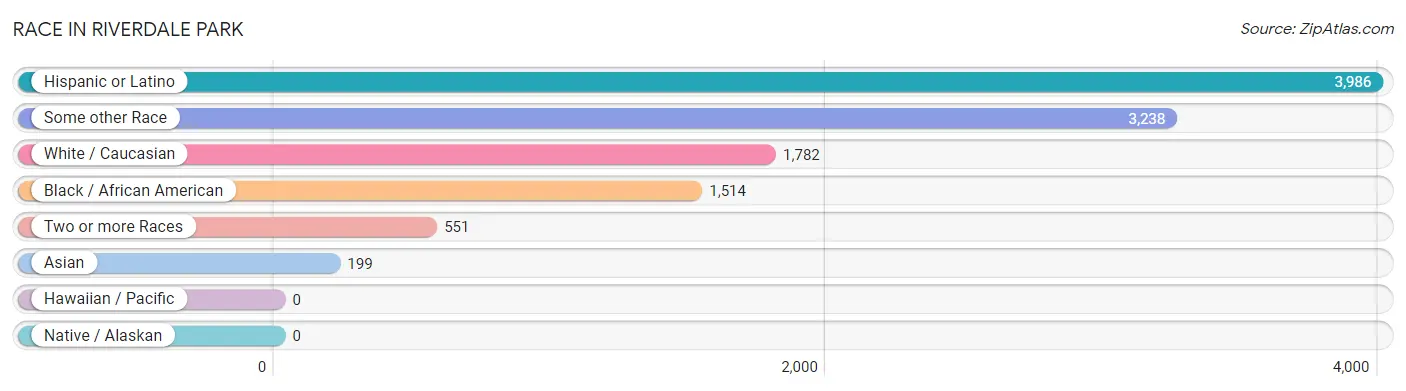
| Race | # Population | % Population |
| Asian | 199 | 2.7% |
| Black / African American | 1,514 | 20.8% |
| Hawaiian / Pacific | 0 | 0.0% |
| Hispanic or Latino | 3,986 | 54.7% |
| Native / Alaskan | 0 | 0.0% |
| White / Caucasian | 1,782 | 24.5% |
| Two or more Races | 551 | 7.6% |
| Some other Race | 3,238 | 44.5% |
| Total | 7,284 | 100.0% |
Ancestry in Riverdale Park
The most populous ancestries reported in Riverdale Park are Central American (2,208 | 30.3%), Mexican (1,484 | 20.4%), Salvadoran (1,220 | 16.8%), Guatemalan (907 | 12.4%), and Guyanese (294 | 4.0%), together accounting for 83.9% of all Riverdale Park residents.
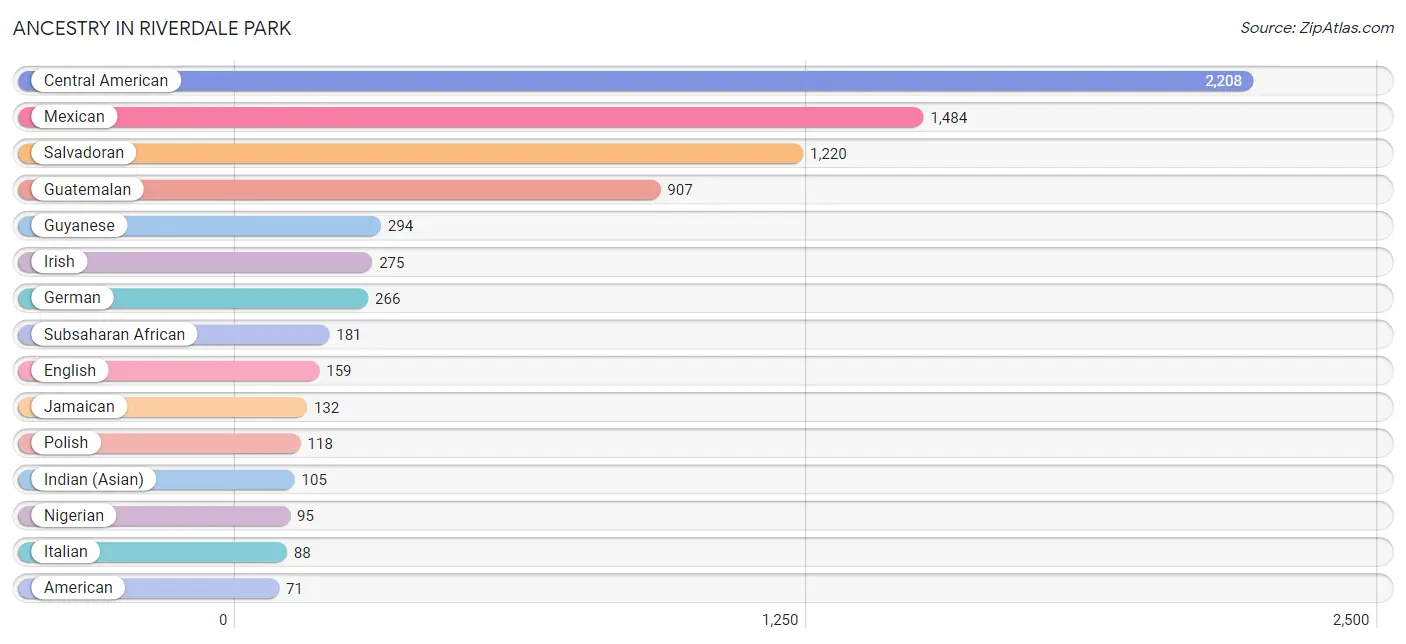
| Ancestry | # Population | % Population |
| Afghan | 29 | 0.4% |
| African | 39 | 0.5% |
| American | 71 | 1.0% |
| Australian | 4 | 0.1% |
| Bolivian | 25 | 0.3% |
| British | 18 | 0.3% |
| British West Indian | 21 | 0.3% |
| Burmese | 10 | 0.1% |
| Canadian | 22 | 0.3% |
| Central American | 2,208 | 30.3% |
| Central American Indian | 9 | 0.1% |
| Colombian | 24 | 0.3% |
| Czech | 4 | 0.1% |
| Dominican | 30 | 0.4% |
| Dutch | 11 | 0.2% |
| Eastern European | 10 | 0.1% |
| English | 159 | 2.2% |
| Ethiopian | 12 | 0.2% |
| European | 57 | 0.8% |
| Finnish | 14 | 0.2% |
| French | 57 | 0.8% |
| French Canadian | 16 | 0.2% |
| German | 266 | 3.6% |
| Greek | 32 | 0.4% |
| Guatemalan | 907 | 12.4% |
| Guyanese | 294 | 4.0% |
| Honduran | 47 | 0.6% |
| Indian (Asian) | 105 | 1.4% |
| Irish | 275 | 3.8% |
| Italian | 88 | 1.2% |
| Jamaican | 132 | 1.8% |
| Japanese | 5 | 0.1% |
| Korean | 6 | 0.1% |
| Laotian | 65 | 0.9% |
| Mexican | 1,484 | 20.4% |
| Nicaraguan | 34 | 0.5% |
| Nigerian | 95 | 1.3% |
| Northern European | 7 | 0.1% |
| Norwegian | 33 | 0.4% |
| Peruvian | 18 | 0.3% |
| Polish | 118 | 1.6% |
| Puerto Rican | 14 | 0.2% |
| Russian | 8 | 0.1% |
| Salvadoran | 1,220 | 16.8% |
| Scandinavian | 8 | 0.1% |
| Scotch-Irish | 18 | 0.3% |
| Scottish | 65 | 0.9% |
| Slovak | 22 | 0.3% |
| South American | 67 | 0.9% |
| Spanish | 18 | 0.3% |
| Sri Lankan | 52 | 0.7% |
| Subsaharan African | 181 | 2.5% |
| Swedish | 13 | 0.2% |
| Thai | 15 | 0.2% |
| Trinidadian and Tobagonian | 6 | 0.1% |
| Welsh | 48 | 0.7% |
| West Indian | 59 | 0.8% | View All 57 Rows |
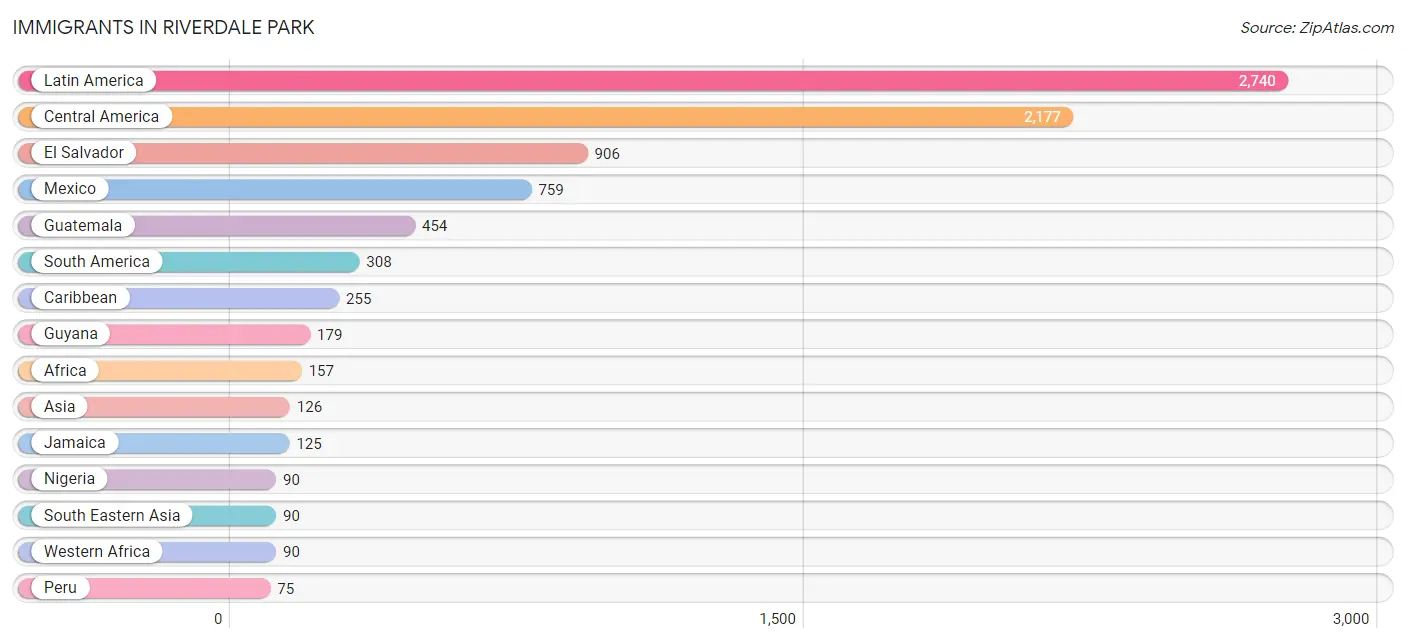
Immigrants in Riverdale Park
The most numerous immigrant groups reported in Riverdale Park came from Latin America (2,740 | 37.6%), Central America (2,177 | 29.9%), El Salvador (906 | 12.4%), Mexico (759 | 10.4%), and Guatemala (454 | 6.2%), together accounting for 96.6% of all Riverdale Park residents.
| Immigration Origin | # Population | % Population |
| Africa | 157 | 2.2% |
| Asia | 126 | 1.7% |
| Bolivia | 27 | 0.4% |
| Cambodia | 5 | 0.1% |
| Canada | 19 | 0.3% |
| Caribbean | 255 | 3.5% |
| Central America | 2,177 | 29.9% |
| China | 21 | 0.3% |
| Colombia | 24 | 0.3% |
| Dominican Republic | 64 | 0.9% |
| Eastern Africa | 4 | 0.1% |
| Eastern Asia | 21 | 0.3% |
| El Salvador | 906 | 12.4% |
| England | 7 | 0.1% |
| Eritrea | 4 | 0.1% |
| Europe | 35 | 0.5% |
| France | 18 | 0.3% |
| Grenada | 21 | 0.3% |
| Guatemala | 454 | 6.2% |
| Guyana | 179 | 2.5% |
| Honduras | 47 | 0.6% |
| India | 15 | 0.2% |
| Indonesia | 26 | 0.4% |
| Jamaica | 125 | 1.7% |
| Latin America | 2,740 | 37.6% |
| Mexico | 759 | 10.4% |
| Middle Africa | 63 | 0.9% |
| Nicaragua | 11 | 0.2% |
| Nigeria | 90 | 1.2% |
| Northern Europe | 13 | 0.2% |
| Peru | 75 | 1.0% |
| Philippines | 18 | 0.3% |
| South America | 308 | 4.2% |
| South Central Asia | 15 | 0.2% |
| South Eastern Asia | 90 | 1.2% |
| Southern Europe | 4 | 0.1% |
| Spain | 4 | 0.1% |
| Trinidad and Tobago | 45 | 0.6% |
| Venezuela | 3 | 0.0% |
| Vietnam | 41 | 0.6% |
| Western Africa | 90 | 1.2% |
| Western Europe | 18 | 0.3% | View All 42 Rows |
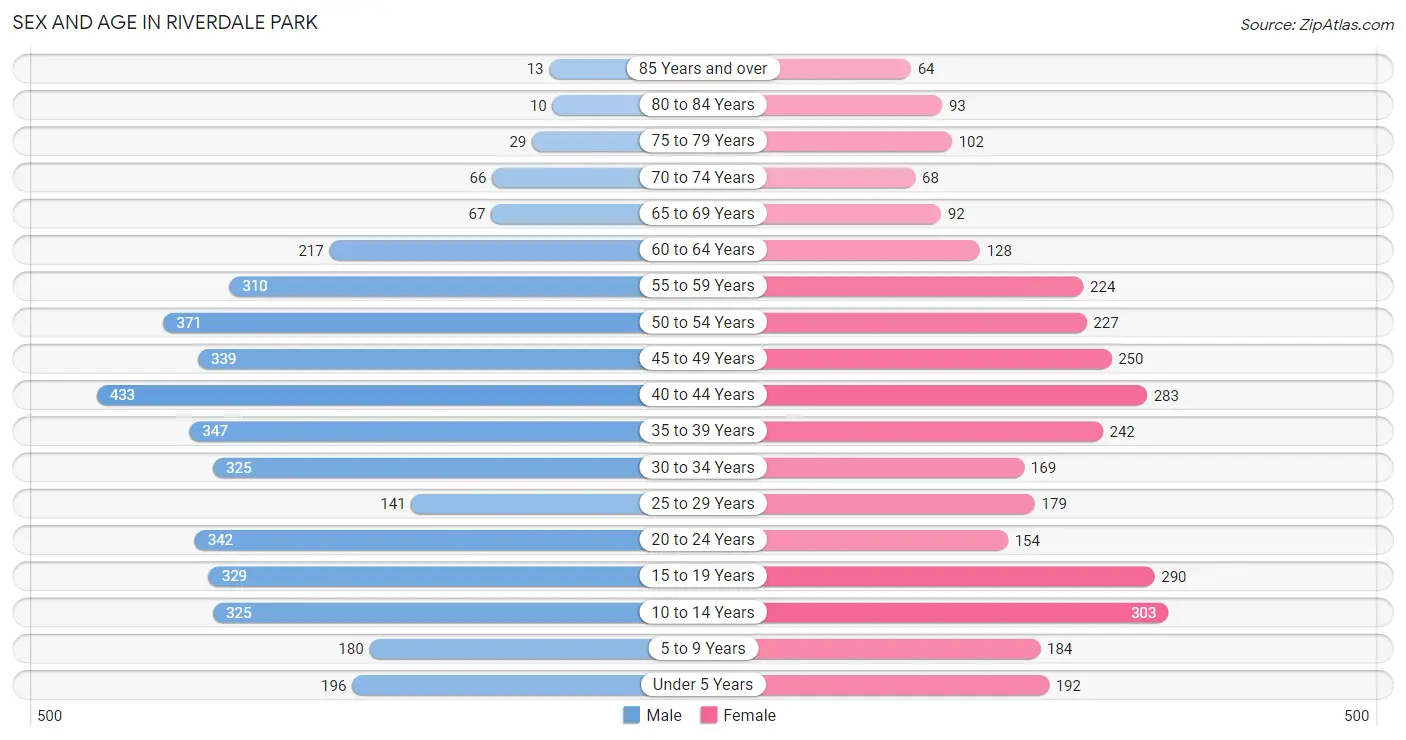
Sex and Age in Riverdale Park
Sex and Age in Riverdale Park
The most populous age groups in Riverdale Park are 40 to 44 Years (433 | 10.7%) for men and 10 to 14 Years (303 | 9.3%) for women.
| Age Bracket | Male | Female |
| Under 5 Years | 196 (4.9%) | 192 (5.9%) |
| 5 to 9 Years | 180 (4.5%) | 184 (5.7%) |
| 10 to 14 Years | 325 (8.0%) | 303 (9.3%) |
| 15 to 19 Years | 329 (8.1%) | 290 (8.9%) |
| 20 to 24 Years | 342 (8.5%) | 154 (4.8%) |
| 25 to 29 Years | 141 (3.5%) | 179 (5.5%) |
| 30 to 34 Years | 325 (8.0%) | 169 (5.2%) |
| 35 to 39 Years | 347 (8.6%) | 242 (7.5%) |
| 40 to 44 Years | 433 (10.7%) | 283 (8.7%) |
| 45 to 49 Years | 339 (8.4%) | 250 (7.7%) |
| 50 to 54 Years | 371 (9.2%) | 227 (7.0%) |
| 55 to 59 Years | 310 (7.7%) | 224 (6.9%) |
| 60 to 64 Years | 217 (5.4%) | 128 (4.0%) |
| 65 to 69 Years | 67 (1.7%) | 92 (2.8%) |
| 70 to 74 Years | 66 (1.6%) | 68 (2.1%) |
| 75 to 79 Years | 29 (0.7%) | 102 (3.1%) |
| 80 to 84 Years | 10 (0.3%) | 93 (2.9%) |
| 85 Years and over | 13 (0.3%) | 64 (2.0%) |
| Total | 4,040 (100.0%) | 3,244 (100.0%) |
Families and Households in Riverdale Park
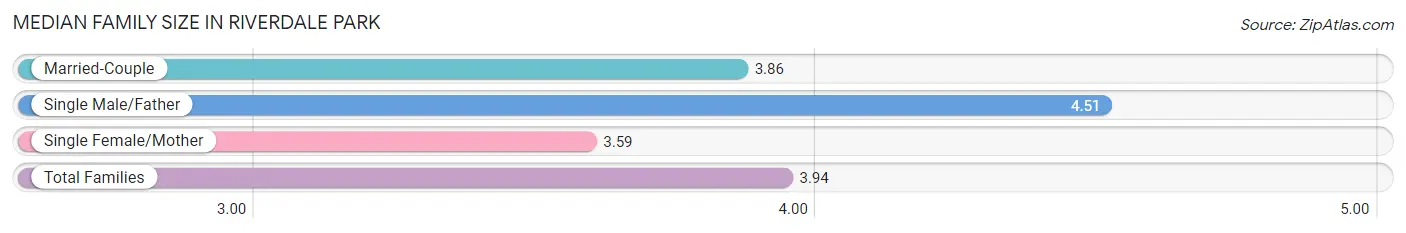
Median Family Size in Riverdale Park
The median family size in Riverdale Park is 3.94 persons per family, with single male/father families (261 | 17.0%) accounting for the largest median family size of 4.51 persons per family. On the other hand, single female/mother families (186 | 12.1%) represent the smallest median family size with 3.59 persons per family.
| Family Type | # Families | Family Size |
| Married-Couple | 1,088 (70.9%) | 3.86 |
| Single Male/Father | 261 (17.0%) | 4.51 |
| Single Female/Mother | 186 (12.1%) | 3.59 |
| Total Families | 1,535 (100.0%) | 3.94 |
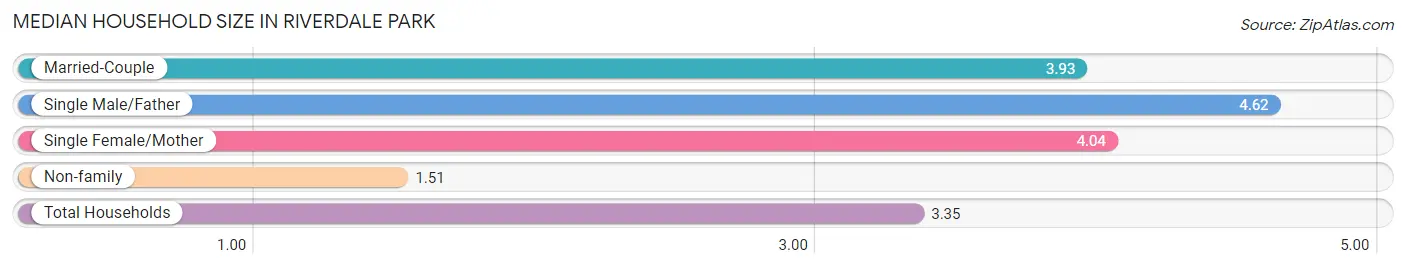
Median Household Size in Riverdale Park
The median household size in Riverdale Park is 3.35 persons per household, with single male/father households (261 | 12.3%) accounting for the largest median household size of 4.62 persons per household. non-family households (587 | 27.7%) represent the smallest median household size with 1.51 persons per household.
| Household Type | # Households | Household Size |
| Married-Couple | 1,088 (51.3%) | 3.93 |
| Single Male/Father | 261 (12.3%) | 4.62 |
| Single Female/Mother | 186 (8.8%) | 4.04 |
| Non-family | 587 (27.7%) | 1.51 |
| Total Households | 2,122 (100.0%) | 3.35 |
Household Size by Marriage Status in Riverdale Park
Out of a total of 2,122 households in Riverdale Park, 1,535 (72.3%) are family households, while 587 (27.7%) are nonfamily households. The most numerous type of family households are 3-person households, comprising 402, and the most common type of nonfamily households are 1-person households, comprising 464.
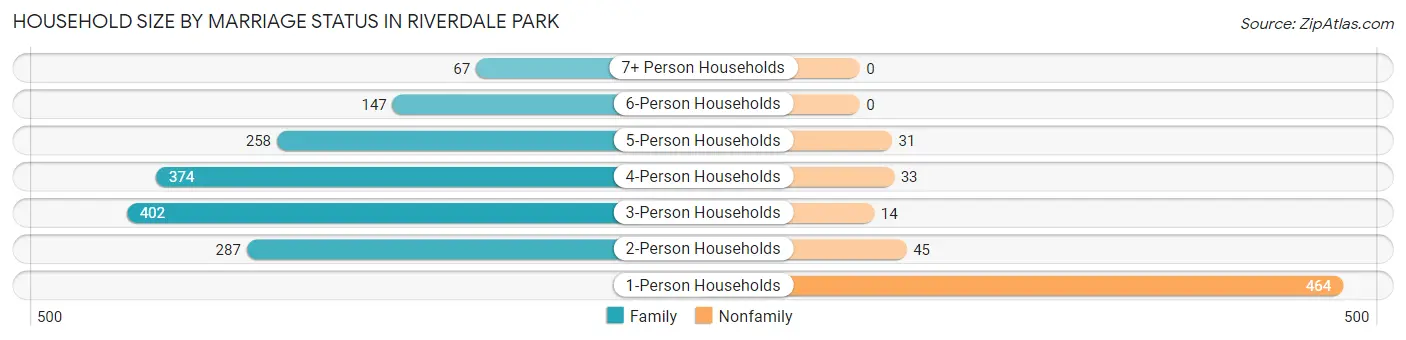
| Household Size | Family Households | Nonfamily Households |
| 1-Person Households | - | 464 (21.9%) |
| 2-Person Households | 287 (13.5%) | 45 (2.1%) |
| 3-Person Households | 402 (18.9%) | 14 (0.7%) |
| 4-Person Households | 374 (17.6%) | 33 (1.6%) |
| 5-Person Households | 258 (12.2%) | 31 (1.5%) |
| 6-Person Households | 147 (6.9%) | 0 (0.0%) |
| 7+ Person Households | 67 (3.2%) | 0 (0.0%) |
| Total | 1,535 (72.3%) | 587 (27.7%) |
Female Fertility in Riverdale Park
Fertility by Age in Riverdale Park
Average fertility rate in Riverdale Park is 73.0 births per 1,000 women. Women in the age bracket of 20 to 34 years have the highest fertility rate with 141.0 births per 1,000 women. Women in the age bracket of 20 to 34 years acount for 61.7% of all women with births.
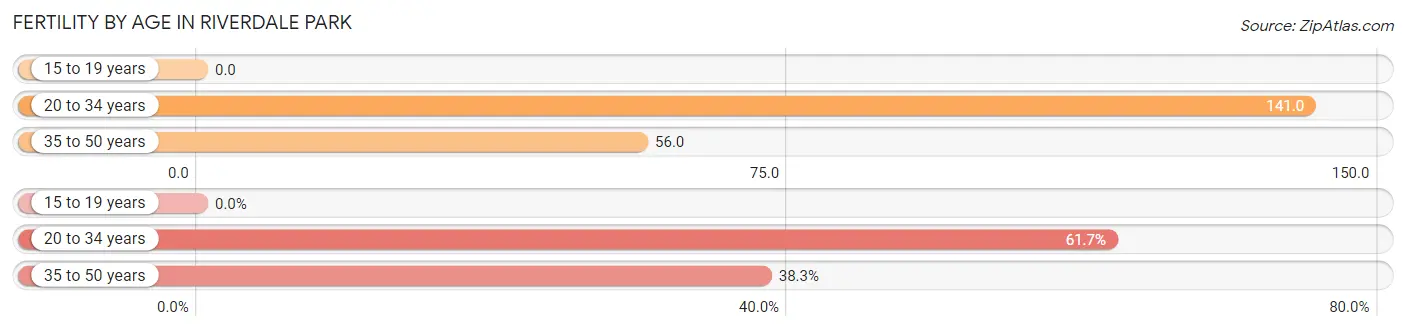
| Age Bracket | Women with Births | Births / 1,000 Women |
| 15 to 19 years | 0 (0.0%) | 0.0 |
| 20 to 34 years | 71 (61.7%) | 141.0 |
| 35 to 50 years | 44 (38.3%) | 56.0 |
| Total | 115 (100.0%) | 73.0 |
Fertility by Age by Marriage Status in Riverdale Park
83.5% of women with births (115) in Riverdale Park are married. The highest percentage of unmarried women with births falls into 20 to 34 years age bracket with 26.8% of them unmarried at the time of birth, while the lowest percentage of unmarried women with births belong to 35 to 50 years age bracket with 0.0% of them unmarried.
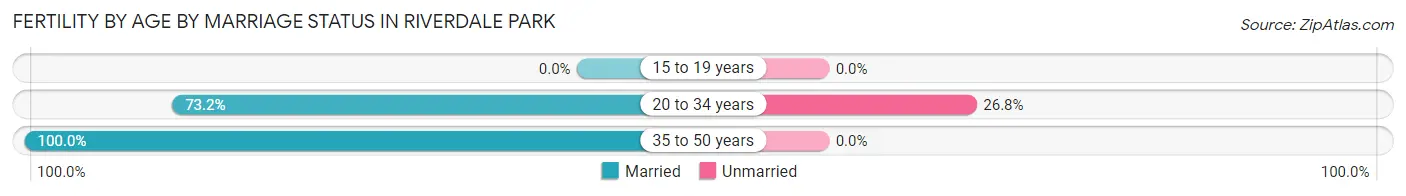
| Age Bracket | Married | Unmarried |
| 15 to 19 years | 0 (0.0%) | 0 (0.0%) |
| 20 to 34 years | 52 (73.2%) | 19 (26.8%) |
| 35 to 50 years | 44 (100.0%) | 0 (0.0%) |
| Total | 96 (83.5%) | 19 (16.5%) |
Fertility by Education in Riverdale Park
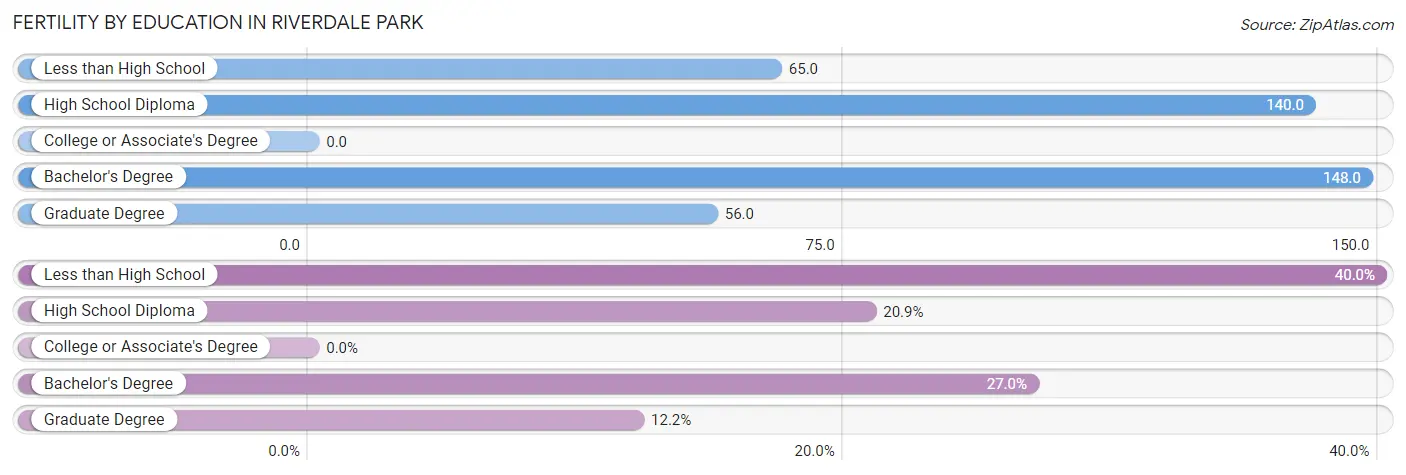
| Educational Attainment | Women with Births | Births / 1,000 Women |
| Less than High School | 46 (40.0%) | 65.0 |
| High School Diploma | 24 (20.9%) | 140.0 |
| College or Associate's Degree | 0 (0.0%) | 0.0 |
| Bachelor's Degree | 31 (27.0%) | 148.0 |
| Graduate Degree | 14 (12.2%) | 56.0 |
| Total | 115 (100.0%) | 73.0 |
Fertility by Education by Marriage Status in Riverdale Park
16.5% of women with births in Riverdale Park are unmarried. Women with the educational attainment of less than high school are most likely to be married with 100.0% of them married at childbirth, while women with the educational attainment of high school diploma are least likely to be married with 79.2% of them unmarried at childbirth.
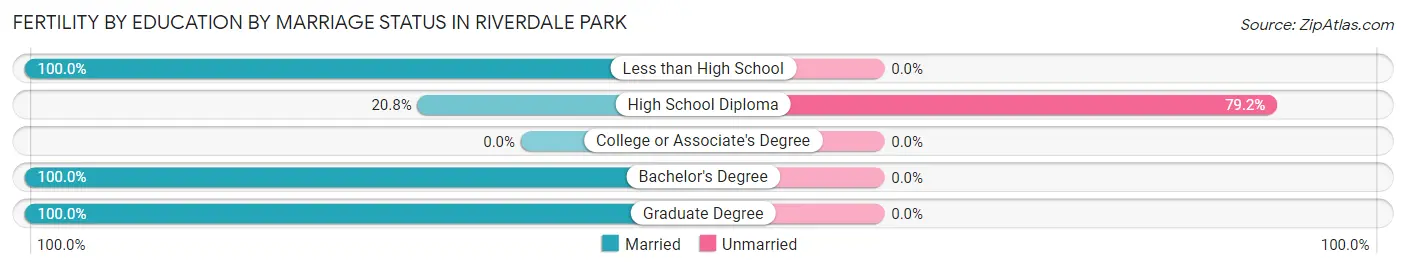
| Educational Attainment | Married | Unmarried |
| Less than High School | 46 (100.0%) | 0 (0.0%) |
| High School Diploma | 5 (20.8%) | 19 (79.2%) |
| College or Associate's Degree | 0 (0.0%) | 0 (0.0%) |
| Bachelor's Degree | 31 (100.0%) | 0 (0.0%) |
| Graduate Degree | 14 (100.0%) | 0 (0.0%) |
| Total | 96 (83.5%) | 19 (16.5%) |
Employment Characteristics in Riverdale Park
Employment by Class of Employer in Riverdale Park
Among the 3,998 employed individuals in Riverdale Park, private company employees (2,628 | 65.7%), not-for-profit organizations (409 | 10.2%), and federal government employees (373 | 9.3%) make up the most common classes of employment.
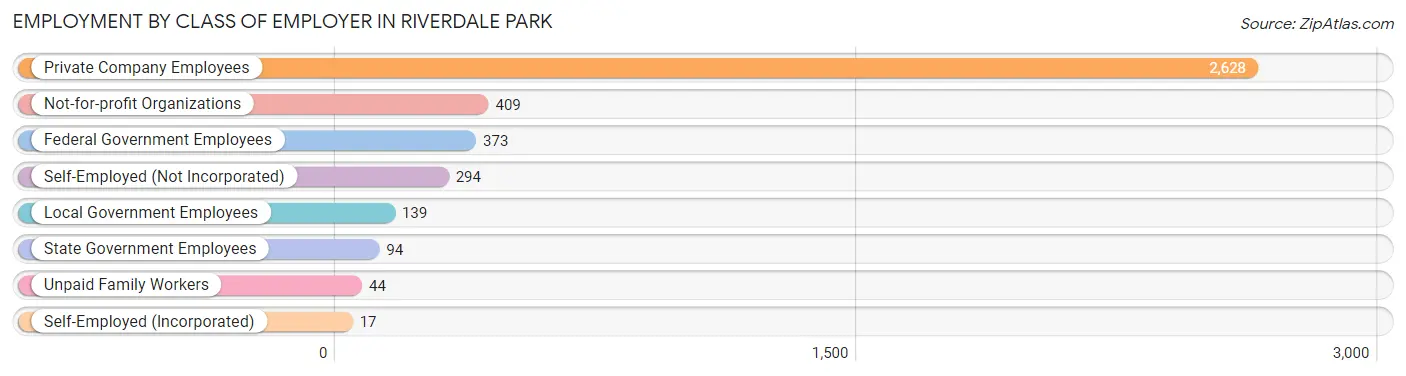
| Employer Class | # Employees | % Employees |
| Private Company Employees | 2,628 | 65.7% |
| Self-Employed (Incorporated) | 17 | 0.4% |
| Self-Employed (Not Incorporated) | 294 | 7.3% |
| Not-for-profit Organizations | 409 | 10.2% |
| Local Government Employees | 139 | 3.5% |
| State Government Employees | 94 | 2.4% |
| Federal Government Employees | 373 | 9.3% |
| Unpaid Family Workers | 44 | 1.1% |
| Total | 3,998 | 100.0% |
Employment Status by Age in Riverdale Park
According to the labor force statistics for Riverdale Park, out of the total population over 16 years of age (5,821), 71.7% or 4,174 individuals are in the labor force, with 3.6% or 150 of them unemployed. The age group with the highest labor force participation rate is 45 to 54 years, with 92.6% or 1,099 individuals in the labor force. Within the labor force, the 20 to 24 years age range has the highest percentage of unemployed individuals, with 12.4% or 42 of them being unemployed.
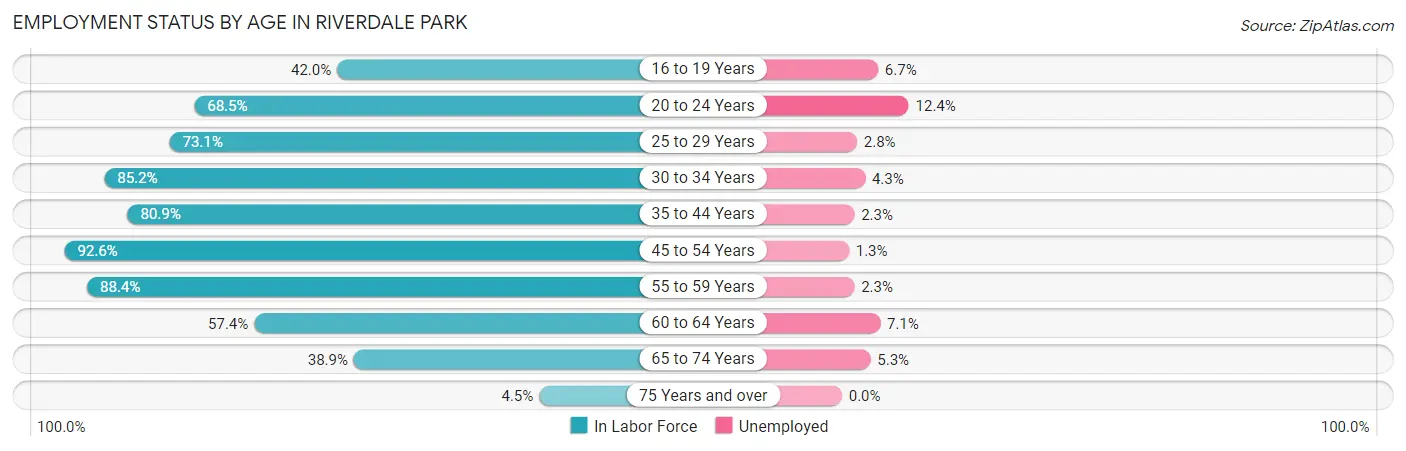
| Age Bracket | In Labor Force | Unemployed |
| 16 to 19 Years | 225 (42.0%) | 15 (6.7%) |
| 20 to 24 Years | 340 (68.5%) | 42 (12.4%) |
| 25 to 29 Years | 234 (73.1%) | 7 (2.8%) |
| 30 to 34 Years | 421 (85.2%) | 18 (4.3%) |
| 35 to 44 Years | 1,056 (80.9%) | 24 (2.3%) |
| 45 to 54 Years | 1,099 (92.6%) | 14 (1.3%) |
| 55 to 59 Years | 472 (88.4%) | 11 (2.3%) |
| 60 to 64 Years | 198 (57.4%) | 14 (7.1%) |
| 65 to 74 Years | 114 (38.9%) | 6 (5.3%) |
| 75 Years and over | 14 (4.5%) | 0 (0.0%) |
| Total | 4,174 (71.7%) | 150 (3.6%) |
Employment Status by Educational Attainment in Riverdale Park
According to labor force statistics for Riverdale Park, 83.2% of individuals (3,482) out of the total population between 25 and 64 years of age (4,185) are in the labor force, with 2.5% or 87 of them being unemployed. The group with the highest labor force participation rate are those with the educational attainment of bachelor's degree or higher, with 90.8% or 1,150 individuals in the labor force. Within the labor force, individuals with bachelor's degree or higher education have the highest percentage of unemployment, with 3.9% or 45 of them being unemployed.
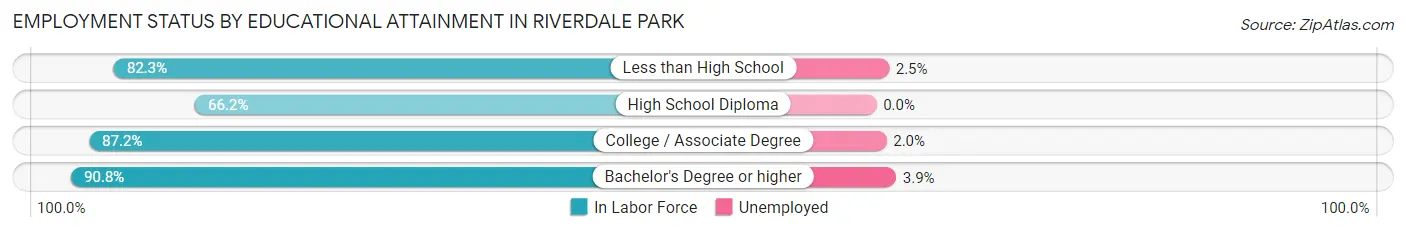
| Educational Attainment | In Labor Force | Unemployed |
| Less than High School | 1,178 (82.3%) | 36 (2.5%) |
| High School Diploma | 457 (66.2%) | 0 (0.0%) |
| College / Associate Degree | 696 (87.2%) | 16 (2.0%) |
| Bachelor's Degree or higher | 1,150 (90.8%) | 49 (3.9%) |
| Total | 3,482 (83.2%) | 105 (2.5%) |
Employment Occupations by Sex in Riverdale Park
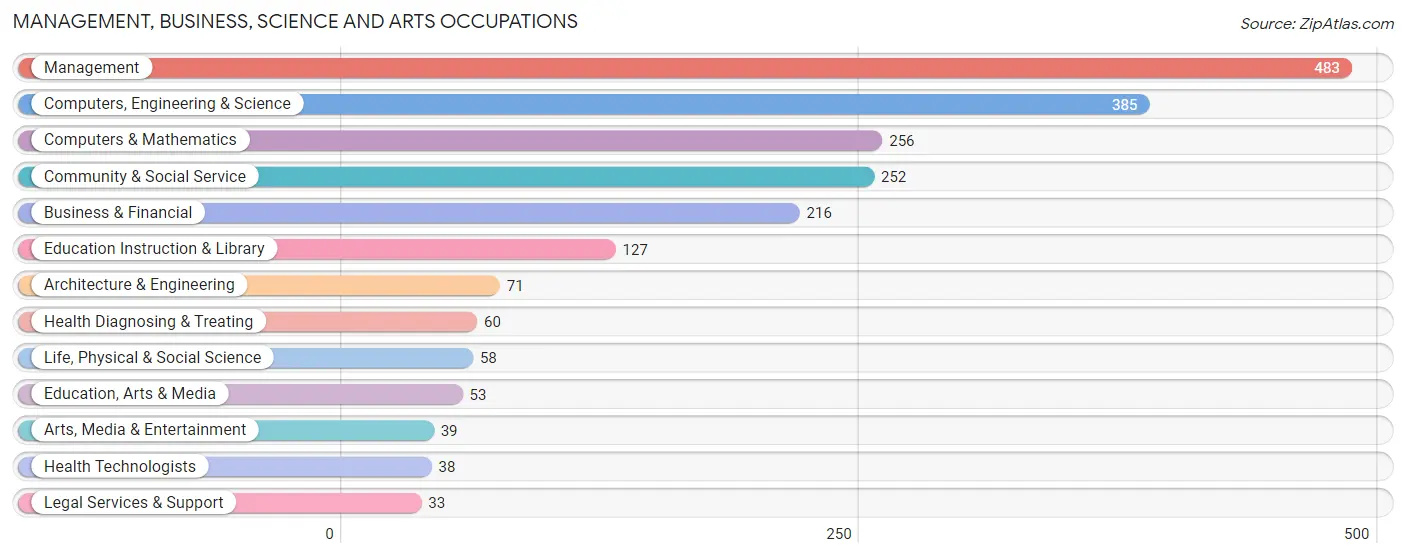
Management, Business, Science and Arts Occupations
The most common Management, Business, Science and Arts occupations in Riverdale Park are Management (483 | 12.2%), Computers, Engineering & Science (385 | 9.7%), Computers & Mathematics (256 | 6.5%), Community & Social Service (252 | 6.3%), and Business & Financial (216 | 5.4%).
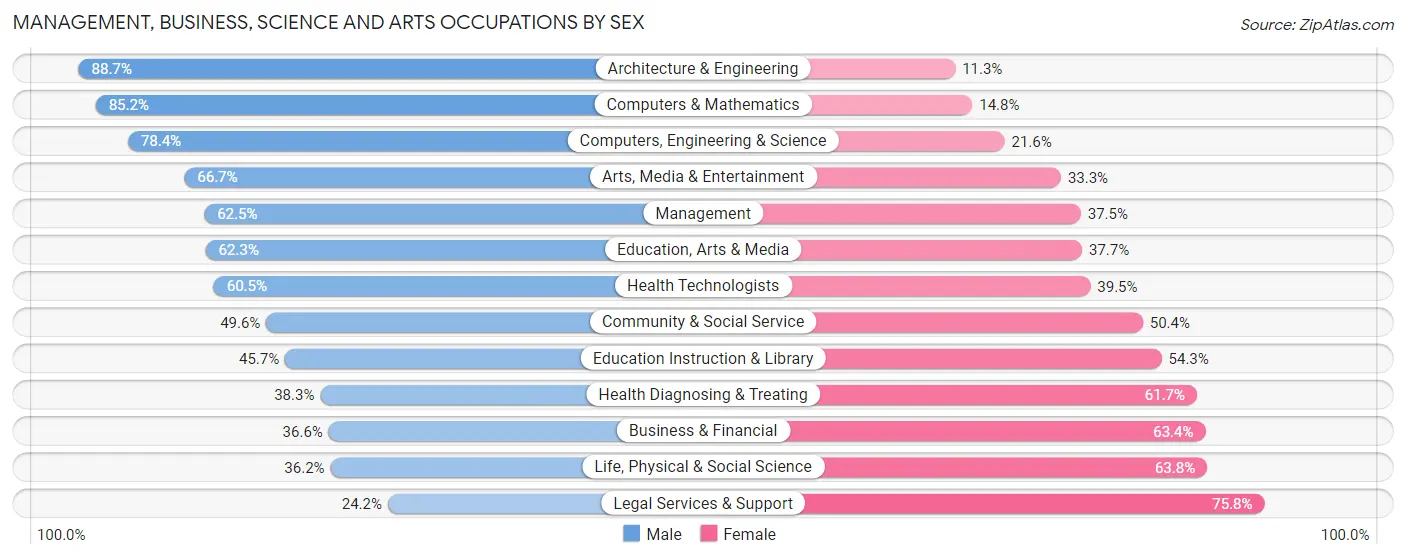
Management, Business, Science and Arts Occupations by Sex
Within the Management, Business, Science and Arts occupations in Riverdale Park, the most male-oriented occupations are Architecture & Engineering (88.7%), Computers & Mathematics (85.2%), and Computers, Engineering & Science (78.4%), while the most female-oriented occupations are Legal Services & Support (75.8%), Life, Physical & Social Science (63.8%), and Business & Financial (63.4%).
| Occupation | Male | Female |
| Management | 302 (62.5%) | 181 (37.5%) |
| Business & Financial | 79 (36.6%) | 137 (63.4%) |
| Computers, Engineering & Science | 302 (78.4%) | 83 (21.6%) |
| Computers & Mathematics | 218 (85.2%) | 38 (14.8%) |
| Architecture & Engineering | 63 (88.7%) | 8 (11.3%) |
| Life, Physical & Social Science | 21 (36.2%) | 37 (63.8%) |
| Community & Social Service | 125 (49.6%) | 127 (50.4%) |
| Education, Arts & Media | 33 (62.3%) | 20 (37.7%) |
| Legal Services & Support | 8 (24.2%) | 25 (75.8%) |
| Education Instruction & Library | 58 (45.7%) | 69 (54.3%) |
| Arts, Media & Entertainment | 26 (66.7%) | 13 (33.3%) |
| Health Diagnosing & Treating | 23 (38.3%) | 37 (61.7%) |
| Health Technologists | 23 (60.5%) | 15 (39.5%) |
| Total (Category) | 831 (59.5%) | 565 (40.5%) |
| Total (Overall) | 2,505 (63.1%) | 1,467 (36.9%) |
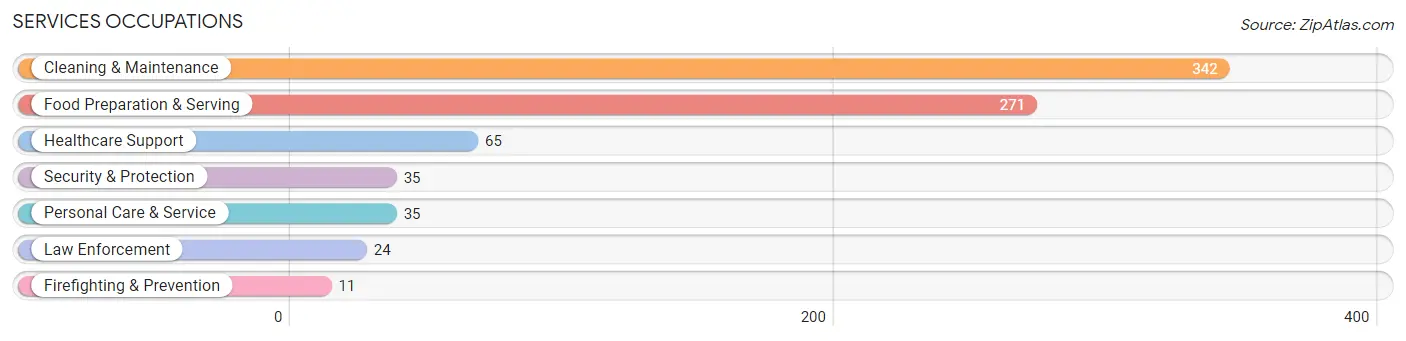
Services Occupations
The most common Services occupations in Riverdale Park are Cleaning & Maintenance (342 | 8.6%), Food Preparation & Serving (271 | 6.8%), Healthcare Support (65 | 1.6%), Security & Protection (35 | 0.9%), and Personal Care & Service (35 | 0.9%).
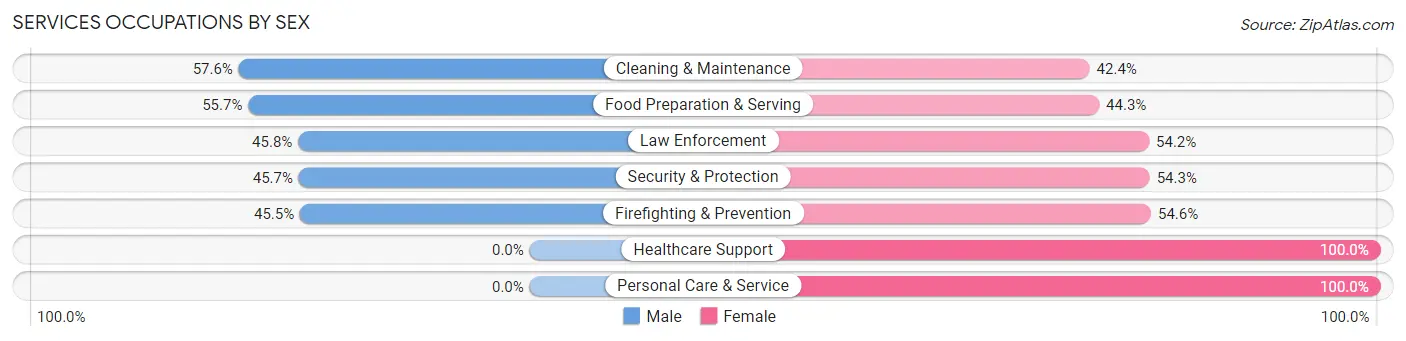
Services Occupations by Sex
Within the Services occupations in Riverdale Park, the most male-oriented occupations are Cleaning & Maintenance (57.6%), Food Preparation & Serving (55.7%), and Law Enforcement (45.8%), while the most female-oriented occupations are Healthcare Support (100.0%), Personal Care & Service (100.0%), and Firefighting & Prevention (54.5%).
| Occupation | Male | Female |
| Healthcare Support | 0 (0.0%) | 65 (100.0%) |
| Security & Protection | 16 (45.7%) | 19 (54.3%) |
| Firefighting & Prevention | 5 (45.5%) | 6 (54.5%) |
| Law Enforcement | 11 (45.8%) | 13 (54.2%) |
| Food Preparation & Serving | 151 (55.7%) | 120 (44.3%) |
| Cleaning & Maintenance | 197 (57.6%) | 145 (42.4%) |
| Personal Care & Service | 0 (0.0%) | 35 (100.0%) |
| Total (Category) | 364 (48.7%) | 384 (51.3%) |
| Total (Overall) | 2,505 (63.1%) | 1,467 (36.9%) |
Sales and Office Occupations
The most common Sales and Office occupations in Riverdale Park are Sales & Related (375 | 9.4%), and Office & Administration (217 | 5.5%).
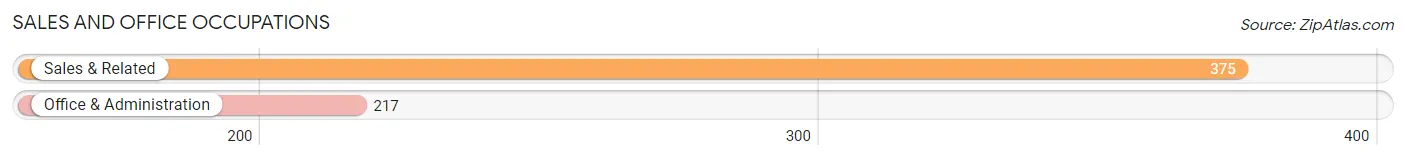
Sales and Office Occupations by Sex
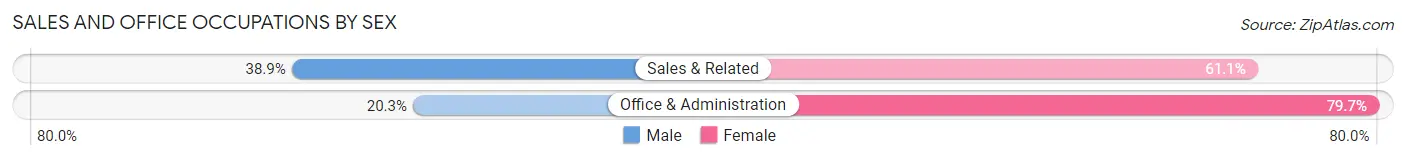
| Occupation | Male | Female |
| Sales & Related | 146 (38.9%) | 229 (61.1%) |
| Office & Administration | 44 (20.3%) | 173 (79.7%) |
| Total (Category) | 190 (32.1%) | 402 (67.9%) |
| Total (Overall) | 2,505 (63.1%) | 1,467 (36.9%) |
Natural Resources, Construction and Maintenance Occupations
The most common Natural Resources, Construction and Maintenance occupations in Riverdale Park are Construction & Extraction (771 | 19.4%), and Installation, Maintenance & Repair (76 | 1.9%).
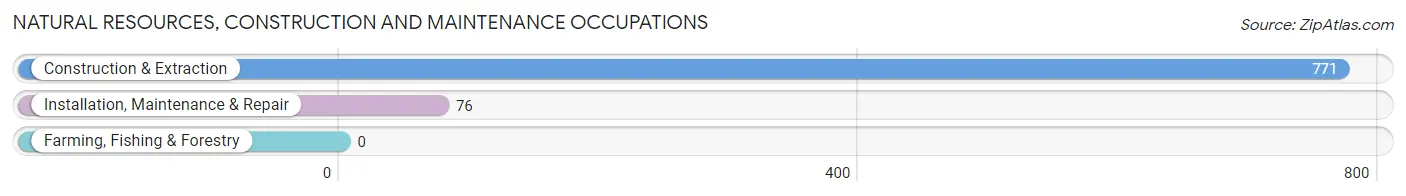
Natural Resources, Construction and Maintenance Occupations by Sex
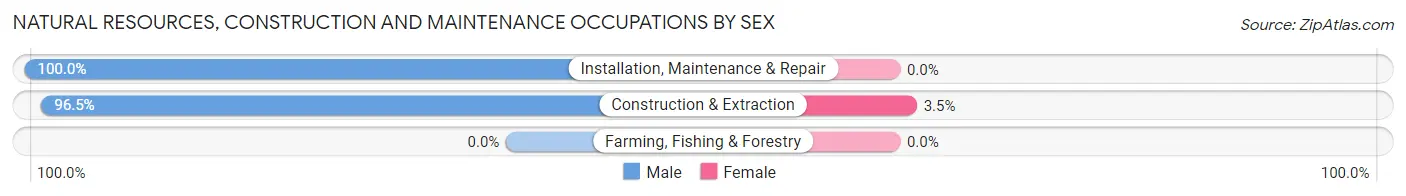
| Occupation | Male | Female |
| Farming, Fishing & Forestry | 0 (0.0%) | 0 (0.0%) |
| Construction & Extraction | 744 (96.5%) | 27 (3.5%) |
| Installation, Maintenance & Repair | 76 (100.0%) | 0 (0.0%) |
| Total (Category) | 820 (96.8%) | 27 (3.2%) |
| Total (Overall) | 2,505 (63.1%) | 1,467 (36.9%) |
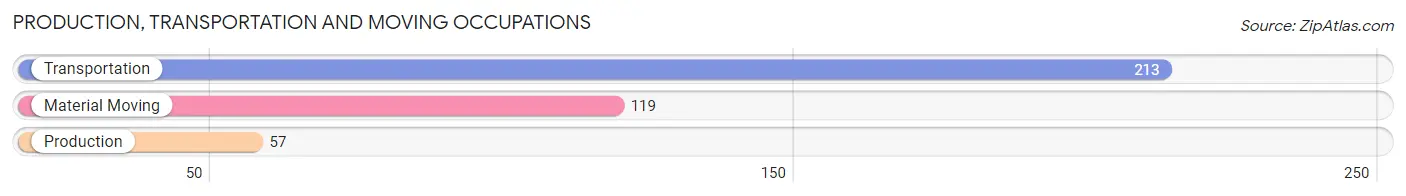
Production, Transportation and Moving Occupations
The most common Production, Transportation and Moving occupations in Riverdale Park are Transportation (213 | 5.4%), Material Moving (119 | 3.0%), and Production (57 | 1.4%).
Production, Transportation and Moving Occupations by Sex
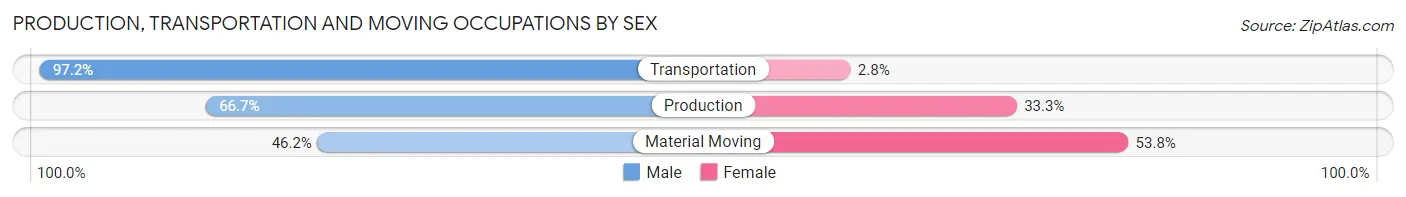
| Occupation | Male | Female |
| Production | 38 (66.7%) | 19 (33.3%) |
| Transportation | 207 (97.2%) | 6 (2.8%) |
| Material Moving | 55 (46.2%) | 64 (53.8%) |
| Total (Category) | 300 (77.1%) | 89 (22.9%) |
| Total (Overall) | 2,505 (63.1%) | 1,467 (36.9%) |
Employment Industries by Sex in Riverdale Park
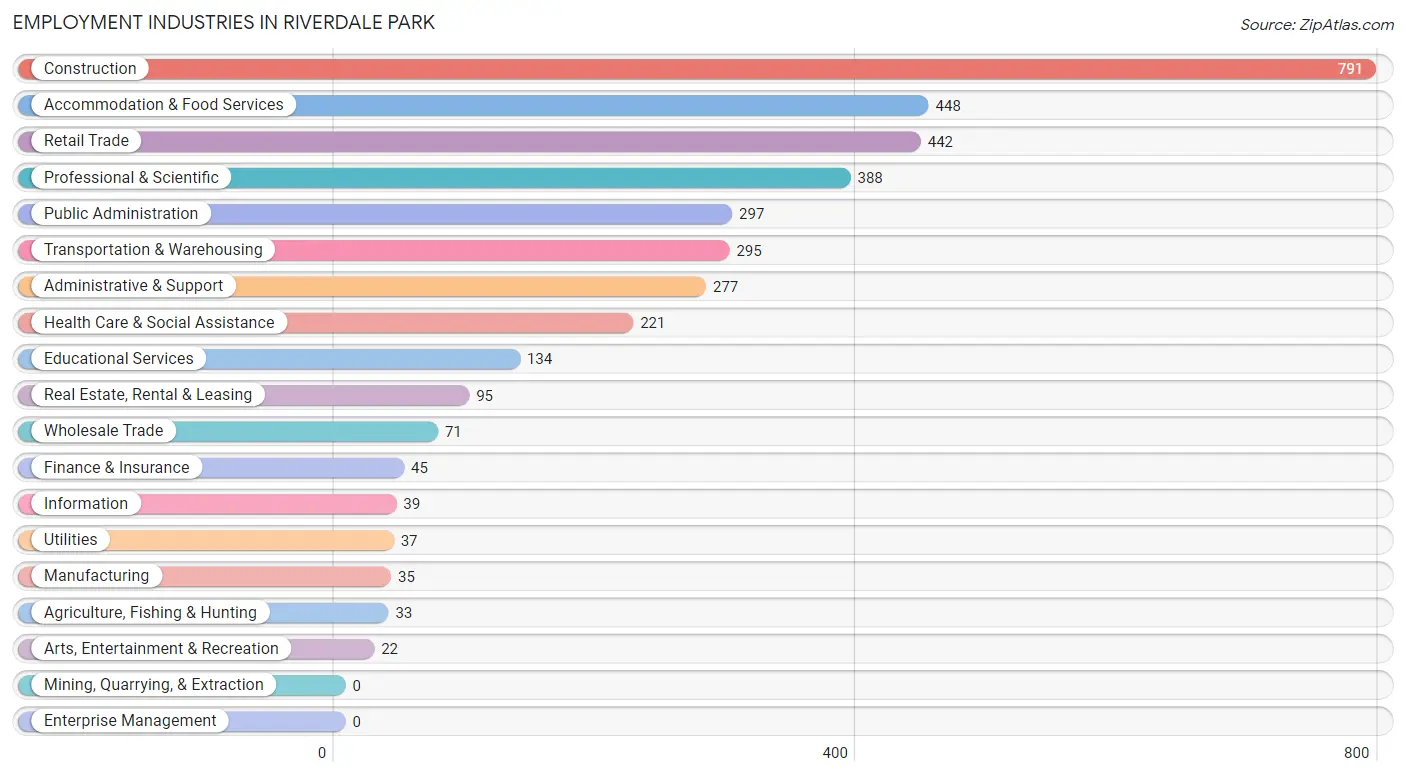
Employment Industries in Riverdale Park
The major employment industries in Riverdale Park include Construction (791 | 19.9%), Accommodation & Food Services (448 | 11.3%), Retail Trade (442 | 11.1%), Professional & Scientific (388 | 9.8%), and Public Administration (297 | 7.5%).
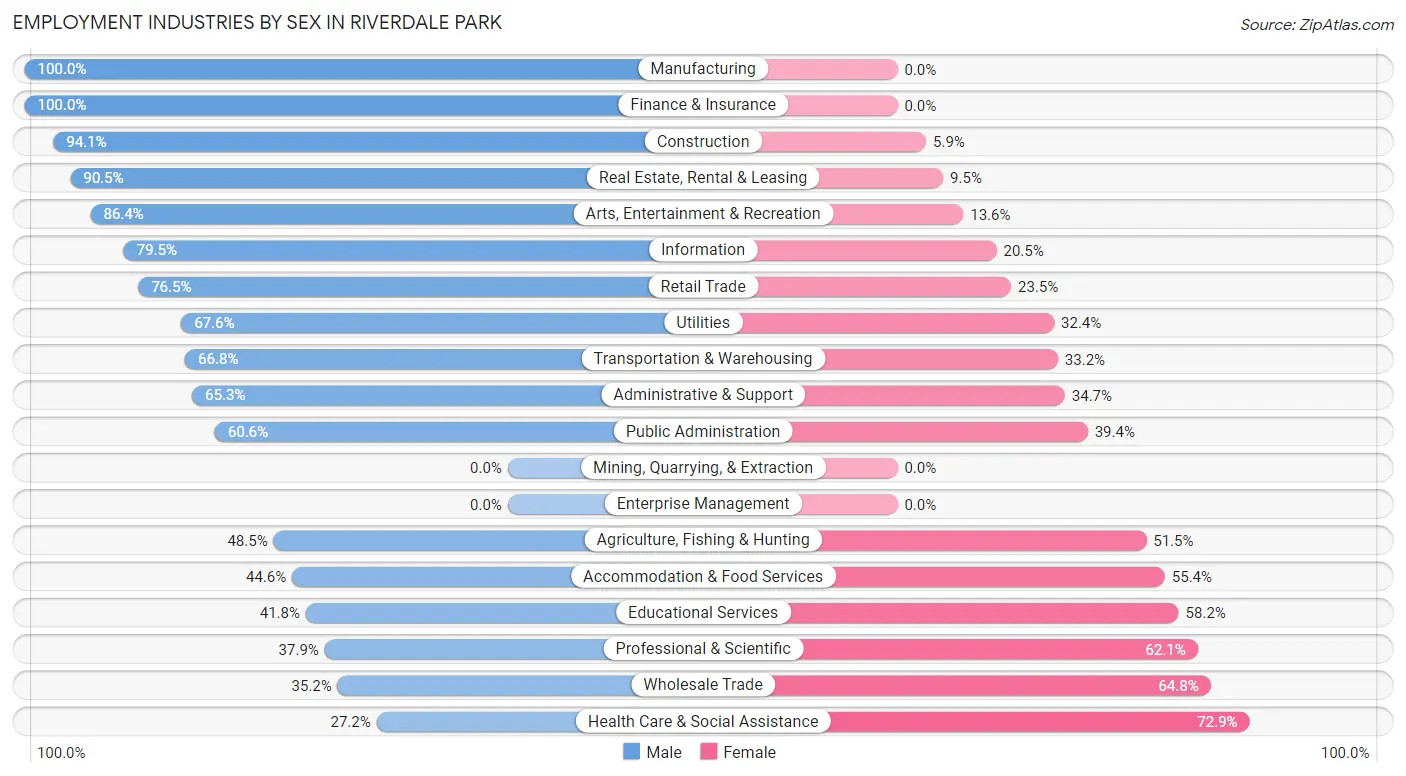
Employment Industries by Sex in Riverdale Park
The Riverdale Park industries that see more men than women are Manufacturing (100.0%), Finance & Insurance (100.0%), and Construction (94.1%), whereas the industries that tend to have a higher number of women are Health Care & Social Assistance (72.9%), Wholesale Trade (64.8%), and Professional & Scientific (62.1%).
| Industry | Male | Female |
| Agriculture, Fishing & Hunting | 16 (48.5%) | 17 (51.5%) |
| Mining, Quarrying, & Extraction | 0 (0.0%) | 0 (0.0%) |
| Construction | 744 (94.1%) | 47 (5.9%) |
| Manufacturing | 35 (100.0%) | 0 (0.0%) |
| Wholesale Trade | 25 (35.2%) | 46 (64.8%) |
| Retail Trade | 338 (76.5%) | 104 (23.5%) |
| Transportation & Warehousing | 197 (66.8%) | 98 (33.2%) |
| Utilities | 25 (67.6%) | 12 (32.4%) |
| Information | 31 (79.5%) | 8 (20.5%) |
| Finance & Insurance | 45 (100.0%) | 0 (0.0%) |
| Real Estate, Rental & Leasing | 86 (90.5%) | 9 (9.5%) |
| Professional & Scientific | 147 (37.9%) | 241 (62.1%) |
| Enterprise Management | 0 (0.0%) | 0 (0.0%) |
| Administrative & Support | 181 (65.3%) | 96 (34.7%) |
| Educational Services | 56 (41.8%) | 78 (58.2%) |
| Health Care & Social Assistance | 60 (27.2%) | 161 (72.9%) |
| Arts, Entertainment & Recreation | 19 (86.4%) | 3 (13.6%) |
| Accommodation & Food Services | 200 (44.6%) | 248 (55.4%) |
| Public Administration | 180 (60.6%) | 117 (39.4%) |
| Total | 2,505 (63.1%) | 1,467 (36.9%) |
Education in Riverdale Park
School Enrollment in Riverdale Park
The most common levels of schooling among the 1,677 students in Riverdale Park are high school (443 | 26.4%), elementary school (403 | 24.0%), and middle school (397 | 23.7%).
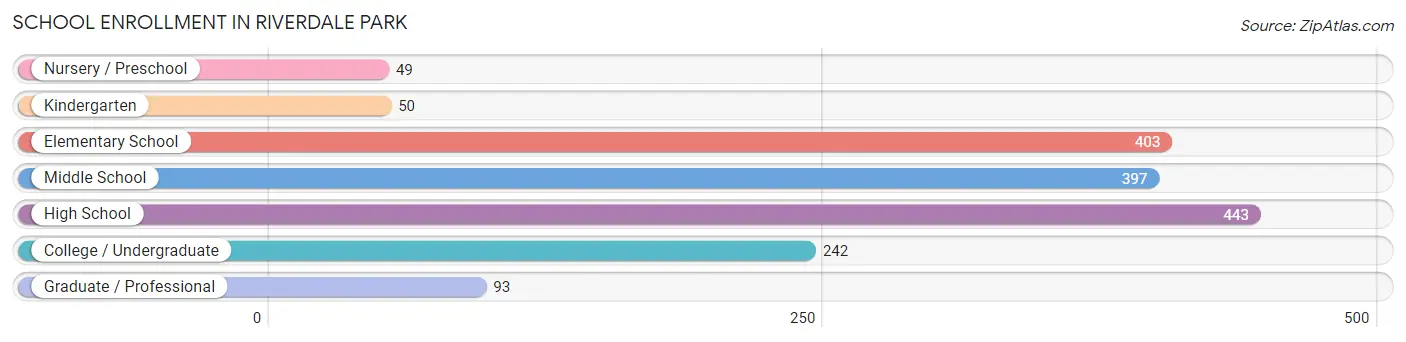
| School Level | # Students | % Students |
| Nursery / Preschool | 49 | 2.9% |
| Kindergarten | 50 | 3.0% |
| Elementary School | 403 | 24.0% |
| Middle School | 397 | 23.7% |
| High School | 443 | 26.4% |
| College / Undergraduate | 242 | 14.4% |
| Graduate / Professional | 93 | 5.6% |
| Total | 1,677 | 100.0% |
School Enrollment by Age by Funding Source in Riverdale Park
Out of a total of 1,677 students who are enrolled in schools in Riverdale Park, 230 (13.7%) attend a private institution, while the remaining 1,447 (86.3%) are enrolled in public schools. The age group of 18 to 19 year olds has the highest likelihood of being enrolled in private schools, with 42 (33.9% in the age bracket) enrolled. Conversely, the age group of 5 to 9 year old has the lowest likelihood of being enrolled in a private school, with 295 (98.3% in the age bracket) attending a public institution.
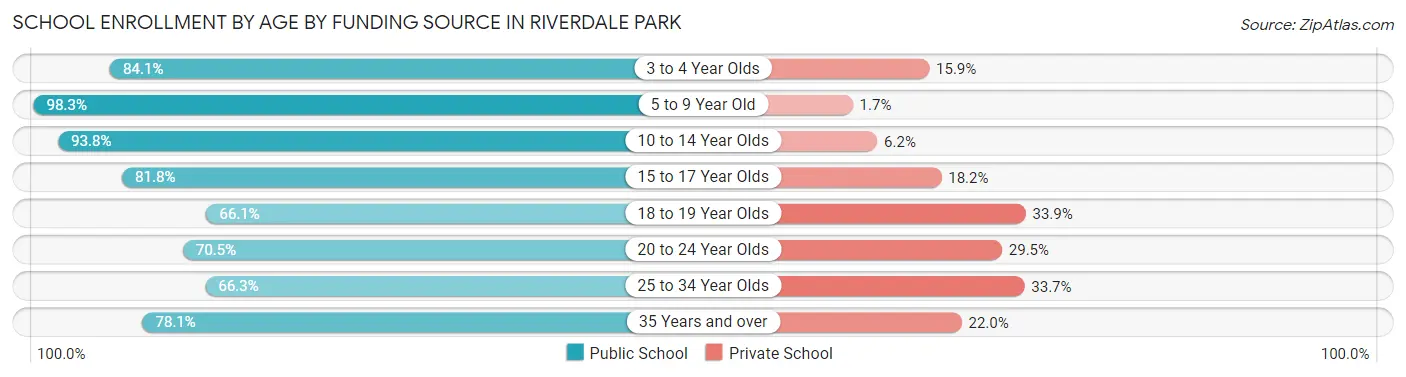
| Age Bracket | Public School | Private School |
| 3 to 4 Year Olds | 37 (84.1%) | 7 (15.9%) |
| 5 to 9 Year Old | 295 (98.3%) | 5 (1.7%) |
| 10 to 14 Year Olds | 571 (93.8%) | 38 (6.2%) |
| 15 to 17 Year Olds | 297 (81.8%) | 66 (18.2%) |
| 18 to 19 Year Olds | 82 (66.1%) | 42 (33.9%) |
| 20 to 24 Year Olds | 67 (70.5%) | 28 (29.5%) |
| 25 to 34 Year Olds | 67 (66.3%) | 34 (33.7%) |
| 35 Years and over | 32 (78.0%) | 9 (22.0%) |
| Total | 1,447 (86.3%) | 230 (13.7%) |
Educational Attainment by Field of Study in Riverdale Park
Social sciences (251 | 16.8%), business (229 | 15.3%), engineering (133 | 8.9%), visual & performing arts (120 | 8.0%), and liberal arts & history (102 | 6.8%) are the most common fields of study among 1,496 individuals in Riverdale Park who have obtained a bachelor's degree or higher.
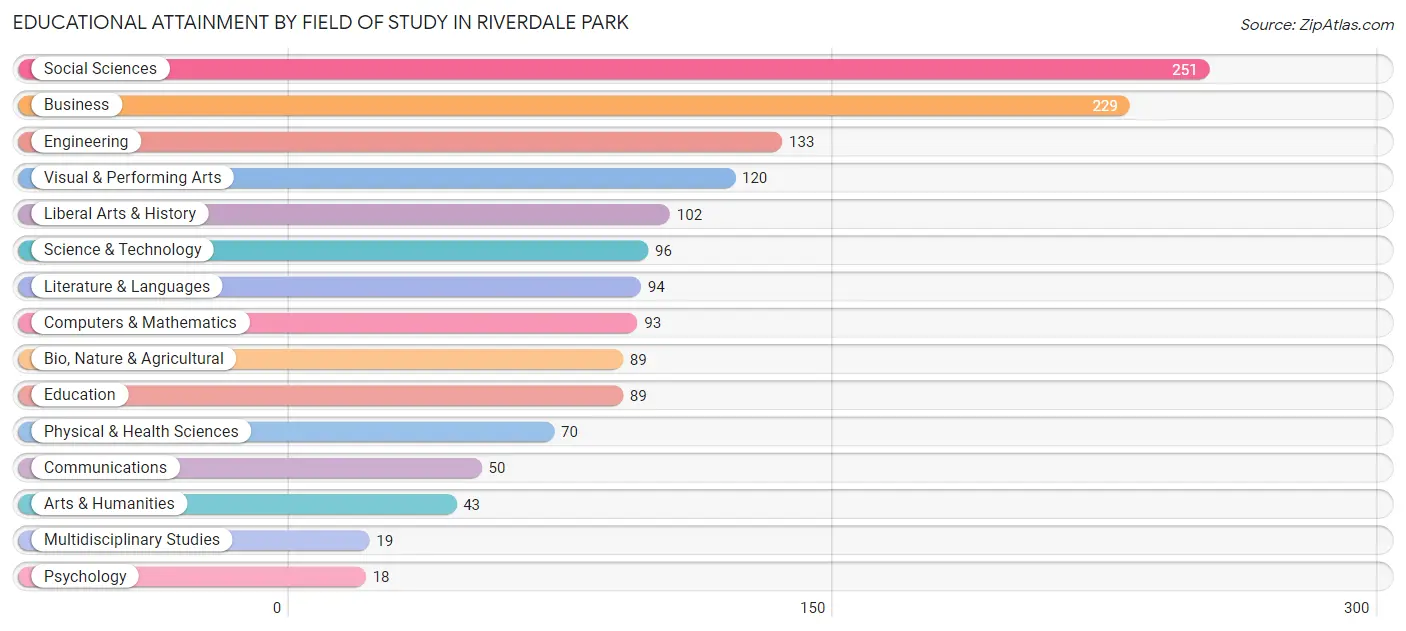
| Field of Study | # Graduates | % Graduates |
| Computers & Mathematics | 93 | 6.2% |
| Bio, Nature & Agricultural | 89 | 5.9% |
| Physical & Health Sciences | 70 | 4.7% |
| Psychology | 18 | 1.2% |
| Social Sciences | 251 | 16.8% |
| Engineering | 133 | 8.9% |
| Multidisciplinary Studies | 19 | 1.3% |
| Science & Technology | 96 | 6.4% |
| Business | 229 | 15.3% |
| Education | 89 | 5.9% |
| Literature & Languages | 94 | 6.3% |
| Liberal Arts & History | 102 | 6.8% |
| Visual & Performing Arts | 120 | 8.0% |
| Communications | 50 | 3.3% |
| Arts & Humanities | 43 | 2.9% |
| Total | 1,496 | 100.0% |
Transportation & Commute in Riverdale Park
Vehicle Availability by Sex in Riverdale Park
The most prevalent vehicle ownership categories in Riverdale Park are males with 2 vehicles (756, accounting for 30.0%) and females with 2 vehicles (571, making up 51.3%).
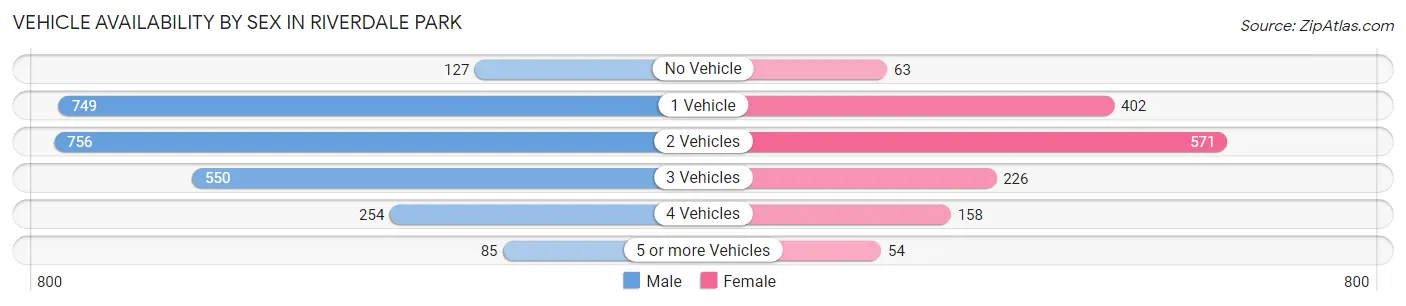
| Vehicles Available | Male | Female |
| No Vehicle | 127 (5.0%) | 63 (4.3%) |
| 1 Vehicle | 749 (29.7%) | 402 (27.3%) |
| 2 Vehicles | 756 (30.0%) | 571 (38.7%) |
| 3 Vehicles | 550 (21.8%) | 226 (15.3%) |
| 4 Vehicles | 254 (10.1%) | 158 (10.7%) |
| 5 or more Vehicles | 85 (3.4%) | 54 (3.7%) |
| Total | 2,521 (100.0%) | 1,474 (100.0%) |
Commute Time in Riverdale Park
The most frequently occuring commute durations in Riverdale Park are 30 to 34 minutes (889 commuters, 26.6%), 20 to 24 minutes (576 commuters, 17.2%), and 45 to 59 minutes (456 commuters, 13.6%).
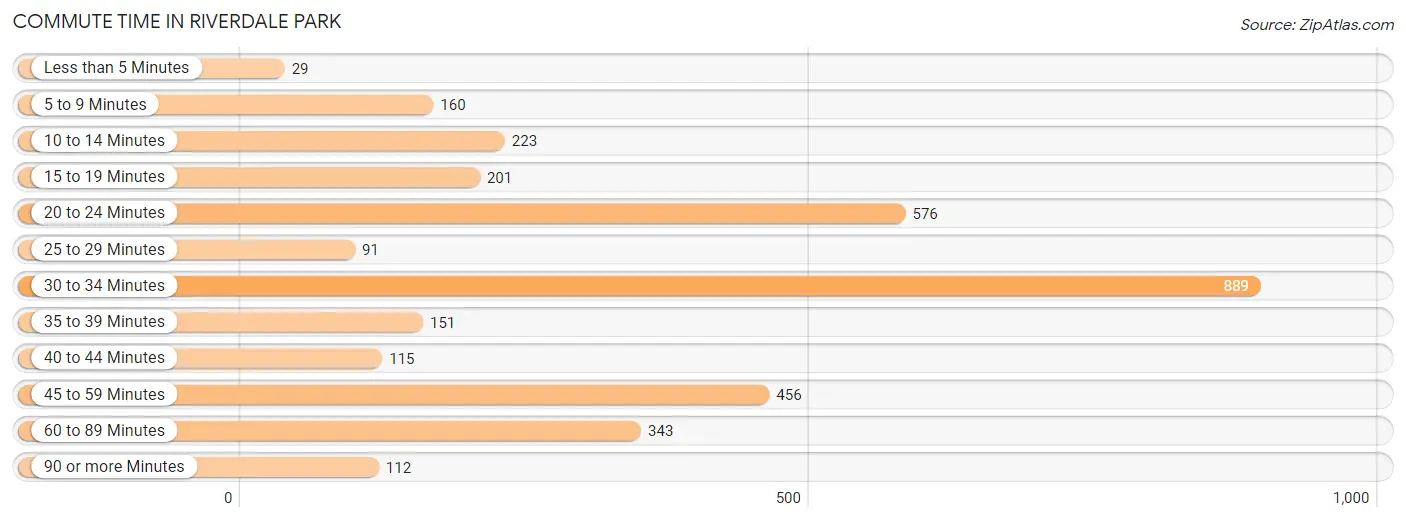
| Commute Time | # Commuters | % Commuters |
| Less than 5 Minutes | 29 | 0.9% |
| 5 to 9 Minutes | 160 | 4.8% |
| 10 to 14 Minutes | 223 | 6.7% |
| 15 to 19 Minutes | 201 | 6.0% |
| 20 to 24 Minutes | 576 | 17.2% |
| 25 to 29 Minutes | 91 | 2.7% |
| 30 to 34 Minutes | 889 | 26.6% |
| 35 to 39 Minutes | 151 | 4.5% |
| 40 to 44 Minutes | 115 | 3.4% |
| 45 to 59 Minutes | 456 | 13.6% |
| 60 to 89 Minutes | 343 | 10.2% |
| 90 or more Minutes | 112 | 3.4% |
Commute Time by Sex in Riverdale Park
The most common commute times in Riverdale Park are 30 to 34 minutes (646 commuters, 28.8%) for males and 30 to 34 minutes (243 commuters, 22.1%) for females.
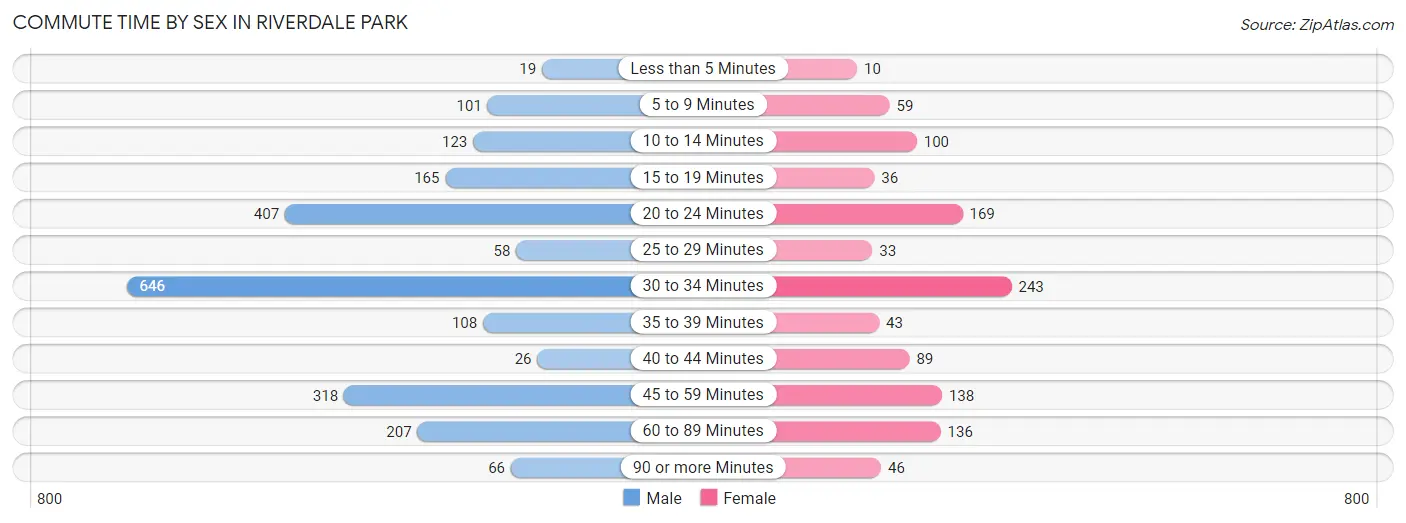
| Commute Time | Male | Female |
| Less than 5 Minutes | 19 (0.9%) | 10 (0.9%) |
| 5 to 9 Minutes | 101 (4.5%) | 59 (5.3%) |
| 10 to 14 Minutes | 123 (5.5%) | 100 (9.1%) |
| 15 to 19 Minutes | 165 (7.3%) | 36 (3.3%) |
| 20 to 24 Minutes | 407 (18.1%) | 169 (15.3%) |
| 25 to 29 Minutes | 58 (2.6%) | 33 (3.0%) |
| 30 to 34 Minutes | 646 (28.8%) | 243 (22.1%) |
| 35 to 39 Minutes | 108 (4.8%) | 43 (3.9%) |
| 40 to 44 Minutes | 26 (1.2%) | 89 (8.1%) |
| 45 to 59 Minutes | 318 (14.2%) | 138 (12.5%) |
| 60 to 89 Minutes | 207 (9.2%) | 136 (12.3%) |
| 90 or more Minutes | 66 (2.9%) | 46 (4.2%) |
Time of Departure to Work by Sex in Riverdale Park
The most frequent times of departure to work in Riverdale Park are 5:00 AM to 5:29 AM (555, 24.7%) for males and 7:00 AM to 7:29 AM (140, 12.7%) for females.
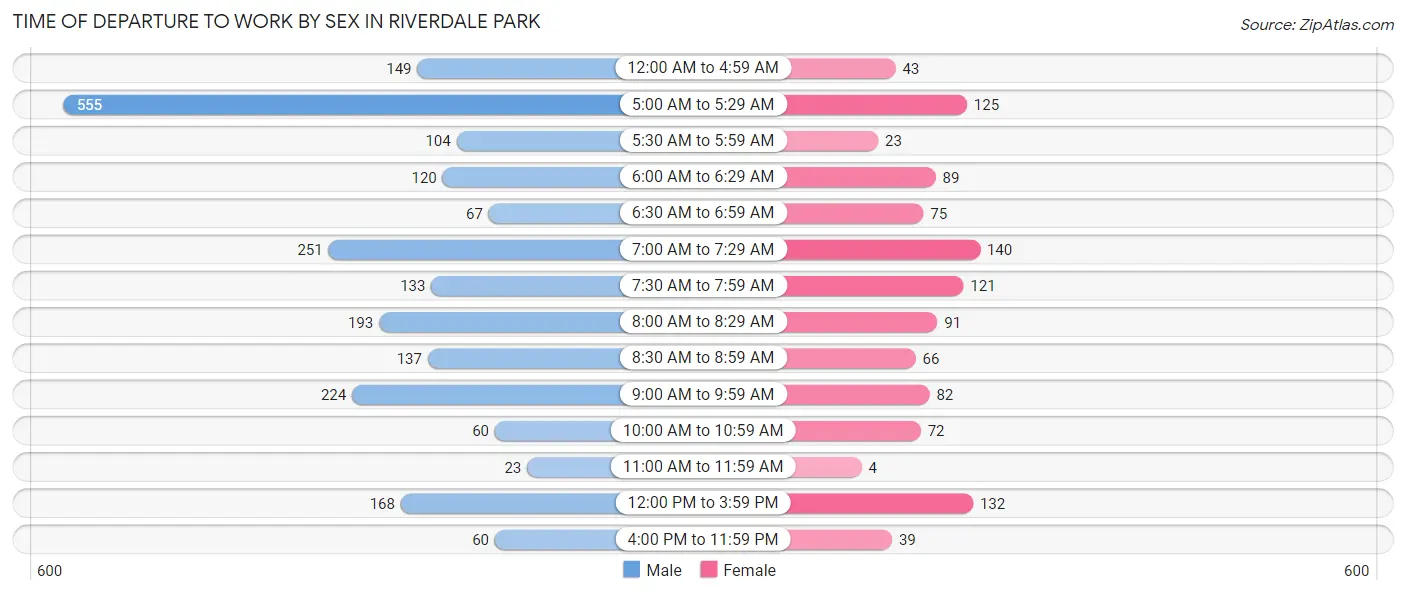
| Time of Departure | Male | Female |
| 12:00 AM to 4:59 AM | 149 (6.6%) | 43 (3.9%) |
| 5:00 AM to 5:29 AM | 555 (24.7%) | 125 (11.3%) |
| 5:30 AM to 5:59 AM | 104 (4.6%) | 23 (2.1%) |
| 6:00 AM to 6:29 AM | 120 (5.3%) | 89 (8.1%) |
| 6:30 AM to 6:59 AM | 67 (3.0%) | 75 (6.8%) |
| 7:00 AM to 7:29 AM | 251 (11.2%) | 140 (12.7%) |
| 7:30 AM to 7:59 AM | 133 (5.9%) | 121 (11.0%) |
| 8:00 AM to 8:29 AM | 193 (8.6%) | 91 (8.3%) |
| 8:30 AM to 8:59 AM | 137 (6.1%) | 66 (6.0%) |
| 9:00 AM to 9:59 AM | 224 (10.0%) | 82 (7.4%) |
| 10:00 AM to 10:59 AM | 60 (2.7%) | 72 (6.5%) |
| 11:00 AM to 11:59 AM | 23 (1.0%) | 4 (0.4%) |
| 12:00 PM to 3:59 PM | 168 (7.5%) | 132 (12.0%) |
| 4:00 PM to 11:59 PM | 60 (2.7%) | 39 (3.5%) |
| Total | 2,244 (100.0%) | 1,102 (100.0%) |
Housing Occupancy in Riverdale Park
Occupancy by Ownership in Riverdale Park
Of the total 2,122 dwellings in Riverdale Park, owner-occupied units account for 1,082 (51.0%), while renter-occupied units make up 1,040 (49.0%).
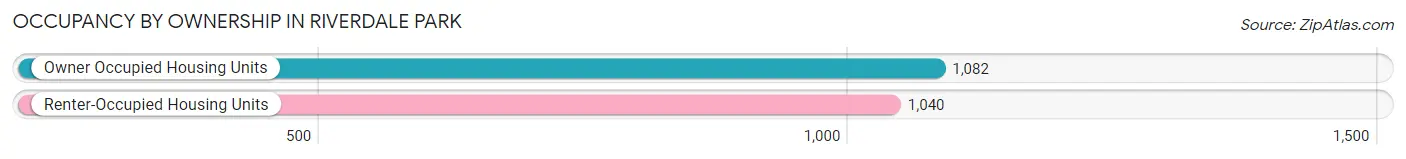
| Occupancy | # Housing Units | % Housing Units |
| Owner Occupied Housing Units | 1,082 | 51.0% |
| Renter-Occupied Housing Units | 1,040 | 49.0% |
| Total Occupied Housing Units | 2,122 | 100.0% |
Occupancy by Household Size in Riverdale Park
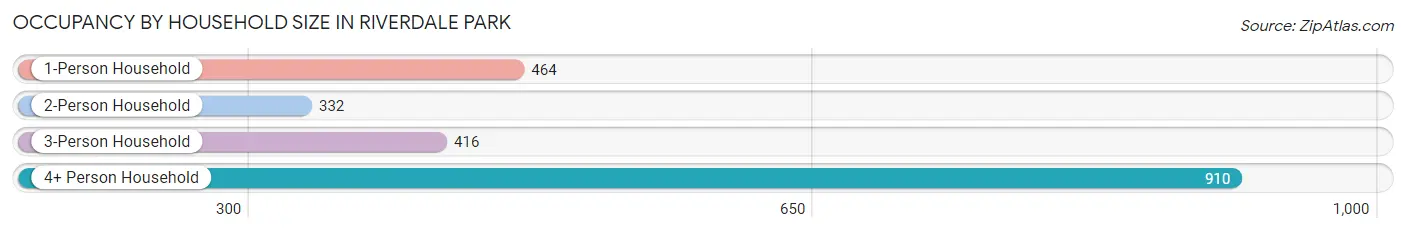
| Household Size | # Housing Units | % Housing Units |
| 1-Person Household | 464 | 21.9% |
| 2-Person Household | 332 | 15.7% |
| 3-Person Household | 416 | 19.6% |
| 4+ Person Household | 910 | 42.9% |
| Total Housing Units | 2,122 | 100.0% |
Occupancy by Ownership by Household Size in Riverdale Park
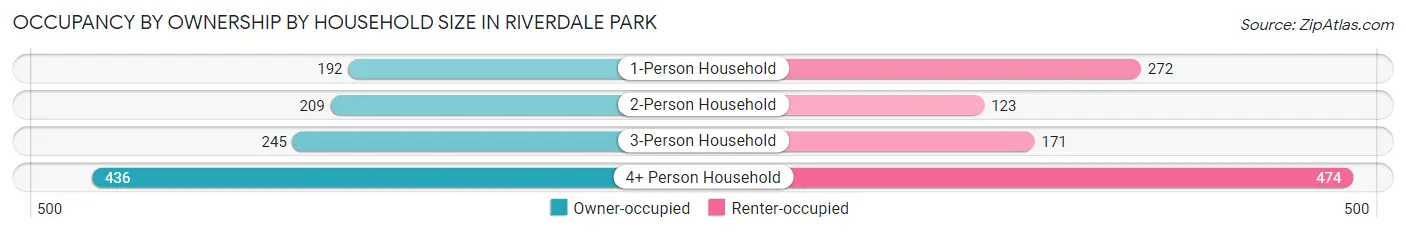
| Household Size | Owner-occupied | Renter-occupied |
| 1-Person Household | 192 (41.4%) | 272 (58.6%) |
| 2-Person Household | 209 (62.9%) | 123 (37.0%) |
| 3-Person Household | 245 (58.9%) | 171 (41.1%) |
| 4+ Person Household | 436 (47.9%) | 474 (52.1%) |
| Total Housing Units | 1,082 (51.0%) | 1,040 (49.0%) |
Occupancy by Educational Attainment in Riverdale Park
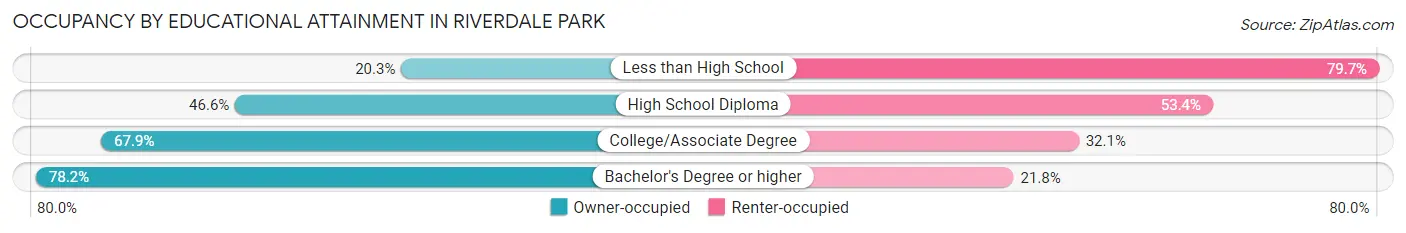
| Household Size | Owner-occupied | Renter-occupied |
| Less than High School | 139 (20.3%) | 547 (79.7%) |
| High School Diploma | 219 (46.6%) | 251 (53.4%) |
| College/Associate Degree | 207 (67.9%) | 98 (32.1%) |
| Bachelor's Degree or higher | 517 (78.2%) | 144 (21.8%) |
Occupancy by Age of Householder in Riverdale Park
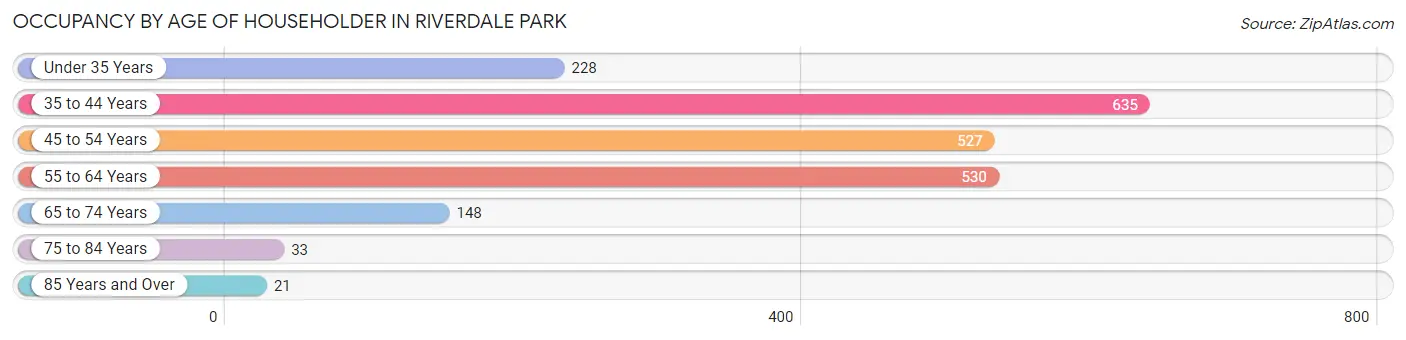
| Age Bracket | # Households | % Households |
| Under 35 Years | 228 | 10.7% |
| 35 to 44 Years | 635 | 29.9% |
| 45 to 54 Years | 527 | 24.8% |
| 55 to 64 Years | 530 | 25.0% |
| 65 to 74 Years | 148 | 7.0% |
| 75 to 84 Years | 33 | 1.6% |
| 85 Years and Over | 21 | 1.0% |
| Total | 2,122 | 100.0% |
Housing Finances in Riverdale Park
Median Income by Occupancy in Riverdale Park
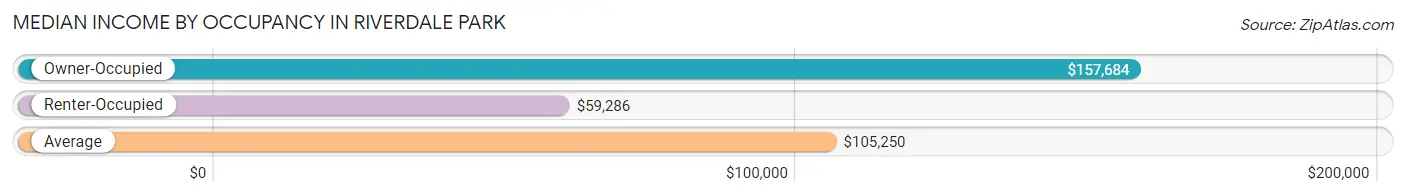
| Occupancy Type | # Households | Median Income |
| Owner-Occupied | 1,082 (51.0%) | $157,684 |
| Renter-Occupied | 1,040 (49.0%) | $59,286 |
| Average | 2,122 (100.0%) | $105,250 |
Occupancy by Householder Income Bracket in Riverdale Park
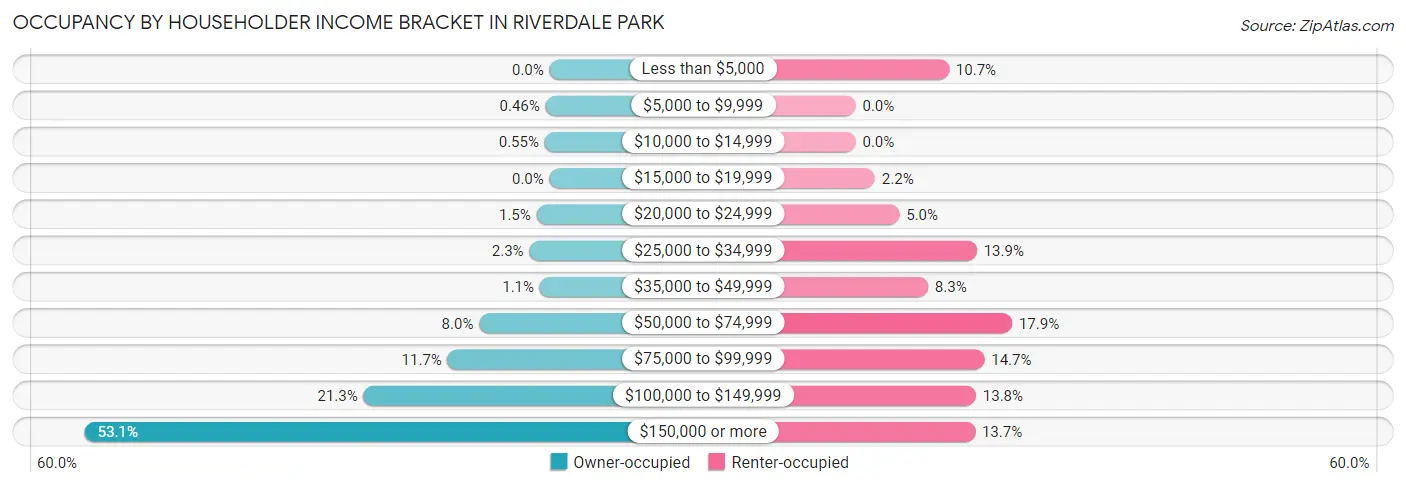
| Income Bracket | Owner-occupied | Renter-occupied |
| Less than $5,000 | 0 (0.0%) | 111 (10.7%) |
| $5,000 to $9,999 | 5 (0.5%) | 0 (0.0%) |
| $10,000 to $14,999 | 6 (0.5%) | 0 (0.0%) |
| $15,000 to $19,999 | 0 (0.0%) | 23 (2.2%) |
| $20,000 to $24,999 | 16 (1.5%) | 52 (5.0%) |
| $25,000 to $34,999 | 25 (2.3%) | 144 (13.9%) |
| $35,000 to $49,999 | 12 (1.1%) | 86 (8.3%) |
| $50,000 to $74,999 | 87 (8.0%) | 186 (17.9%) |
| $75,000 to $99,999 | 126 (11.7%) | 153 (14.7%) |
| $100,000 to $149,999 | 230 (21.3%) | 143 (13.8%) |
| $150,000 or more | 575 (53.1%) | 142 (13.7%) |
| Total | 1,082 (100.0%) | 1,040 (100.0%) |
Monthly Housing Cost Tiers in Riverdale Park
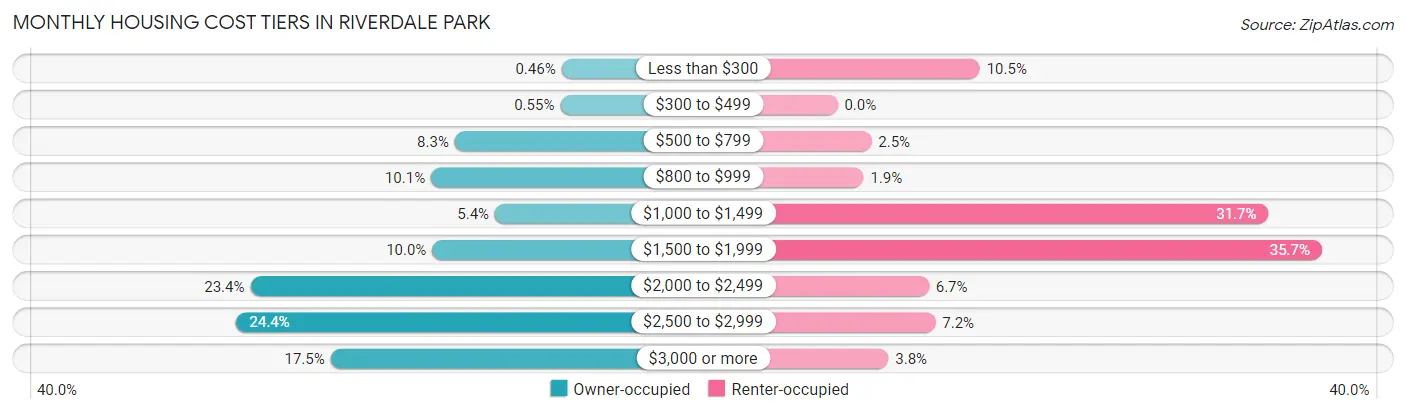
| Monthly Cost | Owner-occupied | Renter-occupied |
| Less than $300 | 5 (0.5%) | 109 (10.5%) |
| $300 to $499 | 6 (0.5%) | 0 (0.0%) |
| $500 to $799 | 90 (8.3%) | 26 (2.5%) |
| $800 to $999 | 109 (10.1%) | 20 (1.9%) |
| $1,000 to $1,499 | 58 (5.4%) | 330 (31.7%) |
| $1,500 to $1,999 | 108 (10.0%) | 371 (35.7%) |
| $2,000 to $2,499 | 253 (23.4%) | 70 (6.7%) |
| $2,500 to $2,999 | 264 (24.4%) | 75 (7.2%) |
| $3,000 or more | 189 (17.5%) | 39 (3.7%) |
| Total | 1,082 (100.0%) | 1,040 (100.0%) |
Physical Housing Characteristics in Riverdale Park
Housing Structures in Riverdale Park
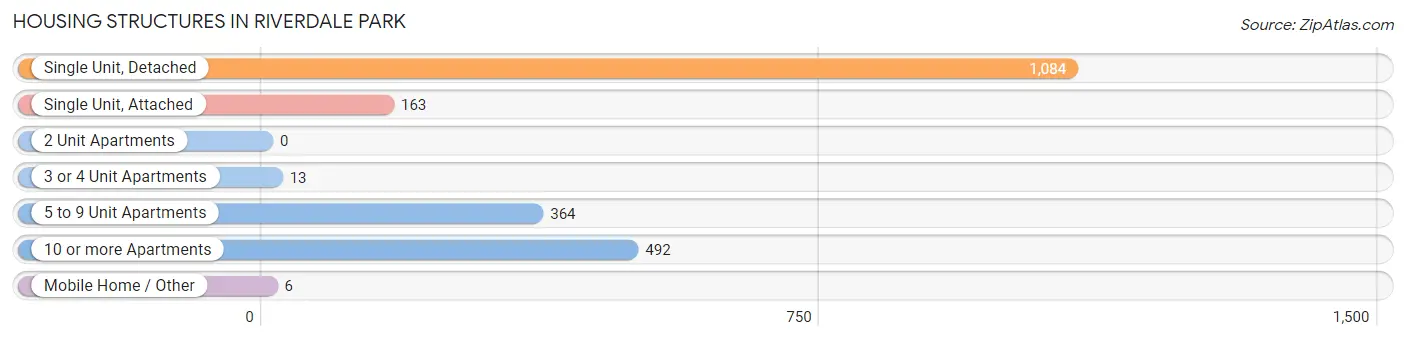
| Structure Type | # Housing Units | % Housing Units |
| Single Unit, Detached | 1,084 | 51.1% |
| Single Unit, Attached | 163 | 7.7% |
| 2 Unit Apartments | 0 | 0.0% |
| 3 or 4 Unit Apartments | 13 | 0.6% |
| 5 to 9 Unit Apartments | 364 | 17.2% |
| 10 or more Apartments | 492 | 23.2% |
| Mobile Home / Other | 6 | 0.3% |
| Total | 2,122 | 100.0% |
Housing Structures by Occupancy in Riverdale Park
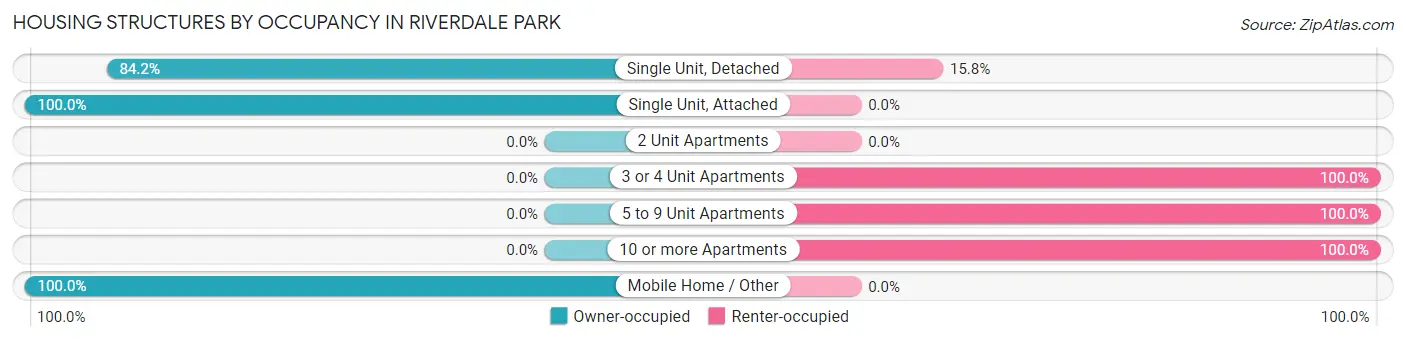
| Structure Type | Owner-occupied | Renter-occupied |
| Single Unit, Detached | 913 (84.2%) | 171 (15.8%) |
| Single Unit, Attached | 163 (100.0%) | 0 (0.0%) |
| 2 Unit Apartments | 0 (0.0%) | 0 (0.0%) |
| 3 or 4 Unit Apartments | 0 (0.0%) | 13 (100.0%) |
| 5 to 9 Unit Apartments | 0 (0.0%) | 364 (100.0%) |
| 10 or more Apartments | 0 (0.0%) | 492 (100.0%) |
| Mobile Home / Other | 6 (100.0%) | 0 (0.0%) |
| Total | 1,082 (51.0%) | 1,040 (49.0%) |
Housing Structures by Number of Rooms in Riverdale Park
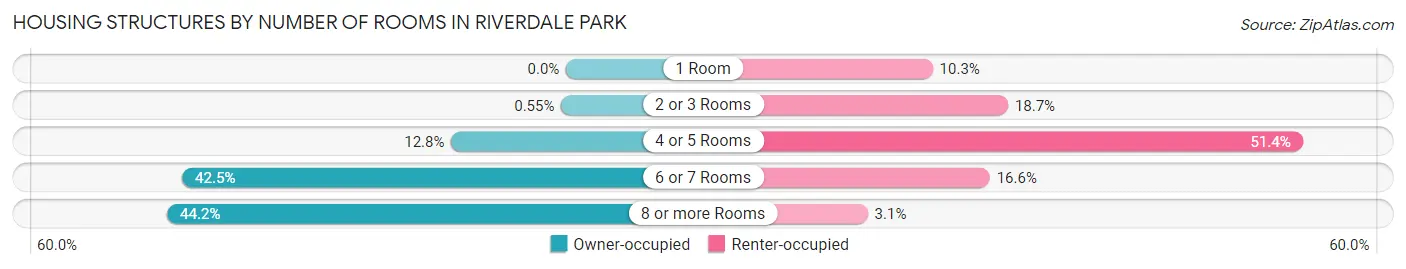
| Number of Rooms | Owner-occupied | Renter-occupied |
| 1 Room | 0 (0.0%) | 107 (10.3%) |
| 2 or 3 Rooms | 6 (0.5%) | 194 (18.6%) |
| 4 or 5 Rooms | 138 (12.8%) | 534 (51.3%) |
| 6 or 7 Rooms | 460 (42.5%) | 173 (16.6%) |
| 8 or more Rooms | 478 (44.2%) | 32 (3.1%) |
| Total | 1,082 (100.0%) | 1,040 (100.0%) |
Housing Structure by Heating Type in Riverdale Park
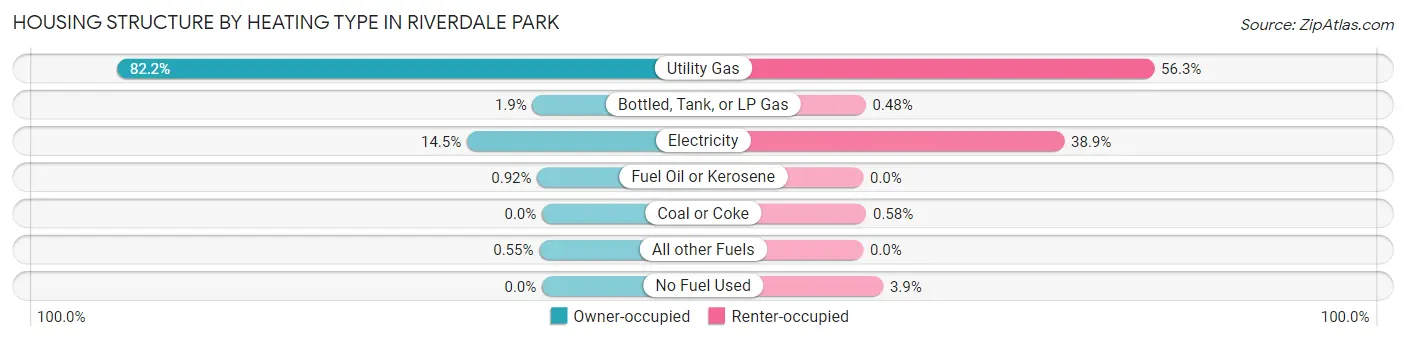
| Heating Type | Owner-occupied | Renter-occupied |
| Utility Gas | 889 (82.2%) | 585 (56.2%) |
| Bottled, Tank, or LP Gas | 20 (1.8%) | 5 (0.5%) |
| Electricity | 157 (14.5%) | 404 (38.9%) |
| Fuel Oil or Kerosene | 10 (0.9%) | 0 (0.0%) |
| Coal or Coke | 0 (0.0%) | 6 (0.6%) |
| All other Fuels | 6 (0.5%) | 0 (0.0%) |
| No Fuel Used | 0 (0.0%) | 40 (3.8%) |
| Total | 1,082 (100.0%) | 1,040 (100.0%) |
Household Vehicle Usage in Riverdale Park
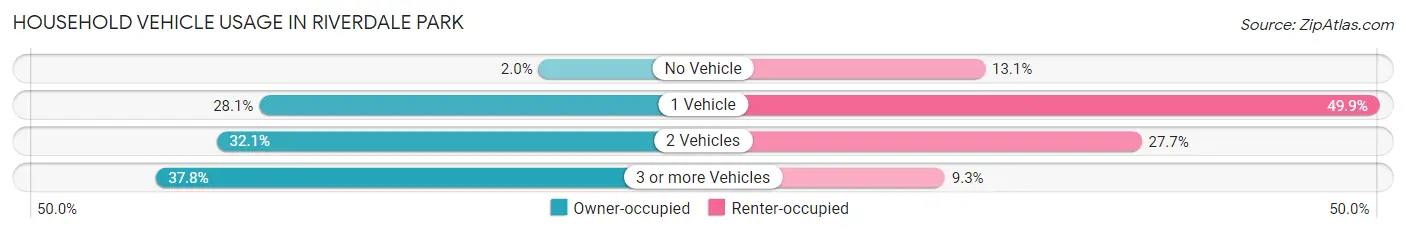
| Vehicles per Household | Owner-occupied | Renter-occupied |
| No Vehicle | 22 (2.0%) | 136 (13.1%) |
| 1 Vehicle | 304 (28.1%) | 519 (49.9%) |
| 2 Vehicles | 347 (32.1%) | 288 (27.7%) |
| 3 or more Vehicles | 409 (37.8%) | 97 (9.3%) |
| Total | 1,082 (100.0%) | 1,040 (100.0%) |
Real Estate & Mortgages in Riverdale Park
Real Estate and Mortgage Overview in Riverdale Park
| Characteristic | Without Mortgage | With Mortgage |
| Housing Units | 251 | 831 |
| Median Property Value | $396,300 | $433,700 |
| Median Household Income | $153,906 | $445 |
| Monthly Housing Costs | $857 | $189 |
| Real Estate Taxes | $4,983 | $0 |
Property Value by Mortgage Status in Riverdale Park
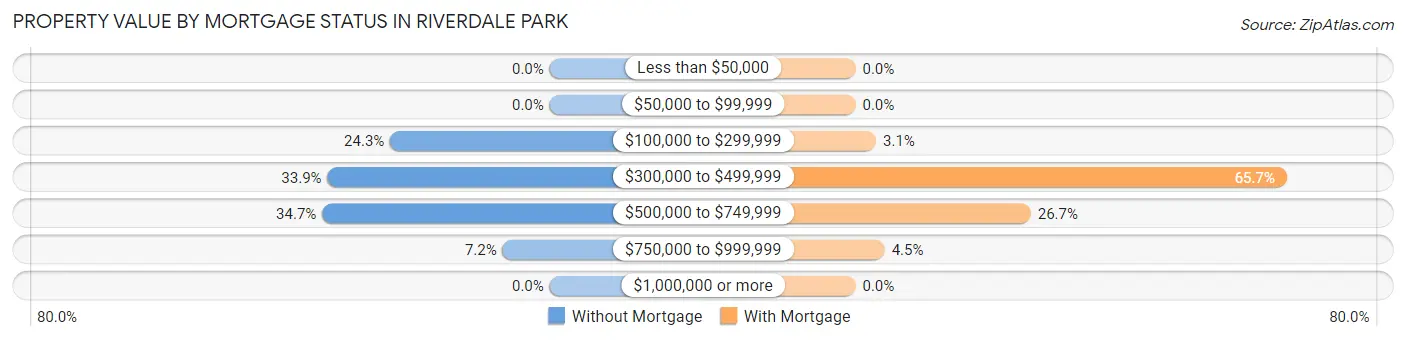
| Property Value | Without Mortgage | With Mortgage |
| Less than $50,000 | 0 (0.0%) | 0 (0.0%) |
| $50,000 to $99,999 | 0 (0.0%) | 0 (0.0%) |
| $100,000 to $299,999 | 61 (24.3%) | 26 (3.1%) |
| $300,000 to $499,999 | 85 (33.9%) | 546 (65.7%) |
| $500,000 to $749,999 | 87 (34.7%) | 222 (26.7%) |
| $750,000 to $999,999 | 18 (7.2%) | 37 (4.4%) |
| $1,000,000 or more | 0 (0.0%) | 0 (0.0%) |
| Total | 251 (100.0%) | 831 (100.0%) |
Household Income by Mortgage Status in Riverdale Park
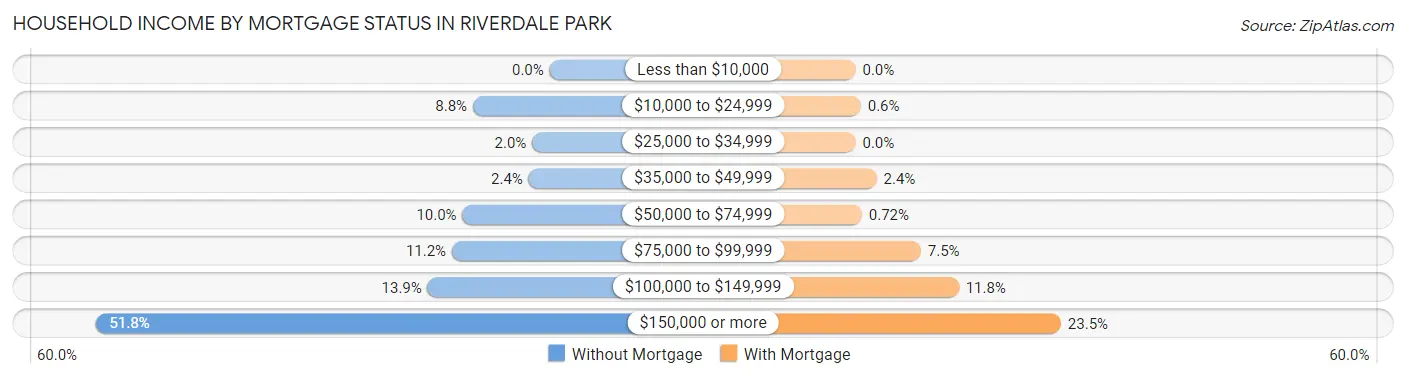
| Household Income | Without Mortgage | With Mortgage |
| Less than $10,000 | 0 (0.0%) | 0 (0.0%) |
| $10,000 to $24,999 | 22 (8.8%) | 5 (0.6%) |
| $25,000 to $34,999 | 5 (2.0%) | 0 (0.0%) |
| $35,000 to $49,999 | 6 (2.4%) | 20 (2.4%) |
| $50,000 to $74,999 | 25 (10.0%) | 6 (0.7%) |
| $75,000 to $99,999 | 28 (11.2%) | 62 (7.5%) |
| $100,000 to $149,999 | 35 (13.9%) | 98 (11.8%) |
| $150,000 or more | 130 (51.8%) | 195 (23.5%) |
| Total | 251 (100.0%) | 831 (100.0%) |
Property Value to Household Income Ratio in Riverdale Park
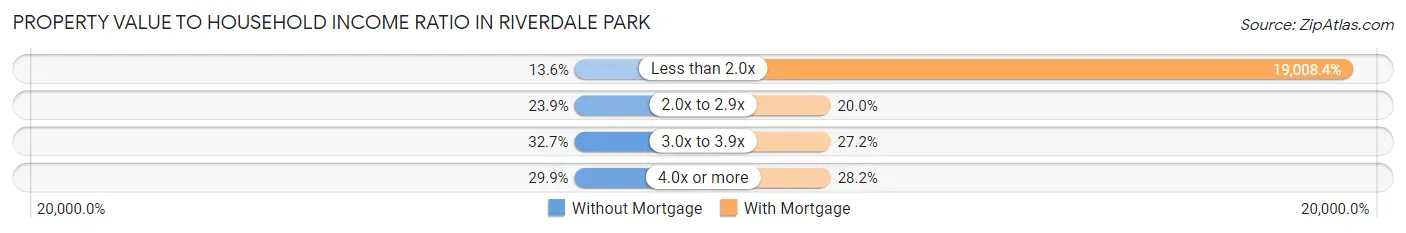
| Value-to-Income Ratio | Without Mortgage | With Mortgage |
| Less than 2.0x | 34 (13.6%) | 157,960 (19,008.4%) |
| 2.0x to 2.9x | 60 (23.9%) | 166 (20.0%) |
| 3.0x to 3.9x | 82 (32.7%) | 226 (27.2%) |
| 4.0x or more | 75 (29.9%) | 234 (28.2%) |
| Total | 251 (100.0%) | 831 (100.0%) |
Real Estate Taxes by Mortgage Status in Riverdale Park
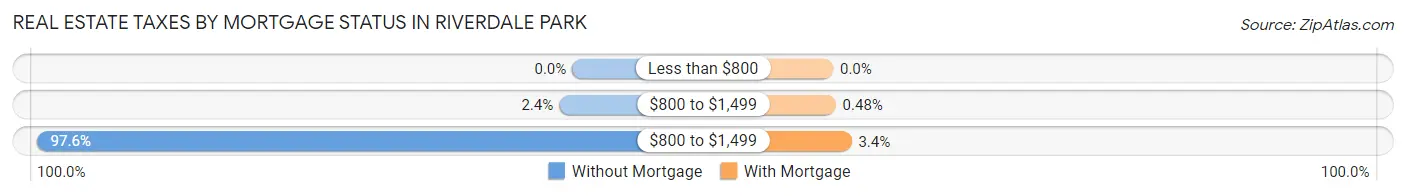
| Property Taxes | Without Mortgage | With Mortgage |
| Less than $800 | 0 (0.0%) | 0 (0.0%) |
| $800 to $1,499 | 6 (2.4%) | 4 (0.5%) |
| $800 to $1,499 | 245 (97.6%) | 28 (3.4%) |
| Total | 251 (100.0%) | 831 (100.0%) |
Health & Disability in Riverdale Park
Health Insurance Coverage by Age in Riverdale Park
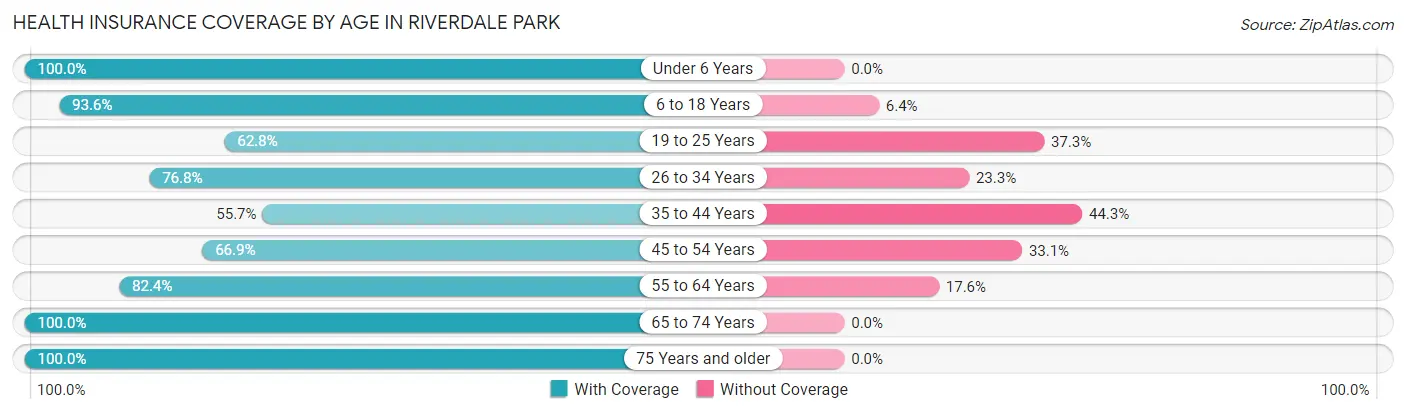
| Age Bracket | With Coverage | Without Coverage |
| Under 6 Years | 415 (100.0%) | 0 (0.0%) |
| 6 to 18 Years | 1,351 (93.6%) | 93 (6.4%) |
| 19 to 25 Years | 416 (62.7%) | 247 (37.2%) |
| 26 to 34 Years | 591 (76.7%) | 179 (23.3%) |
| 35 to 44 Years | 713 (55.7%) | 568 (44.3%) |
| 45 to 54 Years | 783 (66.9%) | 388 (33.1%) |
| 55 to 64 Years | 710 (82.4%) | 152 (17.6%) |
| 65 to 74 Years | 251 (100.0%) | 0 (0.0%) |
| 75 Years and older | 227 (100.0%) | 0 (0.0%) |
| Total | 5,457 (77.0%) | 1,627 (23.0%) |
Health Insurance Coverage by Citizenship Status in Riverdale Park
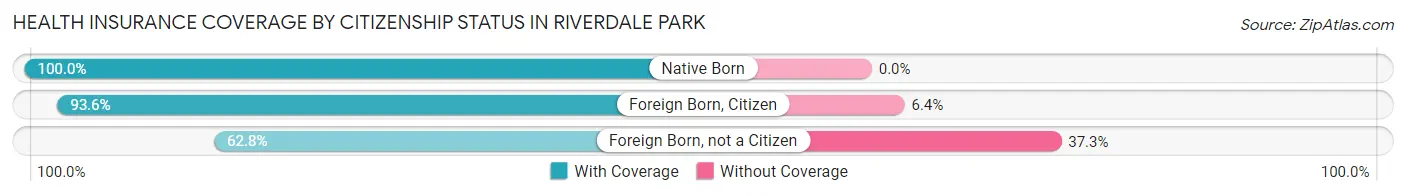
| Citizenship Status | With Coverage | Without Coverage |
| Native Born | 415 (100.0%) | 0 (0.0%) |
| Foreign Born, Citizen | 1,351 (93.6%) | 93 (6.4%) |
| Foreign Born, not a Citizen | 416 (62.7%) | 247 (37.2%) |
Health Insurance Coverage by Household Income in Riverdale Park
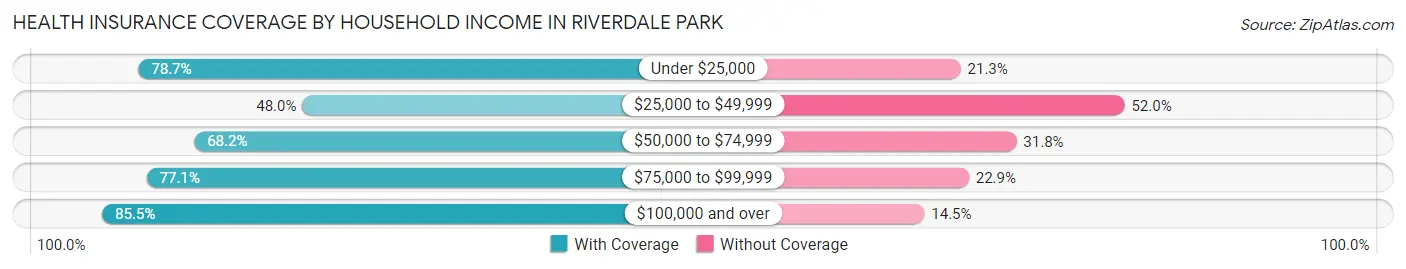
| Household Income | With Coverage | Without Coverage |
| Under $25,000 | 321 (78.7%) | 87 (21.3%) |
| $25,000 to $49,999 | 413 (48.0%) | 448 (52.0%) |
| $50,000 to $74,999 | 659 (68.2%) | 307 (31.8%) |
| $75,000 to $99,999 | 739 (77.1%) | 219 (22.9%) |
| $100,000 and over | 3,312 (85.5%) | 563 (14.5%) |
Public vs Private Health Insurance Coverage by Age in Riverdale Park
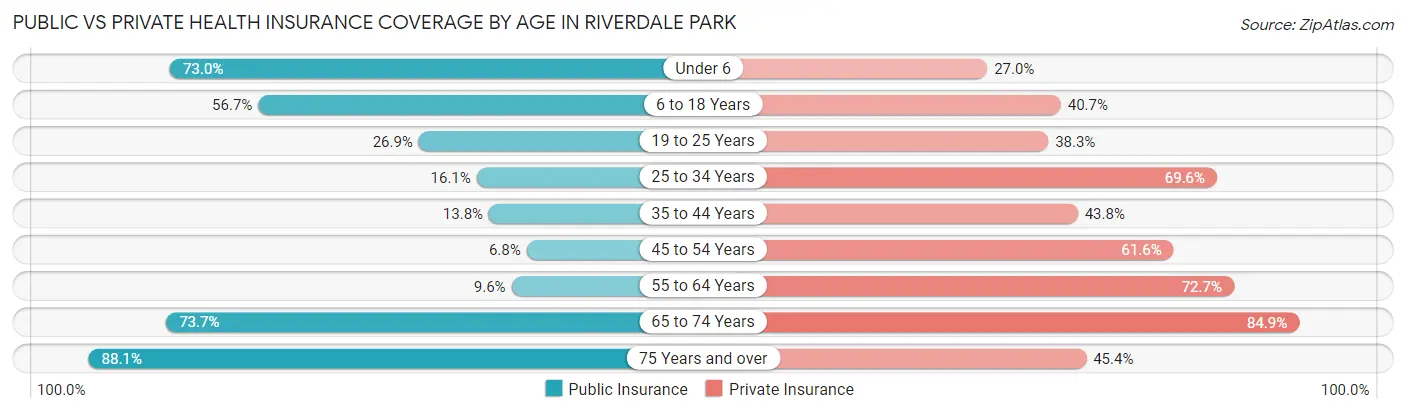
| Age Bracket | Public Insurance | Private Insurance |
| Under 6 | 303 (73.0%) | 112 (27.0%) |
| 6 to 18 Years | 818 (56.7%) | 587 (40.6%) |
| 19 to 25 Years | 178 (26.9%) | 254 (38.3%) |
| 25 to 34 Years | 124 (16.1%) | 536 (69.6%) |
| 35 to 44 Years | 177 (13.8%) | 561 (43.8%) |
| 45 to 54 Years | 80 (6.8%) | 721 (61.6%) |
| 55 to 64 Years | 83 (9.6%) | 627 (72.7%) |
| 65 to 74 Years | 185 (73.7%) | 213 (84.9%) |
| 75 Years and over | 200 (88.1%) | 103 (45.4%) |
| Total | 2,148 (30.3%) | 3,714 (52.4%) |
Disability Status by Sex by Age in Riverdale Park
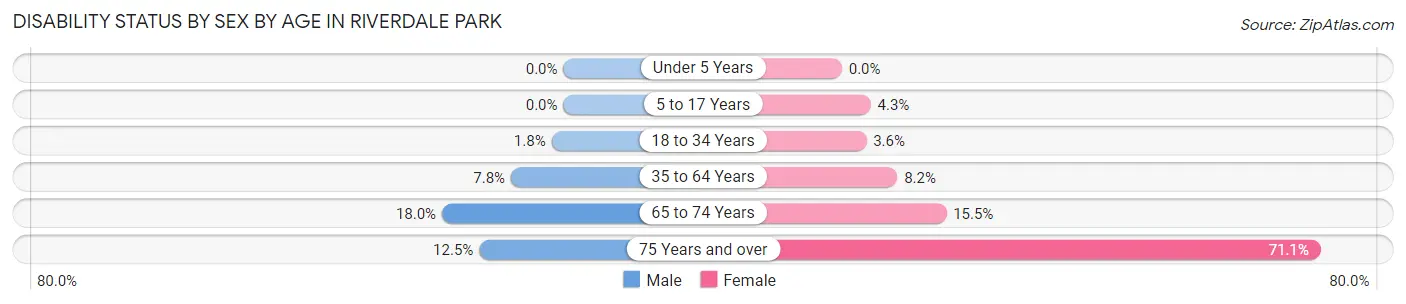
| Age Bracket | Male | Female |
| Under 5 Years | 0 (0.0%) | 0 (0.0%) |
| 5 to 17 Years | 0 (0.0%) | 28 (4.3%) |
| 18 to 34 Years | 16 (1.8%) | 22 (3.6%) |
| 35 to 64 Years | 154 (7.8%) | 110 (8.2%) |
| 65 to 74 Years | 22 (18.0%) | 20 (15.5%) |
| 75 Years and over | 5 (12.5%) | 133 (71.1%) |
Disability Class by Sex by Age in Riverdale Park
Disability Class: Hearing Difficulty
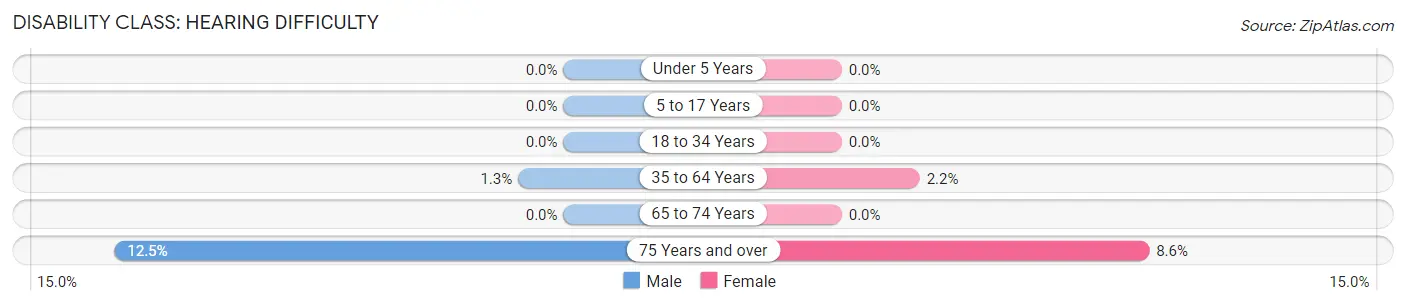
| Age Bracket | Male | Female |
| Under 5 Years | 0 (0.0%) | 0 (0.0%) |
| 5 to 17 Years | 0 (0.0%) | 0 (0.0%) |
| 18 to 34 Years | 0 (0.0%) | 0 (0.0%) |
| 35 to 64 Years | 25 (1.3%) | 29 (2.2%) |
| 65 to 74 Years | 0 (0.0%) | 0 (0.0%) |
| 75 Years and over | 5 (12.5%) | 16 (8.6%) |
Disability Class: Vision Difficulty
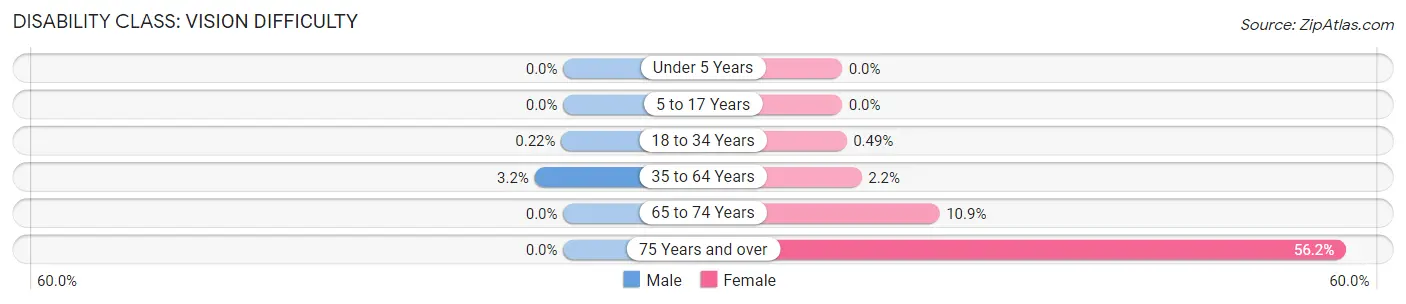
| Age Bracket | Male | Female |
| Under 5 Years | 0 (0.0%) | 0 (0.0%) |
| 5 to 17 Years | 0 (0.0%) | 0 (0.0%) |
| 18 to 34 Years | 2 (0.2%) | 3 (0.5%) |
| 35 to 64 Years | 63 (3.2%) | 29 (2.2%) |
| 65 to 74 Years | 0 (0.0%) | 14 (10.8%) |
| 75 Years and over | 0 (0.0%) | 105 (56.1%) |
Disability Class: Cognitive Difficulty
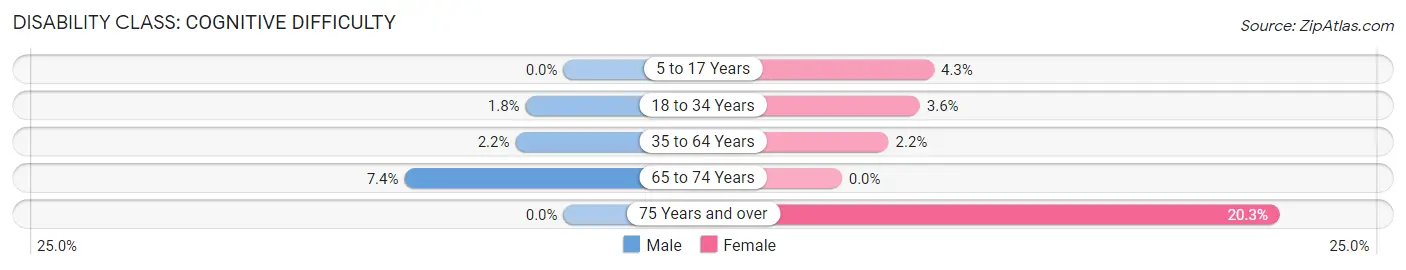
| Age Bracket | Male | Female |
| 5 to 17 Years | 0 (0.0%) | 28 (4.3%) |
| 18 to 34 Years | 16 (1.8%) | 22 (3.6%) |
| 35 to 64 Years | 44 (2.2%) | 29 (2.2%) |
| 65 to 74 Years | 9 (7.4%) | 0 (0.0%) |
| 75 Years and over | 0 (0.0%) | 38 (20.3%) |
Disability Class: Ambulatory Difficulty
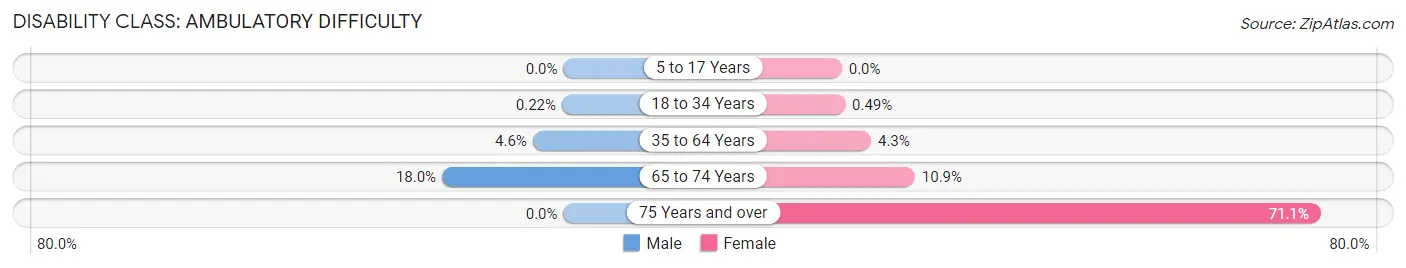
| Age Bracket | Male | Female |
| 5 to 17 Years | 0 (0.0%) | 0 (0.0%) |
| 18 to 34 Years | 2 (0.2%) | 3 (0.5%) |
| 35 to 64 Years | 90 (4.5%) | 58 (4.3%) |
| 65 to 74 Years | 22 (18.0%) | 14 (10.8%) |
| 75 Years and over | 0 (0.0%) | 133 (71.1%) |
Disability Class: Self-Care Difficulty
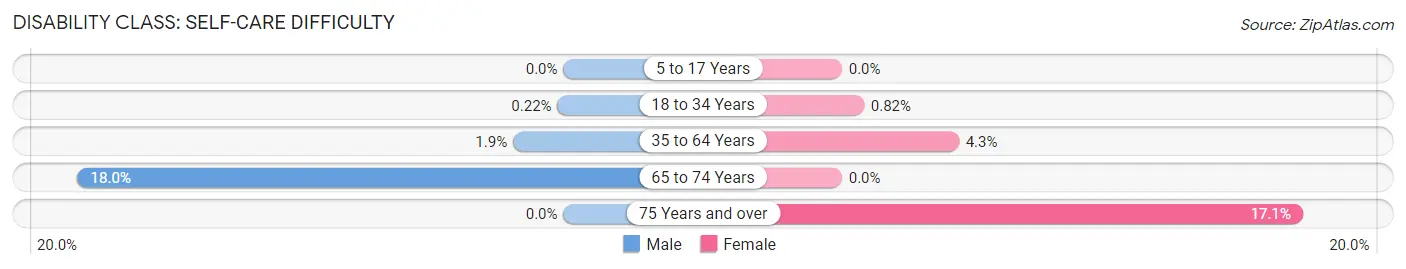
| Age Bracket | Male | Female |
| 5 to 17 Years | 0 (0.0%) | 0 (0.0%) |
| 18 to 34 Years | 2 (0.2%) | 5 (0.8%) |
| 35 to 64 Years | 37 (1.9%) | 58 (4.3%) |
| 65 to 74 Years | 22 (18.0%) | 0 (0.0%) |
| 75 Years and over | 0 (0.0%) | 32 (17.1%) |
Technology Access in Riverdale Park
Computing Device Access in Riverdale Park
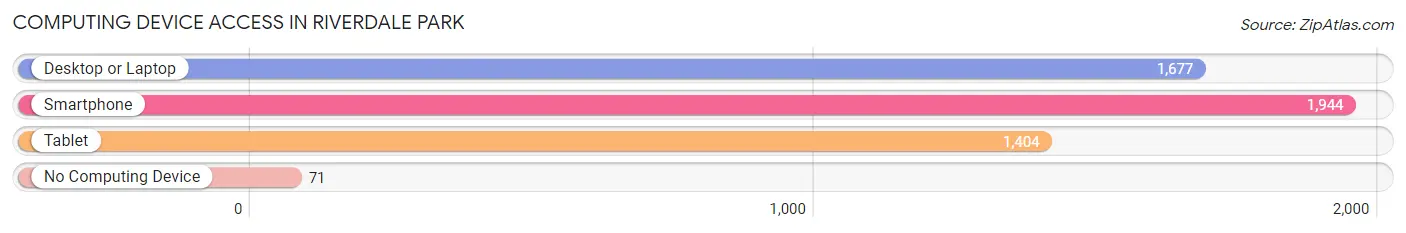
| Device Type | # Households | % Households |
| Desktop or Laptop | 1,677 | 79.0% |
| Smartphone | 1,944 | 91.6% |
| Tablet | 1,404 | 66.2% |
| No Computing Device | 71 | 3.4% |
| Total | 2,122 | 100.0% |
Internet Access in Riverdale Park
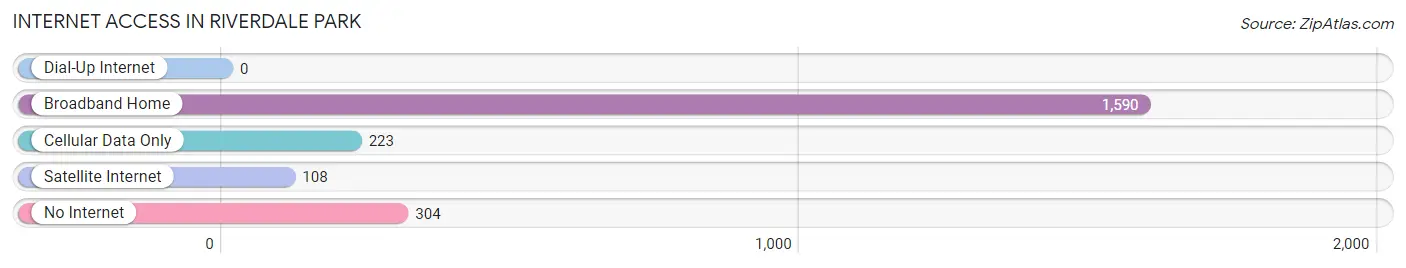
| Internet Type | # Households | % Households |
| Dial-Up Internet | 0 | 0.0% |
| Broadband Home | 1,590 | 74.9% |
| Cellular Data Only | 223 | 10.5% |
| Satellite Internet | 108 | 5.1% |
| No Internet | 304 | 14.3% |
| Total | 2,122 | 100.0% |
Riverdale Park Summary
Riverdale Park, Maryland is a small town located in Prince George’s County, Maryland, just outside of Washington, D.C. It is a part of the Washington Metropolitan Area and is located just north of the city of College Park. The town has a population of 7,564 people, according to the 2010 census.
History
The area that is now Riverdale Park was originally part of a large tract of land owned by the Carroll family, who were prominent landowners in the area. The land was divided up and sold off in the late 19th century, and the town of Riverdale Park was officially incorporated in 1920. The town was named after the nearby Riverdale Mansion, which was built in 1801 by the Carroll family.
The town of Riverdale Park was originally a rural farming community, but it began to develop into a suburban area in the 1950s and 1960s. The town was home to a number of large businesses, including the National Biscuit Company (now Nabisco) and the National Cash Register Company (now NCR). The town also had a number of small businesses, including a grocery store, a hardware store, and a movie theater.
Geography
Riverdale Park is located in Prince George’s County, Maryland, just outside of Washington, D.C. It is bordered by the cities of College Park to the south, Hyattsville to the east, and Greenbelt to the north. The town is situated on the banks of the Anacostia River, and is located just off of Interstate 95.
The town of Riverdale Park covers an area of 1.7 square miles, and has a population density of 4,400 people per square mile. The town is located at an elevation of about 100 feet above sea level.
Economy
The economy of Riverdale Park is largely based on the service industry. The town is home to a number of restaurants, retail stores, and other businesses. The town is also home to a number of government offices, including the Prince George’s County Police Department and the Prince George’s County Fire Department.
The town is also home to a number of educational institutions, including the University of Maryland, College Park, and the University of Maryland, Baltimore County. The town is also home to a number of parks and recreational facilities, including the Riverdale Park Nature Center and the Riverdale Park Golf Course.
Demographics
According to the 2010 census, the population of Riverdale Park was 7,564 people. The town has a population density of 4,400 people per square mile. The racial makeup of the town is 57.3% White, 28.2% African American, 8.2% Asian, and 6.3% Hispanic or Latino.
The median household income in Riverdale Park is $68,945, and the median family income is $76,945. The town has a poverty rate of 8.3%, and the median home value is $310,000. The town has a high rate of homeownership, with 73.3% of the population owning their own homes.
Riverdale Park is a small town with a rich history and a diverse population. The town is home to a number of businesses, educational institutions, and recreational facilities, and is a great place to live and work.
Common Questions
What is Per Capita Income in Riverdale Park?
Per Capita income in Riverdale Park is $37,995.
What is the Median Family Income in Riverdale Park?
Median Family Income in Riverdale Park is $113,393.
What is the Median Household income in Riverdale Park?
Median Household Income in Riverdale Park is $105,250.
What is Income or Wage Gap in Riverdale Park?
Income or Wage Gap in Riverdale Park is 10.3%.
Women in Riverdale Park earn 89.7 cents for every dollar earned by a man.
What is Inequality or Gini Index in Riverdale Park?
Inequality or Gini Index in Riverdale Park is 0.41.
What is the Total Population of Riverdale Park?
Total Population of Riverdale Park is 7,284.
What is the Total Male Population of Riverdale Park?
Total Male Population of Riverdale Park is 4,040.
What is the Total Female Population of Riverdale Park?
Total Female Population of Riverdale Park is 3,244.
What is the Ratio of Males per 100 Females in Riverdale Park?
There are 124.54 Males per 100 Females in Riverdale Park.
What is the Ratio of Females per 100 Males in Riverdale Park?
There are 80.30 Females per 100 Males in Riverdale Park.
What is the Median Population Age in Riverdale Park?
Median Population Age in Riverdale Park is 38.6 Years.
What is the Average Family Size in Riverdale Park
Average Family Size in Riverdale Park is 3.9 People.
What is the Average Household Size in Riverdale Park
Average Household Size in Riverdale Park is 3.4 People.
How Large is the Labor Force in Riverdale Park?
There are 4,174 People in the Labor Forcein in Riverdale Park.
What is the Percentage of People in the Labor Force in Riverdale Park?
71.7% of People are in the Labor Force in Riverdale Park.
What is the Unemployment Rate in Riverdale Park?
Unemployment Rate in Riverdale Park is 3.6%.