Zip Codes with the Highest Percentage of Population Employed in Administrative & Support Services in Rockville, MD
RELATED REPORTS & OPTIONS
Administrative & Support Services
Rockville
Compare Zip Codes
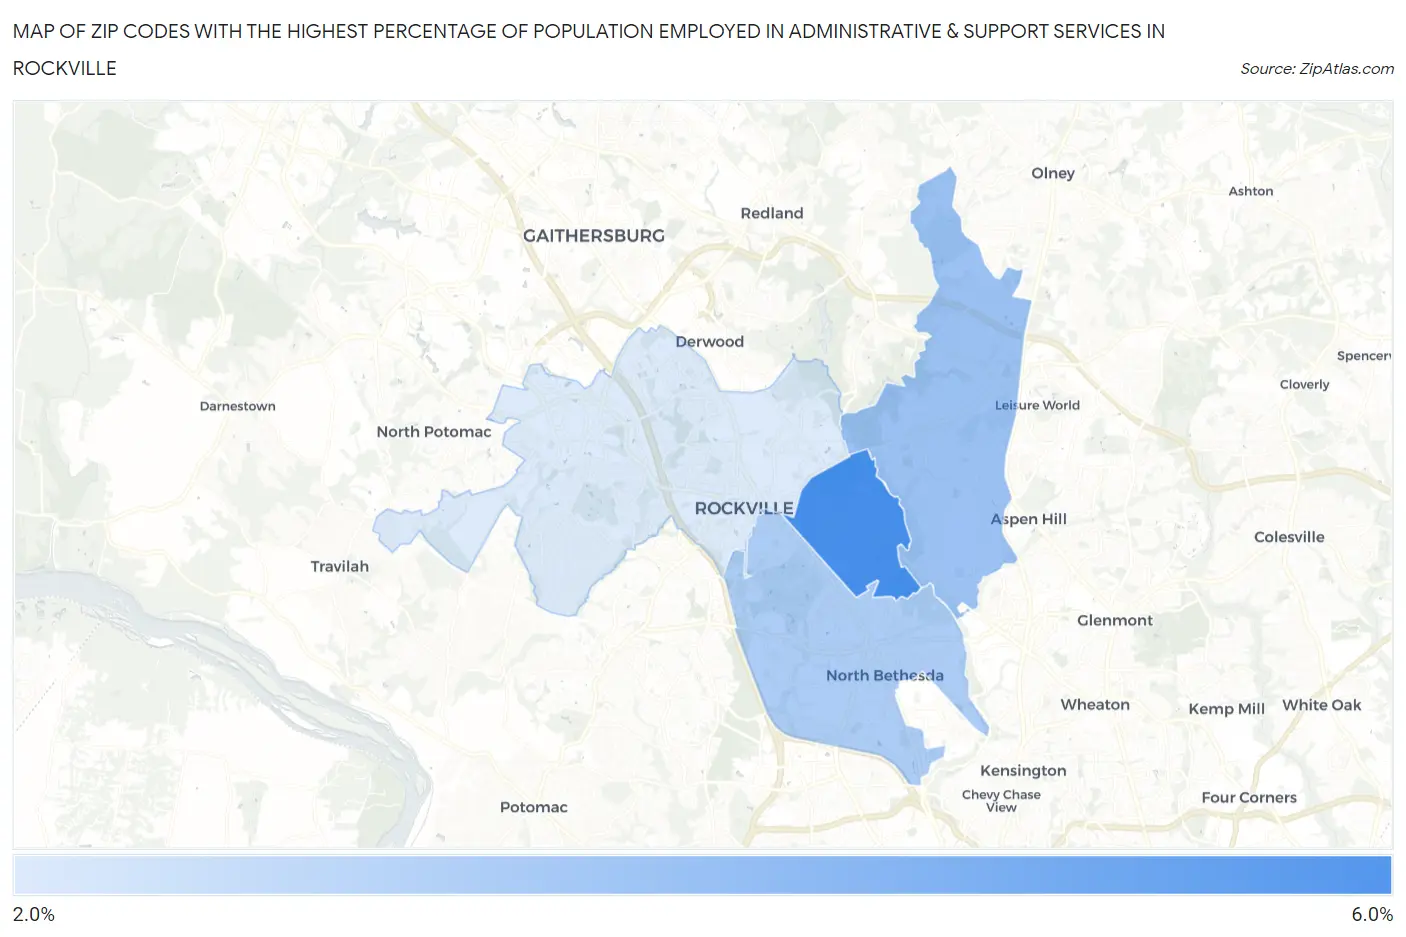
Map of Zip Codes with the Highest Percentage of Population Employed in Administrative & Support Services in Rockville
2.5%
5.8%
Zip Codes with the Highest Percentage of Population Employed in Administrative & Support Services in Rockville, MD
| Zip Code | % Employed | vs State | vs National | |
| 1. | 20851 | 5.8% | 4.2%(+1.55)#90 | 4.1%(+1.63)#5,202 |
| 2. | 20853 | 3.9% | 4.2%(-0.293)#171 | 4.1%(-0.210)#10,934 |
| 3. | 20852 | 3.6% | 4.2%(-0.661)#199 | 4.1%(-0.578)#12,598 |
| 4. | 20850 | 2.5% | 4.2%(-1.69)#283 | 4.1%(-1.61)#17,922 |
1
Common Questions
What are the Top 3 Zip Codes with the Highest Percentage of Population Employed in Administrative & Support Services in Rockville, MD?
Top 3 Zip Codes with the Highest Percentage of Population Employed in Administrative & Support Services in Rockville, MD are:
What zip code has the Highest Percentage of Population Employed in Administrative & Support Services in Rockville, MD?
20851 has the Highest Percentage of Population Employed in Administrative & Support Services in Rockville, MD with 5.8%.
What is the Percentage of Population Employed in Administrative & Support Services in Rockville, MD?
Percentage of Population Employed in Administrative & Support Services in Rockville is 3.8%.
What is the Percentage of Population Employed in Administrative & Support Services in Maryland?
Percentage of Population Employed in Administrative & Support Services in Maryland is 4.2%.
What is the Percentage of Population Employed in Administrative & Support Services in the United States?
Percentage of Population Employed in Administrative & Support Services in the United States is 4.1%.