Chillum, MD Map & Demographics
Chillum Map
Chillum Overview
$30,121
PER CAPITA INCOME
$75,844
AVG FAMILY INCOME
$74,479
AVG HOUSEHOLD INCOME
23.7%
WAGE / INCOME GAP [ % ]
76.3¢/ $1
WAGE / INCOME GAP [ $ ]
$11,650
FAMILY INCOME DEFICIT
0.41
INEQUALITY / GINI INDEX
35,908
TOTAL POPULATION
17,762
MALE POPULATION
18,146
FEMALE POPULATION
97.88
MALES / 100 FEMALES
102.16
FEMALES / 100 MALES
35.3
MEDIAN AGE
3.8
AVG FAMILY SIZE
3.2
AVG HOUSEHOLD SIZE
19,604
LABOR FORCE [ PEOPLE ]
70.9%
PERCENT IN LABOR FORCE
6.1%
UNEMPLOYMENT RATE
Income in Chillum
Income Overview in Chillum
Per Capita Income in Chillum is $30,121, while median incomes of families and households are $75,844 and $74,479 respectively.
| Characteristic | Number | Measure |
| Per Capita Income | 35,908 | $30,121 |
| Median Family Income | 7,516 | $75,844 |
| Mean Family Income | 7,516 | $98,461 |
| Median Household Income | 10,990 | $74,479 |
| Mean Household Income | 10,990 | $92,743 |
| Income Deficit | 7,516 | $11,650 |
| Wage / Income Gap (%) | 35,908 | 23.70% |
| Wage / Income Gap ($) | 35,908 | 76.30¢ per $1 |
| Gini / Inequality Index | 35,908 | 0.41 |
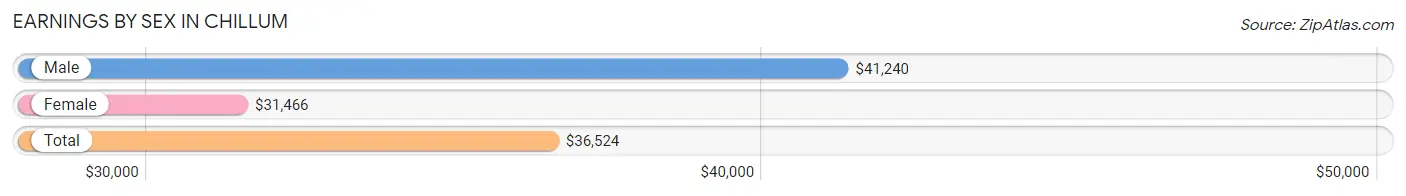
Earnings by Sex in Chillum
Average Earnings in Chillum are $36,524, $41,240 for men and $31,466 for women, a difference of 23.7%.
| Sex | Number | Average Earnings |
| Male | 10,982 (56.0%) | $41,240 |
| Female | 8,640 (44.0%) | $31,466 |
| Total | 19,622 (100.0%) | $36,524 |
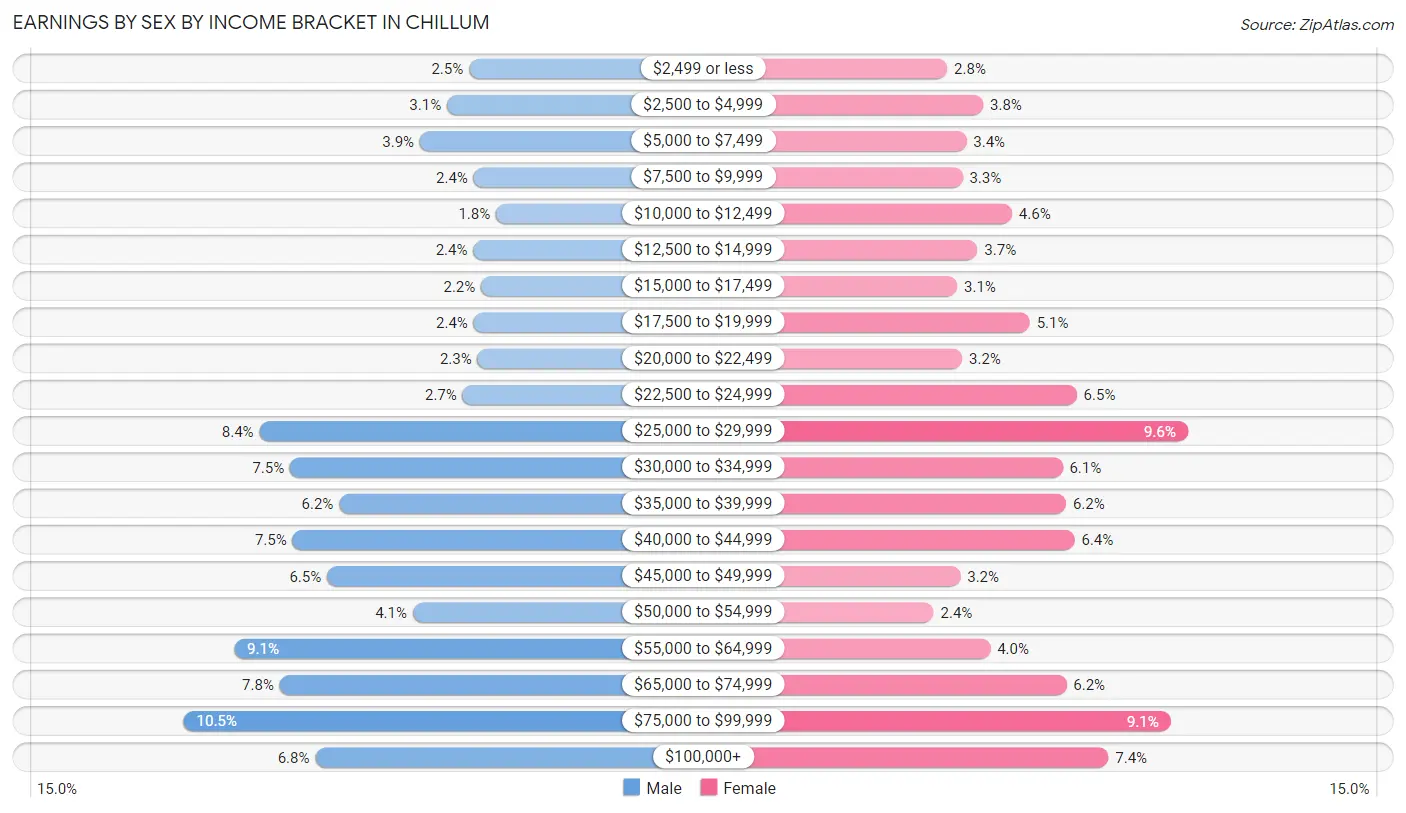
Earnings by Sex by Income Bracket in Chillum
The most common earnings brackets in Chillum are $75,000 to $99,999 for men (1,156 | 10.5%) and $25,000 to $29,999 for women (828 | 9.6%).
| Income | Male | Female |
| $2,499 or less | 276 (2.5%) | 244 (2.8%) |
| $2,500 to $4,999 | 344 (3.1%) | 331 (3.8%) |
| $5,000 to $7,499 | 427 (3.9%) | 290 (3.4%) |
| $7,500 to $9,999 | 261 (2.4%) | 281 (3.3%) |
| $10,000 to $12,499 | 192 (1.8%) | 401 (4.6%) |
| $12,500 to $14,999 | 262 (2.4%) | 317 (3.7%) |
| $15,000 to $17,499 | 238 (2.2%) | 268 (3.1%) |
| $17,500 to $19,999 | 261 (2.4%) | 444 (5.1%) |
| $20,000 to $22,499 | 249 (2.3%) | 280 (3.2%) |
| $22,500 to $24,999 | 295 (2.7%) | 558 (6.5%) |
| $25,000 to $29,999 | 922 (8.4%) | 828 (9.6%) |
| $30,000 to $34,999 | 828 (7.5%) | 524 (6.1%) |
| $35,000 to $39,999 | 677 (6.2%) | 532 (6.2%) |
| $40,000 to $44,999 | 820 (7.5%) | 553 (6.4%) |
| $45,000 to $49,999 | 714 (6.5%) | 276 (3.2%) |
| $50,000 to $54,999 | 449 (4.1%) | 211 (2.4%) |
| $55,000 to $64,999 | 1,001 (9.1%) | 348 (4.0%) |
| $65,000 to $74,999 | 860 (7.8%) | 533 (6.2%) |
| $75,000 to $99,999 | 1,156 (10.5%) | 786 (9.1%) |
| $100,000+ | 750 (6.8%) | 635 (7.3%) |
| Total | 10,982 (100.0%) | 8,640 (100.0%) |
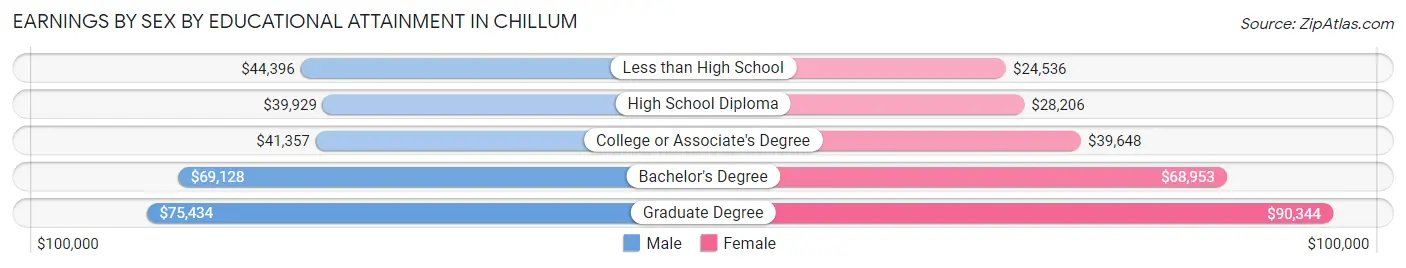
Earnings by Sex by Educational Attainment in Chillum
Average earnings in Chillum are $45,613 for men and $34,564 for women, a difference of 24.2%. Men with an educational attainment of graduate degree enjoy the highest average annual earnings of $75,434, while those with high school diploma education earn the least with $39,929. Women with an educational attainment of graduate degree earn the most with the average annual earnings of $90,344, while those with less than high school education have the smallest earnings of $24,536.
| Educational Attainment | Male Income | Female Income |
| Less than High School | $44,396 | $24,536 |
| High School Diploma | $39,929 | $28,206 |
| College or Associate's Degree | $41,357 | $39,648 |
| Bachelor's Degree | $69,128 | $68,953 |
| Graduate Degree | $75,434 | $90,344 |
| Total | $45,613 | $34,564 |
Family Income in Chillum
Family Income Brackets in Chillum
According to the Chillum family income data, there are 1,826 families falling into the $50,000 to $74,999 income range, which is the most common income bracket and makes up 24.3% of all families. Conversely, the $10,000 to $14,999 income bracket is the least frequent group with only 165 families (2.2%) belonging to this category.
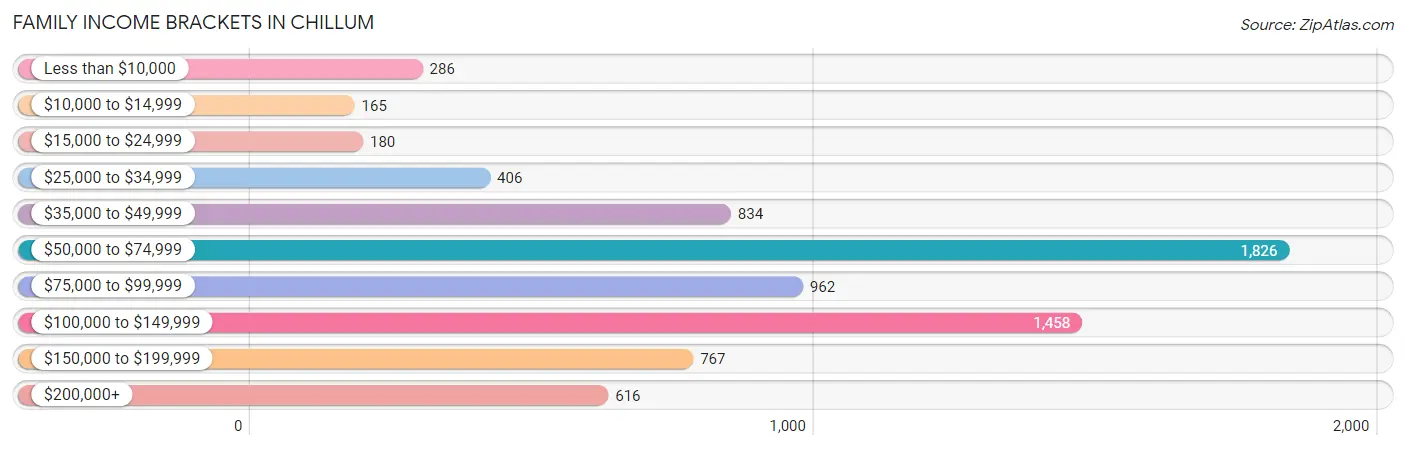
| Income Bracket | # Families | % Families |
| Less than $10,000 | 286 | 3.8% |
| $10,000 to $14,999 | 165 | 2.2% |
| $15,000 to $24,999 | 180 | 2.4% |
| $25,000 to $34,999 | 406 | 5.4% |
| $35,000 to $49,999 | 834 | 11.1% |
| $50,000 to $74,999 | 1,826 | 24.3% |
| $75,000 to $99,999 | 962 | 12.8% |
| $100,000 to $149,999 | 1,458 | 19.4% |
| $150,000 to $199,999 | 767 | 10.2% |
| $200,000+ | 616 | 8.2% |
Family Income by Famaliy Size in Chillum
7+ person families (488 | 6.5%) account for the highest median family income in Chillum with $125,806 per family, while 2-person families (2,688 | 35.8%) have the highest median income of $35,198 per family member.
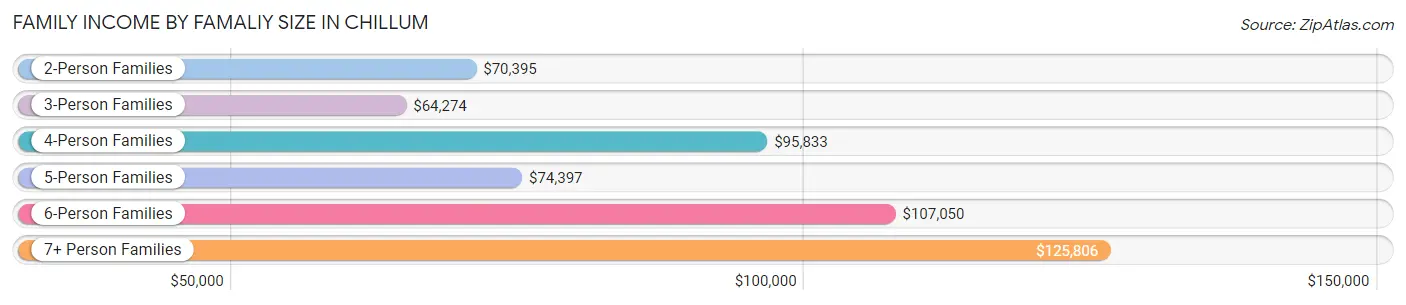
| Income Bracket | # Families | Median Income |
| 2-Person Families | 2,688 (35.8%) | $70,395 |
| 3-Person Families | 1,676 (22.3%) | $64,274 |
| 4-Person Families | 1,444 (19.2%) | $95,833 |
| 5-Person Families | 822 (10.9%) | $74,397 |
| 6-Person Families | 398 (5.3%) | $107,050 |
| 7+ Person Families | 488 (6.5%) | $125,806 |
| Total | 7,516 (100.0%) | $75,844 |
Family Income by Number of Earners in Chillum
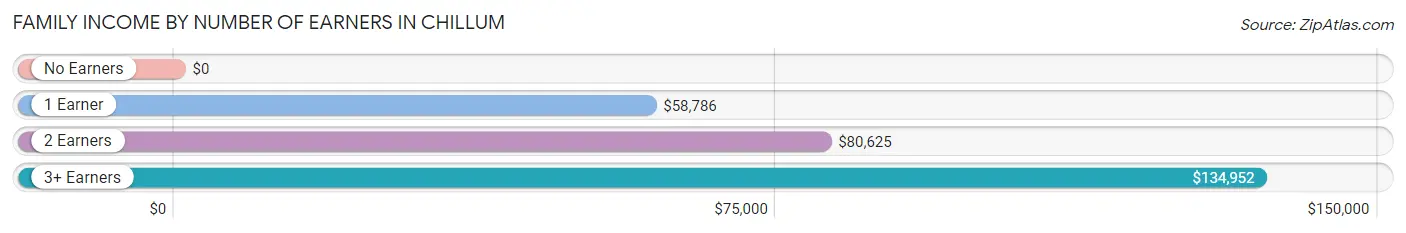
| Number of Earners | # Families | Median Income |
| No Earners | 389 (5.2%) | $0 |
| 1 Earner | 2,636 (35.1%) | $58,786 |
| 2 Earners | 2,856 (38.0%) | $80,625 |
| 3+ Earners | 1,635 (21.7%) | $134,952 |
| Total | 7,516 (100.0%) | $75,844 |
Household Income in Chillum
Household Income Brackets in Chillum
With 2,253 households falling in the category, the $50,000 to $74,999 income range is the most frequent in Chillum, accounting for 20.5% of all households. In contrast, only 253 households (2.3%) fall into the $10,000 to $14,999 income bracket, making it the least populous group.
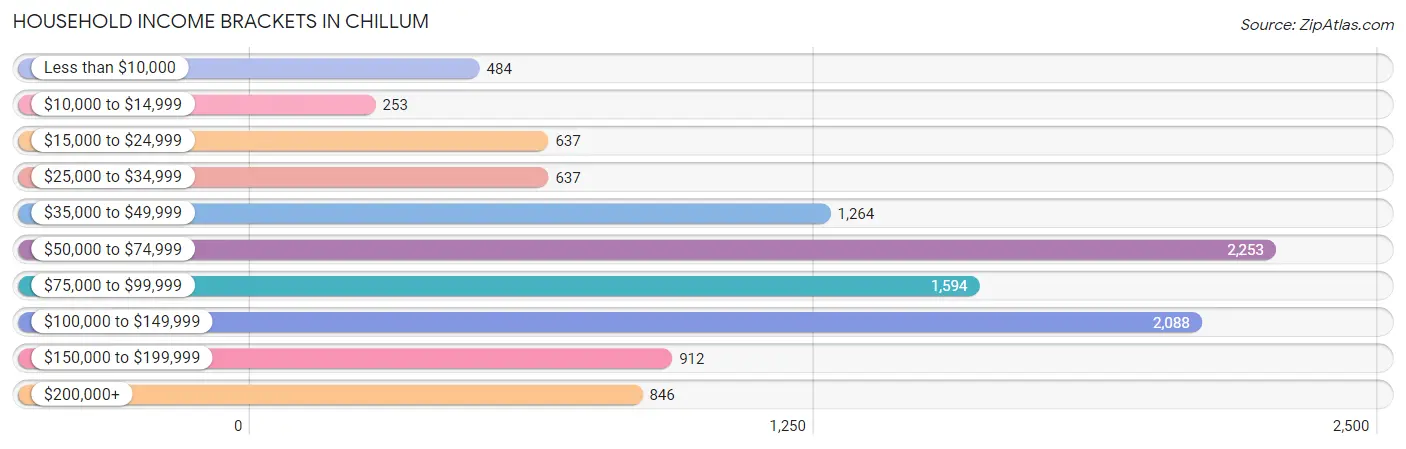
| Income Bracket | # Households | % Households |
| Less than $10,000 | 484 | 4.4% |
| $10,000 to $14,999 | 253 | 2.3% |
| $15,000 to $24,999 | 637 | 5.8% |
| $25,000 to $34,999 | 637 | 5.8% |
| $35,000 to $49,999 | 1,264 | 11.5% |
| $50,000 to $74,999 | 2,253 | 20.5% |
| $75,000 to $99,999 | 1,594 | 14.5% |
| $100,000 to $149,999 | 2,088 | 19.0% |
| $150,000 to $199,999 | 912 | 8.3% |
| $200,000+ | 846 | 7.7% |
Household Income by Householder Age in Chillum
The median household income in Chillum is $74,479, with the highest median household income of $90,376 found in the 45 to 64 years age bracket for the primary householder. A total of 4,140 households (37.7%) fall into this category. Meanwhile, the 15 to 24 years age bracket for the primary householder has the lowest median household income of $0, with 349 households (3.2%) in this group.
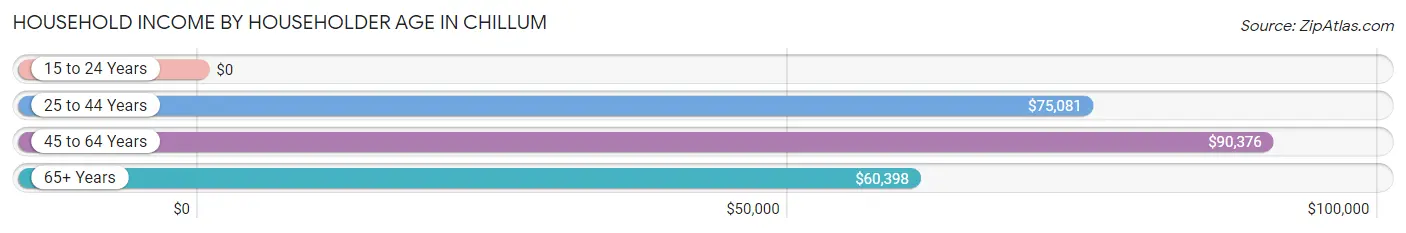
| Income Bracket | # Households | Median Income |
| 15 to 24 Years | 349 (3.2%) | $0 |
| 25 to 44 Years | 3,804 (34.6%) | $75,081 |
| 45 to 64 Years | 4,140 (37.7%) | $90,376 |
| 65+ Years | 2,697 (24.5%) | $60,398 |
| Total | 10,990 (100.0%) | $74,479 |
Poverty in Chillum
Income Below Poverty by Sex and Age in Chillum
With 9.8% poverty level for males and 13.9% for females among the residents of Chillum, 5 year old males and 15 year old females are the most vulnerable to poverty, with 50 males (37.6%) and 94 females (57.7%) in their respective age groups living below the poverty level.
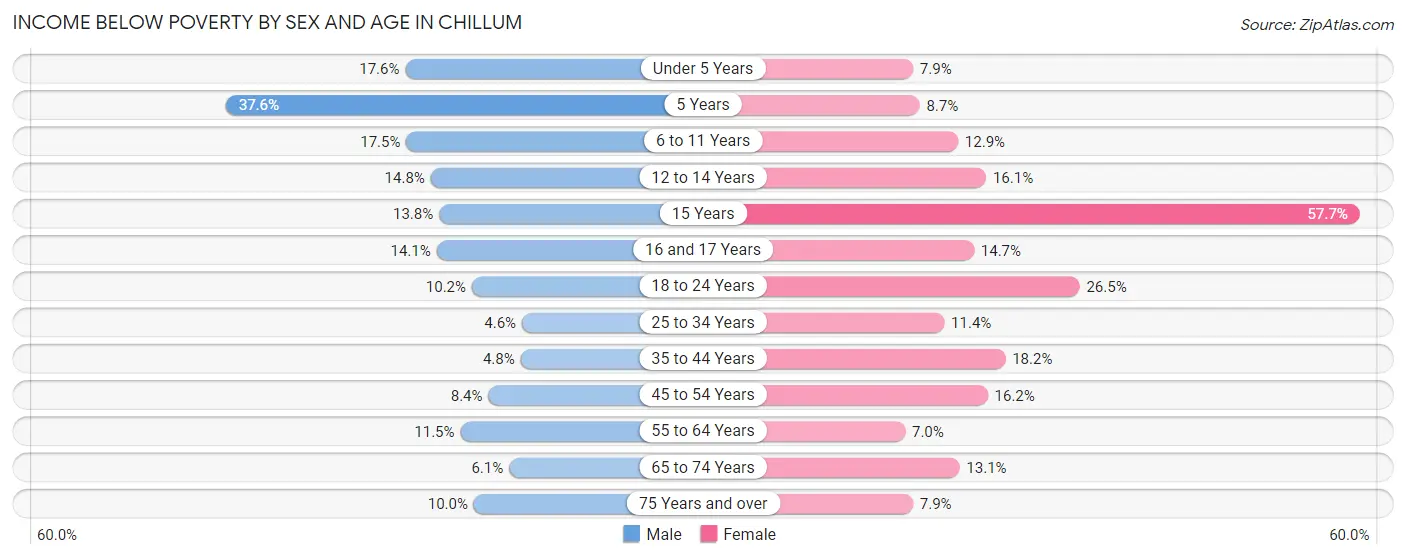
| Age Bracket | Male | Female |
| Under 5 Years | 219 (17.6%) | 119 (7.9%) |
| 5 Years | 50 (37.6%) | 18 (8.6%) |
| 6 to 11 Years | 319 (17.5%) | 191 (12.9%) |
| 12 to 14 Years | 69 (14.8%) | 127 (16.1%) |
| 15 Years | 22 (13.8%) | 94 (57.7%) |
| 16 and 17 Years | 72 (14.1%) | 50 (14.7%) |
| 18 to 24 Years | 172 (10.2%) | 351 (26.5%) |
| 25 to 34 Years | 124 (4.6%) | 329 (11.4%) |
| 35 to 44 Years | 142 (4.8%) | 432 (18.2%) |
| 45 to 54 Years | 187 (8.4%) | 321 (16.2%) |
| 55 to 64 Years | 201 (11.5%) | 158 (7.0%) |
| 65 to 74 Years | 65 (6.0%) | 206 (13.1%) |
| 75 Years and over | 61 (10.0%) | 71 (7.9%) |
| Total | 1,703 (9.8%) | 2,467 (13.9%) |
Income Above Poverty by Sex and Age in Chillum
According to the poverty statistics in Chillum, males aged 25 to 34 years and females aged 55 to 64 years are the age groups that are most secure financially, with 95.4% of males and 93.0% of females in these age groups living above the poverty line.
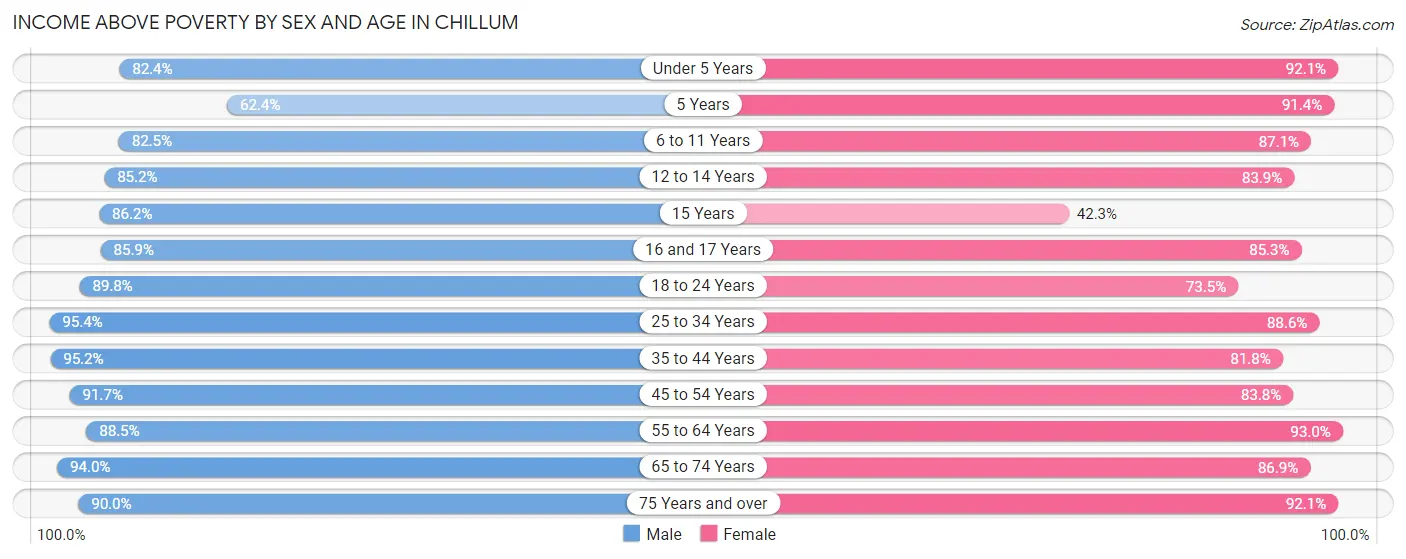
| Age Bracket | Male | Female |
| Under 5 Years | 1,025 (82.4%) | 1,383 (92.1%) |
| 5 Years | 83 (62.4%) | 190 (91.3%) |
| 6 to 11 Years | 1,505 (82.5%) | 1,286 (87.1%) |
| 12 to 14 Years | 398 (85.2%) | 664 (83.9%) |
| 15 Years | 137 (86.2%) | 69 (42.3%) |
| 16 and 17 Years | 438 (85.9%) | 290 (85.3%) |
| 18 to 24 Years | 1,516 (89.8%) | 975 (73.5%) |
| 25 to 34 Years | 2,568 (95.4%) | 2,558 (88.6%) |
| 35 to 44 Years | 2,834 (95.2%) | 1,942 (81.8%) |
| 45 to 54 Years | 2,052 (91.6%) | 1,655 (83.8%) |
| 55 to 64 Years | 1,552 (88.5%) | 2,085 (93.0%) |
| 65 to 74 Years | 1,010 (94.0%) | 1,366 (86.9%) |
| 75 Years and over | 551 (90.0%) | 827 (92.1%) |
| Total | 15,669 (90.2%) | 15,290 (86.1%) |
Income Below Poverty Among Married-Couple Families in Chillum
The poverty statistics for married-couple families in Chillum show that 7.1% or 287 of the total 4,013 families live below the poverty line. Families with 3 or 4 children have the highest poverty rate of 9.7%, comprising of 37 families. On the other hand, families with 5 or more children have the lowest poverty rate of 0.0%, which includes 0 families.
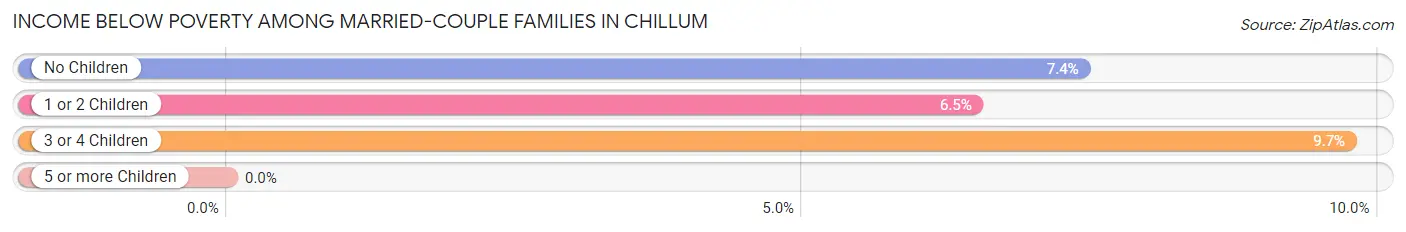
| Children | Above Poverty | Below Poverty |
| No Children | 1,684 (92.6%) | 135 (7.4%) |
| 1 or 2 Children | 1,656 (93.5%) | 115 (6.5%) |
| 3 or 4 Children | 343 (90.3%) | 37 (9.7%) |
| 5 or more Children | 43 (100.0%) | 0 (0.0%) |
| Total | 3,726 (92.8%) | 287 (7.1%) |
Income Below Poverty Among Single-Parent Households in Chillum
According to the poverty data in Chillum, 6.8% or 78 single-father households and 17.1% or 403 single-mother households are living below the poverty line. Among single-father households, those with 1 or 2 children have the highest poverty rate, with 67 households (19.1%) experiencing poverty. Likewise, among single-mother households, those with 3 or 4 children have the highest poverty rate, with 143 households (53.6%) falling below the poverty line.
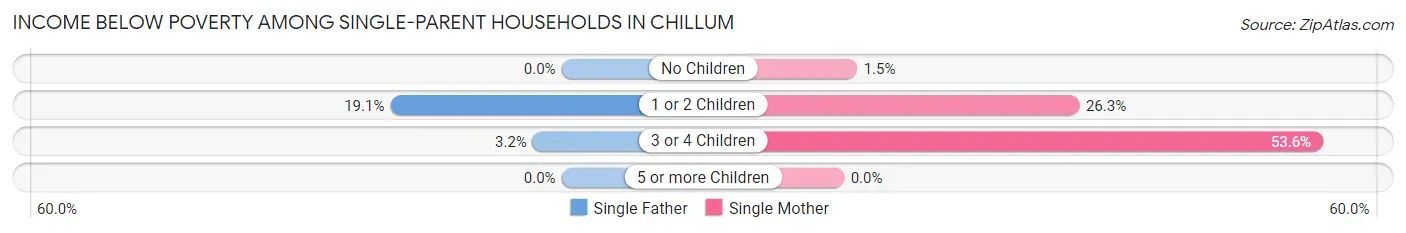
| Children | Single Father | Single Mother |
| No Children | 0 (0.0%) | 17 (1.5%) |
| 1 or 2 Children | 67 (19.1%) | 243 (26.3%) |
| 3 or 4 Children | 11 (3.2%) | 143 (53.6%) |
| 5 or more Children | 0 (0.0%) | 0 (0.0%) |
| Total | 78 (6.8%) | 403 (17.1%) |
Income Below Poverty Among Married-Couple vs Single-Parent Households in Chillum
The poverty data for Chillum shows that 287 of the married-couple family households (7.1%) and 481 of the single-parent households (13.7%) are living below the poverty level. Within the married-couple family households, those with 3 or 4 children have the highest poverty rate, with 37 households (9.7%) falling below the poverty line. Among the single-parent households, those with 3 or 4 children have the highest poverty rate, with 154 household (25.3%) living below poverty.
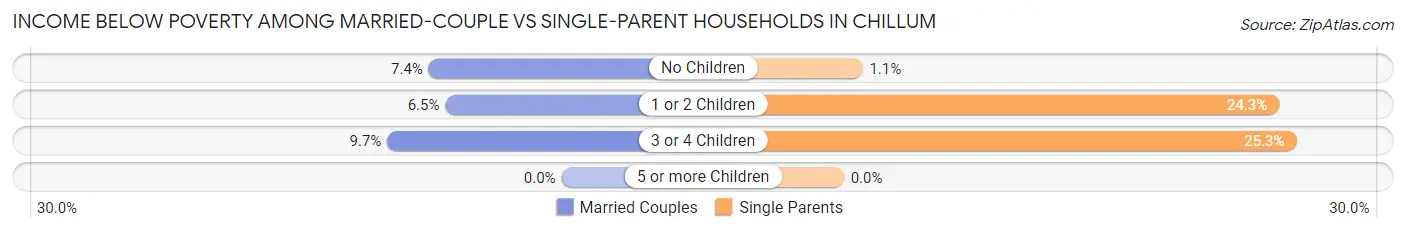
| Children | Married-Couple Families | Single-Parent Households |
| No Children | 135 (7.4%) | 17 (1.1%) |
| 1 or 2 Children | 115 (6.5%) | 310 (24.3%) |
| 3 or 4 Children | 37 (9.7%) | 154 (25.3%) |
| 5 or more Children | 0 (0.0%) | 0 (0.0%) |
| Total | 287 (7.1%) | 481 (13.7%) |
Race in Chillum
The most populous races in Chillum are Hispanic or Latino (17,508 | 48.8%), Black / African American (15,513 | 43.2%), and Some other Race (14,848 | 41.3%).
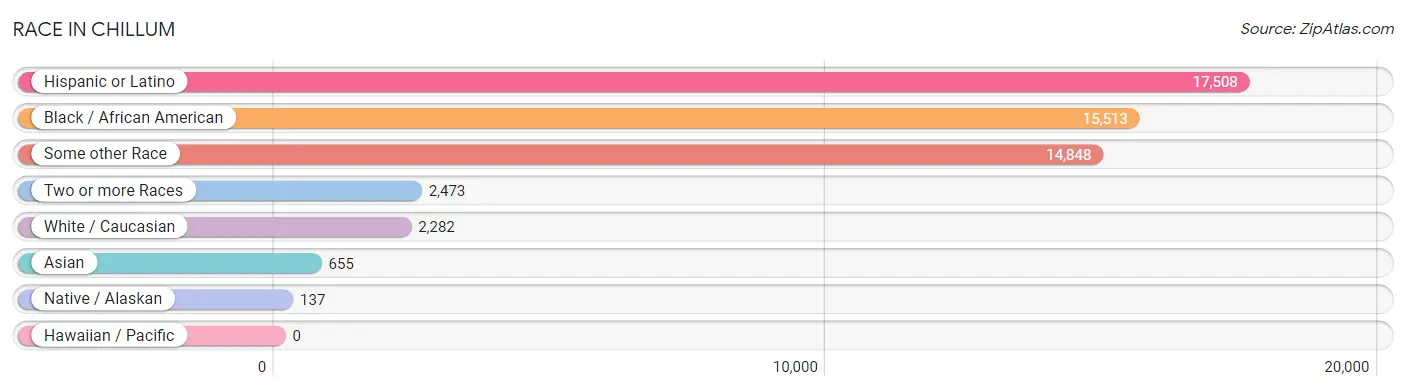
| Race | # Population | % Population |
| Asian | 655 | 1.8% |
| Black / African American | 15,513 | 43.2% |
| Hawaiian / Pacific | 0 | 0.0% |
| Hispanic or Latino | 17,508 | 48.8% |
| Native / Alaskan | 137 | 0.4% |
| White / Caucasian | 2,282 | 6.4% |
| Two or more Races | 2,473 | 6.9% |
| Some other Race | 14,848 | 41.3% |
| Total | 35,908 | 100.0% |
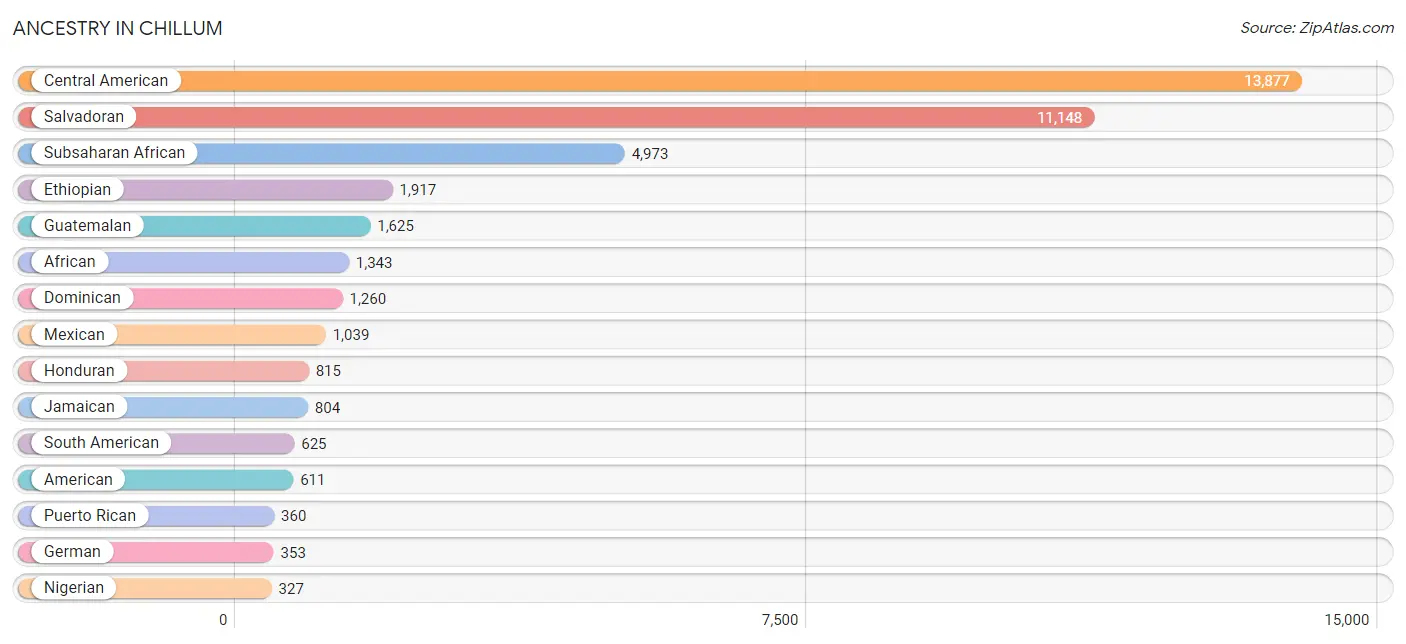
Ancestry in Chillum
The most populous ancestries reported in Chillum are Central American (13,877 | 38.7%), Salvadoran (11,148 | 31.0%), Subsaharan African (4,973 | 13.9%), Ethiopian (1,917 | 5.3%), and Guatemalan (1,625 | 4.5%), together accounting for 93.4% of all Chillum residents.
| Ancestry | # Population | % Population |
| Afghan | 92 | 0.3% |
| African | 1,343 | 3.7% |
| Albanian | 57 | 0.2% |
| American | 611 | 1.7% |
| Arab | 42 | 0.1% |
| Argentinean | 25 | 0.1% |
| Armenian | 3 | 0.0% |
| Austrian | 20 | 0.1% |
| Bhutanese | 8 | 0.0% |
| Blackfeet | 177 | 0.5% |
| Bolivian | 189 | 0.5% |
| British | 25 | 0.1% |
| Burmese | 28 | 0.1% |
| Canadian | 15 | 0.0% |
| Central American | 13,877 | 38.7% |
| Central American Indian | 60 | 0.2% |
| Cherokee | 27 | 0.1% |
| Colombian | 180 | 0.5% |
| Croatian | 35 | 0.1% |
| Danish | 39 | 0.1% |
| Delaware | 51 | 0.1% |
| Dominican | 1,260 | 3.5% |
| Dutch | 12 | 0.0% |
| Ecuadorian | 4 | 0.0% |
| Egyptian | 20 | 0.1% |
| English | 177 | 0.5% |
| Ethiopian | 1,917 | 5.3% |
| European | 71 | 0.2% |
| French | 28 | 0.1% |
| German | 353 | 1.0% |
| Ghanaian | 157 | 0.4% |
| Guatemalan | 1,625 | 4.5% |
| Guyanese | 59 | 0.2% |
| Haitian | 263 | 0.7% |
| Honduran | 815 | 2.3% |
| Hungarian | 13 | 0.0% |
| Indian (Asian) | 104 | 0.3% |
| Irish | 244 | 0.7% |
| Israeli | 15 | 0.0% |
| Italian | 218 | 0.6% |
| Jamaican | 804 | 2.2% |
| Japanese | 30 | 0.1% |
| Kenyan | 118 | 0.3% |
| Korean | 104 | 0.3% |
| Liberian | 282 | 0.8% |
| Lumbee | 39 | 0.1% |
| Mexican | 1,039 | 2.9% |
| Mexican American Indian | 33 | 0.1% |
| Nicaraguan | 288 | 0.8% |
| Nigerian | 327 | 0.9% |
| Norwegian | 15 | 0.0% |
| Palestinian | 15 | 0.0% |
| Peruvian | 150 | 0.4% |
| Polish | 81 | 0.2% |
| Portuguese | 36 | 0.1% |
| Puerto Rican | 360 | 1.0% |
| Romanian | 13 | 0.0% |
| Russian | 25 | 0.1% |
| Salvadoran | 11,148 | 31.0% |
| Scandinavian | 18 | 0.1% |
| Scotch-Irish | 11 | 0.0% |
| Scottish | 25 | 0.1% |
| Senegalese | 43 | 0.1% |
| Sierra Leonean | 115 | 0.3% |
| Sioux | 61 | 0.2% |
| Slovak | 4 | 0.0% |
| South African | 6 | 0.0% |
| South American | 625 | 1.7% |
| Spaniard | 15 | 0.0% |
| Sri Lankan | 99 | 0.3% |
| Subsaharan African | 4,973 | 13.9% |
| Swedish | 78 | 0.2% |
| Thai | 79 | 0.2% |
| Trinidadian and Tobagonian | 150 | 0.4% |
| Turkish | 11 | 0.0% |
| U.S. Virgin Islander | 34 | 0.1% |
| Ukrainian | 17 | 0.1% |
| Venezuelan | 77 | 0.2% |
| Vietnamese | 84 | 0.2% |
| Welsh | 25 | 0.1% |
| West Indian | 121 | 0.3% |
| Zimbabwean | 68 | 0.2% | View All 82 Rows |
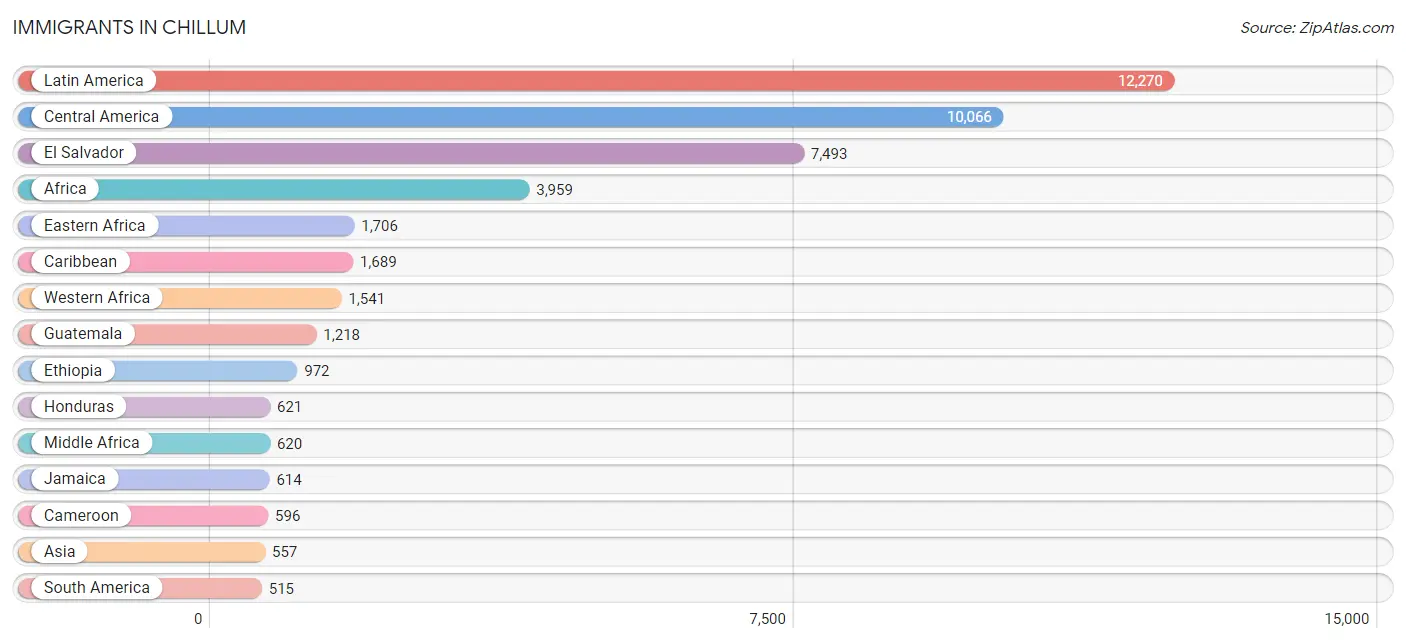
Immigrants in Chillum
The most numerous immigrant groups reported in Chillum came from Latin America (12,270 | 34.2%), Central America (10,066 | 28.0%), El Salvador (7,493 | 20.9%), Africa (3,959 | 11.0%), and Eastern Africa (1,706 | 4.8%), together accounting for 98.8% of all Chillum residents.
| Immigration Origin | # Population | % Population |
| Afghanistan | 92 | 0.3% |
| Africa | 3,959 | 11.0% |
| Argentina | 25 | 0.1% |
| Asia | 557 | 1.5% |
| Bangladesh | 84 | 0.2% |
| Barbados | 40 | 0.1% |
| Bolivia | 133 | 0.4% |
| Cambodia | 15 | 0.0% |
| Cameroon | 596 | 1.7% |
| Canada | 27 | 0.1% |
| Caribbean | 1,689 | 4.7% |
| Central America | 10,066 | 28.0% |
| China | 102 | 0.3% |
| Colombia | 71 | 0.2% |
| Congo | 10 | 0.0% |
| Cuba | 44 | 0.1% |
| Dominican Republic | 478 | 1.3% |
| Eastern Africa | 1,706 | 4.8% |
| Eastern Asia | 122 | 0.3% |
| Eastern Europe | 86 | 0.2% |
| El Salvador | 7,493 | 20.9% |
| Eritrea | 377 | 1.1% |
| Ethiopia | 972 | 2.7% |
| Europe | 99 | 0.3% |
| Ghana | 238 | 0.7% |
| Grenada | 13 | 0.0% |
| Guatemala | 1,218 | 3.4% |
| Guyana | 88 | 0.3% |
| Haiti | 149 | 0.4% |
| Honduras | 621 | 1.7% |
| Hong Kong | 24 | 0.1% |
| India | 2 | 0.0% |
| Iran | 3 | 0.0% |
| Italy | 13 | 0.0% |
| Jamaica | 614 | 1.7% |
| Kenya | 91 | 0.3% |
| Korea | 20 | 0.1% |
| Latin America | 12,270 | 34.2% |
| Liberia | 223 | 0.6% |
| Mexico | 435 | 1.2% |
| Middle Africa | 620 | 1.7% |
| Nepal | 41 | 0.1% |
| Nicaragua | 299 | 0.8% |
| Nigeria | 324 | 0.9% |
| Pakistan | 18 | 0.1% |
| Peru | 103 | 0.3% |
| Philippines | 72 | 0.2% |
| Romania | 9 | 0.0% |
| Russia | 7 | 0.0% |
| Saudi Arabia | 7 | 0.0% |
| Senegal | 43 | 0.1% |
| Sierra Leone | 271 | 0.7% |
| South Africa | 6 | 0.0% |
| South America | 515 | 1.4% |
| South Central Asia | 243 | 0.7% |
| South Eastern Asia | 174 | 0.5% |
| Southern Europe | 13 | 0.0% |
| Trinidad and Tobago | 316 | 0.9% |
| Turkey | 11 | 0.0% |
| Ukraine | 13 | 0.0% |
| Venezuela | 95 | 0.3% |
| Vietnam | 87 | 0.2% |
| Western Africa | 1,541 | 4.3% |
| Western Asia | 18 | 0.1% |
| Zimbabwe | 142 | 0.4% | View All 65 Rows |
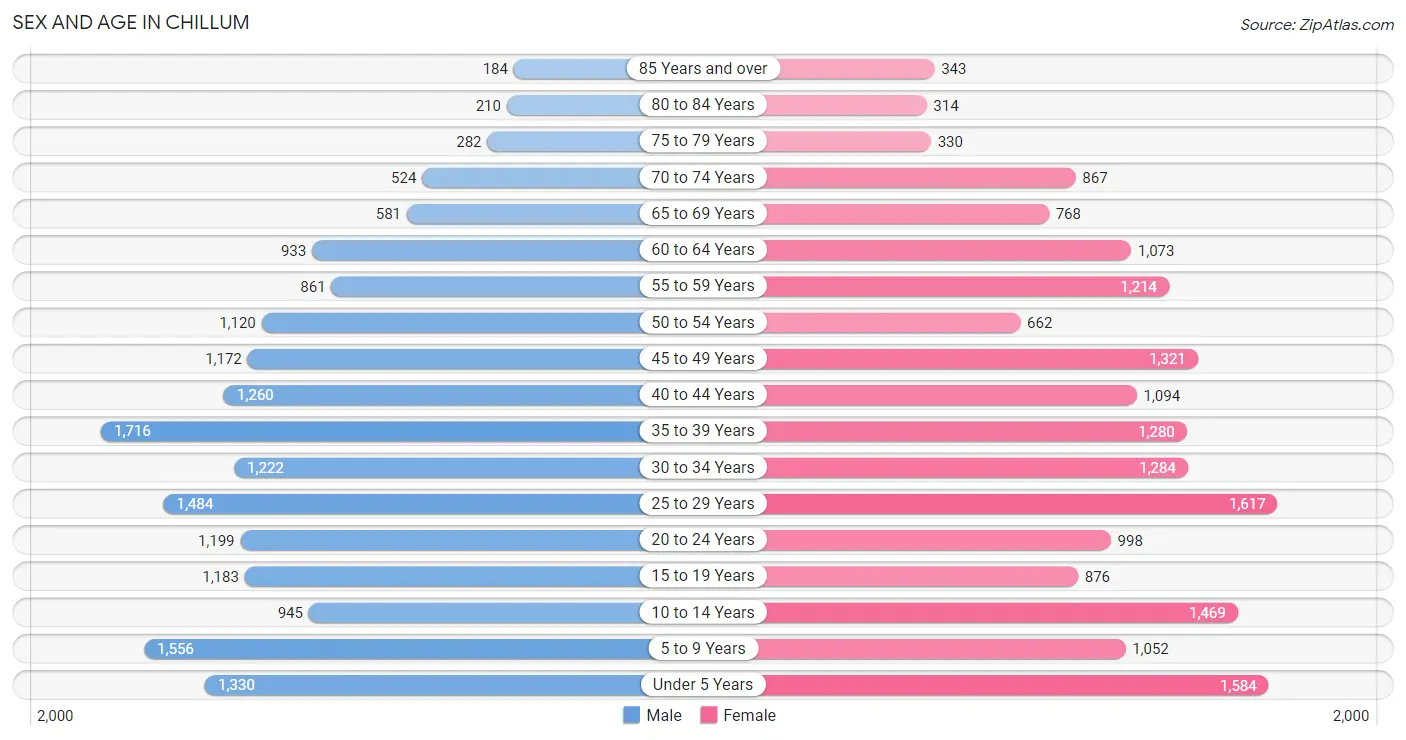
Sex and Age in Chillum
Sex and Age in Chillum
The most populous age groups in Chillum are 35 to 39 Years (1,716 | 9.7%) for men and 25 to 29 Years (1,617 | 8.9%) for women.
| Age Bracket | Male | Female |
| Under 5 Years | 1,330 (7.5%) | 1,584 (8.7%) |
| 5 to 9 Years | 1,556 (8.8%) | 1,052 (5.8%) |
| 10 to 14 Years | 945 (5.3%) | 1,469 (8.1%) |
| 15 to 19 Years | 1,183 (6.7%) | 876 (4.8%) |
| 20 to 24 Years | 1,199 (6.8%) | 998 (5.5%) |
| 25 to 29 Years | 1,484 (8.4%) | 1,617 (8.9%) |
| 30 to 34 Years | 1,222 (6.9%) | 1,284 (7.1%) |
| 35 to 39 Years | 1,716 (9.7%) | 1,280 (7.0%) |
| 40 to 44 Years | 1,260 (7.1%) | 1,094 (6.0%) |
| 45 to 49 Years | 1,172 (6.6%) | 1,321 (7.3%) |
| 50 to 54 Years | 1,120 (6.3%) | 662 (3.6%) |
| 55 to 59 Years | 861 (4.9%) | 1,214 (6.7%) |
| 60 to 64 Years | 933 (5.2%) | 1,073 (5.9%) |
| 65 to 69 Years | 581 (3.3%) | 768 (4.2%) |
| 70 to 74 Years | 524 (2.9%) | 867 (4.8%) |
| 75 to 79 Years | 282 (1.6%) | 330 (1.8%) |
| 80 to 84 Years | 210 (1.2%) | 314 (1.7%) |
| 85 Years and over | 184 (1.0%) | 343 (1.9%) |
| Total | 17,762 (100.0%) | 18,146 (100.0%) |
Families and Households in Chillum
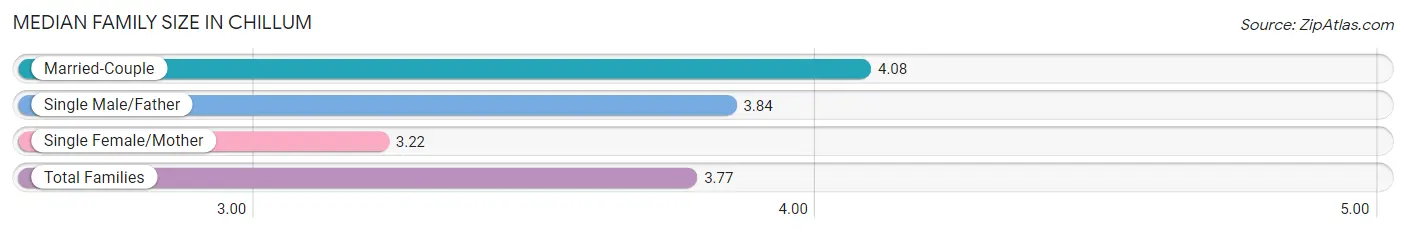
Median Family Size in Chillum
The median family size in Chillum is 3.77 persons per family, with married-couple families (4,013 | 53.4%) accounting for the largest median family size of 4.08 persons per family. On the other hand, single female/mother families (2,357 | 31.4%) represent the smallest median family size with 3.22 persons per family.
| Family Type | # Families | Family Size |
| Married-Couple | 4,013 (53.4%) | 4.08 |
| Single Male/Father | 1,146 (15.2%) | 3.84 |
| Single Female/Mother | 2,357 (31.4%) | 3.22 |
| Total Families | 7,516 (100.0%) | 3.77 |
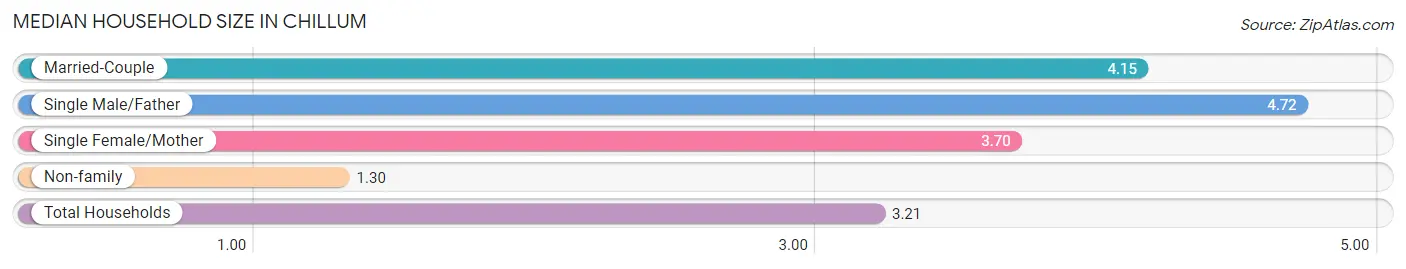
Median Household Size in Chillum
The median household size in Chillum is 3.21 persons per household, with single male/father households (1,146 | 10.4%) accounting for the largest median household size of 4.72 persons per household. non-family households (3,474 | 31.6%) represent the smallest median household size with 1.30 persons per household.
| Household Type | # Households | Household Size |
| Married-Couple | 4,013 (36.5%) | 4.15 |
| Single Male/Father | 1,146 (10.4%) | 4.72 |
| Single Female/Mother | 2,357 (21.4%) | 3.70 |
| Non-family | 3,474 (31.6%) | 1.30 |
| Total Households | 10,990 (100.0%) | 3.21 |
Household Size by Marriage Status in Chillum
Out of a total of 10,990 households in Chillum, 7,516 (68.4%) are family households, while 3,474 (31.6%) are nonfamily households. The most numerous type of family households are 2-person households, comprising 2,011, and the most common type of nonfamily households are 1-person households, comprising 2,806.
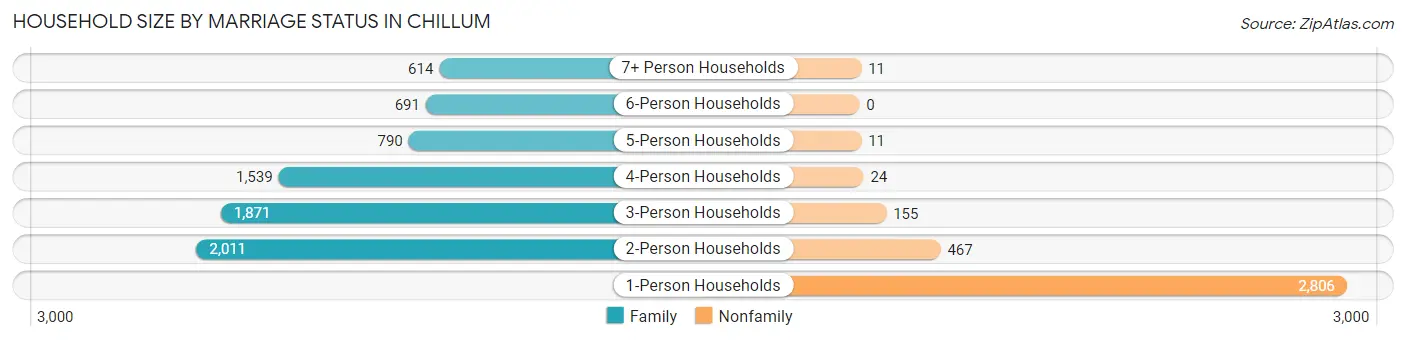
| Household Size | Family Households | Nonfamily Households |
| 1-Person Households | - | 2,806 (25.5%) |
| 2-Person Households | 2,011 (18.3%) | 467 (4.3%) |
| 3-Person Households | 1,871 (17.0%) | 155 (1.4%) |
| 4-Person Households | 1,539 (14.0%) | 24 (0.2%) |
| 5-Person Households | 790 (7.2%) | 11 (0.1%) |
| 6-Person Households | 691 (6.3%) | 0 (0.0%) |
| 7+ Person Households | 614 (5.6%) | 11 (0.1%) |
| Total | 7,516 (68.4%) | 3,474 (31.6%) |
Female Fertility in Chillum
Fertility by Age in Chillum
Average fertility rate in Chillum is 59.0 births per 1,000 women. Women in the age bracket of 20 to 34 years have the highest fertility rate with 70.0 births per 1,000 women. Women in the age bracket of 20 to 34 years acount for 54.3% of all women with births.
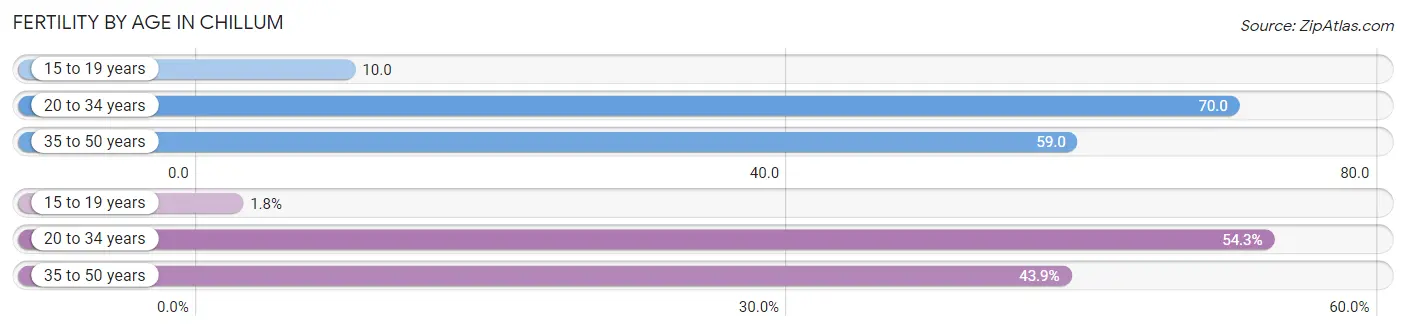
| Age Bracket | Women with Births | Births / 1,000 Women |
| 15 to 19 years | 9 (1.8%) | 10.0 |
| 20 to 34 years | 273 (54.3%) | 70.0 |
| 35 to 50 years | 221 (43.9%) | 59.0 |
| Total | 503 (100.0%) | 59.0 |
Fertility by Age by Marriage Status in Chillum
59.0% of women with births (503) in Chillum are married. The highest percentage of unmarried women with births falls into 15 to 19 years age bracket with 100.0% of them unmarried at the time of birth, while the lowest percentage of unmarried women with births belong to 35 to 50 years age bracket with 38.0% of them unmarried.
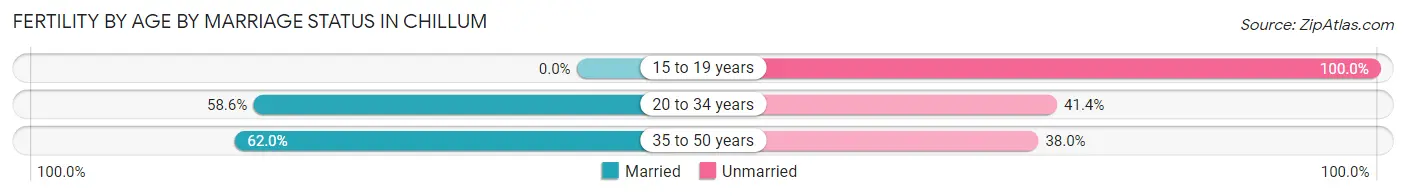
| Age Bracket | Married | Unmarried |
| 15 to 19 years | 0 (0.0%) | 9 (100.0%) |
| 20 to 34 years | 160 (58.6%) | 113 (41.4%) |
| 35 to 50 years | 137 (62.0%) | 84 (38.0%) |
| Total | 297 (59.1%) | 206 (40.9%) |
Fertility by Education in Chillum
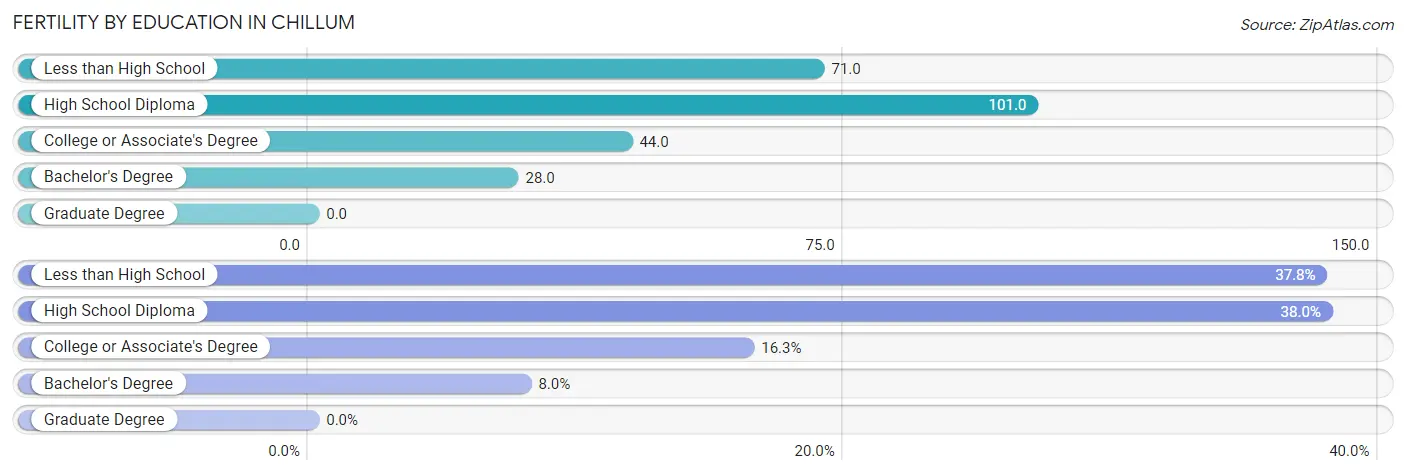
| Educational Attainment | Women with Births | Births / 1,000 Women |
| Less than High School | 190 (37.8%) | 71.0 |
| High School Diploma | 191 (38.0%) | 101.0 |
| College or Associate's Degree | 82 (16.3%) | 44.0 |
| Bachelor's Degree | 40 (8.0%) | 28.0 |
| Graduate Degree | 0 (0.0%) | 0.0 |
| Total | 503 (100.0%) | 59.0 |
Fertility by Education by Marriage Status in Chillum
40.9% of women with births in Chillum are unmarried. Women with the educational attainment of high school diploma are most likely to be married with 94.2% of them married at childbirth, while women with the educational attainment of less than high school are least likely to be married with 70.5% of them unmarried at childbirth.
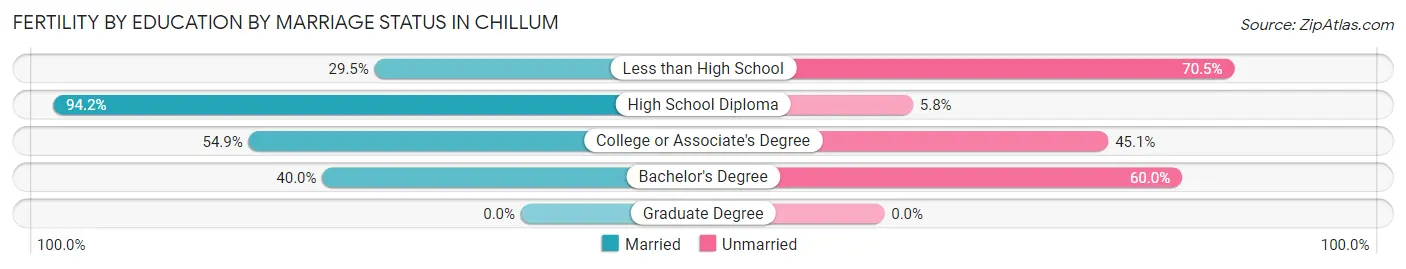
| Educational Attainment | Married | Unmarried |
| Less than High School | 56 (29.5%) | 134 (70.5%) |
| High School Diploma | 180 (94.2%) | 11 (5.8%) |
| College or Associate's Degree | 45 (54.9%) | 37 (45.1%) |
| Bachelor's Degree | 16 (40.0%) | 24 (60.0%) |
| Graduate Degree | 0 (0.0%) | 0 (0.0%) |
| Total | 297 (59.1%) | 206 (40.9%) |
Employment Characteristics in Chillum
Employment by Class of Employer in Chillum
Among the 17,889 employed individuals in Chillum, private company employees (12,878 | 72.0%), federal government employees (1,247 | 7.0%), and not-for-profit organizations (1,214 | 6.8%) make up the most common classes of employment.
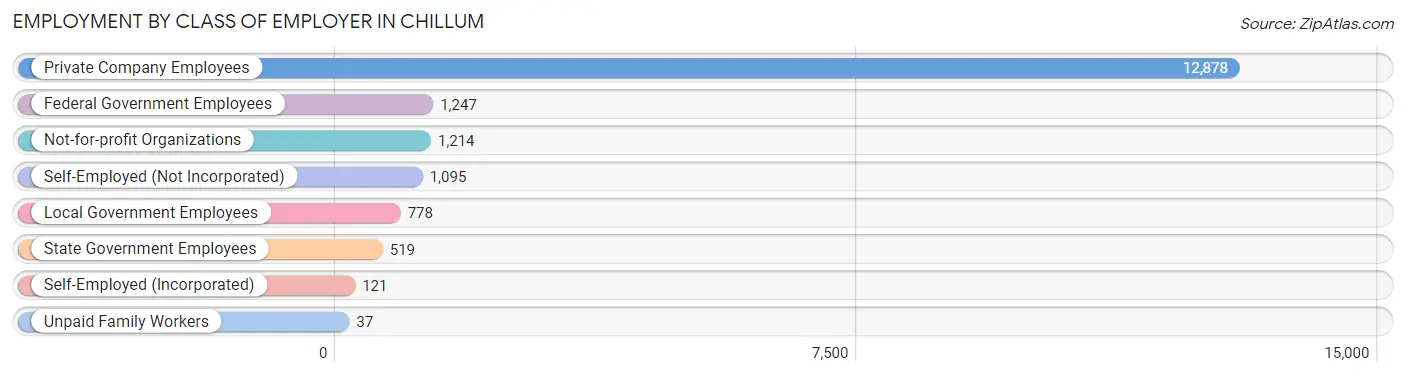
| Employer Class | # Employees | % Employees |
| Private Company Employees | 12,878 | 72.0% |
| Self-Employed (Incorporated) | 121 | 0.7% |
| Self-Employed (Not Incorporated) | 1,095 | 6.1% |
| Not-for-profit Organizations | 1,214 | 6.8% |
| Local Government Employees | 778 | 4.3% |
| State Government Employees | 519 | 2.9% |
| Federal Government Employees | 1,247 | 7.0% |
| Unpaid Family Workers | 37 | 0.2% |
| Total | 17,889 | 100.0% |
Employment Status by Age in Chillum
According to the labor force statistics for Chillum, out of the total population over 16 years of age (27,650), 70.9% or 19,604 individuals are in the labor force, with 6.1% or 1,196 of them unemployed. The age group with the highest labor force participation rate is 30 to 34 years, with 87.8% or 2,200 individuals in the labor force. Within the labor force, the 16 to 19 years age range has the highest percentage of unemployed individuals, with 18.5% or 163 of them being unemployed.
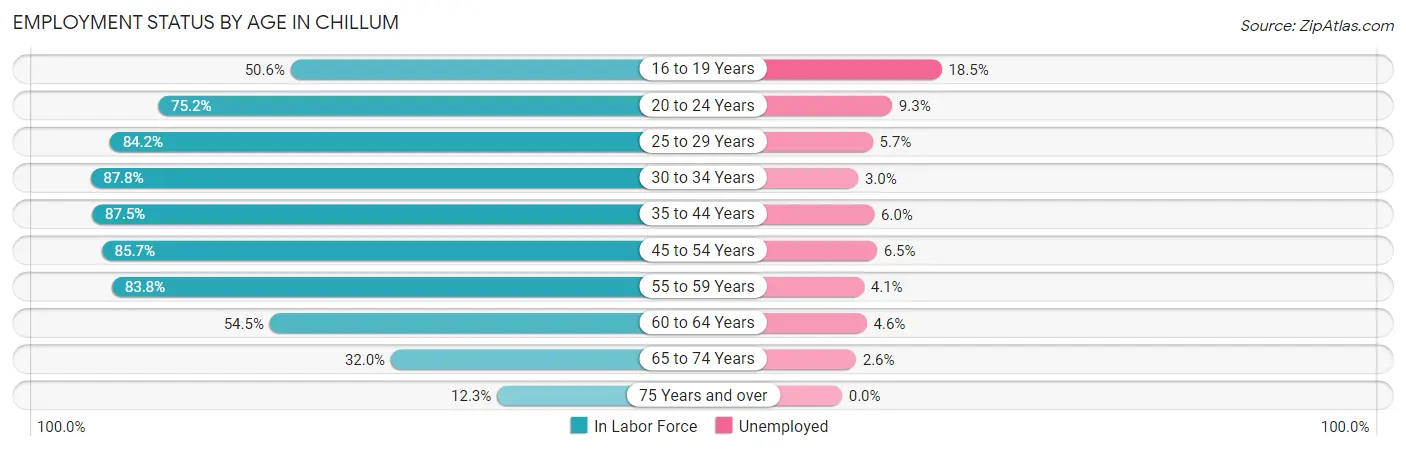
| Age Bracket | In Labor Force | Unemployed |
| 16 to 19 Years | 879 (50.6%) | 163 (18.5%) |
| 20 to 24 Years | 1,652 (75.2%) | 154 (9.3%) |
| 25 to 29 Years | 2,611 (84.2%) | 149 (5.7%) |
| 30 to 34 Years | 2,200 (87.8%) | 66 (3.0%) |
| 35 to 44 Years | 4,681 (87.5%) | 281 (6.0%) |
| 45 to 54 Years | 3,664 (85.7%) | 238 (6.5%) |
| 55 to 59 Years | 1,739 (83.8%) | 71 (4.1%) |
| 60 to 64 Years | 1,093 (54.5%) | 50 (4.6%) |
| 65 to 74 Years | 877 (32.0%) | 23 (2.6%) |
| 75 Years and over | 205 (12.3%) | 0 (0.0%) |
| Total | 19,604 (70.9%) | 1,196 (6.1%) |
Employment Status by Educational Attainment in Chillum
According to labor force statistics for Chillum, 82.8% of individuals (15,991) out of the total population between 25 and 64 years of age (19,313) are in the labor force, with 5.3% or 848 of them being unemployed. The group with the highest labor force participation rate are those with the educational attainment of high school diploma, with 87.5% or 4,279 individuals in the labor force. Within the labor force, individuals with high school diploma education have the highest percentage of unemployment, with 8.2% or 351 of them being unemployed.
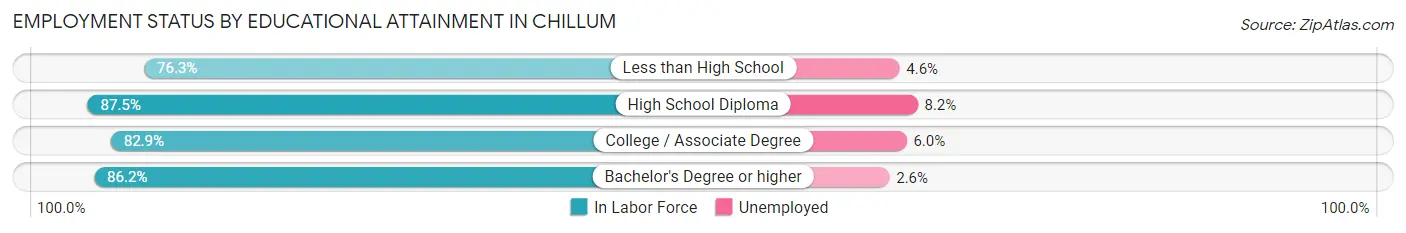
| Educational Attainment | In Labor Force | Unemployed |
| Less than High School | 4,593 (76.3%) | 277 (4.6%) |
| High School Diploma | 4,279 (87.5%) | 401 (8.2%) |
| College / Associate Degree | 3,119 (82.9%) | 226 (6.0%) |
| Bachelor's Degree or higher | 4,001 (86.2%) | 121 (2.6%) |
| Total | 15,991 (82.8%) | 1,024 (5.3%) |
Employment Occupations by Sex in Chillum
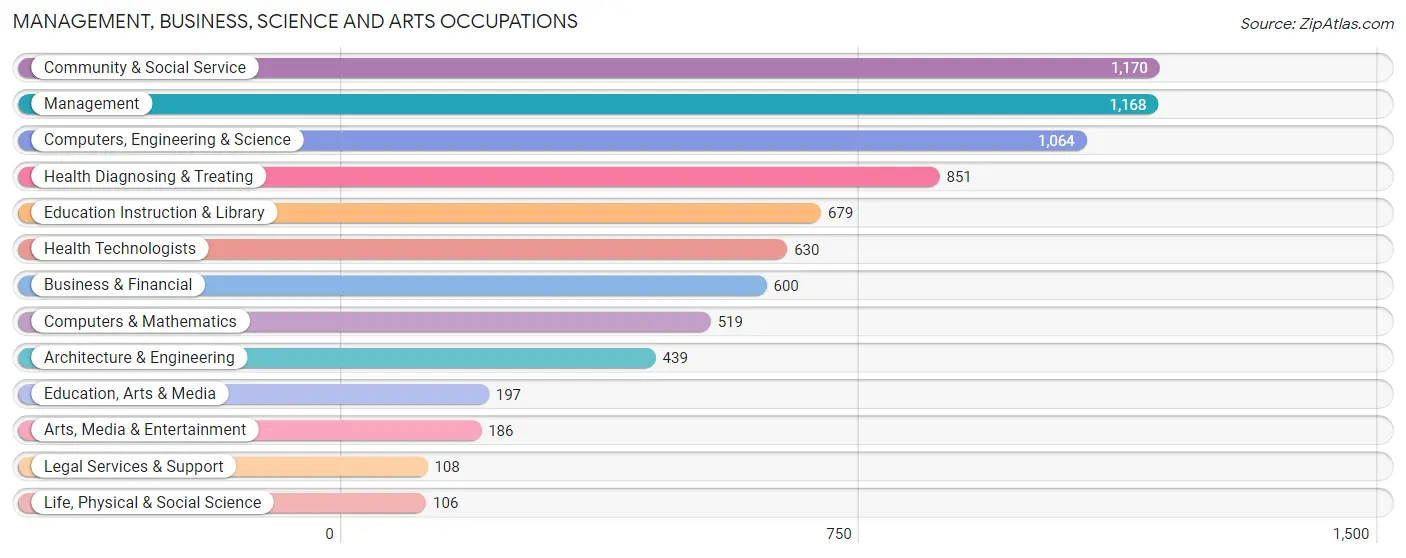
Management, Business, Science and Arts Occupations
The most common Management, Business, Science and Arts occupations in Chillum are Community & Social Service (1,170 | 6.4%), Management (1,168 | 6.4%), Computers, Engineering & Science (1,064 | 5.8%), Health Diagnosing & Treating (851 | 4.6%), and Education Instruction & Library (679 | 3.7%).
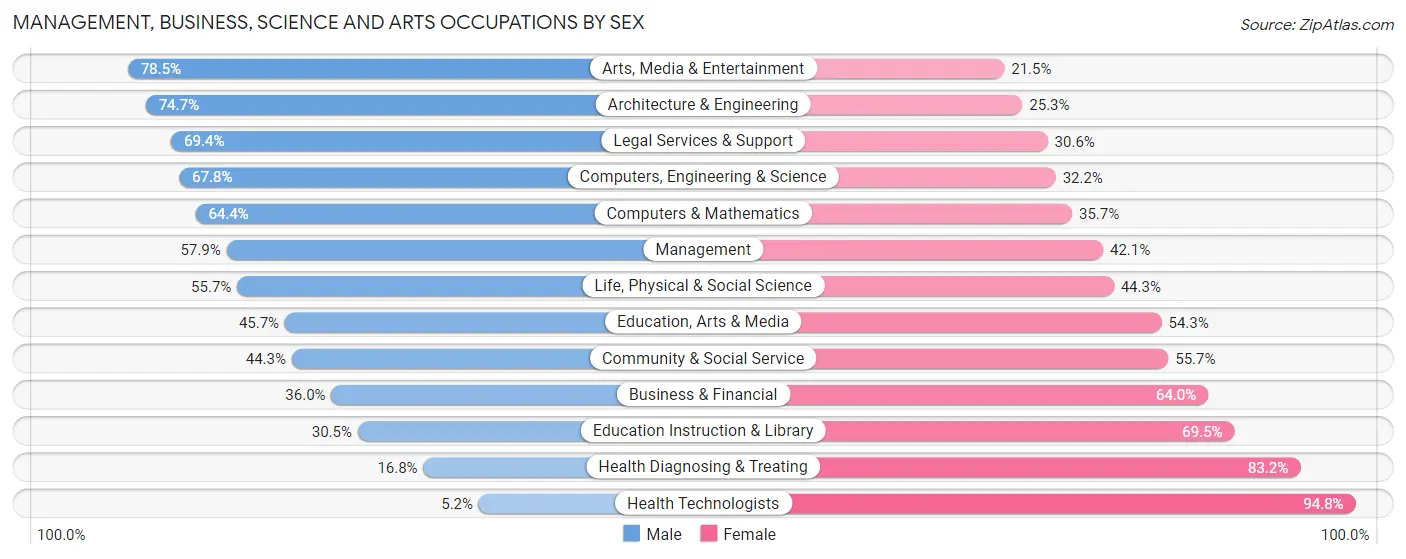
Management, Business, Science and Arts Occupations by Sex
Within the Management, Business, Science and Arts occupations in Chillum, the most male-oriented occupations are Arts, Media & Entertainment (78.5%), Architecture & Engineering (74.7%), and Legal Services & Support (69.4%), while the most female-oriented occupations are Health Technologists (94.8%), Health Diagnosing & Treating (83.2%), and Education Instruction & Library (69.5%).
| Occupation | Male | Female |
| Management | 676 (57.9%) | 492 (42.1%) |
| Business & Financial | 216 (36.0%) | 384 (64.0%) |
| Computers, Engineering & Science | 721 (67.8%) | 343 (32.2%) |
| Computers & Mathematics | 334 (64.3%) | 185 (35.6%) |
| Architecture & Engineering | 328 (74.7%) | 111 (25.3%) |
| Life, Physical & Social Science | 59 (55.7%) | 47 (44.3%) |
| Community & Social Service | 518 (44.3%) | 652 (55.7%) |
| Education, Arts & Media | 90 (45.7%) | 107 (54.3%) |
| Legal Services & Support | 75 (69.4%) | 33 (30.6%) |
| Education Instruction & Library | 207 (30.5%) | 472 (69.5%) |
| Arts, Media & Entertainment | 146 (78.5%) | 40 (21.5%) |
| Health Diagnosing & Treating | 143 (16.8%) | 708 (83.2%) |
| Health Technologists | 33 (5.2%) | 597 (94.8%) |
| Total (Category) | 2,274 (46.9%) | 2,579 (53.1%) |
| Total (Overall) | 10,375 (56.4%) | 8,007 (43.6%) |
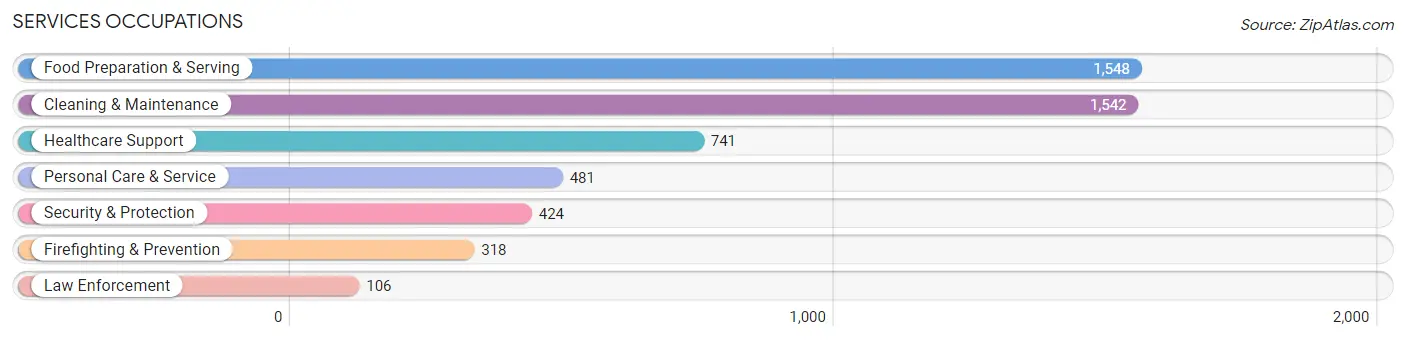
Services Occupations
The most common Services occupations in Chillum are Food Preparation & Serving (1,548 | 8.4%), Cleaning & Maintenance (1,542 | 8.4%), Healthcare Support (741 | 4.0%), Personal Care & Service (481 | 2.6%), and Security & Protection (424 | 2.3%).
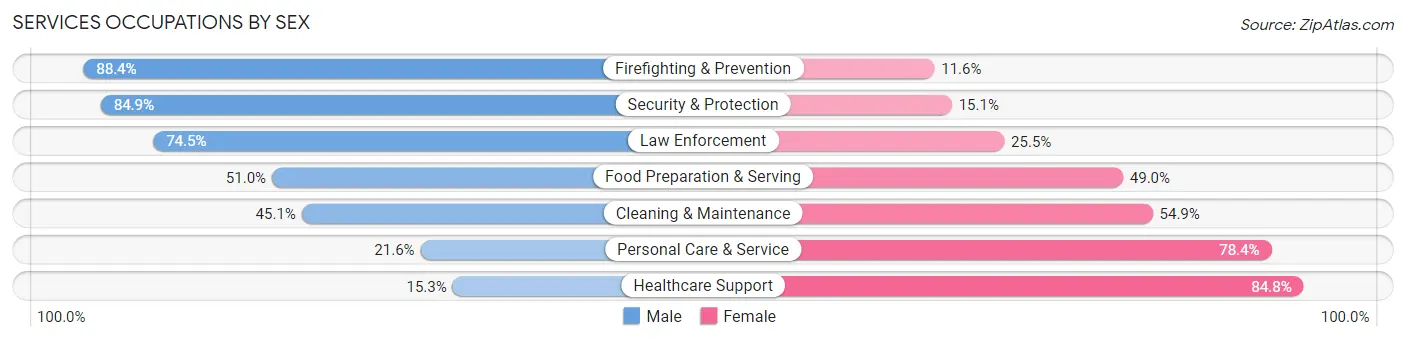
Services Occupations by Sex
Within the Services occupations in Chillum, the most male-oriented occupations are Firefighting & Prevention (88.4%), Security & Protection (84.9%), and Law Enforcement (74.5%), while the most female-oriented occupations are Healthcare Support (84.8%), Personal Care & Service (78.4%), and Cleaning & Maintenance (54.9%).
| Occupation | Male | Female |
| Healthcare Support | 113 (15.2%) | 628 (84.8%) |
| Security & Protection | 360 (84.9%) | 64 (15.1%) |
| Firefighting & Prevention | 281 (88.4%) | 37 (11.6%) |
| Law Enforcement | 79 (74.5%) | 27 (25.5%) |
| Food Preparation & Serving | 790 (51.0%) | 758 (49.0%) |
| Cleaning & Maintenance | 696 (45.1%) | 846 (54.9%) |
| Personal Care & Service | 104 (21.6%) | 377 (78.4%) |
| Total (Category) | 2,063 (43.6%) | 2,673 (56.4%) |
| Total (Overall) | 10,375 (56.4%) | 8,007 (43.6%) |
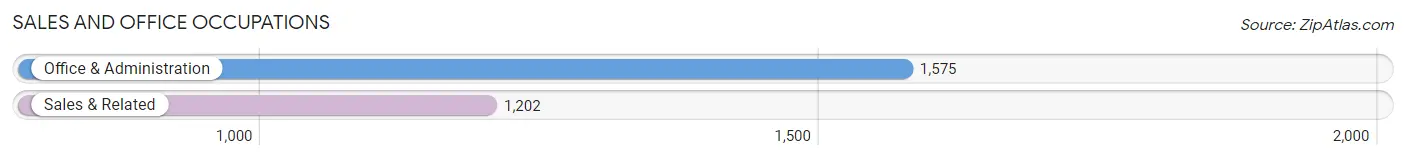
Sales and Office Occupations
The most common Sales and Office occupations in Chillum are Office & Administration (1,575 | 8.6%), and Sales & Related (1,202 | 6.5%).
Sales and Office Occupations by Sex
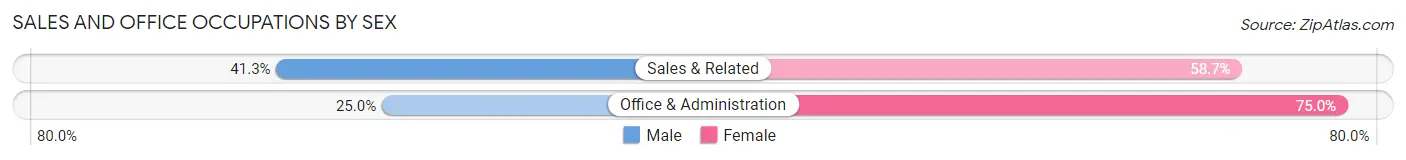
| Occupation | Male | Female |
| Sales & Related | 496 (41.3%) | 706 (58.7%) |
| Office & Administration | 394 (25.0%) | 1,181 (75.0%) |
| Total (Category) | 890 (32.1%) | 1,887 (67.9%) |
| Total (Overall) | 10,375 (56.4%) | 8,007 (43.6%) |
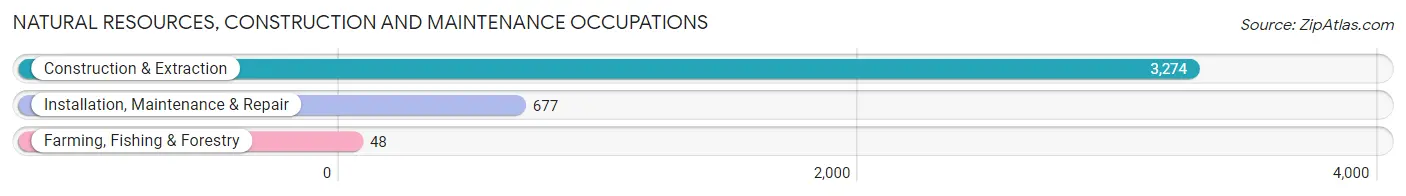
Natural Resources, Construction and Maintenance Occupations
The most common Natural Resources, Construction and Maintenance occupations in Chillum are Construction & Extraction (3,274 | 17.8%), Installation, Maintenance & Repair (677 | 3.7%), and Farming, Fishing & Forestry (48 | 0.3%).
Natural Resources, Construction and Maintenance Occupations by Sex
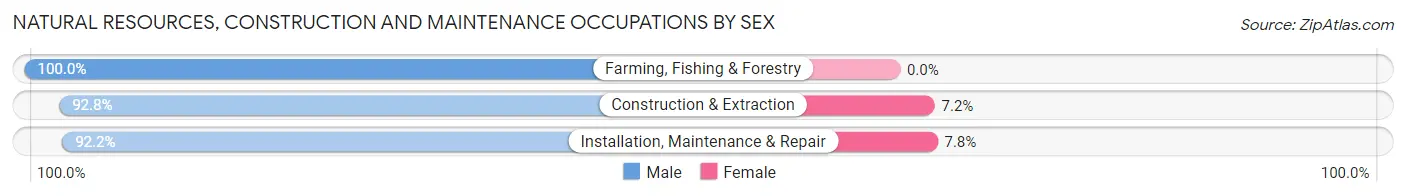
| Occupation | Male | Female |
| Farming, Fishing & Forestry | 48 (100.0%) | 0 (0.0%) |
| Construction & Extraction | 3,038 (92.8%) | 236 (7.2%) |
| Installation, Maintenance & Repair | 624 (92.2%) | 53 (7.8%) |
| Total (Category) | 3,710 (92.8%) | 289 (7.2%) |
| Total (Overall) | 10,375 (56.4%) | 8,007 (43.6%) |
Production, Transportation and Moving Occupations
The most common Production, Transportation and Moving occupations in Chillum are Material Moving (712 | 3.9%), Transportation (685 | 3.7%), and Production (620 | 3.4%).
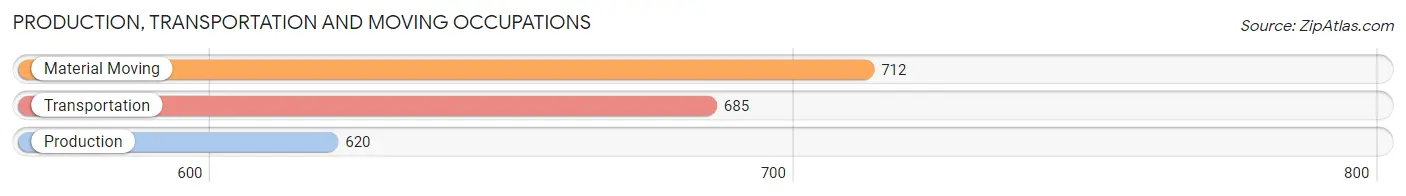
Production, Transportation and Moving Occupations by Sex
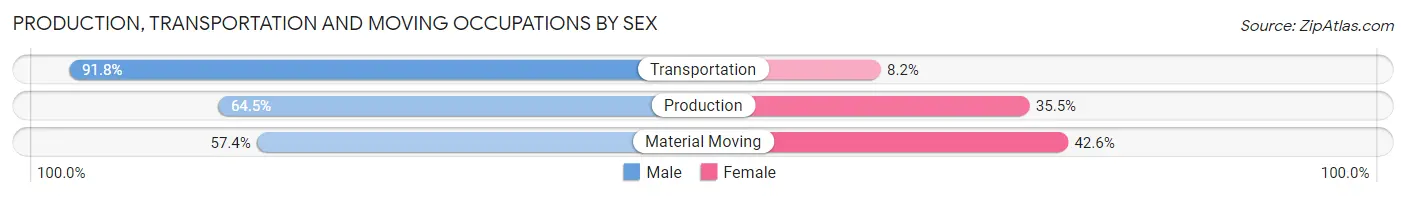
| Occupation | Male | Female |
| Production | 400 (64.5%) | 220 (35.5%) |
| Transportation | 629 (91.8%) | 56 (8.2%) |
| Material Moving | 409 (57.4%) | 303 (42.6%) |
| Total (Category) | 1,438 (71.3%) | 579 (28.7%) |
| Total (Overall) | 10,375 (56.4%) | 8,007 (43.6%) |
Employment Industries by Sex in Chillum
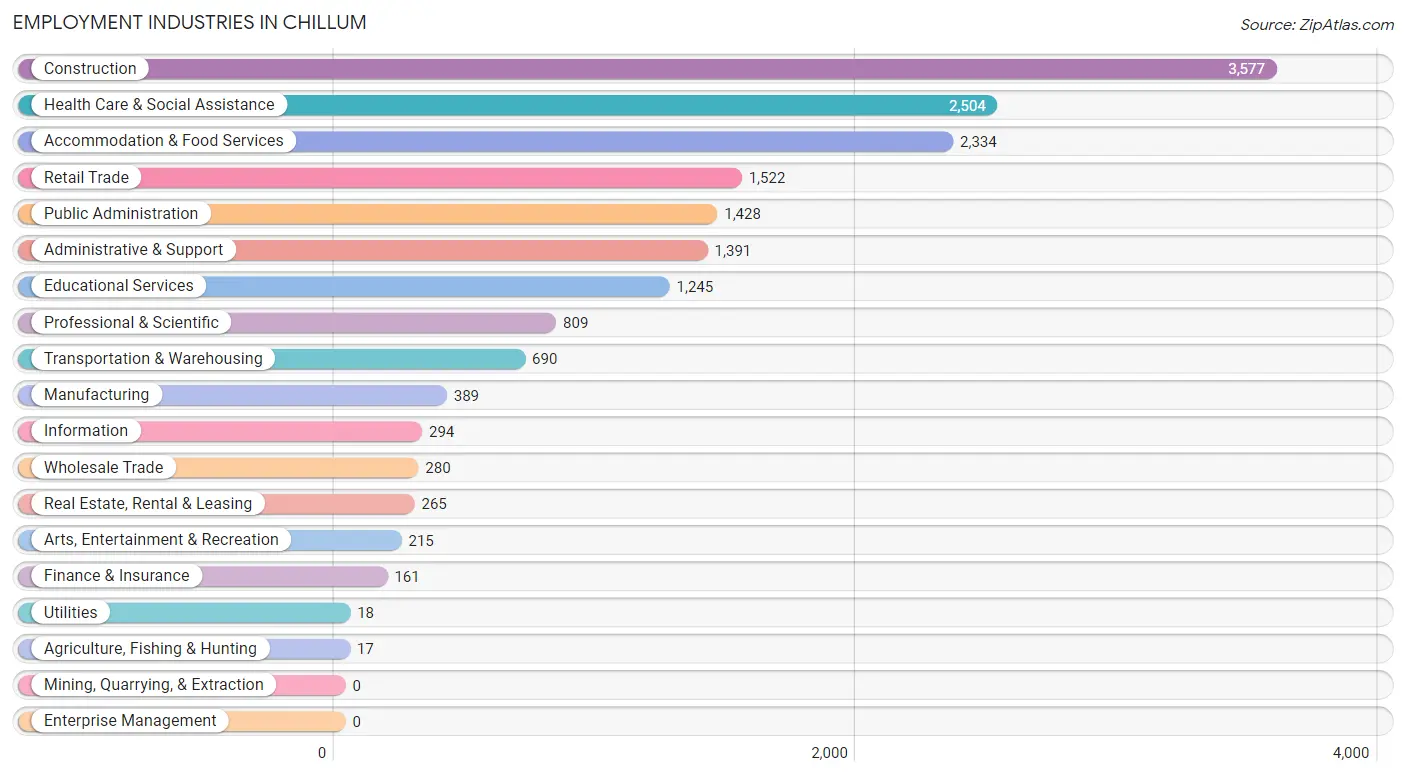
Employment Industries in Chillum
The major employment industries in Chillum include Construction (3,577 | 19.5%), Health Care & Social Assistance (2,504 | 13.6%), Accommodation & Food Services (2,334 | 12.7%), Retail Trade (1,522 | 8.3%), and Public Administration (1,428 | 7.8%).
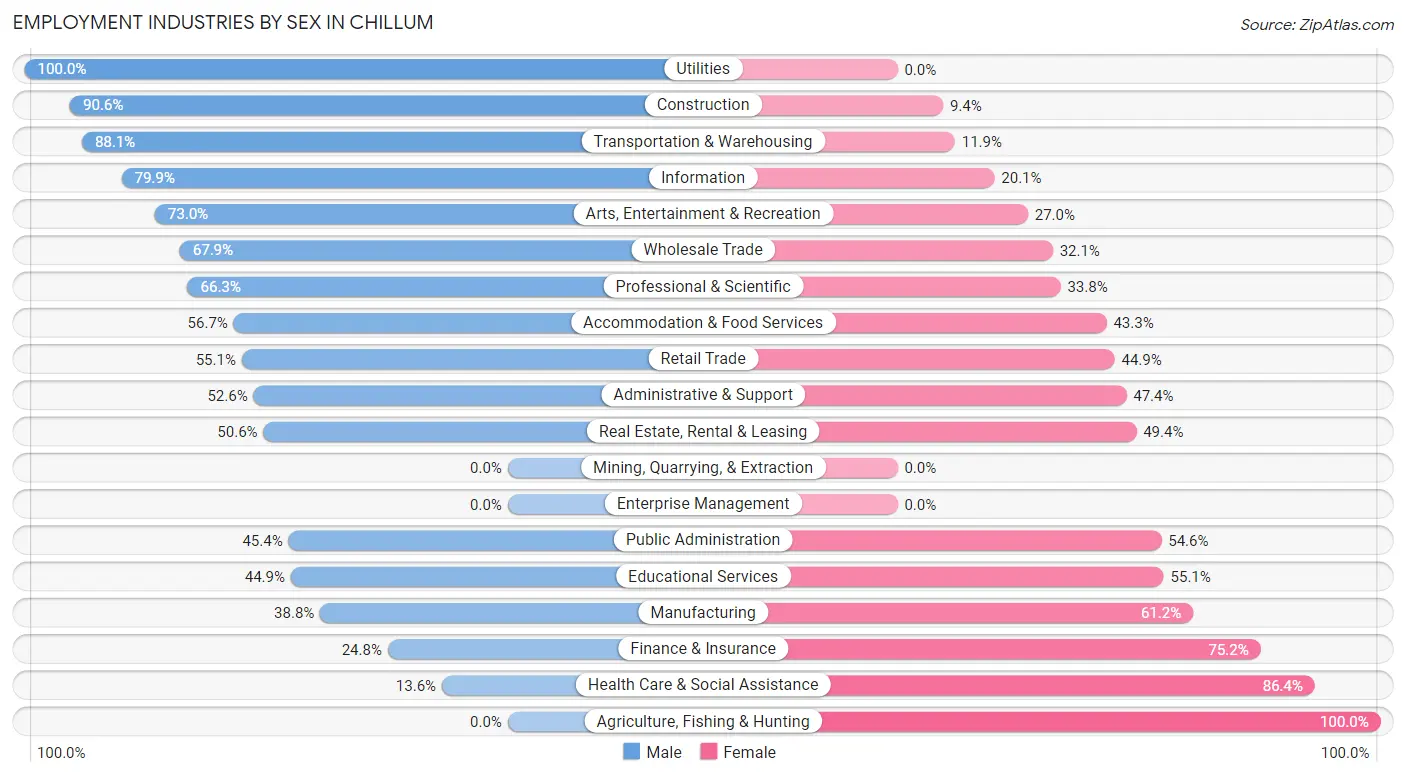
Employment Industries by Sex in Chillum
The Chillum industries that see more men than women are Utilities (100.0%), Construction (90.6%), and Transportation & Warehousing (88.1%), whereas the industries that tend to have a higher number of women are Agriculture, Fishing & Hunting (100.0%), Health Care & Social Assistance (86.4%), and Finance & Insurance (75.2%).
| Industry | Male | Female |
| Agriculture, Fishing & Hunting | 0 (0.0%) | 17 (100.0%) |
| Mining, Quarrying, & Extraction | 0 (0.0%) | 0 (0.0%) |
| Construction | 3,240 (90.6%) | 337 (9.4%) |
| Manufacturing | 151 (38.8%) | 238 (61.2%) |
| Wholesale Trade | 190 (67.9%) | 90 (32.1%) |
| Retail Trade | 838 (55.1%) | 684 (44.9%) |
| Transportation & Warehousing | 608 (88.1%) | 82 (11.9%) |
| Utilities | 18 (100.0%) | 0 (0.0%) |
| Information | 235 (79.9%) | 59 (20.1%) |
| Finance & Insurance | 40 (24.8%) | 121 (75.2%) |
| Real Estate, Rental & Leasing | 134 (50.6%) | 131 (49.4%) |
| Professional & Scientific | 536 (66.2%) | 273 (33.8%) |
| Enterprise Management | 0 (0.0%) | 0 (0.0%) |
| Administrative & Support | 732 (52.6%) | 659 (47.4%) |
| Educational Services | 559 (44.9%) | 686 (55.1%) |
| Health Care & Social Assistance | 341 (13.6%) | 2,163 (86.4%) |
| Arts, Entertainment & Recreation | 157 (73.0%) | 58 (27.0%) |
| Accommodation & Food Services | 1,324 (56.7%) | 1,010 (43.3%) |
| Public Administration | 648 (45.4%) | 780 (54.6%) |
| Total | 10,375 (56.4%) | 8,007 (43.6%) |
Education in Chillum
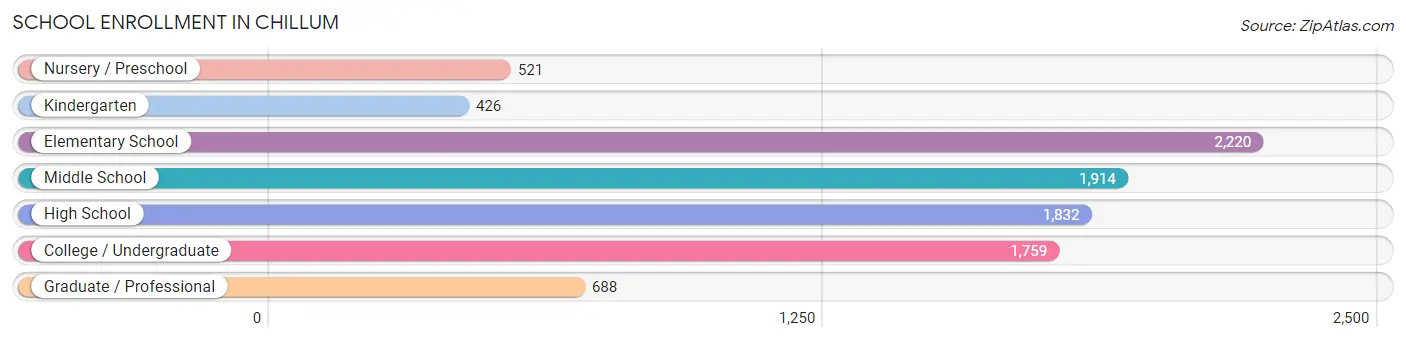
School Enrollment in Chillum
The most common levels of schooling among the 9,360 students in Chillum are elementary school (2,220 | 23.7%), middle school (1,914 | 20.4%), and high school (1,832 | 19.6%).
| School Level | # Students | % Students |
| Nursery / Preschool | 521 | 5.6% |
| Kindergarten | 426 | 4.5% |
| Elementary School | 2,220 | 23.7% |
| Middle School | 1,914 | 20.4% |
| High School | 1,832 | 19.6% |
| College / Undergraduate | 1,759 | 18.8% |
| Graduate / Professional | 688 | 7.3% |
| Total | 9,360 | 100.0% |
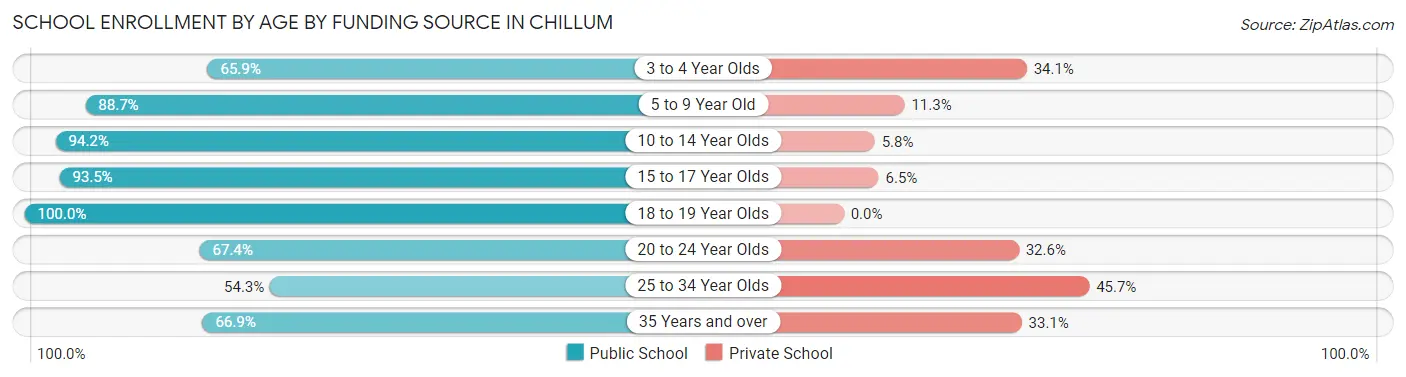
School Enrollment by Age by Funding Source in Chillum
Out of a total of 9,360 students who are enrolled in schools in Chillum, 1,479 (15.8%) attend a private institution, while the remaining 7,881 (84.2%) are enrolled in public schools. The age group of 25 to 34 year olds has the highest likelihood of being enrolled in private schools, with 364 (45.7% in the age bracket) enrolled. Conversely, the age group of 18 to 19 year olds has the lowest likelihood of being enrolled in a private school, with 656 (100.0% in the age bracket) attending a public institution.
| Age Bracket | Public School | Private School |
| 3 to 4 Year Olds | 263 (65.9%) | 136 (34.1%) |
| 5 to 9 Year Old | 2,223 (88.7%) | 284 (11.3%) |
| 10 to 14 Year Olds | 2,233 (94.2%) | 137 (5.8%) |
| 15 to 17 Year Olds | 1,078 (93.5%) | 75 (6.5%) |
| 18 to 19 Year Olds | 656 (100.0%) | 0 (0.0%) |
| 20 to 24 Year Olds | 531 (67.4%) | 257 (32.6%) |
| 25 to 34 Year Olds | 432 (54.3%) | 364 (45.7%) |
| 35 Years and over | 462 (66.9%) | 229 (33.1%) |
| Total | 7,881 (84.2%) | 1,479 (15.8%) |
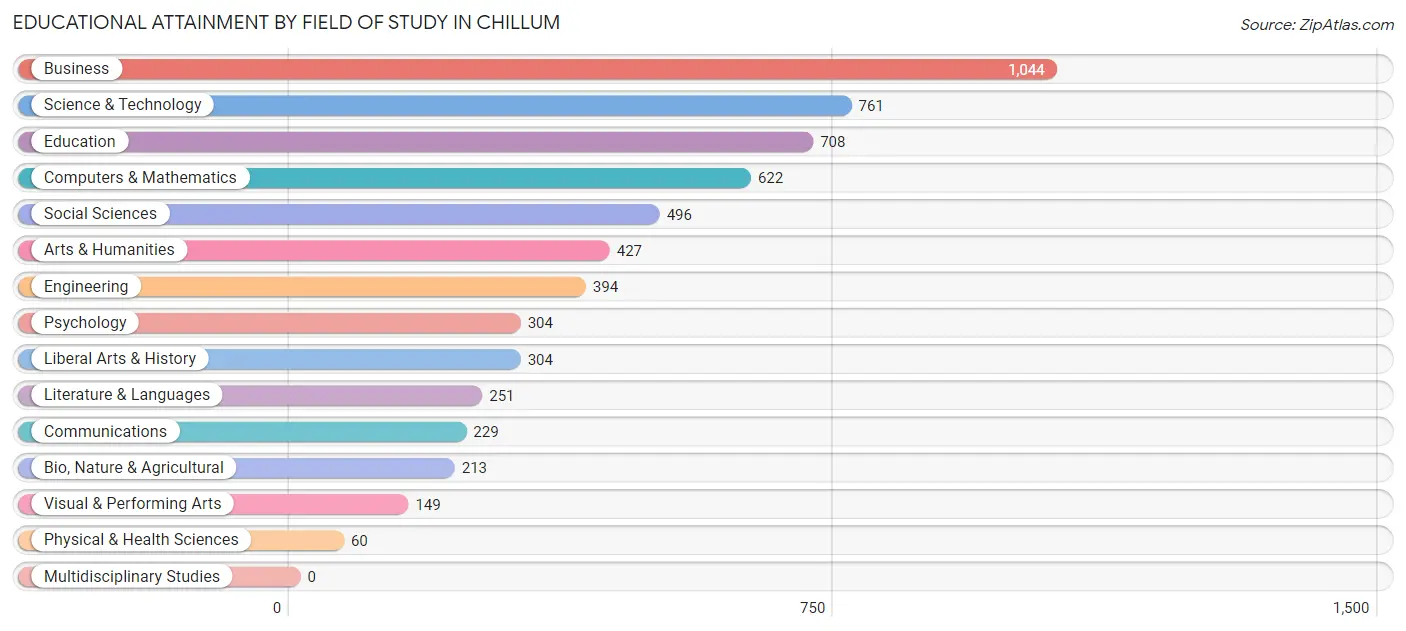
Educational Attainment by Field of Study in Chillum
Business (1,044 | 17.5%), science & technology (761 | 12.8%), education (708 | 11.9%), computers & mathematics (622 | 10.4%), and social sciences (496 | 8.3%) are the most common fields of study among 5,962 individuals in Chillum who have obtained a bachelor's degree or higher.
| Field of Study | # Graduates | % Graduates |
| Computers & Mathematics | 622 | 10.4% |
| Bio, Nature & Agricultural | 213 | 3.6% |
| Physical & Health Sciences | 60 | 1.0% |
| Psychology | 304 | 5.1% |
| Social Sciences | 496 | 8.3% |
| Engineering | 394 | 6.6% |
| Multidisciplinary Studies | 0 | 0.0% |
| Science & Technology | 761 | 12.8% |
| Business | 1,044 | 17.5% |
| Education | 708 | 11.9% |
| Literature & Languages | 251 | 4.2% |
| Liberal Arts & History | 304 | 5.1% |
| Visual & Performing Arts | 149 | 2.5% |
| Communications | 229 | 3.8% |
| Arts & Humanities | 427 | 7.2% |
| Total | 5,962 | 100.0% |
Transportation & Commute in Chillum
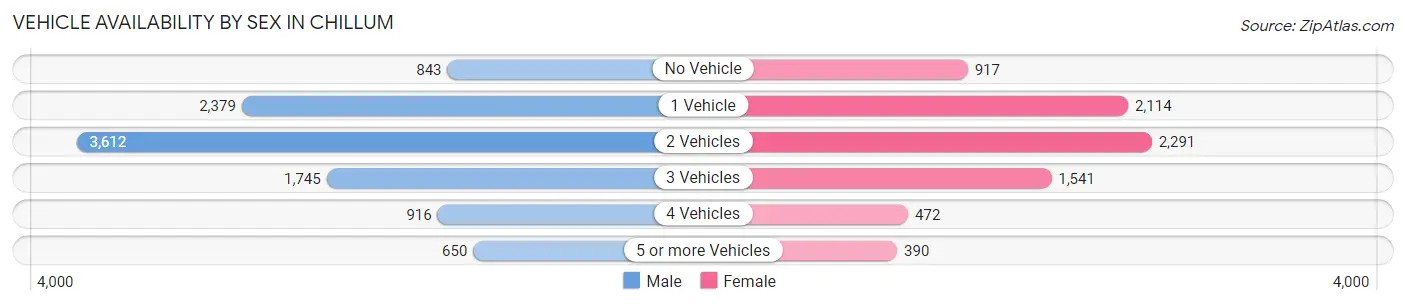
Vehicle Availability by Sex in Chillum
The most prevalent vehicle ownership categories in Chillum are males with 2 vehicles (3,612, accounting for 35.6%) and females with 2 vehicles (2,291, making up 46.8%).
| Vehicles Available | Male | Female |
| No Vehicle | 843 (8.3%) | 917 (11.9%) |
| 1 Vehicle | 2,379 (23.4%) | 2,114 (27.4%) |
| 2 Vehicles | 3,612 (35.6%) | 2,291 (29.7%) |
| 3 Vehicles | 1,745 (17.2%) | 1,541 (20.0%) |
| 4 Vehicles | 916 (9.0%) | 472 (6.1%) |
| 5 or more Vehicles | 650 (6.4%) | 390 (5.1%) |
| Total | 10,145 (100.0%) | 7,725 (100.0%) |
Commute Time in Chillum
The most frequently occuring commute durations in Chillum are 30 to 34 minutes (3,837 commuters, 23.2%), 45 to 59 minutes (2,523 commuters, 15.2%), and 60 to 89 minutes (1,765 commuters, 10.7%).
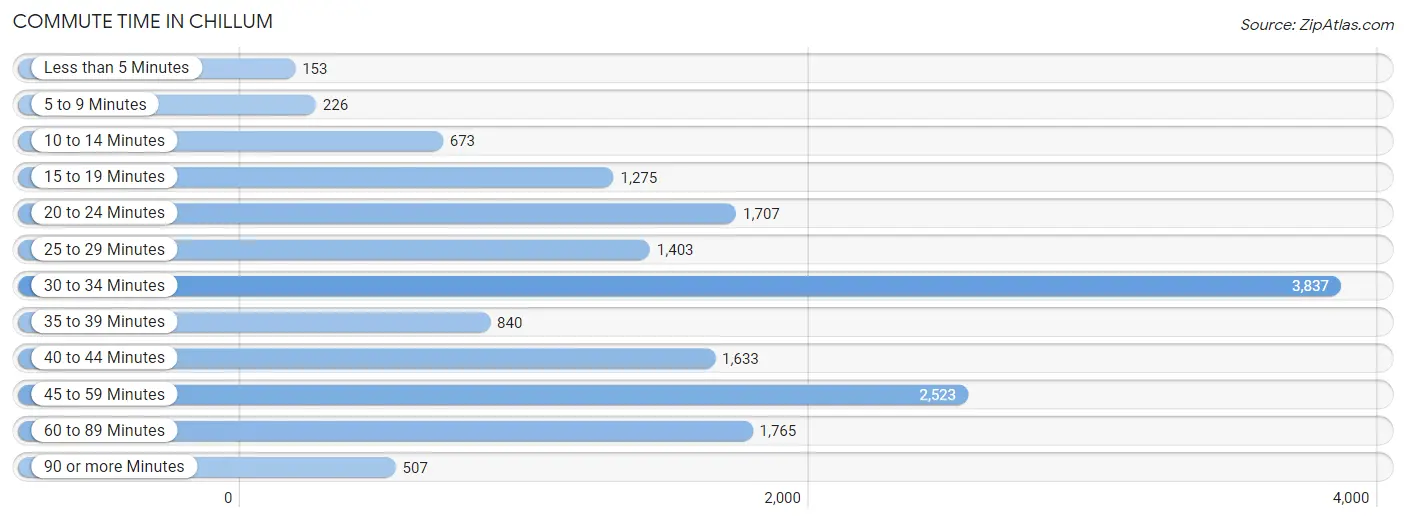
| Commute Time | # Commuters | % Commuters |
| Less than 5 Minutes | 153 | 0.9% |
| 5 to 9 Minutes | 226 | 1.4% |
| 10 to 14 Minutes | 673 | 4.1% |
| 15 to 19 Minutes | 1,275 | 7.7% |
| 20 to 24 Minutes | 1,707 | 10.3% |
| 25 to 29 Minutes | 1,403 | 8.5% |
| 30 to 34 Minutes | 3,837 | 23.2% |
| 35 to 39 Minutes | 840 | 5.1% |
| 40 to 44 Minutes | 1,633 | 9.9% |
| 45 to 59 Minutes | 2,523 | 15.2% |
| 60 to 89 Minutes | 1,765 | 10.7% |
| 90 or more Minutes | 507 | 3.1% |
Commute Time by Sex in Chillum
The most common commute times in Chillum are 30 to 34 minutes (2,445 commuters, 25.9%) for males and 30 to 34 minutes (1,392 commuters, 19.6%) for females.
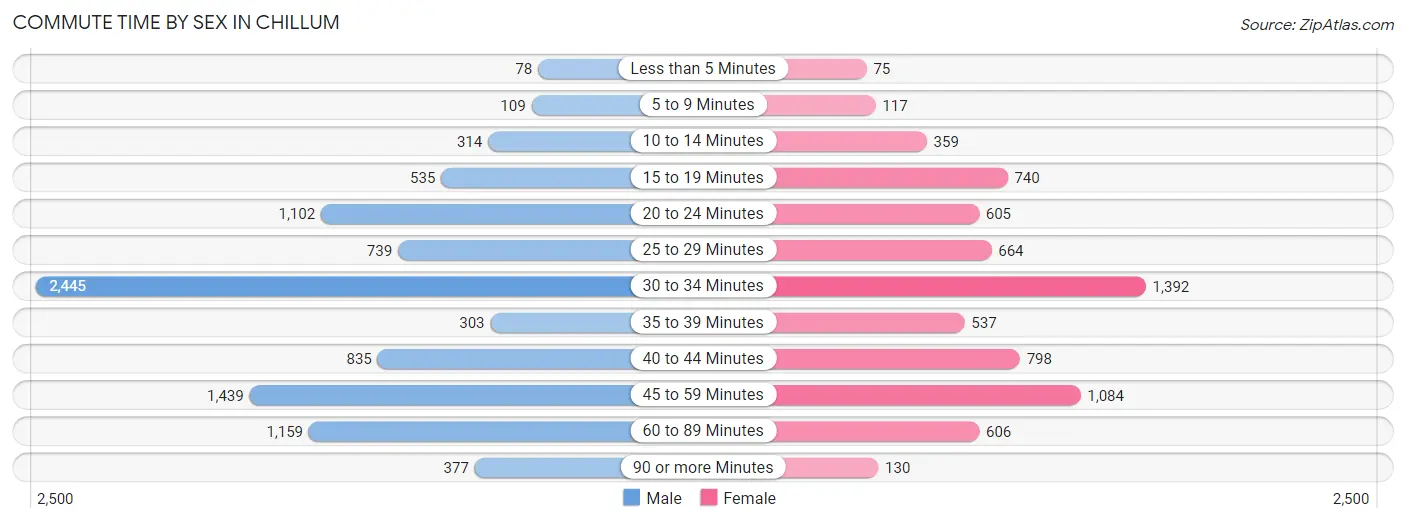
| Commute Time | Male | Female |
| Less than 5 Minutes | 78 (0.8%) | 75 (1.1%) |
| 5 to 9 Minutes | 109 (1.2%) | 117 (1.7%) |
| 10 to 14 Minutes | 314 (3.3%) | 359 (5.1%) |
| 15 to 19 Minutes | 535 (5.7%) | 740 (10.4%) |
| 20 to 24 Minutes | 1,102 (11.7%) | 605 (8.5%) |
| 25 to 29 Minutes | 739 (7.8%) | 664 (9.3%) |
| 30 to 34 Minutes | 2,445 (25.9%) | 1,392 (19.6%) |
| 35 to 39 Minutes | 303 (3.2%) | 537 (7.6%) |
| 40 to 44 Minutes | 835 (8.8%) | 798 (11.2%) |
| 45 to 59 Minutes | 1,439 (15.2%) | 1,084 (15.2%) |
| 60 to 89 Minutes | 1,159 (12.3%) | 606 (8.5%) |
| 90 or more Minutes | 377 (4.0%) | 130 (1.8%) |
Time of Departure to Work by Sex in Chillum
The most frequent times of departure to work in Chillum are 6:00 AM to 6:29 AM (1,600, 17.0%) for males and 6:00 AM to 6:29 AM (1,157, 16.3%) for females.
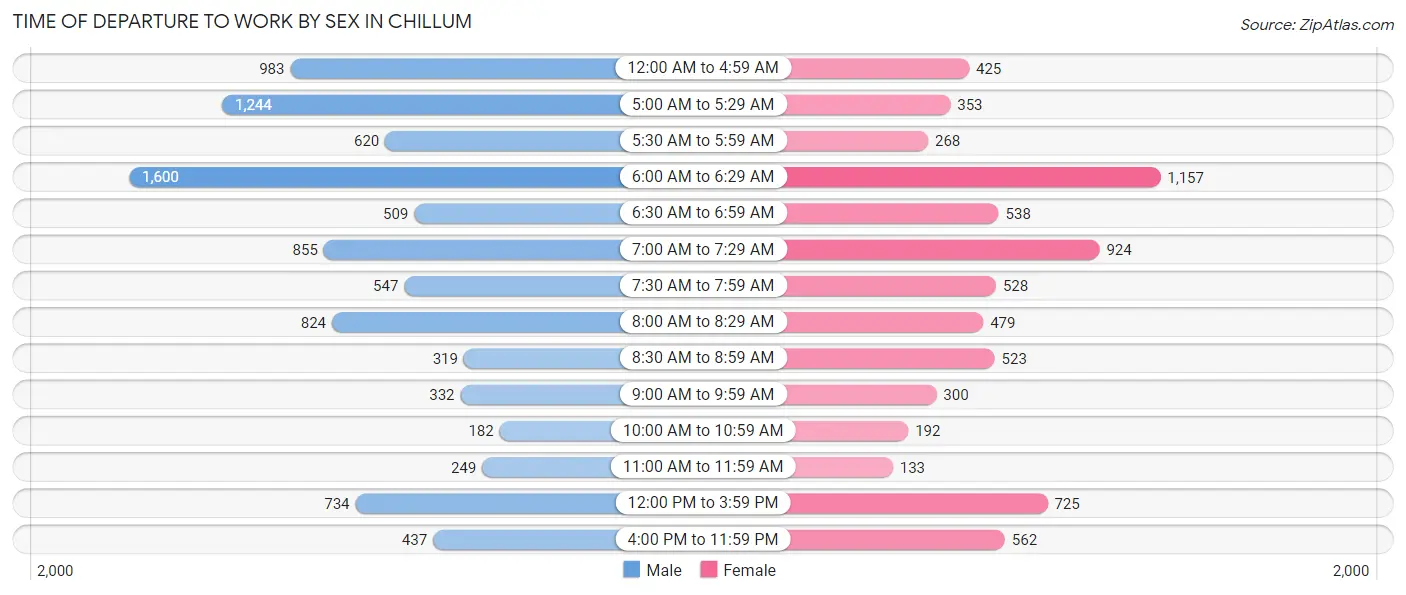
| Time of Departure | Male | Female |
| 12:00 AM to 4:59 AM | 983 (10.4%) | 425 (6.0%) |
| 5:00 AM to 5:29 AM | 1,244 (13.2%) | 353 (5.0%) |
| 5:30 AM to 5:59 AM | 620 (6.6%) | 268 (3.8%) |
| 6:00 AM to 6:29 AM | 1,600 (17.0%) | 1,157 (16.3%) |
| 6:30 AM to 6:59 AM | 509 (5.4%) | 538 (7.6%) |
| 7:00 AM to 7:29 AM | 855 (9.1%) | 924 (13.0%) |
| 7:30 AM to 7:59 AM | 547 (5.8%) | 528 (7.4%) |
| 8:00 AM to 8:29 AM | 824 (8.7%) | 479 (6.7%) |
| 8:30 AM to 8:59 AM | 319 (3.4%) | 523 (7.4%) |
| 9:00 AM to 9:59 AM | 332 (3.5%) | 300 (4.2%) |
| 10:00 AM to 10:59 AM | 182 (1.9%) | 192 (2.7%) |
| 11:00 AM to 11:59 AM | 249 (2.6%) | 133 (1.9%) |
| 12:00 PM to 3:59 PM | 734 (7.8%) | 725 (10.2%) |
| 4:00 PM to 11:59 PM | 437 (4.6%) | 562 (7.9%) |
| Total | 9,435 (100.0%) | 7,107 (100.0%) |
Housing Occupancy in Chillum
Occupancy by Ownership in Chillum
Of the total 10,990 dwellings in Chillum, owner-occupied units account for 4,559 (41.5%), while renter-occupied units make up 6,431 (58.5%).
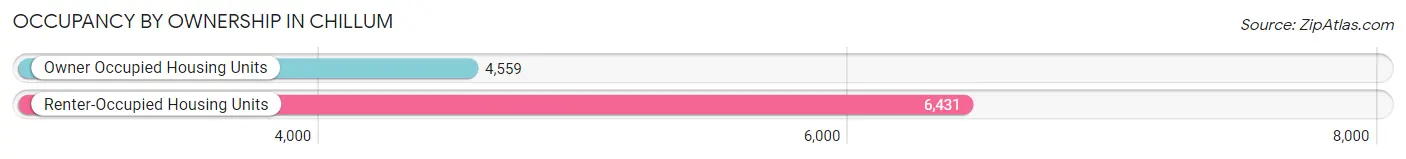
| Occupancy | # Housing Units | % Housing Units |
| Owner Occupied Housing Units | 4,559 | 41.5% |
| Renter-Occupied Housing Units | 6,431 | 58.5% |
| Total Occupied Housing Units | 10,990 | 100.0% |
Occupancy by Household Size in Chillum
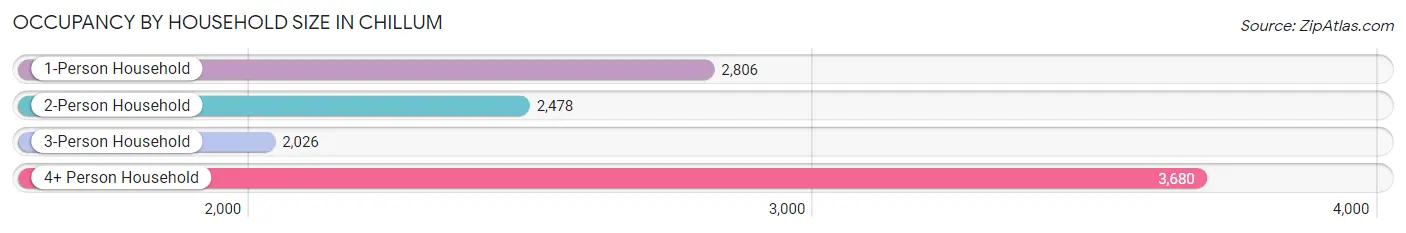
| Household Size | # Housing Units | % Housing Units |
| 1-Person Household | 2,806 | 25.5% |
| 2-Person Household | 2,478 | 22.6% |
| 3-Person Household | 2,026 | 18.4% |
| 4+ Person Household | 3,680 | 33.5% |
| Total Housing Units | 10,990 | 100.0% |
Occupancy by Ownership by Household Size in Chillum
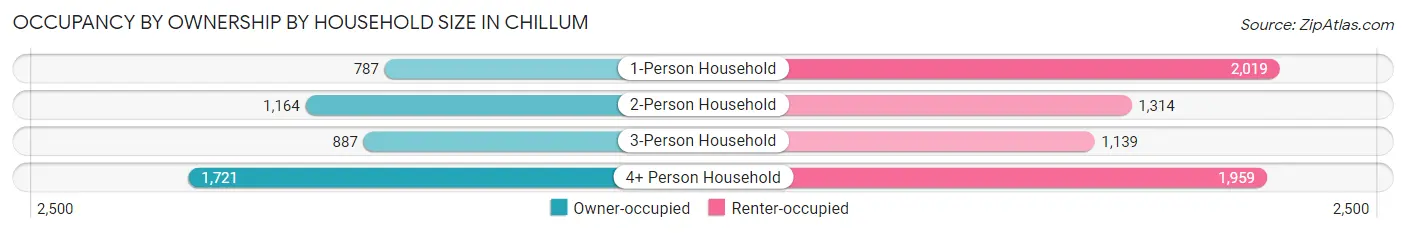
| Household Size | Owner-occupied | Renter-occupied |
| 1-Person Household | 787 (28.1%) | 2,019 (72.0%) |
| 2-Person Household | 1,164 (47.0%) | 1,314 (53.0%) |
| 3-Person Household | 887 (43.8%) | 1,139 (56.2%) |
| 4+ Person Household | 1,721 (46.8%) | 1,959 (53.2%) |
| Total Housing Units | 4,559 (41.5%) | 6,431 (58.5%) |
Occupancy by Educational Attainment in Chillum
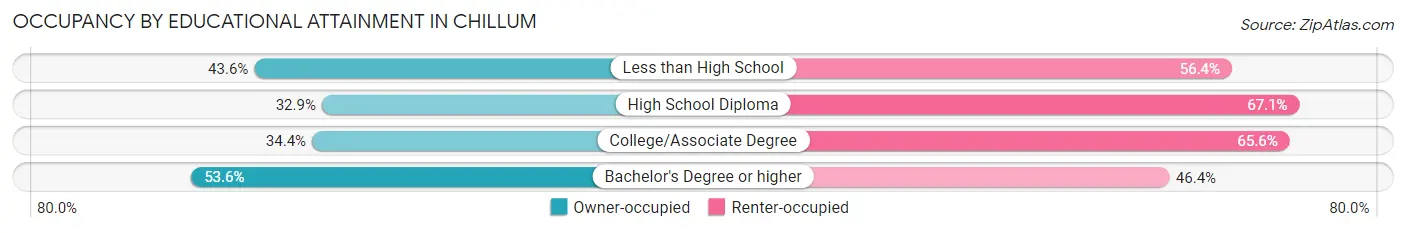
| Household Size | Owner-occupied | Renter-occupied |
| Less than High School | 1,150 (43.6%) | 1,488 (56.4%) |
| High School Diploma | 784 (32.9%) | 1,601 (67.1%) |
| College/Associate Degree | 1,028 (34.4%) | 1,958 (65.6%) |
| Bachelor's Degree or higher | 1,597 (53.6%) | 1,384 (46.4%) |
Occupancy by Age of Householder in Chillum
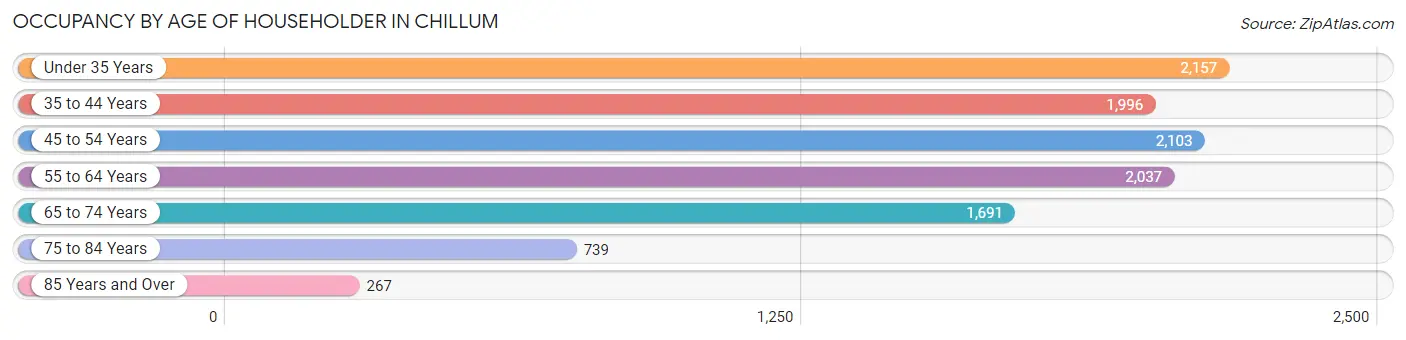
| Age Bracket | # Households | % Households |
| Under 35 Years | 2,157 | 19.6% |
| 35 to 44 Years | 1,996 | 18.2% |
| 45 to 54 Years | 2,103 | 19.1% |
| 55 to 64 Years | 2,037 | 18.5% |
| 65 to 74 Years | 1,691 | 15.4% |
| 75 to 84 Years | 739 | 6.7% |
| 85 Years and Over | 267 | 2.4% |
| Total | 10,990 | 100.0% |
Housing Finances in Chillum
Median Income by Occupancy in Chillum
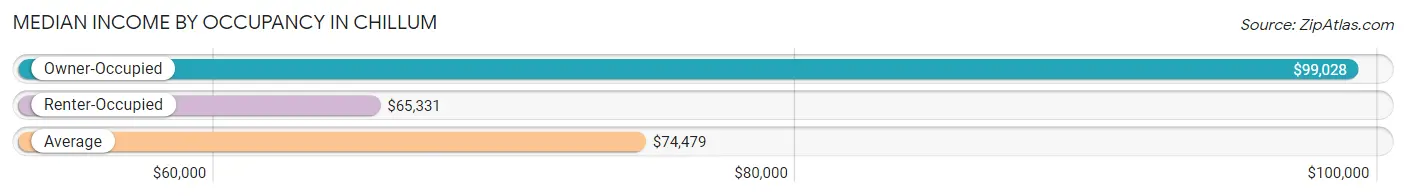
| Occupancy Type | # Households | Median Income |
| Owner-Occupied | 4,559 (41.5%) | $99,028 |
| Renter-Occupied | 6,431 (58.5%) | $65,331 |
| Average | 10,990 (100.0%) | $74,479 |
Occupancy by Householder Income Bracket in Chillum
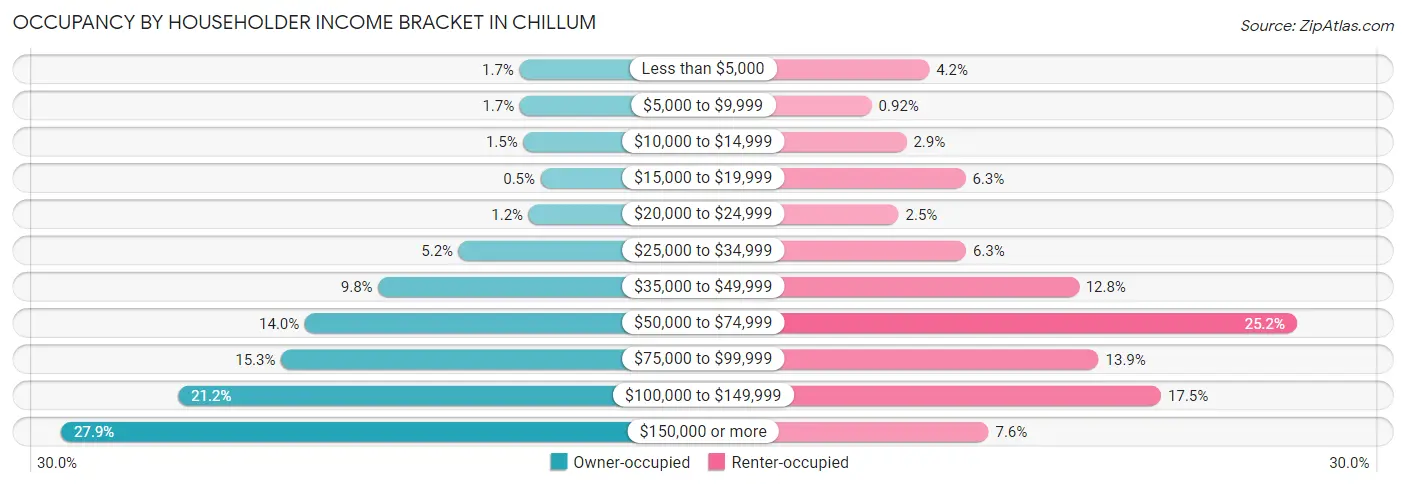
| Income Bracket | Owner-occupied | Renter-occupied |
| Less than $5,000 | 78 (1.7%) | 271 (4.2%) |
| $5,000 to $9,999 | 77 (1.7%) | 59 (0.9%) |
| $10,000 to $14,999 | 68 (1.5%) | 187 (2.9%) |
| $15,000 to $19,999 | 23 (0.5%) | 404 (6.3%) |
| $20,000 to $24,999 | 54 (1.2%) | 158 (2.5%) |
| $25,000 to $34,999 | 236 (5.2%) | 406 (6.3%) |
| $35,000 to $49,999 | 446 (9.8%) | 820 (12.8%) |
| $50,000 to $74,999 | 637 (14.0%) | 1,621 (25.2%) |
| $75,000 to $99,999 | 699 (15.3%) | 893 (13.9%) |
| $100,000 to $149,999 | 968 (21.2%) | 1,123 (17.5%) |
| $150,000 or more | 1,273 (27.9%) | 489 (7.6%) |
| Total | 4,559 (100.0%) | 6,431 (100.0%) |
Monthly Housing Cost Tiers in Chillum
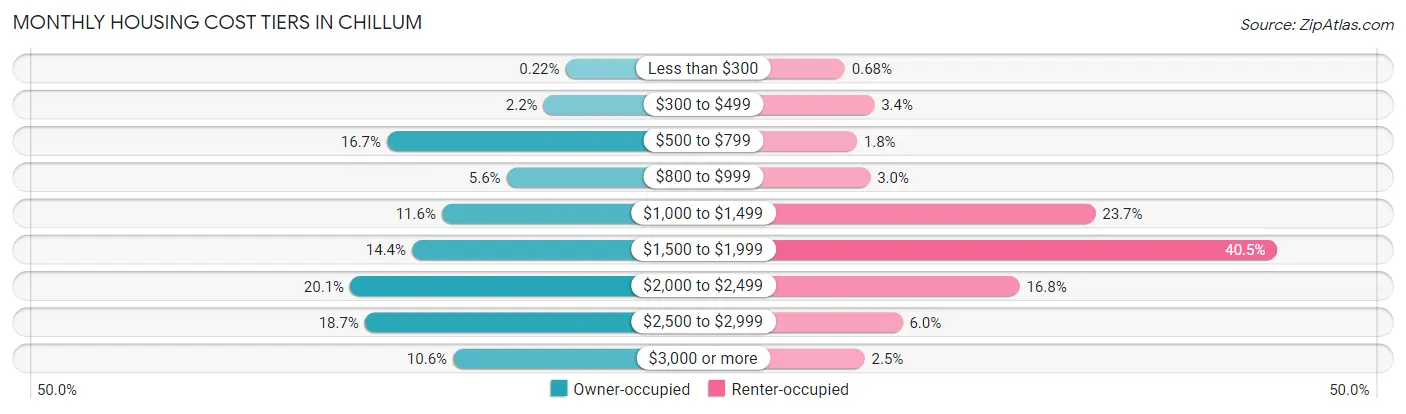
| Monthly Cost | Owner-occupied | Renter-occupied |
| Less than $300 | 10 (0.2%) | 44 (0.7%) |
| $300 to $499 | 102 (2.2%) | 218 (3.4%) |
| $500 to $799 | 759 (16.7%) | 115 (1.8%) |
| $800 to $999 | 257 (5.6%) | 194 (3.0%) |
| $1,000 to $1,499 | 529 (11.6%) | 1,527 (23.7%) |
| $1,500 to $1,999 | 654 (14.3%) | 2,604 (40.5%) |
| $2,000 to $2,499 | 914 (20.1%) | 1,078 (16.8%) |
| $2,500 to $2,999 | 852 (18.7%) | 385 (6.0%) |
| $3,000 or more | 482 (10.6%) | 161 (2.5%) |
| Total | 4,559 (100.0%) | 6,431 (100.0%) |
Physical Housing Characteristics in Chillum
Housing Structures in Chillum
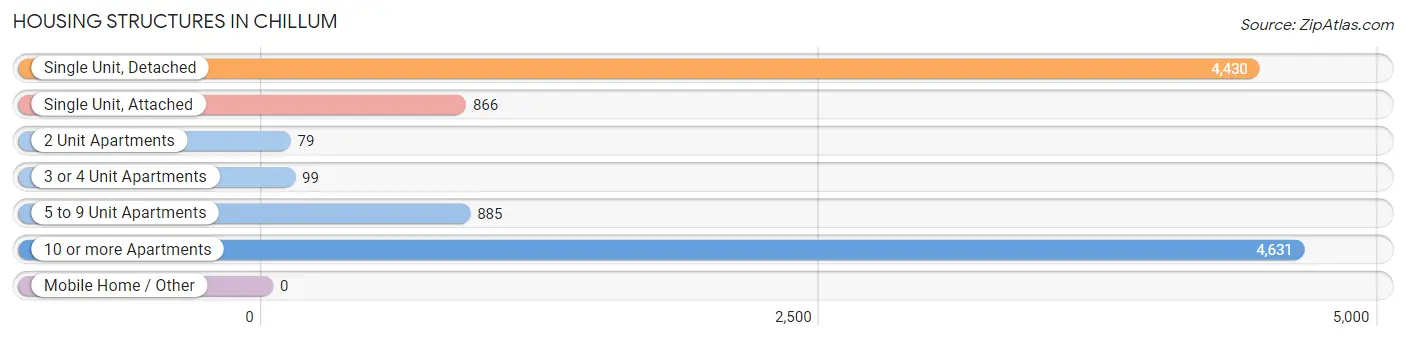
| Structure Type | # Housing Units | % Housing Units |
| Single Unit, Detached | 4,430 | 40.3% |
| Single Unit, Attached | 866 | 7.9% |
| 2 Unit Apartments | 79 | 0.7% |
| 3 or 4 Unit Apartments | 99 | 0.9% |
| 5 to 9 Unit Apartments | 885 | 8.1% |
| 10 or more Apartments | 4,631 | 42.1% |
| Mobile Home / Other | 0 | 0.0% |
| Total | 10,990 | 100.0% |
Housing Structures by Occupancy in Chillum
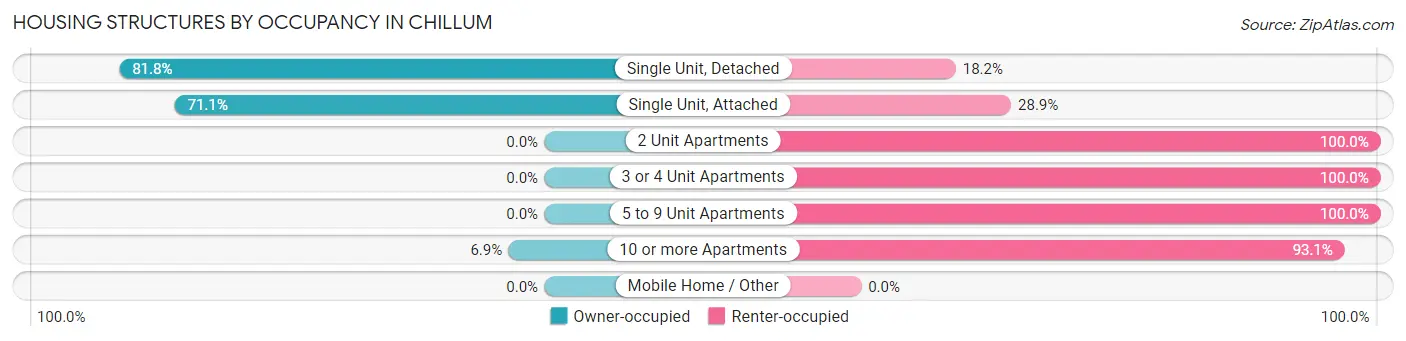
| Structure Type | Owner-occupied | Renter-occupied |
| Single Unit, Detached | 3,623 (81.8%) | 807 (18.2%) |
| Single Unit, Attached | 616 (71.1%) | 250 (28.9%) |
| 2 Unit Apartments | 0 (0.0%) | 79 (100.0%) |
| 3 or 4 Unit Apartments | 0 (0.0%) | 99 (100.0%) |
| 5 to 9 Unit Apartments | 0 (0.0%) | 885 (100.0%) |
| 10 or more Apartments | 320 (6.9%) | 4,311 (93.1%) |
| Mobile Home / Other | 0 (0.0%) | 0 (0.0%) |
| Total | 4,559 (41.5%) | 6,431 (58.5%) |
Housing Structures by Number of Rooms in Chillum
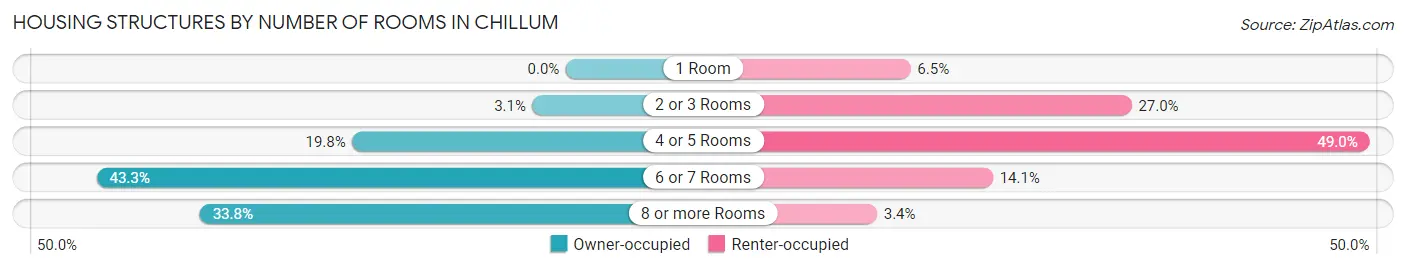
| Number of Rooms | Owner-occupied | Renter-occupied |
| 1 Room | 0 (0.0%) | 419 (6.5%) |
| 2 or 3 Rooms | 141 (3.1%) | 1,734 (27.0%) |
| 4 or 5 Rooms | 901 (19.8%) | 3,150 (49.0%) |
| 6 or 7 Rooms | 1,976 (43.3%) | 909 (14.1%) |
| 8 or more Rooms | 1,541 (33.8%) | 219 (3.4%) |
| Total | 4,559 (100.0%) | 6,431 (100.0%) |
Housing Structure by Heating Type in Chillum
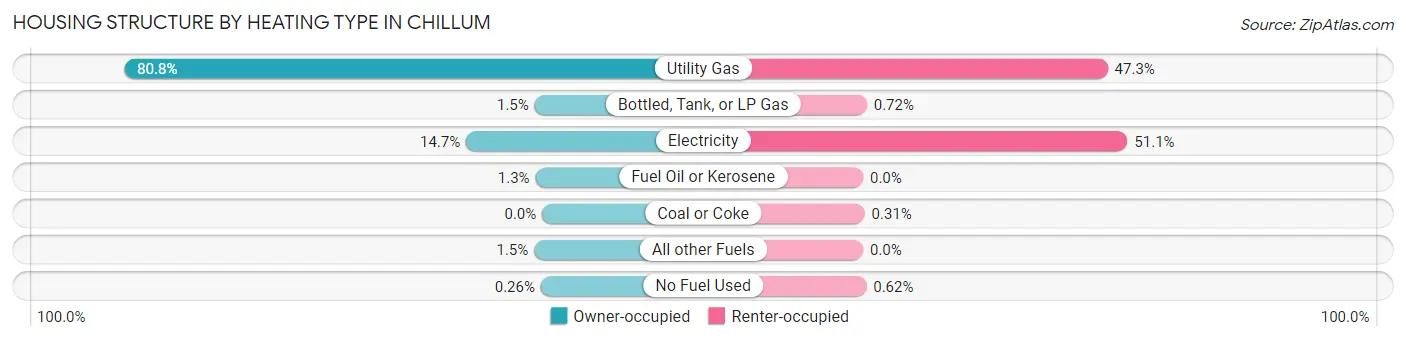
| Heating Type | Owner-occupied | Renter-occupied |
| Utility Gas | 3,682 (80.8%) | 3,040 (47.3%) |
| Bottled, Tank, or LP Gas | 66 (1.5%) | 46 (0.7%) |
| Electricity | 670 (14.7%) | 3,285 (51.1%) |
| Fuel Oil or Kerosene | 59 (1.3%) | 0 (0.0%) |
| Coal or Coke | 0 (0.0%) | 20 (0.3%) |
| All other Fuels | 70 (1.5%) | 0 (0.0%) |
| No Fuel Used | 12 (0.3%) | 40 (0.6%) |
| Total | 4,559 (100.0%) | 6,431 (100.0%) |
Household Vehicle Usage in Chillum
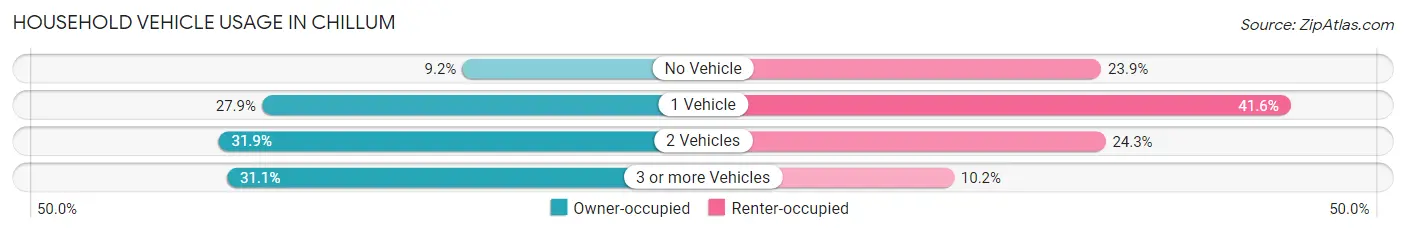
| Vehicles per Household | Owner-occupied | Renter-occupied |
| No Vehicle | 417 (9.1%) | 1,538 (23.9%) |
| 1 Vehicle | 1,270 (27.9%) | 2,675 (41.6%) |
| 2 Vehicles | 1,454 (31.9%) | 1,564 (24.3%) |
| 3 or more Vehicles | 1,418 (31.1%) | 654 (10.2%) |
| Total | 4,559 (100.0%) | 6,431 (100.0%) |
Real Estate & Mortgages in Chillum
Real Estate and Mortgage Overview in Chillum
| Characteristic | Without Mortgage | With Mortgage |
| Housing Units | 1,111 | 3,448 |
| Median Property Value | $385,800 | $365,400 |
| Median Household Income | $68,523 | $1,132 |
| Monthly Housing Costs | $657 | $482 |
| Real Estate Taxes | $3,649 | $50 |
Property Value by Mortgage Status in Chillum
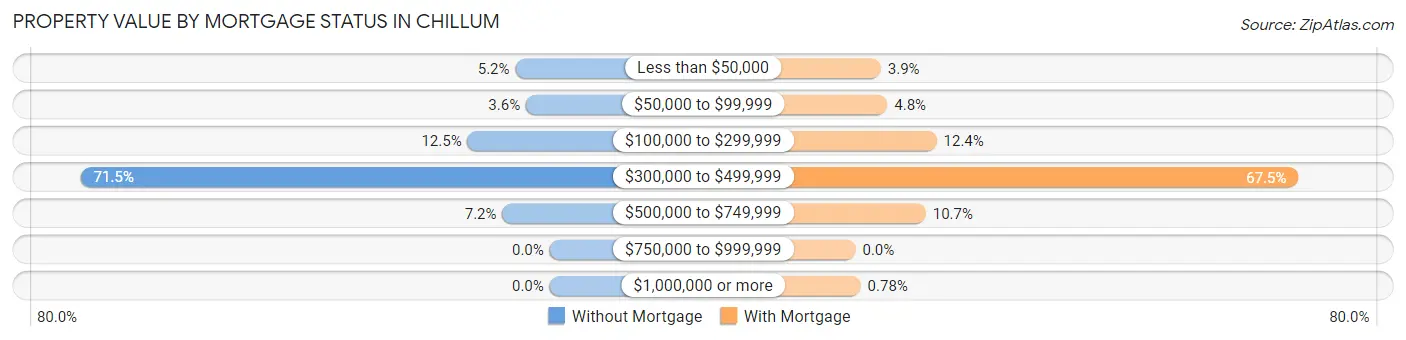
| Property Value | Without Mortgage | With Mortgage |
| Less than $50,000 | 58 (5.2%) | 133 (3.9%) |
| $50,000 to $99,999 | 40 (3.6%) | 167 (4.8%) |
| $100,000 to $299,999 | 139 (12.5%) | 426 (12.3%) |
| $300,000 to $499,999 | 794 (71.5%) | 2,326 (67.5%) |
| $500,000 to $749,999 | 80 (7.2%) | 369 (10.7%) |
| $750,000 to $999,999 | 0 (0.0%) | 0 (0.0%) |
| $1,000,000 or more | 0 (0.0%) | 27 (0.8%) |
| Total | 1,111 (100.0%) | 3,448 (100.0%) |
Household Income by Mortgage Status in Chillum
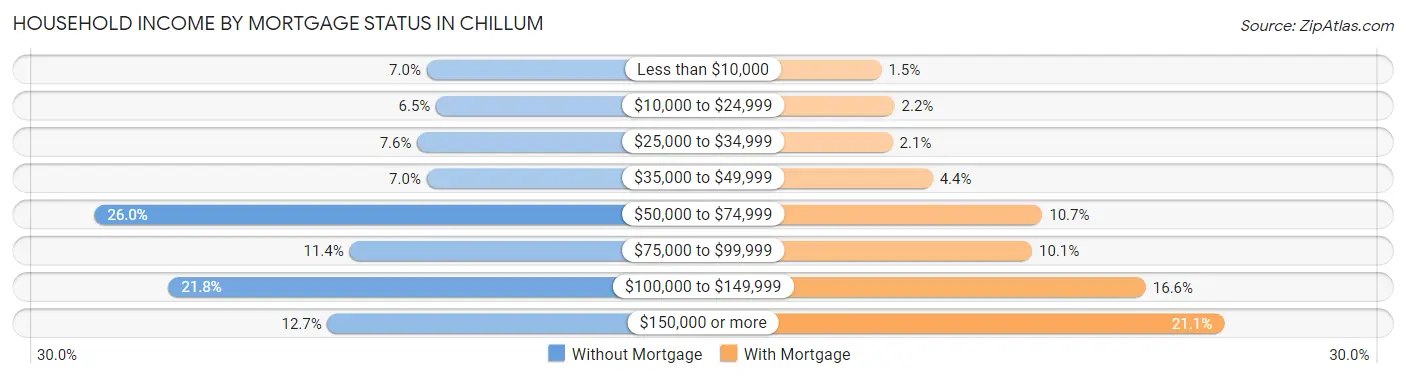
| Household Income | Without Mortgage | With Mortgage |
| Less than $10,000 | 78 (7.0%) | 51 (1.5%) |
| $10,000 to $24,999 | 72 (6.5%) | 77 (2.2%) |
| $25,000 to $34,999 | 84 (7.6%) | 73 (2.1%) |
| $35,000 to $49,999 | 78 (7.0%) | 152 (4.4%) |
| $50,000 to $74,999 | 289 (26.0%) | 368 (10.7%) |
| $75,000 to $99,999 | 127 (11.4%) | 348 (10.1%) |
| $100,000 to $149,999 | 242 (21.8%) | 572 (16.6%) |
| $150,000 or more | 141 (12.7%) | 726 (21.1%) |
| Total | 1,111 (100.0%) | 3,448 (100.0%) |
Property Value to Household Income Ratio in Chillum
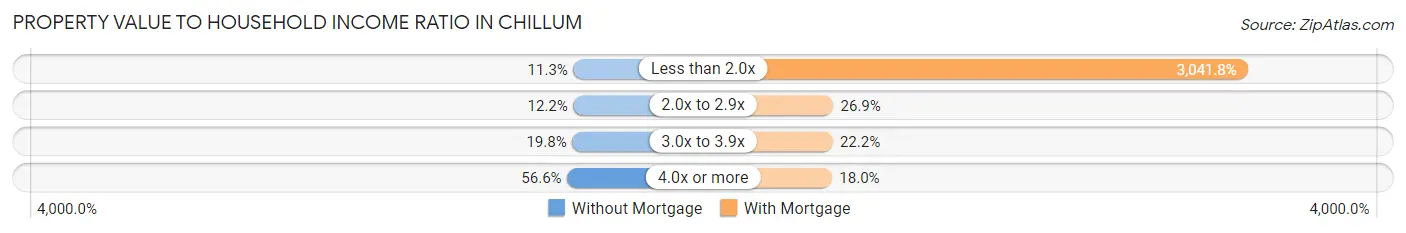
| Value-to-Income Ratio | Without Mortgage | With Mortgage |
| Less than 2.0x | 126 (11.3%) | 104,881 (3,041.8%) |
| 2.0x to 2.9x | 136 (12.2%) | 926 (26.9%) |
| 3.0x to 3.9x | 220 (19.8%) | 765 (22.2%) |
| 4.0x or more | 629 (56.6%) | 622 (18.0%) |
| Total | 1,111 (100.0%) | 3,448 (100.0%) |
Real Estate Taxes by Mortgage Status in Chillum
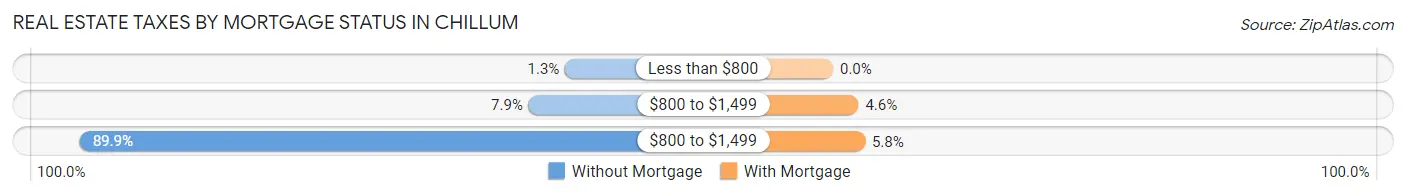
| Property Taxes | Without Mortgage | With Mortgage |
| Less than $800 | 14 (1.3%) | 0 (0.0%) |
| $800 to $1,499 | 88 (7.9%) | 160 (4.6%) |
| $800 to $1,499 | 999 (89.9%) | 201 (5.8%) |
| Total | 1,111 (100.0%) | 3,448 (100.0%) |
Health & Disability in Chillum
Health Insurance Coverage by Age in Chillum
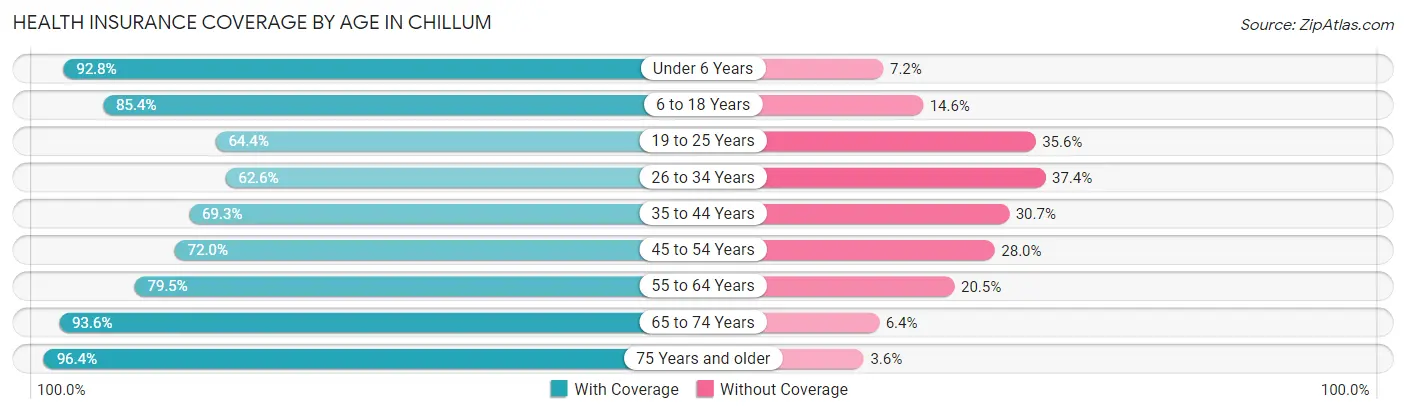
| Age Bracket | With Coverage | Without Coverage |
| Under 6 Years | 3,020 (92.8%) | 235 (7.2%) |
| 6 to 18 Years | 5,450 (85.4%) | 933 (14.6%) |
| 19 to 25 Years | 2,073 (64.4%) | 1,146 (35.6%) |
| 26 to 34 Years | 3,073 (62.6%) | 1,838 (37.4%) |
| 35 to 44 Years | 3,695 (69.3%) | 1,634 (30.7%) |
| 45 to 54 Years | 3,030 (72.0%) | 1,177 (28.0%) |
| 55 to 64 Years | 3,178 (79.5%) | 818 (20.5%) |
| 65 to 74 Years | 2,477 (93.6%) | 170 (6.4%) |
| 75 Years and older | 1,456 (96.4%) | 54 (3.6%) |
| Total | 27,452 (77.4%) | 8,005 (22.6%) |
Health Insurance Coverage by Citizenship Status in Chillum
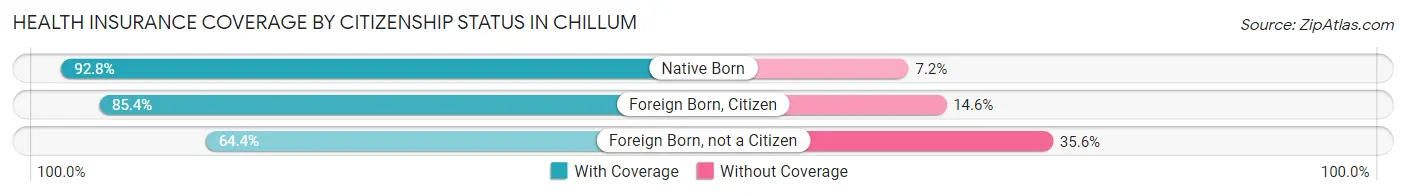
| Citizenship Status | With Coverage | Without Coverage |
| Native Born | 3,020 (92.8%) | 235 (7.2%) |
| Foreign Born, Citizen | 5,450 (85.4%) | 933 (14.6%) |
| Foreign Born, not a Citizen | 2,073 (64.4%) | 1,146 (35.6%) |
Health Insurance Coverage by Household Income in Chillum
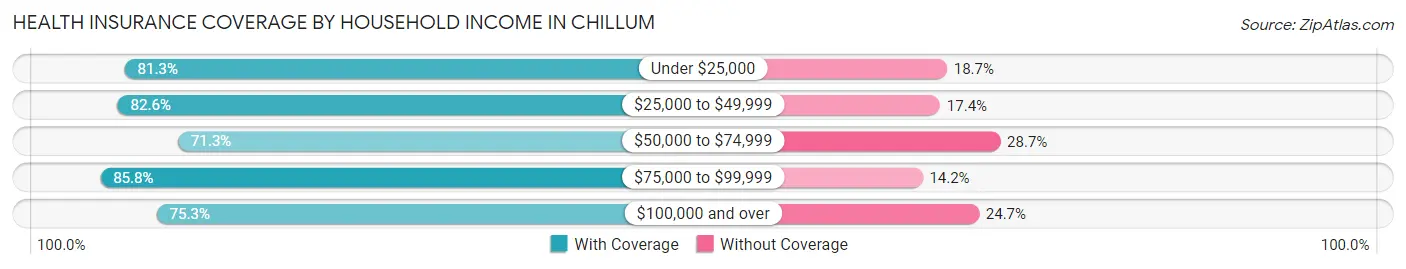
| Household Income | With Coverage | Without Coverage |
| Under $25,000 | 2,185 (81.3%) | 504 (18.7%) |
| $25,000 to $49,999 | 3,850 (82.6%) | 813 (17.4%) |
| $50,000 to $74,999 | 4,646 (71.3%) | 1,873 (28.7%) |
| $75,000 to $99,999 | 3,883 (85.8%) | 641 (14.2%) |
| $100,000 and over | 12,691 (75.3%) | 4,171 (24.7%) |
Public vs Private Health Insurance Coverage by Age in Chillum
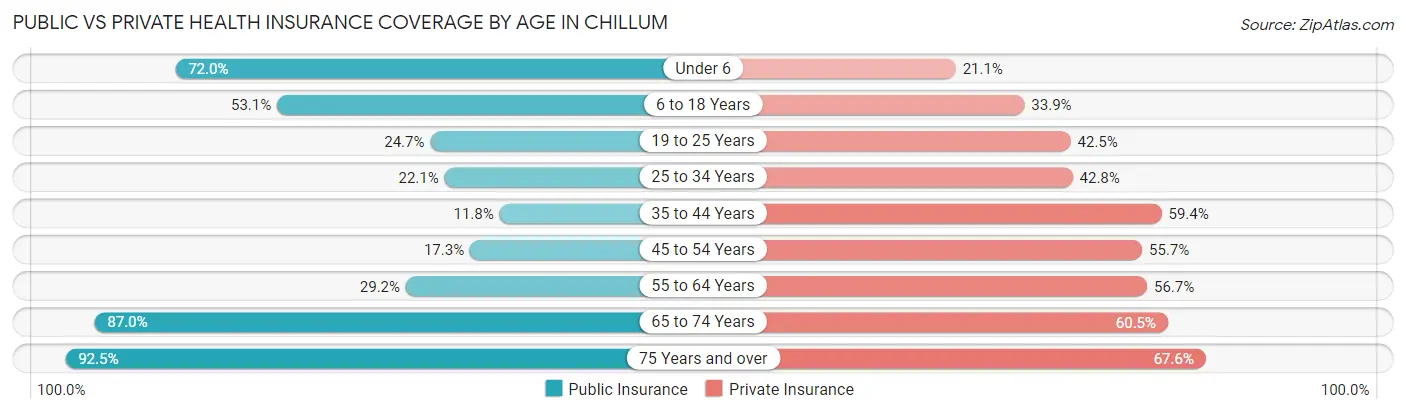
| Age Bracket | Public Insurance | Private Insurance |
| Under 6 | 2,345 (72.0%) | 688 (21.1%) |
| 6 to 18 Years | 3,392 (53.1%) | 2,164 (33.9%) |
| 19 to 25 Years | 795 (24.7%) | 1,367 (42.5%) |
| 25 to 34 Years | 1,083 (22.1%) | 2,104 (42.8%) |
| 35 to 44 Years | 631 (11.8%) | 3,163 (59.4%) |
| 45 to 54 Years | 729 (17.3%) | 2,345 (55.7%) |
| 55 to 64 Years | 1,168 (29.2%) | 2,264 (56.7%) |
| 65 to 74 Years | 2,304 (87.0%) | 1,602 (60.5%) |
| 75 Years and over | 1,396 (92.4%) | 1,020 (67.5%) |
| Total | 13,843 (39.0%) | 16,717 (47.1%) |
Disability Status by Sex by Age in Chillum
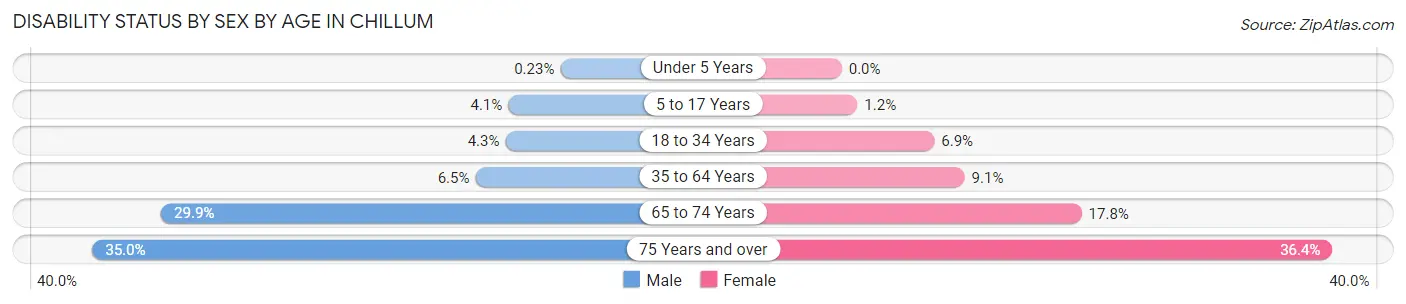
| Age Bracket | Male | Female |
| Under 5 Years | 3 (0.2%) | 0 (0.0%) |
| 5 to 17 Years | 130 (4.1%) | 35 (1.2%) |
| 18 to 34 Years | 190 (4.3%) | 292 (6.9%) |
| 35 to 64 Years | 454 (6.5%) | 601 (9.1%) |
| 65 to 74 Years | 321 (29.9%) | 280 (17.8%) |
| 75 Years and over | 214 (35.0%) | 327 (36.4%) |
Disability Class by Sex by Age in Chillum
Disability Class: Hearing Difficulty
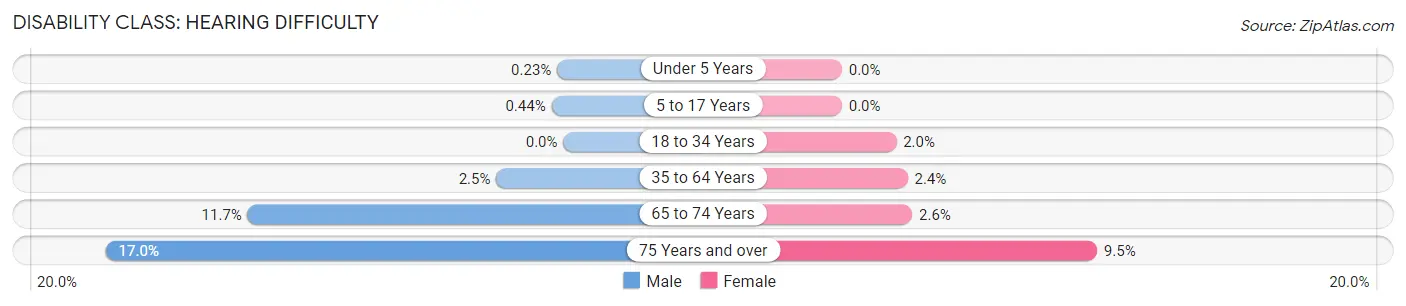
| Age Bracket | Male | Female |
| Under 5 Years | 3 (0.2%) | 0 (0.0%) |
| 5 to 17 Years | 14 (0.4%) | 0 (0.0%) |
| 18 to 34 Years | 0 (0.0%) | 86 (2.0%) |
| 35 to 64 Years | 173 (2.5%) | 161 (2.4%) |
| 65 to 74 Years | 126 (11.7%) | 41 (2.6%) |
| 75 Years and over | 104 (17.0%) | 85 (9.5%) |
Disability Class: Vision Difficulty

| Age Bracket | Male | Female |
| Under 5 Years | 0 (0.0%) | 0 (0.0%) |
| 5 to 17 Years | 0 (0.0%) | 0 (0.0%) |
| 18 to 34 Years | 7 (0.2%) | 75 (1.8%) |
| 35 to 64 Years | 71 (1.0%) | 168 (2.5%) |
| 65 to 74 Years | 50 (4.6%) | 48 (3.0%) |
| 75 Years and over | 0 (0.0%) | 58 (6.5%) |
Disability Class: Cognitive Difficulty
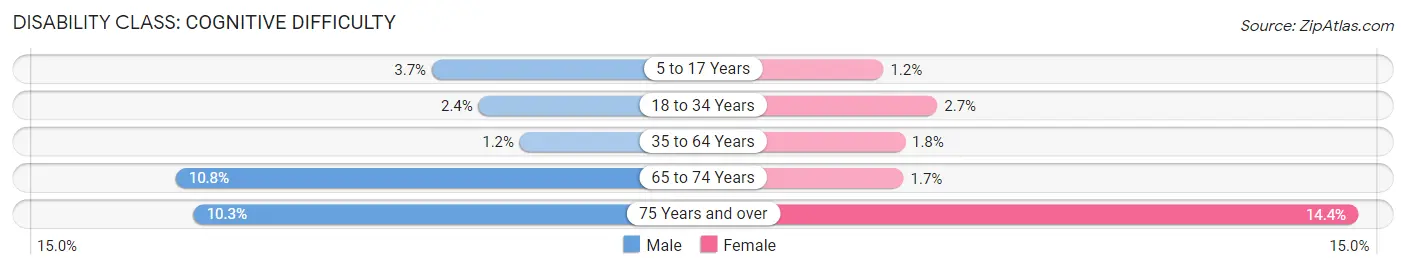
| Age Bracket | Male | Female |
| 5 to 17 Years | 116 (3.7%) | 35 (1.2%) |
| 18 to 34 Years | 104 (2.4%) | 113 (2.7%) |
| 35 to 64 Years | 84 (1.2%) | 116 (1.8%) |
| 65 to 74 Years | 116 (10.8%) | 27 (1.7%) |
| 75 Years and over | 63 (10.3%) | 129 (14.4%) |
Disability Class: Ambulatory Difficulty
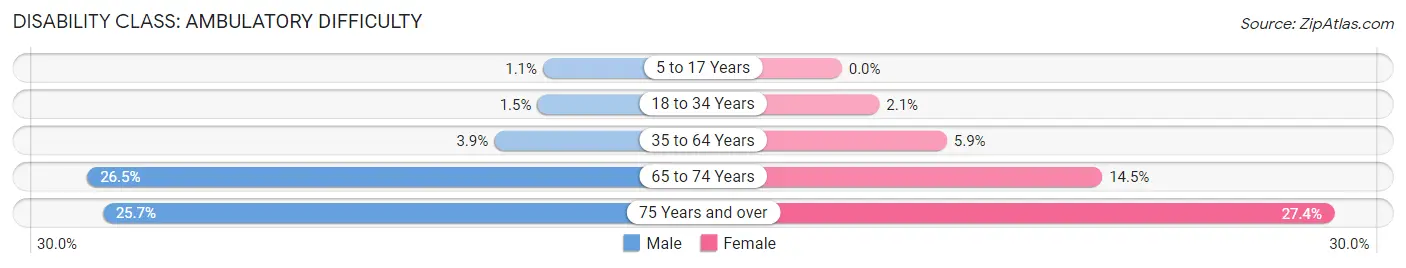
| Age Bracket | Male | Female |
| 5 to 17 Years | 36 (1.1%) | 0 (0.0%) |
| 18 to 34 Years | 64 (1.5%) | 89 (2.1%) |
| 35 to 64 Years | 268 (3.9%) | 386 (5.9%) |
| 65 to 74 Years | 285 (26.5%) | 228 (14.5%) |
| 75 Years and over | 157 (25.7%) | 246 (27.4%) |
Disability Class: Self-Care Difficulty
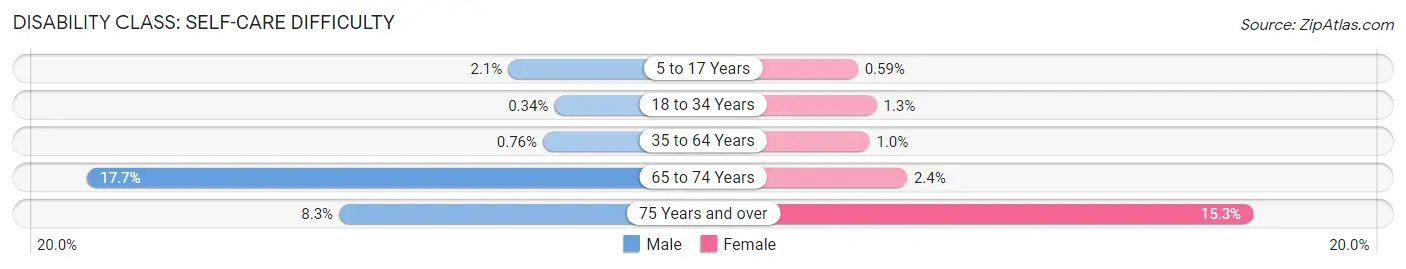
| Age Bracket | Male | Female |
| 5 to 17 Years | 65 (2.1%) | 18 (0.6%) |
| 18 to 34 Years | 15 (0.3%) | 55 (1.3%) |
| 35 to 64 Years | 53 (0.8%) | 68 (1.0%) |
| 65 to 74 Years | 190 (17.7%) | 38 (2.4%) |
| 75 Years and over | 51 (8.3%) | 137 (15.3%) |
Technology Access in Chillum
Computing Device Access in Chillum
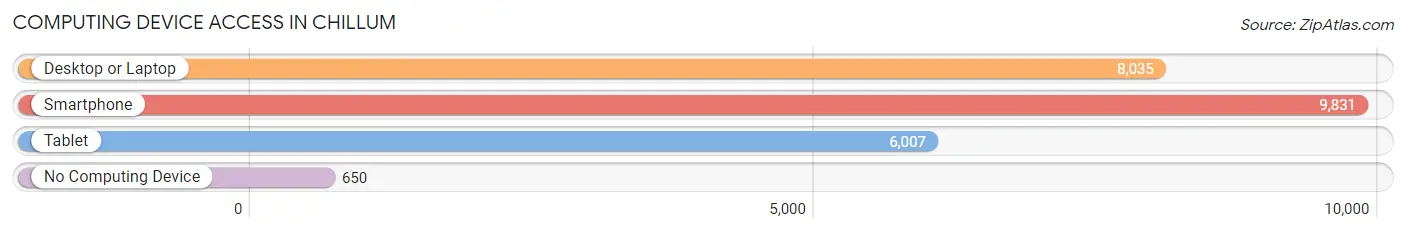
| Device Type | # Households | % Households |
| Desktop or Laptop | 8,035 | 73.1% |
| Smartphone | 9,831 | 89.4% |
| Tablet | 6,007 | 54.7% |
| No Computing Device | 650 | 5.9% |
| Total | 10,990 | 100.0% |
Internet Access in Chillum
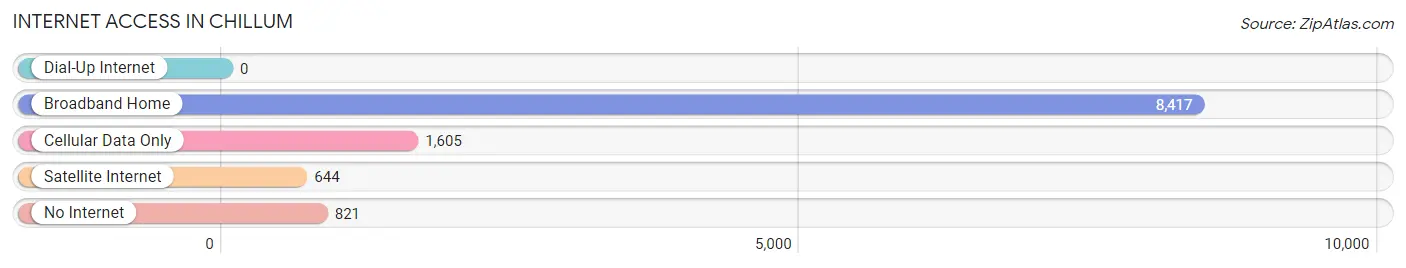
| Internet Type | # Households | % Households |
| Dial-Up Internet | 0 | 0.0% |
| Broadband Home | 8,417 | 76.6% |
| Cellular Data Only | 1,605 | 14.6% |
| Satellite Internet | 644 | 5.9% |
| No Internet | 821 | 7.5% |
| Total | 10,990 | 100.0% |
Chillum Summary
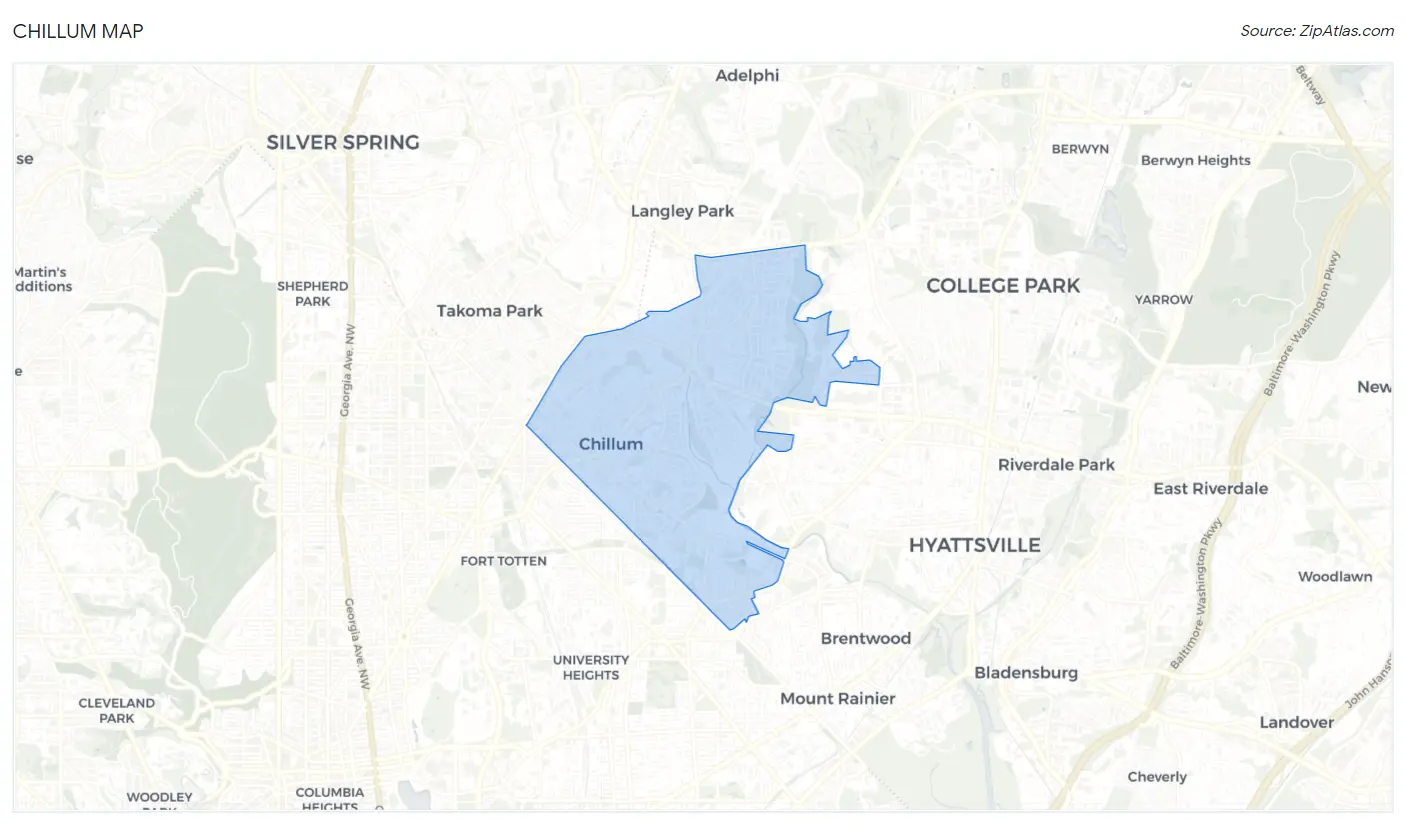
Chillum is an unincorporated area located in Prince George’s County, Maryland. It is located just east of the Washington, D.C. border and is part of the Washington metropolitan area. The area is bordered by the cities of Hyattsville and Mount Rainier to the north, Langley Park to the east, and Adelphi to the south.
History
Chillum was first settled in the late 19th century by farmers and was known as “Chillumville”. The area was named after the Chillum family, who owned a large farm in the area. In the early 20th century, the area began to develop as a residential suburb of Washington, D.C. The area was annexed by the City of Hyattsville in 1945, but was later re-annexed by Prince George’s County in 1954.
Geography
Chillum is located in the northeastern corner of Prince George’s County, Maryland. It is bordered by the cities of Hyattsville and Mount Rainier to the north, Langley Park to the east, and Adelphi to the south. The area is located just east of the Washington, D.C. border and is part of the Washington metropolitan area. The area is located in the Piedmont region of Maryland and is characterized by rolling hills and valleys. The area is located in the watershed of the Anacostia River and is home to several small streams and creeks.
Economy
Chillum is primarily a residential area, but it is also home to several small businesses. The area is home to a variety of restaurants, convenience stores, and other retail establishments. The area is also home to several auto repair shops and other service businesses. The area is also home to a few industrial businesses, including a printing company and a metal fabrication shop.
Demographics
As of the 2010 census, the population of Chillum was 8,945. The population is primarily African American, with a small Hispanic population. The median household income in the area is $50,945, and the median home value is $232,000. The area is served by the Prince George’s County Public Schools system.
Conclusion
Chillum is an unincorporated area located in Prince George’s County, Maryland. It is located just east of the Washington, D.C. border and is part of the Washington metropolitan area. The area is primarily residential, but it is also home to several small businesses. The population of Chillum is primarily African American, with a small Hispanic population. The median household income in the area is $50,945, and the median home value is $232,000. The area is served by the Prince George’s County Public Schools system.
Common Questions
What is Per Capita Income in Chillum?
Per Capita income in Chillum is $30,121.
What is the Median Family Income in Chillum?
Median Family Income in Chillum is $75,844.
What is the Median Household income in Chillum?
Median Household Income in Chillum is $74,479.
What is Income or Wage Gap in Chillum?
Income or Wage Gap in Chillum is 23.7%.
Women in Chillum earn 76.3 cents for every dollar earned by a man.
What is Family Income Deficit in Chillum?
Family Income Deficit in Chillum is $11,650.
Families that are below poverty line in Chillum earn $11,650 less on average than the poverty threshold level.
What is Inequality or Gini Index in Chillum?
Inequality or Gini Index in Chillum is 0.41.
What is the Total Population of Chillum?
Total Population of Chillum is 35,908.
What is the Total Male Population of Chillum?
Total Male Population of Chillum is 17,762.
What is the Total Female Population of Chillum?
Total Female Population of Chillum is 18,146.
What is the Ratio of Males per 100 Females in Chillum?
There are 97.88 Males per 100 Females in Chillum.
What is the Ratio of Females per 100 Males in Chillum?
There are 102.16 Females per 100 Males in Chillum.
What is the Median Population Age in Chillum?
Median Population Age in Chillum is 35.3 Years.
What is the Average Family Size in Chillum
Average Family Size in Chillum is 3.8 People.
What is the Average Household Size in Chillum
Average Household Size in Chillum is 3.2 People.
How Large is the Labor Force in Chillum?
There are 19,604 People in the Labor Forcein in Chillum.
What is the Percentage of People in the Labor Force in Chillum?
70.9% of People are in the Labor Force in Chillum.
What is the Unemployment Rate in Chillum?
Unemployment Rate in Chillum is 6.1%.