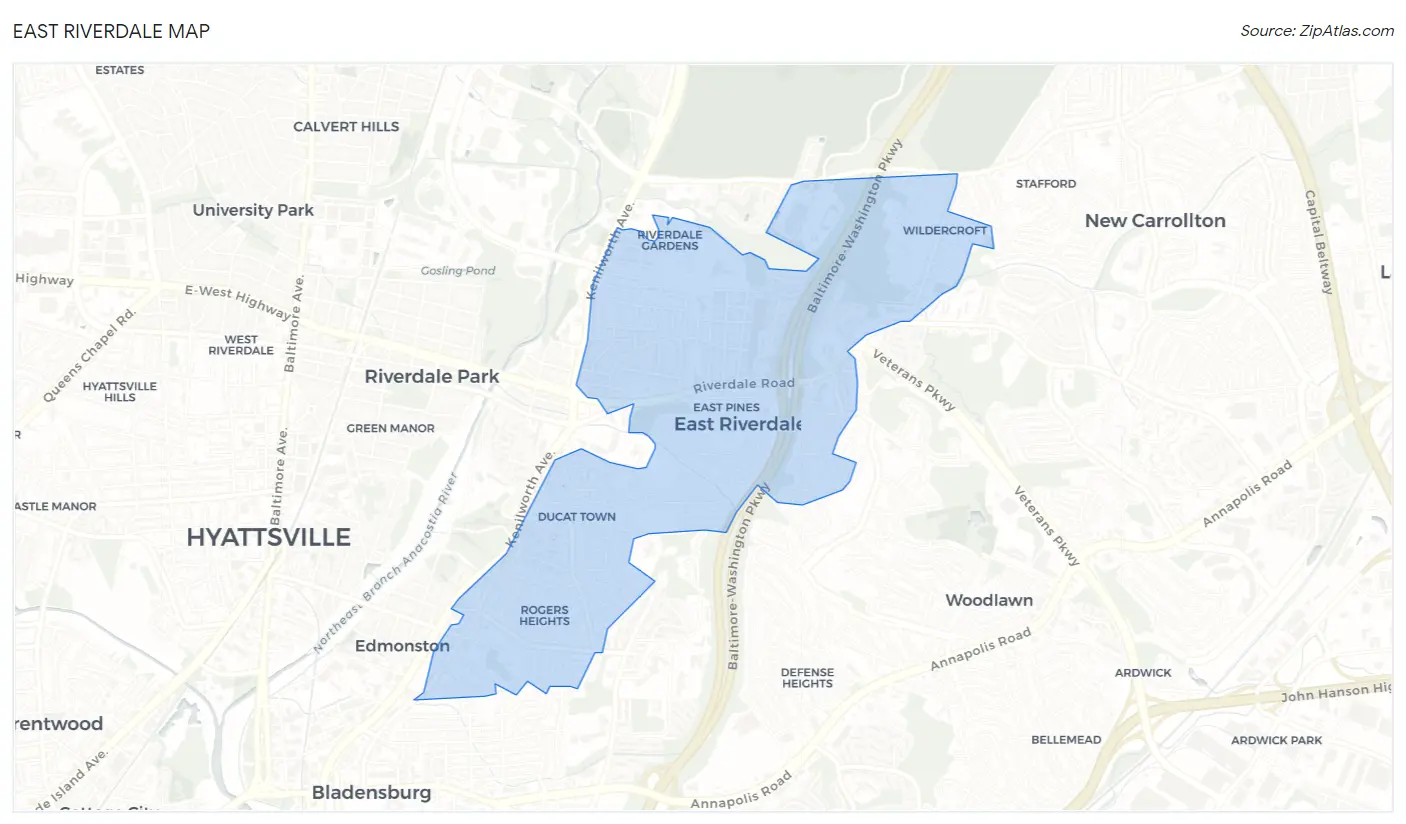
East Riverdale, MD Map & Demographics
East Riverdale Map
East Riverdale Overview
$31,617
PER CAPITA INCOME
$79,536
AVG FAMILY INCOME
$81,354
AVG HOUSEHOLD INCOME
32.8%
WAGE / INCOME GAP [ % ]
67.2¢/ $1
WAGE / INCOME GAP [ $ ]
$13,147
FAMILY INCOME DEFICIT
0.40
INEQUALITY / GINI INDEX
18,080
TOTAL POPULATION
9,991
MALE POPULATION
8,089
FEMALE POPULATION
123.51
MALES / 100 FEMALES
80.96
FEMALES / 100 MALES
30.1
MEDIAN AGE
4.1
AVG FAMILY SIZE
3.9
AVG HOUSEHOLD SIZE
9,321
LABOR FORCE [ PEOPLE ]
71.5%
PERCENT IN LABOR FORCE
8.0%
UNEMPLOYMENT RATE
Income in East Riverdale
Income Overview in East Riverdale
Per Capita Income in East Riverdale is $31,617, while median incomes of families and households are $79,536 and $81,354 respectively.
| Characteristic | Number | Measure |
| Per Capita Income | 18,080 | $31,617 |
| Median Family Income | 3,648 | $79,536 |
| Mean Family Income | 3,648 | $95,645 |
| Median Household Income | 4,641 | $81,354 |
| Mean Household Income | 4,641 | $96,890 |
| Income Deficit | 3,648 | $13,147 |
| Wage / Income Gap (%) | 18,080 | 32.78% |
| Wage / Income Gap ($) | 18,080 | 67.22¢ per $1 |
| Gini / Inequality Index | 18,080 | 0.40 |
Earnings by Sex in East Riverdale
Average Earnings in East Riverdale are $37,625, $43,779 for men and $29,429 for women, a difference of 32.8%.
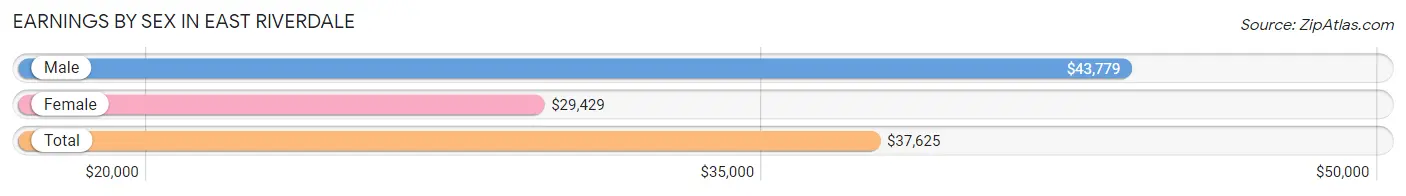
| Sex | Number | Average Earnings |
| Male | 5,960 (62.9%) | $43,779 |
| Female | 3,516 (37.1%) | $29,429 |
| Total | 9,476 (100.0%) | $37,625 |
Earnings by Sex by Income Bracket in East Riverdale
The most common earnings brackets in East Riverdale are $45,000 to $49,999 for men (682 | 11.4%) and $55,000 to $64,999 for women (358 | 10.2%).
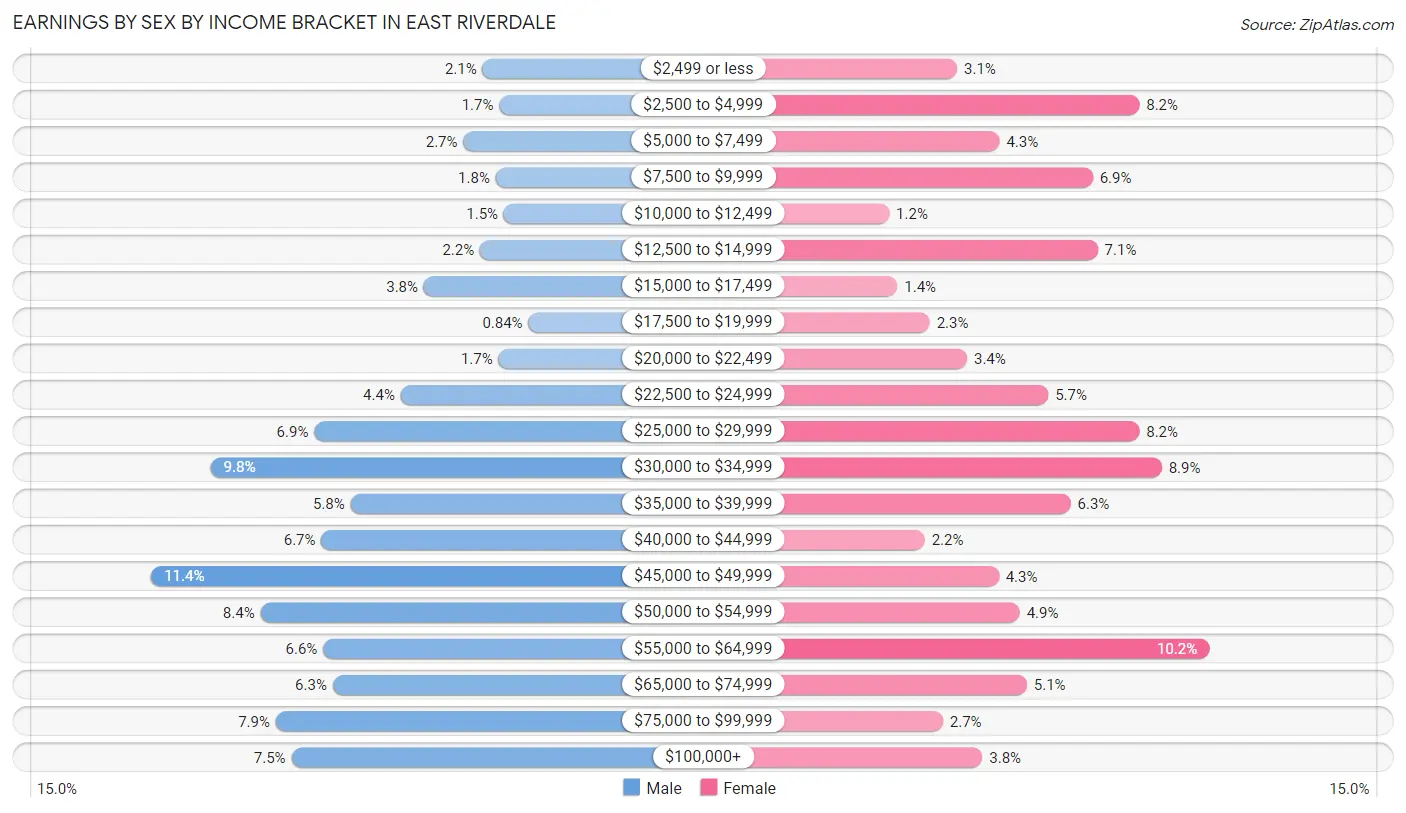
| Income | Male | Female |
| $2,499 or less | 127 (2.1%) | 109 (3.1%) |
| $2,500 to $4,999 | 99 (1.7%) | 289 (8.2%) |
| $5,000 to $7,499 | 159 (2.7%) | 151 (4.3%) |
| $7,500 to $9,999 | 105 (1.8%) | 243 (6.9%) |
| $10,000 to $12,499 | 91 (1.5%) | 42 (1.2%) |
| $12,500 to $14,999 | 131 (2.2%) | 248 (7.0%) |
| $15,000 to $17,499 | 225 (3.8%) | 50 (1.4%) |
| $17,500 to $19,999 | 50 (0.8%) | 82 (2.3%) |
| $20,000 to $22,499 | 100 (1.7%) | 119 (3.4%) |
| $22,500 to $24,999 | 264 (4.4%) | 199 (5.7%) |
| $25,000 to $29,999 | 409 (6.9%) | 289 (8.2%) |
| $30,000 to $34,999 | 582 (9.8%) | 311 (8.8%) |
| $35,000 to $39,999 | 348 (5.8%) | 221 (6.3%) |
| $40,000 to $44,999 | 397 (6.7%) | 77 (2.2%) |
| $45,000 to $49,999 | 682 (11.4%) | 150 (4.3%) |
| $50,000 to $54,999 | 499 (8.4%) | 171 (4.9%) |
| $55,000 to $64,999 | 394 (6.6%) | 358 (10.2%) |
| $65,000 to $74,999 | 378 (6.3%) | 178 (5.1%) |
| $75,000 to $99,999 | 473 (7.9%) | 95 (2.7%) |
| $100,000+ | 447 (7.5%) | 134 (3.8%) |
| Total | 5,960 (100.0%) | 3,516 (100.0%) |
Earnings by Sex by Educational Attainment in East Riverdale
Average earnings in East Riverdale are $46,292 for men and $33,458 for women, a difference of 27.7%. Men with an educational attainment of graduate degree enjoy the highest average annual earnings of $81,094, while those with college or associate's degree education earn the least with $42,375. Women with an educational attainment of graduate degree earn the most with the average annual earnings of $63,333, while those with less than high school education have the smallest earnings of $25,192.
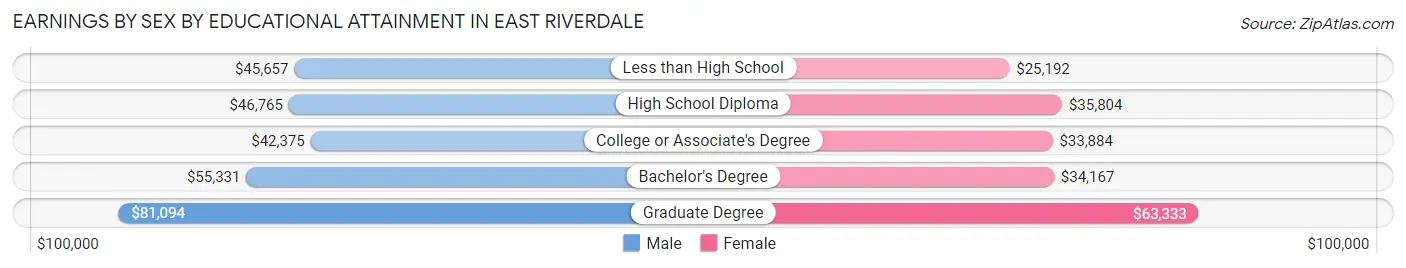
| Educational Attainment | Male Income | Female Income |
| Less than High School | $45,657 | $25,192 |
| High School Diploma | $46,765 | $35,804 |
| College or Associate's Degree | $42,375 | $33,884 |
| Bachelor's Degree | $55,331 | $34,167 |
| Graduate Degree | $81,094 | $63,333 |
| Total | $46,292 | $33,458 |
Family Income in East Riverdale
Family Income Brackets in East Riverdale
According to the East Riverdale family income data, there are 686 families falling into the $100,000 to $149,999 income range, which is the most common income bracket and makes up 18.8% of all families. Conversely, the $10,000 to $14,999 income bracket is the least frequent group with only 62 families (1.7%) belonging to this category.
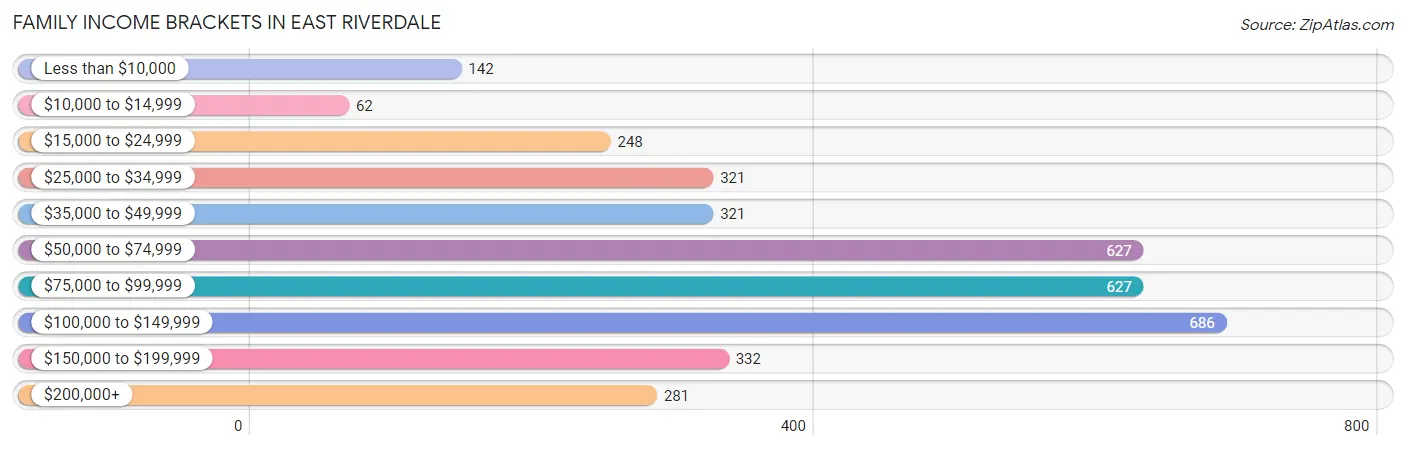
| Income Bracket | # Families | % Families |
| Less than $10,000 | 142 | 3.9% |
| $10,000 to $14,999 | 62 | 1.7% |
| $15,000 to $24,999 | 248 | 6.8% |
| $25,000 to $34,999 | 321 | 8.8% |
| $35,000 to $49,999 | 321 | 8.8% |
| $50,000 to $74,999 | 627 | 17.2% |
| $75,000 to $99,999 | 627 | 17.2% |
| $100,000 to $149,999 | 686 | 18.8% |
| $150,000 to $199,999 | 332 | 9.1% |
| $200,000+ | 281 | 7.7% |
Family Income by Famaliy Size in East Riverdale
7+ person families (380 | 10.4%) account for the highest median family income in East Riverdale with $131,379 per family, while 2-person families (1,265 | 34.7%) have the highest median income of $39,246 per family member.
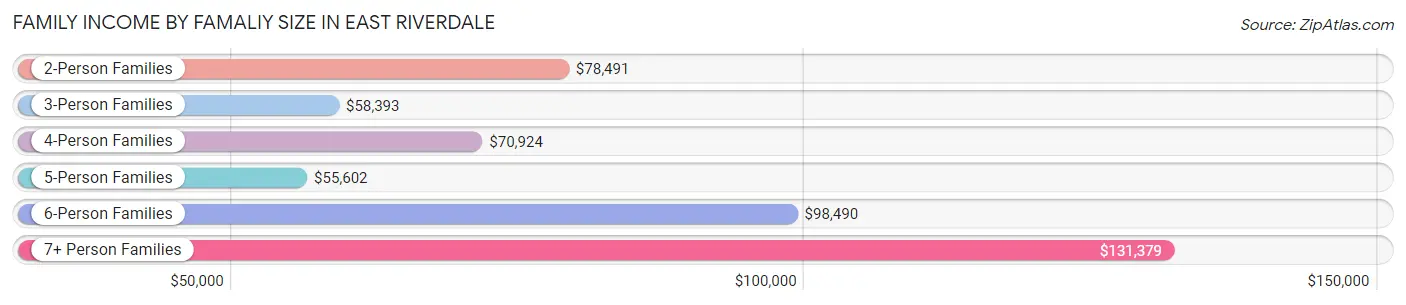
| Income Bracket | # Families | Median Income |
| 2-Person Families | 1,265 (34.7%) | $78,491 |
| 3-Person Families | 708 (19.4%) | $58,393 |
| 4-Person Families | 531 (14.6%) | $70,924 |
| 5-Person Families | 425 (11.7%) | $55,602 |
| 6-Person Families | 339 (9.3%) | $98,490 |
| 7+ Person Families | 380 (10.4%) | $131,379 |
| Total | 3,648 (100.0%) | $79,536 |
Family Income by Number of Earners in East Riverdale
The median family income in East Riverdale is $79,536, with families comprising 3+ earners (830) having the highest median family income of $150,500, while families with no earners (222) have the lowest median family income of $45,063, accounting for 22.8% and 6.1% of families, respectively.
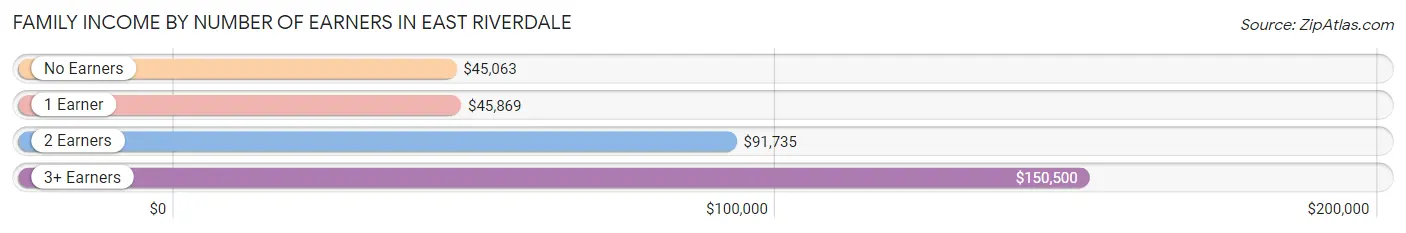
| Number of Earners | # Families | Median Income |
| No Earners | 222 (6.1%) | $45,063 |
| 1 Earner | 1,407 (38.6%) | $45,869 |
| 2 Earners | 1,189 (32.6%) | $91,735 |
| 3+ Earners | 830 (22.8%) | $150,500 |
| Total | 3,648 (100.0%) | $79,536 |
Household Income in East Riverdale
Household Income Brackets in East Riverdale
With 1,002 households falling in the category, the $100,000 to $149,999 income range is the most frequent in East Riverdale, accounting for 21.6% of all households. In contrast, only 116 households (2.5%) fall into the $10,000 to $14,999 income bracket, making it the least populous group.
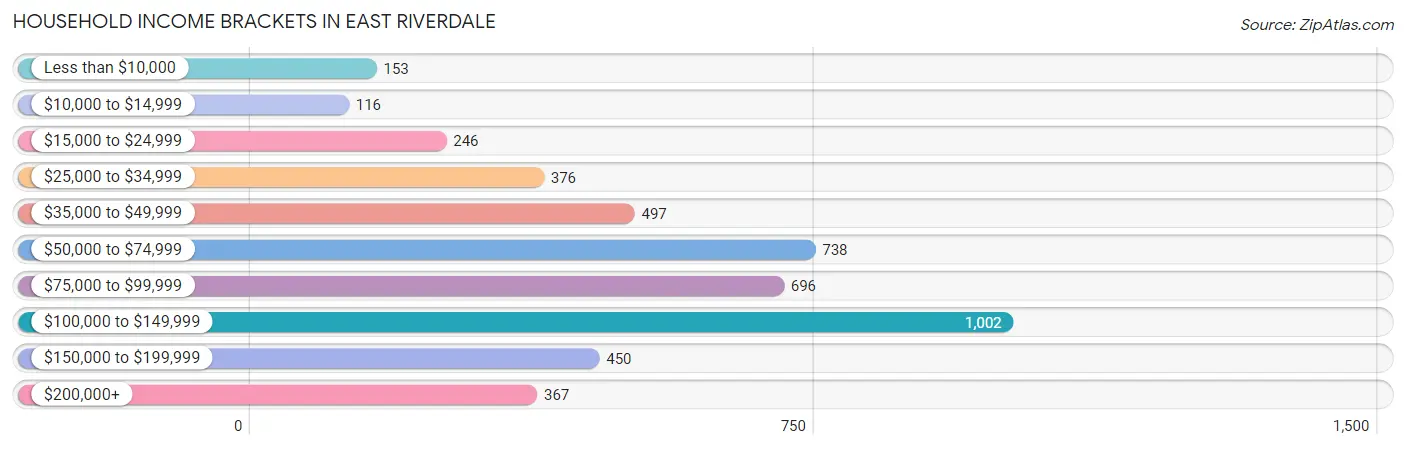
| Income Bracket | # Households | % Households |
| Less than $10,000 | 153 | 3.3% |
| $10,000 to $14,999 | 116 | 2.5% |
| $15,000 to $24,999 | 246 | 5.3% |
| $25,000 to $34,999 | 376 | 8.1% |
| $35,000 to $49,999 | 497 | 10.7% |
| $50,000 to $74,999 | 738 | 15.9% |
| $75,000 to $99,999 | 696 | 15.0% |
| $100,000 to $149,999 | 1,002 | 21.6% |
| $150,000 to $199,999 | 450 | 9.7% |
| $200,000+ | 367 | 7.9% |
Household Income by Householder Age in East Riverdale
The median household income in East Riverdale is $81,354, with the highest median household income of $104,301 found in the 45 to 64 years age bracket for the primary householder. A total of 1,794 households (38.7%) fall into this category. Meanwhile, the 65+ years age bracket for the primary householder has the lowest median household income of $57,500, with 906 households (19.5%) in this group.
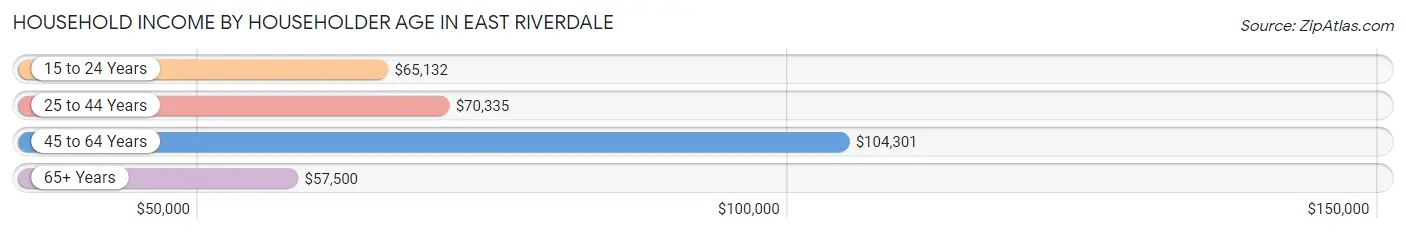
| Income Bracket | # Households | Median Income |
| 15 to 24 Years | 182 (3.9%) | $65,132 |
| 25 to 44 Years | 1,759 (37.9%) | $70,335 |
| 45 to 64 Years | 1,794 (38.7%) | $104,301 |
| 65+ Years | 906 (19.5%) | $57,500 |
| Total | 4,641 (100.0%) | $81,354 |
Poverty in East Riverdale
Income Below Poverty by Sex and Age in East Riverdale
With 17.6% poverty level for males and 20.1% for females among the residents of East Riverdale, 6 to 11 year old males and under 5 year old females are the most vulnerable to poverty, with 426 males (45.7%) and 193 females (41.1%) in their respective age groups living below the poverty level.
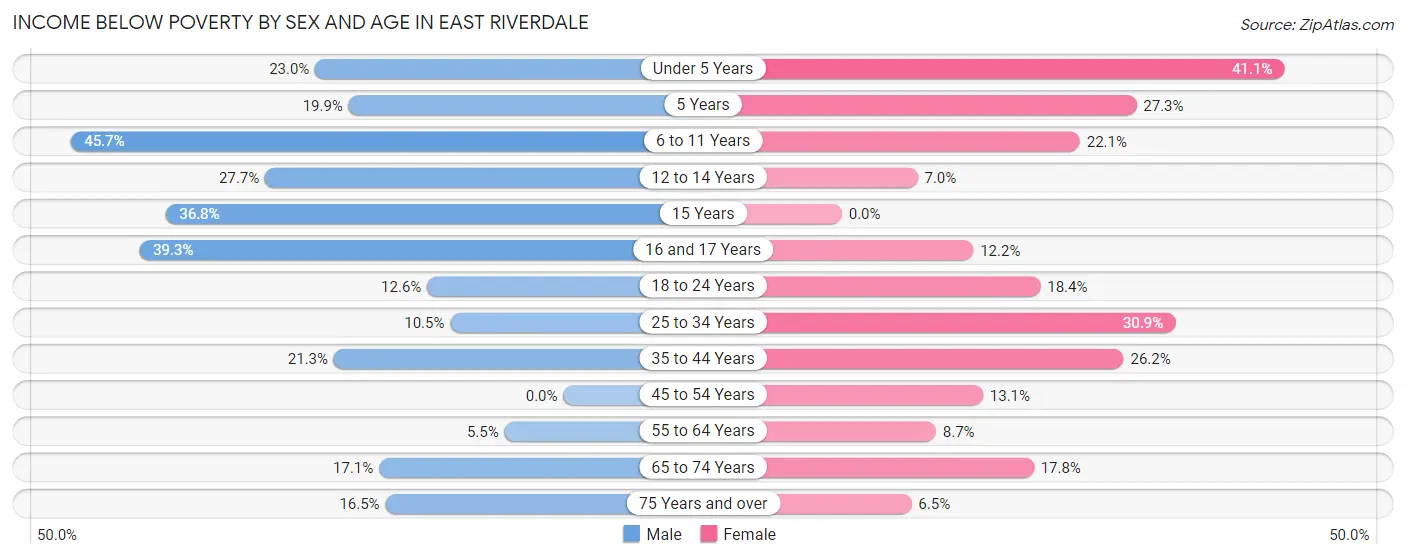
| Age Bracket | Male | Female |
| Under 5 Years | 243 (23.0%) | 193 (41.1%) |
| 5 Years | 47 (19.9%) | 38 (27.3%) |
| 6 to 11 Years | 426 (45.7%) | 180 (22.1%) |
| 12 to 14 Years | 137 (27.7%) | 31 (7.0%) |
| 15 Years | 49 (36.8%) | 0 (0.0%) |
| 16 and 17 Years | 110 (39.3%) | 40 (12.2%) |
| 18 to 24 Years | 139 (12.6%) | 163 (18.4%) |
| 25 to 34 Years | 170 (10.5%) | 360 (30.9%) |
| 35 to 44 Years | 302 (21.3%) | 301 (26.2%) |
| 45 to 54 Years | 0 (0.0%) | 119 (13.1%) |
| 55 to 64 Years | 40 (5.5%) | 60 (8.7%) |
| 65 to 74 Years | 66 (17.1%) | 99 (17.8%) |
| 75 Years and over | 18 (16.5%) | 19 (6.5%) |
| Total | 1,747 (17.6%) | 1,603 (20.1%) |
Income Above Poverty by Sex and Age in East Riverdale
According to the poverty statistics in East Riverdale, males aged 45 to 54 years and females aged 15 years are the age groups that are most secure financially, with 100.0% of males and 100.0% of females in these age groups living above the poverty line.
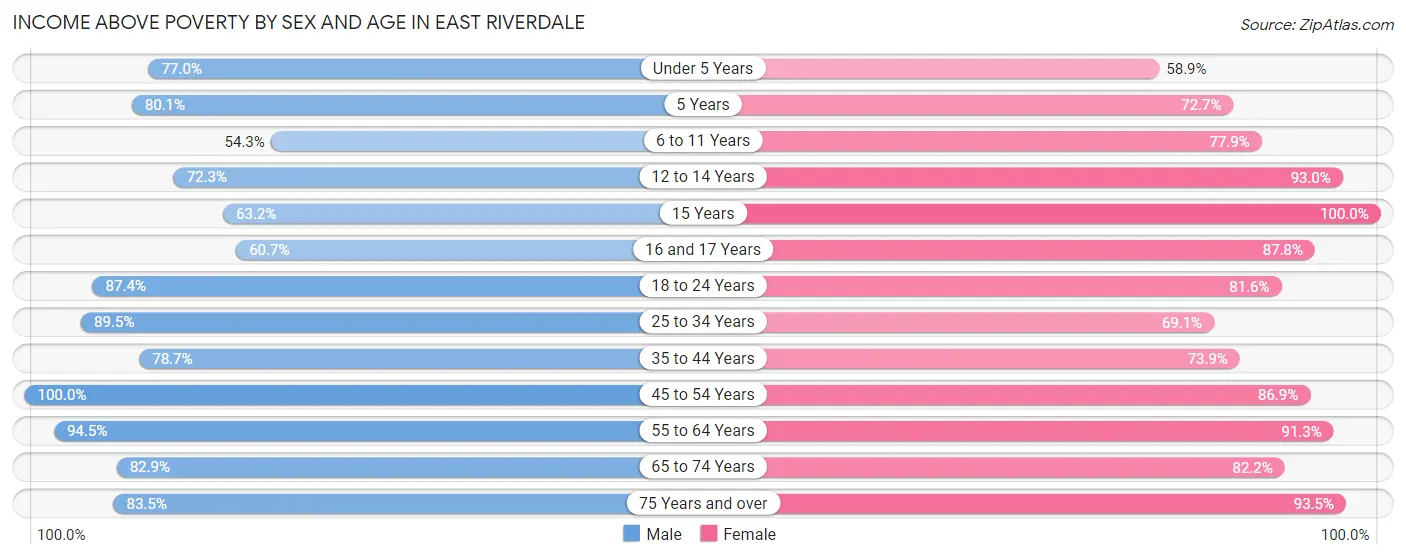
| Age Bracket | Male | Female |
| Under 5 Years | 812 (77.0%) | 277 (58.9%) |
| 5 Years | 189 (80.1%) | 101 (72.7%) |
| 6 to 11 Years | 507 (54.3%) | 635 (77.9%) |
| 12 to 14 Years | 358 (72.3%) | 410 (93.0%) |
| 15 Years | 84 (63.2%) | 157 (100.0%) |
| 16 and 17 Years | 170 (60.7%) | 288 (87.8%) |
| 18 to 24 Years | 961 (87.4%) | 722 (81.6%) |
| 25 to 34 Years | 1,450 (89.5%) | 804 (69.1%) |
| 35 to 44 Years | 1,116 (78.7%) | 850 (73.9%) |
| 45 to 54 Years | 1,417 (100.0%) | 790 (86.9%) |
| 55 to 64 Years | 693 (94.5%) | 627 (91.3%) |
| 65 to 74 Years | 320 (82.9%) | 457 (82.2%) |
| 75 Years and over | 91 (83.5%) | 275 (93.5%) |
| Total | 8,168 (82.4%) | 6,393 (79.9%) |
Income Below Poverty Among Married-Couple Families in East Riverdale
The poverty statistics for married-couple families in East Riverdale show that 14.5% or 285 of the total 1,970 families live below the poverty line. Families with 5 or more children have the highest poverty rate of 100.0%, comprising of 23 families. On the other hand, families with no children have the lowest poverty rate of 4.2%, which includes 36 families.
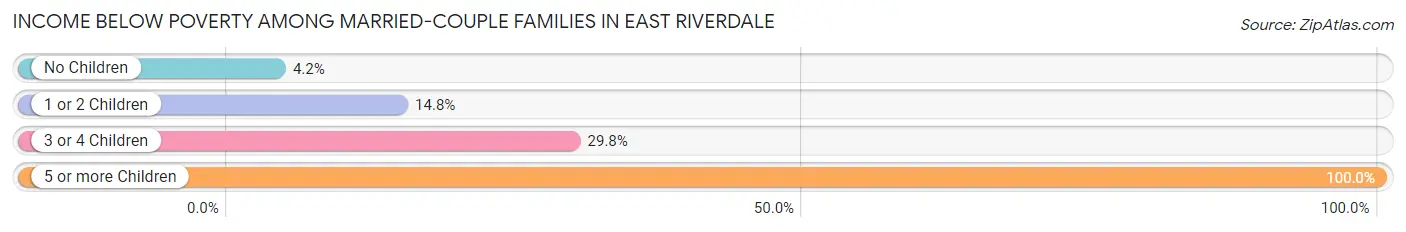
| Children | Above Poverty | Below Poverty |
| No Children | 827 (95.8%) | 36 (4.2%) |
| 1 or 2 Children | 552 (85.2%) | 96 (14.8%) |
| 3 or 4 Children | 306 (70.2%) | 130 (29.8%) |
| 5 or more Children | 0 (0.0%) | 23 (100.0%) |
| Total | 1,685 (85.5%) | 285 (14.5%) |
Income Below Poverty Among Single-Parent Households in East Riverdale
According to the poverty data in East Riverdale, 9.0% or 79 single-father households and 19.1% or 152 single-mother households are living below the poverty line. Among single-father households, those with 3 or 4 children have the highest poverty rate, with 63 households (45.3%) experiencing poverty. Likewise, among single-mother households, those with 1 or 2 children have the highest poverty rate, with 134 households (31.1%) falling below the poverty line.
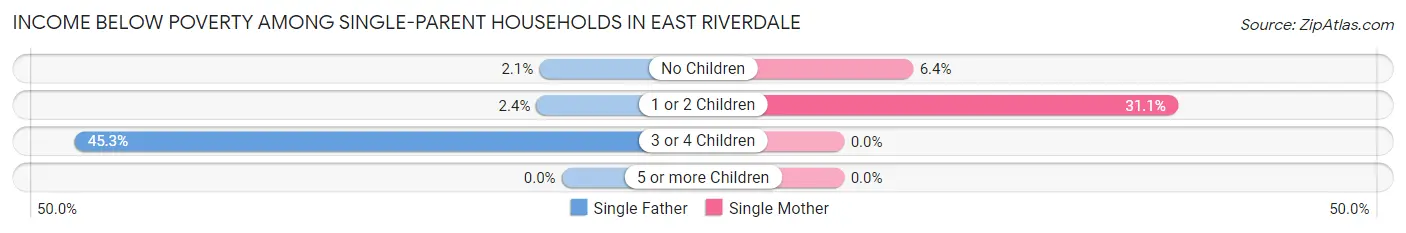
| Children | Single Father | Single Mother |
| No Children | 6 (2.1%) | 18 (6.4%) |
| 1 or 2 Children | 10 (2.4%) | 134 (31.1%) |
| 3 or 4 Children | 63 (45.3%) | 0 (0.0%) |
| 5 or more Children | 0 (0.0%) | 0 (0.0%) |
| Total | 79 (9.0%) | 152 (19.1%) |
Income Below Poverty Among Married-Couple vs Single-Parent Households in East Riverdale
The poverty data for East Riverdale shows that 285 of the married-couple family households (14.5%) and 231 of the single-parent households (13.8%) are living below the poverty level. Within the married-couple family households, those with 5 or more children have the highest poverty rate, with 23 households (100.0%) falling below the poverty line. Among the single-parent households, those with 3 or 4 children have the highest poverty rate, with 63 household (29.4%) living below poverty.
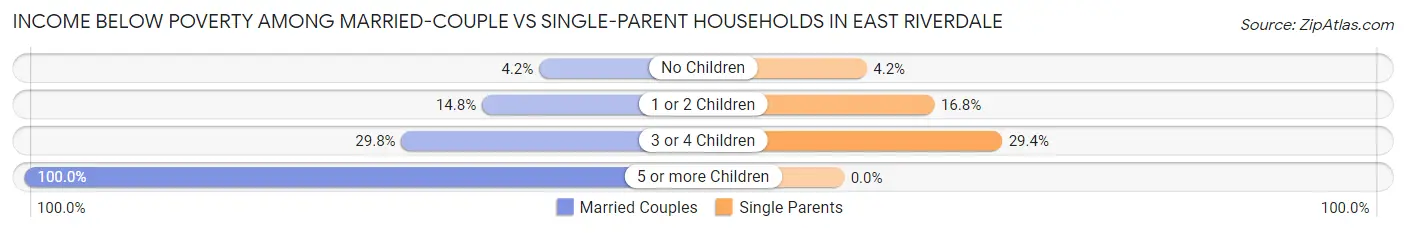
| Children | Married-Couple Families | Single-Parent Households |
| No Children | 36 (4.2%) | 24 (4.2%) |
| 1 or 2 Children | 96 (14.8%) | 144 (16.8%) |
| 3 or 4 Children | 130 (29.8%) | 63 (29.4%) |
| 5 or more Children | 23 (100.0%) | 0 (0.0%) |
| Total | 285 (14.5%) | 231 (13.8%) |
Race in East Riverdale
The most populous races in East Riverdale are Hispanic or Latino (11,898 | 65.8%), Some other Race (8,327 | 46.1%), and Black / African American (4,400 | 24.3%).
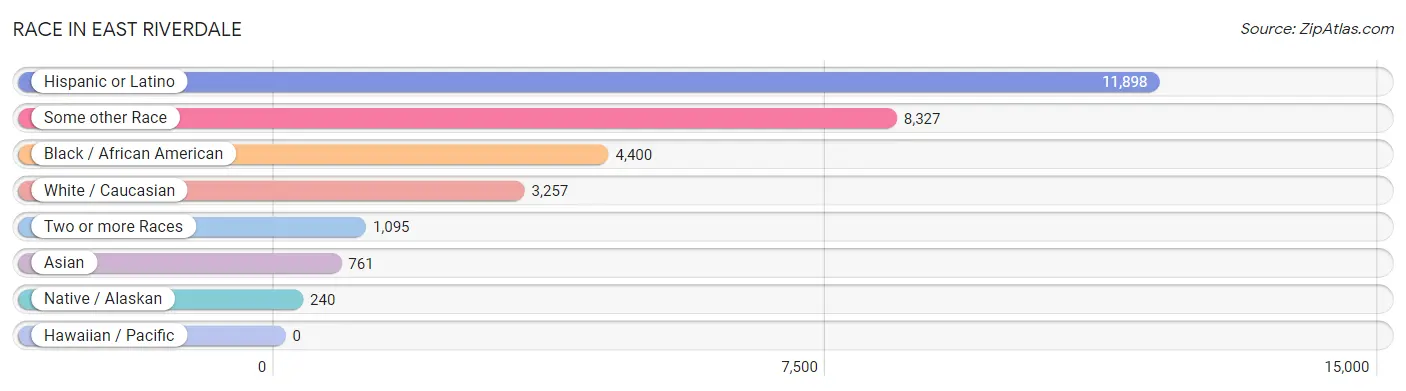
| Race | # Population | % Population |
| Asian | 761 | 4.2% |
| Black / African American | 4,400 | 24.3% |
| Hawaiian / Pacific | 0 | 0.0% |
| Hispanic or Latino | 11,898 | 65.8% |
| Native / Alaskan | 240 | 1.3% |
| White / Caucasian | 3,257 | 18.0% |
| Two or more Races | 1,095 | 6.1% |
| Some other Race | 8,327 | 46.1% |
| Total | 18,080 | 100.0% |
Ancestry in East Riverdale
The most populous ancestries reported in East Riverdale are Central American (6,421 | 35.5%), Salvadoran (4,914 | 27.2%), Mexican (3,902 | 21.6%), Subsaharan African (1,064 | 5.9%), and Guatemalan (954 | 5.3%), together accounting for 95.4% of all East Riverdale residents.
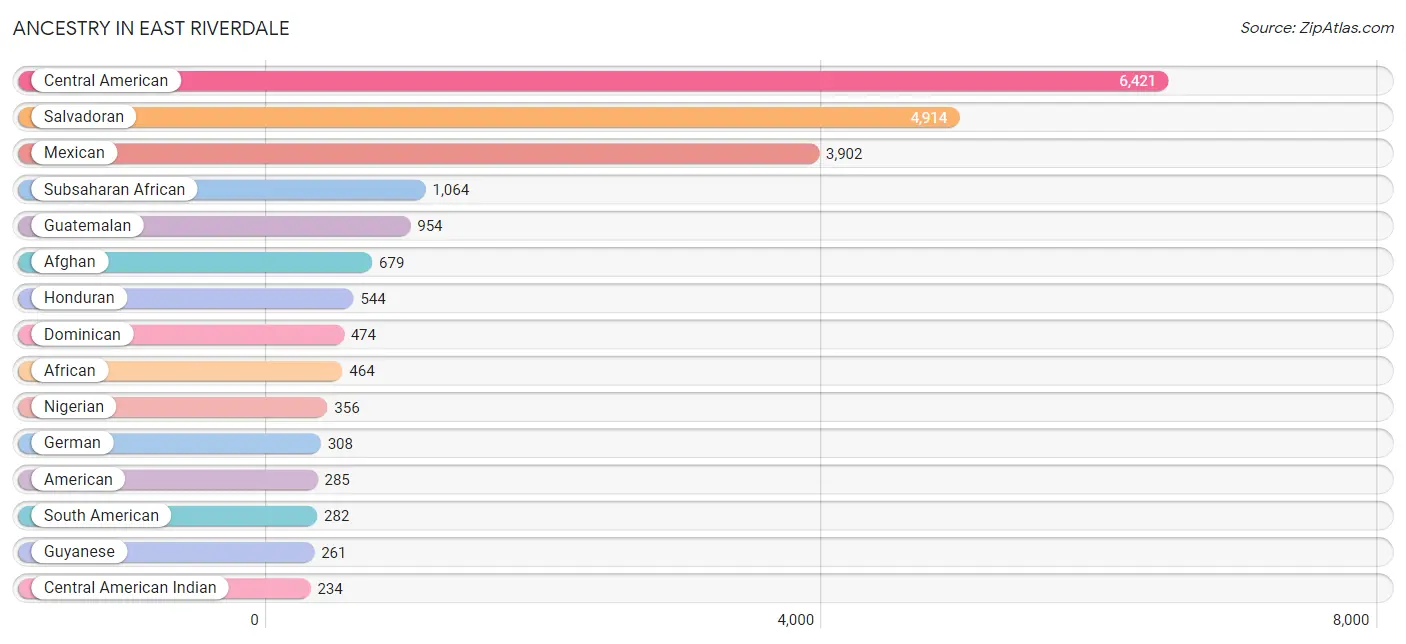
| Ancestry | # Population | % Population |
| Afghan | 679 | 3.8% |
| African | 464 | 2.6% |
| American | 285 | 1.6% |
| Arab | 37 | 0.2% |
| Australian | 93 | 0.5% |
| Austrian | 10 | 0.1% |
| Bolivian | 29 | 0.2% |
| British | 7 | 0.0% |
| British West Indian | 9 | 0.1% |
| Central American | 6,421 | 35.5% |
| Central American Indian | 234 | 1.3% |
| Colombian | 39 | 0.2% |
| Costa Rican | 9 | 0.1% |
| Creek | 13 | 0.1% |
| Croatian | 18 | 0.1% |
| Cuban | 17 | 0.1% |
| Dominican | 474 | 2.6% |
| Ecuadorian | 27 | 0.2% |
| English | 221 | 1.2% |
| Ethiopian | 12 | 0.1% |
| European | 16 | 0.1% |
| Filipino | 15 | 0.1% |
| French | 14 | 0.1% |
| French Canadian | 18 | 0.1% |
| German | 308 | 1.7% |
| Ghanaian | 12 | 0.1% |
| Greek | 12 | 0.1% |
| Guamanian / Chamorro | 16 | 0.1% |
| Guatemalan | 954 | 5.3% |
| Guyanese | 261 | 1.4% |
| Haitian | 10 | 0.1% |
| Honduran | 544 | 3.0% |
| Indian (Asian) | 79 | 0.4% |
| Iraqi | 12 | 0.1% |
| Irish | 192 | 1.1% |
| Italian | 49 | 0.3% |
| Jamaican | 164 | 0.9% |
| Japanese | 32 | 0.2% |
| Korean | 15 | 0.1% |
| Mexican | 3,902 | 21.6% |
| Mexican American Indian | 6 | 0.0% |
| Nigerian | 356 | 2.0% |
| Norwegian | 7 | 0.0% |
| Peruvian | 131 | 0.7% |
| Polish | 26 | 0.1% |
| Puerto Rican | 224 | 1.2% |
| Salvadoran | 4,914 | 27.2% |
| Scotch-Irish | 6 | 0.0% |
| Scottish | 13 | 0.1% |
| Slavic | 43 | 0.2% |
| South American | 282 | 1.6% |
| Spanish | 81 | 0.4% |
| Sri Lankan | 4 | 0.0% |
| Subsaharan African | 1,064 | 5.9% |
| Swedish | 39 | 0.2% |
| Thai | 45 | 0.3% |
| Venezuelan | 56 | 0.3% |
| Welsh | 7 | 0.0% |
| West Indian | 114 | 0.6% | View All 59 Rows |
Immigrants in East Riverdale
The most numerous immigrant groups reported in East Riverdale came from Latin America (7,763 | 42.9%), Central America (6,729 | 37.2%), El Salvador (3,638 | 20.1%), Mexico (1,943 | 10.7%), and Asia (917 | 5.1%), together accounting for 116.1% of all East Riverdale residents.
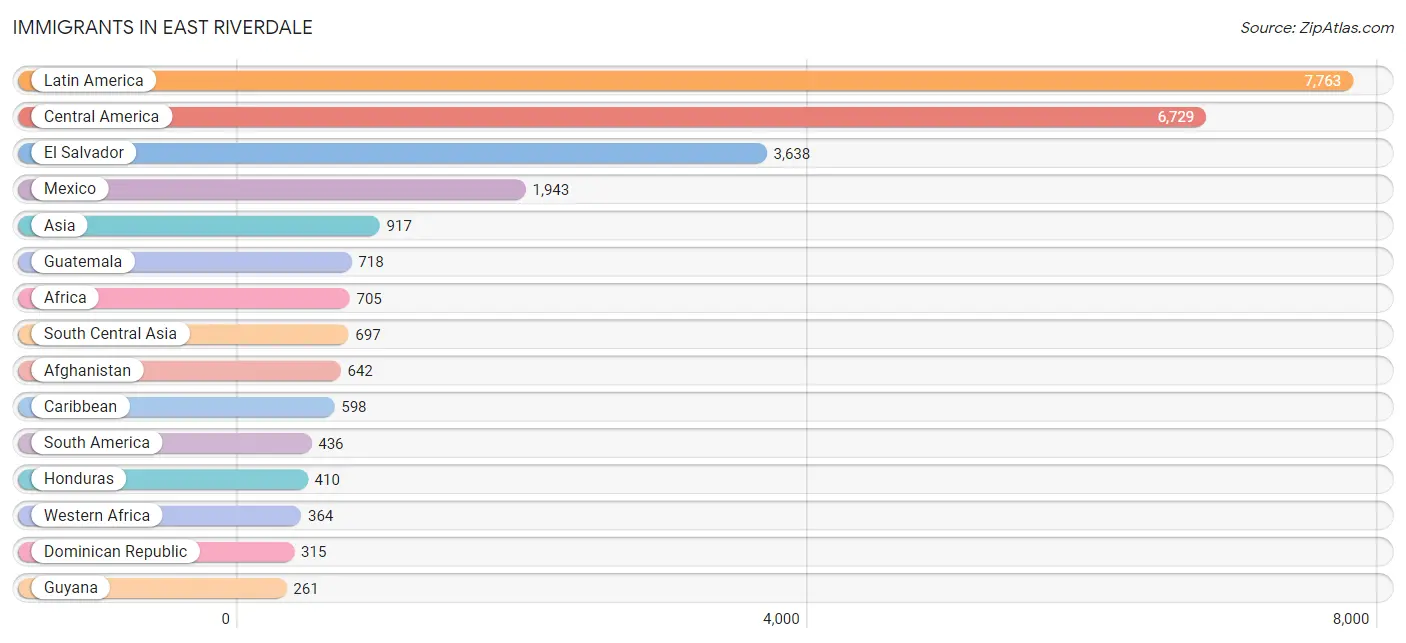
| Immigration Origin | # Population | % Population |
| Afghanistan | 642 | 3.5% |
| Africa | 705 | 3.9% |
| Asia | 917 | 5.1% |
| Australia | 93 | 0.5% |
| Bolivia | 29 | 0.2% |
| Cambodia | 32 | 0.2% |
| Cameroon | 219 | 1.2% |
| Canada | 8 | 0.0% |
| Caribbean | 598 | 3.3% |
| Central America | 6,729 | 37.2% |
| China | 50 | 0.3% |
| Colombia | 15 | 0.1% |
| Cuba | 17 | 0.1% |
| Dominica | 14 | 0.1% |
| Dominican Republic | 315 | 1.7% |
| Eastern Africa | 12 | 0.1% |
| Eastern Asia | 50 | 0.3% |
| El Salvador | 3,638 | 20.1% |
| Ethiopia | 12 | 0.1% |
| Europe | 36 | 0.2% |
| Germany | 17 | 0.1% |
| Ghana | 31 | 0.2% |
| Guatemala | 718 | 4.0% |
| Guyana | 261 | 1.4% |
| Haiti | 10 | 0.1% |
| Honduras | 410 | 2.3% |
| India | 33 | 0.2% |
| Indonesia | 6 | 0.0% |
| Iraq | 37 | 0.2% |
| Jamaica | 139 | 0.8% |
| Latin America | 7,763 | 42.9% |
| Liberia | 13 | 0.1% |
| Mexico | 1,943 | 10.7% |
| Middle Africa | 219 | 1.2% |
| Nicaragua | 20 | 0.1% |
| Nigeria | 207 | 1.1% |
| Northern Europe | 19 | 0.1% |
| Oceania | 93 | 0.5% |
| Peru | 131 | 0.7% |
| Philippines | 15 | 0.1% |
| Sierra Leone | 59 | 0.3% |
| South America | 436 | 2.4% |
| South Central Asia | 697 | 3.9% |
| South Eastern Asia | 53 | 0.3% |
| Taiwan | 15 | 0.1% |
| Trinidad and Tobago | 20 | 0.1% |
| Turkey | 80 | 0.4% |
| West Indies | 83 | 0.5% |
| Western Africa | 364 | 2.0% |
| Western Asia | 117 | 0.6% |
| Western Europe | 17 | 0.1% | View All 51 Rows |
Sex and Age in East Riverdale
Sex and Age in East Riverdale
The most populous age groups in East Riverdale are Under 5 Years (1,055 | 10.6%) for men and 15 to 19 Years (834 | 10.3%) for women.
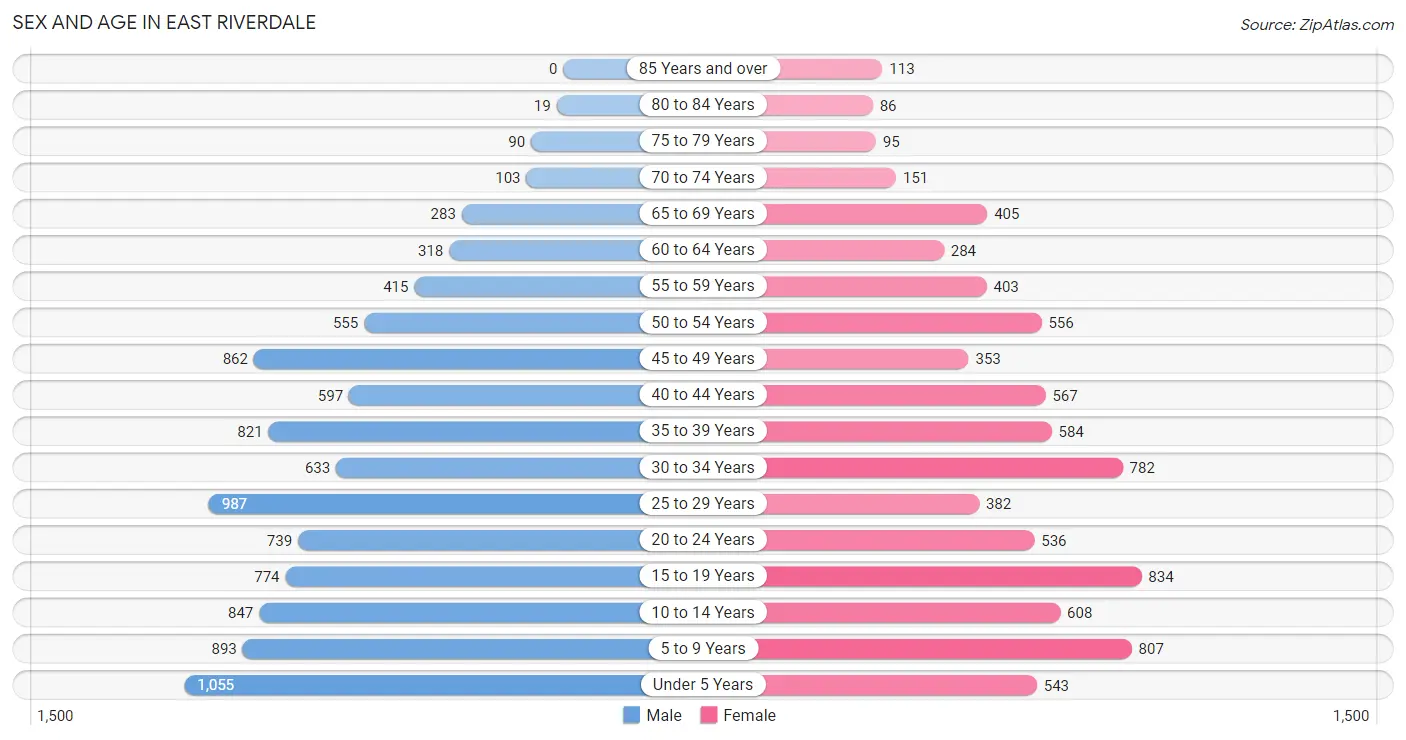
| Age Bracket | Male | Female |
| Under 5 Years | 1,055 (10.6%) | 543 (6.7%) |
| 5 to 9 Years | 893 (8.9%) | 807 (10.0%) |
| 10 to 14 Years | 847 (8.5%) | 608 (7.5%) |
| 15 to 19 Years | 774 (7.7%) | 834 (10.3%) |
| 20 to 24 Years | 739 (7.4%) | 536 (6.6%) |
| 25 to 29 Years | 987 (9.9%) | 382 (4.7%) |
| 30 to 34 Years | 633 (6.3%) | 782 (9.7%) |
| 35 to 39 Years | 821 (8.2%) | 584 (7.2%) |
| 40 to 44 Years | 597 (6.0%) | 567 (7.0%) |
| 45 to 49 Years | 862 (8.6%) | 353 (4.4%) |
| 50 to 54 Years | 555 (5.6%) | 556 (6.9%) |
| 55 to 59 Years | 415 (4.2%) | 403 (5.0%) |
| 60 to 64 Years | 318 (3.2%) | 284 (3.5%) |
| 65 to 69 Years | 283 (2.8%) | 405 (5.0%) |
| 70 to 74 Years | 103 (1.0%) | 151 (1.9%) |
| 75 to 79 Years | 90 (0.9%) | 95 (1.2%) |
| 80 to 84 Years | 19 (0.2%) | 86 (1.1%) |
| 85 Years and over | 0 (0.0%) | 113 (1.4%) |
| Total | 9,991 (100.0%) | 8,089 (100.0%) |
Families and Households in East Riverdale
Median Family Size in East Riverdale
The median family size in East Riverdale is 4.13 persons per family, with single female/mother families (798 | 21.9%) accounting for the largest median family size of 4.35 persons per family. On the other hand, single male/father families (880 | 24.1%) represent the smallest median family size with 3.63 persons per family.
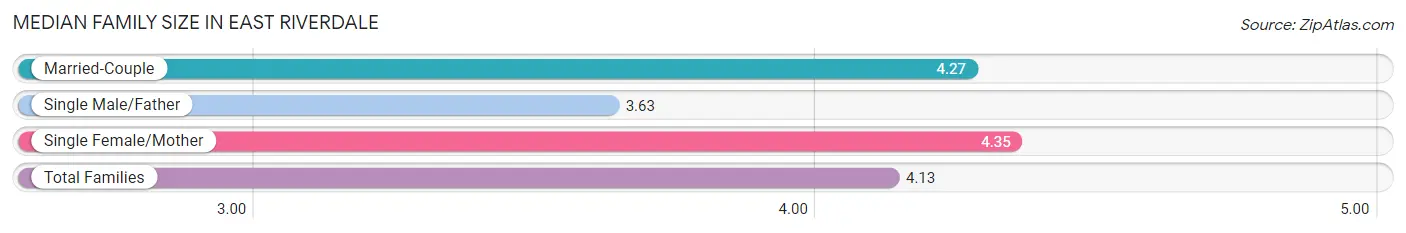
| Family Type | # Families | Family Size |
| Married-Couple | 1,970 (54.0%) | 4.27 |
| Single Male/Father | 880 (24.1%) | 3.63 |
| Single Female/Mother | 798 (21.9%) | 4.35 |
| Total Families | 3,648 (100.0%) | 4.13 |
Median Household Size in East Riverdale
The median household size in East Riverdale is 3.89 persons per household, with single female/mother households (798 | 17.2%) accounting for the largest median household size of 4.9 persons per household. non-family households (993 | 21.4%) represent the smallest median household size with 1.40 persons per household.
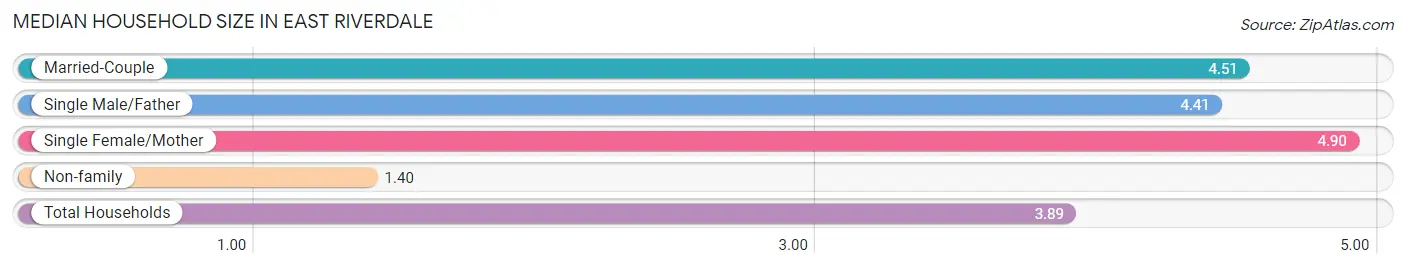
| Household Type | # Households | Household Size |
| Married-Couple | 1,970 (42.4%) | 4.51 |
| Single Male/Father | 880 (19.0%) | 4.41 |
| Single Female/Mother | 798 (17.2%) | 4.90 |
| Non-family | 993 (21.4%) | 1.40 |
| Total Households | 4,641 (100.0%) | 3.89 |
Household Size by Marriage Status in East Riverdale
Out of a total of 4,641 households in East Riverdale, 3,648 (78.6%) are family households, while 993 (21.4%) are nonfamily households. The most numerous type of family households are 2-person households, comprising 868, and the most common type of nonfamily households are 1-person households, comprising 787.
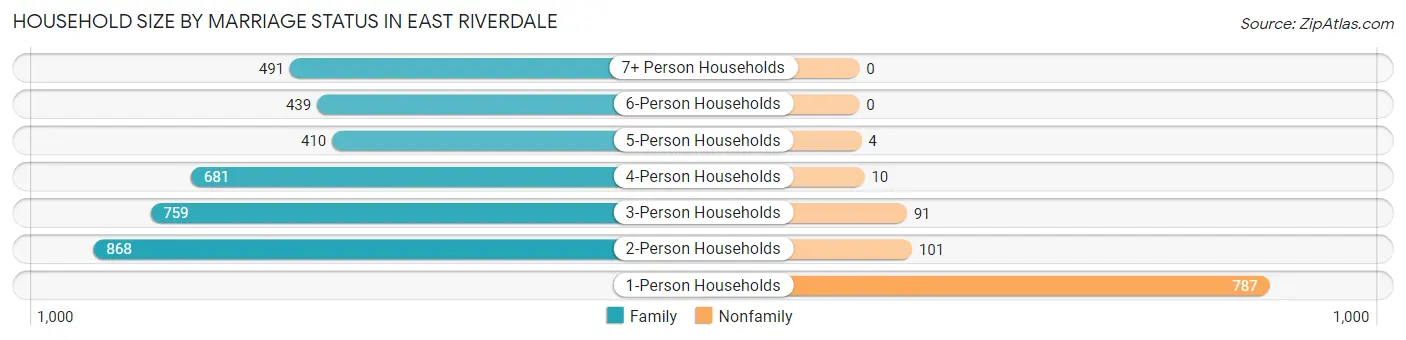
| Household Size | Family Households | Nonfamily Households |
| 1-Person Households | - | 787 (17.0%) |
| 2-Person Households | 868 (18.7%) | 101 (2.2%) |
| 3-Person Households | 759 (16.4%) | 91 (2.0%) |
| 4-Person Households | 681 (14.7%) | 10 (0.2%) |
| 5-Person Households | 410 (8.8%) | 4 (0.1%) |
| 6-Person Households | 439 (9.5%) | 0 (0.0%) |
| 7+ Person Households | 491 (10.6%) | 0 (0.0%) |
| Total | 3,648 (78.6%) | 993 (21.4%) |
Female Fertility in East Riverdale
Fertility by Age in East Riverdale
Average fertility rate in East Riverdale is 74.0 births per 1,000 women. Women in the age bracket of 20 to 34 years have the highest fertility rate with 154.0 births per 1,000 women. Women in the age bracket of 20 to 34 years acount for 84.0% of all women with births.
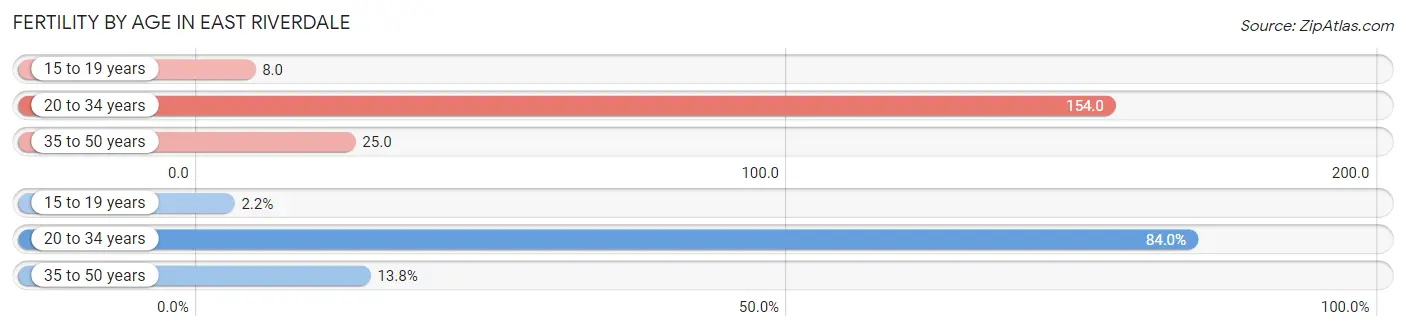
| Age Bracket | Women with Births | Births / 1,000 Women |
| 15 to 19 years | 7 (2.2%) | 8.0 |
| 20 to 34 years | 262 (84.0%) | 154.0 |
| 35 to 50 years | 43 (13.8%) | 25.0 |
| Total | 312 (100.0%) | 74.0 |
Fertility by Age by Marriage Status in East Riverdale
58.7% of women with births (312) in East Riverdale are married. The highest percentage of unmarried women with births falls into 20 to 34 years age bracket with 49.2% of them unmarried at the time of birth, while the lowest percentage of unmarried women with births belong to 15 to 19 years age bracket with 0.0% of them unmarried.
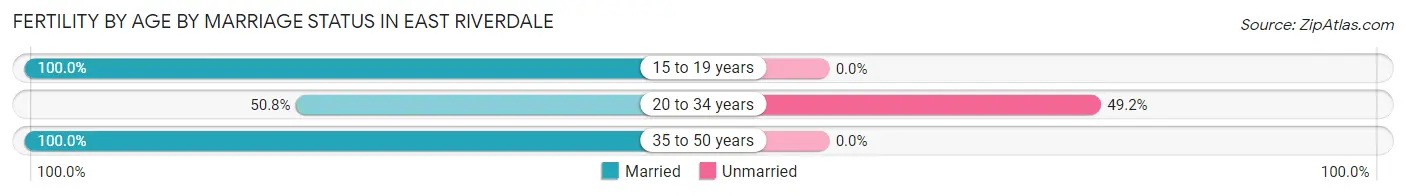
| Age Bracket | Married | Unmarried |
| 15 to 19 years | 7 (100.0%) | 0 (0.0%) |
| 20 to 34 years | 133 (50.8%) | 129 (49.2%) |
| 35 to 50 years | 43 (100.0%) | 0 (0.0%) |
| Total | 183 (58.7%) | 129 (41.3%) |
Fertility by Education in East Riverdale
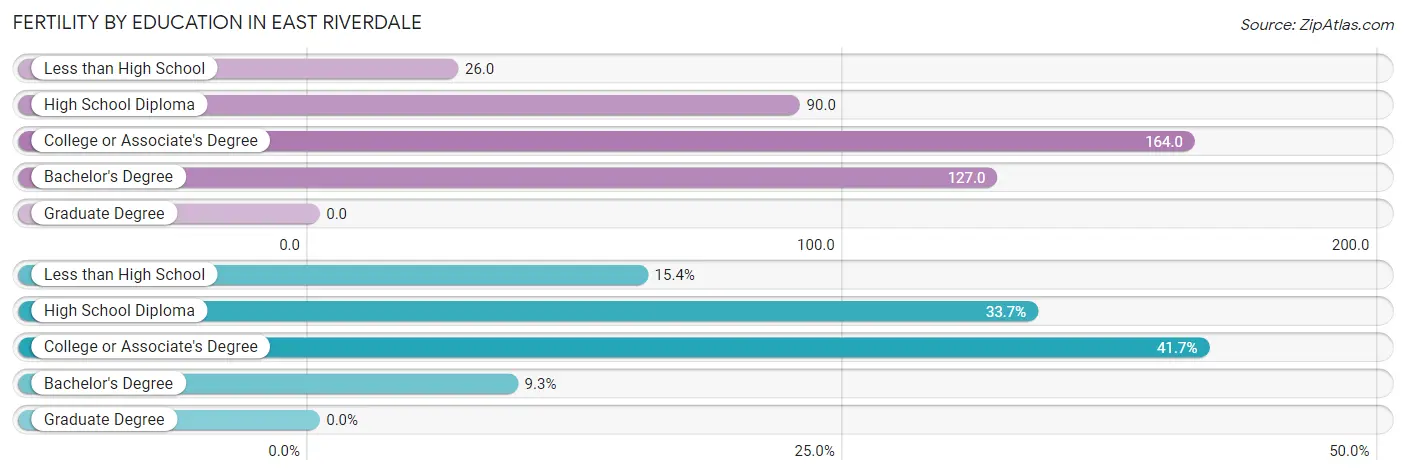
| Educational Attainment | Women with Births | Births / 1,000 Women |
| Less than High School | 48 (15.4%) | 26.0 |
| High School Diploma | 105 (33.7%) | 90.0 |
| College or Associate's Degree | 130 (41.7%) | 164.0 |
| Bachelor's Degree | 29 (9.3%) | 127.0 |
| Graduate Degree | 0 (0.0%) | 0.0 |
| Total | 312 (100.0%) | 74.0 |
Fertility by Education by Marriage Status in East Riverdale
41.3% of women with births in East Riverdale are unmarried. Women with the educational attainment of high school diploma are most likely to be married with 89.5% of them married at childbirth, while women with the educational attainment of less than high school are least likely to be married with 66.7% of them unmarried at childbirth.
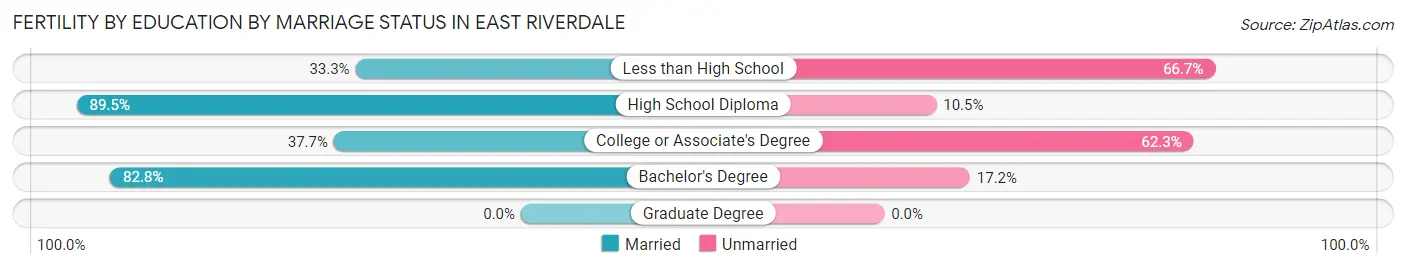
| Educational Attainment | Married | Unmarried |
| Less than High School | 16 (33.3%) | 32 (66.7%) |
| High School Diploma | 94 (89.5%) | 11 (10.5%) |
| College or Associate's Degree | 49 (37.7%) | 81 (62.3%) |
| Bachelor's Degree | 24 (82.8%) | 5 (17.2%) |
| Graduate Degree | 0 (0.0%) | 0 (0.0%) |
| Total | 183 (58.7%) | 129 (41.3%) |
Employment Characteristics in East Riverdale
Employment by Class of Employer in East Riverdale
Among the 8,406 employed individuals in East Riverdale, private company employees (6,406 | 76.2%), self-employed (not incorporated) (587 | 7.0%), and federal government employees (419 | 5.0%) make up the most common classes of employment.
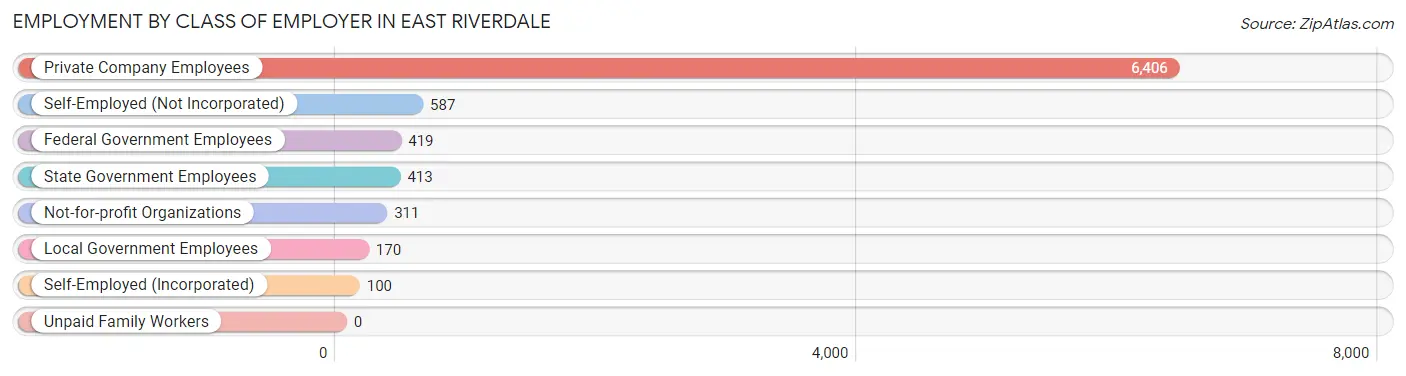
| Employer Class | # Employees | % Employees |
| Private Company Employees | 6,406 | 76.2% |
| Self-Employed (Incorporated) | 100 | 1.2% |
| Self-Employed (Not Incorporated) | 587 | 7.0% |
| Not-for-profit Organizations | 311 | 3.7% |
| Local Government Employees | 170 | 2.0% |
| State Government Employees | 413 | 4.9% |
| Federal Government Employees | 419 | 5.0% |
| Unpaid Family Workers | 0 | 0.0% |
| Total | 8,406 | 100.0% |
Employment Status by Age in East Riverdale
According to the labor force statistics for East Riverdale, out of the total population over 16 years of age (13,037), 71.5% or 9,321 individuals are in the labor force, with 8.0% or 746 of them unemployed. The age group with the highest labor force participation rate is 45 to 54 years, with 88.9% or 2,068 individuals in the labor force. Within the labor force, the 75 years and over age range has the highest percentage of unemployed individuals, with 33.3% or 17 of them being unemployed.
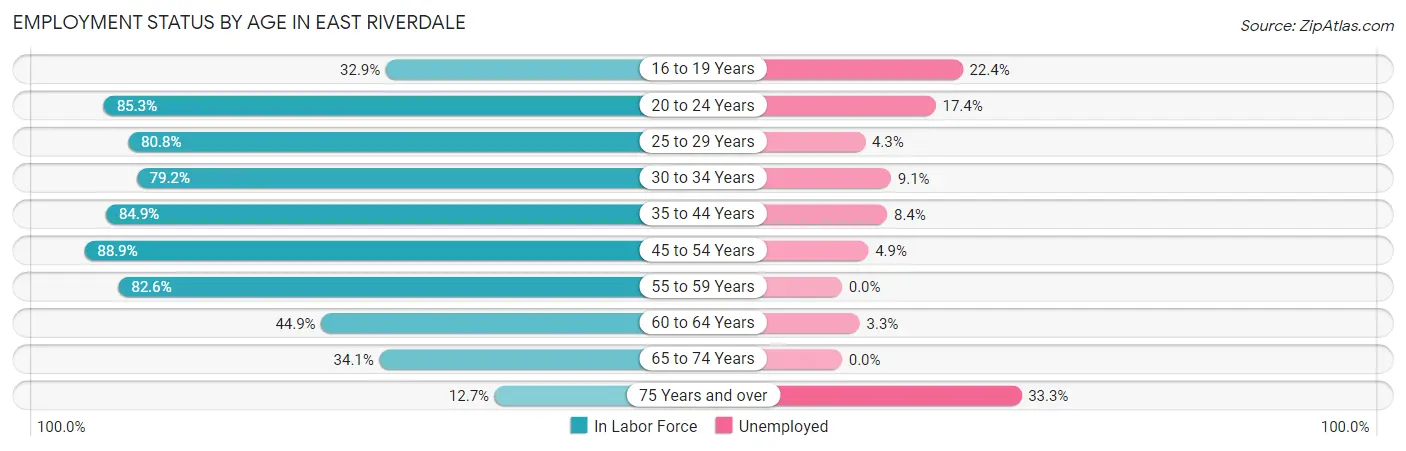
| Age Bracket | In Labor Force | Unemployed |
| 16 to 19 Years | 434 (32.9%) | 97 (22.4%) |
| 20 to 24 Years | 1,088 (85.3%) | 189 (17.4%) |
| 25 to 29 Years | 1,106 (80.8%) | 48 (4.3%) |
| 30 to 34 Years | 1,121 (79.2%) | 102 (9.1%) |
| 35 to 44 Years | 2,181 (84.9%) | 183 (8.4%) |
| 45 to 54 Years | 2,068 (88.9%) | 101 (4.9%) |
| 55 to 59 Years | 676 (82.6%) | 0 (0.0%) |
| 60 to 64 Years | 270 (44.9%) | 9 (3.3%) |
| 65 to 74 Years | 321 (34.1%) | 0 (0.0%) |
| 75 Years and over | 51 (12.7%) | 17 (33.3%) |
| Total | 9,321 (71.5%) | 746 (8.0%) |
Employment Status by Educational Attainment in East Riverdale
According to labor force statistics for East Riverdale, 81.6% of individuals (7,425) out of the total population between 25 and 64 years of age (9,099) are in the labor force, with 6.0% or 446 of them being unemployed. The group with the highest labor force participation rate are those with the educational attainment of bachelor's degree or higher, with 93.1% or 1,244 individuals in the labor force. Within the labor force, individuals with college / associate degree education have the highest percentage of unemployment, with 8.8% or 110 of them being unemployed.
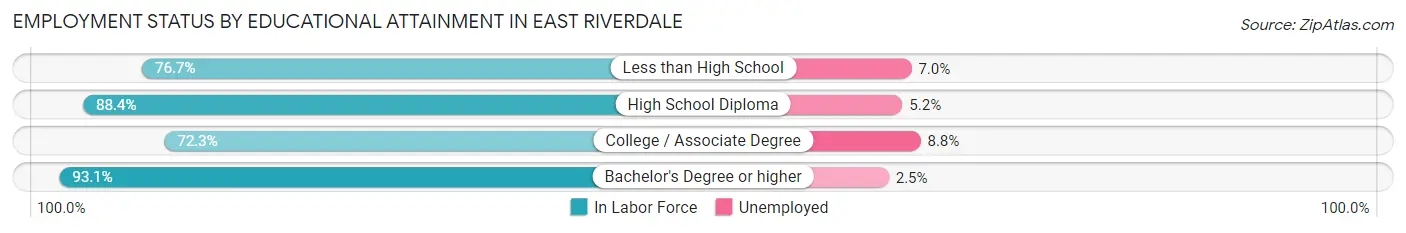
| Educational Attainment | In Labor Force | Unemployed |
| Less than High School | 2,654 (76.7%) | 242 (7.0%) |
| High School Diploma | 2,275 (88.4%) | 134 (5.2%) |
| College / Associate Degree | 1,251 (72.3%) | 152 (8.8%) |
| Bachelor's Degree or higher | 1,244 (93.1%) | 33 (2.5%) |
| Total | 7,425 (81.6%) | 546 (6.0%) |
Employment Occupations by Sex in East Riverdale
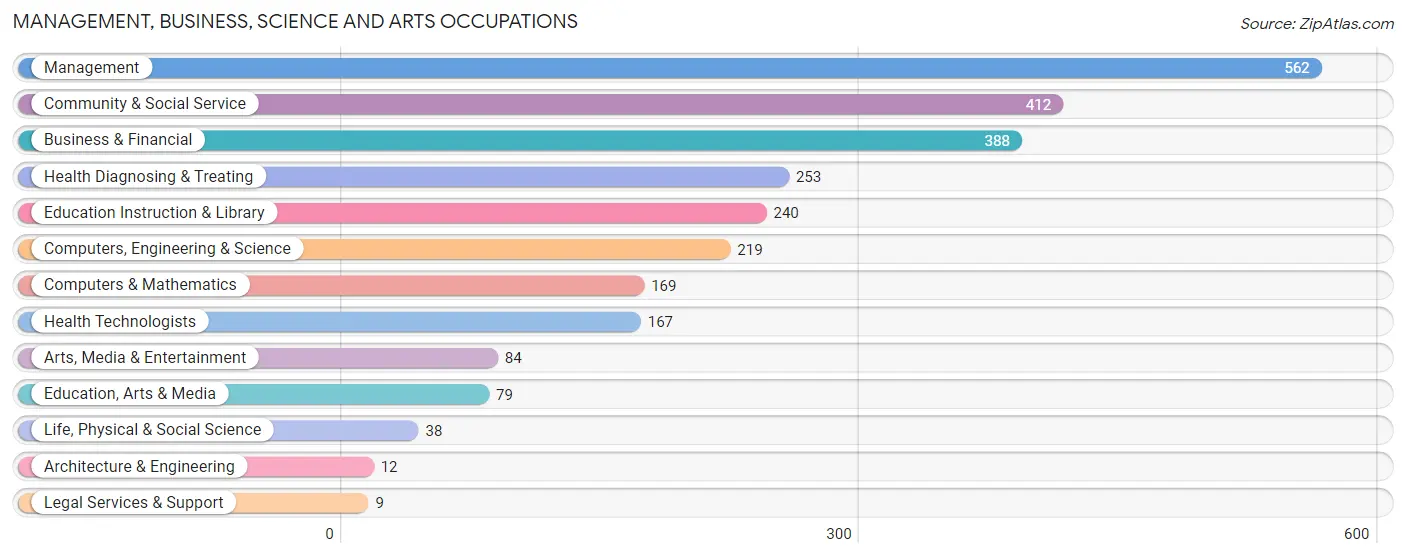
Management, Business, Science and Arts Occupations
The most common Management, Business, Science and Arts occupations in East Riverdale are Management (562 | 6.6%), Community & Social Service (412 | 4.8%), Business & Financial (388 | 4.5%), Health Diagnosing & Treating (253 | 3.0%), and Education Instruction & Library (240 | 2.8%).
Management, Business, Science and Arts Occupations by Sex
Within the Management, Business, Science and Arts occupations in East Riverdale, the most male-oriented occupations are Legal Services & Support (100.0%), Computers & Mathematics (91.7%), and Computers, Engineering & Science (74.4%), while the most female-oriented occupations are Life, Physical & Social Science (100.0%), Education Instruction & Library (96.3%), and Health Technologists (86.8%).
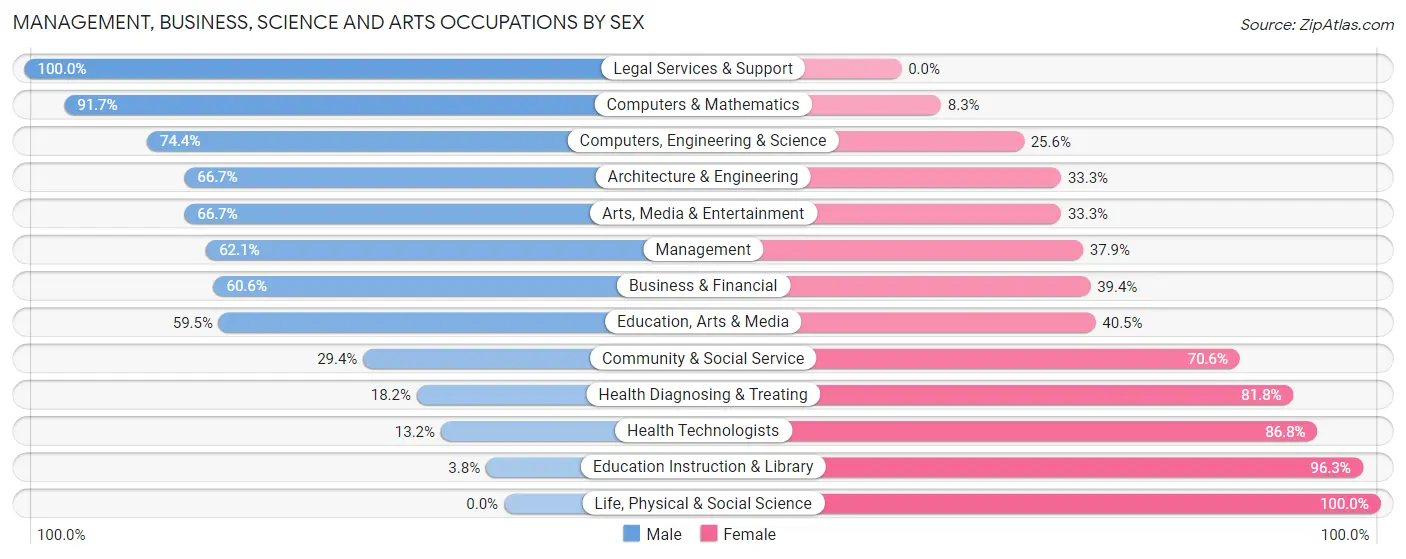
| Occupation | Male | Female |
| Management | 349 (62.1%) | 213 (37.9%) |
| Business & Financial | 235 (60.6%) | 153 (39.4%) |
| Computers, Engineering & Science | 163 (74.4%) | 56 (25.6%) |
| Computers & Mathematics | 155 (91.7%) | 14 (8.3%) |
| Architecture & Engineering | 8 (66.7%) | 4 (33.3%) |
| Life, Physical & Social Science | 0 (0.0%) | 38 (100.0%) |
| Community & Social Service | 121 (29.4%) | 291 (70.6%) |
| Education, Arts & Media | 47 (59.5%) | 32 (40.5%) |
| Legal Services & Support | 9 (100.0%) | 0 (0.0%) |
| Education Instruction & Library | 9 (3.7%) | 231 (96.3%) |
| Arts, Media & Entertainment | 56 (66.7%) | 28 (33.3%) |
| Health Diagnosing & Treating | 46 (18.2%) | 207 (81.8%) |
| Health Technologists | 22 (13.2%) | 145 (86.8%) |
| Total (Category) | 914 (49.8%) | 920 (50.2%) |
| Total (Overall) | 5,398 (63.1%) | 3,150 (36.8%) |
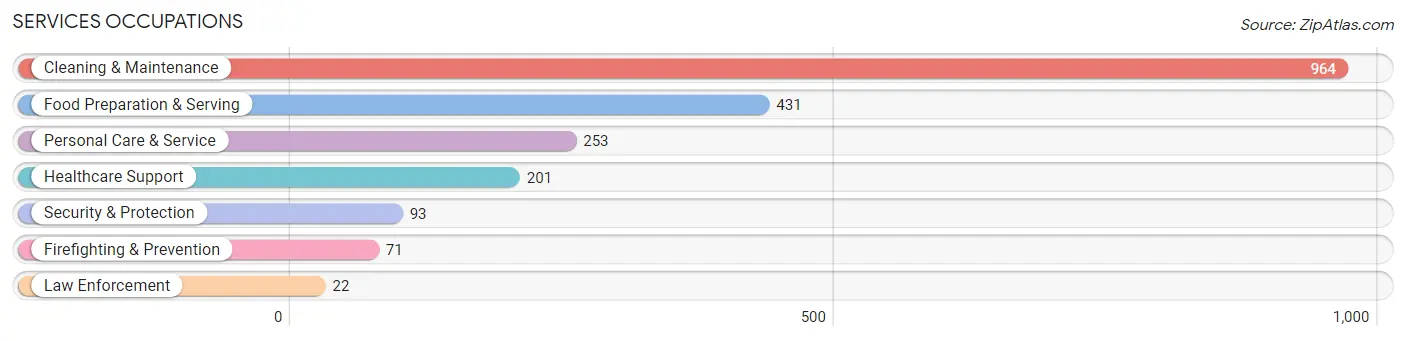
Services Occupations
The most common Services occupations in East Riverdale are Cleaning & Maintenance (964 | 11.3%), Food Preparation & Serving (431 | 5.0%), Personal Care & Service (253 | 3.0%), Healthcare Support (201 | 2.4%), and Security & Protection (93 | 1.1%).
Services Occupations by Sex
Within the Services occupations in East Riverdale, the most male-oriented occupations are Law Enforcement (100.0%), Security & Protection (85.0%), and Firefighting & Prevention (80.3%), while the most female-oriented occupations are Healthcare Support (73.1%), Personal Care & Service (72.7%), and Cleaning & Maintenance (52.3%).
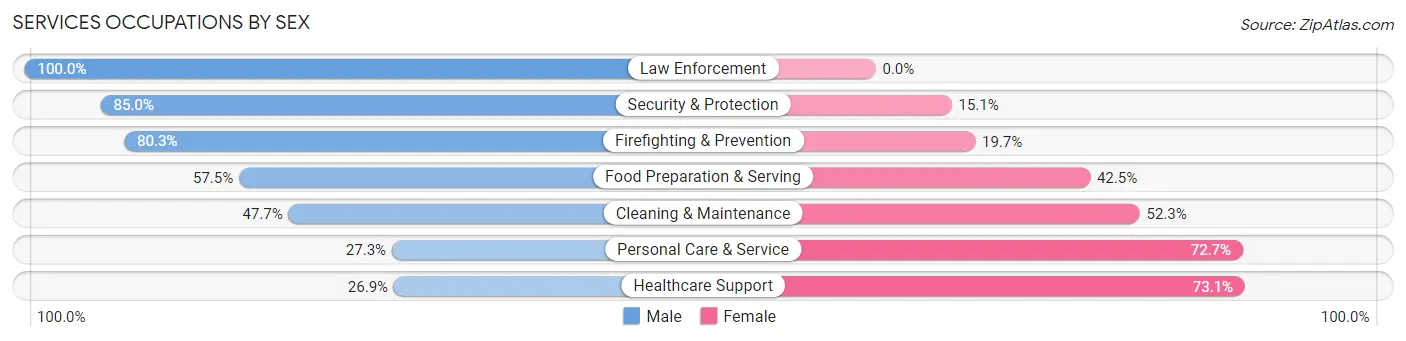
| Occupation | Male | Female |
| Healthcare Support | 54 (26.9%) | 147 (73.1%) |
| Security & Protection | 79 (85.0%) | 14 (15.0%) |
| Firefighting & Prevention | 57 (80.3%) | 14 (19.7%) |
| Law Enforcement | 22 (100.0%) | 0 (0.0%) |
| Food Preparation & Serving | 248 (57.5%) | 183 (42.5%) |
| Cleaning & Maintenance | 460 (47.7%) | 504 (52.3%) |
| Personal Care & Service | 69 (27.3%) | 184 (72.7%) |
| Total (Category) | 910 (46.9%) | 1,032 (53.1%) |
| Total (Overall) | 5,398 (63.1%) | 3,150 (36.8%) |
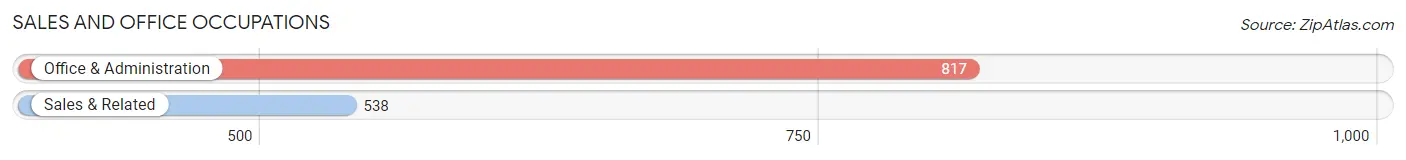
Sales and Office Occupations
The most common Sales and Office occupations in East Riverdale are Office & Administration (817 | 9.6%), and Sales & Related (538 | 6.3%).
Sales and Office Occupations by Sex
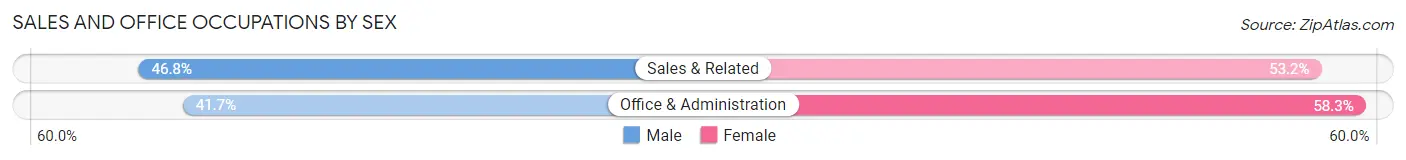
| Occupation | Male | Female |
| Sales & Related | 252 (46.8%) | 286 (53.2%) |
| Office & Administration | 341 (41.7%) | 476 (58.3%) |
| Total (Category) | 593 (43.8%) | 762 (56.2%) |
| Total (Overall) | 5,398 (63.1%) | 3,150 (36.8%) |
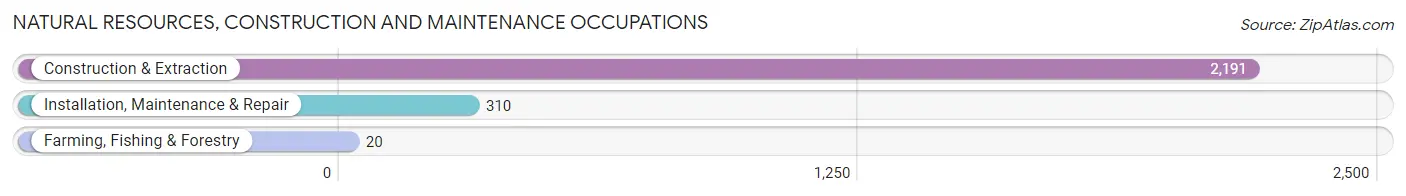
Natural Resources, Construction and Maintenance Occupations
The most common Natural Resources, Construction and Maintenance occupations in East Riverdale are Construction & Extraction (2,191 | 25.6%), Installation, Maintenance & Repair (310 | 3.6%), and Farming, Fishing & Forestry (20 | 0.2%).
Natural Resources, Construction and Maintenance Occupations by Sex
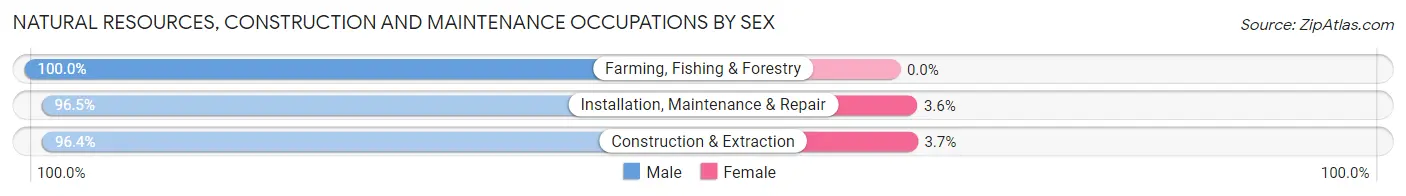
| Occupation | Male | Female |
| Farming, Fishing & Forestry | 20 (100.0%) | 0 (0.0%) |
| Construction & Extraction | 2,111 (96.4%) | 80 (3.6%) |
| Installation, Maintenance & Repair | 299 (96.5%) | 11 (3.5%) |
| Total (Category) | 2,430 (96.4%) | 91 (3.6%) |
| Total (Overall) | 5,398 (63.1%) | 3,150 (36.8%) |
Production, Transportation and Moving Occupations
The most common Production, Transportation and Moving occupations in East Riverdale are Production (336 | 3.9%), Material Moving (299 | 3.5%), and Transportation (261 | 3.0%).
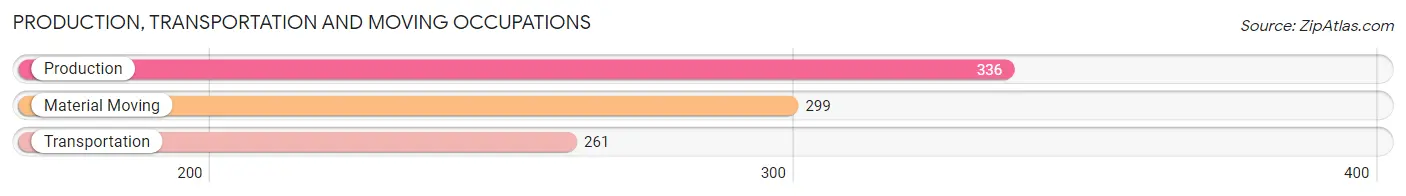
Production, Transportation and Moving Occupations by Sex
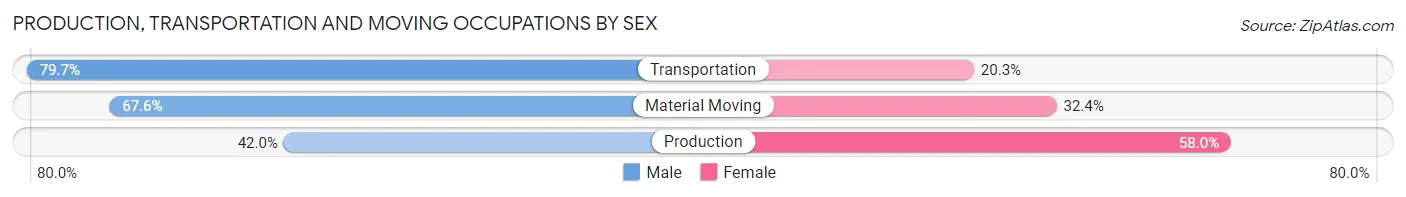
| Occupation | Male | Female |
| Production | 141 (42.0%) | 195 (58.0%) |
| Transportation | 208 (79.7%) | 53 (20.3%) |
| Material Moving | 202 (67.6%) | 97 (32.4%) |
| Total (Category) | 551 (61.5%) | 345 (38.5%) |
| Total (Overall) | 5,398 (63.1%) | 3,150 (36.8%) |
Employment Industries by Sex in East Riverdale
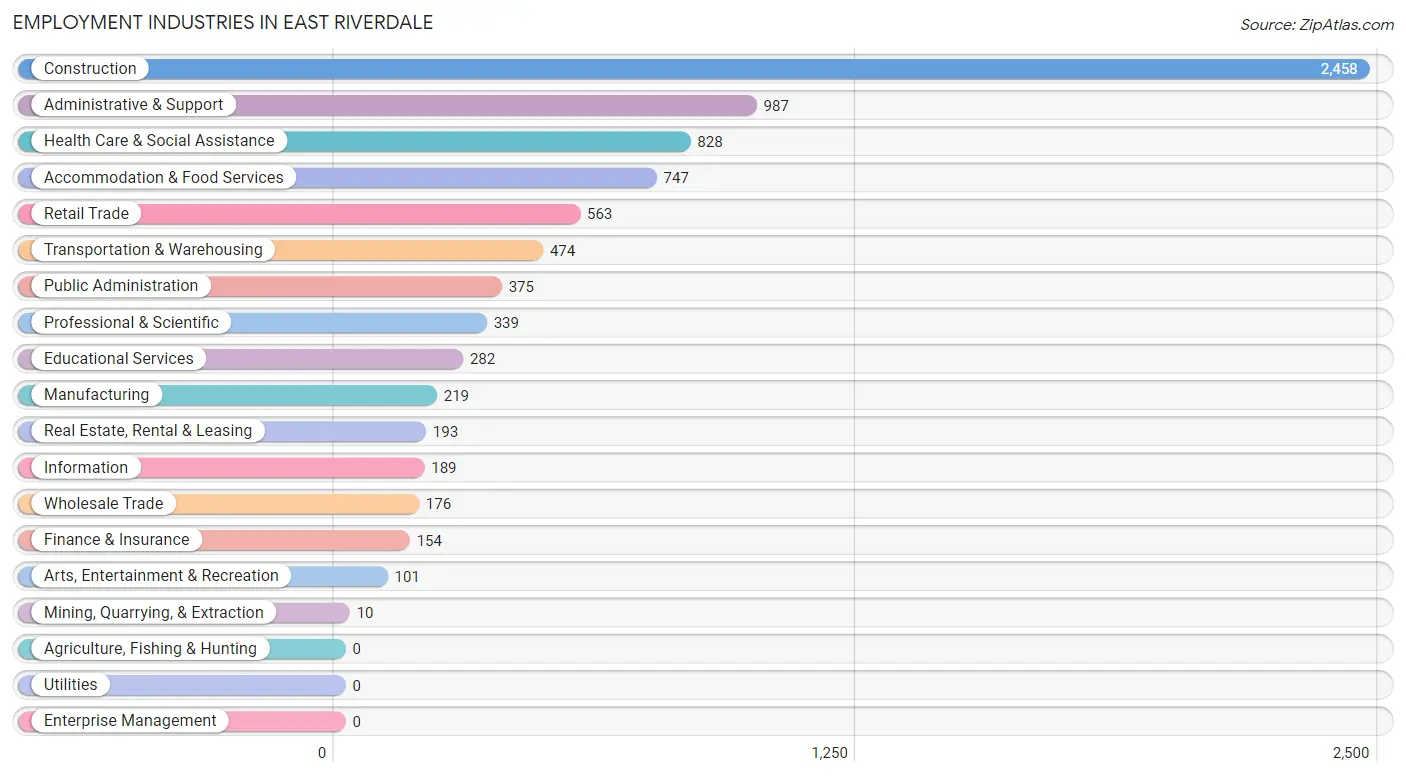
Employment Industries in East Riverdale
The major employment industries in East Riverdale include Construction (2,458 | 28.8%), Administrative & Support (987 | 11.6%), Health Care & Social Assistance (828 | 9.7%), Accommodation & Food Services (747 | 8.7%), and Retail Trade (563 | 6.6%).
Employment Industries by Sex in East Riverdale
The East Riverdale industries that see more men than women are Mining, Quarrying, & Extraction (100.0%), Construction (95.3%), and Transportation & Warehousing (93.0%), whereas the industries that tend to have a higher number of women are Educational Services (78.4%), Health Care & Social Assistance (75.8%), and Manufacturing (61.6%).
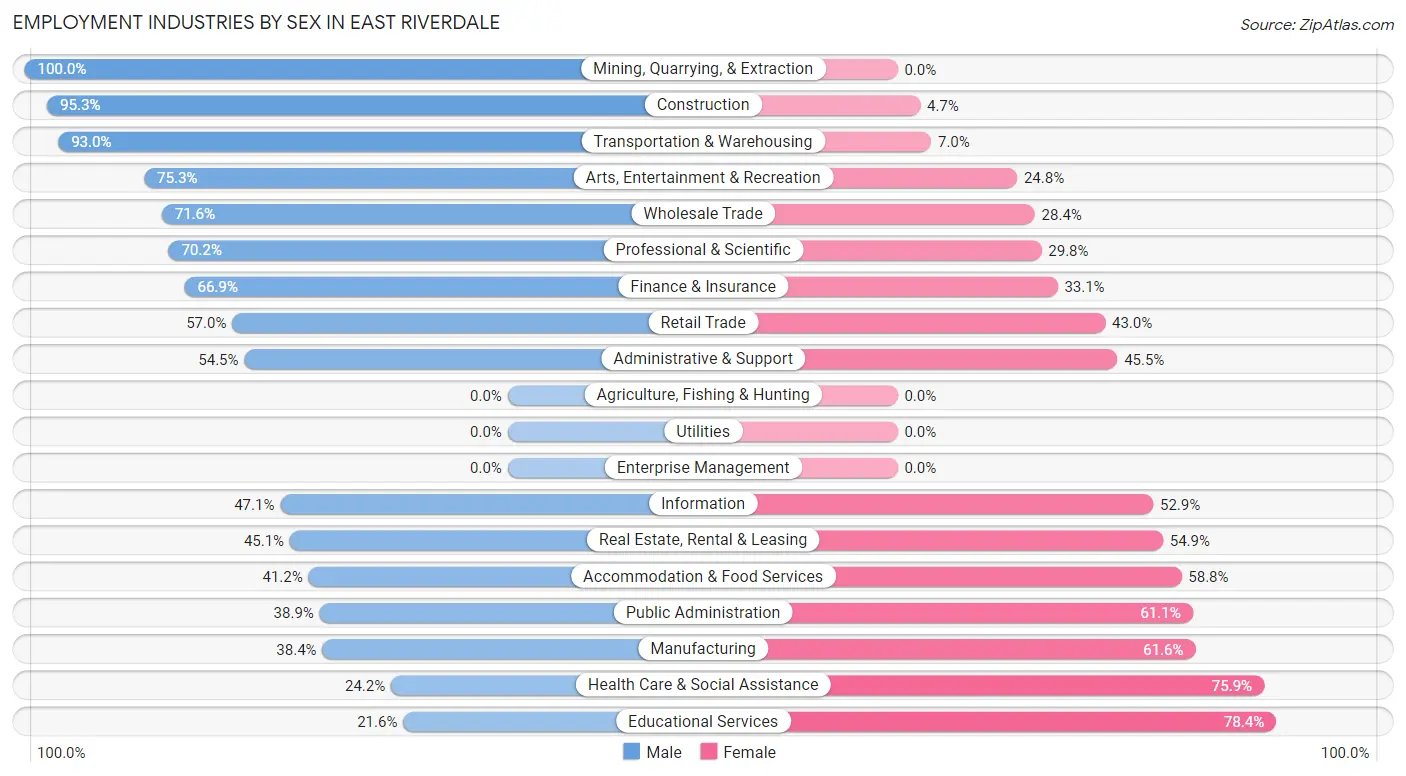
| Industry | Male | Female |
| Agriculture, Fishing & Hunting | 0 (0.0%) | 0 (0.0%) |
| Mining, Quarrying, & Extraction | 10 (100.0%) | 0 (0.0%) |
| Construction | 2,343 (95.3%) | 115 (4.7%) |
| Manufacturing | 84 (38.4%) | 135 (61.6%) |
| Wholesale Trade | 126 (71.6%) | 50 (28.4%) |
| Retail Trade | 321 (57.0%) | 242 (43.0%) |
| Transportation & Warehousing | 441 (93.0%) | 33 (7.0%) |
| Utilities | 0 (0.0%) | 0 (0.0%) |
| Information | 89 (47.1%) | 100 (52.9%) |
| Finance & Insurance | 103 (66.9%) | 51 (33.1%) |
| Real Estate, Rental & Leasing | 87 (45.1%) | 106 (54.9%) |
| Professional & Scientific | 238 (70.2%) | 101 (29.8%) |
| Enterprise Management | 0 (0.0%) | 0 (0.0%) |
| Administrative & Support | 538 (54.5%) | 449 (45.5%) |
| Educational Services | 61 (21.6%) | 221 (78.4%) |
| Health Care & Social Assistance | 200 (24.1%) | 628 (75.8%) |
| Arts, Entertainment & Recreation | 76 (75.2%) | 25 (24.7%) |
| Accommodation & Food Services | 308 (41.2%) | 439 (58.8%) |
| Public Administration | 146 (38.9%) | 229 (61.1%) |
| Total | 5,398 (63.1%) | 3,150 (36.8%) |
Education in East Riverdale
School Enrollment in East Riverdale
The most common levels of schooling among the 5,133 students in East Riverdale are high school (1,402 | 27.3%), elementary school (1,306 | 25.4%), and middle school (1,096 | 21.3%).
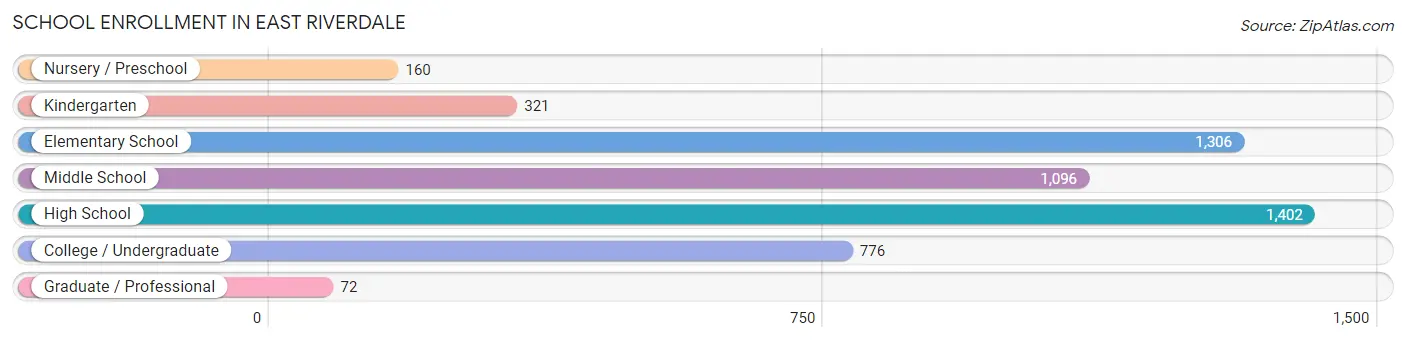
| School Level | # Students | % Students |
| Nursery / Preschool | 160 | 3.1% |
| Kindergarten | 321 | 6.2% |
| Elementary School | 1,306 | 25.4% |
| Middle School | 1,096 | 21.3% |
| High School | 1,402 | 27.3% |
| College / Undergraduate | 776 | 15.1% |
| Graduate / Professional | 72 | 1.4% |
| Total | 5,133 | 100.0% |
School Enrollment by Age by Funding Source in East Riverdale
Out of a total of 5,133 students who are enrolled in schools in East Riverdale, 323 (6.3%) attend a private institution, while the remaining 4,810 (93.7%) are enrolled in public schools. The age group of 35 years and over has the highest likelihood of being enrolled in private schools, with 158 (57.0% in the age bracket) enrolled. Conversely, the age group of 18 to 19 year olds has the lowest likelihood of being enrolled in a private school, with 481 (99.0% in the age bracket) attending a public institution.
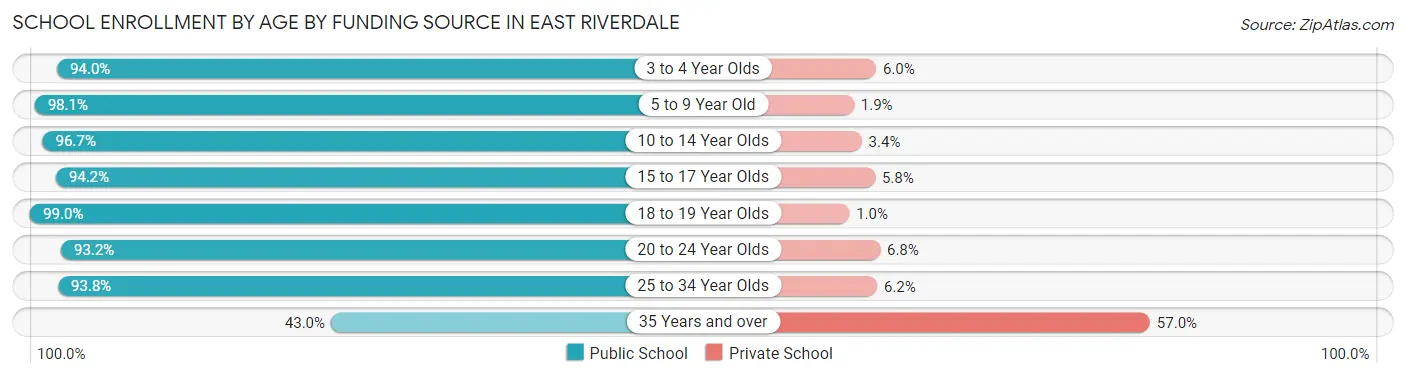
| Age Bracket | Public School | Private School |
| 3 to 4 Year Olds | 109 (94.0%) | 7 (6.0%) |
| 5 to 9 Year Old | 1,609 (98.1%) | 31 (1.9%) |
| 10 to 14 Year Olds | 1,300 (96.7%) | 45 (3.4%) |
| 15 to 17 Year Olds | 808 (94.2%) | 50 (5.8%) |
| 18 to 19 Year Olds | 481 (99.0%) | 5 (1.0%) |
| 20 to 24 Year Olds | 248 (93.2%) | 18 (6.8%) |
| 25 to 34 Year Olds | 136 (93.8%) | 9 (6.2%) |
| 35 Years and over | 119 (43.0%) | 158 (57.0%) |
| Total | 4,810 (93.7%) | 323 (6.3%) |
Educational Attainment by Field of Study in East Riverdale
Business (532 | 28.4%), science & technology (229 | 12.2%), education (229 | 12.2%), computers & mathematics (191 | 10.2%), and liberal arts & history (127 | 6.8%) are the most common fields of study among 1,873 individuals in East Riverdale who have obtained a bachelor's degree or higher.
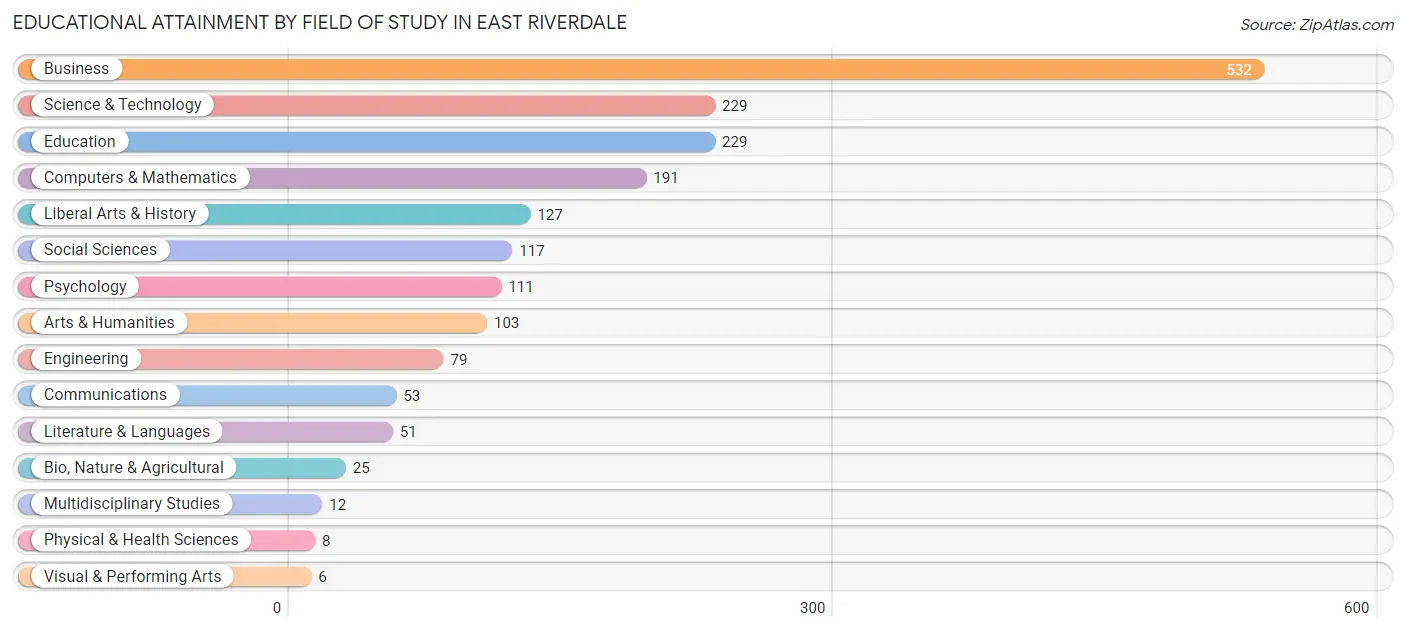
| Field of Study | # Graduates | % Graduates |
| Computers & Mathematics | 191 | 10.2% |
| Bio, Nature & Agricultural | 25 | 1.3% |
| Physical & Health Sciences | 8 | 0.4% |
| Psychology | 111 | 5.9% |
| Social Sciences | 117 | 6.2% |
| Engineering | 79 | 4.2% |
| Multidisciplinary Studies | 12 | 0.6% |
| Science & Technology | 229 | 12.2% |
| Business | 532 | 28.4% |
| Education | 229 | 12.2% |
| Literature & Languages | 51 | 2.7% |
| Liberal Arts & History | 127 | 6.8% |
| Visual & Performing Arts | 6 | 0.3% |
| Communications | 53 | 2.8% |
| Arts & Humanities | 103 | 5.5% |
| Total | 1,873 | 100.0% |
Transportation & Commute in East Riverdale
Vehicle Availability by Sex in East Riverdale
The most prevalent vehicle ownership categories in East Riverdale are males with 2 vehicles (1,960, accounting for 37.1%) and females with 2 vehicles (1,159, making up 62.6%).
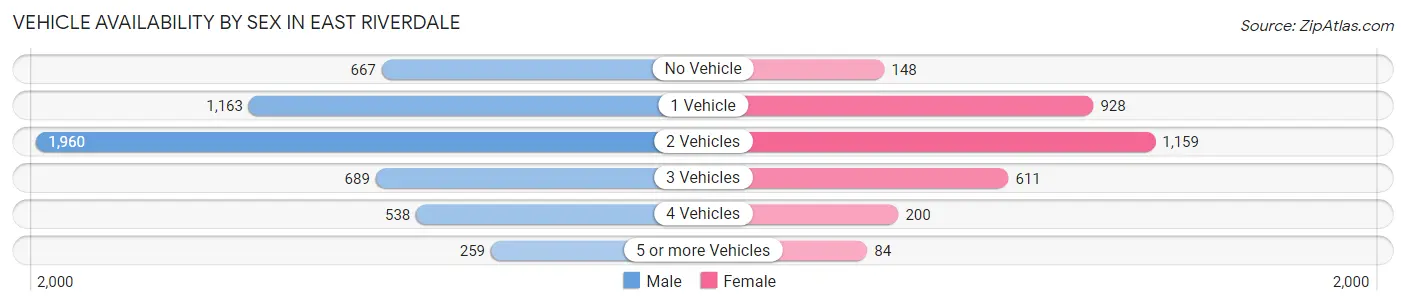
| Vehicles Available | Male | Female |
| No Vehicle | 667 (12.6%) | 148 (4.7%) |
| 1 Vehicle | 1,163 (22.0%) | 928 (29.6%) |
| 2 Vehicles | 1,960 (37.1%) | 1,159 (37.0%) |
| 3 Vehicles | 689 (13.1%) | 611 (19.5%) |
| 4 Vehicles | 538 (10.2%) | 200 (6.4%) |
| 5 or more Vehicles | 259 (4.9%) | 84 (2.7%) |
| Total | 5,276 (100.0%) | 3,130 (100.0%) |
Commute Time in East Riverdale
The most frequently occuring commute durations in East Riverdale are 30 to 34 minutes (1,537 commuters, 19.3%), 20 to 24 minutes (1,368 commuters, 17.2%), and 60 to 89 minutes (1,115 commuters, 14.0%).
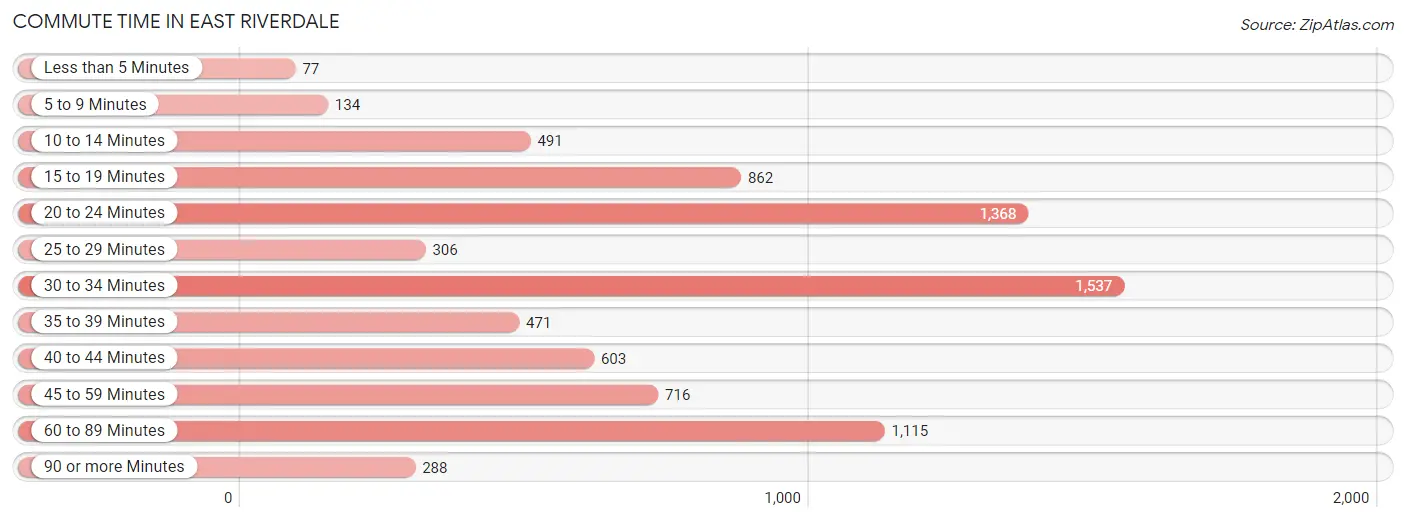
| Commute Time | # Commuters | % Commuters |
| Less than 5 Minutes | 77 | 1.0% |
| 5 to 9 Minutes | 134 | 1.7% |
| 10 to 14 Minutes | 491 | 6.2% |
| 15 to 19 Minutes | 862 | 10.8% |
| 20 to 24 Minutes | 1,368 | 17.2% |
| 25 to 29 Minutes | 306 | 3.8% |
| 30 to 34 Minutes | 1,537 | 19.3% |
| 35 to 39 Minutes | 471 | 5.9% |
| 40 to 44 Minutes | 603 | 7.6% |
| 45 to 59 Minutes | 716 | 9.0% |
| 60 to 89 Minutes | 1,115 | 14.0% |
| 90 or more Minutes | 288 | 3.6% |
Commute Time by Sex in East Riverdale
The most common commute times in East Riverdale are 30 to 34 minutes (1,042 commuters, 20.4%) for males and 20 to 24 minutes (662 commuters, 23.1%) for females.
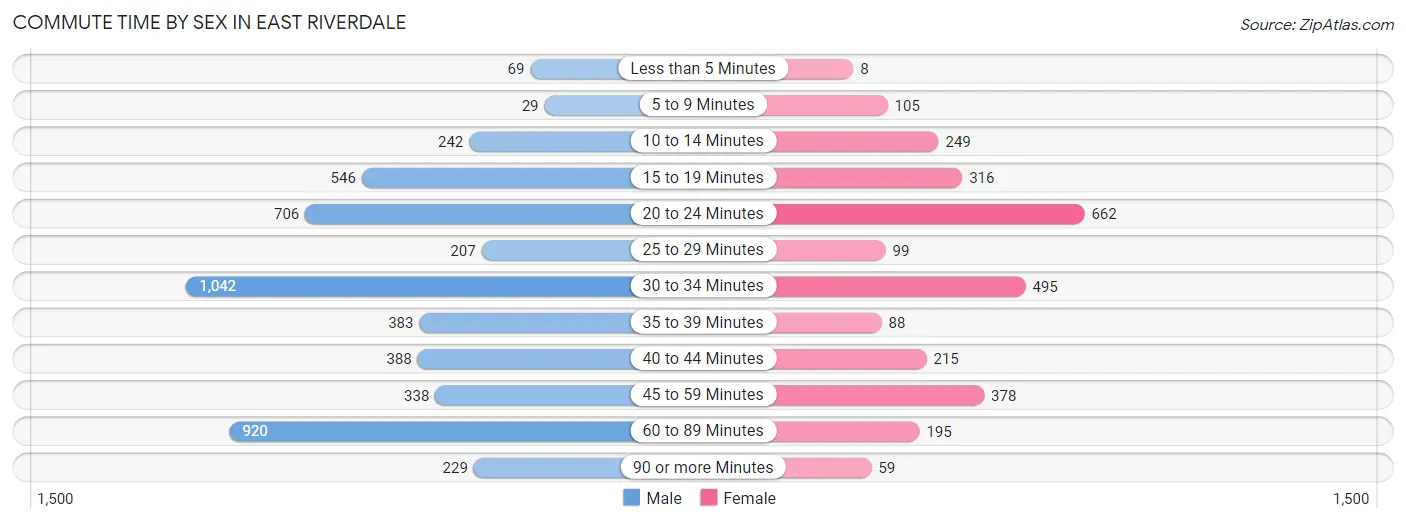
| Commute Time | Male | Female |
| Less than 5 Minutes | 69 (1.3%) | 8 (0.3%) |
| 5 to 9 Minutes | 29 (0.6%) | 105 (3.7%) |
| 10 to 14 Minutes | 242 (4.8%) | 249 (8.7%) |
| 15 to 19 Minutes | 546 (10.7%) | 316 (11.0%) |
| 20 to 24 Minutes | 706 (13.9%) | 662 (23.1%) |
| 25 to 29 Minutes | 207 (4.1%) | 99 (3.5%) |
| 30 to 34 Minutes | 1,042 (20.4%) | 495 (17.2%) |
| 35 to 39 Minutes | 383 (7.5%) | 88 (3.1%) |
| 40 to 44 Minutes | 388 (7.6%) | 215 (7.5%) |
| 45 to 59 Minutes | 338 (6.6%) | 378 (13.2%) |
| 60 to 89 Minutes | 920 (18.0%) | 195 (6.8%) |
| 90 or more Minutes | 229 (4.5%) | 59 (2.1%) |
Time of Departure to Work by Sex in East Riverdale
The most frequent times of departure to work in East Riverdale are 6:00 AM to 6:29 AM (1,202, 23.6%) for males and 7:00 AM to 7:29 AM (505, 17.6%) for females.
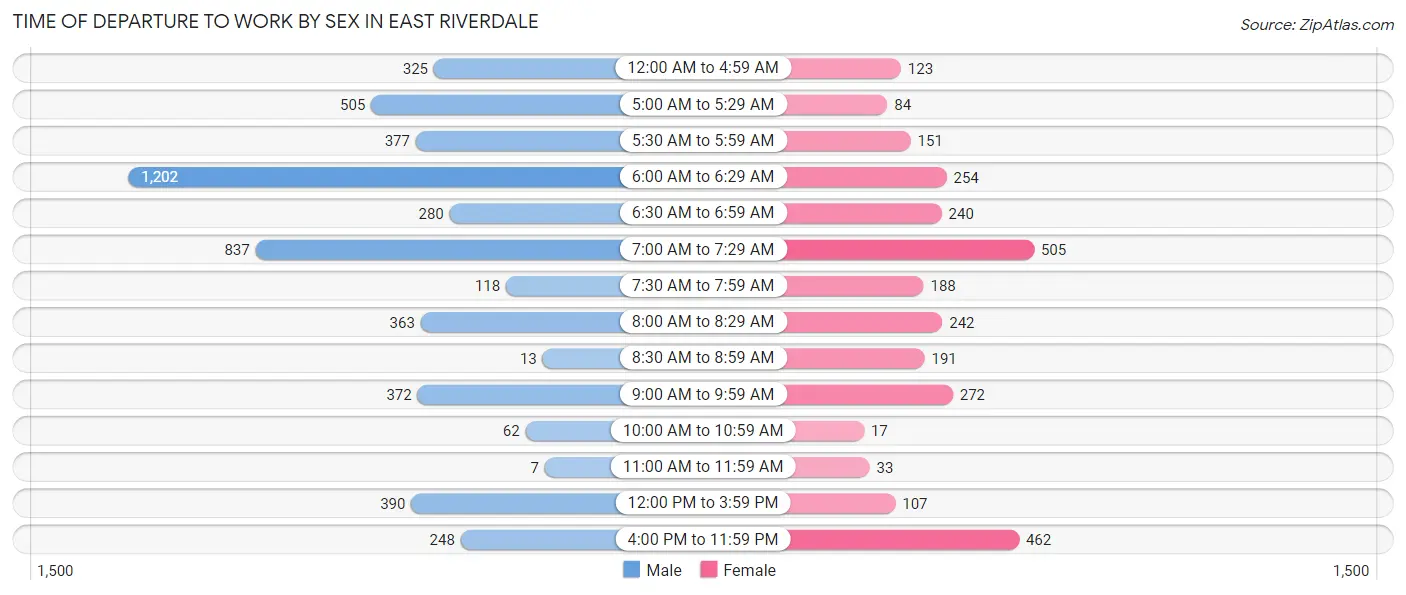
| Time of Departure | Male | Female |
| 12:00 AM to 4:59 AM | 325 (6.4%) | 123 (4.3%) |
| 5:00 AM to 5:29 AM | 505 (9.9%) | 84 (2.9%) |
| 5:30 AM to 5:59 AM | 377 (7.4%) | 151 (5.3%) |
| 6:00 AM to 6:29 AM | 1,202 (23.6%) | 254 (8.8%) |
| 6:30 AM to 6:59 AM | 280 (5.5%) | 240 (8.4%) |
| 7:00 AM to 7:29 AM | 837 (16.4%) | 505 (17.6%) |
| 7:30 AM to 7:59 AM | 118 (2.3%) | 188 (6.6%) |
| 8:00 AM to 8:29 AM | 363 (7.1%) | 242 (8.4%) |
| 8:30 AM to 8:59 AM | 13 (0.3%) | 191 (6.7%) |
| 9:00 AM to 9:59 AM | 372 (7.3%) | 272 (9.5%) |
| 10:00 AM to 10:59 AM | 62 (1.2%) | 17 (0.6%) |
| 11:00 AM to 11:59 AM | 7 (0.1%) | 33 (1.1%) |
| 12:00 PM to 3:59 PM | 390 (7.6%) | 107 (3.7%) |
| 4:00 PM to 11:59 PM | 248 (4.9%) | 462 (16.1%) |
| Total | 5,099 (100.0%) | 2,869 (100.0%) |
Housing Occupancy in East Riverdale
Occupancy by Ownership in East Riverdale
Of the total 4,641 dwellings in East Riverdale, owner-occupied units account for 2,479 (53.4%), while renter-occupied units make up 2,162 (46.6%).
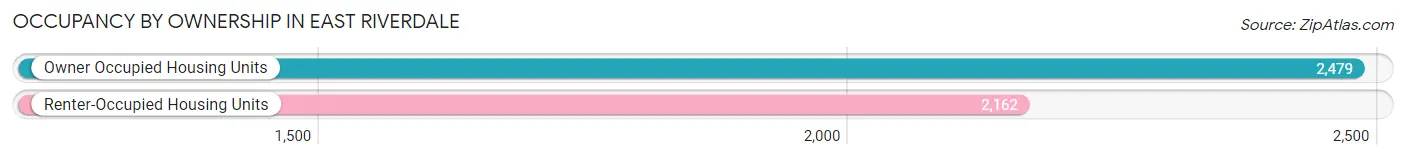
| Occupancy | # Housing Units | % Housing Units |
| Owner Occupied Housing Units | 2,479 | 53.4% |
| Renter-Occupied Housing Units | 2,162 | 46.6% |
| Total Occupied Housing Units | 4,641 | 100.0% |
Occupancy by Household Size in East Riverdale
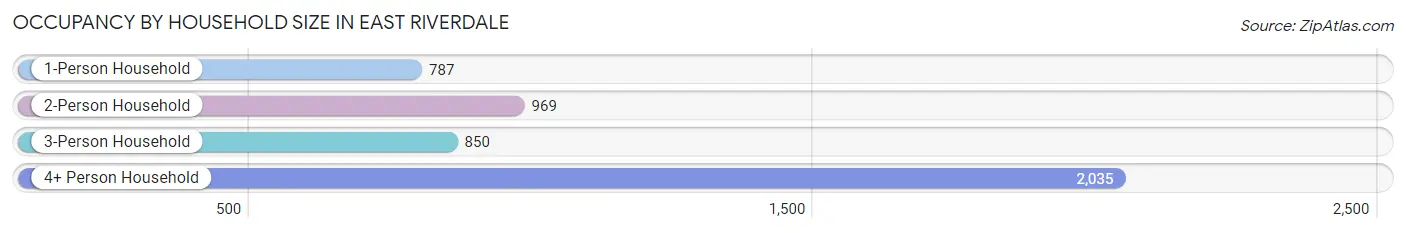
| Household Size | # Housing Units | % Housing Units |
| 1-Person Household | 787 | 17.0% |
| 2-Person Household | 969 | 20.9% |
| 3-Person Household | 850 | 18.3% |
| 4+ Person Household | 2,035 | 43.9% |
| Total Housing Units | 4,641 | 100.0% |
Occupancy by Ownership by Household Size in East Riverdale
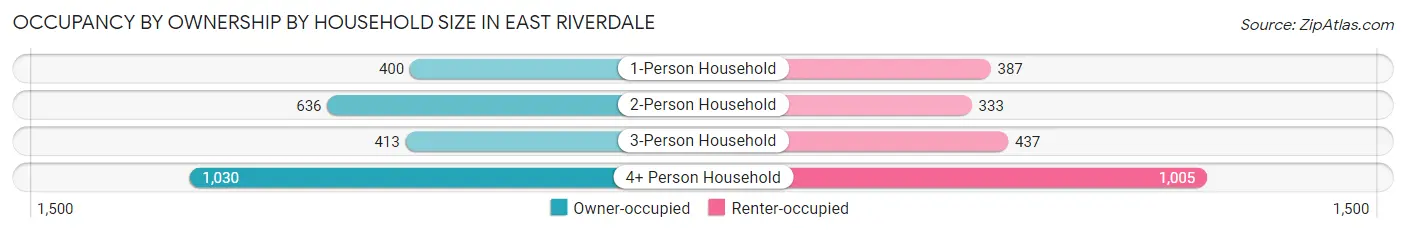
| Household Size | Owner-occupied | Renter-occupied |
| 1-Person Household | 400 (50.8%) | 387 (49.2%) |
| 2-Person Household | 636 (65.6%) | 333 (34.4%) |
| 3-Person Household | 413 (48.6%) | 437 (51.4%) |
| 4+ Person Household | 1,030 (50.6%) | 1,005 (49.4%) |
| Total Housing Units | 2,479 (53.4%) | 2,162 (46.6%) |
Occupancy by Educational Attainment in East Riverdale
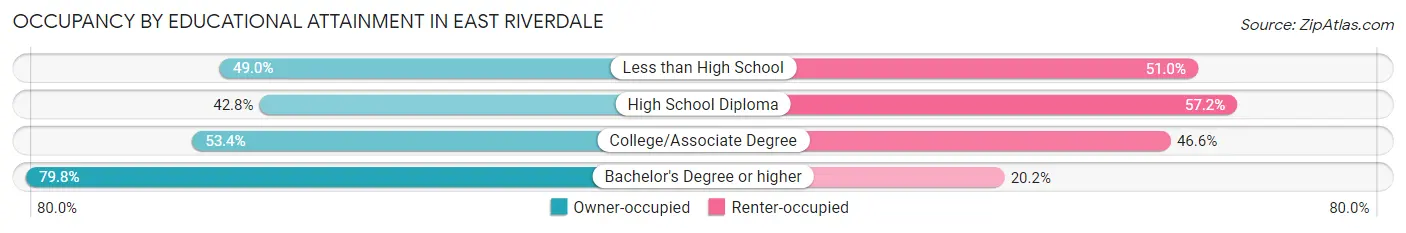
| Household Size | Owner-occupied | Renter-occupied |
| Less than High School | 753 (49.0%) | 784 (51.0%) |
| High School Diploma | 553 (42.8%) | 740 (57.2%) |
| College/Associate Degree | 550 (53.4%) | 480 (46.6%) |
| Bachelor's Degree or higher | 623 (79.8%) | 158 (20.2%) |
Occupancy by Age of Householder in East Riverdale
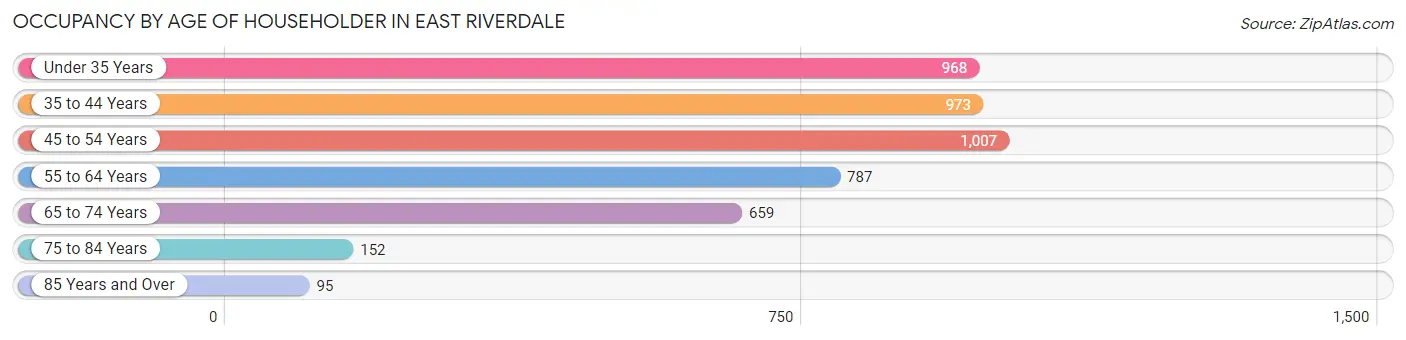
| Age Bracket | # Households | % Households |
| Under 35 Years | 968 | 20.9% |
| 35 to 44 Years | 973 | 21.0% |
| 45 to 54 Years | 1,007 | 21.7% |
| 55 to 64 Years | 787 | 17.0% |
| 65 to 74 Years | 659 | 14.2% |
| 75 to 84 Years | 152 | 3.3% |
| 85 Years and Over | 95 | 2.1% |
| Total | 4,641 | 100.0% |
Housing Finances in East Riverdale
Median Income by Occupancy in East Riverdale
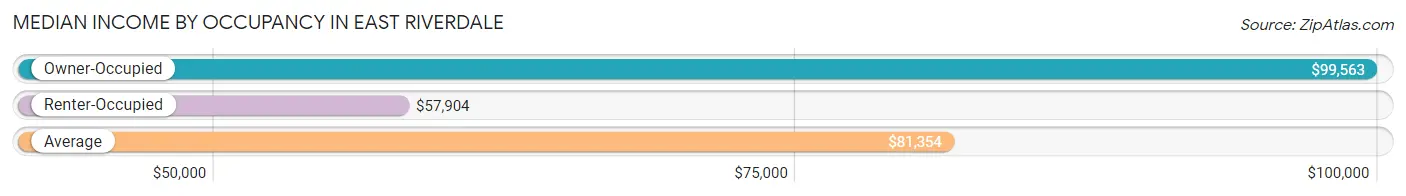
| Occupancy Type | # Households | Median Income |
| Owner-Occupied | 2,479 (53.4%) | $99,563 |
| Renter-Occupied | 2,162 (46.6%) | $57,904 |
| Average | 4,641 (100.0%) | $81,354 |
Occupancy by Householder Income Bracket in East Riverdale
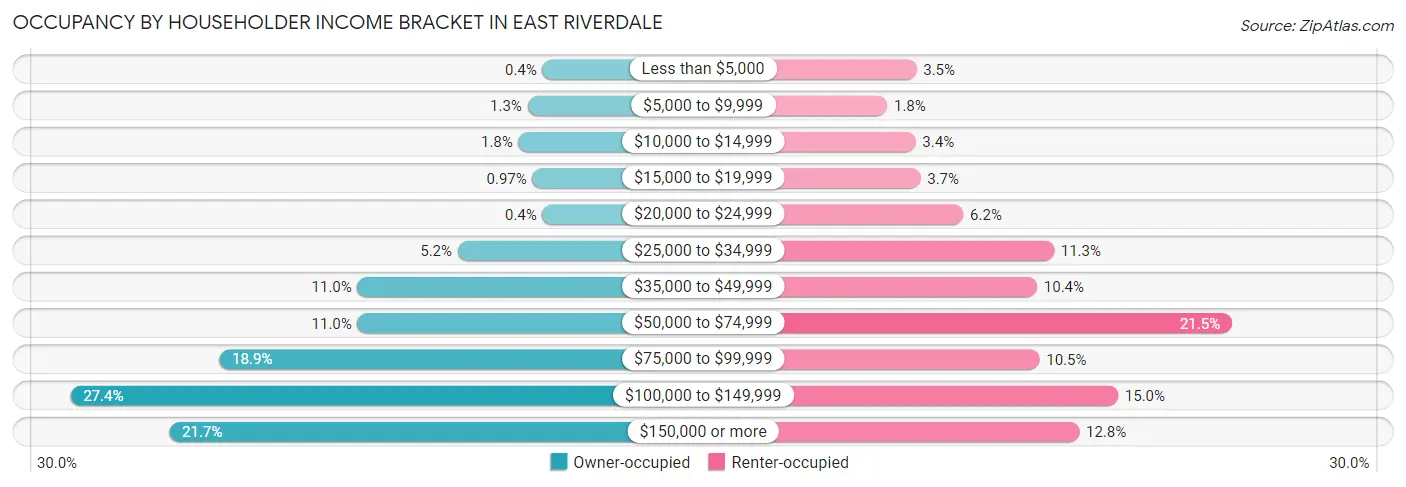
| Income Bracket | Owner-occupied | Renter-occupied |
| Less than $5,000 | 10 (0.4%) | 75 (3.5%) |
| $5,000 to $9,999 | 31 (1.3%) | 39 (1.8%) |
| $10,000 to $14,999 | 44 (1.8%) | 74 (3.4%) |
| $15,000 to $19,999 | 24 (1.0%) | 80 (3.7%) |
| $20,000 to $24,999 | 10 (0.4%) | 133 (6.1%) |
| $25,000 to $34,999 | 130 (5.2%) | 245 (11.3%) |
| $35,000 to $49,999 | 272 (11.0%) | 224 (10.4%) |
| $50,000 to $74,999 | 272 (11.0%) | 465 (21.5%) |
| $75,000 to $99,999 | 468 (18.9%) | 227 (10.5%) |
| $100,000 to $149,999 | 679 (27.4%) | 324 (15.0%) |
| $150,000 or more | 539 (21.7%) | 276 (12.8%) |
| Total | 2,479 (100.0%) | 2,162 (100.0%) |
Monthly Housing Cost Tiers in East Riverdale
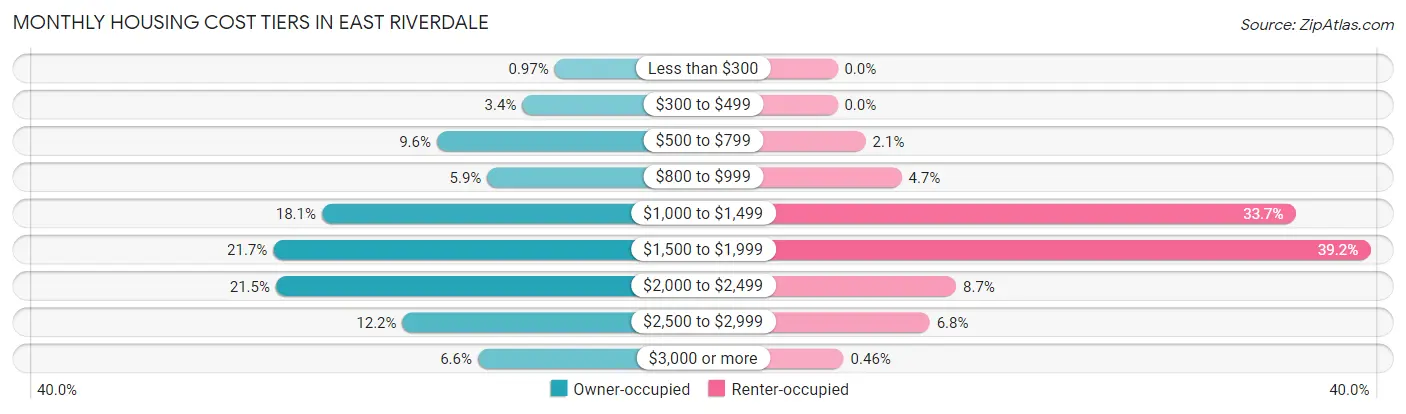
| Monthly Cost | Owner-occupied | Renter-occupied |
| Less than $300 | 24 (1.0%) | 0 (0.0%) |
| $300 to $499 | 83 (3.4%) | 0 (0.0%) |
| $500 to $799 | 239 (9.6%) | 45 (2.1%) |
| $800 to $999 | 147 (5.9%) | 102 (4.7%) |
| $1,000 to $1,499 | 449 (18.1%) | 729 (33.7%) |
| $1,500 to $1,999 | 538 (21.7%) | 848 (39.2%) |
| $2,000 to $2,499 | 533 (21.5%) | 189 (8.7%) |
| $2,500 to $2,999 | 302 (12.2%) | 147 (6.8%) |
| $3,000 or more | 164 (6.6%) | 10 (0.5%) |
| Total | 2,479 (100.0%) | 2,162 (100.0%) |
Physical Housing Characteristics in East Riverdale
Housing Structures in East Riverdale
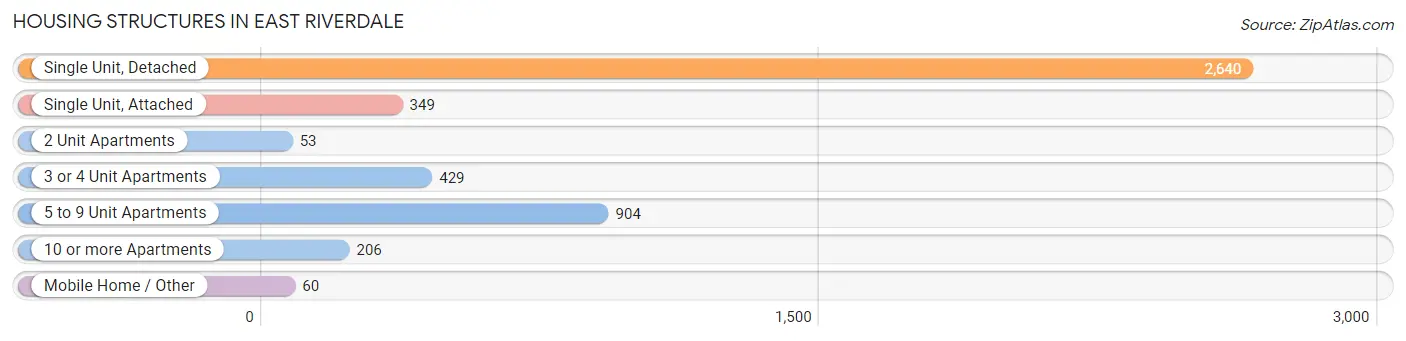
| Structure Type | # Housing Units | % Housing Units |
| Single Unit, Detached | 2,640 | 56.9% |
| Single Unit, Attached | 349 | 7.5% |
| 2 Unit Apartments | 53 | 1.1% |
| 3 or 4 Unit Apartments | 429 | 9.2% |
| 5 to 9 Unit Apartments | 904 | 19.5% |
| 10 or more Apartments | 206 | 4.4% |
| Mobile Home / Other | 60 | 1.3% |
| Total | 4,641 | 100.0% |
Housing Structures by Occupancy in East Riverdale
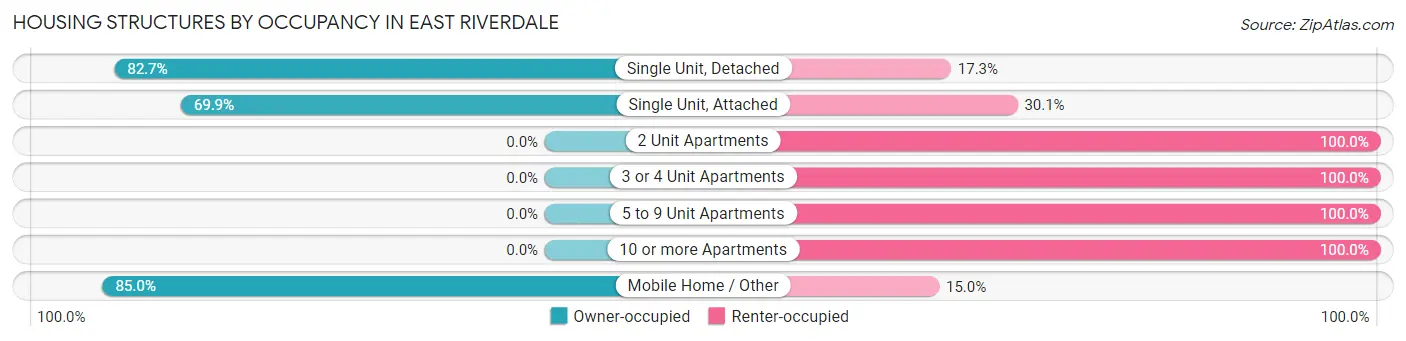
| Structure Type | Owner-occupied | Renter-occupied |
| Single Unit, Detached | 2,184 (82.7%) | 456 (17.3%) |
| Single Unit, Attached | 244 (69.9%) | 105 (30.1%) |
| 2 Unit Apartments | 0 (0.0%) | 53 (100.0%) |
| 3 or 4 Unit Apartments | 0 (0.0%) | 429 (100.0%) |
| 5 to 9 Unit Apartments | 0 (0.0%) | 904 (100.0%) |
| 10 or more Apartments | 0 (0.0%) | 206 (100.0%) |
| Mobile Home / Other | 51 (85.0%) | 9 (15.0%) |
| Total | 2,479 (53.4%) | 2,162 (46.6%) |
Housing Structures by Number of Rooms in East Riverdale
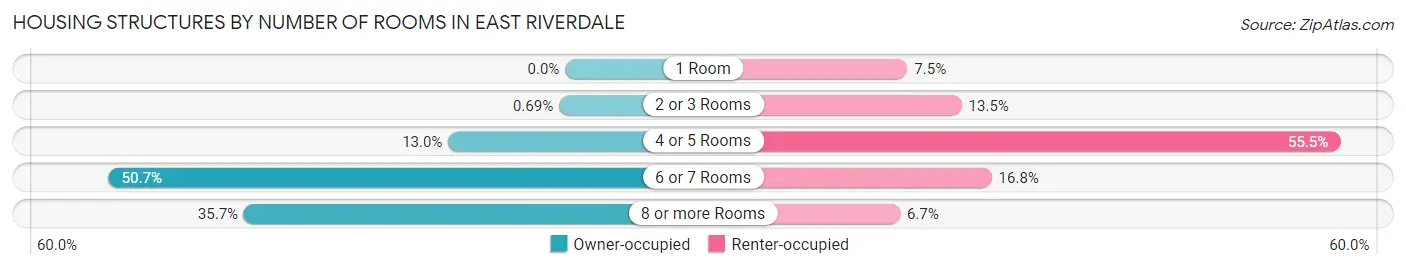
| Number of Rooms | Owner-occupied | Renter-occupied |
| 1 Room | 0 (0.0%) | 162 (7.5%) |
| 2 or 3 Rooms | 17 (0.7%) | 292 (13.5%) |
| 4 or 5 Rooms | 322 (13.0%) | 1,200 (55.5%) |
| 6 or 7 Rooms | 1,256 (50.7%) | 364 (16.8%) |
| 8 or more Rooms | 884 (35.7%) | 144 (6.7%) |
| Total | 2,479 (100.0%) | 2,162 (100.0%) |
Housing Structure by Heating Type in East Riverdale
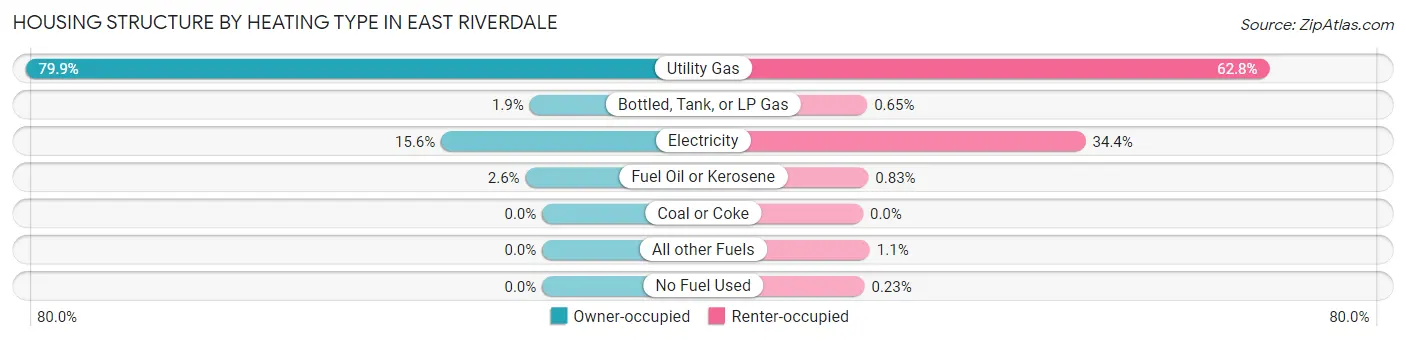
| Heating Type | Owner-occupied | Renter-occupied |
| Utility Gas | 1,980 (79.9%) | 1,358 (62.8%) |
| Bottled, Tank, or LP Gas | 48 (1.9%) | 14 (0.6%) |
| Electricity | 387 (15.6%) | 744 (34.4%) |
| Fuel Oil or Kerosene | 64 (2.6%) | 18 (0.8%) |
| Coal or Coke | 0 (0.0%) | 0 (0.0%) |
| All other Fuels | 0 (0.0%) | 23 (1.1%) |
| No Fuel Used | 0 (0.0%) | 5 (0.2%) |
| Total | 2,479 (100.0%) | 2,162 (100.0%) |
Household Vehicle Usage in East Riverdale
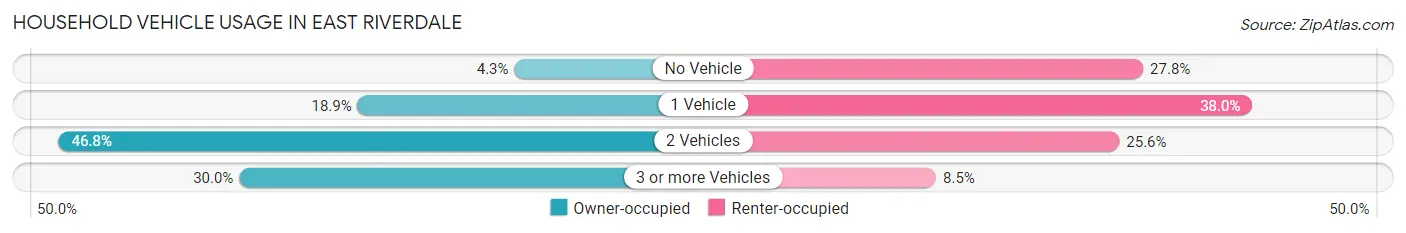
| Vehicles per Household | Owner-occupied | Renter-occupied |
| No Vehicle | 106 (4.3%) | 602 (27.8%) |
| 1 Vehicle | 469 (18.9%) | 822 (38.0%) |
| 2 Vehicles | 1,161 (46.8%) | 554 (25.6%) |
| 3 or more Vehicles | 743 (30.0%) | 184 (8.5%) |
| Total | 2,479 (100.0%) | 2,162 (100.0%) |
Real Estate & Mortgages in East Riverdale
Real Estate and Mortgage Overview in East Riverdale
| Characteristic | Without Mortgage | With Mortgage |
| Housing Units | 527 | 1,952 |
| Median Property Value | $318,500 | $328,900 |
| Median Household Income | $102,702 | $431 |
| Monthly Housing Costs | $760 | $164 |
| Real Estate Taxes | $4,246 | $38 |
Property Value by Mortgage Status in East Riverdale
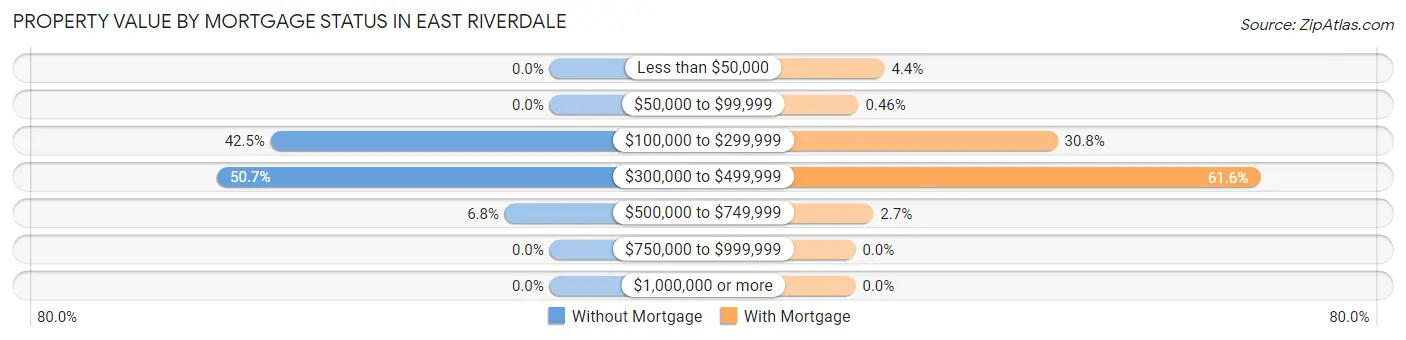
| Property Value | Without Mortgage | With Mortgage |
| Less than $50,000 | 0 (0.0%) | 86 (4.4%) |
| $50,000 to $99,999 | 0 (0.0%) | 9 (0.5%) |
| $100,000 to $299,999 | 224 (42.5%) | 601 (30.8%) |
| $300,000 to $499,999 | 267 (50.7%) | 1,203 (61.6%) |
| $500,000 to $749,999 | 36 (6.8%) | 53 (2.7%) |
| $750,000 to $999,999 | 0 (0.0%) | 0 (0.0%) |
| $1,000,000 or more | 0 (0.0%) | 0 (0.0%) |
| Total | 527 (100.0%) | 1,952 (100.0%) |
Household Income by Mortgage Status in East Riverdale
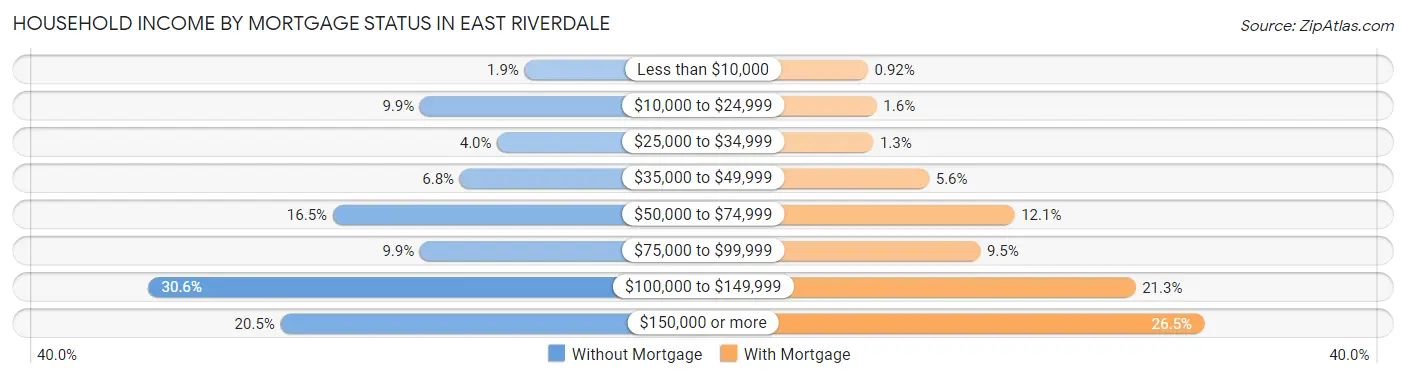
| Household Income | Without Mortgage | With Mortgage |
| Less than $10,000 | 10 (1.9%) | 18 (0.9%) |
| $10,000 to $24,999 | 52 (9.9%) | 31 (1.6%) |
| $25,000 to $34,999 | 21 (4.0%) | 26 (1.3%) |
| $35,000 to $49,999 | 36 (6.8%) | 109 (5.6%) |
| $50,000 to $74,999 | 87 (16.5%) | 236 (12.1%) |
| $75,000 to $99,999 | 52 (9.9%) | 185 (9.5%) |
| $100,000 to $149,999 | 161 (30.5%) | 416 (21.3%) |
| $150,000 or more | 108 (20.5%) | 518 (26.5%) |
| Total | 527 (100.0%) | 1,952 (100.0%) |
Property Value to Household Income Ratio in East Riverdale
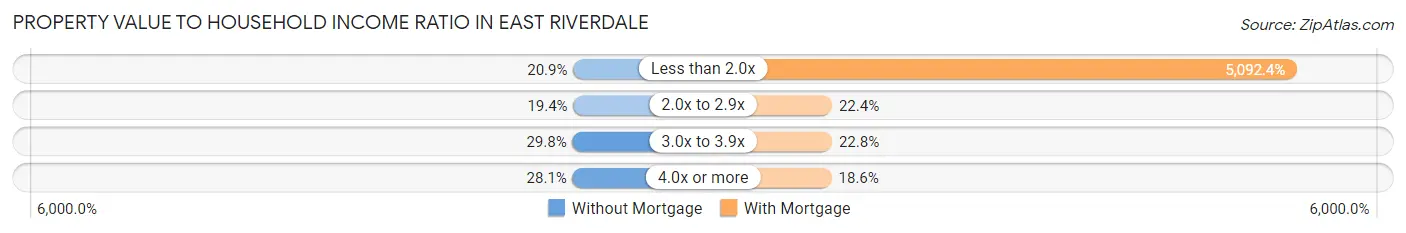
| Value-to-Income Ratio | Without Mortgage | With Mortgage |
| Less than 2.0x | 110 (20.9%) | 99,403 (5,092.4%) |
| 2.0x to 2.9x | 102 (19.4%) | 437 (22.4%) |
| 3.0x to 3.9x | 157 (29.8%) | 444 (22.8%) |
| 4.0x or more | 148 (28.1%) | 363 (18.6%) |
| Total | 527 (100.0%) | 1,952 (100.0%) |
Real Estate Taxes by Mortgage Status in East Riverdale
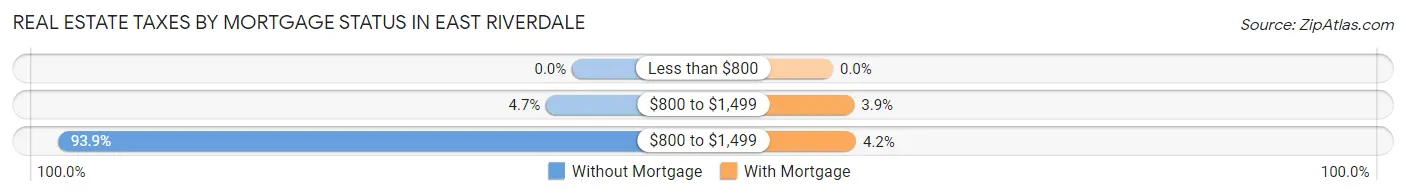
| Property Taxes | Without Mortgage | With Mortgage |
| Less than $800 | 0 (0.0%) | 0 (0.0%) |
| $800 to $1,499 | 25 (4.7%) | 76 (3.9%) |
| $800 to $1,499 | 495 (93.9%) | 82 (4.2%) |
| Total | 527 (100.0%) | 1,952 (100.0%) |
Health & Disability in East Riverdale
Health Insurance Coverage by Age in East Riverdale
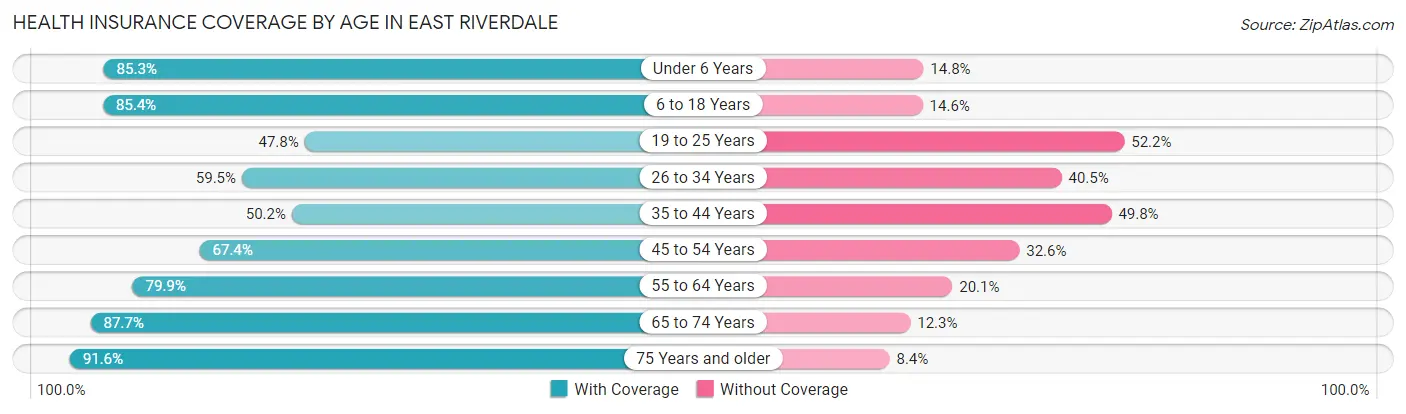
| Age Bracket | With Coverage | Without Coverage |
| Under 6 Years | 1,682 (85.3%) | 291 (14.7%) |
| 6 to 18 Years | 3,412 (85.4%) | 584 (14.6%) |
| 19 to 25 Years | 909 (47.8%) | 993 (52.2%) |
| 26 to 34 Years | 1,502 (59.5%) | 1,023 (40.5%) |
| 35 to 44 Years | 1,289 (50.2%) | 1,280 (49.8%) |
| 45 to 54 Years | 1,567 (67.4%) | 759 (32.6%) |
| 55 to 64 Years | 1,134 (79.9%) | 286 (20.1%) |
| 65 to 74 Years | 826 (87.7%) | 116 (12.3%) |
| 75 Years and older | 369 (91.6%) | 34 (8.4%) |
| Total | 12,690 (70.3%) | 5,366 (29.7%) |
Health Insurance Coverage by Citizenship Status in East Riverdale
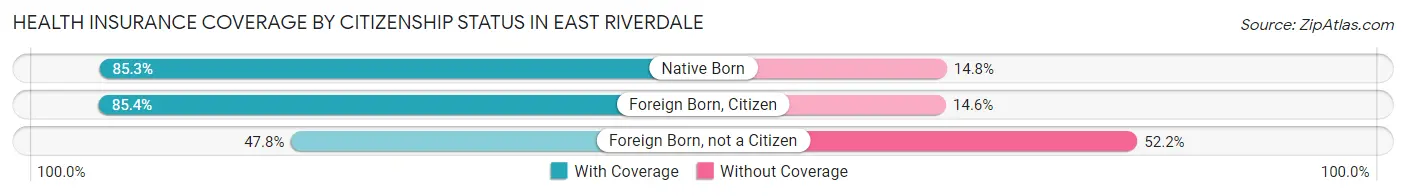
| Citizenship Status | With Coverage | Without Coverage |
| Native Born | 1,682 (85.3%) | 291 (14.7%) |
| Foreign Born, Citizen | 3,412 (85.4%) | 584 (14.6%) |
| Foreign Born, not a Citizen | 909 (47.8%) | 993 (52.2%) |
Health Insurance Coverage by Household Income in East Riverdale
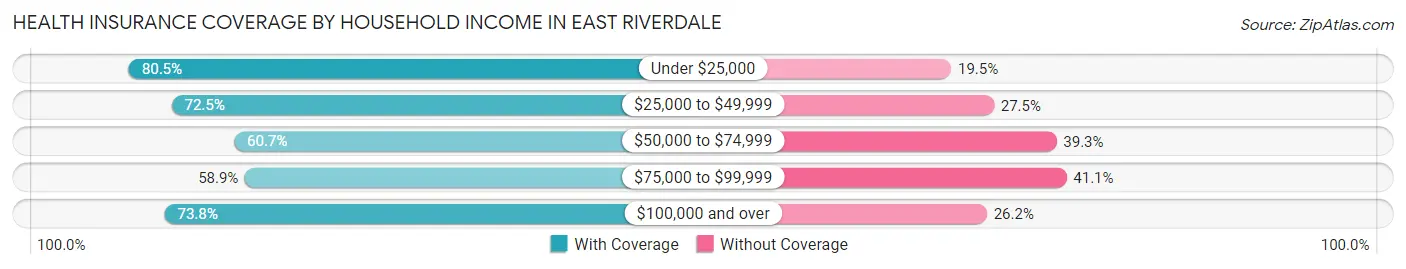
| Household Income | With Coverage | Without Coverage |
| Under $25,000 | 1,388 (80.5%) | 337 (19.5%) |
| $25,000 to $49,999 | 1,871 (72.5%) | 711 (27.5%) |
| $50,000 to $74,999 | 1,470 (60.7%) | 950 (39.3%) |
| $75,000 to $99,999 | 1,568 (58.9%) | 1,096 (41.1%) |
| $100,000 and over | 6,389 (73.8%) | 2,271 (26.2%) |
Public vs Private Health Insurance Coverage by Age in East Riverdale
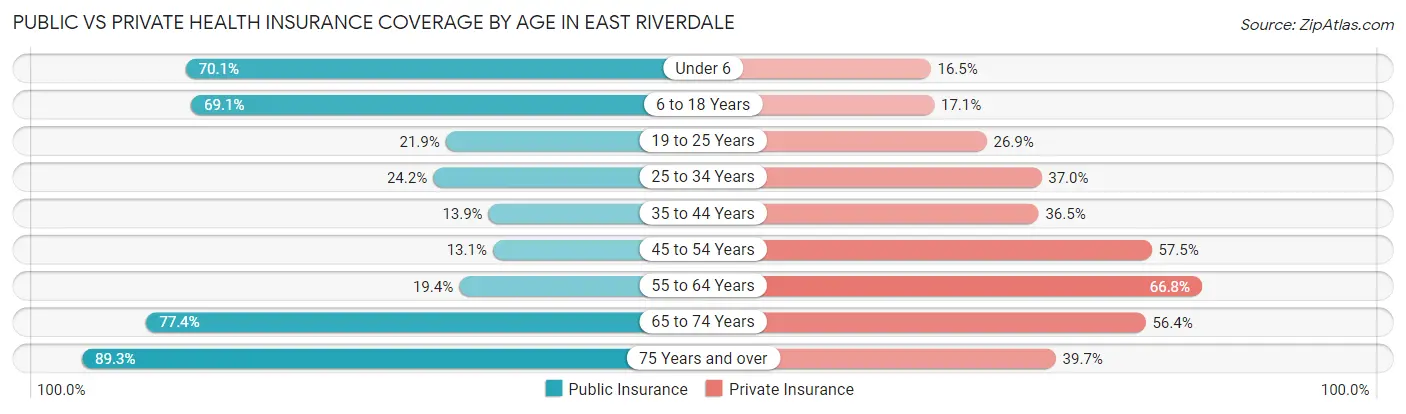
| Age Bracket | Public Insurance | Private Insurance |
| Under 6 | 1,383 (70.1%) | 325 (16.5%) |
| 6 to 18 Years | 2,761 (69.1%) | 684 (17.1%) |
| 19 to 25 Years | 416 (21.9%) | 511 (26.9%) |
| 25 to 34 Years | 611 (24.2%) | 935 (37.0%) |
| 35 to 44 Years | 357 (13.9%) | 938 (36.5%) |
| 45 to 54 Years | 305 (13.1%) | 1,337 (57.5%) |
| 55 to 64 Years | 275 (19.4%) | 949 (66.8%) |
| 65 to 74 Years | 729 (77.4%) | 531 (56.4%) |
| 75 Years and over | 360 (89.3%) | 160 (39.7%) |
| Total | 7,197 (39.9%) | 6,370 (35.3%) |
Disability Status by Sex by Age in East Riverdale
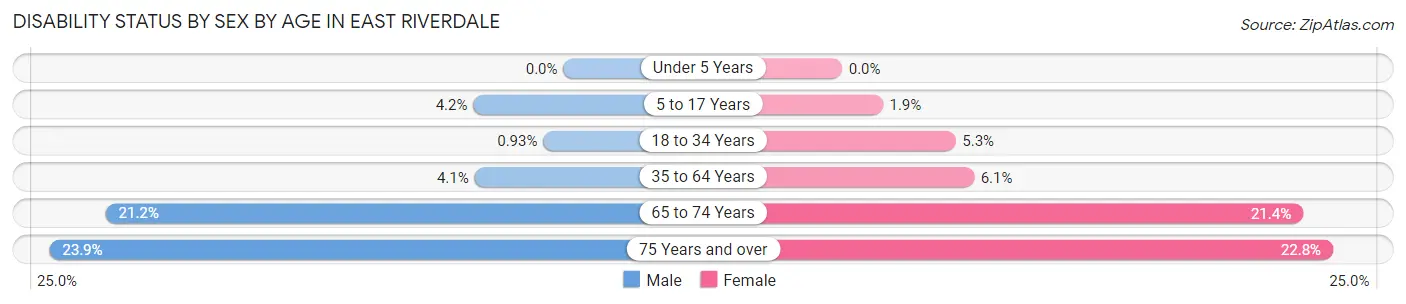
| Age Bracket | Male | Female |
| Under 5 Years | 0 (0.0%) | 0 (0.0%) |
| 5 to 17 Years | 90 (4.2%) | 36 (1.9%) |
| 18 to 34 Years | 25 (0.9%) | 108 (5.3%) |
| 35 to 64 Years | 147 (4.1%) | 168 (6.1%) |
| 65 to 74 Years | 82 (21.2%) | 119 (21.4%) |
| 75 Years and over | 26 (23.8%) | 67 (22.8%) |
Disability Class by Sex by Age in East Riverdale
Disability Class: Hearing Difficulty
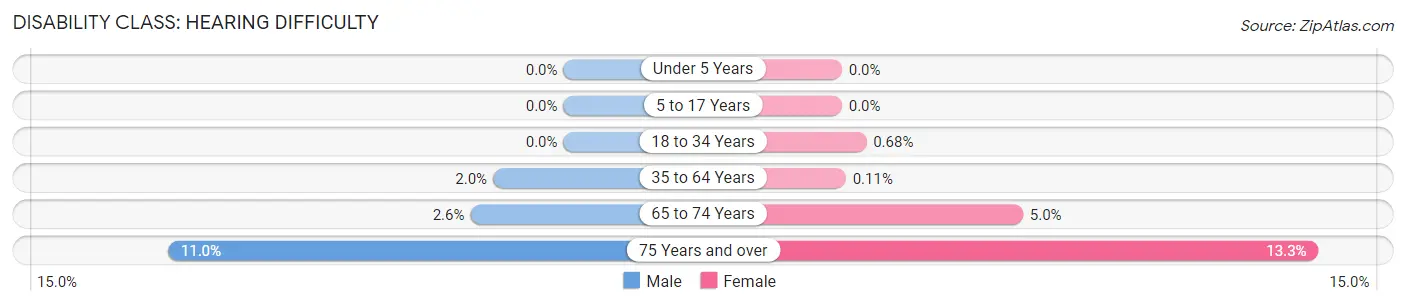
| Age Bracket | Male | Female |
| Under 5 Years | 0 (0.0%) | 0 (0.0%) |
| 5 to 17 Years | 0 (0.0%) | 0 (0.0%) |
| 18 to 34 Years | 0 (0.0%) | 14 (0.7%) |
| 35 to 64 Years | 70 (2.0%) | 3 (0.1%) |
| 65 to 74 Years | 10 (2.6%) | 28 (5.0%) |
| 75 Years and over | 12 (11.0%) | 39 (13.3%) |
Disability Class: Vision Difficulty
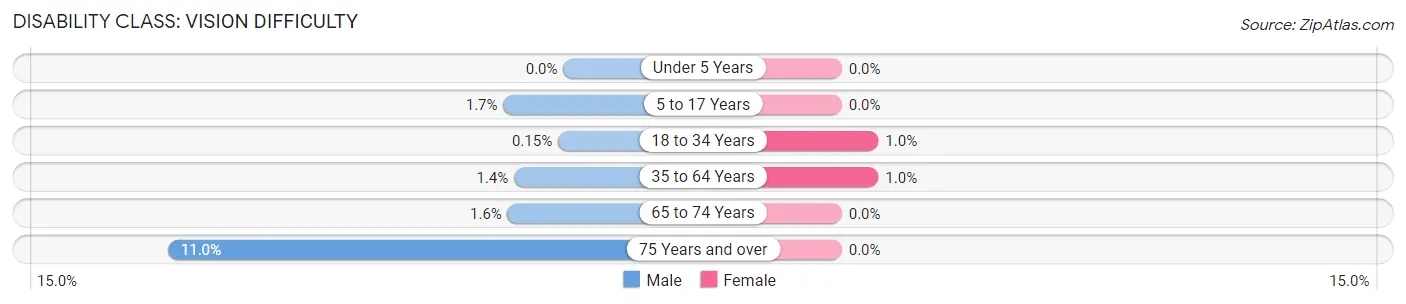
| Age Bracket | Male | Female |
| Under 5 Years | 0 (0.0%) | 0 (0.0%) |
| 5 to 17 Years | 36 (1.7%) | 0 (0.0%) |
| 18 to 34 Years | 4 (0.2%) | 21 (1.0%) |
| 35 to 64 Years | 49 (1.4%) | 28 (1.0%) |
| 65 to 74 Years | 6 (1.5%) | 0 (0.0%) |
| 75 Years and over | 12 (11.0%) | 0 (0.0%) |
Disability Class: Cognitive Difficulty
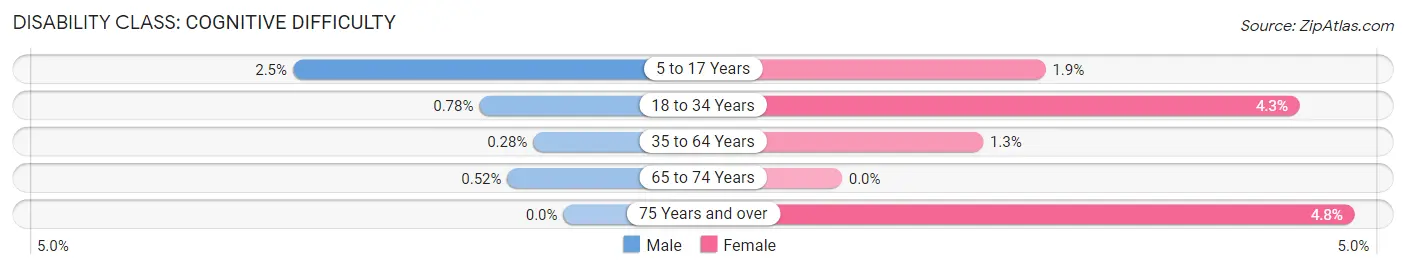
| Age Bracket | Male | Female |
| 5 to 17 Years | 54 (2.5%) | 36 (1.9%) |
| 18 to 34 Years | 21 (0.8%) | 87 (4.3%) |
| 35 to 64 Years | 10 (0.3%) | 36 (1.3%) |
| 65 to 74 Years | 2 (0.5%) | 0 (0.0%) |
| 75 Years and over | 0 (0.0%) | 14 (4.8%) |
Disability Class: Ambulatory Difficulty
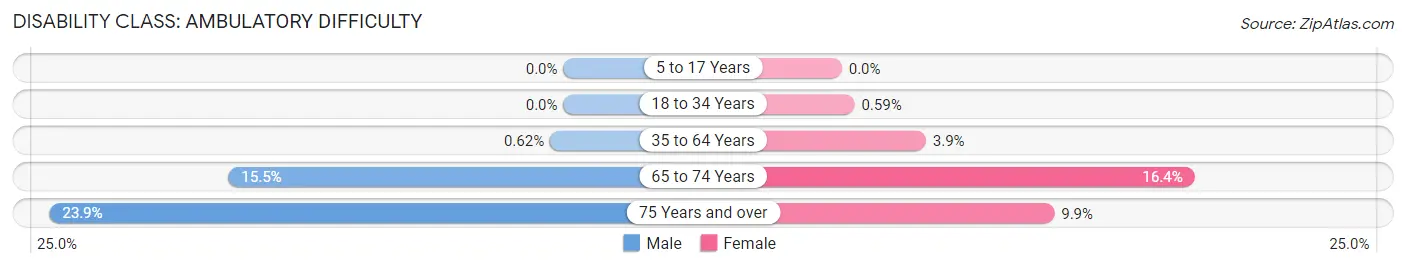
| Age Bracket | Male | Female |
| 5 to 17 Years | 0 (0.0%) | 0 (0.0%) |
| 18 to 34 Years | 0 (0.0%) | 12 (0.6%) |
| 35 to 64 Years | 22 (0.6%) | 107 (3.9%) |
| 65 to 74 Years | 60 (15.5%) | 91 (16.4%) |
| 75 Years and over | 26 (23.8%) | 29 (9.9%) |
Disability Class: Self-Care Difficulty
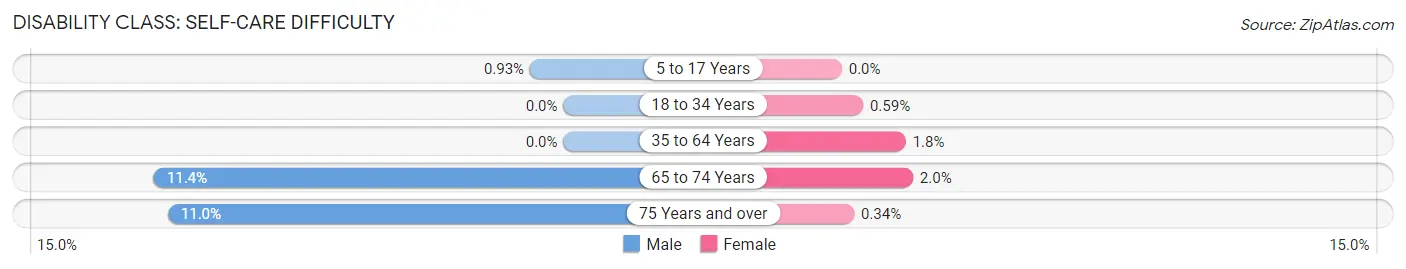
| Age Bracket | Male | Female |
| 5 to 17 Years | 20 (0.9%) | 0 (0.0%) |
| 18 to 34 Years | 0 (0.0%) | 12 (0.6%) |
| 35 to 64 Years | 0 (0.0%) | 49 (1.8%) |
| 65 to 74 Years | 44 (11.4%) | 11 (2.0%) |
| 75 Years and over | 12 (11.0%) | 1 (0.3%) |
Technology Access in East Riverdale
Computing Device Access in East Riverdale
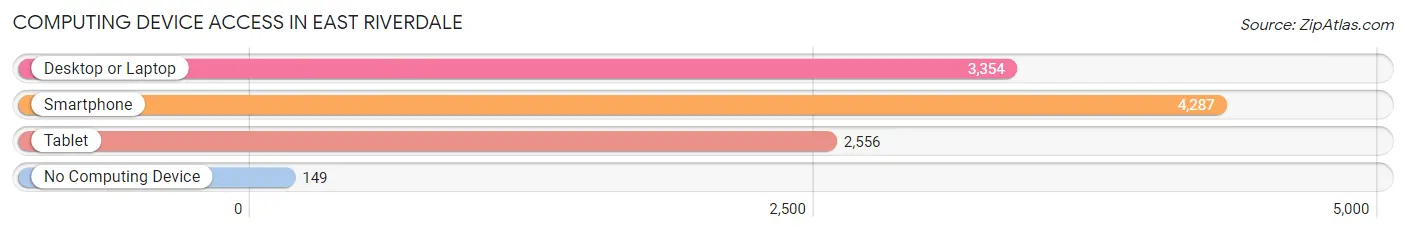
| Device Type | # Households | % Households |
| Desktop or Laptop | 3,354 | 72.3% |
| Smartphone | 4,287 | 92.4% |
| Tablet | 2,556 | 55.1% |
| No Computing Device | 149 | 3.2% |
| Total | 4,641 | 100.0% |
Internet Access in East Riverdale
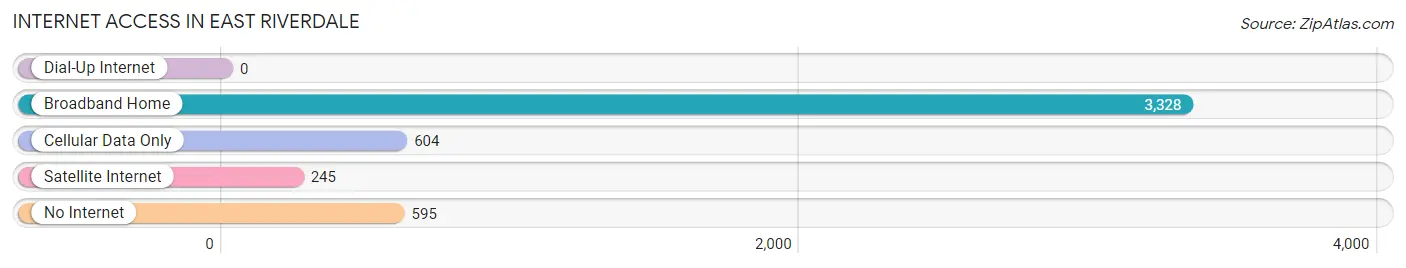
| Internet Type | # Households | % Households |
| Dial-Up Internet | 0 | 0.0% |
| Broadband Home | 3,328 | 71.7% |
| Cellular Data Only | 604 | 13.0% |
| Satellite Internet | 245 | 5.3% |
| No Internet | 595 | 12.8% |
| Total | 4,641 | 100.0% |
East Riverdale Summary
Riverdale, Maryland is a small town located in Prince George’s County, Maryland, just outside of Washington, D.C. It is a part of the larger East Riverdale area, which includes the towns of Bladensburg, Colmar Manor, and Edmonston. The town of Riverdale is located on the east side of the Anacostia River, and is bordered by the towns of Bladensburg and Colmar Manor to the north, and Edmonston to the south.
History
The area that is now Riverdale was originally inhabited by the Nacotchtank Native Americans. The first European settlers arrived in the area in the late 1600s, and the town of Riverdale was officially established in 1854. The town was named after the nearby Riverdale Plantation, which was owned by the prominent Bowie family.
In the late 1800s, the town of Riverdale began to grow and develop. The town was home to a number of businesses, including a general store, a post office, a blacksmith shop, and a hotel. The town also had a number of churches, including the Riverdale Methodist Episcopal Church, which was founded in 1867.
In the early 1900s, the town of Riverdale began to experience rapid growth. The population of the town increased from just over 500 in 1900 to over 3,000 by the mid-1920s. This growth was largely due to the development of the nearby Washington, D.C. area, as well as the construction of the Anacostia River Bridge in 1923.
Geography
Riverdale is located in Prince George’s County, Maryland, just outside of Washington, D.C. The town is situated on the east side of the Anacostia River, and is bordered by the towns of Bladensburg and Colmar Manor to the north, and Edmonston to the south. The town is located approximately 8 miles from downtown Washington, D.C.
The town of Riverdale is located in a predominantly residential area, and is home to a number of parks and recreational areas. The town is also home to a number of historic sites, including the Riverdale Historic District, which is listed on the National Register of Historic Places.
Economy
The economy of Riverdale is largely based on the service industry. The town is home to a number of restaurants, retail stores, and other businesses. The town is also home to a number of government offices, including the Prince George’s County Police Department and the Prince George’s County Fire Department.
The town of Riverdale is also home to a number of educational institutions, including the University of Maryland, College Park, and the University of Maryland, Baltimore County. The town is also home to a number of medical facilities, including the Prince George’s Hospital Center and the Children’s National Medical Center.
Demographics
As of the 2010 census, the town of Riverdale had a population of 8,988. The population of the town is predominantly African American, with a small percentage of white and Hispanic residents. The median household income in the town is $50,945, and the median home value is $232,400. The town has a high rate of homeownership, with over 70% of the population owning their own homes.
Common Questions
What is Per Capita Income in East Riverdale?
Per Capita income in East Riverdale is $31,617.
What is the Median Family Income in East Riverdale?
Median Family Income in East Riverdale is $79,536.
What is the Median Household income in East Riverdale?
Median Household Income in East Riverdale is $81,354.
What is Income or Wage Gap in East Riverdale?
Income or Wage Gap in East Riverdale is 32.8%.
Women in East Riverdale earn 67.2 cents for every dollar earned by a man.
What is Family Income Deficit in East Riverdale?
Family Income Deficit in East Riverdale is $13,147.
Families that are below poverty line in East Riverdale earn $13,147 less on average than the poverty threshold level.
What is Inequality or Gini Index in East Riverdale?
Inequality or Gini Index in East Riverdale is 0.40.
What is the Total Population of East Riverdale?
Total Population of East Riverdale is 18,080.
What is the Total Male Population of East Riverdale?
Total Male Population of East Riverdale is 9,991.
What is the Total Female Population of East Riverdale?
Total Female Population of East Riverdale is 8,089.
What is the Ratio of Males per 100 Females in East Riverdale?
There are 123.51 Males per 100 Females in East Riverdale.
What is the Ratio of Females per 100 Males in East Riverdale?
There are 80.96 Females per 100 Males in East Riverdale.
What is the Median Population Age in East Riverdale?
Median Population Age in East Riverdale is 30.1 Years.
What is the Average Family Size in East Riverdale
Average Family Size in East Riverdale is 4.1 People.
What is the Average Household Size in East Riverdale
Average Household Size in East Riverdale is 3.9 People.
How Large is the Labor Force in East Riverdale?
There are 9,321 People in the Labor Forcein in East Riverdale.
What is the Percentage of People in the Labor Force in East Riverdale?
71.5% of People are in the Labor Force in East Riverdale.
What is the Unemployment Rate in East Riverdale?
Unemployment Rate in East Riverdale is 8.0%.