Pleasant Grove, MD Map & Demographics
Pleasant Grove Map
Pleasant Grove Overview
$32,827
PER CAPITA INCOME
$105,139
AVG FAMILY INCOME
$54,242
AVG HOUSEHOLD INCOME
0.39
INEQUALITY / GINI INDEX
287
TOTAL POPULATION
148
MALE POPULATION
139
FEMALE POPULATION
106.47
MALES / 100 FEMALES
93.92
FEMALES / 100 MALES
56.6
MEDIAN AGE
2.1
AVG FAMILY SIZE
1.7
AVG HOUSEHOLD SIZE
136
LABOR FORCE [ PEOPLE ]
54.8%
PERCENT IN LABOR FORCE
Income in Pleasant Grove
Income Overview in Pleasant Grove
Per Capita Income in Pleasant Grove is $32,827, while median incomes of families and households are $105,139 and $54,242 respectively.
| Characteristic | Number | Measure |
| Per Capita Income | 287 | $32,827 |
| Median Family Income | 98 | $105,139 |
| Mean Family Income | 98 | $83,078 |
| Median Household Income | 166 | $54,242 |
| Mean Household Income | 166 | $60,862 |
| Income Deficit | 98 | $0 |
| Wage / Income Gap (%) | 287 | 0.00% |
| Wage / Income Gap ($) | 287 | 100.00¢ per $1 |
| Gini / Inequality Index | 287 | 0.39 |
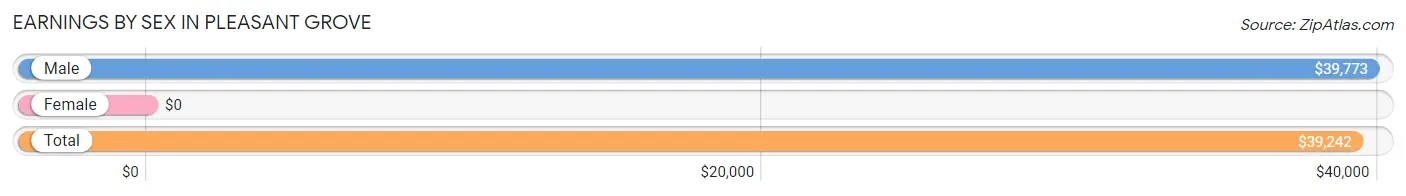
Earnings by Sex in Pleasant Grove
| Sex | Number | Average Earnings |
| Male | 122 (78.2%) | $39,773 |
| Female | 34 (21.8%) | $0 |
| Total | 156 (100.0%) | $39,242 |
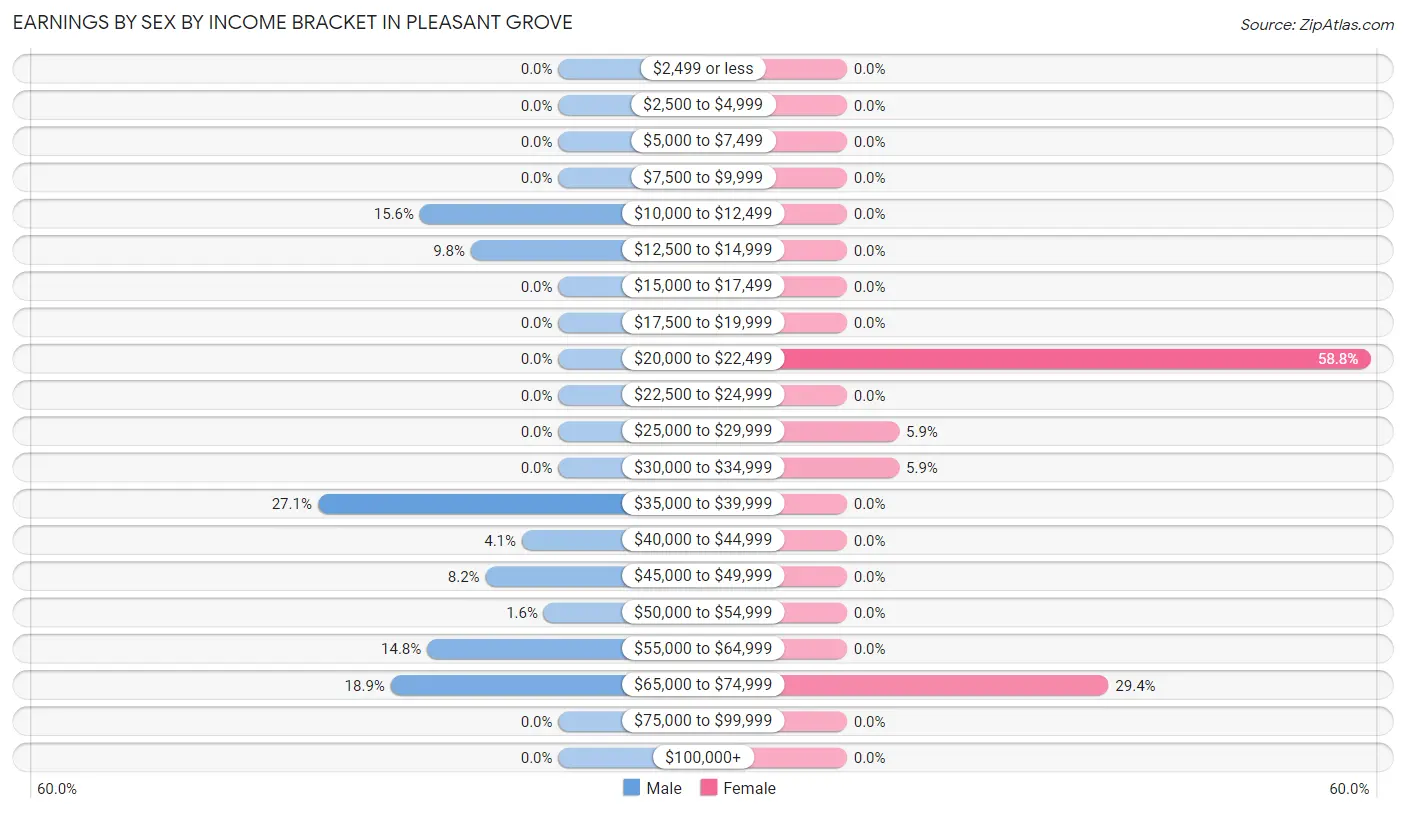
Earnings by Sex by Income Bracket in Pleasant Grove
The most common earnings brackets in Pleasant Grove are $35,000 to $39,999 for men (33 | 27.1%) and $20,000 to $22,499 for women (20 | 58.8%).
| Income | Male | Female |
| $2,499 or less | 0 (0.0%) | 0 (0.0%) |
| $2,500 to $4,999 | 0 (0.0%) | 0 (0.0%) |
| $5,000 to $7,499 | 0 (0.0%) | 0 (0.0%) |
| $7,500 to $9,999 | 0 (0.0%) | 0 (0.0%) |
| $10,000 to $12,499 | 19 (15.6%) | 0 (0.0%) |
| $12,500 to $14,999 | 12 (9.8%) | 0 (0.0%) |
| $15,000 to $17,499 | 0 (0.0%) | 0 (0.0%) |
| $17,500 to $19,999 | 0 (0.0%) | 0 (0.0%) |
| $20,000 to $22,499 | 0 (0.0%) | 20 (58.8%) |
| $22,500 to $24,999 | 0 (0.0%) | 0 (0.0%) |
| $25,000 to $29,999 | 0 (0.0%) | 2 (5.9%) |
| $30,000 to $34,999 | 0 (0.0%) | 2 (5.9%) |
| $35,000 to $39,999 | 33 (27.1%) | 0 (0.0%) |
| $40,000 to $44,999 | 5 (4.1%) | 0 (0.0%) |
| $45,000 to $49,999 | 10 (8.2%) | 0 (0.0%) |
| $50,000 to $54,999 | 2 (1.6%) | 0 (0.0%) |
| $55,000 to $64,999 | 18 (14.7%) | 0 (0.0%) |
| $65,000 to $74,999 | 23 (18.9%) | 10 (29.4%) |
| $75,000 to $99,999 | 0 (0.0%) | 0 (0.0%) |
| $100,000+ | 0 (0.0%) | 0 (0.0%) |
| Total | 122 (100.0%) | 34 (100.0%) |
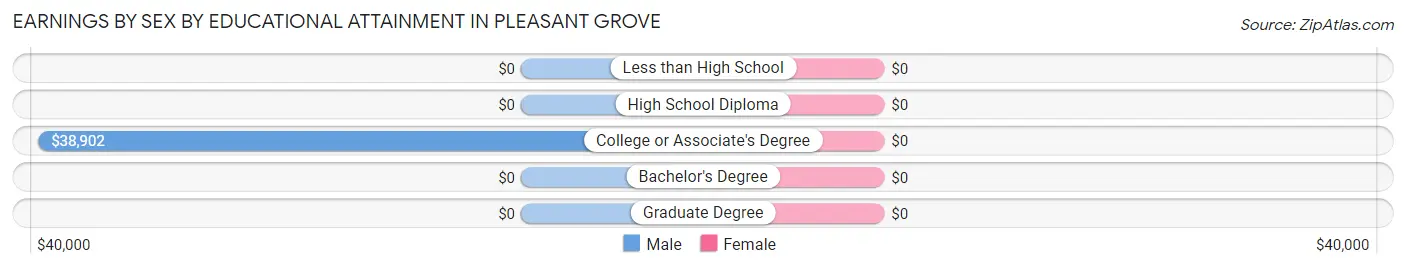
Earnings by Sex by Educational Attainment in Pleasant Grove
| Educational Attainment | Male Income | Female Income |
| Less than High School | - | - |
| High School Diploma | - | - |
| College or Associate's Degree | $38,902 | $0 |
| Bachelor's Degree | - | - |
| Graduate Degree | - | - |
| Total | $39,773 | $0 |
Family Income in Pleasant Grove
Family Income Brackets in Pleasant Grove
According to the Pleasant Grove family income data, there are 50 families falling into the $100,000 to $149,999 income range, which is the most common income bracket and makes up 51.0% of all families.
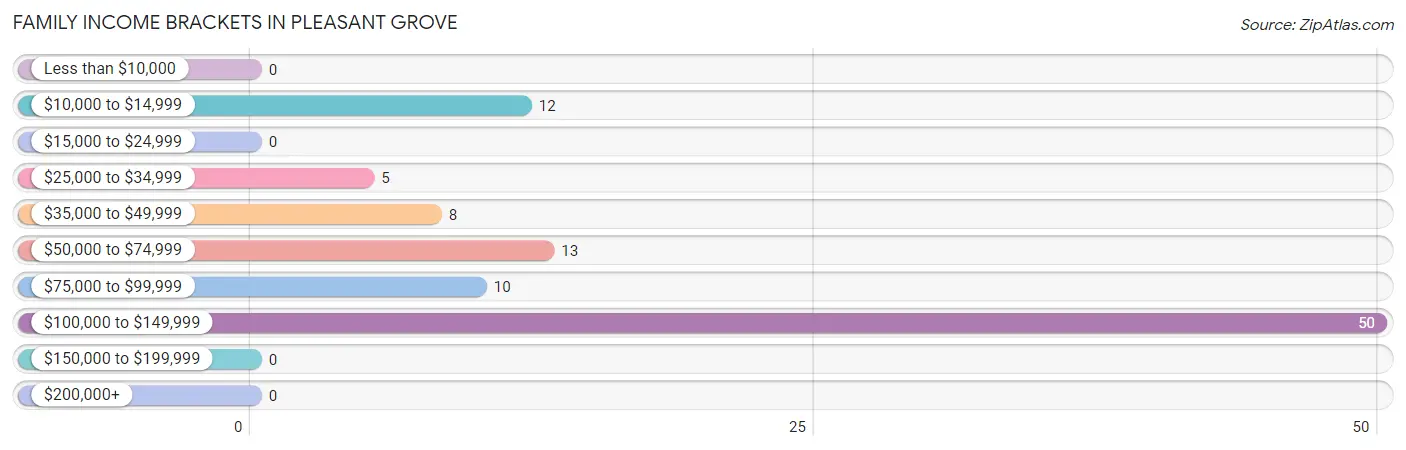
| Income Bracket | # Families | % Families |
| Less than $10,000 | 0 | 0.0% |
| $10,000 to $14,999 | 12 | 12.2% |
| $15,000 to $24,999 | 0 | 0.0% |
| $25,000 to $34,999 | 5 | 5.1% |
| $35,000 to $49,999 | 8 | 8.2% |
| $50,000 to $74,999 | 13 | 13.3% |
| $75,000 to $99,999 | 10 | 10.2% |
| $100,000 to $149,999 | 50 | 51.0% |
| $150,000 to $199,999 | 0 | 0.0% |
| $200,000+ | 0 | 0.0% |
Family Income by Famaliy Size in Pleasant Grove
2-person families (74 | 75.5%) account for the highest median family income in Pleasant Grove with $105,139 per family, while 2-person families (74 | 75.5%) have the highest median income of $52,570 per family member.
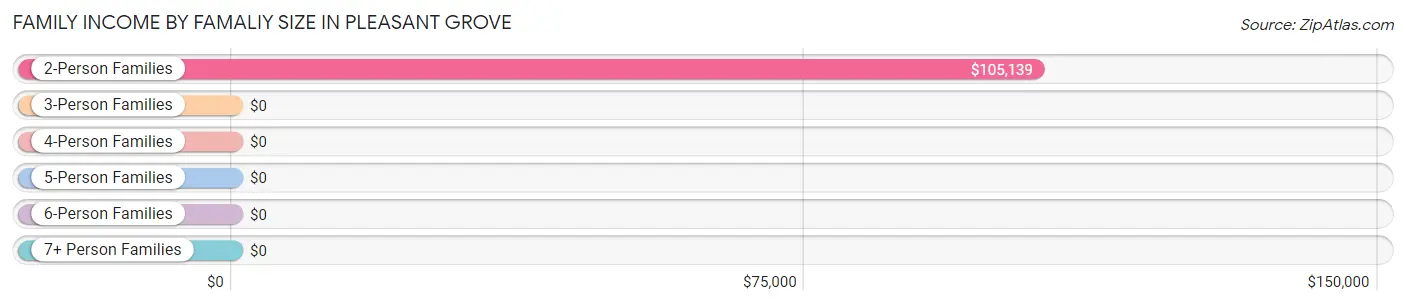
| Income Bracket | # Families | Median Income |
| 2-Person Families | 74 (75.5%) | $105,139 |
| 3-Person Families | 12 (12.2%) | $0 |
| 4-Person Families | 12 (12.2%) | $0 |
| 5-Person Families | 0 (0.0%) | $0 |
| 6-Person Families | 0 (0.0%) | $0 |
| 7+ Person Families | 0 (0.0%) | $0 |
| Total | 98 (100.0%) | $105,139 |
Family Income by Number of Earners in Pleasant Grove
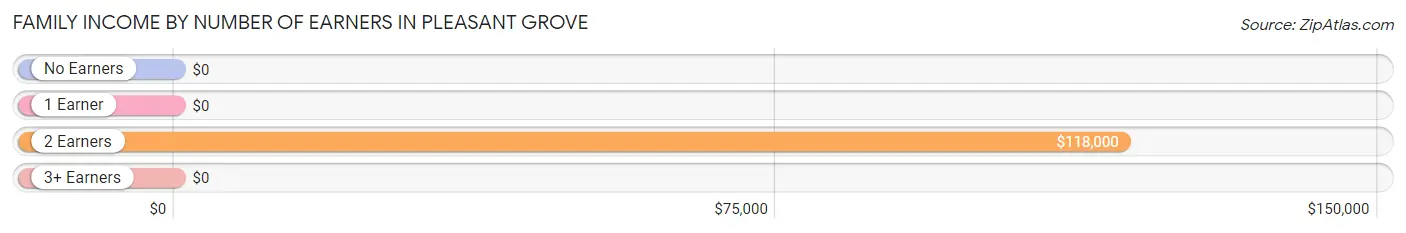
| Number of Earners | # Families | Median Income |
| No Earners | 13 (13.3%) | $0 |
| 1 Earner | 35 (35.7%) | $0 |
| 2 Earners | 48 (49.0%) | $118,000 |
| 3+ Earners | 2 (2.0%) | $0 |
| Total | 98 (100.0%) | $105,139 |
Household Income in Pleasant Grove
Household Income Brackets in Pleasant Grove
With 50 households falling in the category, the $100,000 to $149,999 income range is the most frequent in Pleasant Grove, accounting for 30.1% of all households.
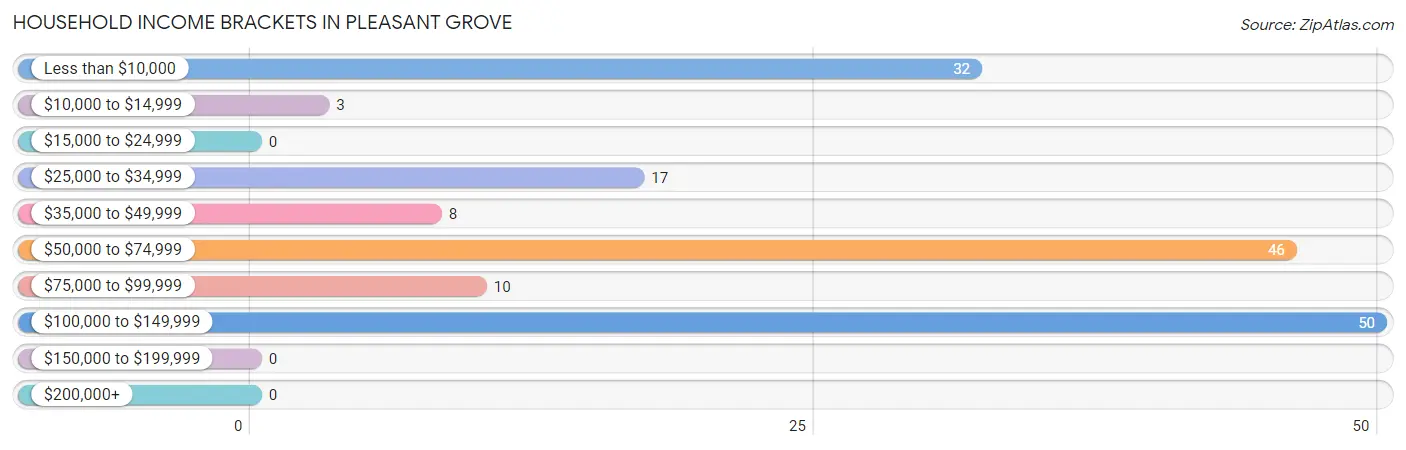
| Income Bracket | # Households | % Households |
| Less than $10,000 | 32 | 19.3% |
| $10,000 to $14,999 | 3 | 1.8% |
| $15,000 to $24,999 | 0 | 0.0% |
| $25,000 to $34,999 | 17 | 10.2% |
| $35,000 to $49,999 | 8 | 4.8% |
| $50,000 to $74,999 | 46 | 27.7% |
| $75,000 to $99,999 | 10 | 6.0% |
| $100,000 to $149,999 | 50 | 30.1% |
| $150,000 to $199,999 | 0 | 0.0% |
| $200,000+ | 0 | 0.0% |
Household Income by Householder Age in Pleasant Grove
The median household income in Pleasant Grove is $54,242, with the highest median household income of $84,375 found in the 45 to 64 years age bracket for the primary householder. A total of 65 households (39.2%) fall into this category.
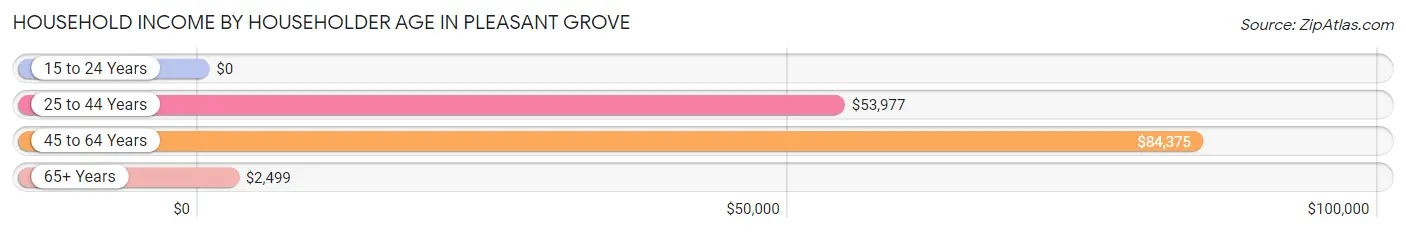
| Income Bracket | # Households | Median Income |
| 15 to 24 Years | 0 (0.0%) | $0 |
| 25 to 44 Years | 63 (38.0%) | $53,977 |
| 45 to 64 Years | 65 (39.2%) | $84,375 |
| 65+ Years | 38 (22.9%) | $2,499 |
| Total | 166 (100.0%) | $54,242 |
Poverty in Pleasant Grove
Income Below Poverty by Sex and Age in Pleasant Grove
With 16.2% poverty level for males and 45.3% for females among the residents of Pleasant Grove, 35 to 44 year old males and 6 to 11 year old females are the most vulnerable to poverty, with 12 males (70.6%) and 20 females (100.0%) in their respective age groups living below the poverty level.
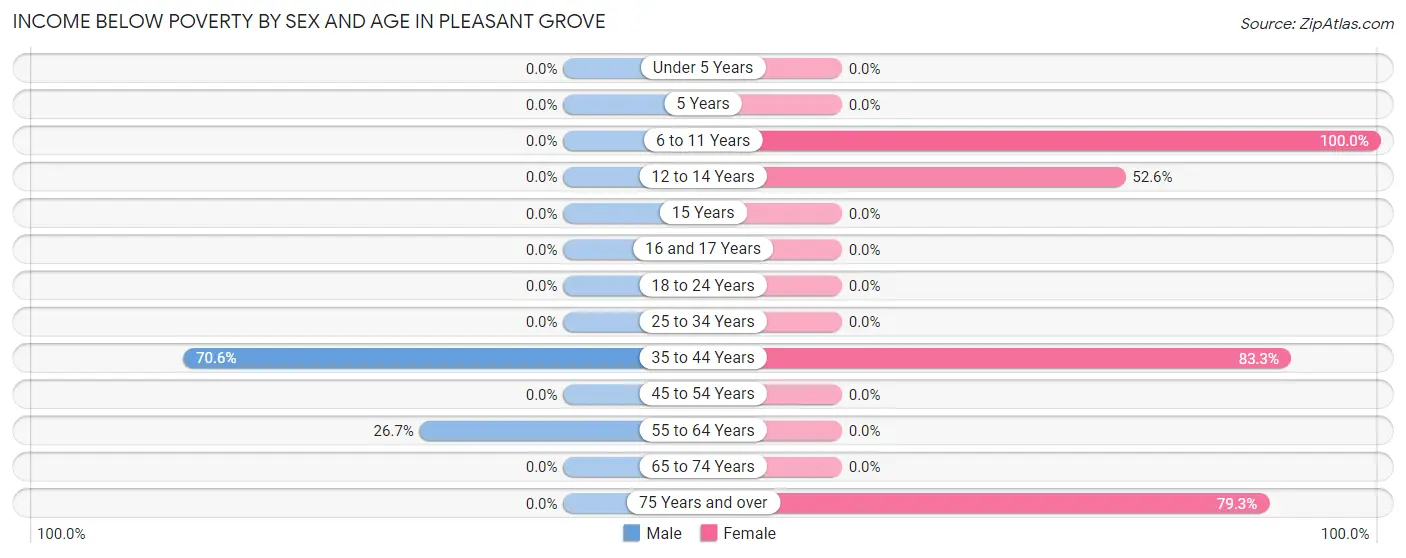
| Age Bracket | Male | Female |
| Under 5 Years | 0 (0.0%) | 0 (0.0%) |
| 5 Years | 0 (0.0%) | 0 (0.0%) |
| 6 to 11 Years | 0 (0.0%) | 20 (100.0%) |
| 12 to 14 Years | 0 (0.0%) | 10 (52.6%) |
| 15 Years | 0 (0.0%) | 0 (0.0%) |
| 16 and 17 Years | 0 (0.0%) | 0 (0.0%) |
| 18 to 24 Years | 0 (0.0%) | 0 (0.0%) |
| 25 to 34 Years | 0 (0.0%) | 0 (0.0%) |
| 35 to 44 Years | 12 (70.6%) | 10 (83.3%) |
| 45 to 54 Years | 0 (0.0%) | 0 (0.0%) |
| 55 to 64 Years | 12 (26.7%) | 0 (0.0%) |
| 65 to 74 Years | 0 (0.0%) | 0 (0.0%) |
| 75 Years and over | 0 (0.0%) | 23 (79.3%) |
| Total | 24 (16.2%) | 63 (45.3%) |
Income Above Poverty by Sex and Age in Pleasant Grove
According to the poverty statistics in Pleasant Grove, males aged 25 to 34 years and females aged 45 to 54 years are the age groups that are most secure financially, with 100.0% of males and 100.0% of females in these age groups living above the poverty line.
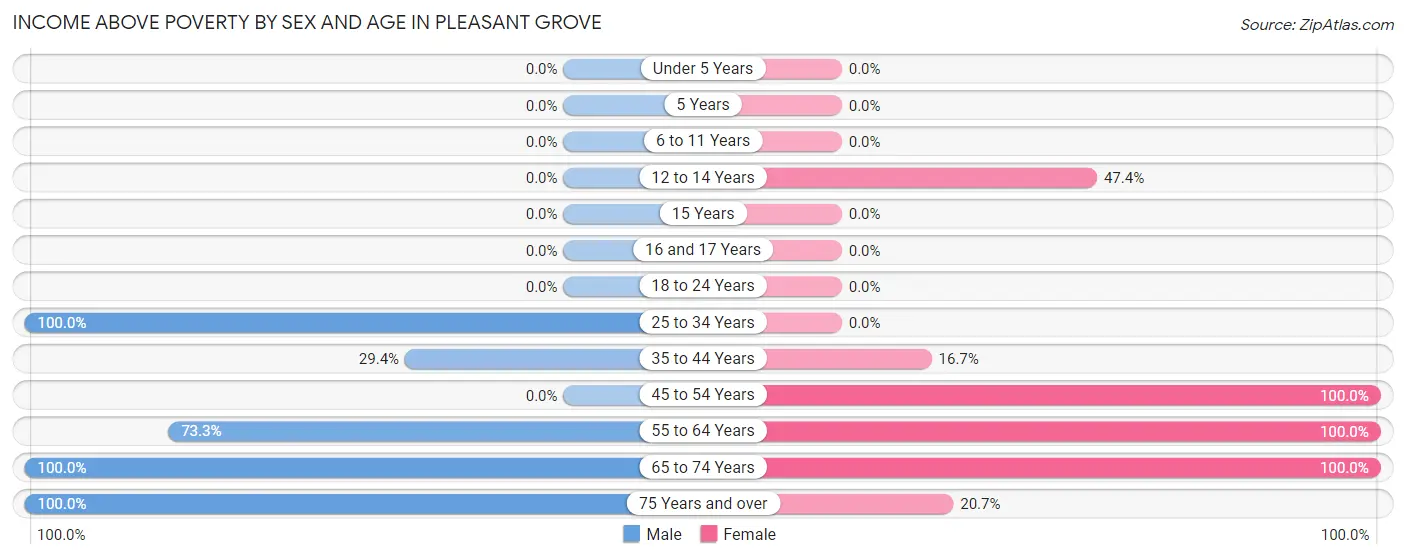
| Age Bracket | Male | Female |
| Under 5 Years | 0 (0.0%) | 0 (0.0%) |
| 5 Years | 0 (0.0%) | 0 (0.0%) |
| 6 to 11 Years | 0 (0.0%) | 0 (0.0%) |
| 12 to 14 Years | 0 (0.0%) | 9 (47.4%) |
| 15 Years | 0 (0.0%) | 0 (0.0%) |
| 16 and 17 Years | 0 (0.0%) | 0 (0.0%) |
| 18 to 24 Years | 0 (0.0%) | 0 (0.0%) |
| 25 to 34 Years | 60 (100.0%) | 0 (0.0%) |
| 35 to 44 Years | 5 (29.4%) | 2 (16.7%) |
| 45 to 54 Years | 0 (0.0%) | 10 (100.0%) |
| 55 to 64 Years | 33 (73.3%) | 33 (100.0%) |
| 65 to 74 Years | 21 (100.0%) | 16 (100.0%) |
| 75 Years and over | 5 (100.0%) | 6 (20.7%) |
| Total | 124 (83.8%) | 76 (54.7%) |
Income Below Poverty Among Married-Couple Families in Pleasant Grove
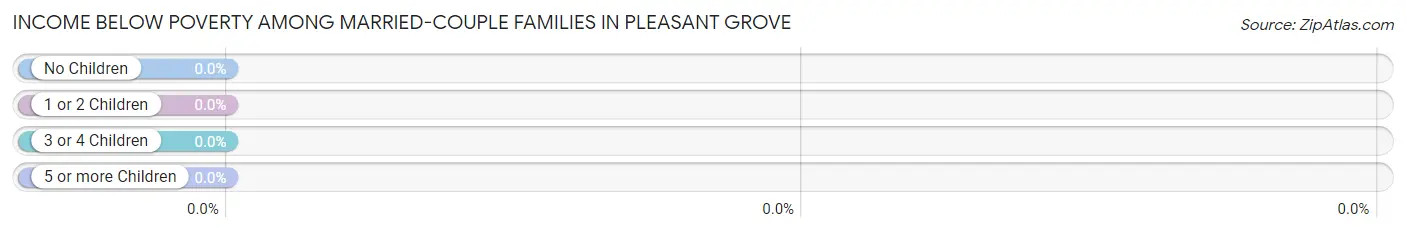
| Children | Above Poverty | Below Poverty |
| No Children | 58 (100.0%) | 0 (0.0%) |
| 1 or 2 Children | 10 (100.0%) | 0 (0.0%) |
| 3 or 4 Children | 0 (0.0%) | 0 (0.0%) |
| 5 or more Children | 0 (0.0%) | 0 (0.0%) |
| Total | 68 (100.0%) | 0 (0.0%) |
Income Below Poverty Among Single-Parent Households in Pleasant Grove
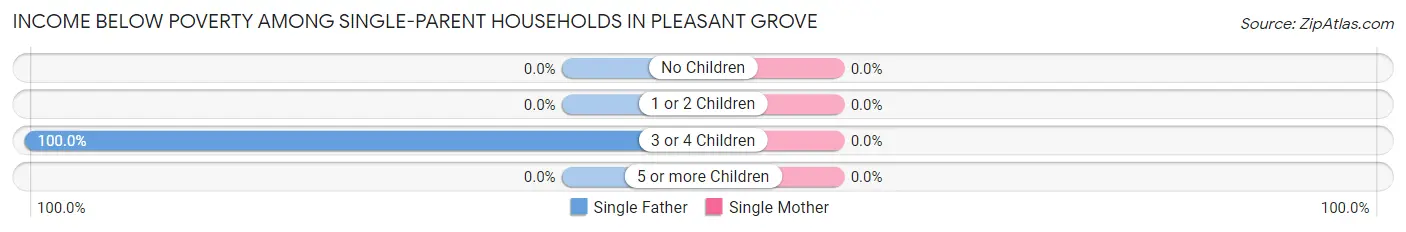
| Children | Single Father | Single Mother |
| No Children | 0 (0.0%) | 0 (0.0%) |
| 1 or 2 Children | 0 (0.0%) | 0 (0.0%) |
| 3 or 4 Children | 12 (100.0%) | 0 (0.0%) |
| 5 or more Children | 0 (0.0%) | 0 (0.0%) |
| Total | 12 (54.5%) | 0 (0.0%) |
Income Below Poverty Among Married-Couple vs Single-Parent Households in Pleasant Grove
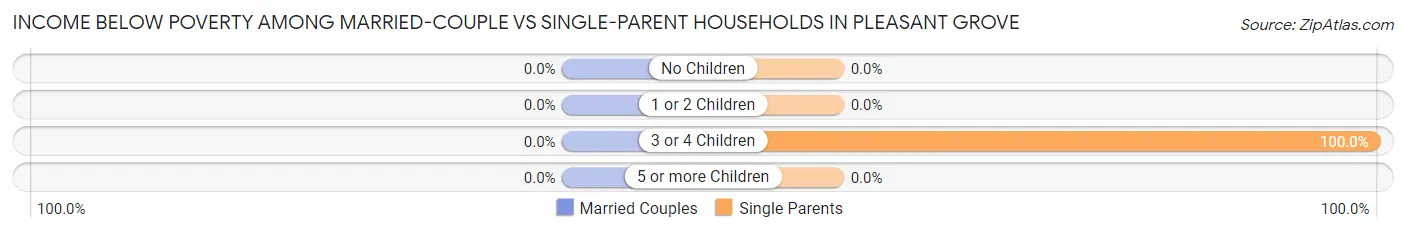
| Children | Married-Couple Families | Single-Parent Households |
| No Children | 0 (0.0%) | 0 (0.0%) |
| 1 or 2 Children | 0 (0.0%) | 0 (0.0%) |
| 3 or 4 Children | 0 (0.0%) | 12 (100.0%) |
| 5 or more Children | 0 (0.0%) | 0 (0.0%) |
| Total | 0 (0.0%) | 12 (40.0%) |
Race in Pleasant Grove
The most populous races in Pleasant Grove are White / Caucasian (279 | 97.2%), Black / African American (5 | 1.7%), and Native / Alaskan (3 | 1.1%).
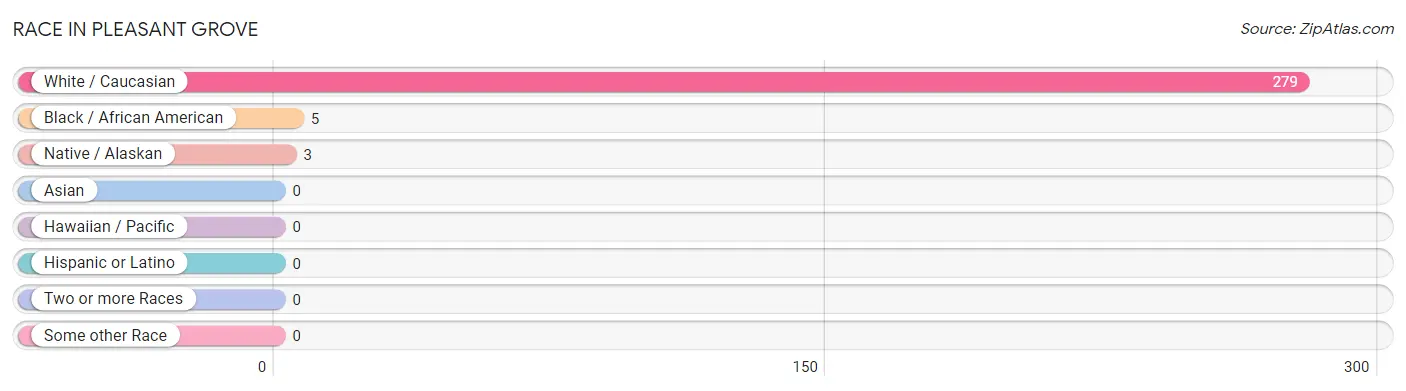
| Race | # Population | % Population |
| Asian | 0 | 0.0% |
| Black / African American | 5 | 1.7% |
| Hawaiian / Pacific | 0 | 0.0% |
| Hispanic or Latino | 0 | 0.0% |
| Native / Alaskan | 3 | 1.1% |
| White / Caucasian | 279 | 97.2% |
| Two or more Races | 0 | 0.0% |
| Some other Race | 0 | 0.0% |
| Total | 287 | 100.0% |
Ancestry in Pleasant Grove
The most populous ancestries reported in Pleasant Grove are American (78 | 27.2%), German (73 | 25.4%), Irish (70 | 24.4%), English (31 | 10.8%), and Italian (14 | 4.9%), together accounting for 92.7% of all Pleasant Grove residents.
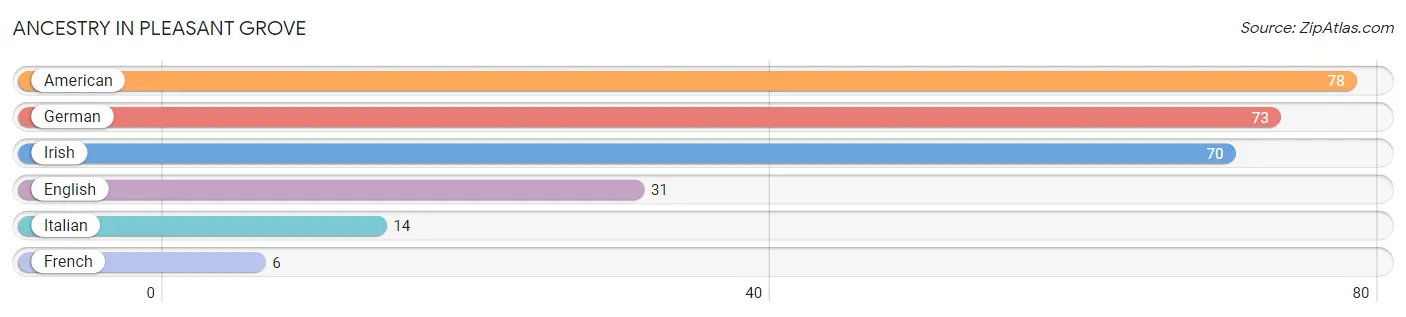
| Ancestry | # Population | % Population |
| American | 78 | 27.2% |
| English | 31 | 10.8% |
| French | 6 | 2.1% |
| German | 73 | 25.4% |
| Irish | 70 | 24.4% |
| Italian | 14 | 4.9% | View All 6 Rows |
Immigrants in Pleasant Grove

| Immigration Origin | # Population | % Population | View All 0 Rows |
Sex and Age in Pleasant Grove
Sex and Age in Pleasant Grove
The most populous age groups in Pleasant Grove are 30 to 34 Years (60 | 40.5%) for men and 10 to 14 Years (29 | 20.9%) for women.
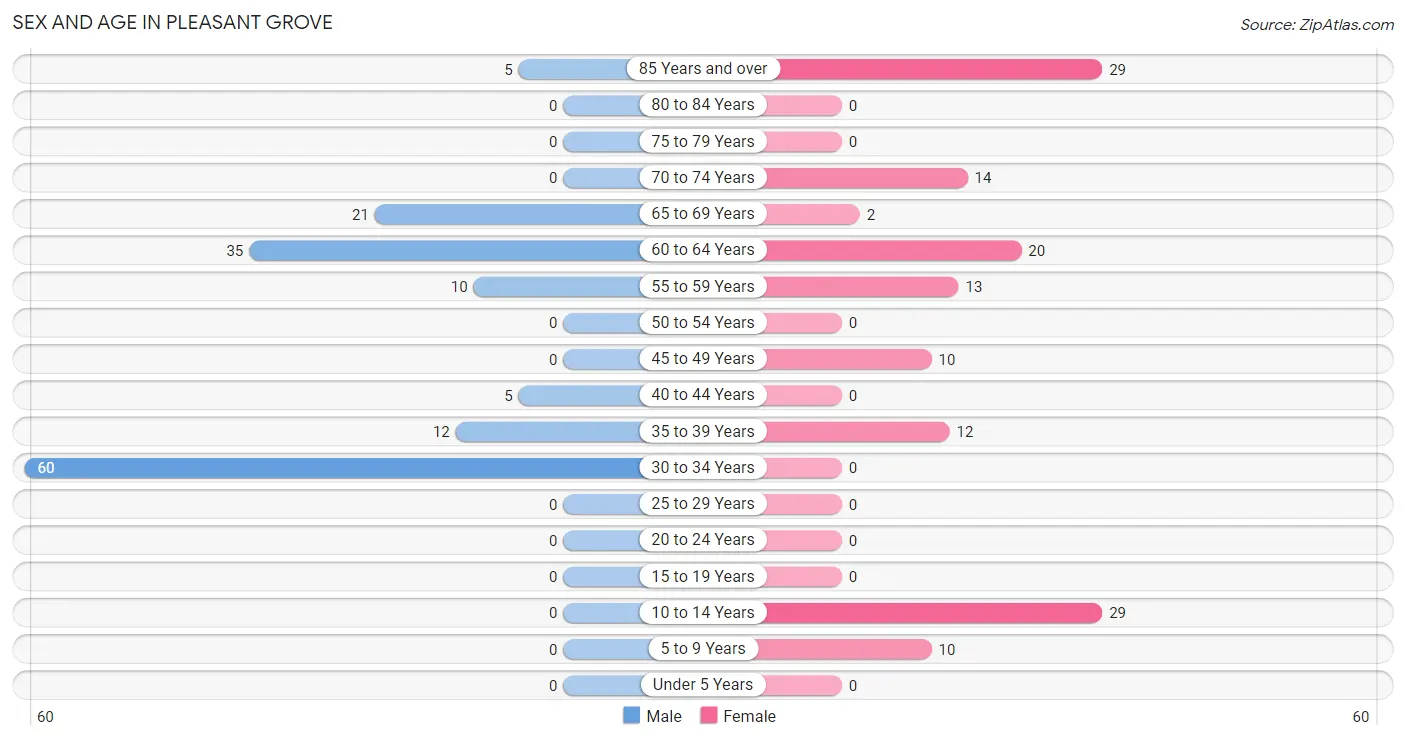
| Age Bracket | Male | Female |
| Under 5 Years | 0 (0.0%) | 0 (0.0%) |
| 5 to 9 Years | 0 (0.0%) | 10 (7.2%) |
| 10 to 14 Years | 0 (0.0%) | 29 (20.9%) |
| 15 to 19 Years | 0 (0.0%) | 0 (0.0%) |
| 20 to 24 Years | 0 (0.0%) | 0 (0.0%) |
| 25 to 29 Years | 0 (0.0%) | 0 (0.0%) |
| 30 to 34 Years | 60 (40.5%) | 0 (0.0%) |
| 35 to 39 Years | 12 (8.1%) | 12 (8.6%) |
| 40 to 44 Years | 5 (3.4%) | 0 (0.0%) |
| 45 to 49 Years | 0 (0.0%) | 10 (7.2%) |
| 50 to 54 Years | 0 (0.0%) | 0 (0.0%) |
| 55 to 59 Years | 10 (6.8%) | 13 (9.3%) |
| 60 to 64 Years | 35 (23.6%) | 20 (14.4%) |
| 65 to 69 Years | 21 (14.2%) | 2 (1.4%) |
| 70 to 74 Years | 0 (0.0%) | 14 (10.1%) |
| 75 to 79 Years | 0 (0.0%) | 0 (0.0%) |
| 80 to 84 Years | 0 (0.0%) | 0 (0.0%) |
| 85 Years and over | 5 (3.4%) | 29 (20.9%) |
| Total | 148 (100.0%) | 139 (100.0%) |
Families and Households in Pleasant Grove
Median Family Size in Pleasant Grove
The median family size in Pleasant Grove is 2.13 persons per family, with single male/father families (22 | 22.5%) accounting for the largest median family size of 2.77 persons per family. On the other hand, single female/mother families (8 | 8.2%) represent the smallest median family size with 1.75 persons per family.
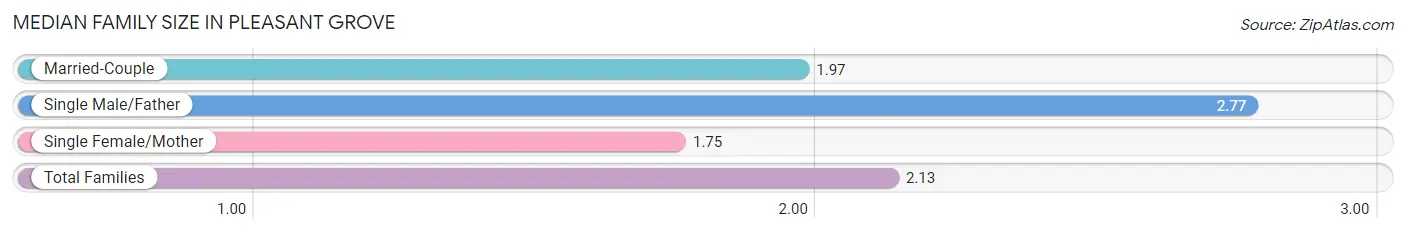
| Family Type | # Families | Family Size |
| Married-Couple | 68 (69.4%) | 1.97 |
| Single Male/Father | 22 (22.5%) | 2.77 |
| Single Female/Mother | 8 (8.2%) | 1.75 |
| Total Families | 98 (100.0%) | 2.13 |
Median Household Size in Pleasant Grove
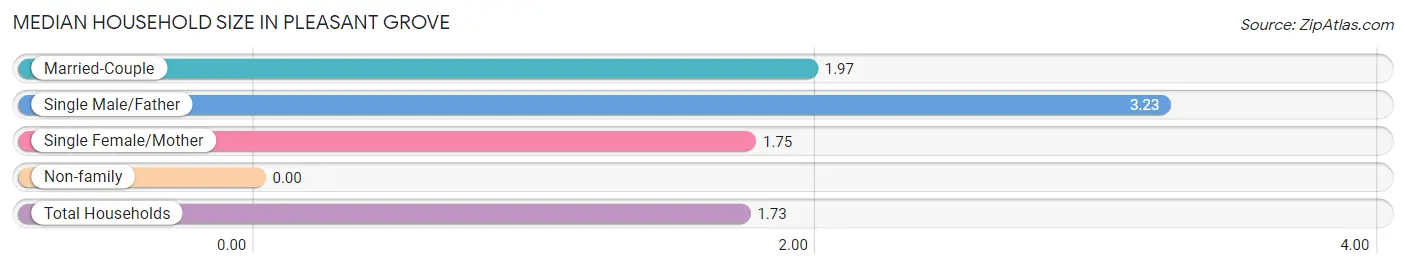
| Household Type | # Households | Household Size |
| Married-Couple | 68 (41.0%) | 1.97 |
| Single Male/Father | 22 (13.3%) | 3.23 |
| Single Female/Mother | 8 (4.8%) | 1.75 |
| Non-family | 68 (41.0%) | - |
| Total Households | 166 (100.0%) | 1.73 |
Household Size by Marriage Status in Pleasant Grove
Out of a total of 166 households in Pleasant Grove, 98 (59.0%) are family households, while 68 (41.0%) are nonfamily households. The most numerous type of family households are 2-person households, comprising 74, and the most common type of nonfamily households are 1-person households, comprising 68.
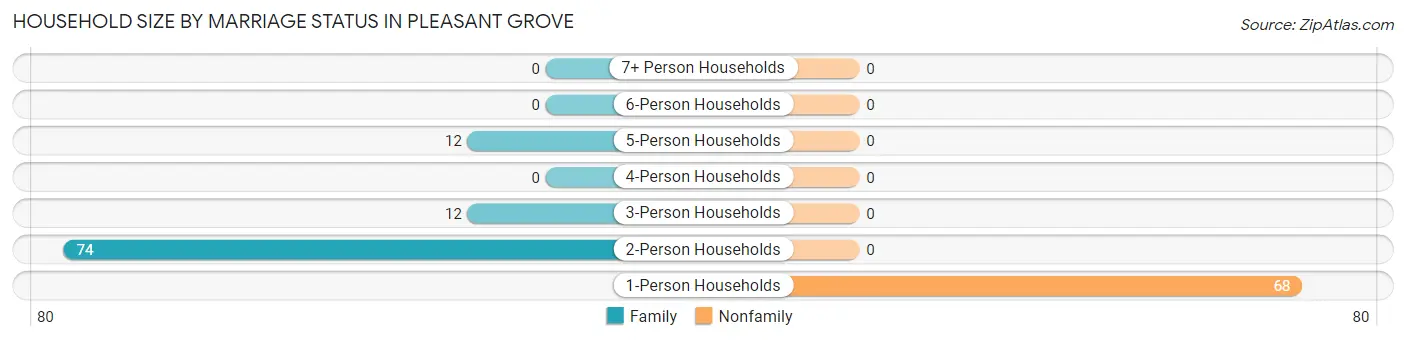
| Household Size | Family Households | Nonfamily Households |
| 1-Person Households | - | 68 (41.0%) |
| 2-Person Households | 74 (44.6%) | 0 (0.0%) |
| 3-Person Households | 12 (7.2%) | 0 (0.0%) |
| 4-Person Households | 0 (0.0%) | 0 (0.0%) |
| 5-Person Households | 12 (7.2%) | 0 (0.0%) |
| 6-Person Households | 0 (0.0%) | 0 (0.0%) |
| 7+ Person Households | 0 (0.0%) | 0 (0.0%) |
| Total | 98 (59.0%) | 68 (41.0%) |
Female Fertility in Pleasant Grove
Fertility by Age in Pleasant Grove
| Age Bracket | Women with Births | Births / 1,000 Women |
| 15 to 19 years | 0 (0.0%) | 0.0 |
| 20 to 34 years | 0 (0.0%) | 0.0 |
| 35 to 50 years | 0 (0.0%) | 0.0 |
| Total | 0 (0.0%) | 0.0 |
Fertility by Age by Marriage Status in Pleasant Grove
| Age Bracket | Married | Unmarried |
| 15 to 19 years | 0 (0.0%) | 0 (0.0%) |
| 20 to 34 years | 0 (0.0%) | 0 (0.0%) |
| 35 to 50 years | 0 (0.0%) | 0 (0.0%) |
| Total | 0 (0.0%) | 0 (0.0%) |
Fertility by Education in Pleasant Grove
| Educational Attainment | Women with Births | Births / 1,000 Women |
| Less than High School | 0 (0.0%) | 0.0 |
| High School Diploma | 0 (0.0%) | 0.0 |
| College or Associate's Degree | 0 (0.0%) | 0.0 |
| Bachelor's Degree | 0 (0.0%) | 0.0 |
| Graduate Degree | 0 (0.0%) | 0.0 |
| Total | 0 (0.0%) | 0.0 |
Fertility by Education by Marriage Status in Pleasant Grove
| Educational Attainment | Married | Unmarried |
| Less than High School | 0 (0.0%) | 0 (0.0%) |
| High School Diploma | 0 (0.0%) | 0 (0.0%) |
| College or Associate's Degree | 0 (0.0%) | 0 (0.0%) |
| Bachelor's Degree | 0 (0.0%) | 0 (0.0%) |
| Graduate Degree | 0 (0.0%) | 0 (0.0%) |
| Total | 0 (0.0%) | 0 (0.0%) |
Employment Characteristics in Pleasant Grove
Employment by Class of Employer in Pleasant Grove
Among the 136 employed individuals in Pleasant Grove, private company employees (85 | 62.5%), state government employees (31 | 22.8%), and local government employees (20 | 14.7%) make up the most common classes of employment.
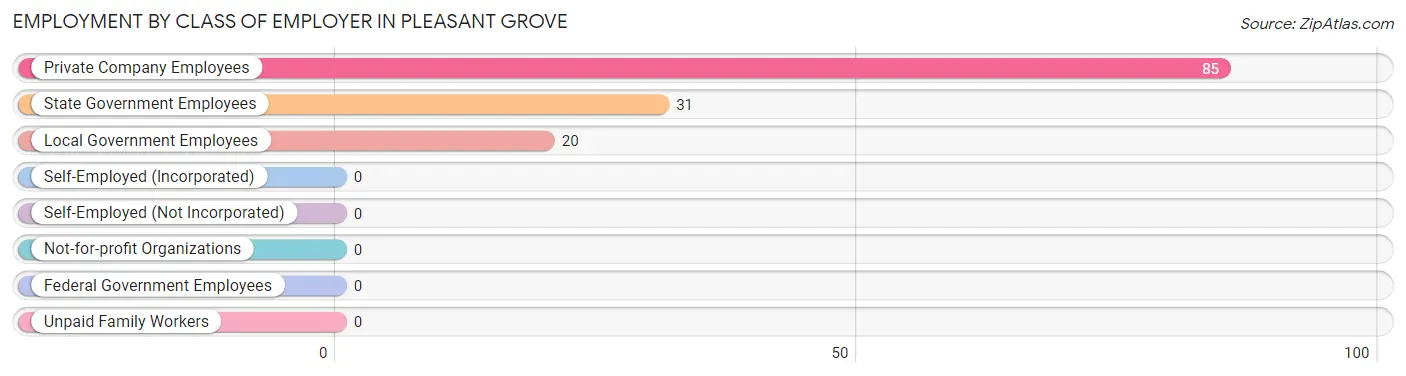
| Employer Class | # Employees | % Employees |
| Private Company Employees | 85 | 62.5% |
| Self-Employed (Incorporated) | 0 | 0.0% |
| Self-Employed (Not Incorporated) | 0 | 0.0% |
| Not-for-profit Organizations | 0 | 0.0% |
| Local Government Employees | 20 | 14.7% |
| State Government Employees | 31 | 22.8% |
| Federal Government Employees | 0 | 0.0% |
| Unpaid Family Workers | 0 | 0.0% |
| Total | 136 | 100.0% |
Employment Status by Age in Pleasant Grove
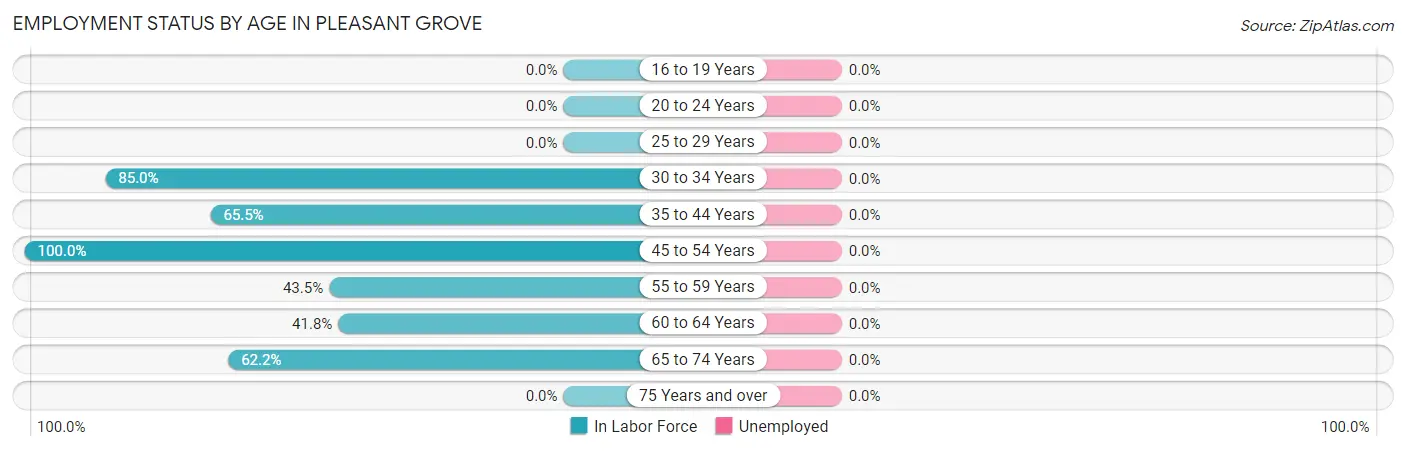
| Age Bracket | In Labor Force | Unemployed |
| 16 to 19 Years | 0 (0.0%) | 0 (0.0%) |
| 20 to 24 Years | 0 (0.0%) | 0 (0.0%) |
| 25 to 29 Years | 0 (0.0%) | 0 (0.0%) |
| 30 to 34 Years | 51 (85.0%) | 0 (0.0%) |
| 35 to 44 Years | 19 (65.5%) | 0 (0.0%) |
| 45 to 54 Years | 10 (100.0%) | 0 (0.0%) |
| 55 to 59 Years | 10 (43.5%) | 0 (0.0%) |
| 60 to 64 Years | 23 (41.8%) | 0 (0.0%) |
| 65 to 74 Years | 23 (62.2%) | 0 (0.0%) |
| 75 Years and over | 0 (0.0%) | 0 (0.0%) |
| Total | 136 (54.8%) | 0 (0.0%) |
Employment Status by Educational Attainment in Pleasant Grove
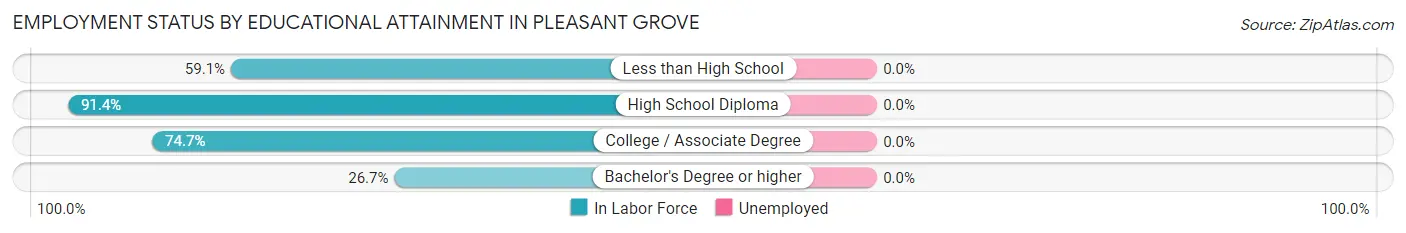
| Educational Attainment | In Labor Force | Unemployed |
| Less than High School | 13 (59.1%) | 0 (0.0%) |
| High School Diploma | 32 (91.4%) | 0 (0.0%) |
| College / Associate Degree | 56 (74.7%) | 0 (0.0%) |
| Bachelor's Degree or higher | 12 (26.7%) | 0 (0.0%) |
| Total | 113 (63.8%) | 0 (0.0%) |
Employment Occupations by Sex in Pleasant Grove
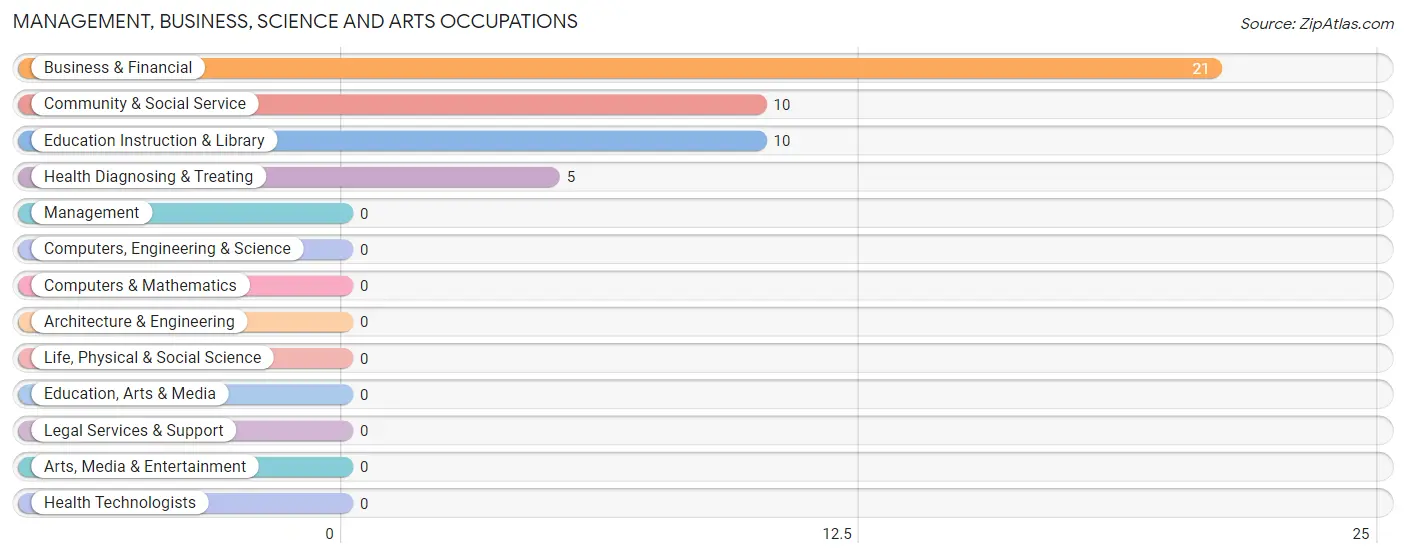
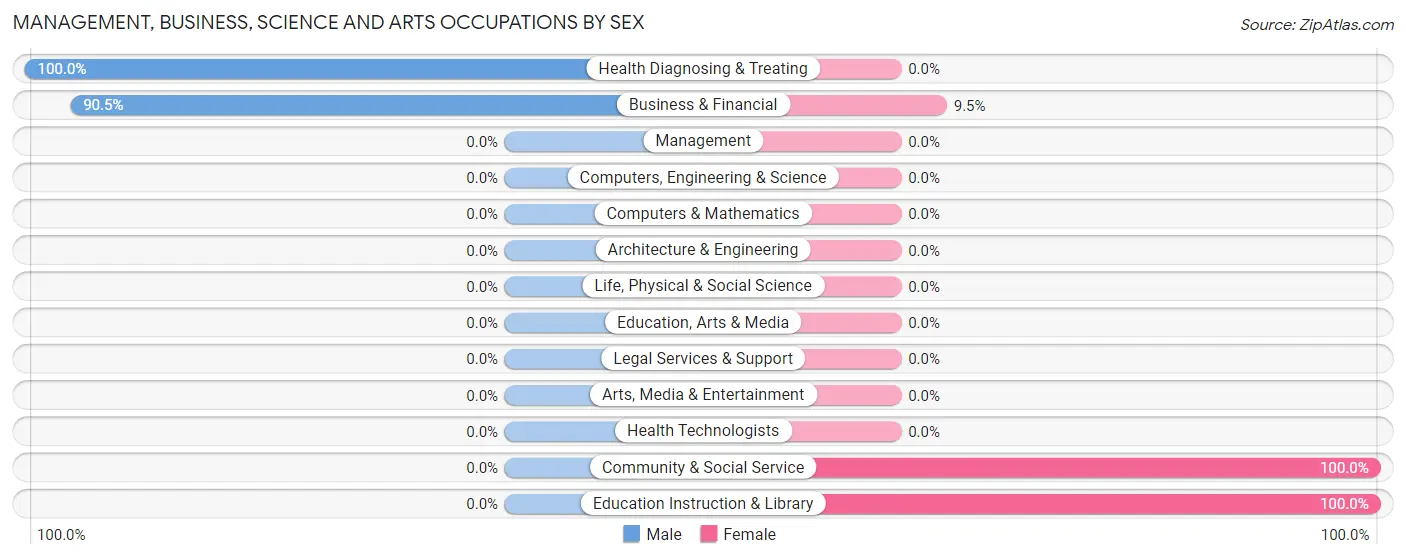
Management, Business, Science and Arts Occupations
The most common Management, Business, Science and Arts occupations in Pleasant Grove are Business & Financial (21 | 15.4%), Community & Social Service (10 | 7.3%), Education Instruction & Library (10 | 7.3%), and Health Diagnosing & Treating (5 | 3.7%).
Management, Business, Science and Arts Occupations by Sex
Within the Management, Business, Science and Arts occupations in Pleasant Grove, the most male-oriented occupations are Health Diagnosing & Treating (100.0%), and Business & Financial (90.5%), while the most female-oriented occupations are Community & Social Service (100.0%), Education Instruction & Library (100.0%), and Business & Financial (9.5%).
| Occupation | Male | Female |
| Management | 0 (0.0%) | 0 (0.0%) |
| Business & Financial | 19 (90.5%) | 2 (9.5%) |
| Computers, Engineering & Science | 0 (0.0%) | 0 (0.0%) |
| Computers & Mathematics | 0 (0.0%) | 0 (0.0%) |
| Architecture & Engineering | 0 (0.0%) | 0 (0.0%) |
| Life, Physical & Social Science | 0 (0.0%) | 0 (0.0%) |
| Community & Social Service | 0 (0.0%) | 10 (100.0%) |
| Education, Arts & Media | 0 (0.0%) | 0 (0.0%) |
| Legal Services & Support | 0 (0.0%) | 0 (0.0%) |
| Education Instruction & Library | 0 (0.0%) | 10 (100.0%) |
| Arts, Media & Entertainment | 0 (0.0%) | 0 (0.0%) |
| Health Diagnosing & Treating | 5 (100.0%) | 0 (0.0%) |
| Health Technologists | 0 (0.0%) | 0 (0.0%) |
| Total (Category) | 24 (66.7%) | 12 (33.3%) |
| Total (Overall) | 122 (89.7%) | 14 (10.3%) |
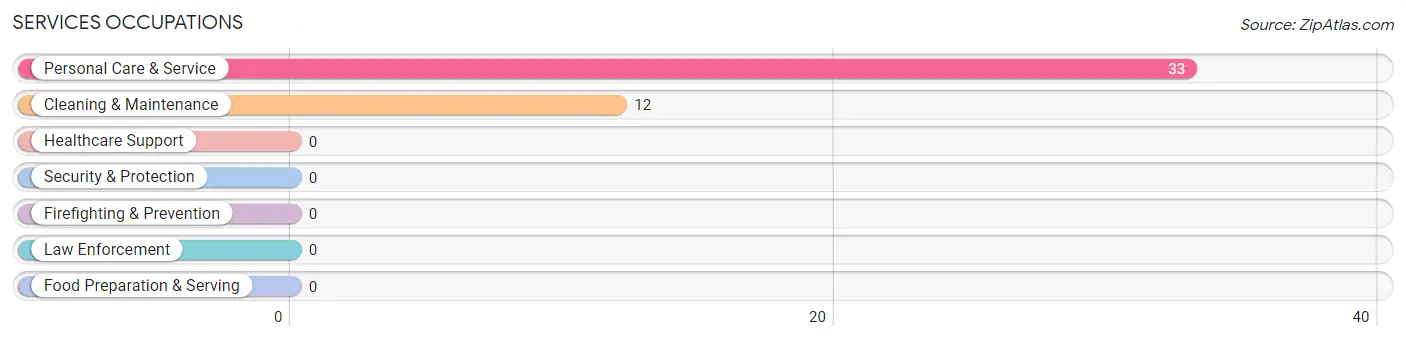
Services Occupations
The most common Services occupations in Pleasant Grove are Personal Care & Service (33 | 24.3%), and Cleaning & Maintenance (12 | 8.8%).
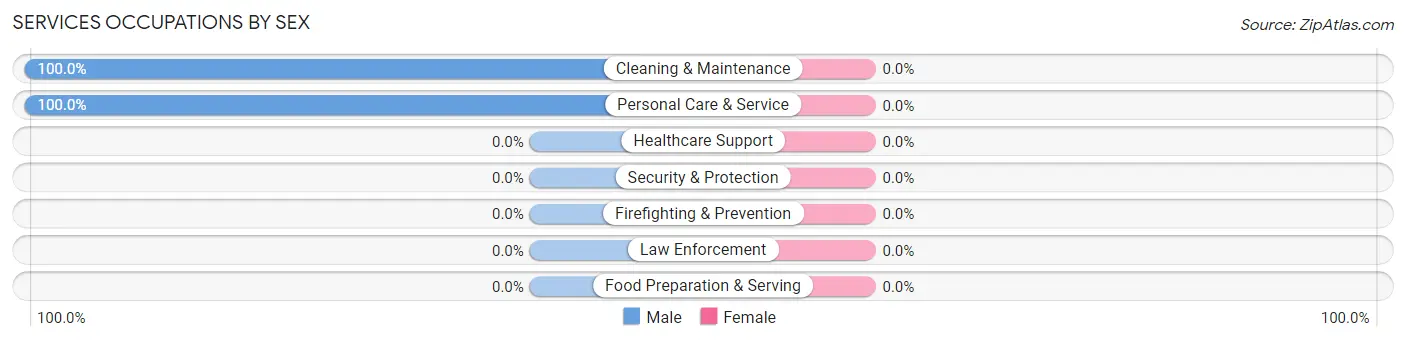
Services Occupations by Sex
| Occupation | Male | Female |
| Healthcare Support | 0 (0.0%) | 0 (0.0%) |
| Security & Protection | 0 (0.0%) | 0 (0.0%) |
| Firefighting & Prevention | 0 (0.0%) | 0 (0.0%) |
| Law Enforcement | 0 (0.0%) | 0 (0.0%) |
| Food Preparation & Serving | 0 (0.0%) | 0 (0.0%) |
| Cleaning & Maintenance | 12 (100.0%) | 0 (0.0%) |
| Personal Care & Service | 33 (100.0%) | 0 (0.0%) |
| Total (Category) | 45 (100.0%) | 0 (0.0%) |
| Total (Overall) | 122 (89.7%) | 14 (10.3%) |
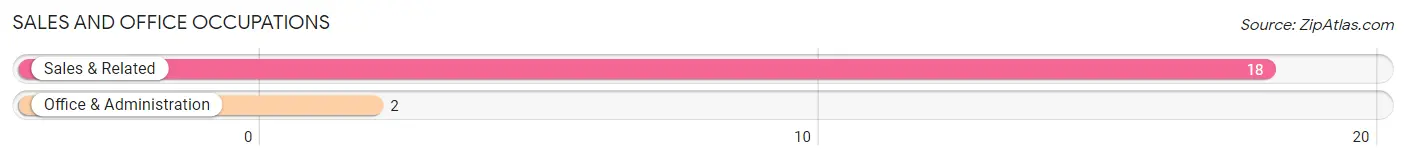
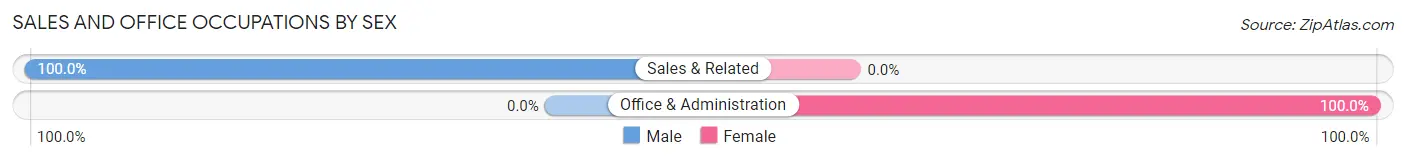
Sales and Office Occupations
The most common Sales and Office occupations in Pleasant Grove are Sales & Related (18 | 13.2%), and Office & Administration (2 | 1.5%).
Sales and Office Occupations by Sex
| Occupation | Male | Female |
| Sales & Related | 18 (100.0%) | 0 (0.0%) |
| Office & Administration | 0 (0.0%) | 2 (100.0%) |
| Total (Category) | 18 (90.0%) | 2 (10.0%) |
| Total (Overall) | 122 (89.7%) | 14 (10.3%) |
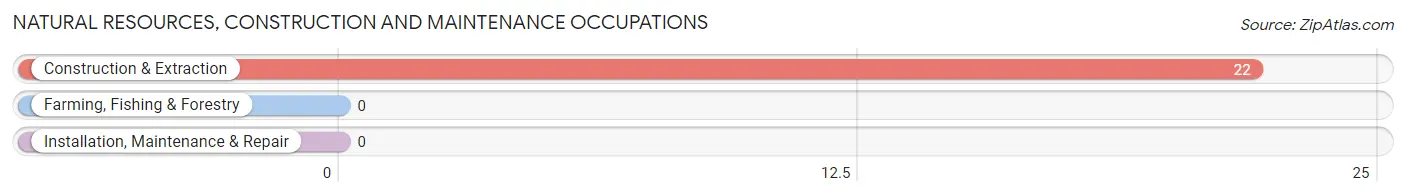
Natural Resources, Construction and Maintenance Occupations
The most common Natural Resources, Construction and Maintenance occupations in Pleasant Grove are , and Construction & Extraction (22 | 16.2%).
Natural Resources, Construction and Maintenance Occupations by Sex
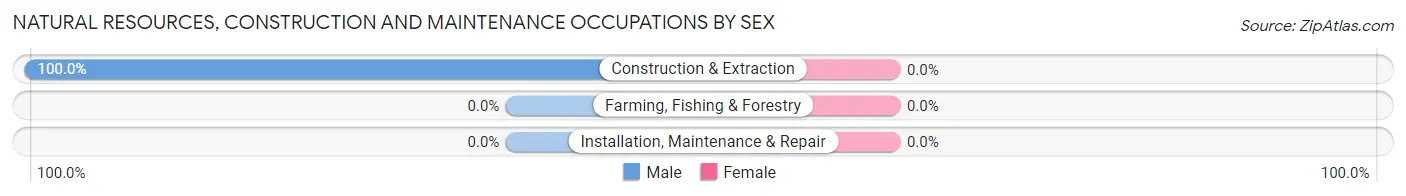
| Occupation | Male | Female |
| Farming, Fishing & Forestry | 0 (0.0%) | 0 (0.0%) |
| Construction & Extraction | 22 (100.0%) | 0 (0.0%) |
| Installation, Maintenance & Repair | 0 (0.0%) | 0 (0.0%) |
| Total (Category) | 22 (100.0%) | 0 (0.0%) |
| Total (Overall) | 122 (89.7%) | 14 (10.3%) |
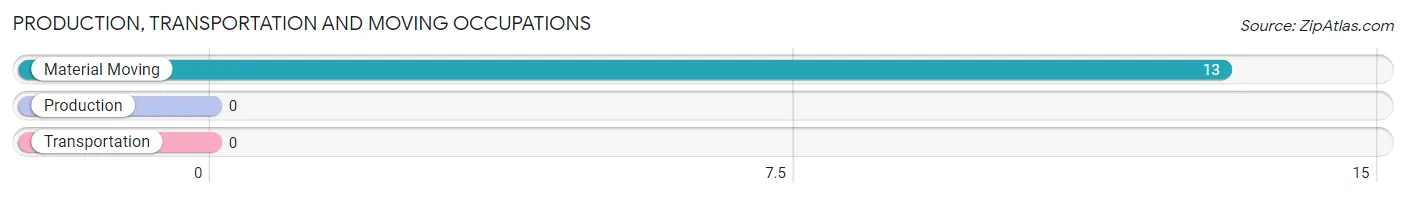
Production, Transportation and Moving Occupations
The most common Production, Transportation and Moving occupations in Pleasant Grove are , and Material Moving (13 | 9.6%).
Production, Transportation and Moving Occupations by Sex
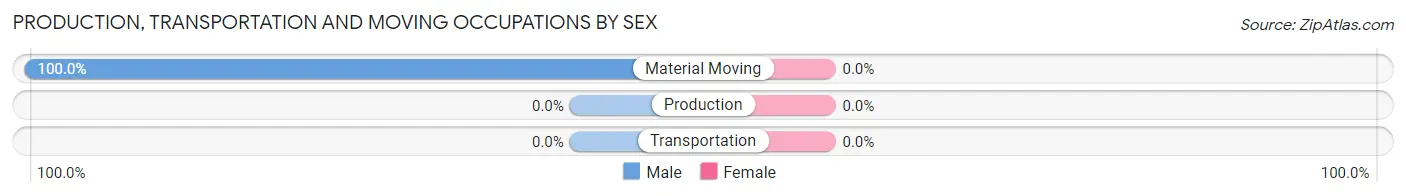
| Occupation | Male | Female |
| Production | 0 (0.0%) | 0 (0.0%) |
| Transportation | 0 (0.0%) | 0 (0.0%) |
| Material Moving | 13 (100.0%) | 0 (0.0%) |
| Total (Category) | 13 (100.0%) | 0 (0.0%) |
| Total (Overall) | 122 (89.7%) | 14 (10.3%) |
Employment Industries by Sex in Pleasant Grove
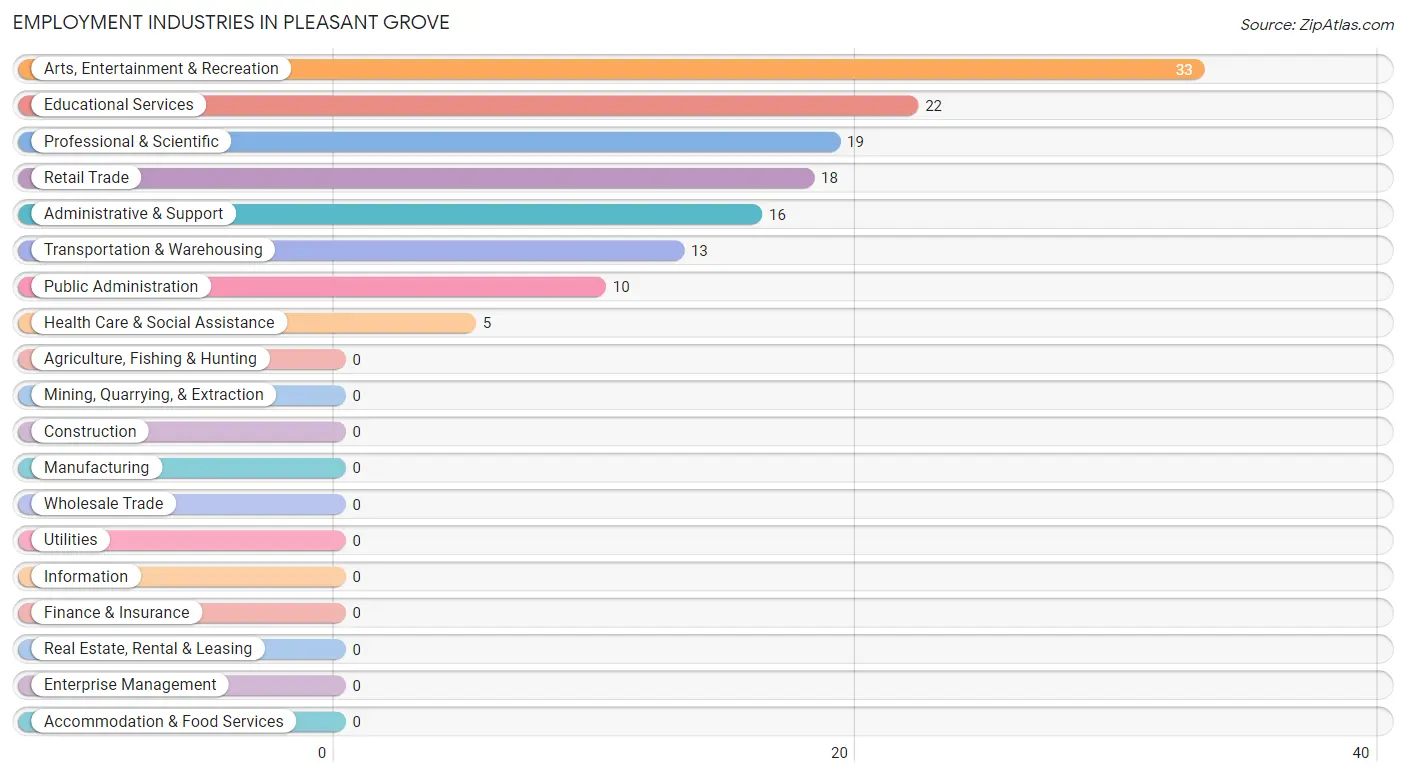
Employment Industries in Pleasant Grove
The major employment industries in Pleasant Grove include Arts, Entertainment & Recreation (33 | 24.3%), Educational Services (22 | 16.2%), Professional & Scientific (19 | 14.0%), Retail Trade (18 | 13.2%), and Administrative & Support (16 | 11.8%).
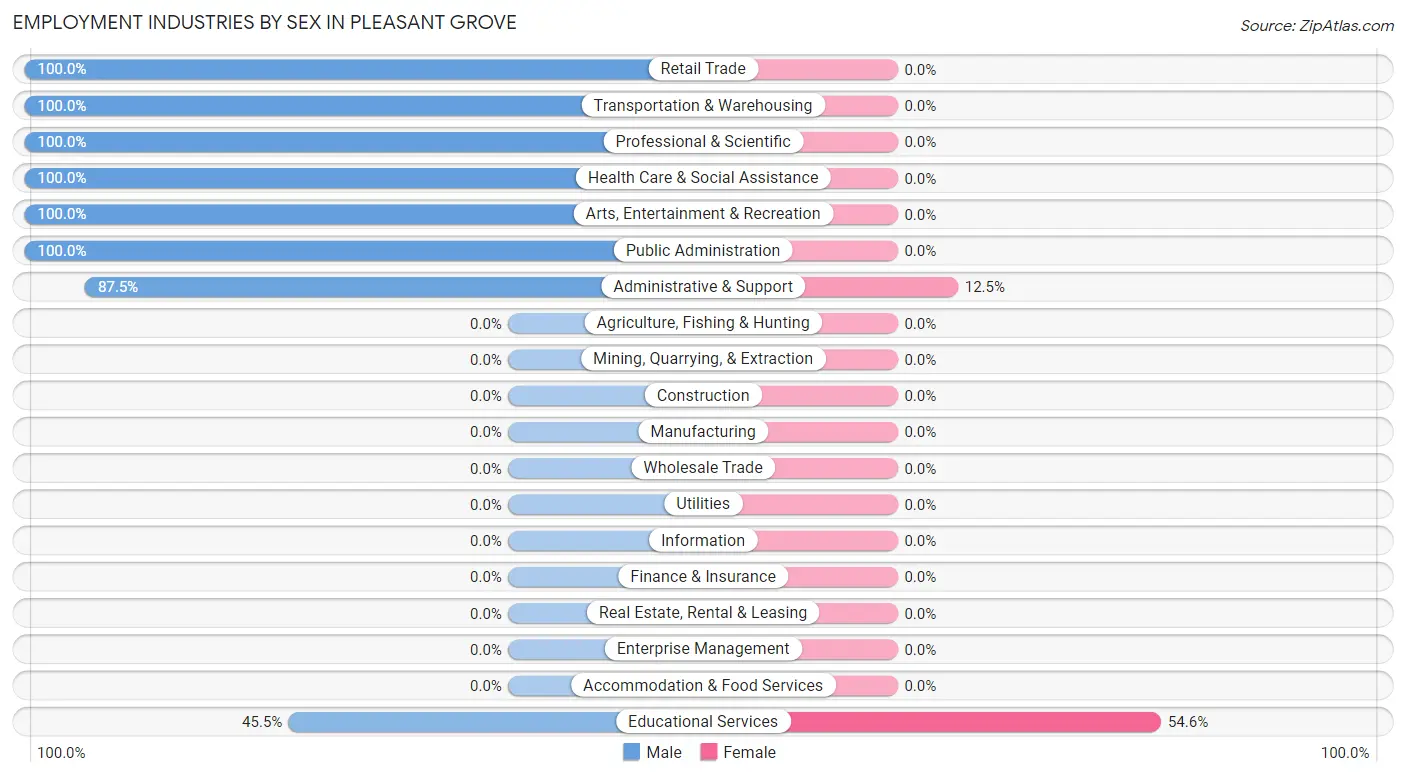
Employment Industries by Sex in Pleasant Grove
The Pleasant Grove industries that see more men than women are Retail Trade (100.0%), Transportation & Warehousing (100.0%), and Professional & Scientific (100.0%), whereas the industries that tend to have a higher number of women are Educational Services (54.5%), and Administrative & Support (12.5%).
| Industry | Male | Female |
| Agriculture, Fishing & Hunting | 0 (0.0%) | 0 (0.0%) |
| Mining, Quarrying, & Extraction | 0 (0.0%) | 0 (0.0%) |
| Construction | 0 (0.0%) | 0 (0.0%) |
| Manufacturing | 0 (0.0%) | 0 (0.0%) |
| Wholesale Trade | 0 (0.0%) | 0 (0.0%) |
| Retail Trade | 18 (100.0%) | 0 (0.0%) |
| Transportation & Warehousing | 13 (100.0%) | 0 (0.0%) |
| Utilities | 0 (0.0%) | 0 (0.0%) |
| Information | 0 (0.0%) | 0 (0.0%) |
| Finance & Insurance | 0 (0.0%) | 0 (0.0%) |
| Real Estate, Rental & Leasing | 0 (0.0%) | 0 (0.0%) |
| Professional & Scientific | 19 (100.0%) | 0 (0.0%) |
| Enterprise Management | 0 (0.0%) | 0 (0.0%) |
| Administrative & Support | 14 (87.5%) | 2 (12.5%) |
| Educational Services | 10 (45.5%) | 12 (54.5%) |
| Health Care & Social Assistance | 5 (100.0%) | 0 (0.0%) |
| Arts, Entertainment & Recreation | 33 (100.0%) | 0 (0.0%) |
| Accommodation & Food Services | 0 (0.0%) | 0 (0.0%) |
| Public Administration | 10 (100.0%) | 0 (0.0%) |
| Total | 122 (89.7%) | 14 (10.3%) |
Education in Pleasant Grove
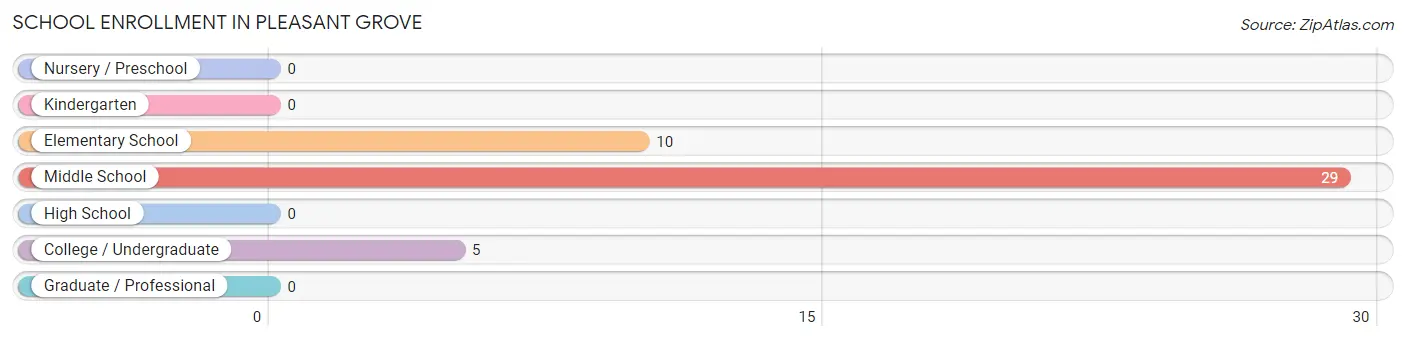
School Enrollment in Pleasant Grove
The most common levels of schooling among the 44 students in Pleasant Grove are middle school (29 | 65.9%), elementary school (10 | 22.7%), and college / undergraduate (5 | 11.4%).
| School Level | # Students | % Students |
| Nursery / Preschool | 0 | 0.0% |
| Kindergarten | 0 | 0.0% |
| Elementary School | 10 | 22.7% |
| Middle School | 29 | 65.9% |
| High School | 0 | 0.0% |
| College / Undergraduate | 5 | 11.4% |
| Graduate / Professional | 0 | 0.0% |
| Total | 44 | 100.0% |
School Enrollment by Age by Funding Source in Pleasant Grove
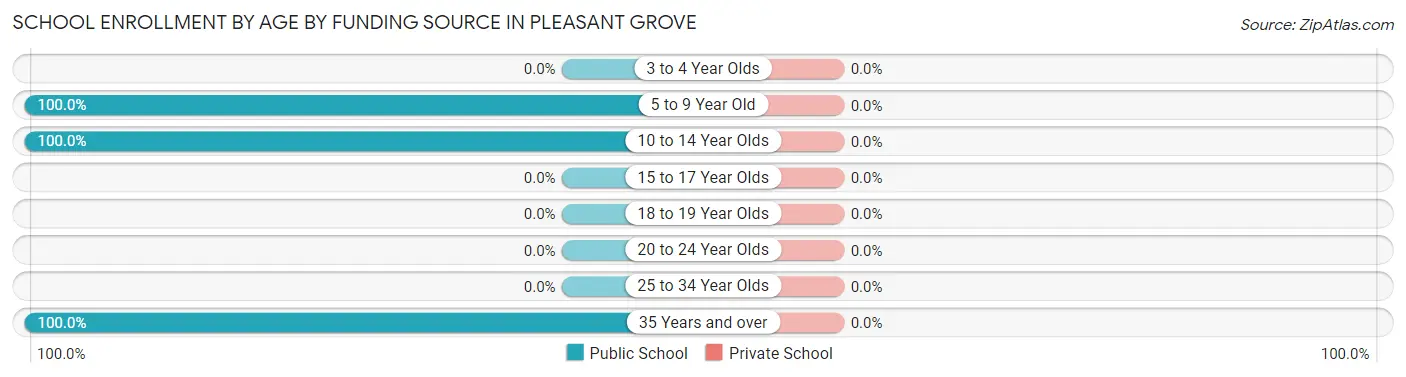
| Age Bracket | Public School | Private School |
| 3 to 4 Year Olds | 0 (0.0%) | 0 (0.0%) |
| 5 to 9 Year Old | 10 (100.0%) | 0 (0.0%) |
| 10 to 14 Year Olds | 29 (100.0%) | 0 (0.0%) |
| 15 to 17 Year Olds | 0 (0.0%) | 0 (0.0%) |
| 18 to 19 Year Olds | 0 (0.0%) | 0 (0.0%) |
| 20 to 24 Year Olds | 0 (0.0%) | 0 (0.0%) |
| 25 to 34 Year Olds | 0 (0.0%) | 0 (0.0%) |
| 35 Years and over | 5 (100.0%) | 0 (0.0%) |
| Total | 44 (100.0%) | 0 (0.0%) |
Educational Attainment by Field of Study in Pleasant Grove
Science & technology (20 | 42.5%), arts & humanities (13 | 27.7%), education (10 | 21.3%), and liberal arts & history (4 | 8.5%) are the most common fields of study among 47 individuals in Pleasant Grove who have obtained a bachelor's degree or higher.
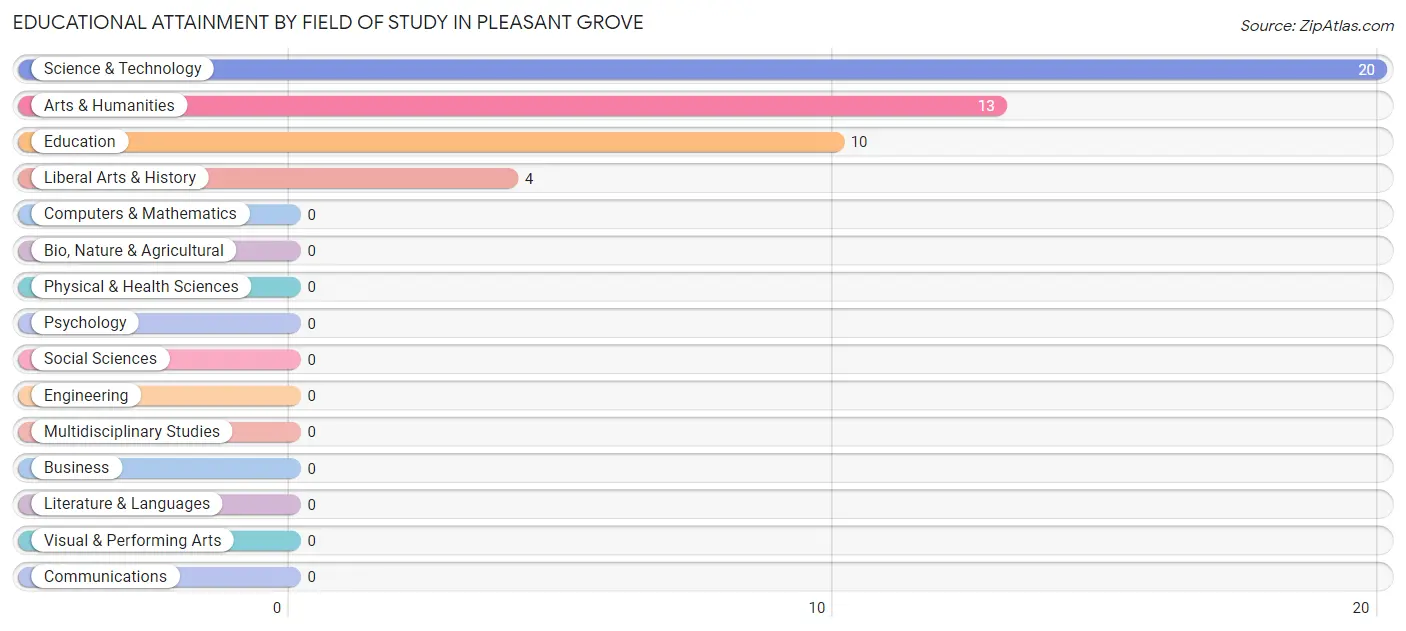
| Field of Study | # Graduates | % Graduates |
| Computers & Mathematics | 0 | 0.0% |
| Bio, Nature & Agricultural | 0 | 0.0% |
| Physical & Health Sciences | 0 | 0.0% |
| Psychology | 0 | 0.0% |
| Social Sciences | 0 | 0.0% |
| Engineering | 0 | 0.0% |
| Multidisciplinary Studies | 0 | 0.0% |
| Science & Technology | 20 | 42.5% |
| Business | 0 | 0.0% |
| Education | 10 | 21.3% |
| Literature & Languages | 0 | 0.0% |
| Liberal Arts & History | 4 | 8.5% |
| Visual & Performing Arts | 0 | 0.0% |
| Communications | 0 | 0.0% |
| Arts & Humanities | 13 | 27.7% |
| Total | 47 | 100.0% |
Transportation & Commute in Pleasant Grove
Vehicle Availability by Sex in Pleasant Grove
The most prevalent vehicle ownership categories in Pleasant Grove are males with 1 vehicle (58, accounting for 47.5%) and females with 1 vehicle (0, making up 414.3%).
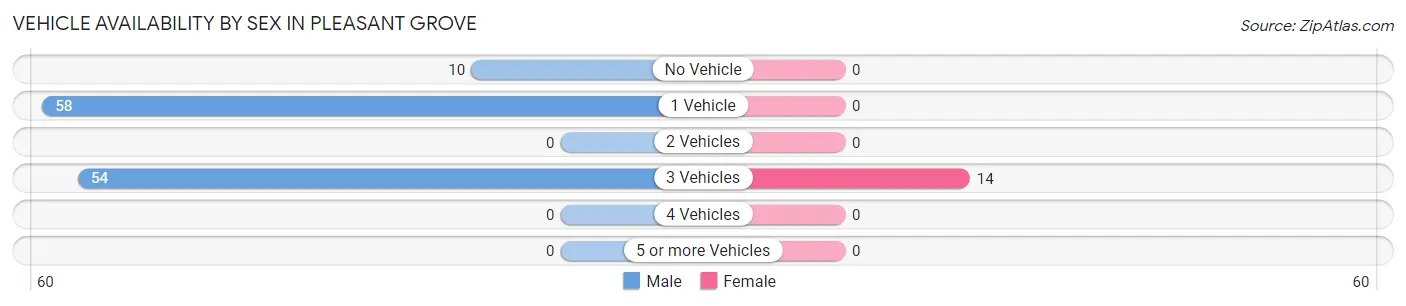
| Vehicles Available | Male | Female |
| No Vehicle | 10 (8.2%) | 0 (0.0%) |
| 1 Vehicle | 58 (47.5%) | 0 (0.0%) |
| 2 Vehicles | 0 (0.0%) | 0 (0.0%) |
| 3 Vehicles | 54 (44.3%) | 14 (100.0%) |
| 4 Vehicles | 0 (0.0%) | 0 (0.0%) |
| 5 or more Vehicles | 0 (0.0%) | 0 (0.0%) |
| Total | 122 (100.0%) | 14 (100.0%) |
Commute Time in Pleasant Grove
The most frequently occuring commute durations in Pleasant Grove are 15 to 19 minutes (47 commuters, 34.6%), 5 to 9 minutes (33 commuters, 24.3%), and 10 to 14 minutes (24 commuters, 17.6%).
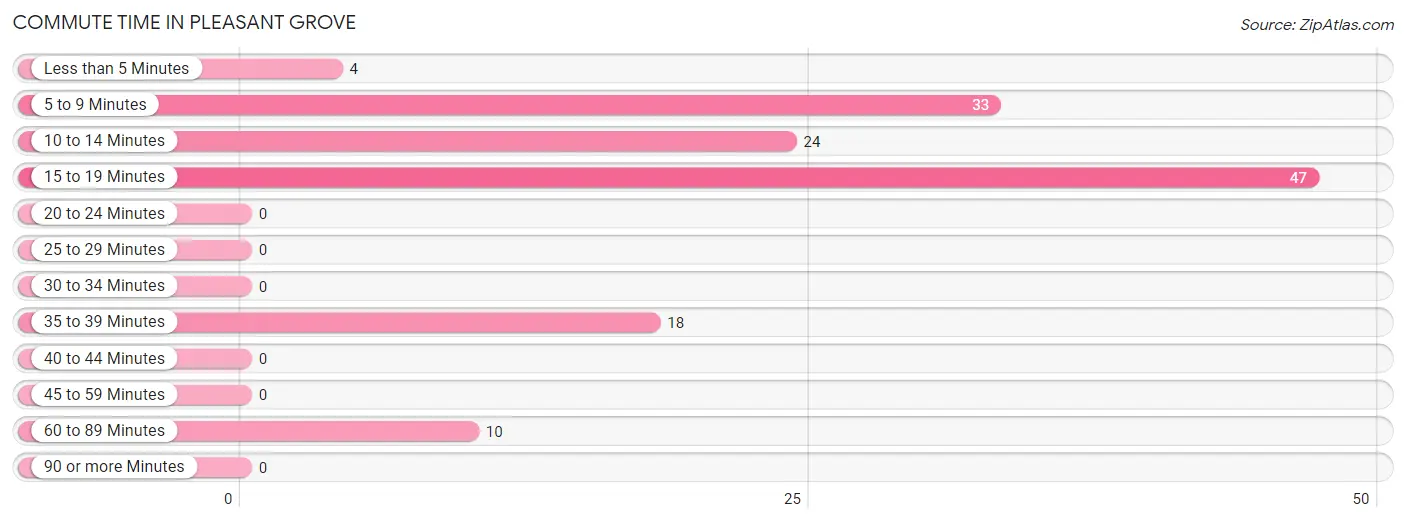
| Commute Time | # Commuters | % Commuters |
| Less than 5 Minutes | 4 | 2.9% |
| 5 to 9 Minutes | 33 | 24.3% |
| 10 to 14 Minutes | 24 | 17.6% |
| 15 to 19 Minutes | 47 | 34.6% |
| 20 to 24 Minutes | 0 | 0.0% |
| 25 to 29 Minutes | 0 | 0.0% |
| 30 to 34 Minutes | 0 | 0.0% |
| 35 to 39 Minutes | 18 | 13.2% |
| 40 to 44 Minutes | 0 | 0.0% |
| 45 to 59 Minutes | 0 | 0.0% |
| 60 to 89 Minutes | 10 | 7.3% |
| 90 or more Minutes | 0 | 0.0% |
Commute Time by Sex in Pleasant Grove
The most common commute times in Pleasant Grove are 15 to 19 minutes (37 commuters, 30.3%) for males and 15 to 19 minutes (10 commuters, 71.4%) for females.
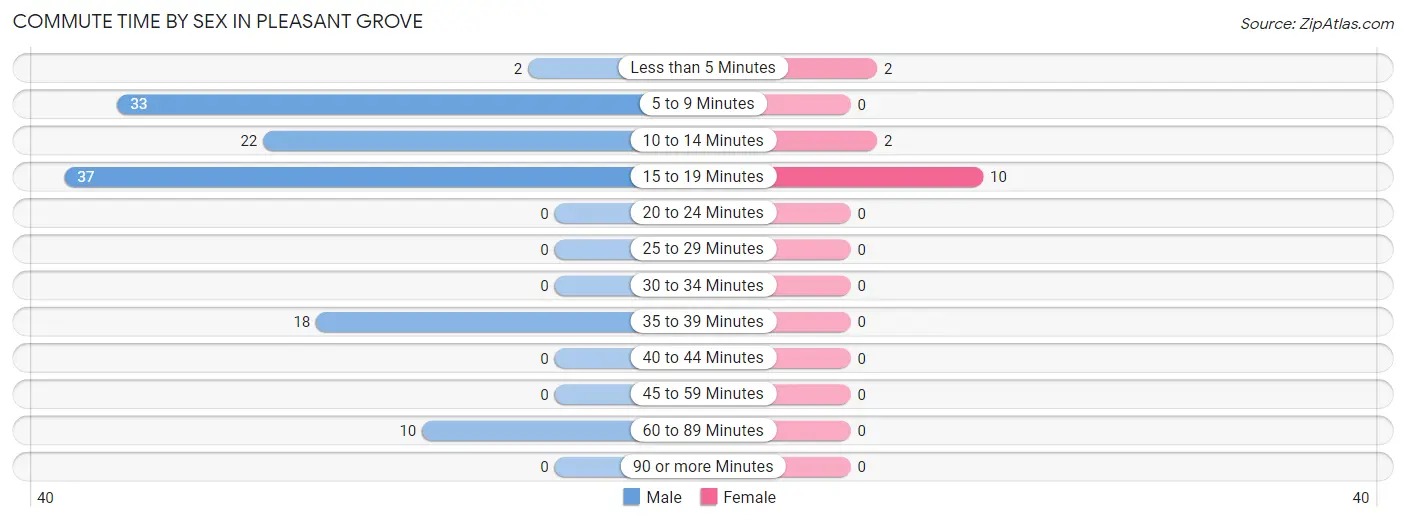
| Commute Time | Male | Female |
| Less than 5 Minutes | 2 (1.6%) | 2 (14.3%) |
| 5 to 9 Minutes | 33 (27.1%) | 0 (0.0%) |
| 10 to 14 Minutes | 22 (18.0%) | 2 (14.3%) |
| 15 to 19 Minutes | 37 (30.3%) | 10 (71.4%) |
| 20 to 24 Minutes | 0 (0.0%) | 0 (0.0%) |
| 25 to 29 Minutes | 0 (0.0%) | 0 (0.0%) |
| 30 to 34 Minutes | 0 (0.0%) | 0 (0.0%) |
| 35 to 39 Minutes | 18 (14.7%) | 0 (0.0%) |
| 40 to 44 Minutes | 0 (0.0%) | 0 (0.0%) |
| 45 to 59 Minutes | 0 (0.0%) | 0 (0.0%) |
| 60 to 89 Minutes | 10 (8.2%) | 0 (0.0%) |
| 90 or more Minutes | 0 (0.0%) | 0 (0.0%) |
Time of Departure to Work by Sex in Pleasant Grove
The most frequent times of departure to work in Pleasant Grove are 5:00 AM to 5:29 AM (33, 27.1%) for males and 7:30 AM to 7:59 AM (10, 71.4%) for females.
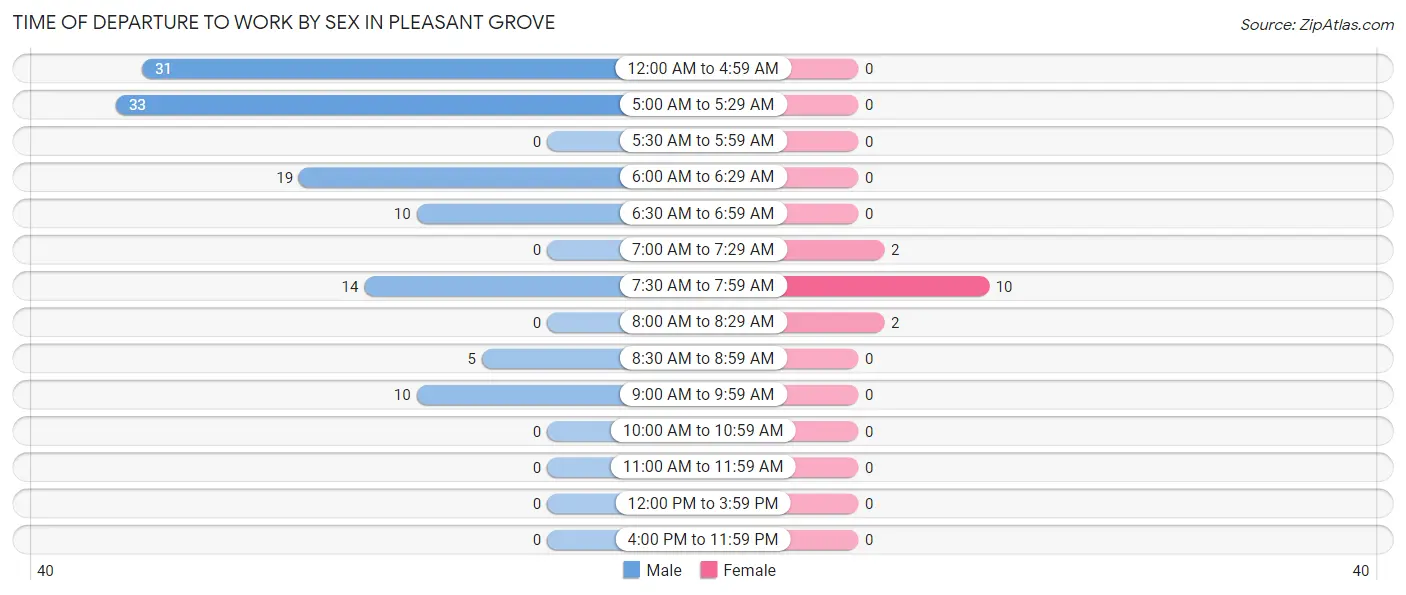
| Time of Departure | Male | Female |
| 12:00 AM to 4:59 AM | 31 (25.4%) | 0 (0.0%) |
| 5:00 AM to 5:29 AM | 33 (27.1%) | 0 (0.0%) |
| 5:30 AM to 5:59 AM | 0 (0.0%) | 0 (0.0%) |
| 6:00 AM to 6:29 AM | 19 (15.6%) | 0 (0.0%) |
| 6:30 AM to 6:59 AM | 10 (8.2%) | 0 (0.0%) |
| 7:00 AM to 7:29 AM | 0 (0.0%) | 2 (14.3%) |
| 7:30 AM to 7:59 AM | 14 (11.5%) | 10 (71.4%) |
| 8:00 AM to 8:29 AM | 0 (0.0%) | 2 (14.3%) |
| 8:30 AM to 8:59 AM | 5 (4.1%) | 0 (0.0%) |
| 9:00 AM to 9:59 AM | 10 (8.2%) | 0 (0.0%) |
| 10:00 AM to 10:59 AM | 0 (0.0%) | 0 (0.0%) |
| 11:00 AM to 11:59 AM | 0 (0.0%) | 0 (0.0%) |
| 12:00 PM to 3:59 PM | 0 (0.0%) | 0 (0.0%) |
| 4:00 PM to 11:59 PM | 0 (0.0%) | 0 (0.0%) |
| Total | 122 (100.0%) | 14 (100.0%) |
Housing Occupancy in Pleasant Grove
Occupancy by Ownership in Pleasant Grove
Of the total 166 dwellings in Pleasant Grove, owner-occupied units account for 121 (72.9%), while renter-occupied units make up 45 (27.1%).
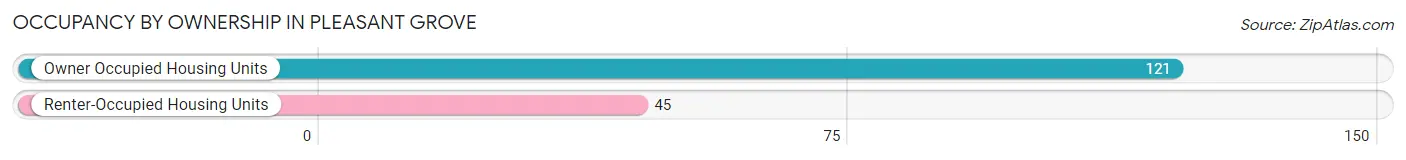
| Occupancy | # Housing Units | % Housing Units |
| Owner Occupied Housing Units | 121 | 72.9% |
| Renter-Occupied Housing Units | 45 | 27.1% |
| Total Occupied Housing Units | 166 | 100.0% |
Occupancy by Household Size in Pleasant Grove
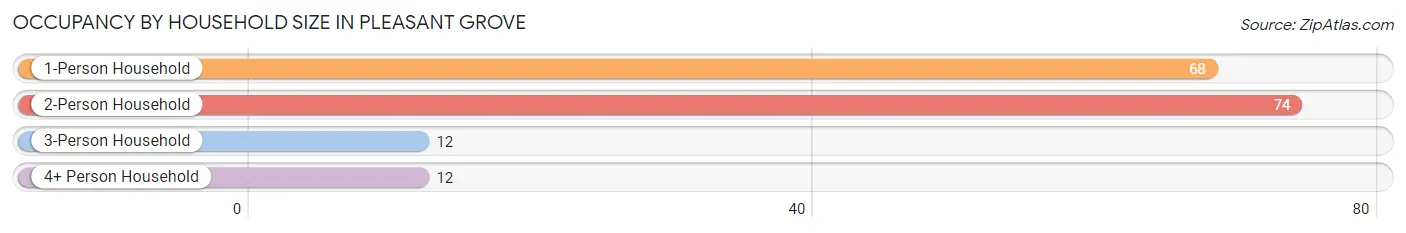
| Household Size | # Housing Units | % Housing Units |
| 1-Person Household | 68 | 41.0% |
| 2-Person Household | 74 | 44.6% |
| 3-Person Household | 12 | 7.2% |
| 4+ Person Household | 12 | 7.2% |
| Total Housing Units | 166 | 100.0% |
Occupancy by Ownership by Household Size in Pleasant Grove
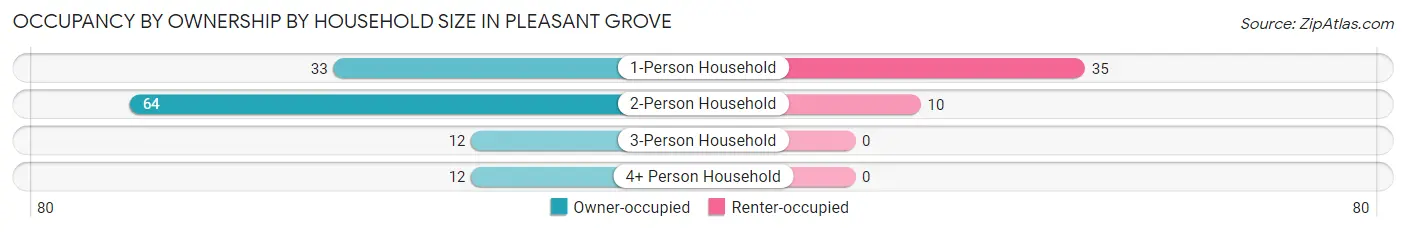
| Household Size | Owner-occupied | Renter-occupied |
| 1-Person Household | 33 (48.5%) | 35 (51.5%) |
| 2-Person Household | 64 (86.5%) | 10 (13.5%) |
| 3-Person Household | 12 (100.0%) | 0 (0.0%) |
| 4+ Person Household | 12 (100.0%) | 0 (0.0%) |
| Total Housing Units | 121 (72.9%) | 45 (27.1%) |
Occupancy by Educational Attainment in Pleasant Grove
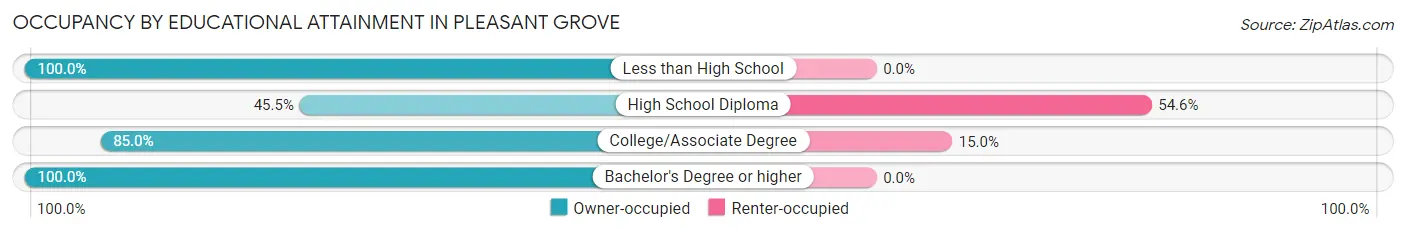
| Household Size | Owner-occupied | Renter-occupied |
| Less than High School | 18 (100.0%) | 0 (0.0%) |
| High School Diploma | 30 (45.5%) | 36 (54.5%) |
| College/Associate Degree | 51 (85.0%) | 9 (15.0%) |
| Bachelor's Degree or higher | 22 (100.0%) | 0 (0.0%) |
Occupancy by Age of Householder in Pleasant Grove
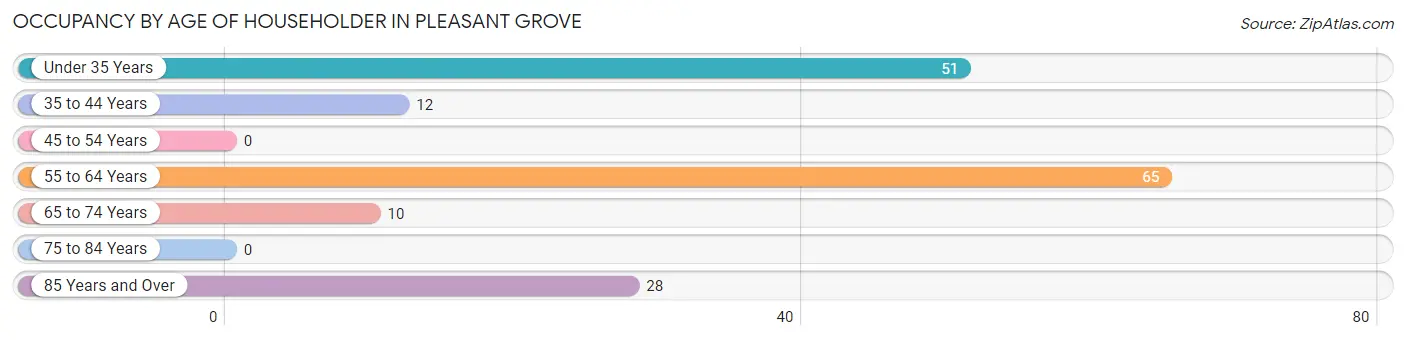
| Age Bracket | # Households | % Households |
| Under 35 Years | 51 | 30.7% |
| 35 to 44 Years | 12 | 7.2% |
| 45 to 54 Years | 0 | 0.0% |
| 55 to 64 Years | 65 | 39.2% |
| 65 to 74 Years | 10 | 6.0% |
| 75 to 84 Years | 0 | 0.0% |
| 85 Years and Over | 28 | 16.9% |
| Total | 166 | 100.0% |
Housing Finances in Pleasant Grove
Median Income by Occupancy in Pleasant Grove
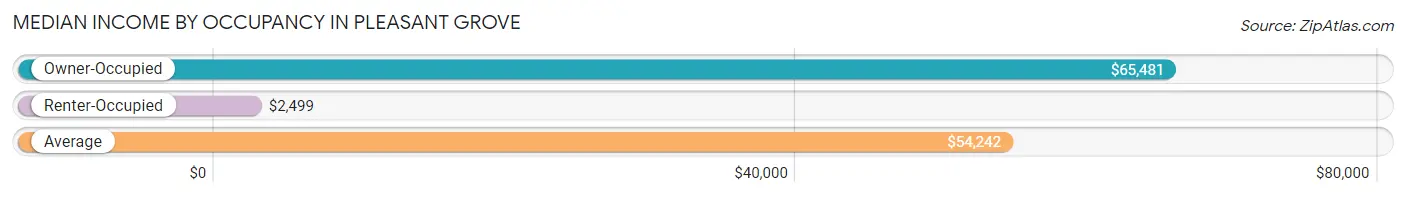
| Occupancy Type | # Households | Median Income |
| Owner-Occupied | 121 (72.9%) | $65,481 |
| Renter-Occupied | 45 (27.1%) | $2,499 |
| Average | 166 (100.0%) | $54,242 |
Occupancy by Householder Income Bracket in Pleasant Grove
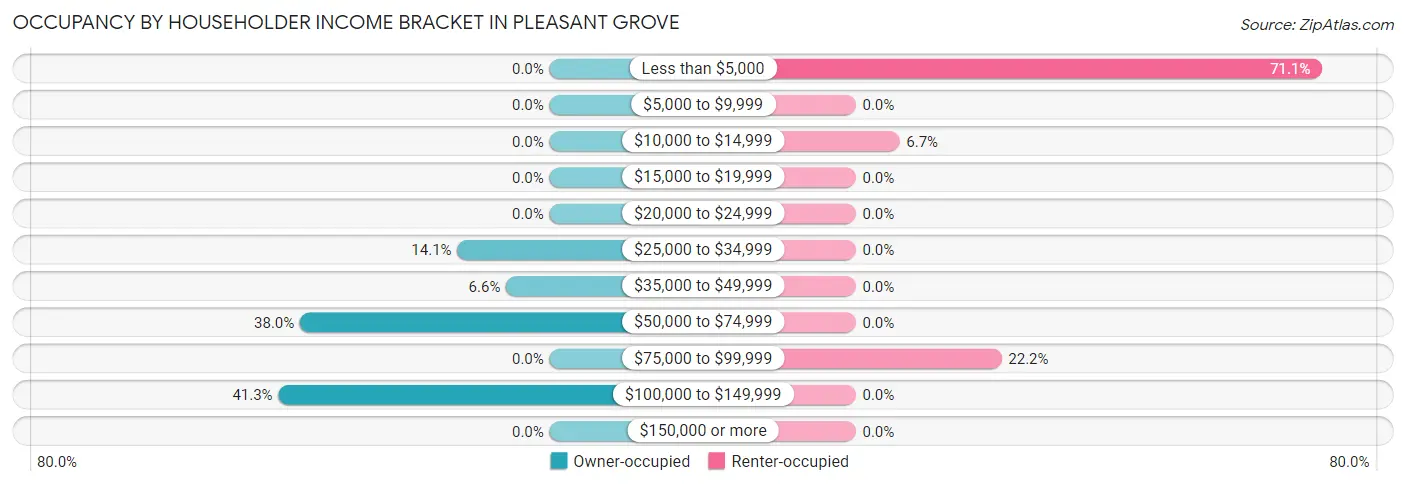
| Income Bracket | Owner-occupied | Renter-occupied |
| Less than $5,000 | 0 (0.0%) | 32 (71.1%) |
| $5,000 to $9,999 | 0 (0.0%) | 0 (0.0%) |
| $10,000 to $14,999 | 0 (0.0%) | 3 (6.7%) |
| $15,000 to $19,999 | 0 (0.0%) | 0 (0.0%) |
| $20,000 to $24,999 | 0 (0.0%) | 0 (0.0%) |
| $25,000 to $34,999 | 17 (14.1%) | 0 (0.0%) |
| $35,000 to $49,999 | 8 (6.6%) | 0 (0.0%) |
| $50,000 to $74,999 | 46 (38.0%) | 0 (0.0%) |
| $75,000 to $99,999 | 0 (0.0%) | 10 (22.2%) |
| $100,000 to $149,999 | 50 (41.3%) | 0 (0.0%) |
| $150,000 or more | 0 (0.0%) | 0 (0.0%) |
| Total | 121 (100.0%) | 45 (100.0%) |
Monthly Housing Cost Tiers in Pleasant Grove
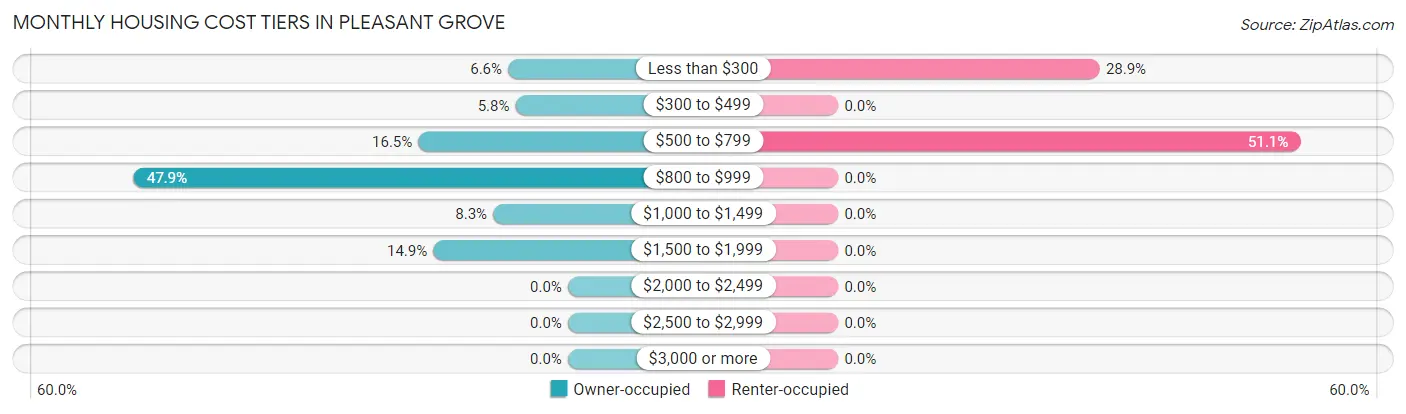
| Monthly Cost | Owner-occupied | Renter-occupied |
| Less than $300 | 8 (6.6%) | 13 (28.9%) |
| $300 to $499 | 7 (5.8%) | 0 (0.0%) |
| $500 to $799 | 20 (16.5%) | 23 (51.1%) |
| $800 to $999 | 58 (47.9%) | 0 (0.0%) |
| $1,000 to $1,499 | 10 (8.3%) | 0 (0.0%) |
| $1,500 to $1,999 | 18 (14.9%) | 0 (0.0%) |
| $2,000 to $2,499 | 0 (0.0%) | 0 (0.0%) |
| $2,500 to $2,999 | 0 (0.0%) | 0 (0.0%) |
| $3,000 or more | 0 (0.0%) | 0 (0.0%) |
| Total | 121 (100.0%) | 45 (100.0%) |
Physical Housing Characteristics in Pleasant Grove
Housing Structures in Pleasant Grove
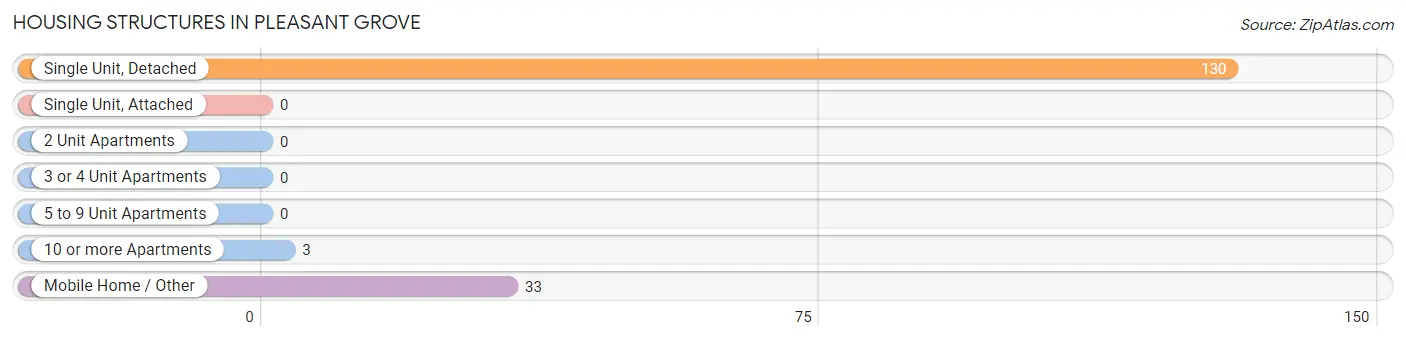
| Structure Type | # Housing Units | % Housing Units |
| Single Unit, Detached | 130 | 78.3% |
| Single Unit, Attached | 0 | 0.0% |
| 2 Unit Apartments | 0 | 0.0% |
| 3 or 4 Unit Apartments | 0 | 0.0% |
| 5 to 9 Unit Apartments | 0 | 0.0% |
| 10 or more Apartments | 3 | 1.8% |
| Mobile Home / Other | 33 | 19.9% |
| Total | 166 | 100.0% |
Housing Structures by Occupancy in Pleasant Grove
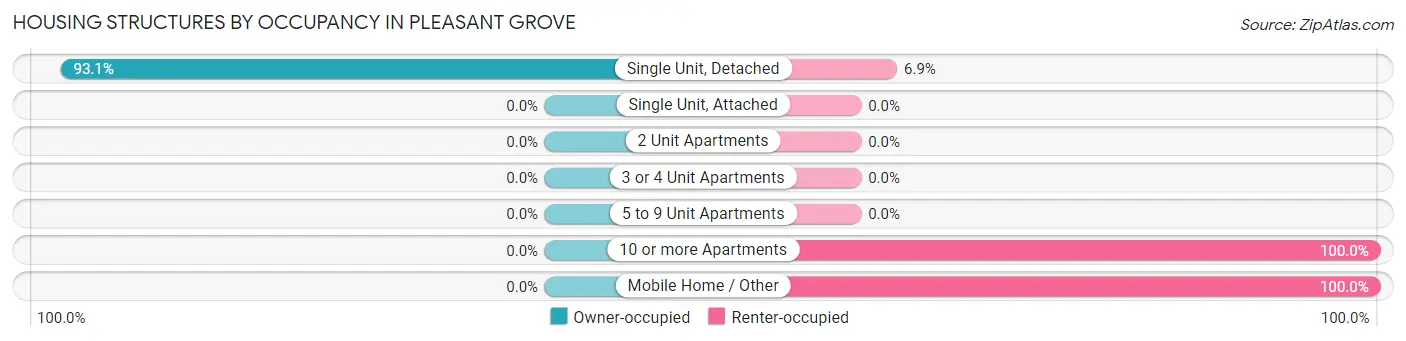
| Structure Type | Owner-occupied | Renter-occupied |
| Single Unit, Detached | 121 (93.1%) | 9 (6.9%) |
| Single Unit, Attached | 0 (0.0%) | 0 (0.0%) |
| 2 Unit Apartments | 0 (0.0%) | 0 (0.0%) |
| 3 or 4 Unit Apartments | 0 (0.0%) | 0 (0.0%) |
| 5 to 9 Unit Apartments | 0 (0.0%) | 0 (0.0%) |
| 10 or more Apartments | 0 (0.0%) | 3 (100.0%) |
| Mobile Home / Other | 0 (0.0%) | 33 (100.0%) |
| Total | 121 (72.9%) | 45 (27.1%) |
Housing Structures by Number of Rooms in Pleasant Grove
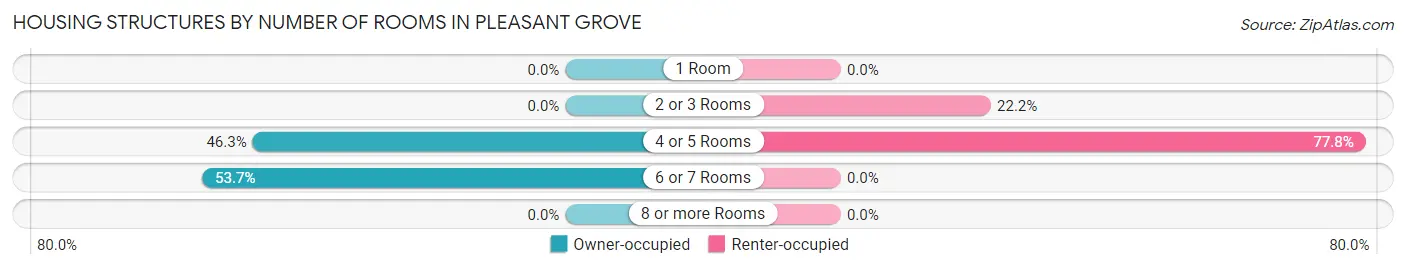
| Number of Rooms | Owner-occupied | Renter-occupied |
| 1 Room | 0 (0.0%) | 0 (0.0%) |
| 2 or 3 Rooms | 0 (0.0%) | 10 (22.2%) |
| 4 or 5 Rooms | 56 (46.3%) | 35 (77.8%) |
| 6 or 7 Rooms | 65 (53.7%) | 0 (0.0%) |
| 8 or more Rooms | 0 (0.0%) | 0 (0.0%) |
| Total | 121 (100.0%) | 45 (100.0%) |
Housing Structure by Heating Type in Pleasant Grove
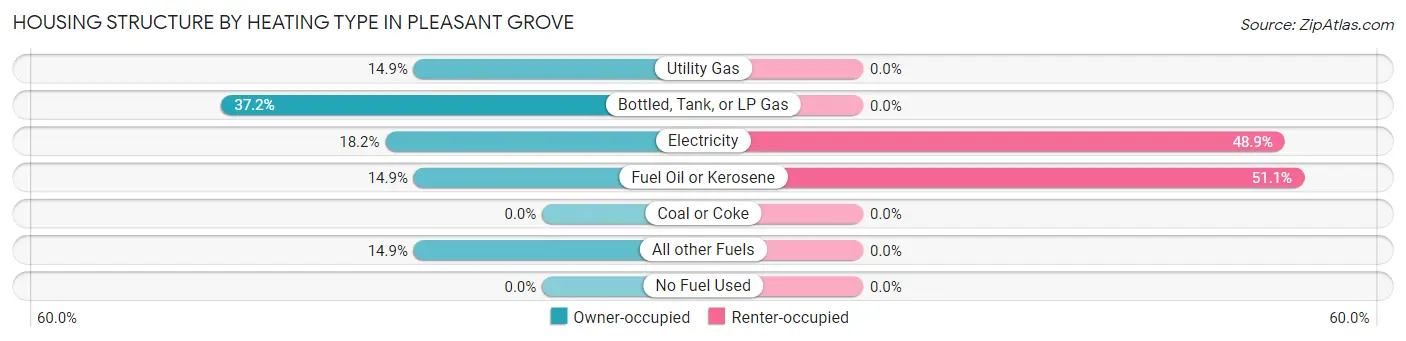
| Heating Type | Owner-occupied | Renter-occupied |
| Utility Gas | 18 (14.9%) | 0 (0.0%) |
| Bottled, Tank, or LP Gas | 45 (37.2%) | 0 (0.0%) |
| Electricity | 22 (18.2%) | 22 (48.9%) |
| Fuel Oil or Kerosene | 18 (14.9%) | 23 (51.1%) |
| Coal or Coke | 0 (0.0%) | 0 (0.0%) |
| All other Fuels | 18 (14.9%) | 0 (0.0%) |
| No Fuel Used | 0 (0.0%) | 0 (0.0%) |
| Total | 121 (100.0%) | 45 (100.0%) |
Household Vehicle Usage in Pleasant Grove
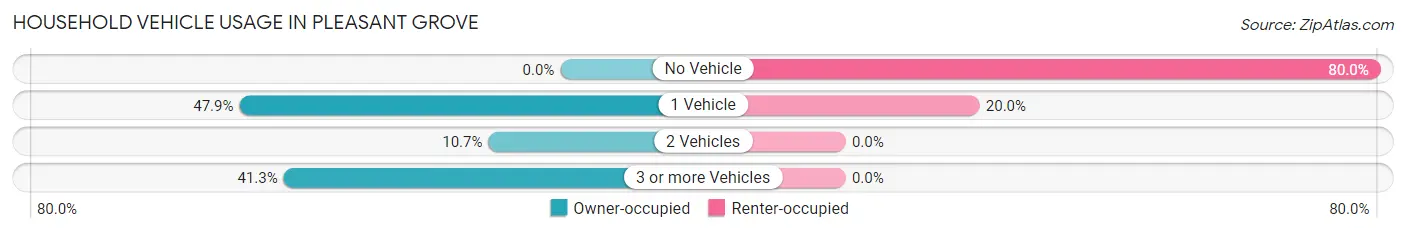
| Vehicles per Household | Owner-occupied | Renter-occupied |
| No Vehicle | 0 (0.0%) | 36 (80.0%) |
| 1 Vehicle | 58 (47.9%) | 9 (20.0%) |
| 2 Vehicles | 13 (10.7%) | 0 (0.0%) |
| 3 or more Vehicles | 50 (41.3%) | 0 (0.0%) |
| Total | 121 (100.0%) | 45 (100.0%) |
Real Estate & Mortgages in Pleasant Grove
Real Estate and Mortgage Overview in Pleasant Grove
| Characteristic | Without Mortgage | With Mortgage |
| Housing Units | 15 | 106 |
| Median Property Value | $89,400 | $115,400 |
| Median Household Income | $45,781 | $0 |
| Monthly Housing Costs | $297 | $0 |
| Real Estate Taxes | $988 | $0 |
Property Value by Mortgage Status in Pleasant Grove
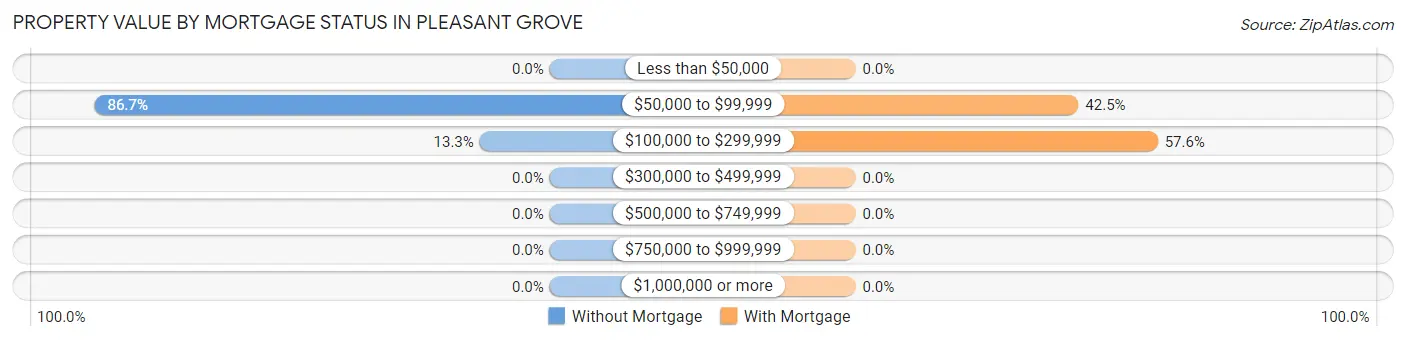
| Property Value | Without Mortgage | With Mortgage |
| Less than $50,000 | 0 (0.0%) | 0 (0.0%) |
| $50,000 to $99,999 | 13 (86.7%) | 45 (42.4%) |
| $100,000 to $299,999 | 2 (13.3%) | 61 (57.6%) |
| $300,000 to $499,999 | 0 (0.0%) | 0 (0.0%) |
| $500,000 to $749,999 | 0 (0.0%) | 0 (0.0%) |
| $750,000 to $999,999 | 0 (0.0%) | 0 (0.0%) |
| $1,000,000 or more | 0 (0.0%) | 0 (0.0%) |
| Total | 15 (100.0%) | 106 (100.0%) |
Household Income by Mortgage Status in Pleasant Grove
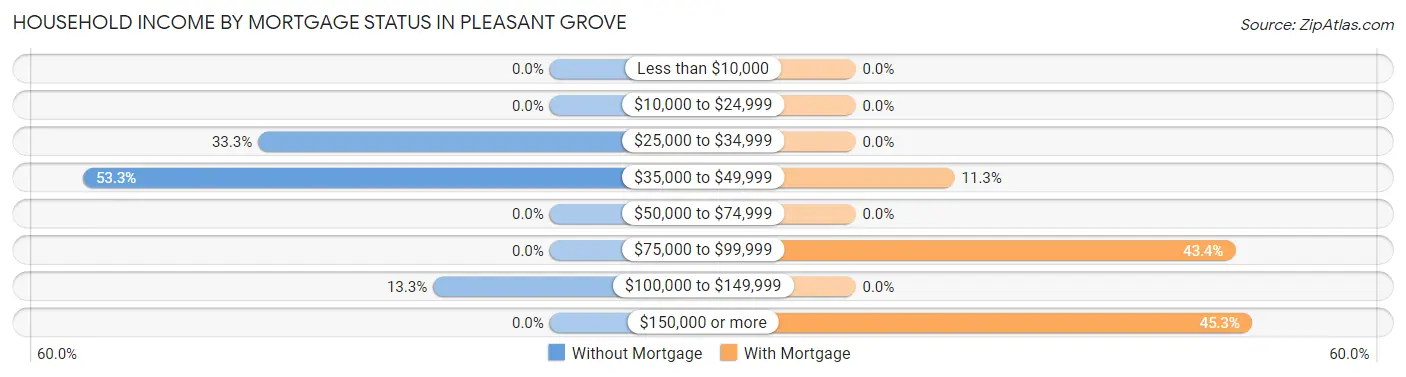
| Household Income | Without Mortgage | With Mortgage |
| Less than $10,000 | 0 (0.0%) | 0 (0.0%) |
| $10,000 to $24,999 | 0 (0.0%) | 0 (0.0%) |
| $25,000 to $34,999 | 5 (33.3%) | 0 (0.0%) |
| $35,000 to $49,999 | 8 (53.3%) | 12 (11.3%) |
| $50,000 to $74,999 | 0 (0.0%) | 0 (0.0%) |
| $75,000 to $99,999 | 0 (0.0%) | 46 (43.4%) |
| $100,000 to $149,999 | 2 (13.3%) | 0 (0.0%) |
| $150,000 or more | 0 (0.0%) | 48 (45.3%) |
| Total | 15 (100.0%) | 106 (100.0%) |
Property Value to Household Income Ratio in Pleasant Grove
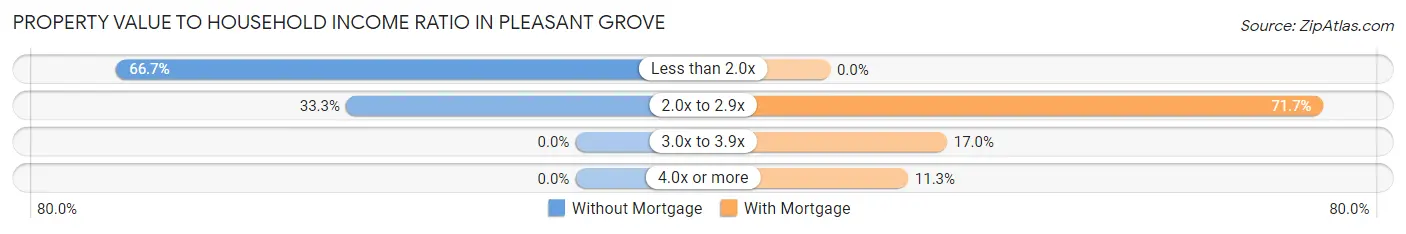
| Value-to-Income Ratio | Without Mortgage | With Mortgage |
| Less than 2.0x | 10 (66.7%) | 0 (0.0%) |
| 2.0x to 2.9x | 5 (33.3%) | 76 (71.7%) |
| 3.0x to 3.9x | 0 (0.0%) | 18 (17.0%) |
| 4.0x or more | 0 (0.0%) | 12 (11.3%) |
| Total | 15 (100.0%) | 106 (100.0%) |
Real Estate Taxes by Mortgage Status in Pleasant Grove
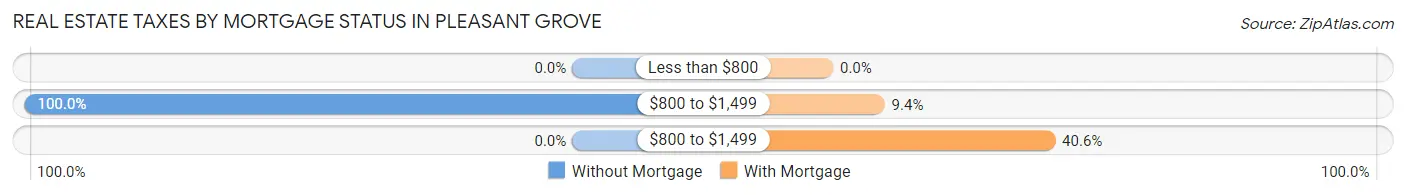
| Property Taxes | Without Mortgage | With Mortgage |
| Less than $800 | 0 (0.0%) | 0 (0.0%) |
| $800 to $1,499 | 15 (100.0%) | 10 (9.4%) |
| $800 to $1,499 | 0 (0.0%) | 43 (40.6%) |
| Total | 15 (100.0%) | 106 (100.0%) |
Health & Disability in Pleasant Grove
Health Insurance Coverage by Age in Pleasant Grove
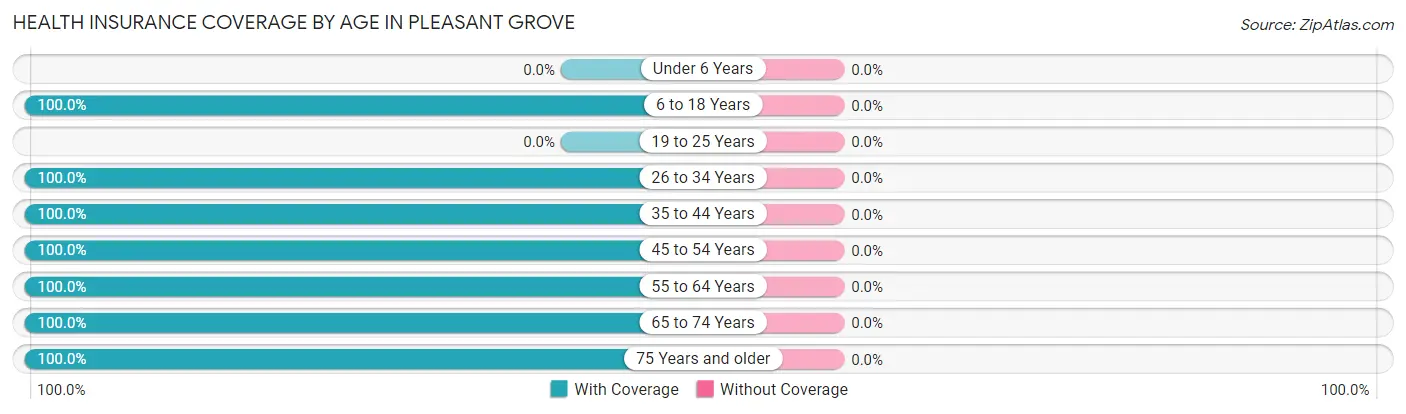
| Age Bracket | With Coverage | Without Coverage |
| Under 6 Years | 0 (0.0%) | 0 (0.0%) |
| 6 to 18 Years | 39 (100.0%) | 0 (0.0%) |
| 19 to 25 Years | 0 (0.0%) | 0 (0.0%) |
| 26 to 34 Years | 60 (100.0%) | 0 (0.0%) |
| 35 to 44 Years | 29 (100.0%) | 0 (0.0%) |
| 45 to 54 Years | 10 (100.0%) | 0 (0.0%) |
| 55 to 64 Years | 78 (100.0%) | 0 (0.0%) |
| 65 to 74 Years | 37 (100.0%) | 0 (0.0%) |
| 75 Years and older | 34 (100.0%) | 0 (0.0%) |
| Total | 287 (100.0%) | 0 (0.0%) |
Health Insurance Coverage by Citizenship Status in Pleasant Grove
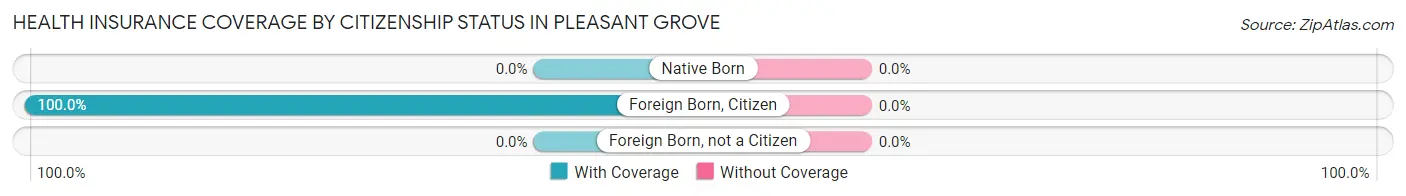
| Citizenship Status | With Coverage | Without Coverage |
| Native Born | 0 (0.0%) | 0 (0.0%) |
| Foreign Born, Citizen | 39 (100.0%) | 0 (0.0%) |
| Foreign Born, not a Citizen | 0 (0.0%) | 0 (0.0%) |
Health Insurance Coverage by Household Income in Pleasant Grove
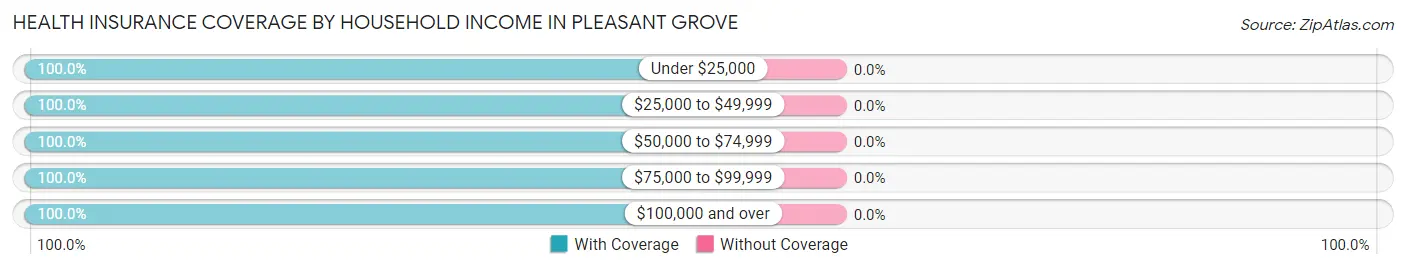
| Household Income | With Coverage | Without Coverage |
| Under $25,000 | 35 (100.0%) | 0 (0.0%) |
| $25,000 to $49,999 | 77 (100.0%) | 0 (0.0%) |
| $50,000 to $74,999 | 59 (100.0%) | 0 (0.0%) |
| $75,000 to $99,999 | 19 (100.0%) | 0 (0.0%) |
| $100,000 and over | 97 (100.0%) | 0 (0.0%) |
Public vs Private Health Insurance Coverage by Age in Pleasant Grove
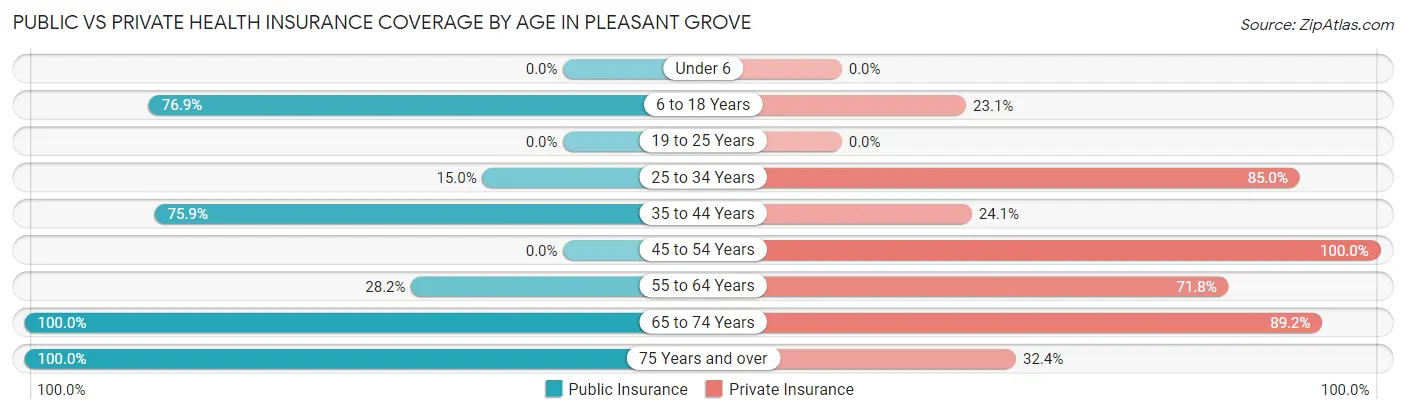
| Age Bracket | Public Insurance | Private Insurance |
| Under 6 | 0 (0.0%) | 0 (0.0%) |
| 6 to 18 Years | 30 (76.9%) | 9 (23.1%) |
| 19 to 25 Years | 0 (0.0%) | 0 (0.0%) |
| 25 to 34 Years | 9 (15.0%) | 51 (85.0%) |
| 35 to 44 Years | 22 (75.9%) | 7 (24.1%) |
| 45 to 54 Years | 0 (0.0%) | 10 (100.0%) |
| 55 to 64 Years | 22 (28.2%) | 56 (71.8%) |
| 65 to 74 Years | 37 (100.0%) | 33 (89.2%) |
| 75 Years and over | 34 (100.0%) | 11 (32.4%) |
| Total | 154 (53.7%) | 177 (61.7%) |
Disability Status by Sex by Age in Pleasant Grove
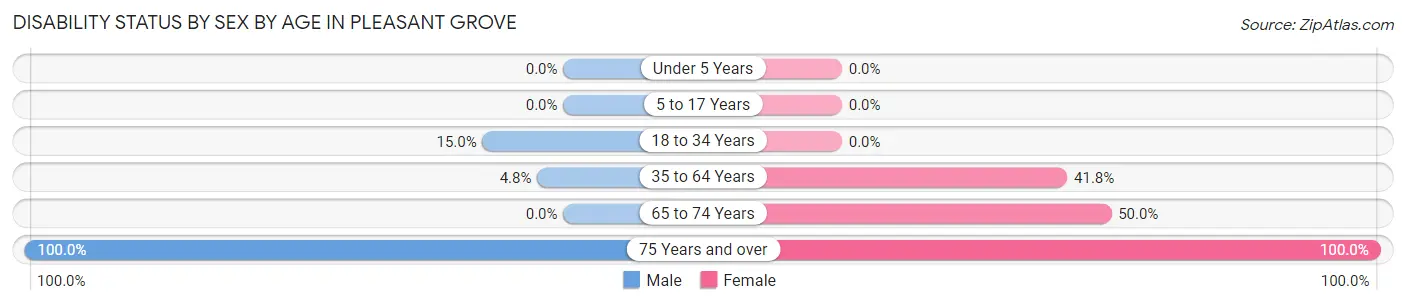
| Age Bracket | Male | Female |
| Under 5 Years | 0 (0.0%) | 0 (0.0%) |
| 5 to 17 Years | 0 (0.0%) | 0 (0.0%) |
| 18 to 34 Years | 9 (15.0%) | 0 (0.0%) |
| 35 to 64 Years | 3 (4.8%) | 23 (41.8%) |
| 65 to 74 Years | 0 (0.0%) | 8 (50.0%) |
| 75 Years and over | 5 (100.0%) | 29 (100.0%) |
Disability Class by Sex by Age in Pleasant Grove
Disability Class: Hearing Difficulty
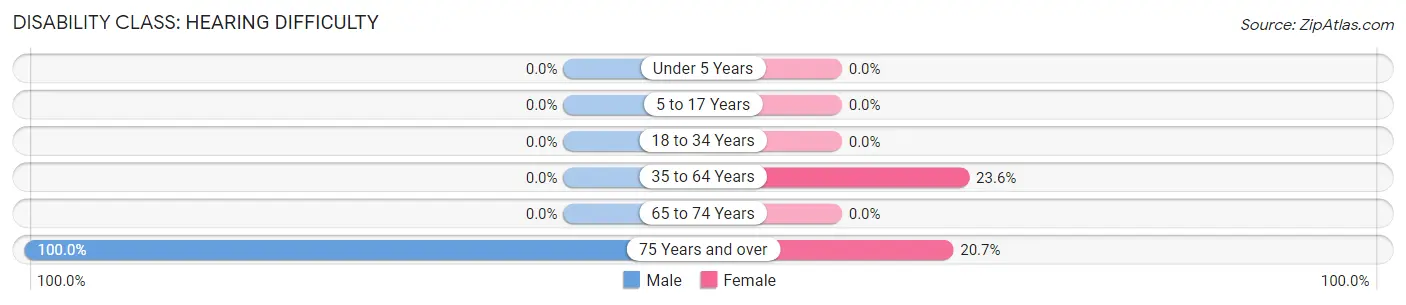
| Age Bracket | Male | Female |
| Under 5 Years | 0 (0.0%) | 0 (0.0%) |
| 5 to 17 Years | 0 (0.0%) | 0 (0.0%) |
| 18 to 34 Years | 0 (0.0%) | 0 (0.0%) |
| 35 to 64 Years | 0 (0.0%) | 13 (23.6%) |
| 65 to 74 Years | 0 (0.0%) | 0 (0.0%) |
| 75 Years and over | 5 (100.0%) | 6 (20.7%) |
Disability Class: Vision Difficulty
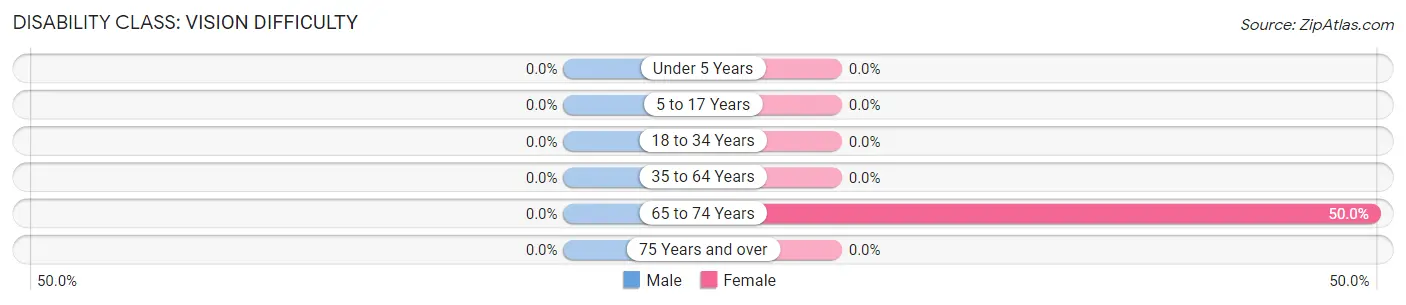
| Age Bracket | Male | Female |
| Under 5 Years | 0 (0.0%) | 0 (0.0%) |
| 5 to 17 Years | 0 (0.0%) | 0 (0.0%) |
| 18 to 34 Years | 0 (0.0%) | 0 (0.0%) |
| 35 to 64 Years | 0 (0.0%) | 0 (0.0%) |
| 65 to 74 Years | 0 (0.0%) | 8 (50.0%) |
| 75 Years and over | 0 (0.0%) | 0 (0.0%) |
Disability Class: Cognitive Difficulty
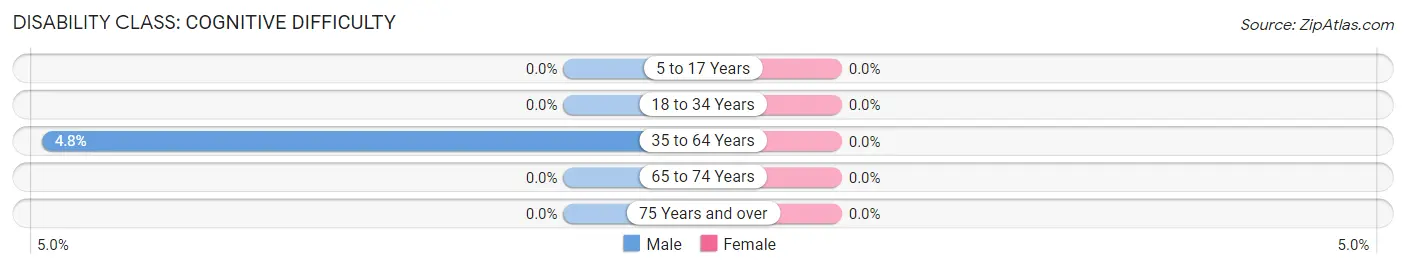
| Age Bracket | Male | Female |
| 5 to 17 Years | 0 (0.0%) | 0 (0.0%) |
| 18 to 34 Years | 0 (0.0%) | 0 (0.0%) |
| 35 to 64 Years | 3 (4.8%) | 0 (0.0%) |
| 65 to 74 Years | 0 (0.0%) | 0 (0.0%) |
| 75 Years and over | 0 (0.0%) | 0 (0.0%) |
Disability Class: Ambulatory Difficulty
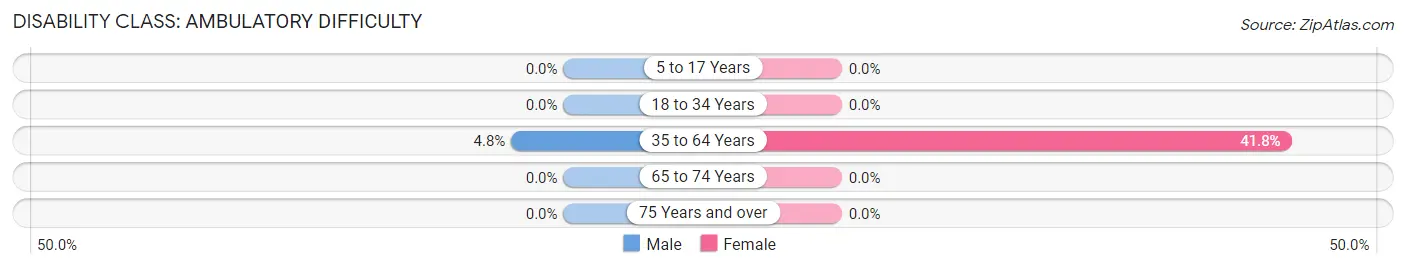
| Age Bracket | Male | Female |
| 5 to 17 Years | 0 (0.0%) | 0 (0.0%) |
| 18 to 34 Years | 0 (0.0%) | 0 (0.0%) |
| 35 to 64 Years | 3 (4.8%) | 23 (41.8%) |
| 65 to 74 Years | 0 (0.0%) | 0 (0.0%) |
| 75 Years and over | 0 (0.0%) | 0 (0.0%) |
Disability Class: Self-Care Difficulty
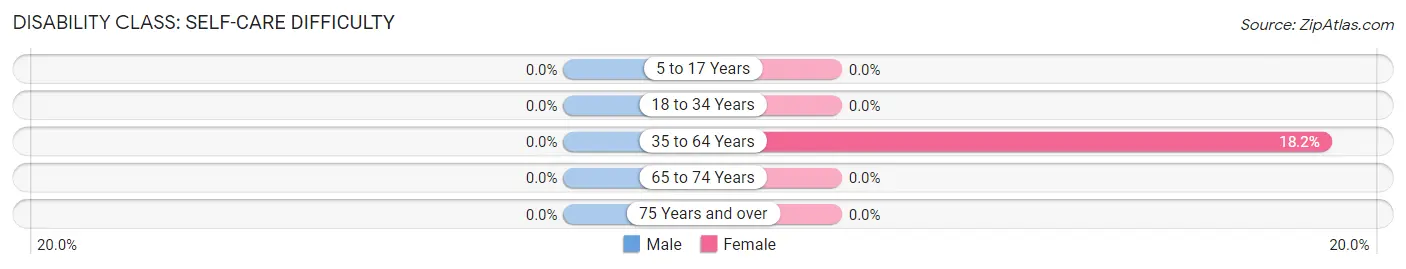
| Age Bracket | Male | Female |
| 5 to 17 Years | 0 (0.0%) | 0 (0.0%) |
| 18 to 34 Years | 0 (0.0%) | 0 (0.0%) |
| 35 to 64 Years | 0 (0.0%) | 10 (18.2%) |
| 65 to 74 Years | 0 (0.0%) | 0 (0.0%) |
| 75 Years and over | 0 (0.0%) | 0 (0.0%) |
Technology Access in Pleasant Grove
Computing Device Access in Pleasant Grove
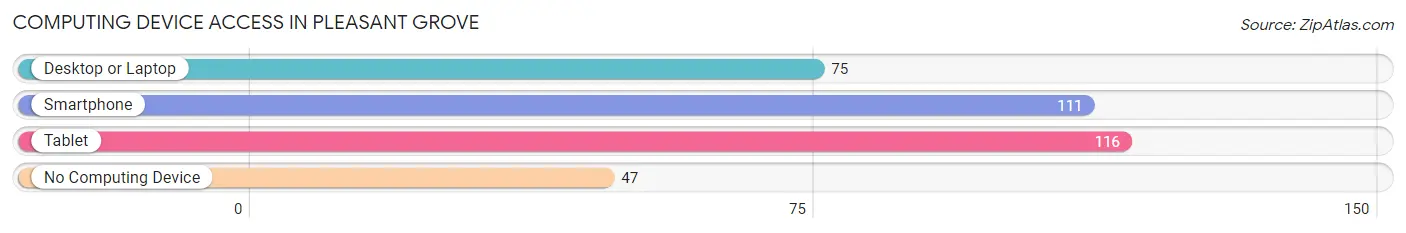
| Device Type | # Households | % Households |
| Desktop or Laptop | 75 | 45.2% |
| Smartphone | 111 | 66.9% |
| Tablet | 116 | 69.9% |
| No Computing Device | 47 | 28.3% |
| Total | 166 | 100.0% |
Internet Access in Pleasant Grove
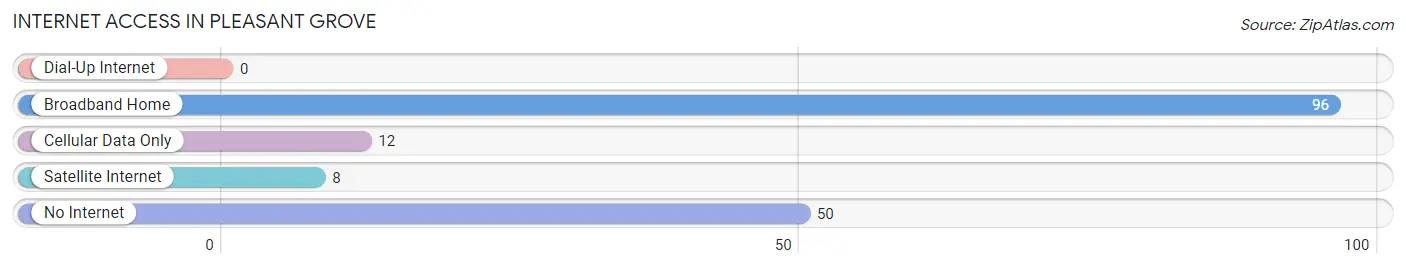
| Internet Type | # Households | % Households |
| Dial-Up Internet | 0 | 0.0% |
| Broadband Home | 96 | 57.8% |
| Cellular Data Only | 12 | 7.2% |
| Satellite Internet | 8 | 4.8% |
| No Internet | 50 | 30.1% |
| Total | 166 | 100.0% |
Pleasant Grove Summary
Pleasant Grove is a small unincorporated community located in Prince George’s County, Maryland. It is situated in the southeastern corner of the county, just north of the Washington, D.C. border. The community is bordered by the towns of Bladensburg, Colmar Manor, and Cottage City.
History
Pleasant Grove was first settled in the early 1800s by freed slaves and their descendants. The community was originally known as “Pleasant Grove Plantation” and was owned by the prominent Bowie family. The plantation was home to a large number of slaves, who worked the land and provided labor for the family’s tobacco and cotton crops. After the Civil War, the plantation was divided up and sold off to former slaves and their descendants.
In the late 19th century, Pleasant Grove was a thriving rural community. The area was home to a number of small farms, as well as a few stores and churches. The community was also home to a number of African-American businesses, including a blacksmith shop, a barber shop, and a general store.
In the early 20th century, the area began to experience rapid growth and development. The population of Pleasant Grove increased significantly, and the community began to attract new businesses and industries. In the 1950s, the area was annexed by the town of Bladensburg, and the name of the community was changed to “Pleasant Grove.”
Geography
Pleasant Grove is located in the southeastern corner of Prince George’s County, Maryland. The community is bordered by the towns of Bladensburg, Colmar Manor, and Cottage City. The area is situated on a plateau, with an elevation of approximately 200 feet above sea level. The area is characterized by rolling hills and wooded areas.
The climate in Pleasant Grove is humid subtropical, with hot, humid summers and mild winters. The average annual temperature is around 60 degrees Fahrenheit, and the average annual precipitation is around 40 inches.
Economy
Pleasant Grove is primarily a residential community, with a small number of businesses and industries. The area is home to a number of small retail stores, restaurants, and other businesses. The community is also home to a number of churches and other religious organizations.
The area is served by the Washington Metropolitan Area Transit Authority (WMATA), which provides bus and rail service to the community. The nearest airport is Ronald Reagan Washington National Airport, located approximately 20 miles away.
Demographics
As of the 2010 census, the population of Pleasant Grove was 4,845. The racial makeup of the community was 79.3% African American, 15.2% White, 2.2% Hispanic or Latino, 1.2% Asian, and 0.3% Native American. The median household income was $50,945, and the median home value was $220,000.
Pleasant Grove is a diverse community, with a variety of cultures and backgrounds represented. The area is home to a number of churches and other religious organizations, as well as a number of civic and social organizations. The community is also home to a number of small businesses and industries.
Common Questions
What is Per Capita Income in Pleasant Grove?
Per Capita income in Pleasant Grove is $32,827.
What is the Median Family Income in Pleasant Grove?
Median Family Income in Pleasant Grove is $105,139.
What is the Median Household income in Pleasant Grove?
Median Household Income in Pleasant Grove is $54,242.
What is Inequality or Gini Index in Pleasant Grove?
Inequality or Gini Index in Pleasant Grove is 0.39.
What is the Total Population of Pleasant Grove?
Total Population of Pleasant Grove is 287.
What is the Total Male Population of Pleasant Grove?
Total Male Population of Pleasant Grove is 148.
What is the Total Female Population of Pleasant Grove?
Total Female Population of Pleasant Grove is 139.
What is the Ratio of Males per 100 Females in Pleasant Grove?
There are 106.47 Males per 100 Females in Pleasant Grove.
What is the Ratio of Females per 100 Males in Pleasant Grove?
There are 93.92 Females per 100 Males in Pleasant Grove.
What is the Median Population Age in Pleasant Grove?
Median Population Age in Pleasant Grove is 56.6 Years.
What is the Average Family Size in Pleasant Grove
Average Family Size in Pleasant Grove is 2.1 People.
What is the Average Household Size in Pleasant Grove
Average Household Size in Pleasant Grove is 1.7 People.
How Large is the Labor Force in Pleasant Grove?
There are 136 People in the Labor Forcein in Pleasant Grove.
What is the Percentage of People in the Labor Force in Pleasant Grove?
54.8% of People are in the Labor Force in Pleasant Grove.