Pinesburg, MD Map & Demographics
Pinesburg Map
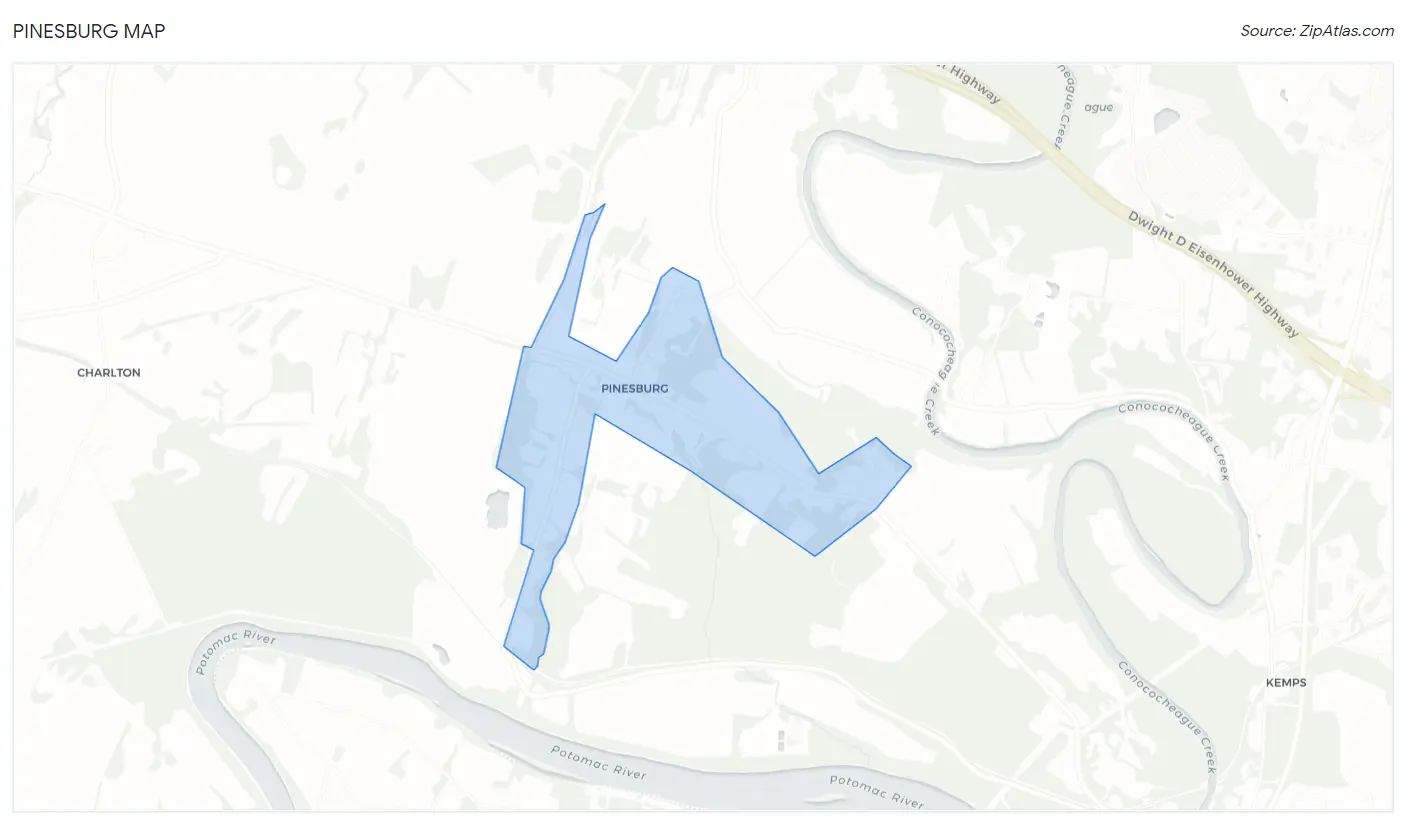
Pinesburg Overview
$22,831
PER CAPITA INCOME
0.45
INEQUALITY / GINI INDEX
511
TOTAL POPULATION
254
MALE POPULATION
257
FEMALE POPULATION
98.83
MALES / 100 FEMALES
101.18
FEMALES / 100 MALES
29.6
MEDIAN AGE
3.3
AVG FAMILY SIZE
3.3
AVG HOUSEHOLD SIZE
314
LABOR FORCE [ PEOPLE ]
83.1%
PERCENT IN LABOR FORCE
3.8%
UNEMPLOYMENT RATE
Income in Pinesburg
Income Overview in Pinesburg
| Characteristic | Number | Measure |
| Per Capita Income | 511 | $22,831 |
| Median Family Income | 135 | $0 |
| Mean Family Income | 135 | $76,755 |
| Median Household Income | 154 | $0 |
| Mean Household Income | 154 | $74,048 |
| Income Deficit | 135 | $0 |
| Wage / Income Gap (%) | 511 | 0.00% |
| Wage / Income Gap ($) | 511 | 100.00¢ per $1 |
| Gini / Inequality Index | 511 | 0.45 |
Earnings by Sex in Pinesburg
| Sex | Number | Average Earnings |
| Male | 175 (55.7%) | $0 |
| Female | 139 (44.3%) | $0 |
| Total | 314 (100.0%) | $0 |
Earnings by Sex by Income Bracket in Pinesburg
The most common earnings brackets in Pinesburg are $10,000 to $12,499 for men (39 | 22.3%) and $20,000 to $22,499 for women (54 | 38.9%).
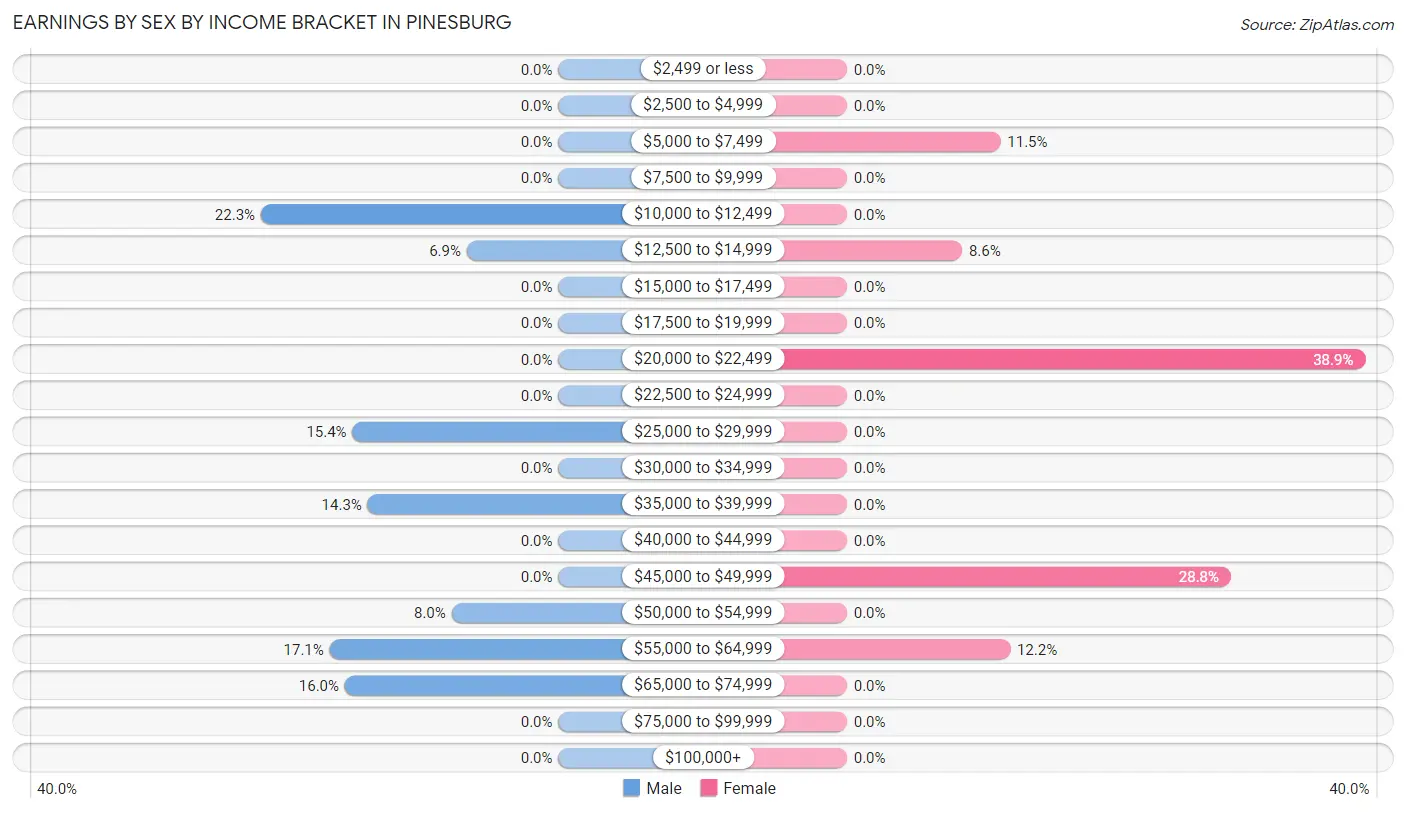
| Income | Male | Female |
| $2,499 or less | 0 (0.0%) | 0 (0.0%) |
| $2,500 to $4,999 | 0 (0.0%) | 0 (0.0%) |
| $5,000 to $7,499 | 0 (0.0%) | 16 (11.5%) |
| $7,500 to $9,999 | 0 (0.0%) | 0 (0.0%) |
| $10,000 to $12,499 | 39 (22.3%) | 0 (0.0%) |
| $12,500 to $14,999 | 12 (6.9%) | 12 (8.6%) |
| $15,000 to $17,499 | 0 (0.0%) | 0 (0.0%) |
| $17,500 to $19,999 | 0 (0.0%) | 0 (0.0%) |
| $20,000 to $22,499 | 0 (0.0%) | 54 (38.9%) |
| $22,500 to $24,999 | 0 (0.0%) | 0 (0.0%) |
| $25,000 to $29,999 | 27 (15.4%) | 0 (0.0%) |
| $30,000 to $34,999 | 0 (0.0%) | 0 (0.0%) |
| $35,000 to $39,999 | 25 (14.3%) | 0 (0.0%) |
| $40,000 to $44,999 | 0 (0.0%) | 0 (0.0%) |
| $45,000 to $49,999 | 0 (0.0%) | 40 (28.8%) |
| $50,000 to $54,999 | 14 (8.0%) | 0 (0.0%) |
| $55,000 to $64,999 | 30 (17.1%) | 17 (12.2%) |
| $65,000 to $74,999 | 28 (16.0%) | 0 (0.0%) |
| $75,000 to $99,999 | 0 (0.0%) | 0 (0.0%) |
| $100,000+ | 0 (0.0%) | 0 (0.0%) |
| Total | 175 (100.0%) | 139 (100.0%) |
Earnings by Sex by Educational Attainment in Pinesburg
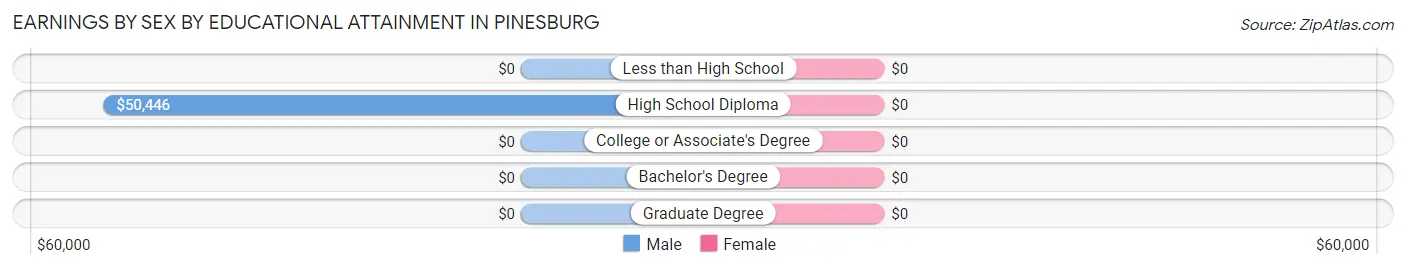
| Educational Attainment | Male Income | Female Income |
| Less than High School | - | - |
| High School Diploma | $50,446 | $0 |
| College or Associate's Degree | - | - |
| Bachelor's Degree | - | - |
| Graduate Degree | - | - |
| Total | - | - |
Family Income in Pinesburg
Family Income Brackets in Pinesburg
According to the Pinesburg family income data, there are 40 families falling into the $150,000 to $199,999 income range, which is the most common income bracket and makes up 29.6% of all families.
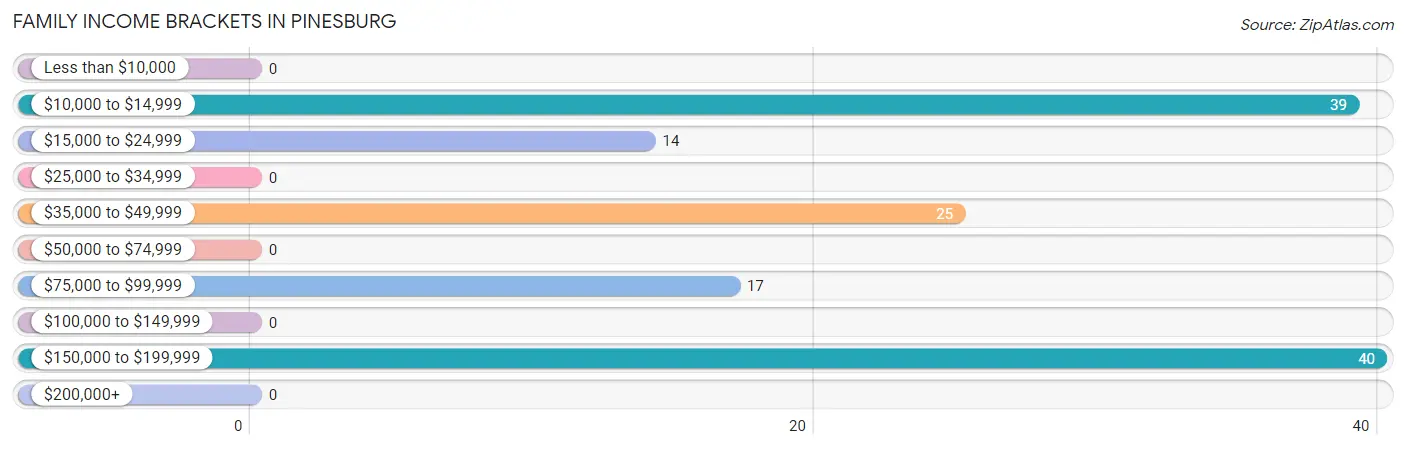
| Income Bracket | # Families | % Families |
| Less than $10,000 | 0 | 0.0% |
| $10,000 to $14,999 | 39 | 28.9% |
| $15,000 to $24,999 | 14 | 10.4% |
| $25,000 to $34,999 | 0 | 0.0% |
| $35,000 to $49,999 | 25 | 18.5% |
| $50,000 to $74,999 | 0 | 0.0% |
| $75,000 to $99,999 | 17 | 12.6% |
| $100,000 to $149,999 | 0 | 0.0% |
| $150,000 to $199,999 | 40 | 29.6% |
| $200,000+ | 0 | 0.0% |
Family Income by Famaliy Size in Pinesburg
5-person families (57 | 42.2%) account for the highest median family income in Pinesburg with $176,065 per family, while 5-person families (57 | 42.2%) have the highest median income of $35,213 per family member.
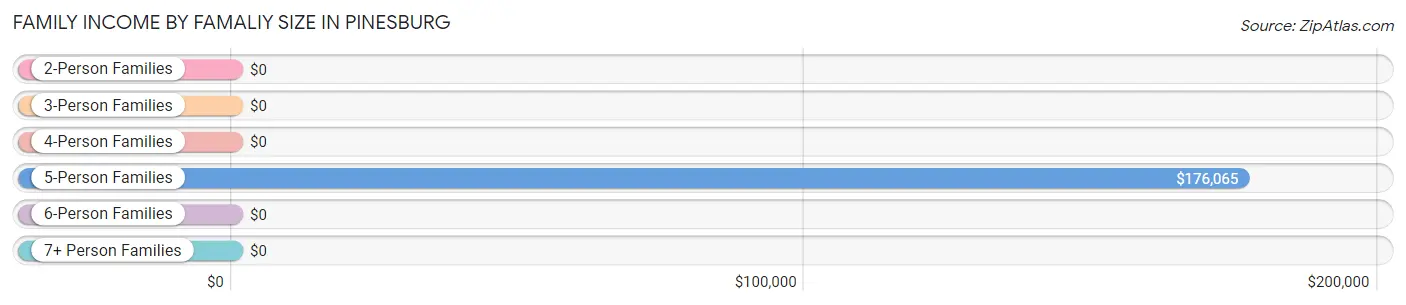
| Income Bracket | # Families | Median Income |
| 2-Person Families | 78 (57.8%) | $0 |
| 3-Person Families | 0 (0.0%) | $0 |
| 4-Person Families | 0 (0.0%) | $0 |
| 5-Person Families | 57 (42.2%) | $176,065 |
| 6-Person Families | 0 (0.0%) | $0 |
| 7+ Person Families | 0 (0.0%) | $0 |
| Total | 135 (100.0%) | $0 |
Family Income by Number of Earners in Pinesburg
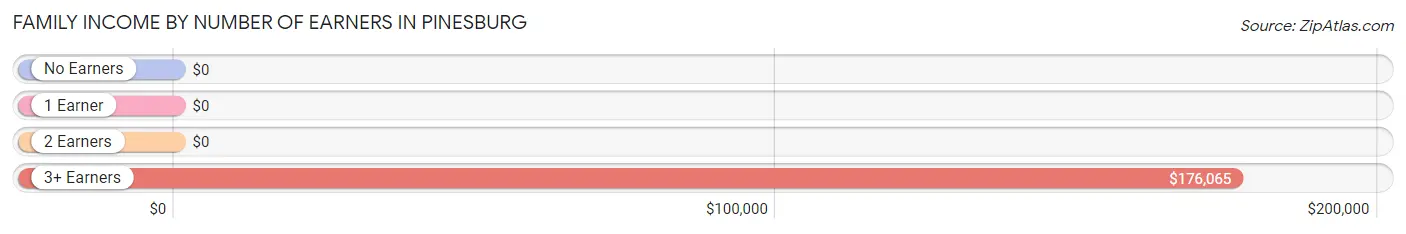
| Number of Earners | # Families | Median Income |
| No Earners | 0 (0.0%) | $0 |
| 1 Earner | 78 (57.8%) | $0 |
| 2 Earners | 0 (0.0%) | $0 |
| 3+ Earners | 57 (42.2%) | $176,065 |
| Total | 135 (100.0%) | $0 |
Household Income in Pinesburg
Household Income Brackets in Pinesburg
With 53 households falling in the category, the $25,000 to $34,999 income range is the most frequent in Pinesburg, accounting for 34.4% of all households.
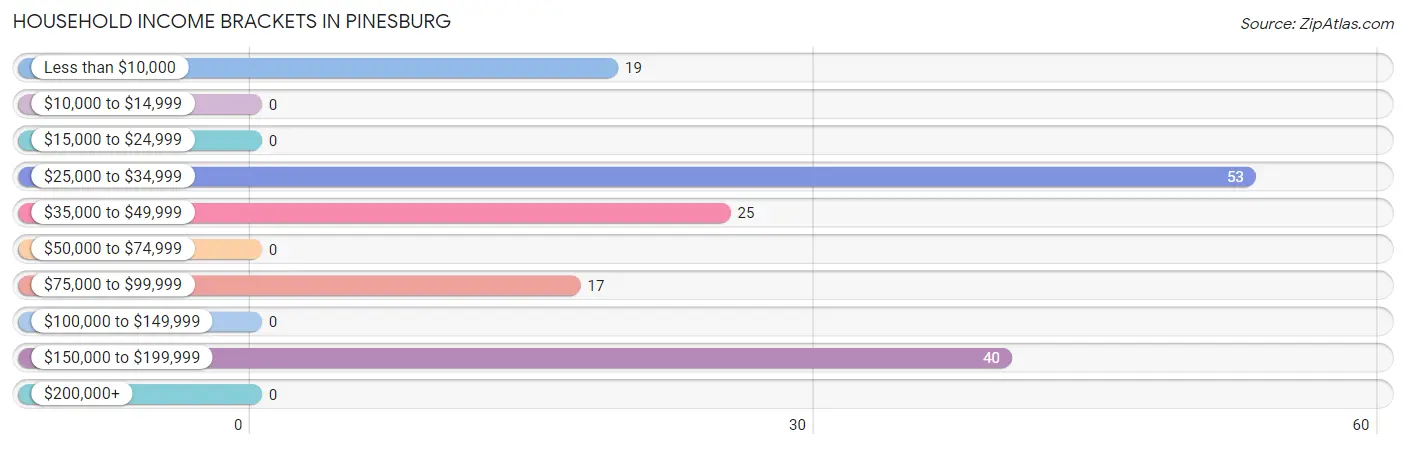
| Income Bracket | # Households | % Households |
| Less than $10,000 | 19 | 12.3% |
| $10,000 to $14,999 | 0 | 0.0% |
| $15,000 to $24,999 | 0 | 0.0% |
| $25,000 to $34,999 | 53 | 34.4% |
| $35,000 to $49,999 | 25 | 16.2% |
| $50,000 to $74,999 | 0 | 0.0% |
| $75,000 to $99,999 | 17 | 11.0% |
| $100,000 to $149,999 | 0 | 0.0% |
| $150,000 to $199,999 | 40 | 26.0% |
| $200,000+ | 0 | 0.0% |
Household Income by Householder Age in Pinesburg
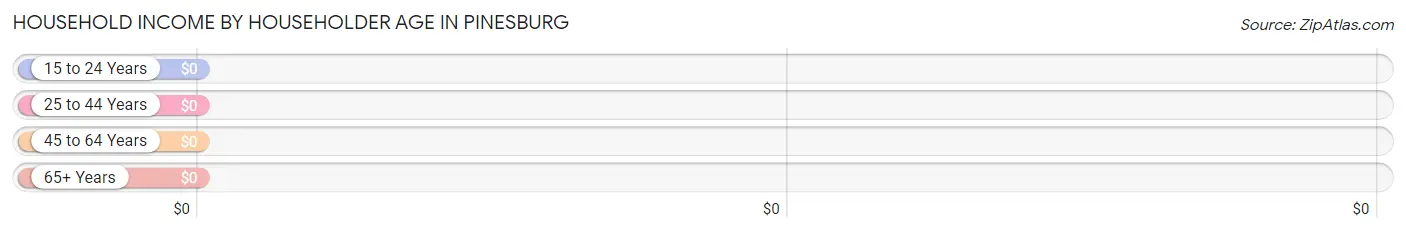
| Income Bracket | # Households | Median Income |
| 15 to 24 Years | 0 (0.0%) | $0 |
| 25 to 44 Years | 97 (63.0%) | $0 |
| 45 to 64 Years | 13 (8.4%) | $0 |
| 65+ Years | 44 (28.6%) | $0 |
| Total | 154 (100.0%) | $0 |
Poverty in Pinesburg
Income Below Poverty by Sex and Age in Pinesburg
With 27.6% poverty level for males and 15.6% for females among the residents of Pinesburg, 35 to 44 year old males and 6 to 11 year old females are the most vulnerable to poverty, with 39 males (100.0%) and 40 females (70.2%) in their respective age groups living below the poverty level.
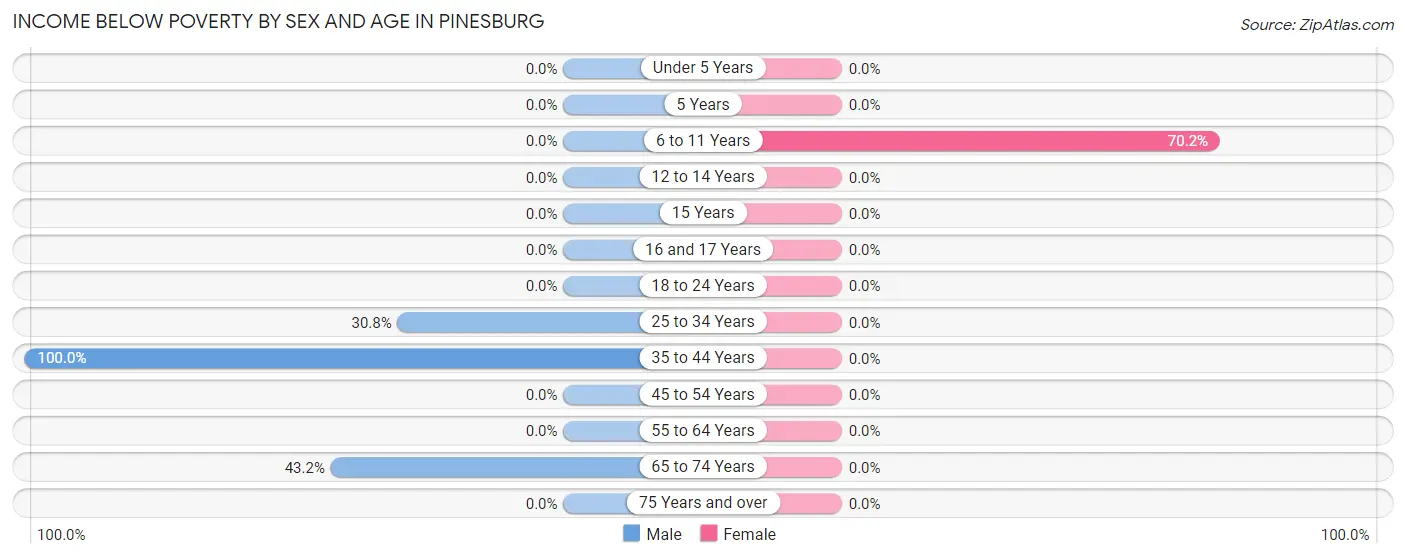
| Age Bracket | Male | Female |
| Under 5 Years | 0 (0.0%) | 0 (0.0%) |
| 5 Years | 0 (0.0%) | 0 (0.0%) |
| 6 to 11 Years | 0 (0.0%) | 40 (70.2%) |
| 12 to 14 Years | 0 (0.0%) | 0 (0.0%) |
| 15 Years | 0 (0.0%) | 0 (0.0%) |
| 16 and 17 Years | 0 (0.0%) | 0 (0.0%) |
| 18 to 24 Years | 0 (0.0%) | 0 (0.0%) |
| 25 to 34 Years | 12 (30.8%) | 0 (0.0%) |
| 35 to 44 Years | 39 (100.0%) | 0 (0.0%) |
| 45 to 54 Years | 0 (0.0%) | 0 (0.0%) |
| 55 to 64 Years | 0 (0.0%) | 0 (0.0%) |
| 65 to 74 Years | 19 (43.2%) | 0 (0.0%) |
| 75 Years and over | 0 (0.0%) | 0 (0.0%) |
| Total | 70 (27.6%) | 40 (15.6%) |
Income Above Poverty by Sex and Age in Pinesburg
According to the poverty statistics in Pinesburg, males aged 6 to 11 years and females aged under 5 years are the age groups that are most secure financially, with 100.0% of males and 100.0% of females in these age groups living above the poverty line.
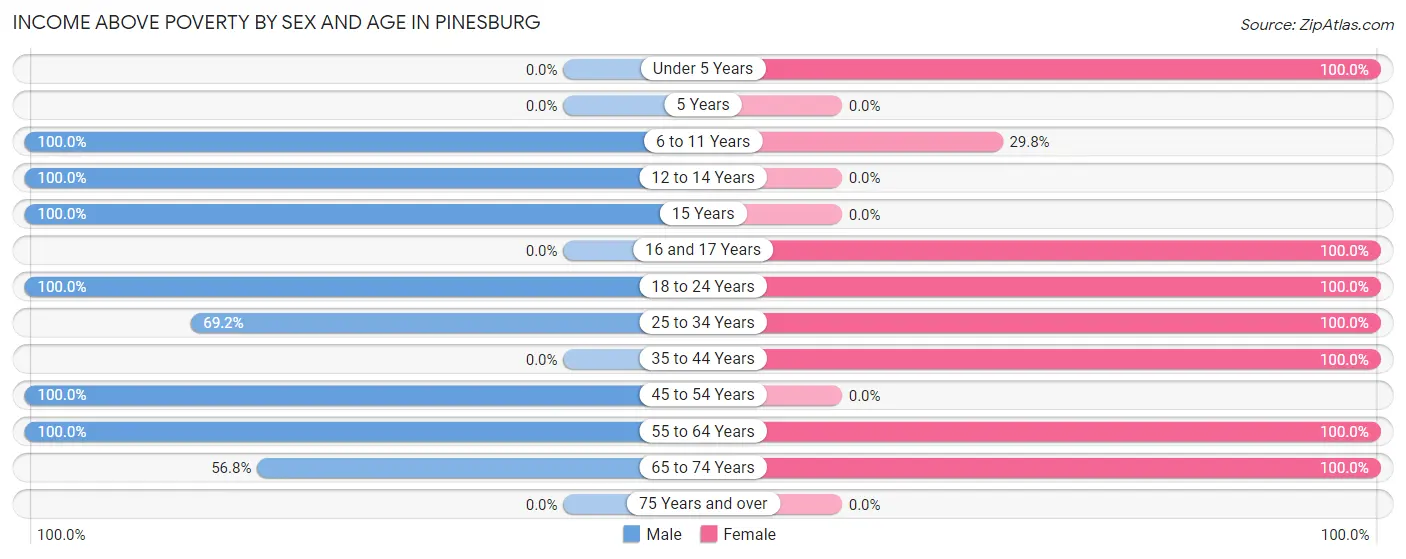
| Age Bracket | Male | Female |
| Under 5 Years | 0 (0.0%) | 16 (100.0%) |
| 5 Years | 0 (0.0%) | 0 (0.0%) |
| 6 to 11 Years | 13 (100.0%) | 17 (29.8%) |
| 12 to 14 Years | 29 (100.0%) | 0 (0.0%) |
| 15 Years | 18 (100.0%) | 0 (0.0%) |
| 16 and 17 Years | 0 (0.0%) | 16 (100.0%) |
| 18 to 24 Years | 30 (100.0%) | 33 (100.0%) |
| 25 to 34 Years | 27 (69.2%) | 14 (100.0%) |
| 35 to 44 Years | 0 (0.0%) | 84 (100.0%) |
| 45 to 54 Years | 28 (100.0%) | 0 (0.0%) |
| 55 to 64 Years | 14 (100.0%) | 13 (100.0%) |
| 65 to 74 Years | 25 (56.8%) | 24 (100.0%) |
| 75 Years and over | 0 (0.0%) | 0 (0.0%) |
| Total | 184 (72.4%) | 217 (84.4%) |
Income Below Poverty Among Married-Couple Families in Pinesburg
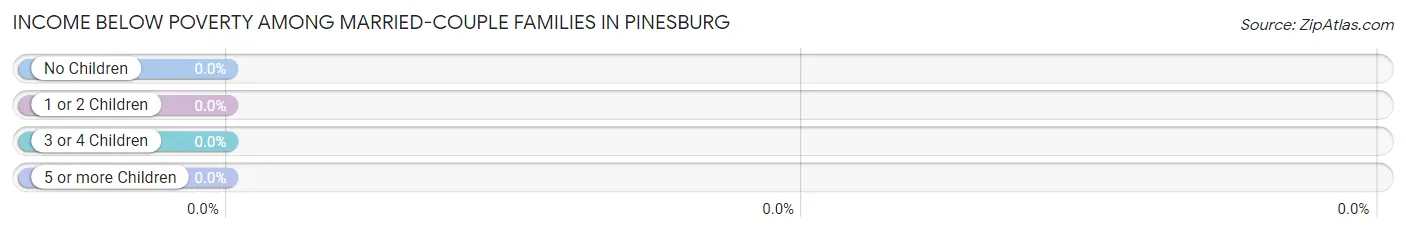
| Children | Above Poverty | Below Poverty |
| No Children | 25 (100.0%) | 0 (0.0%) |
| 1 or 2 Children | 40 (100.0%) | 0 (0.0%) |
| 3 or 4 Children | 0 (0.0%) | 0 (0.0%) |
| 5 or more Children | 0 (0.0%) | 0 (0.0%) |
| Total | 65 (100.0%) | 0 (0.0%) |
Income Below Poverty Among Single-Parent Households in Pinesburg
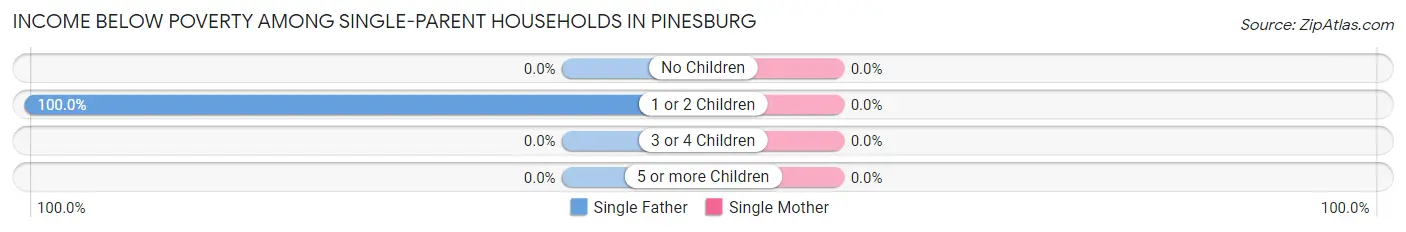
| Children | Single Father | Single Mother |
| No Children | 0 (0.0%) | 0 (0.0%) |
| 1 or 2 Children | 39 (100.0%) | 0 (0.0%) |
| 3 or 4 Children | 0 (0.0%) | 0 (0.0%) |
| 5 or more Children | 0 (0.0%) | 0 (0.0%) |
| Total | 39 (100.0%) | 0 (0.0%) |
Income Below Poverty Among Married-Couple vs Single-Parent Households in Pinesburg
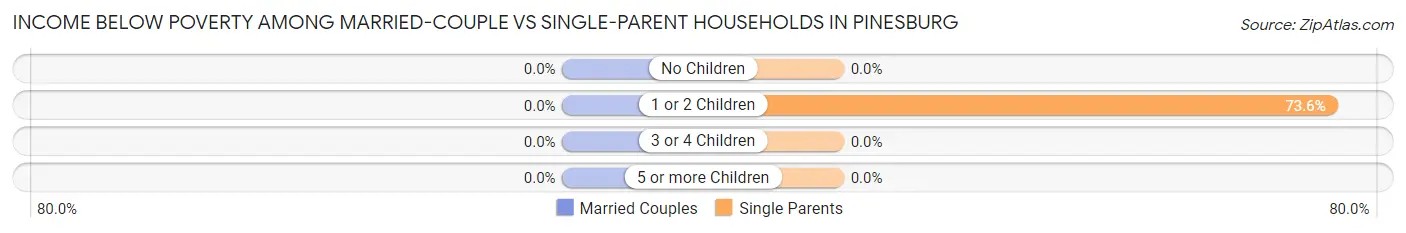
| Children | Married-Couple Families | Single-Parent Households |
| No Children | 0 (0.0%) | 0 (0.0%) |
| 1 or 2 Children | 0 (0.0%) | 39 (73.6%) |
| 3 or 4 Children | 0 (0.0%) | 0 (0.0%) |
| 5 or more Children | 0 (0.0%) | 0 (0.0%) |
| Total | 0 (0.0%) | 39 (55.7%) |
Race in Pinesburg
The most populous races in Pinesburg are , and White / Caucasian (511 | 100.0%).
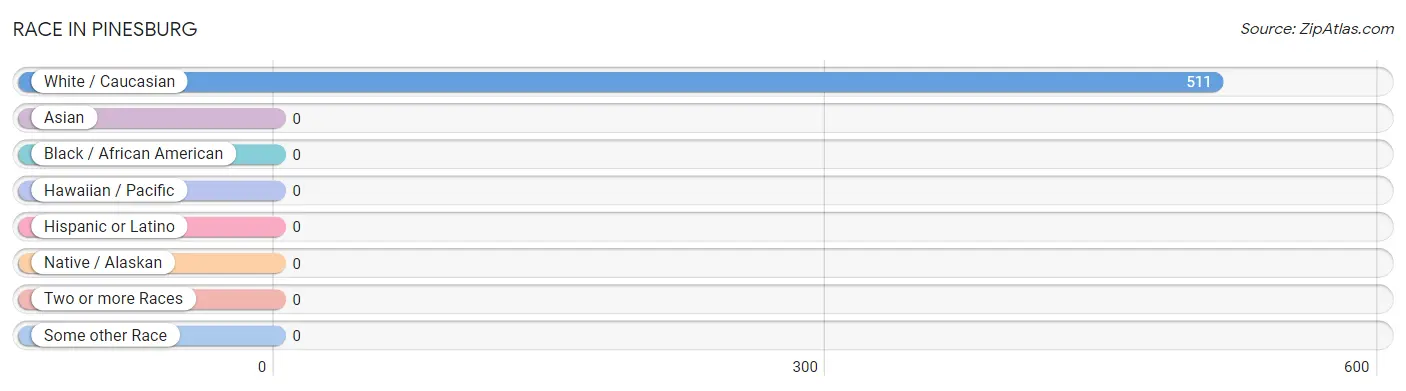
| Race | # Population | % Population |
| Asian | 0 | 0.0% |
| Black / African American | 0 | 0.0% |
| Hawaiian / Pacific | 0 | 0.0% |
| Hispanic or Latino | 0 | 0.0% |
| Native / Alaskan | 0 | 0.0% |
| White / Caucasian | 511 | 100.0% |
| Two or more Races | 0 | 0.0% |
| Some other Race | 0 | 0.0% |
| Total | 511 | 100.0% |
Ancestry in Pinesburg
The most populous ancestries reported in Pinesburg are American (78 | 15.3%), German (68 | 13.3%), and English (19 | 3.7%), together accounting for 32.3% of all Pinesburg residents.
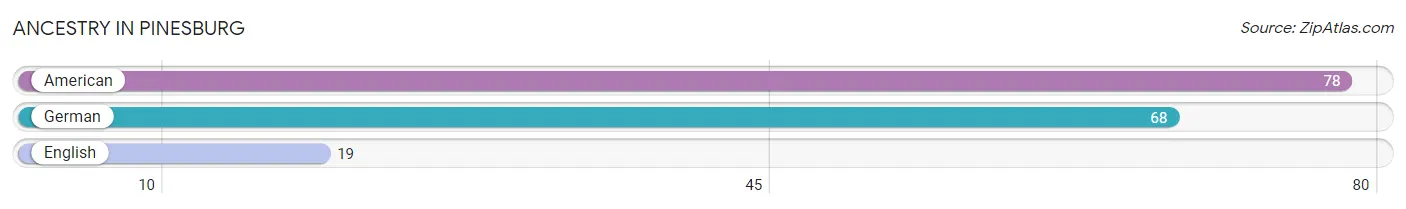
| Ancestry | # Population | % Population |
| American | 78 | 15.3% |
| English | 19 | 3.7% |
| German | 68 | 13.3% | View All 3 Rows |
Immigrants in Pinesburg

| Immigration Origin | # Population | % Population | View All 0 Rows |
Sex and Age in Pinesburg
Sex and Age in Pinesburg
The most populous age groups in Pinesburg are 25 to 29 Years (39 | 15.3%) for men and 5 to 9 Years (57 | 22.2%) for women.
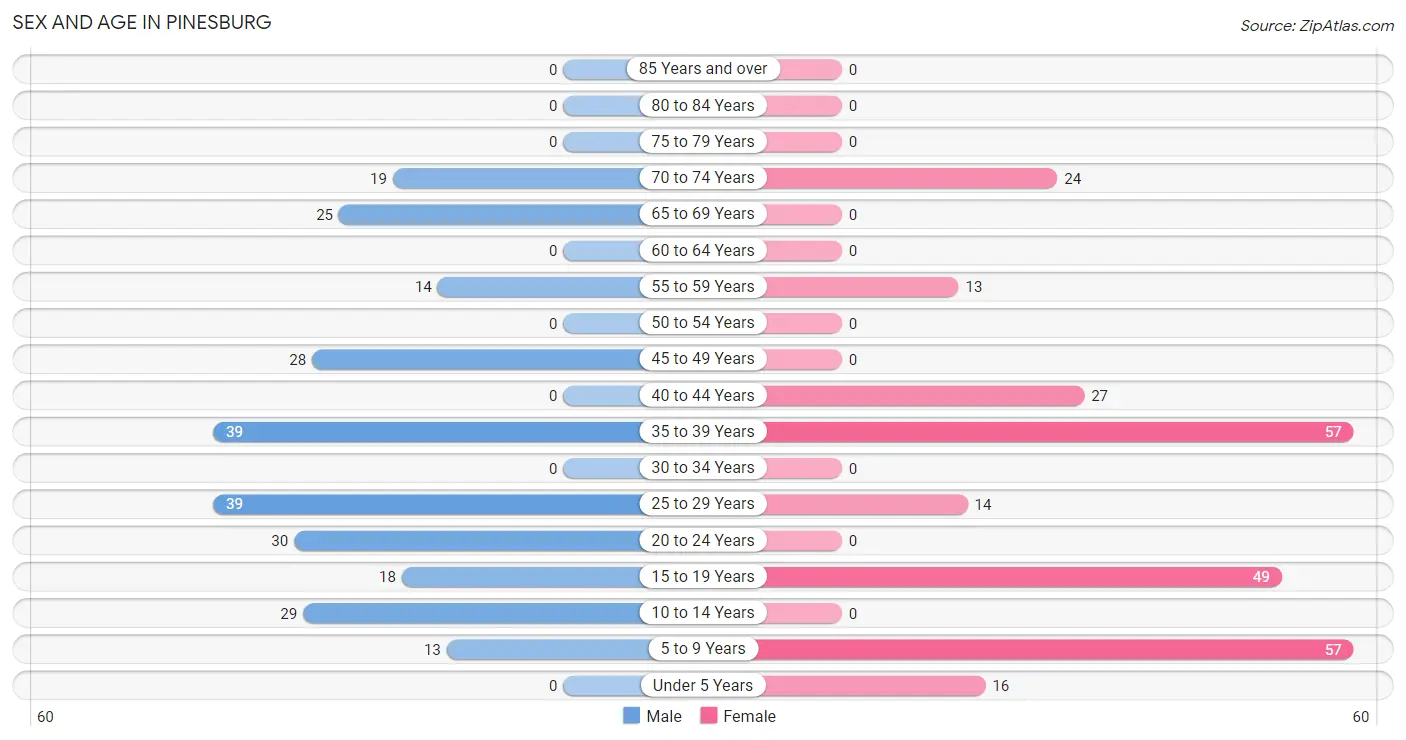
| Age Bracket | Male | Female |
| Under 5 Years | 0 (0.0%) | 16 (6.2%) |
| 5 to 9 Years | 13 (5.1%) | 57 (22.2%) |
| 10 to 14 Years | 29 (11.4%) | 0 (0.0%) |
| 15 to 19 Years | 18 (7.1%) | 49 (19.1%) |
| 20 to 24 Years | 30 (11.8%) | 0 (0.0%) |
| 25 to 29 Years | 39 (15.3%) | 14 (5.4%) |
| 30 to 34 Years | 0 (0.0%) | 0 (0.0%) |
| 35 to 39 Years | 39 (15.3%) | 57 (22.2%) |
| 40 to 44 Years | 0 (0.0%) | 27 (10.5%) |
| 45 to 49 Years | 28 (11.0%) | 0 (0.0%) |
| 50 to 54 Years | 0 (0.0%) | 0 (0.0%) |
| 55 to 59 Years | 14 (5.5%) | 13 (5.1%) |
| 60 to 64 Years | 0 (0.0%) | 0 (0.0%) |
| 65 to 69 Years | 25 (9.8%) | 0 (0.0%) |
| 70 to 74 Years | 19 (7.5%) | 24 (9.3%) |
| 75 to 79 Years | 0 (0.0%) | 0 (0.0%) |
| 80 to 84 Years | 0 (0.0%) | 0 (0.0%) |
| 85 Years and over | 0 (0.0%) | 0 (0.0%) |
| Total | 254 (100.0%) | 257 (100.0%) |
Families and Households in Pinesburg
Median Family Size in Pinesburg
The median family size in Pinesburg is 3.26 persons per family, with married-couple families (65 | 48.1%) accounting for the largest median family size of 3.94 persons per family. On the other hand, single male/father families (39 | 28.9%) represent the smallest median family size with 2.03 persons per family.
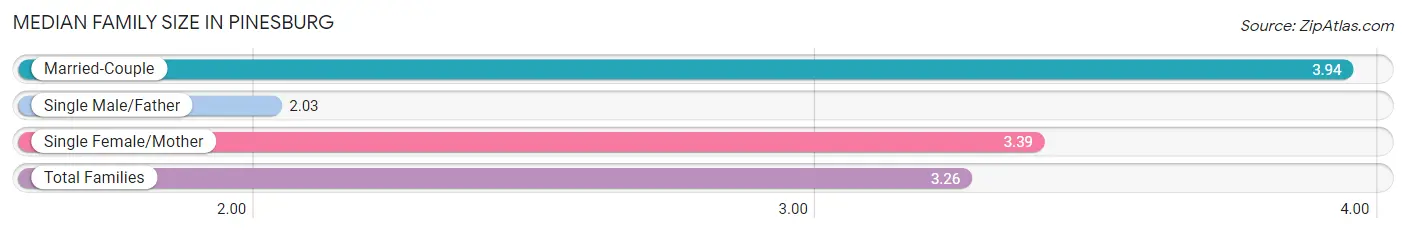
| Family Type | # Families | Family Size |
| Married-Couple | 65 (48.1%) | 3.94 |
| Single Male/Father | 39 (28.9%) | 2.03 |
| Single Female/Mother | 31 (23.0%) | 3.39 |
| Total Families | 135 (100.0%) | 3.26 |
Median Household Size in Pinesburg
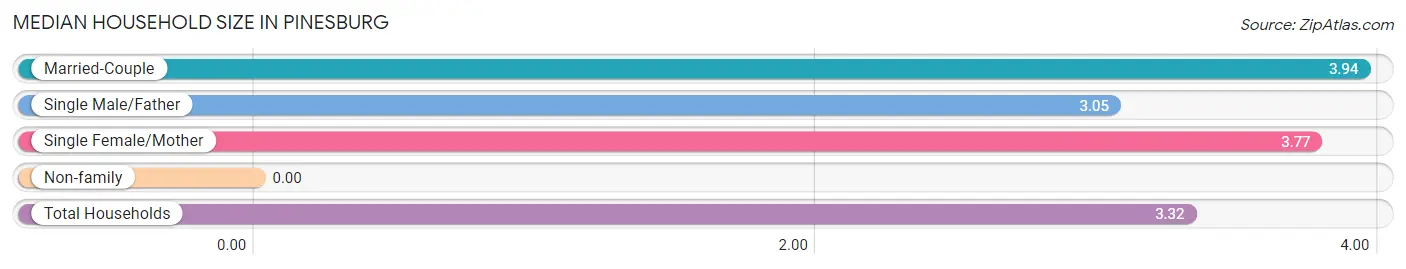
| Household Type | # Households | Household Size |
| Married-Couple | 65 (42.2%) | 3.94 |
| Single Male/Father | 39 (25.3%) | 3.05 |
| Single Female/Mother | 31 (20.1%) | 3.77 |
| Non-family | 19 (12.3%) | - |
| Total Households | 154 (100.0%) | 3.32 |
Household Size by Marriage Status in Pinesburg
Out of a total of 154 households in Pinesburg, 135 (87.7%) are family households, while 19 (12.3%) are nonfamily households. The most numerous type of family households are 5-person households, comprising 57, and the most common type of nonfamily households are 1-person households, comprising 19.
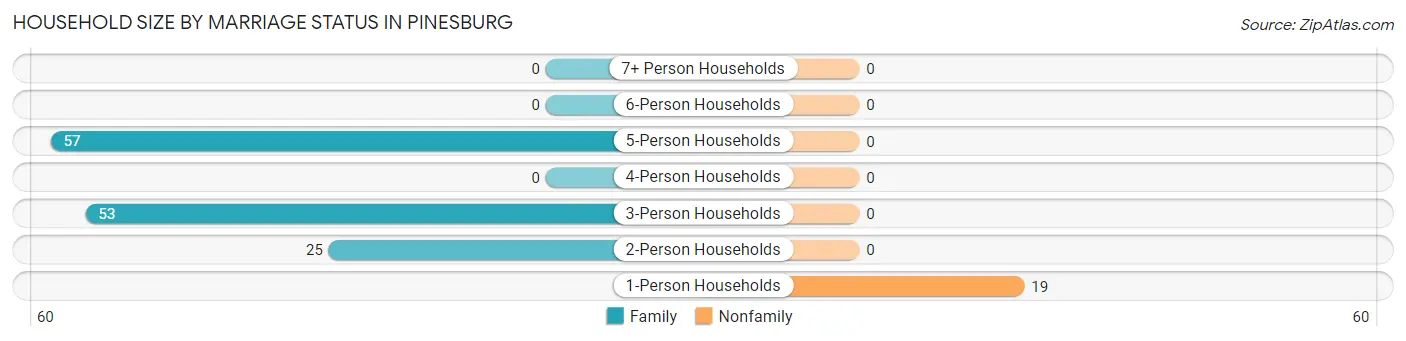
| Household Size | Family Households | Nonfamily Households |
| 1-Person Households | - | 19 (12.3%) |
| 2-Person Households | 25 (16.2%) | 0 (0.0%) |
| 3-Person Households | 53 (34.4%) | 0 (0.0%) |
| 4-Person Households | 0 (0.0%) | 0 (0.0%) |
| 5-Person Households | 57 (37.0%) | 0 (0.0%) |
| 6-Person Households | 0 (0.0%) | 0 (0.0%) |
| 7+ Person Households | 0 (0.0%) | 0 (0.0%) |
| Total | 135 (87.7%) | 19 (12.3%) |
Female Fertility in Pinesburg
Fertility by Age in Pinesburg
| Age Bracket | Women with Births | Births / 1,000 Women |
| 15 to 19 years | 0 (0.0%) | 0.0 |
| 20 to 34 years | 0 (0.0%) | 0.0 |
| 35 to 50 years | 0 (0.0%) | 0.0 |
| Total | 0 (0.0%) | 0.0 |
Fertility by Age by Marriage Status in Pinesburg
| Age Bracket | Married | Unmarried |
| 15 to 19 years | 0 (0.0%) | 0 (0.0%) |
| 20 to 34 years | 0 (0.0%) | 0 (0.0%) |
| 35 to 50 years | 0 (0.0%) | 0 (0.0%) |
| Total | 0 (0.0%) | 0 (0.0%) |
Fertility by Education in Pinesburg
| Educational Attainment | Women with Births | Births / 1,000 Women |
| Less than High School | 0 (0.0%) | 0.0 |
| High School Diploma | 0 (0.0%) | 0.0 |
| College or Associate's Degree | 0 (0.0%) | 0.0 |
| Bachelor's Degree | 0 (0.0%) | 0.0 |
| Graduate Degree | 0 (0.0%) | 0.0 |
| Total | 0 (0.0%) | 0.0 |
Fertility by Education by Marriage Status in Pinesburg
| Educational Attainment | Married | Unmarried |
| Less than High School | 0 (0.0%) | 0 (0.0%) |
| High School Diploma | 0 (0.0%) | 0 (0.0%) |
| College or Associate's Degree | 0 (0.0%) | 0 (0.0%) |
| Bachelor's Degree | 0 (0.0%) | 0 (0.0%) |
| Graduate Degree | 0 (0.0%) | 0 (0.0%) |
| Total | 0 (0.0%) | 0 (0.0%) |
Employment Characteristics in Pinesburg
Employment by Class of Employer in Pinesburg
Among the 302 employed individuals in Pinesburg, private company employees (233 | 77.1%), self-employed (not incorporated) (27 | 8.9%), and self-employed (incorporated) (25 | 8.3%) make up the most common classes of employment.
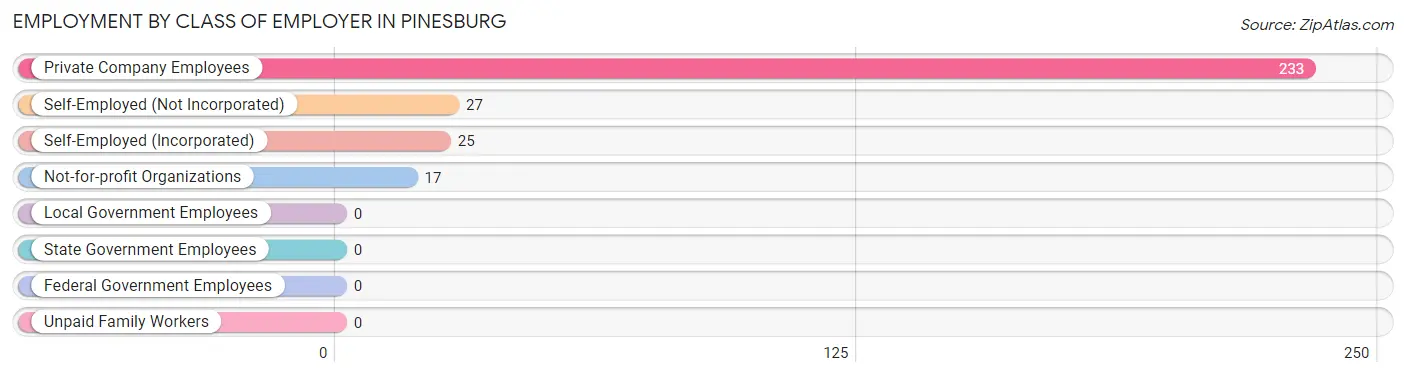
| Employer Class | # Employees | % Employees |
| Private Company Employees | 233 | 77.1% |
| Self-Employed (Incorporated) | 25 | 8.3% |
| Self-Employed (Not Incorporated) | 27 | 8.9% |
| Not-for-profit Organizations | 17 | 5.6% |
| Local Government Employees | 0 | 0.0% |
| State Government Employees | 0 | 0.0% |
| Federal Government Employees | 0 | 0.0% |
| Unpaid Family Workers | 0 | 0.0% |
| Total | 302 | 100.0% |
Employment Status by Age in Pinesburg
According to the labor force statistics for Pinesburg, out of the total population over 16 years of age (378), 83.1% or 314 individuals are in the labor force, with 3.8% or 12 of them unemployed. The age group with the highest labor force participation rate is 20 to 24 years, with 100.0% or 30 individuals in the labor force. Within the labor force, the 25 to 29 years age range has the highest percentage of unemployed individuals, with 22.6% or 12 of them being unemployed.
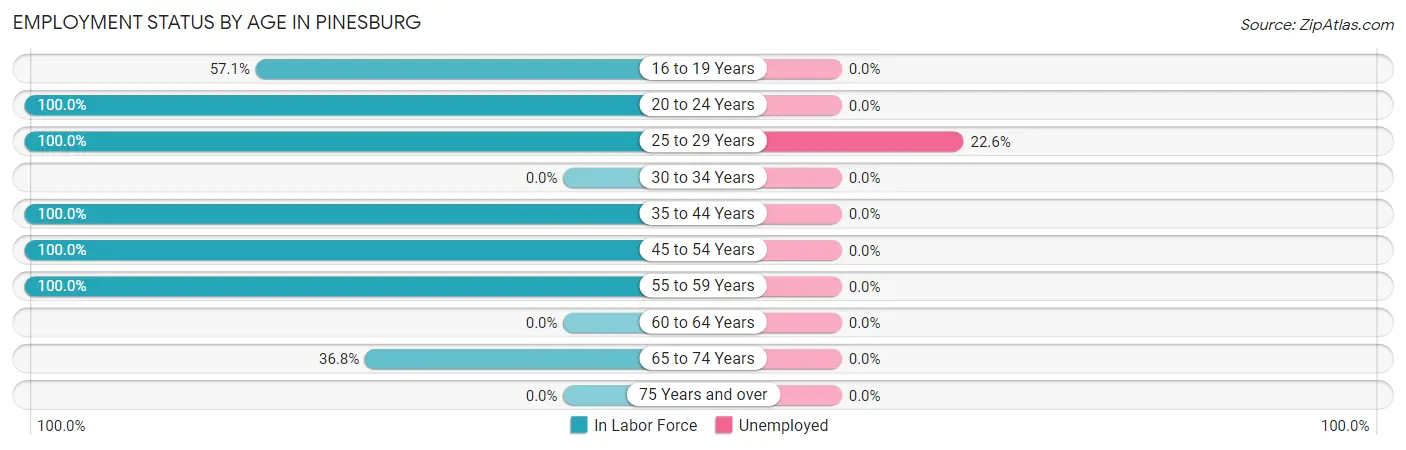
| Age Bracket | In Labor Force | Unemployed |
| 16 to 19 Years | 28 (57.1%) | 0 (0.0%) |
| 20 to 24 Years | 30 (100.0%) | 0 (0.0%) |
| 25 to 29 Years | 53 (100.0%) | 12 (22.6%) |
| 30 to 34 Years | 0 (0.0%) | 0 (0.0%) |
| 35 to 44 Years | 123 (100.0%) | 0 (0.0%) |
| 45 to 54 Years | 28 (100.0%) | 0 (0.0%) |
| 55 to 59 Years | 27 (100.0%) | 0 (0.0%) |
| 60 to 64 Years | 0 (0.0%) | 0 (0.0%) |
| 65 to 74 Years | 25 (36.8%) | 0 (0.0%) |
| 75 Years and over | 0 (0.0%) | 0 (0.0%) |
| Total | 314 (83.1%) | 12 (3.8%) |
Employment Status by Educational Attainment in Pinesburg
According to labor force statistics for Pinesburg, 100.0% of individuals (231) out of the total population between 25 and 64 years of age (231) are in the labor force, with 5.2% or 12 of them being unemployed. The group with the highest labor force participation rate are those with the educational attainment of less than high school, with 100.0% or 14 individuals in the labor force. Within the labor force, individuals with high school diploma education have the highest percentage of unemployment, with 12.8% or 12 of them being unemployed.
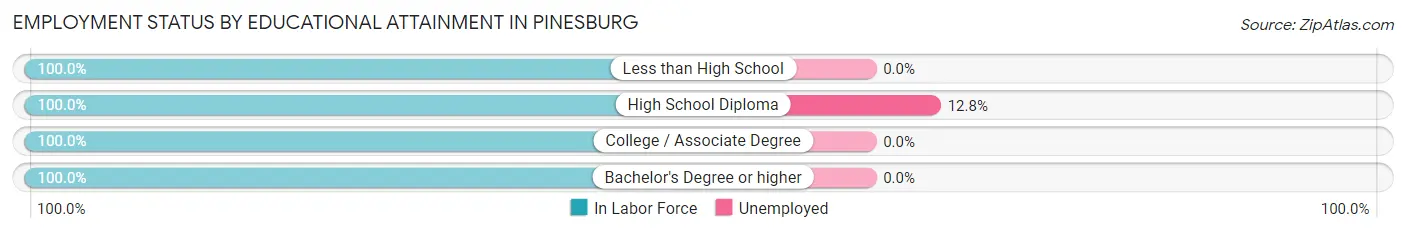
| Educational Attainment | In Labor Force | Unemployed |
| Less than High School | 14 (100.0%) | 0 (0.0%) |
| High School Diploma | 94 (100.0%) | 12 (12.8%) |
| College / Associate Degree | 106 (100.0%) | 0 (0.0%) |
| Bachelor's Degree or higher | 17 (100.0%) | 0 (0.0%) |
| Total | 231 (100.0%) | 12 (5.2%) |
Employment Occupations by Sex in Pinesburg
Management, Business, Science and Arts Occupations
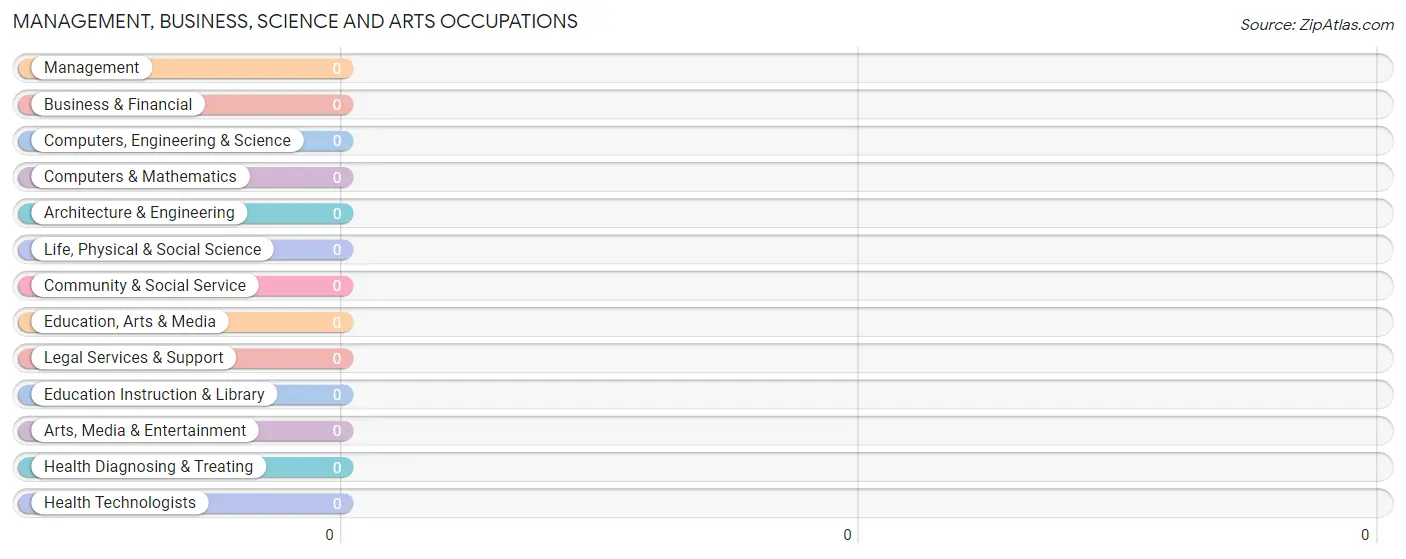
Management, Business, Science and Arts Occupations by Sex
| Occupation | Male | Female |
| Management | 0 (0.0%) | 0 (0.0%) |
| Business & Financial | 0 (0.0%) | 0 (0.0%) |
| Computers, Engineering & Science | 0 (0.0%) | 0 (0.0%) |
| Computers & Mathematics | 0 (0.0%) | 0 (0.0%) |
| Architecture & Engineering | 0 (0.0%) | 0 (0.0%) |
| Life, Physical & Social Science | 0 (0.0%) | 0 (0.0%) |
| Community & Social Service | 0 (0.0%) | 0 (0.0%) |
| Education, Arts & Media | 0 (0.0%) | 0 (0.0%) |
| Legal Services & Support | 0 (0.0%) | 0 (0.0%) |
| Education Instruction & Library | 0 (0.0%) | 0 (0.0%) |
| Arts, Media & Entertainment | 0 (0.0%) | 0 (0.0%) |
| Health Diagnosing & Treating | 0 (0.0%) | 0 (0.0%) |
| Health Technologists | 0 (0.0%) | 0 (0.0%) |
| Total (Category) | 0 (0.0%) | 0 (0.0%) |
| Total (Overall) | 163 (54.0%) | 139 (46.0%) |
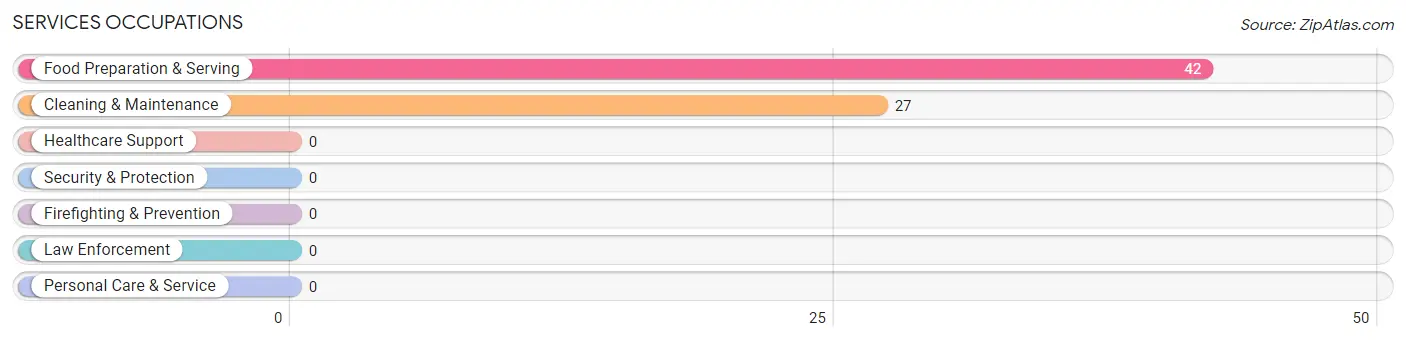
Services Occupations
The most common Services occupations in Pinesburg are Food Preparation & Serving (42 | 13.9%), and Cleaning & Maintenance (27 | 8.9%).
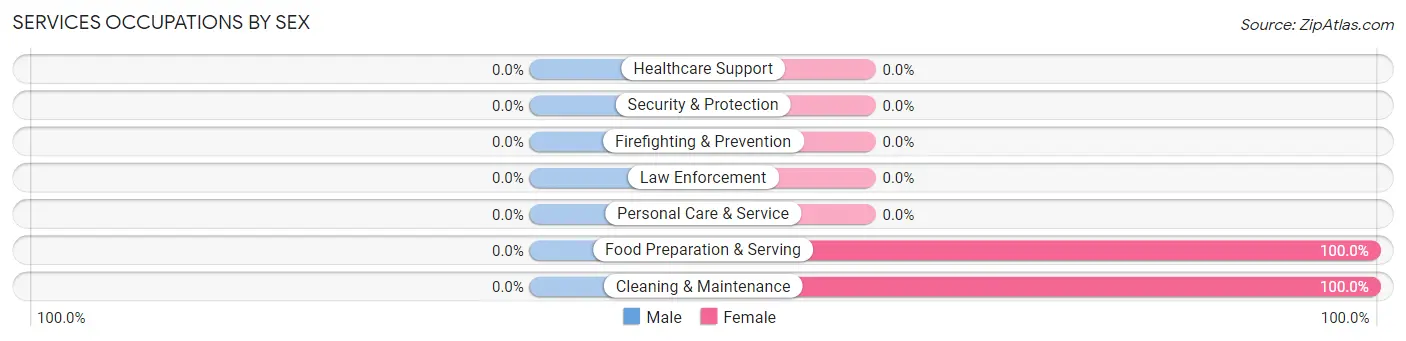
Services Occupations by Sex
| Occupation | Male | Female |
| Healthcare Support | 0 (0.0%) | 0 (0.0%) |
| Security & Protection | 0 (0.0%) | 0 (0.0%) |
| Firefighting & Prevention | 0 (0.0%) | 0 (0.0%) |
| Law Enforcement | 0 (0.0%) | 0 (0.0%) |
| Food Preparation & Serving | 0 (0.0%) | 42 (100.0%) |
| Cleaning & Maintenance | 0 (0.0%) | 27 (100.0%) |
| Personal Care & Service | 0 (0.0%) | 0 (0.0%) |
| Total (Category) | 0 (0.0%) | 69 (100.0%) |
| Total (Overall) | 163 (54.0%) | 139 (46.0%) |
Sales and Office Occupations
The most common Sales and Office occupations in Pinesburg are , and Office & Administration (30 | 9.9%).
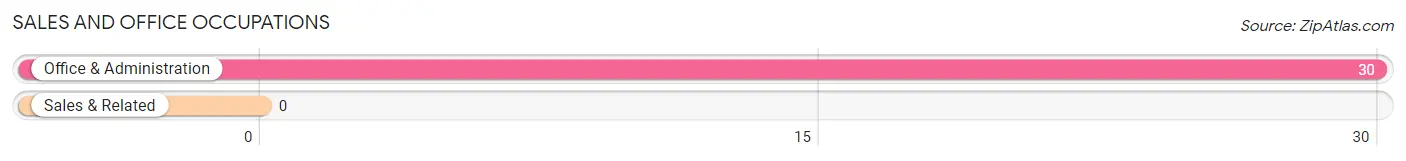
Sales and Office Occupations by Sex
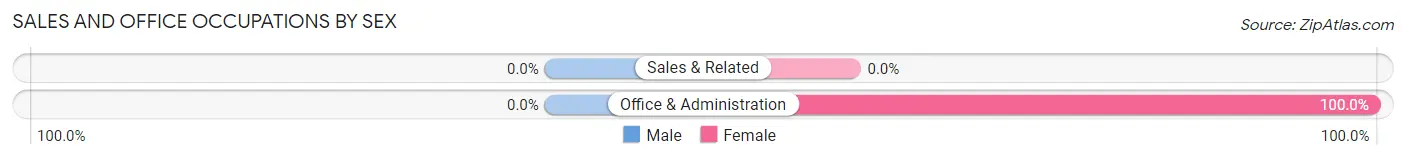
| Occupation | Male | Female |
| Sales & Related | 0 (0.0%) | 0 (0.0%) |
| Office & Administration | 0 (0.0%) | 30 (100.0%) |
| Total (Category) | 0 (0.0%) | 30 (100.0%) |
| Total (Overall) | 163 (54.0%) | 139 (46.0%) |
Natural Resources, Construction and Maintenance Occupations
The most common Natural Resources, Construction and Maintenance occupations in Pinesburg are , and Construction & Extraction (83 | 27.5%).
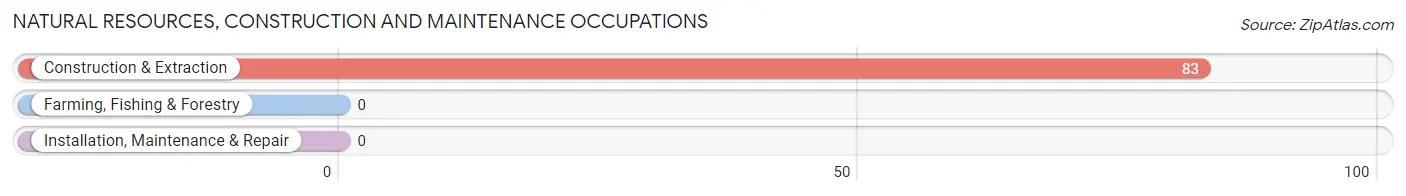
Natural Resources, Construction and Maintenance Occupations by Sex
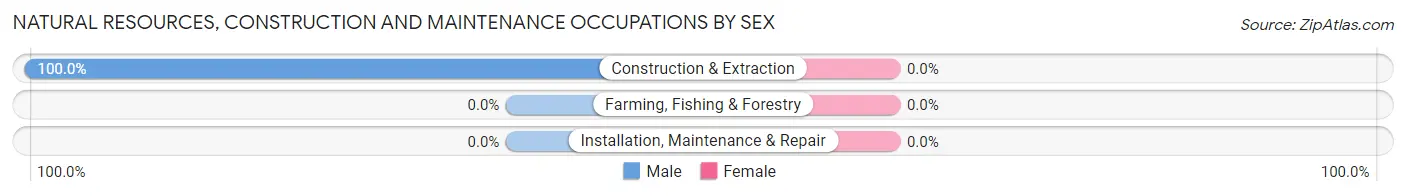
| Occupation | Male | Female |
| Farming, Fishing & Forestry | 0 (0.0%) | 0 (0.0%) |
| Construction & Extraction | 83 (100.0%) | 0 (0.0%) |
| Installation, Maintenance & Repair | 0 (0.0%) | 0 (0.0%) |
| Total (Category) | 83 (100.0%) | 0 (0.0%) |
| Total (Overall) | 163 (54.0%) | 139 (46.0%) |
Production, Transportation and Moving Occupations
The most common Production, Transportation and Moving occupations in Pinesburg are Transportation (79 | 26.2%), and Production (41 | 13.6%).
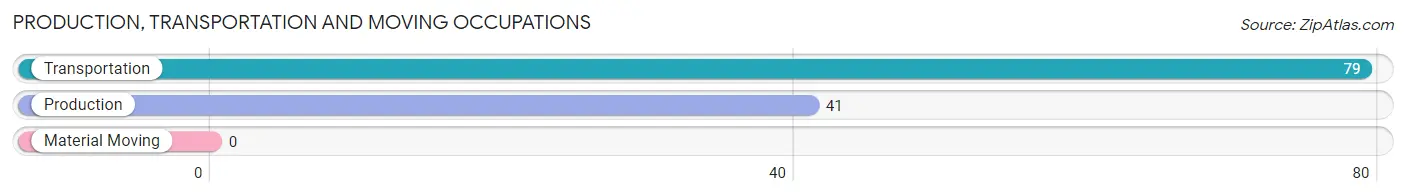
Production, Transportation and Moving Occupations by Sex
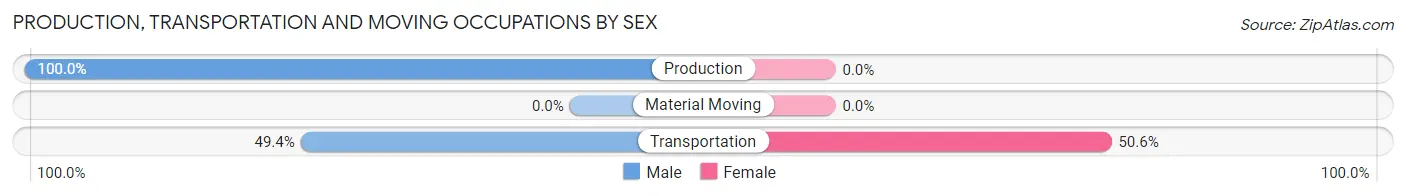
| Occupation | Male | Female |
| Production | 41 (100.0%) | 0 (0.0%) |
| Transportation | 39 (49.4%) | 40 (50.6%) |
| Material Moving | 0 (0.0%) | 0 (0.0%) |
| Total (Category) | 80 (66.7%) | 40 (33.3%) |
| Total (Overall) | 163 (54.0%) | 139 (46.0%) |
Employment Industries by Sex in Pinesburg
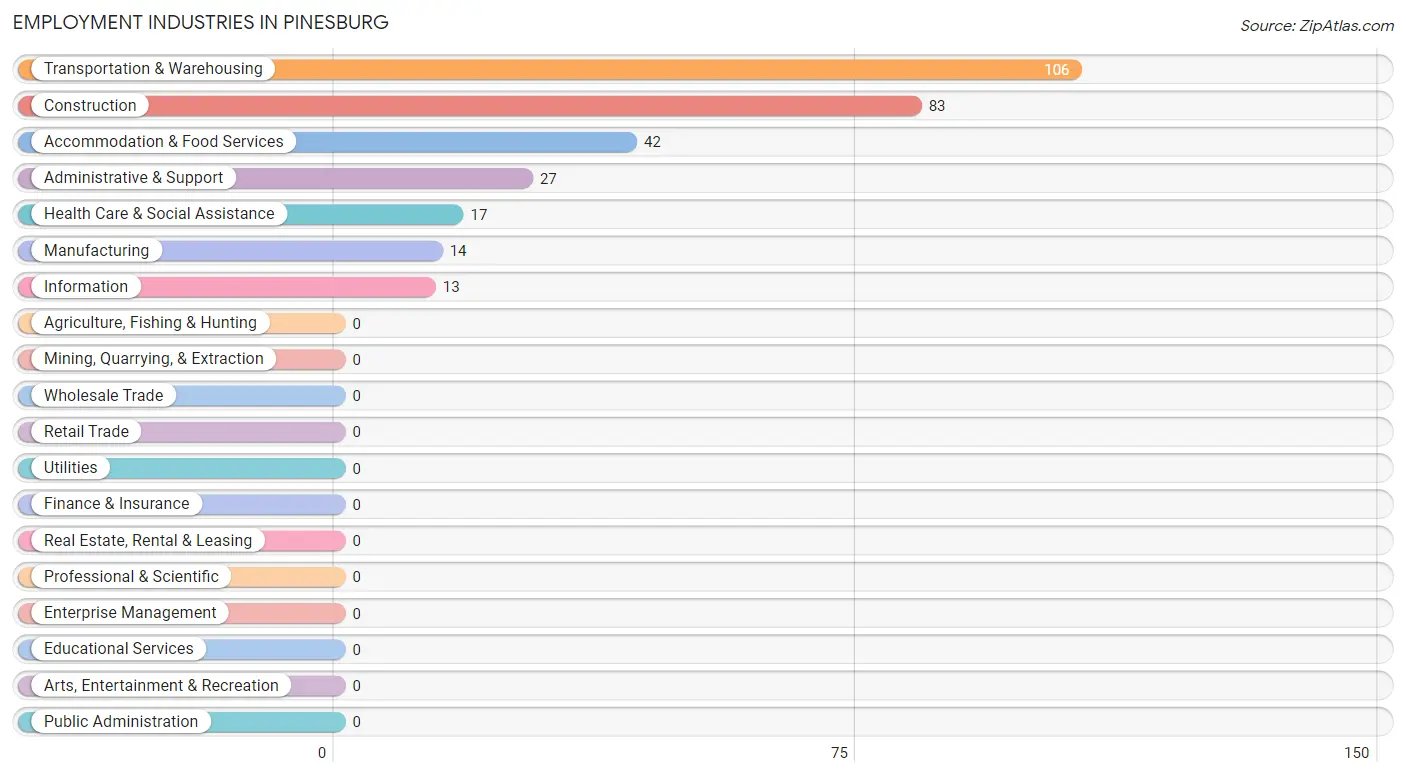
Employment Industries in Pinesburg
The major employment industries in Pinesburg include Transportation & Warehousing (106 | 35.1%), Construction (83 | 27.5%), Accommodation & Food Services (42 | 13.9%), Administrative & Support (27 | 8.9%), and Health Care & Social Assistance (17 | 5.6%).
Employment Industries by Sex in Pinesburg
The Pinesburg industries that see more men than women are Construction (100.0%), Manufacturing (100.0%), and Information (100.0%), whereas the industries that tend to have a higher number of women are Administrative & Support (100.0%), Health Care & Social Assistance (100.0%), and Accommodation & Food Services (100.0%).
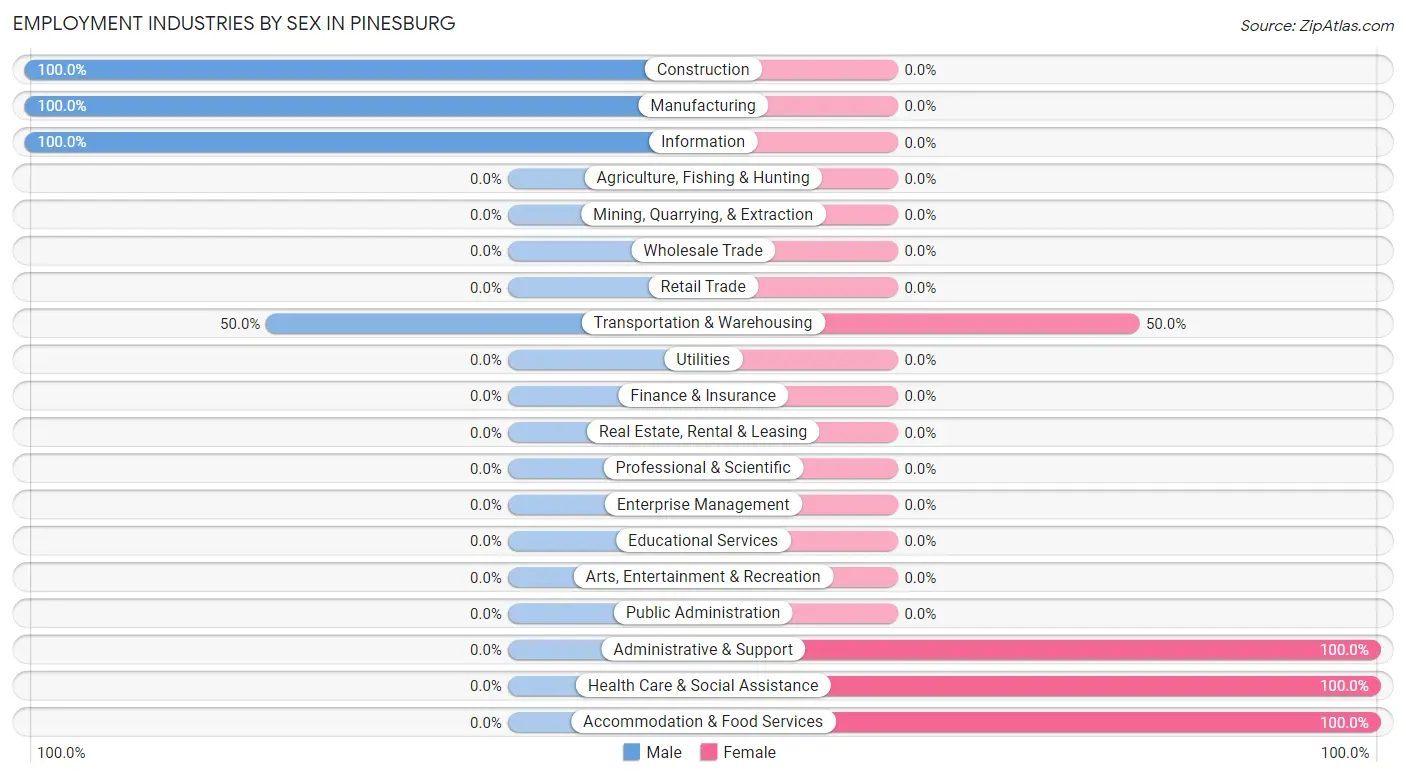
| Industry | Male | Female |
| Agriculture, Fishing & Hunting | 0 (0.0%) | 0 (0.0%) |
| Mining, Quarrying, & Extraction | 0 (0.0%) | 0 (0.0%) |
| Construction | 83 (100.0%) | 0 (0.0%) |
| Manufacturing | 14 (100.0%) | 0 (0.0%) |
| Wholesale Trade | 0 (0.0%) | 0 (0.0%) |
| Retail Trade | 0 (0.0%) | 0 (0.0%) |
| Transportation & Warehousing | 53 (50.0%) | 53 (50.0%) |
| Utilities | 0 (0.0%) | 0 (0.0%) |
| Information | 13 (100.0%) | 0 (0.0%) |
| Finance & Insurance | 0 (0.0%) | 0 (0.0%) |
| Real Estate, Rental & Leasing | 0 (0.0%) | 0 (0.0%) |
| Professional & Scientific | 0 (0.0%) | 0 (0.0%) |
| Enterprise Management | 0 (0.0%) | 0 (0.0%) |
| Administrative & Support | 0 (0.0%) | 27 (100.0%) |
| Educational Services | 0 (0.0%) | 0 (0.0%) |
| Health Care & Social Assistance | 0 (0.0%) | 17 (100.0%) |
| Arts, Entertainment & Recreation | 0 (0.0%) | 0 (0.0%) |
| Accommodation & Food Services | 0 (0.0%) | 42 (100.0%) |
| Public Administration | 0 (0.0%) | 0 (0.0%) |
| Total | 163 (54.0%) | 139 (46.0%) |
Education in Pinesburg
School Enrollment in Pinesburg
The most common levels of schooling among the 166 students in Pinesburg are elementary school (57 | 34.3%), high school (34 | 20.5%), and college / undergraduate (33 | 19.9%).
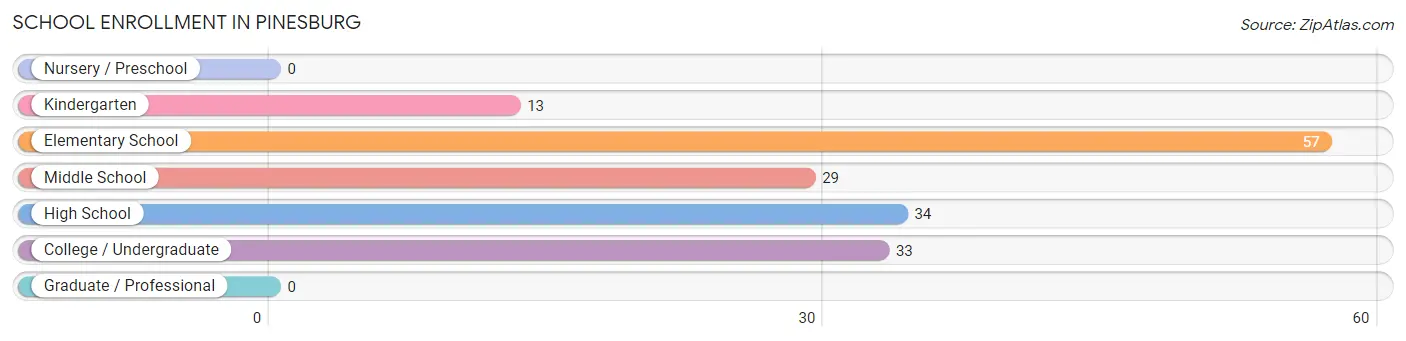
| School Level | # Students | % Students |
| Nursery / Preschool | 0 | 0.0% |
| Kindergarten | 13 | 7.8% |
| Elementary School | 57 | 34.3% |
| Middle School | 29 | 17.5% |
| High School | 34 | 20.5% |
| College / Undergraduate | 33 | 19.9% |
| Graduate / Professional | 0 | 0.0% |
| Total | 166 | 100.0% |
School Enrollment by Age by Funding Source in Pinesburg
Out of a total of 166 students who are enrolled in schools in Pinesburg, 18 (10.8%) attend a private institution, while the remaining 148 (89.2%) are enrolled in public schools. The age group of 15 to 17 year olds has the highest likelihood of being enrolled in private schools, with 18 (52.9% in the age bracket) enrolled. Conversely, the age group of 5 to 9 year old has the lowest likelihood of being enrolled in a private school, with 70 (100.0% in the age bracket) attending a public institution.
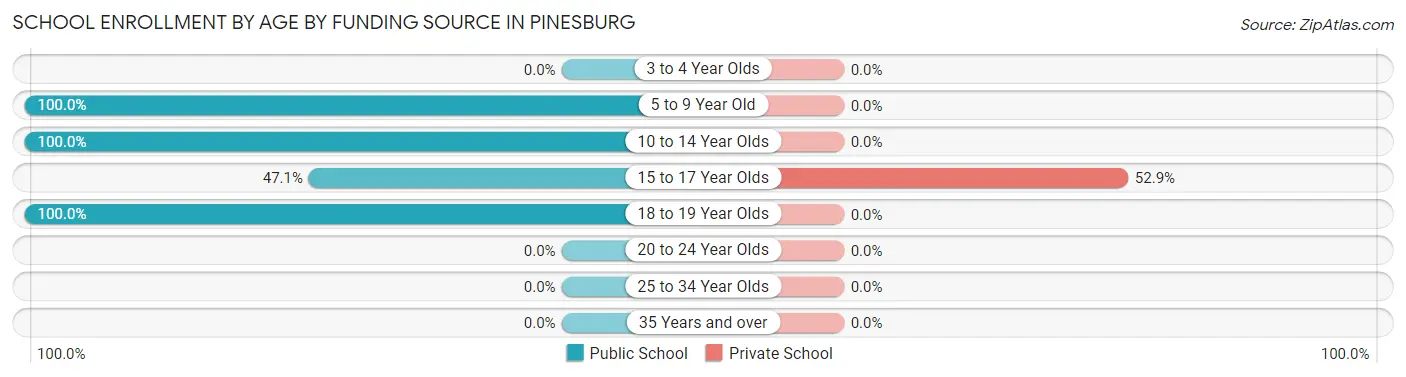
| Age Bracket | Public School | Private School |
| 3 to 4 Year Olds | 0 (0.0%) | 0 (0.0%) |
| 5 to 9 Year Old | 70 (100.0%) | 0 (0.0%) |
| 10 to 14 Year Olds | 29 (100.0%) | 0 (0.0%) |
| 15 to 17 Year Olds | 16 (47.1%) | 18 (52.9%) |
| 18 to 19 Year Olds | 33 (100.0%) | 0 (0.0%) |
| 20 to 24 Year Olds | 0 (0.0%) | 0 (0.0%) |
| 25 to 34 Year Olds | 0 (0.0%) | 0 (0.0%) |
| 35 Years and over | 0 (0.0%) | 0 (0.0%) |
| Total | 148 (89.2%) | 18 (10.8%) |
Educational Attainment by Field of Study in Pinesburg
, and business (17 | 100.0%) are the most common fields of study among 17 individuals in Pinesburg who have obtained a bachelor's degree or higher.
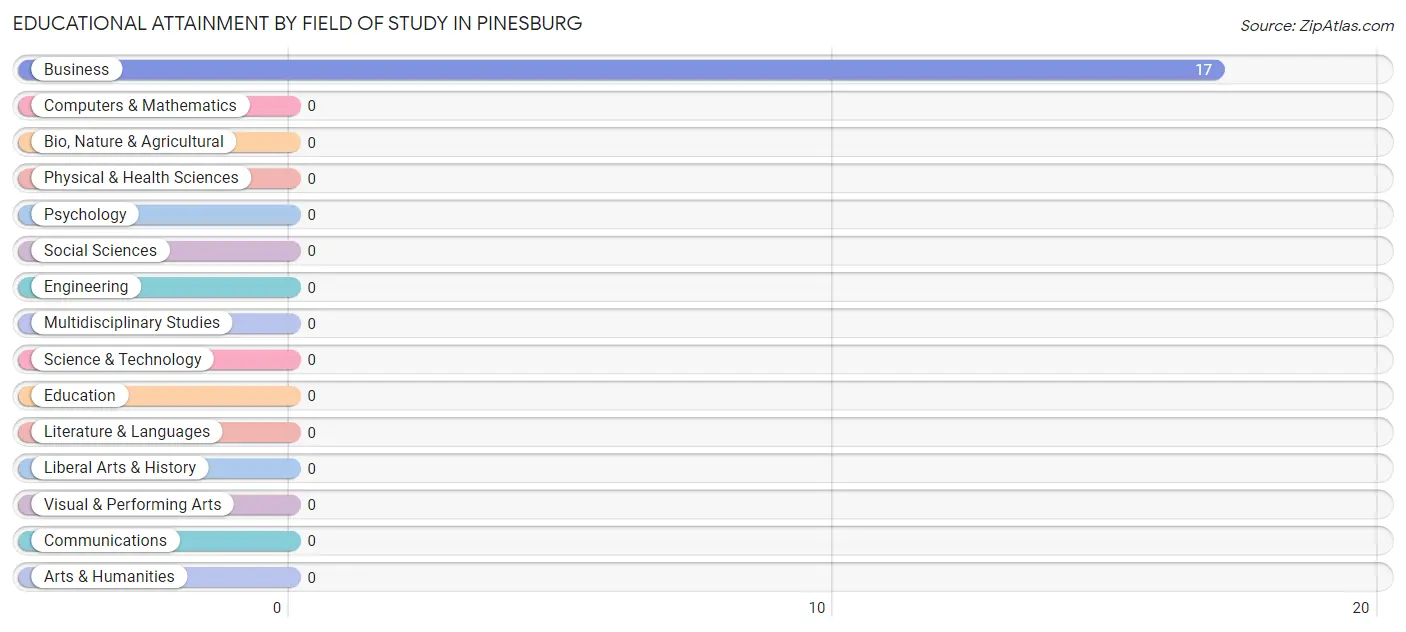
| Field of Study | # Graduates | % Graduates |
| Computers & Mathematics | 0 | 0.0% |
| Bio, Nature & Agricultural | 0 | 0.0% |
| Physical & Health Sciences | 0 | 0.0% |
| Psychology | 0 | 0.0% |
| Social Sciences | 0 | 0.0% |
| Engineering | 0 | 0.0% |
| Multidisciplinary Studies | 0 | 0.0% |
| Science & Technology | 0 | 0.0% |
| Business | 17 | 100.0% |
| Education | 0 | 0.0% |
| Literature & Languages | 0 | 0.0% |
| Liberal Arts & History | 0 | 0.0% |
| Visual & Performing Arts | 0 | 0.0% |
| Communications | 0 | 0.0% |
| Arts & Humanities | 0 | 0.0% |
| Total | 17 | 100.0% |
Transportation & Commute in Pinesburg
Vehicle Availability by Sex in Pinesburg
The most prevalent vehicle ownership categories in Pinesburg are males with 3 vehicles (66, accounting for 40.5%) and females with 3 vehicles (13, making up 47.5%).
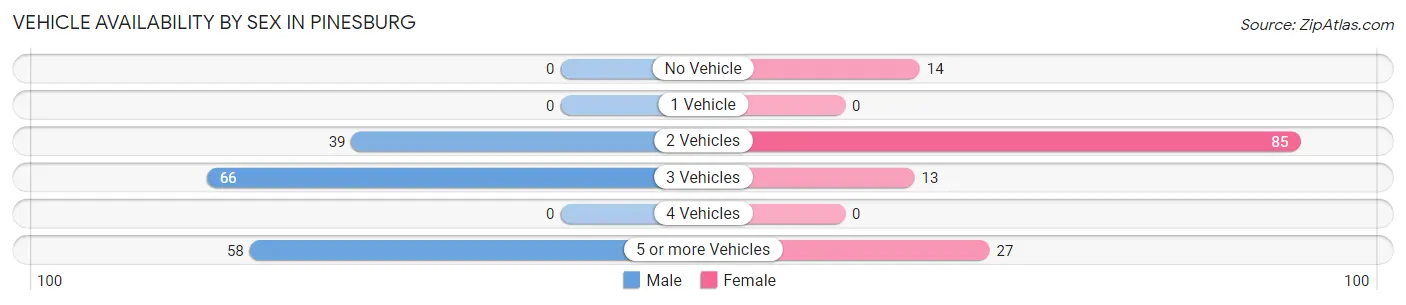
| Vehicles Available | Male | Female |
| No Vehicle | 0 (0.0%) | 14 (10.1%) |
| 1 Vehicle | 0 (0.0%) | 0 (0.0%) |
| 2 Vehicles | 39 (23.9%) | 85 (61.2%) |
| 3 Vehicles | 66 (40.5%) | 13 (9.3%) |
| 4 Vehicles | 0 (0.0%) | 0 (0.0%) |
| 5 or more Vehicles | 58 (35.6%) | 27 (19.4%) |
| Total | 163 (100.0%) | 139 (100.0%) |
Commute Time in Pinesburg
The most frequently occuring commute durations in Pinesburg are 10 to 14 minutes (150 commuters, 49.7%), 15 to 19 minutes (69 commuters, 22.9%), and 20 to 24 minutes (56 commuters, 18.5%).
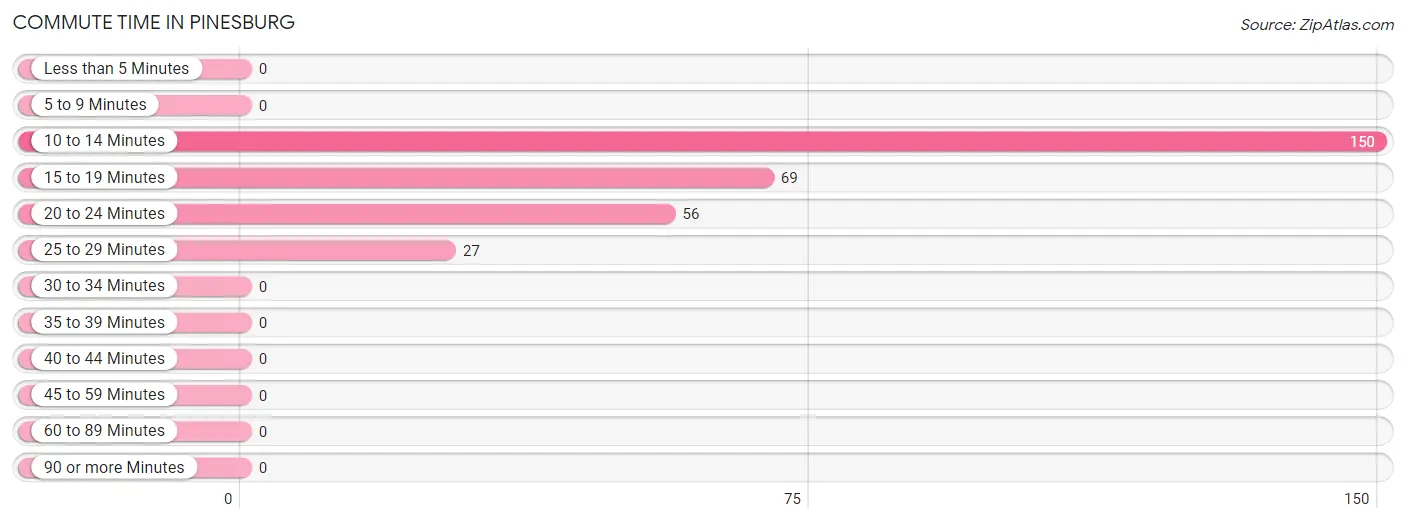
| Commute Time | # Commuters | % Commuters |
| Less than 5 Minutes | 0 | 0.0% |
| 5 to 9 Minutes | 0 | 0.0% |
| 10 to 14 Minutes | 150 | 49.7% |
| 15 to 19 Minutes | 69 | 22.9% |
| 20 to 24 Minutes | 56 | 18.5% |
| 25 to 29 Minutes | 27 | 8.9% |
| 30 to 34 Minutes | 0 | 0.0% |
| 35 to 39 Minutes | 0 | 0.0% |
| 40 to 44 Minutes | 0 | 0.0% |
| 45 to 59 Minutes | 0 | 0.0% |
| 60 to 89 Minutes | 0 | 0.0% |
| 90 or more Minutes | 0 | 0.0% |
Commute Time by Sex in Pinesburg
The most common commute times in Pinesburg are 10 to 14 minutes (67 commuters, 41.1%) for males and 10 to 14 minutes (83 commuters, 59.7%) for females.
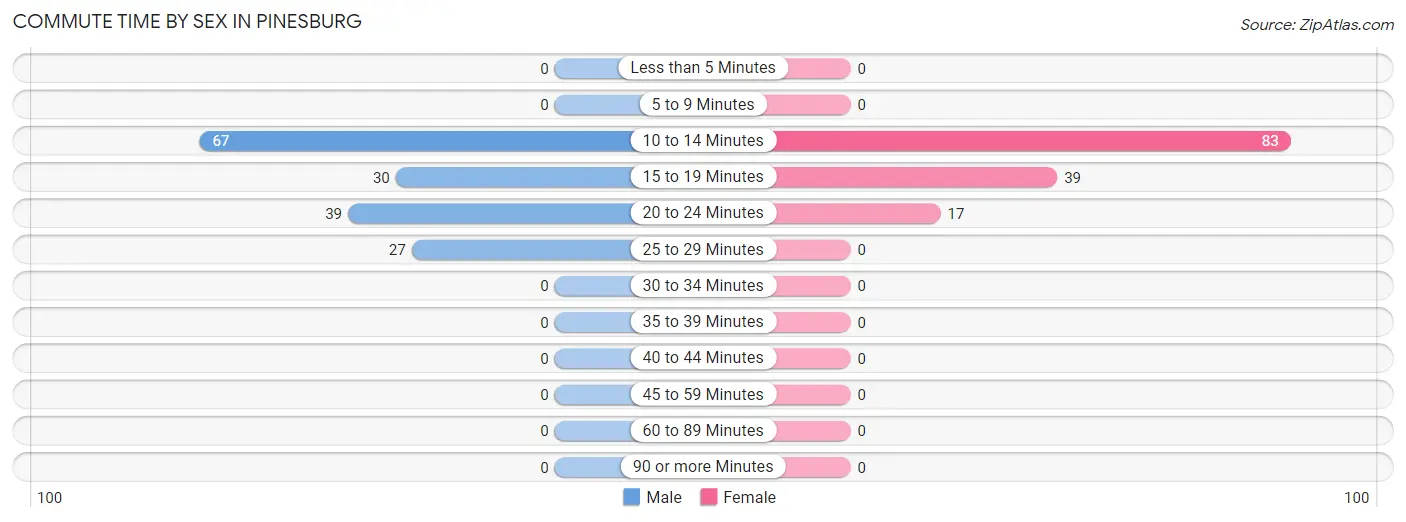
| Commute Time | Male | Female |
| Less than 5 Minutes | 0 (0.0%) | 0 (0.0%) |
| 5 to 9 Minutes | 0 (0.0%) | 0 (0.0%) |
| 10 to 14 Minutes | 67 (41.1%) | 83 (59.7%) |
| 15 to 19 Minutes | 30 (18.4%) | 39 (28.1%) |
| 20 to 24 Minutes | 39 (23.9%) | 17 (12.2%) |
| 25 to 29 Minutes | 27 (16.6%) | 0 (0.0%) |
| 30 to 34 Minutes | 0 (0.0%) | 0 (0.0%) |
| 35 to 39 Minutes | 0 (0.0%) | 0 (0.0%) |
| 40 to 44 Minutes | 0 (0.0%) | 0 (0.0%) |
| 45 to 59 Minutes | 0 (0.0%) | 0 (0.0%) |
| 60 to 89 Minutes | 0 (0.0%) | 0 (0.0%) |
| 90 or more Minutes | 0 (0.0%) | 0 (0.0%) |
Time of Departure to Work by Sex in Pinesburg
The most frequent times of departure to work in Pinesburg are 10:00 AM to 10:59 AM (97, 59.5%) for males and 8:00 AM to 8:29 AM (67, 48.2%) for females.
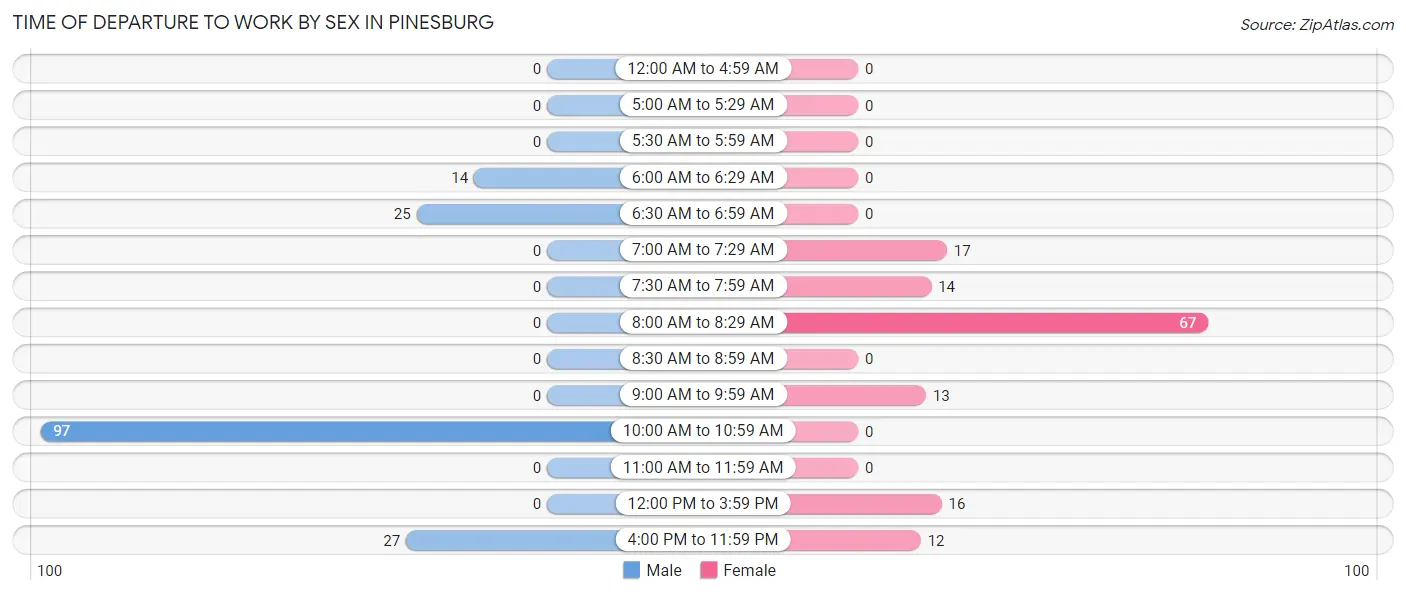
| Time of Departure | Male | Female |
| 12:00 AM to 4:59 AM | 0 (0.0%) | 0 (0.0%) |
| 5:00 AM to 5:29 AM | 0 (0.0%) | 0 (0.0%) |
| 5:30 AM to 5:59 AM | 0 (0.0%) | 0 (0.0%) |
| 6:00 AM to 6:29 AM | 14 (8.6%) | 0 (0.0%) |
| 6:30 AM to 6:59 AM | 25 (15.3%) | 0 (0.0%) |
| 7:00 AM to 7:29 AM | 0 (0.0%) | 17 (12.2%) |
| 7:30 AM to 7:59 AM | 0 (0.0%) | 14 (10.1%) |
| 8:00 AM to 8:29 AM | 0 (0.0%) | 67 (48.2%) |
| 8:30 AM to 8:59 AM | 0 (0.0%) | 0 (0.0%) |
| 9:00 AM to 9:59 AM | 0 (0.0%) | 13 (9.3%) |
| 10:00 AM to 10:59 AM | 97 (59.5%) | 0 (0.0%) |
| 11:00 AM to 11:59 AM | 0 (0.0%) | 0 (0.0%) |
| 12:00 PM to 3:59 PM | 0 (0.0%) | 16 (11.5%) |
| 4:00 PM to 11:59 PM | 27 (16.6%) | 12 (8.6%) |
| Total | 163 (100.0%) | 139 (100.0%) |
Housing Occupancy in Pinesburg
Occupancy by Ownership in Pinesburg
Of the total 154 dwellings in Pinesburg, owner-occupied units account for 154 (100.0%), while renter-occupied units make up 0 (0.0%).
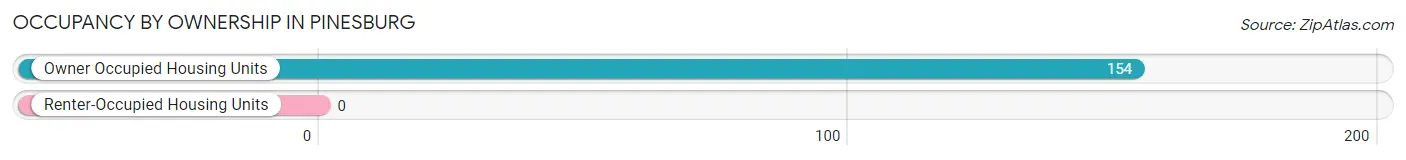
| Occupancy | # Housing Units | % Housing Units |
| Owner Occupied Housing Units | 154 | 100.0% |
| Renter-Occupied Housing Units | 0 | 0.0% |
| Total Occupied Housing Units | 154 | 100.0% |
Occupancy by Household Size in Pinesburg
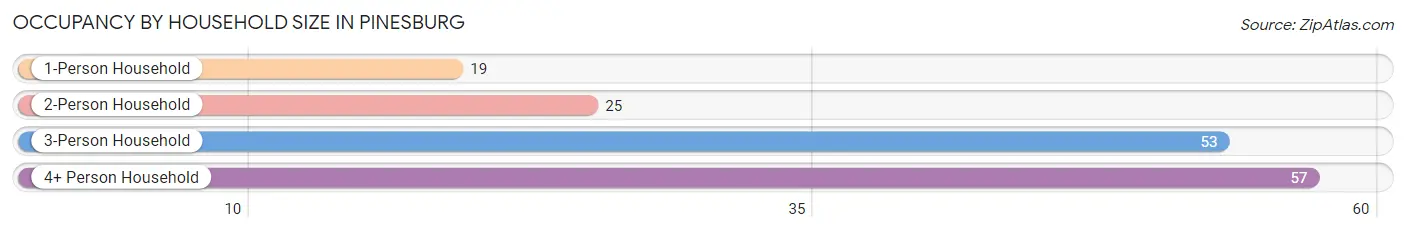
| Household Size | # Housing Units | % Housing Units |
| 1-Person Household | 19 | 12.3% |
| 2-Person Household | 25 | 16.2% |
| 3-Person Household | 53 | 34.4% |
| 4+ Person Household | 57 | 37.0% |
| Total Housing Units | 154 | 100.0% |
Occupancy by Ownership by Household Size in Pinesburg
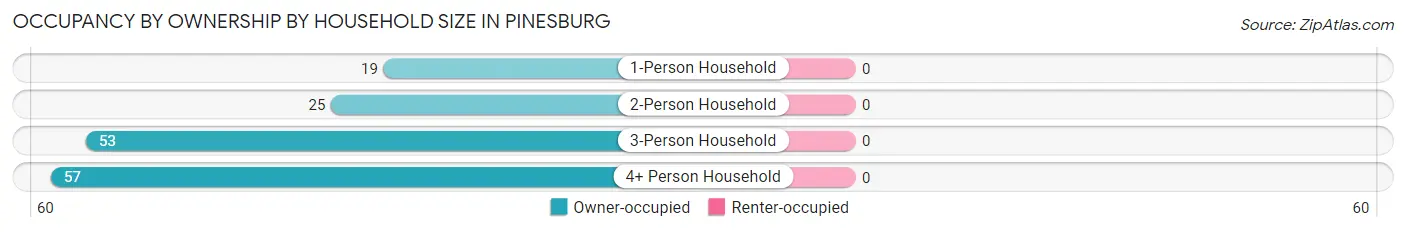
| Household Size | Owner-occupied | Renter-occupied |
| 1-Person Household | 19 (100.0%) | 0 (0.0%) |
| 2-Person Household | 25 (100.0%) | 0 (0.0%) |
| 3-Person Household | 53 (100.0%) | 0 (0.0%) |
| 4+ Person Household | 57 (100.0%) | 0 (0.0%) |
| Total Housing Units | 154 (100.0%) | 0 (0.0%) |
Occupancy by Educational Attainment in Pinesburg
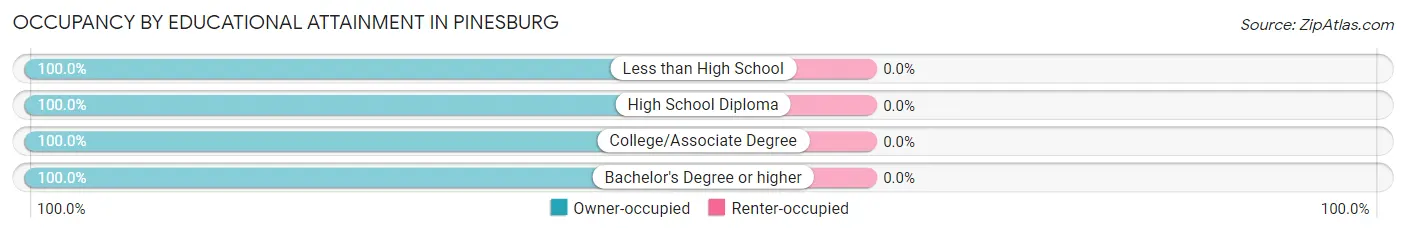
| Household Size | Owner-occupied | Renter-occupied |
| Less than High School | 33 (100.0%) | 0 (0.0%) |
| High School Diploma | 25 (100.0%) | 0 (0.0%) |
| College/Associate Degree | 79 (100.0%) | 0 (0.0%) |
| Bachelor's Degree or higher | 17 (100.0%) | 0 (0.0%) |
Occupancy by Age of Householder in Pinesburg
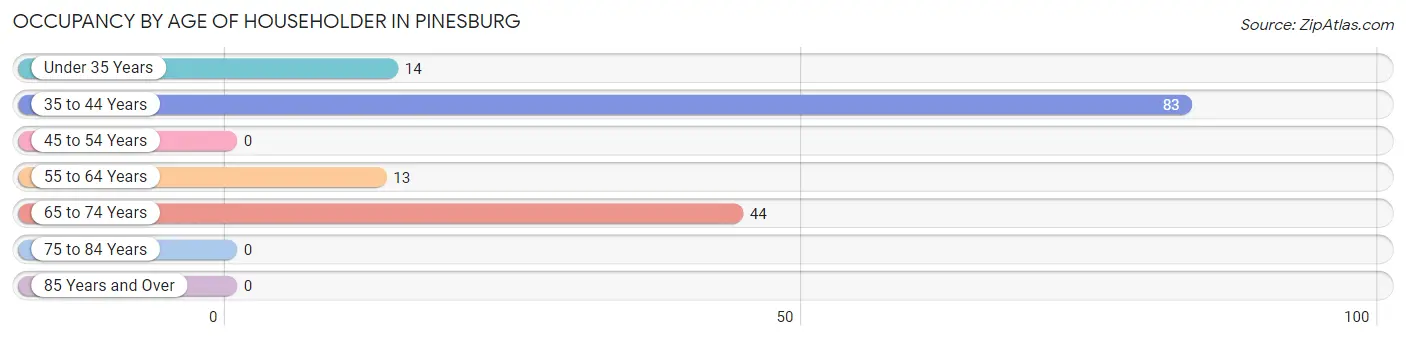
| Age Bracket | # Households | % Households |
| Under 35 Years | 14 | 9.1% |
| 35 to 44 Years | 83 | 53.9% |
| 45 to 54 Years | 0 | 0.0% |
| 55 to 64 Years | 13 | 8.4% |
| 65 to 74 Years | 44 | 28.6% |
| 75 to 84 Years | 0 | 0.0% |
| 85 Years and Over | 0 | 0.0% |
| Total | 154 | 100.0% |
Housing Finances in Pinesburg
Median Income by Occupancy in Pinesburg
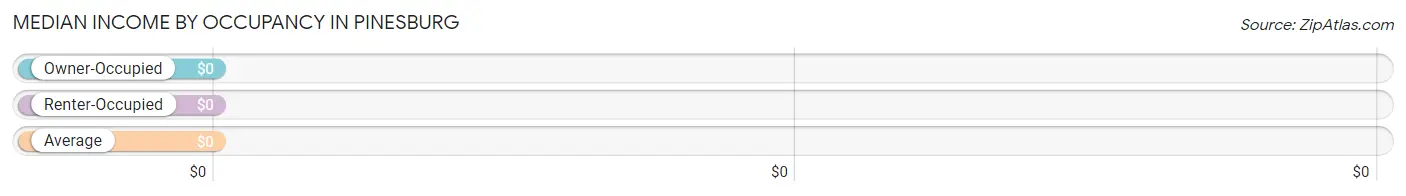
| Occupancy Type | # Households | Median Income |
| Owner-Occupied | 154 (100.0%) | $0 |
| Renter-Occupied | 0 (0.0%) | $0 |
| Average | 154 (100.0%) | $0 |
Occupancy by Householder Income Bracket in Pinesburg
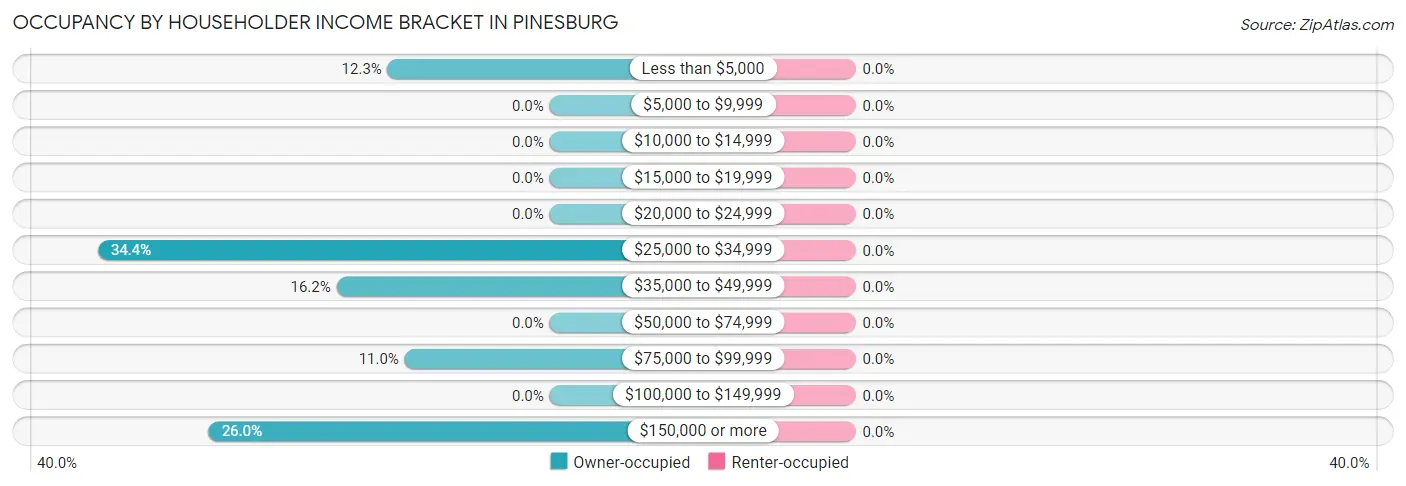
| Income Bracket | Owner-occupied | Renter-occupied |
| Less than $5,000 | 19 (12.3%) | 0 (0.0%) |
| $5,000 to $9,999 | 0 (0.0%) | 0 (0.0%) |
| $10,000 to $14,999 | 0 (0.0%) | 0 (0.0%) |
| $15,000 to $19,999 | 0 (0.0%) | 0 (0.0%) |
| $20,000 to $24,999 | 0 (0.0%) | 0 (0.0%) |
| $25,000 to $34,999 | 53 (34.4%) | 0 (0.0%) |
| $35,000 to $49,999 | 25 (16.2%) | 0 (0.0%) |
| $50,000 to $74,999 | 0 (0.0%) | 0 (0.0%) |
| $75,000 to $99,999 | 17 (11.0%) | 0 (0.0%) |
| $100,000 to $149,999 | 0 (0.0%) | 0 (0.0%) |
| $150,000 or more | 40 (26.0%) | 0 (0.0%) |
| Total | 154 (100.0%) | 0 (0.0%) |
Monthly Housing Cost Tiers in Pinesburg
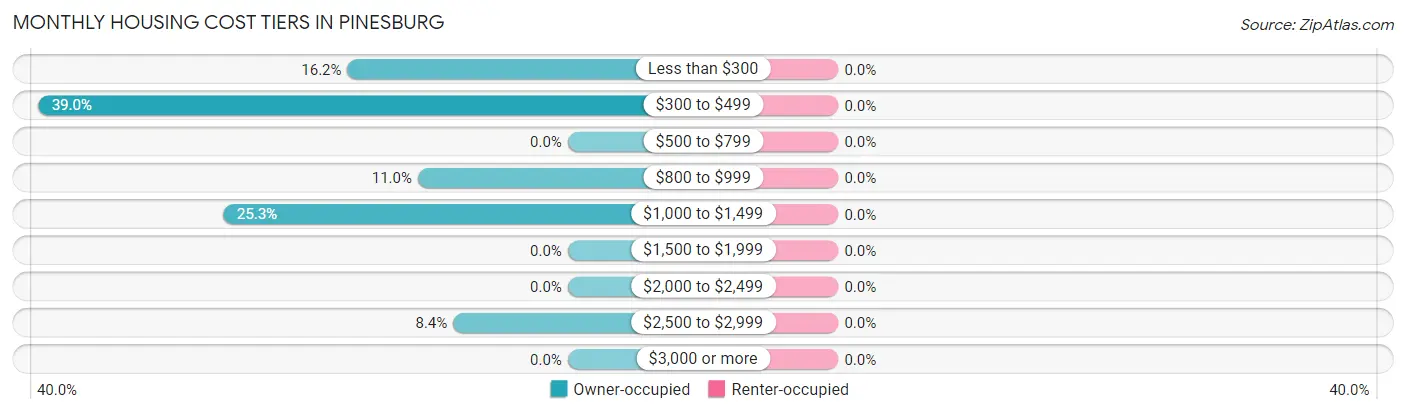
| Monthly Cost | Owner-occupied | Renter-occupied |
| Less than $300 | 25 (16.2%) | 0 (0.0%) |
| $300 to $499 | 60 (39.0%) | 0 (0.0%) |
| $500 to $799 | 0 (0.0%) | 0 (0.0%) |
| $800 to $999 | 17 (11.0%) | 0 (0.0%) |
| $1,000 to $1,499 | 39 (25.3%) | 0 (0.0%) |
| $1,500 to $1,999 | 0 (0.0%) | 0 (0.0%) |
| $2,000 to $2,499 | 0 (0.0%) | 0 (0.0%) |
| $2,500 to $2,999 | 13 (8.4%) | 0 (0.0%) |
| $3,000 or more | 0 (0.0%) | 0 (0.0%) |
| Total | 154 (100.0%) | 0 (0.0%) |
Physical Housing Characteristics in Pinesburg
Housing Structures in Pinesburg
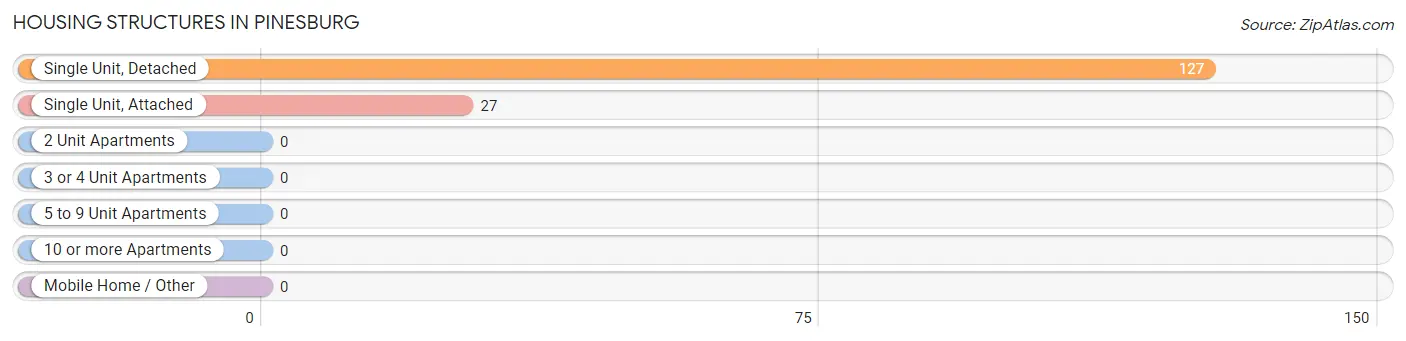
| Structure Type | # Housing Units | % Housing Units |
| Single Unit, Detached | 127 | 82.5% |
| Single Unit, Attached | 27 | 17.5% |
| 2 Unit Apartments | 0 | 0.0% |
| 3 or 4 Unit Apartments | 0 | 0.0% |
| 5 to 9 Unit Apartments | 0 | 0.0% |
| 10 or more Apartments | 0 | 0.0% |
| Mobile Home / Other | 0 | 0.0% |
| Total | 154 | 100.0% |
Housing Structures by Occupancy in Pinesburg
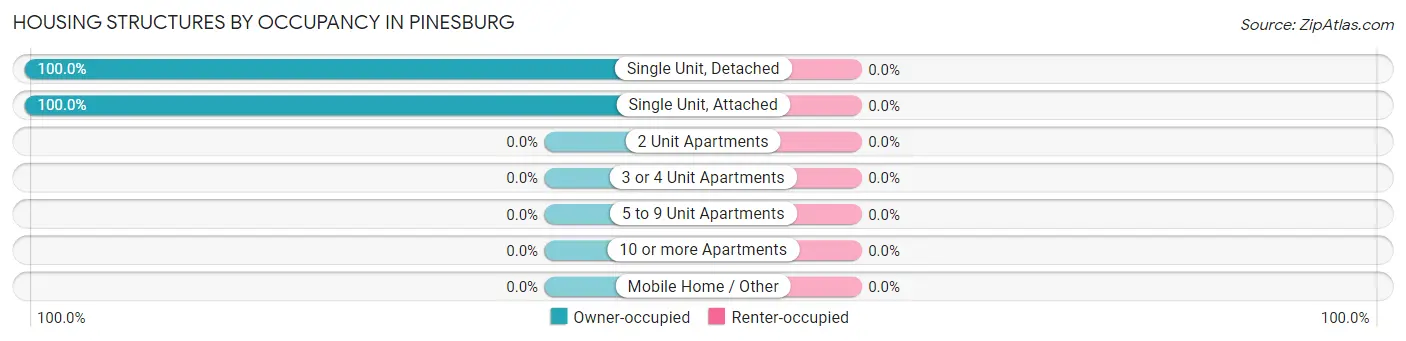
| Structure Type | Owner-occupied | Renter-occupied |
| Single Unit, Detached | 127 (100.0%) | 0 (0.0%) |
| Single Unit, Attached | 27 (100.0%) | 0 (0.0%) |
| 2 Unit Apartments | 0 (0.0%) | 0 (0.0%) |
| 3 or 4 Unit Apartments | 0 (0.0%) | 0 (0.0%) |
| 5 to 9 Unit Apartments | 0 (0.0%) | 0 (0.0%) |
| 10 or more Apartments | 0 (0.0%) | 0 (0.0%) |
| Mobile Home / Other | 0 (0.0%) | 0 (0.0%) |
| Total | 154 (100.0%) | 0 (0.0%) |
Housing Structures by Number of Rooms in Pinesburg
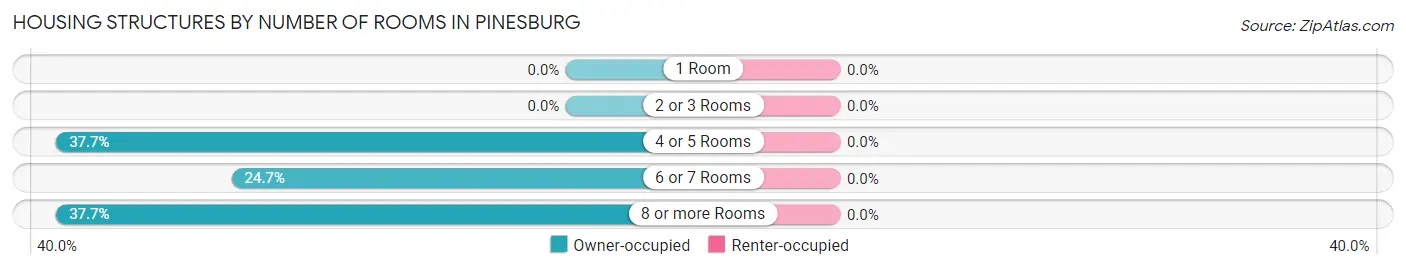
| Number of Rooms | Owner-occupied | Renter-occupied |
| 1 Room | 0 (0.0%) | 0 (0.0%) |
| 2 or 3 Rooms | 0 (0.0%) | 0 (0.0%) |
| 4 or 5 Rooms | 58 (37.7%) | 0 (0.0%) |
| 6 or 7 Rooms | 38 (24.7%) | 0 (0.0%) |
| 8 or more Rooms | 58 (37.7%) | 0 (0.0%) |
| Total | 154 (100.0%) | 0 (0.0%) |
Housing Structure by Heating Type in Pinesburg
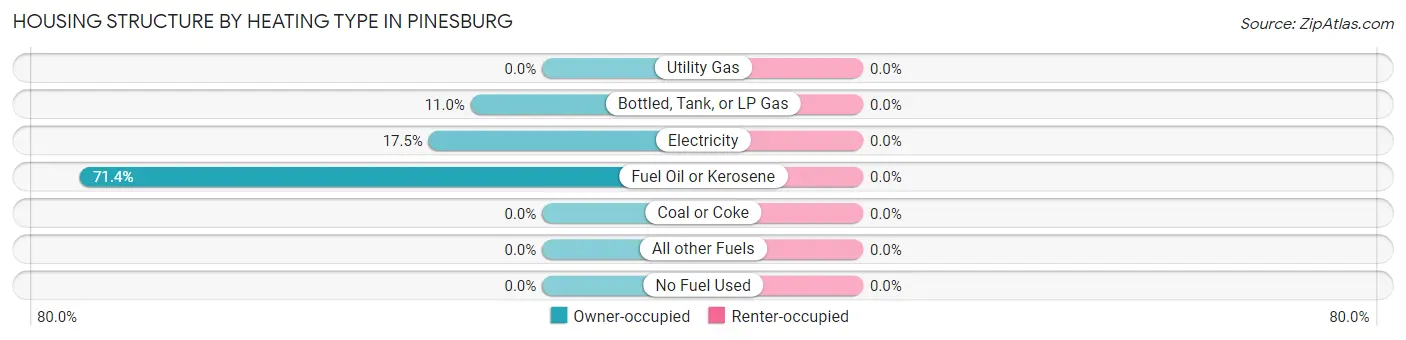
| Heating Type | Owner-occupied | Renter-occupied |
| Utility Gas | 0 (0.0%) | 0 (0.0%) |
| Bottled, Tank, or LP Gas | 17 (11.0%) | 0 (0.0%) |
| Electricity | 27 (17.5%) | 0 (0.0%) |
| Fuel Oil or Kerosene | 110 (71.4%) | 0 (0.0%) |
| Coal or Coke | 0 (0.0%) | 0 (0.0%) |
| All other Fuels | 0 (0.0%) | 0 (0.0%) |
| No Fuel Used | 0 (0.0%) | 0 (0.0%) |
| Total | 154 (100.0%) | 0 (0.0%) |
Household Vehicle Usage in Pinesburg
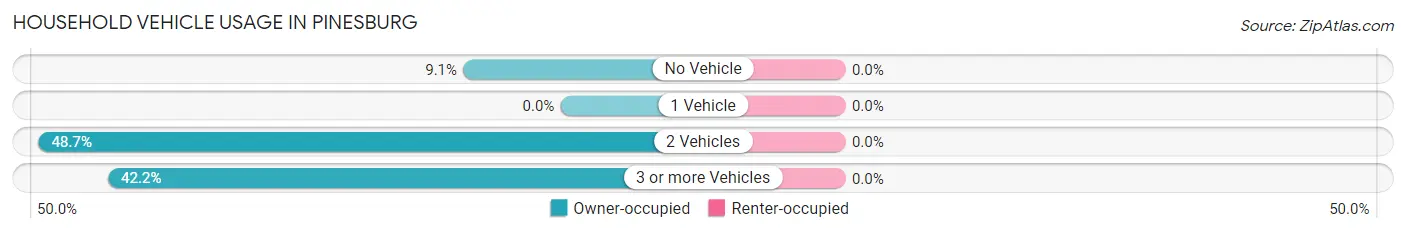
| Vehicles per Household | Owner-occupied | Renter-occupied |
| No Vehicle | 14 (9.1%) | 0 (0.0%) |
| 1 Vehicle | 0 (0.0%) | 0 (0.0%) |
| 2 Vehicles | 75 (48.7%) | 0 (0.0%) |
| 3 or more Vehicles | 65 (42.2%) | 0 (0.0%) |
| Total | 154 (100.0%) | 0 (0.0%) |
Real Estate & Mortgages in Pinesburg
Real Estate and Mortgage Overview in Pinesburg
| Characteristic | Without Mortgage | With Mortgage |
| Housing Units | 58 | 96 |
| Median Property Value | $212,800 | $186,700 |
| Median Household Income | - | - |
| Monthly Housing Costs | $314 | $0 |
| Real Estate Taxes | $1,300 | $0 |
Property Value by Mortgage Status in Pinesburg
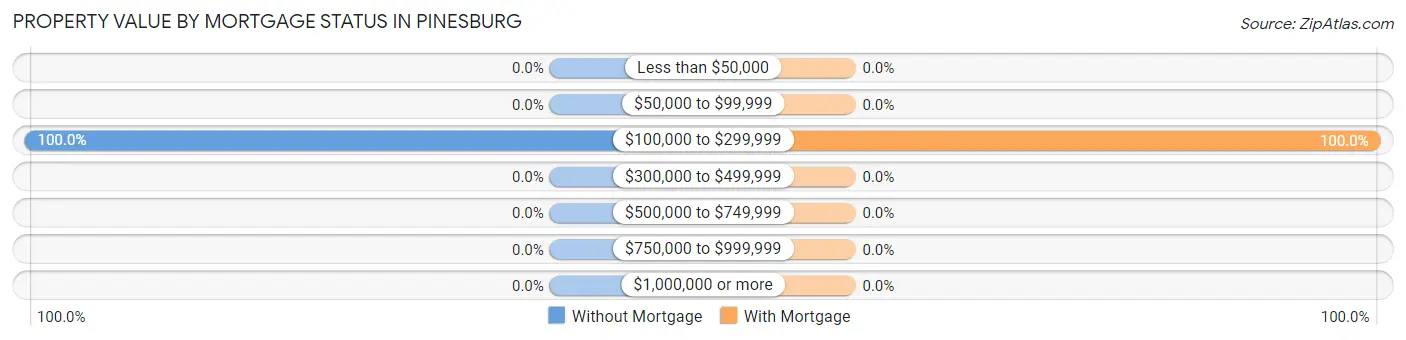
| Property Value | Without Mortgage | With Mortgage |
| Less than $50,000 | 0 (0.0%) | 0 (0.0%) |
| $50,000 to $99,999 | 0 (0.0%) | 0 (0.0%) |
| $100,000 to $299,999 | 58 (100.0%) | 96 (100.0%) |
| $300,000 to $499,999 | 0 (0.0%) | 0 (0.0%) |
| $500,000 to $749,999 | 0 (0.0%) | 0 (0.0%) |
| $750,000 to $999,999 | 0 (0.0%) | 0 (0.0%) |
| $1,000,000 or more | 0 (0.0%) | 0 (0.0%) |
| Total | 58 (100.0%) | 96 (100.0%) |
Household Income by Mortgage Status in Pinesburg
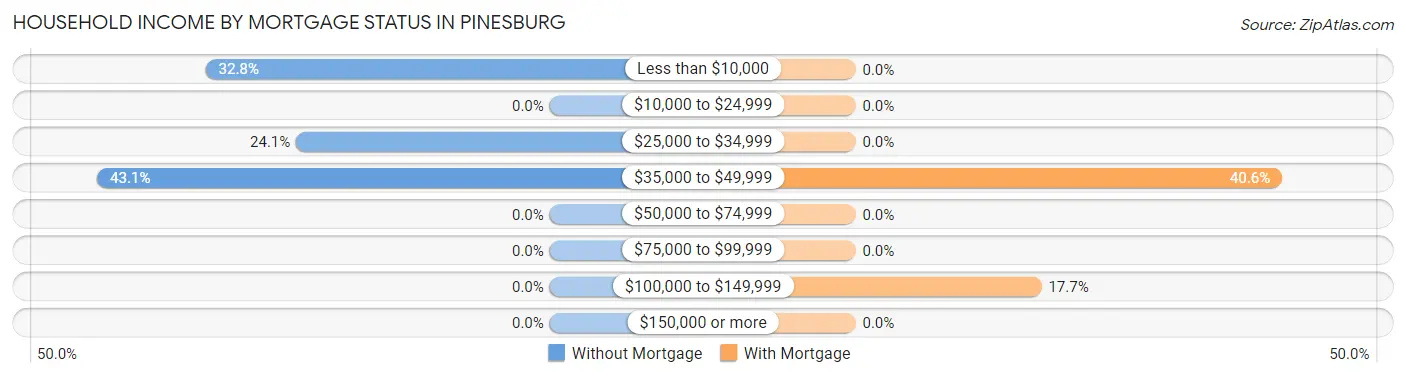
| Household Income | Without Mortgage | With Mortgage |
| Less than $10,000 | 19 (32.8%) | 0 (0.0%) |
| $10,000 to $24,999 | 0 (0.0%) | 0 (0.0%) |
| $25,000 to $34,999 | 14 (24.1%) | 0 (0.0%) |
| $35,000 to $49,999 | 25 (43.1%) | 39 (40.6%) |
| $50,000 to $74,999 | 0 (0.0%) | 0 (0.0%) |
| $75,000 to $99,999 | 0 (0.0%) | 0 (0.0%) |
| $100,000 to $149,999 | 0 (0.0%) | 17 (17.7%) |
| $150,000 or more | 0 (0.0%) | 0 (0.0%) |
| Total | 58 (100.0%) | 96 (100.0%) |
Property Value to Household Income Ratio in Pinesburg
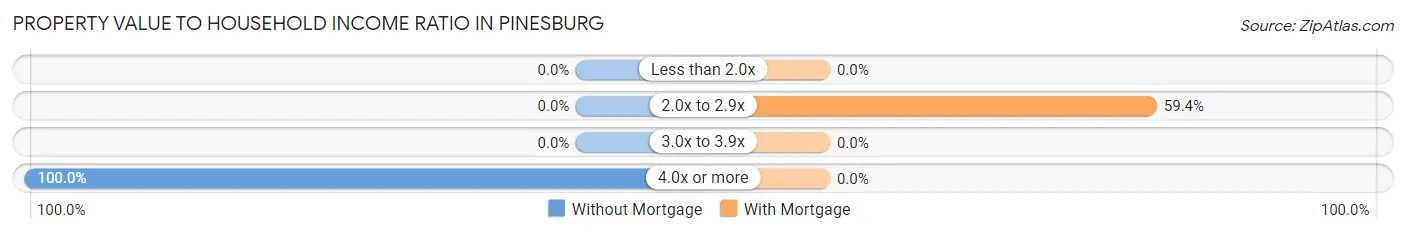
| Value-to-Income Ratio | Without Mortgage | With Mortgage |
| Less than 2.0x | 0 (0.0%) | 0 (0.0%) |
| 2.0x to 2.9x | 0 (0.0%) | 57 (59.4%) |
| 3.0x to 3.9x | 0 (0.0%) | 0 (0.0%) |
| 4.0x or more | 58 (100.0%) | 0 (0.0%) |
| Total | 58 (100.0%) | 96 (100.0%) |
Real Estate Taxes by Mortgage Status in Pinesburg
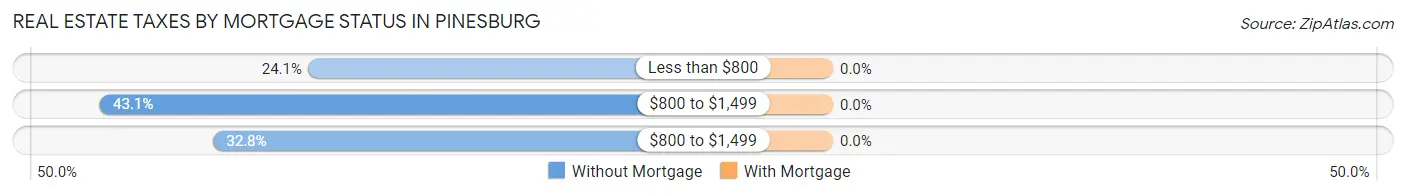
| Property Taxes | Without Mortgage | With Mortgage |
| Less than $800 | 14 (24.1%) | 0 (0.0%) |
| $800 to $1,499 | 25 (43.1%) | 0 (0.0%) |
| $800 to $1,499 | 19 (32.8%) | 0 (0.0%) |
| Total | 58 (100.0%) | 96 (100.0%) |
Health & Disability in Pinesburg
Health Insurance Coverage by Age in Pinesburg
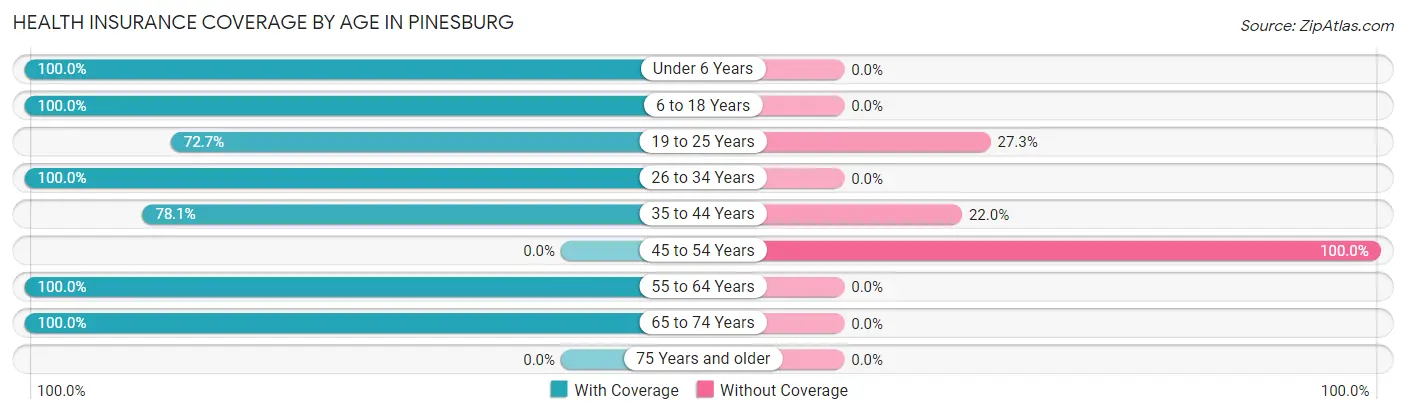
| Age Bracket | With Coverage | Without Coverage |
| Under 6 Years | 16 (100.0%) | 0 (0.0%) |
| 6 to 18 Years | 145 (100.0%) | 0 (0.0%) |
| 19 to 25 Years | 56 (72.7%) | 21 (27.3%) |
| 26 to 34 Years | 27 (100.0%) | 0 (0.0%) |
| 35 to 44 Years | 96 (78.0%) | 27 (22.0%) |
| 45 to 54 Years | 0 (0.0%) | 28 (100.0%) |
| 55 to 64 Years | 27 (100.0%) | 0 (0.0%) |
| 65 to 74 Years | 68 (100.0%) | 0 (0.0%) |
| 75 Years and older | 0 (0.0%) | 0 (0.0%) |
| Total | 435 (85.1%) | 76 (14.9%) |
Health Insurance Coverage by Citizenship Status in Pinesburg
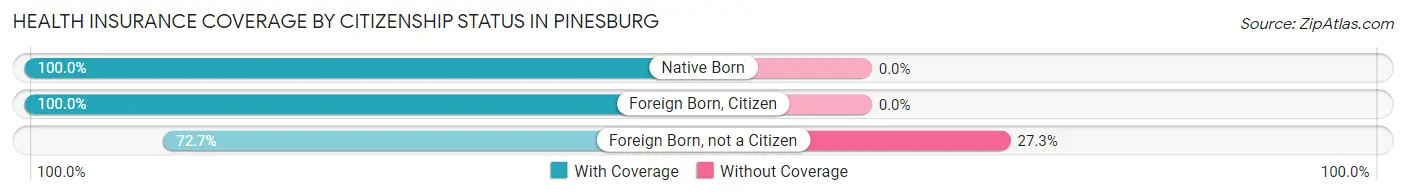
| Citizenship Status | With Coverage | Without Coverage |
| Native Born | 16 (100.0%) | 0 (0.0%) |
| Foreign Born, Citizen | 145 (100.0%) | 0 (0.0%) |
| Foreign Born, not a Citizen | 56 (72.7%) | 21 (27.3%) |
Health Insurance Coverage by Household Income in Pinesburg
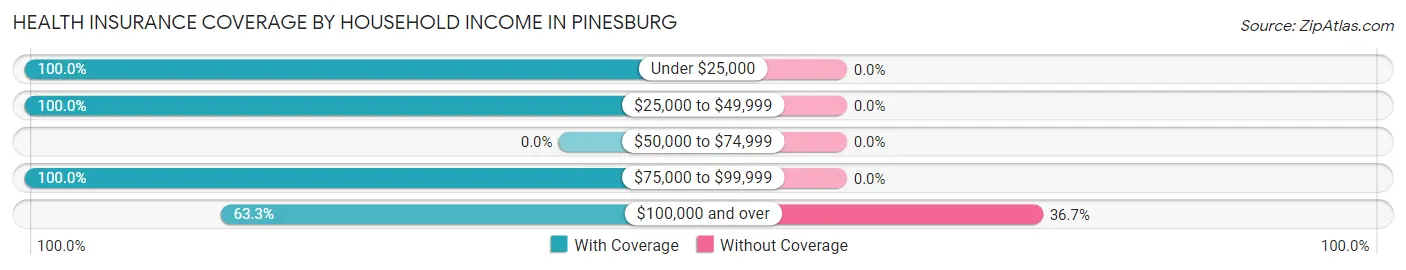
| Household Income | With Coverage | Without Coverage |
| Under $25,000 | 19 (100.0%) | 0 (0.0%) |
| $25,000 to $49,999 | 207 (100.0%) | 0 (0.0%) |
| $50,000 to $74,999 | 0 (0.0%) | 0 (0.0%) |
| $75,000 to $99,999 | 78 (100.0%) | 0 (0.0%) |
| $100,000 and over | 131 (63.3%) | 76 (36.7%) |
Public vs Private Health Insurance Coverage by Age in Pinesburg
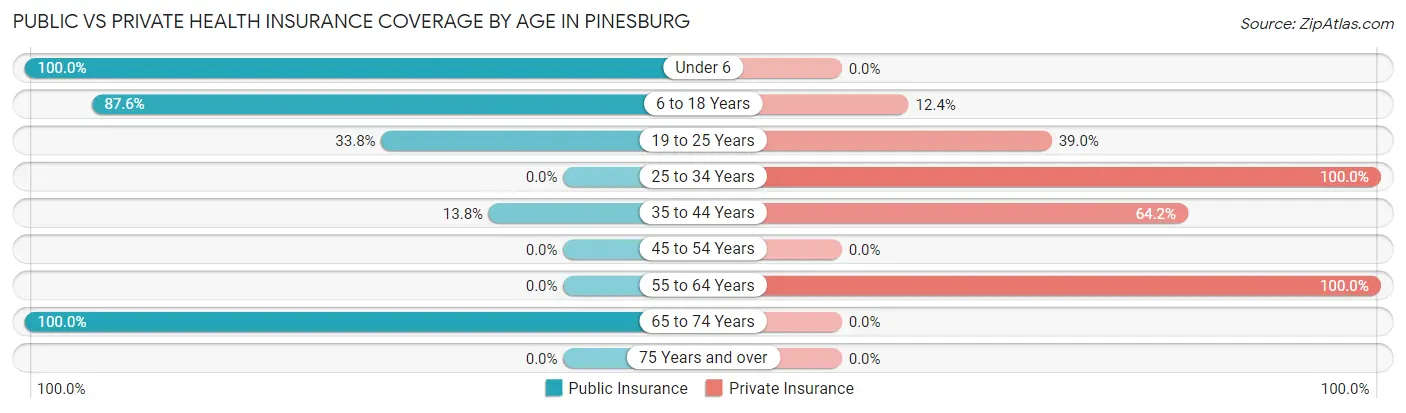
| Age Bracket | Public Insurance | Private Insurance |
| Under 6 | 16 (100.0%) | 0 (0.0%) |
| 6 to 18 Years | 127 (87.6%) | 18 (12.4%) |
| 19 to 25 Years | 26 (33.8%) | 30 (39.0%) |
| 25 to 34 Years | 0 (0.0%) | 27 (100.0%) |
| 35 to 44 Years | 17 (13.8%) | 79 (64.2%) |
| 45 to 54 Years | 0 (0.0%) | 0 (0.0%) |
| 55 to 64 Years | 0 (0.0%) | 27 (100.0%) |
| 65 to 74 Years | 68 (100.0%) | 0 (0.0%) |
| 75 Years and over | 0 (0.0%) | 0 (0.0%) |
| Total | 254 (49.7%) | 181 (35.4%) |
Disability Status by Sex by Age in Pinesburg
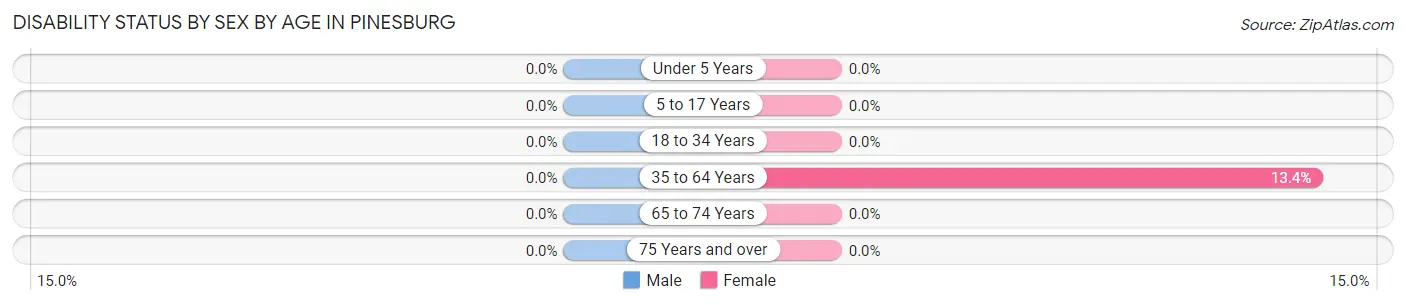
| Age Bracket | Male | Female |
| Under 5 Years | 0 (0.0%) | 0 (0.0%) |
| 5 to 17 Years | 0 (0.0%) | 0 (0.0%) |
| 18 to 34 Years | 0 (0.0%) | 0 (0.0%) |
| 35 to 64 Years | 0 (0.0%) | 13 (13.4%) |
| 65 to 74 Years | 0 (0.0%) | 0 (0.0%) |
| 75 Years and over | 0 (0.0%) | 0 (0.0%) |
Disability Class by Sex by Age in Pinesburg
Disability Class: Hearing Difficulty
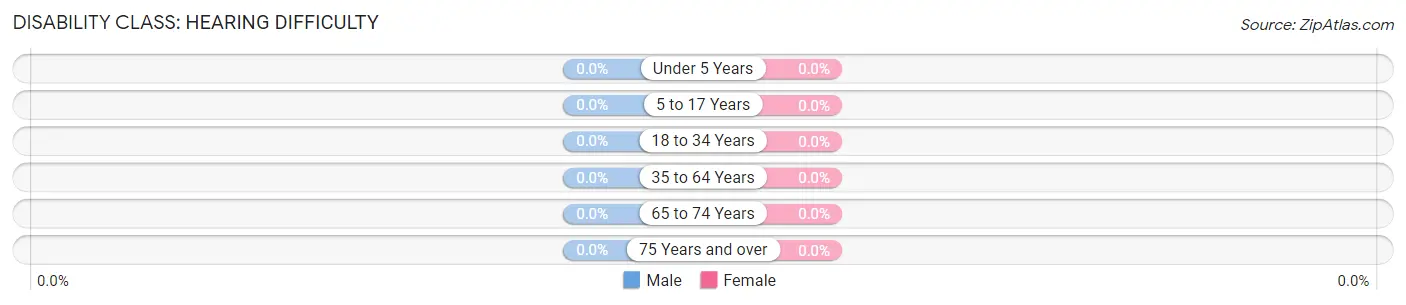
| Age Bracket | Male | Female |
| Under 5 Years | 0 (0.0%) | 0 (0.0%) |
| 5 to 17 Years | 0 (0.0%) | 0 (0.0%) |
| 18 to 34 Years | 0 (0.0%) | 0 (0.0%) |
| 35 to 64 Years | 0 (0.0%) | 0 (0.0%) |
| 65 to 74 Years | 0 (0.0%) | 0 (0.0%) |
| 75 Years and over | 0 (0.0%) | 0 (0.0%) |
Disability Class: Vision Difficulty
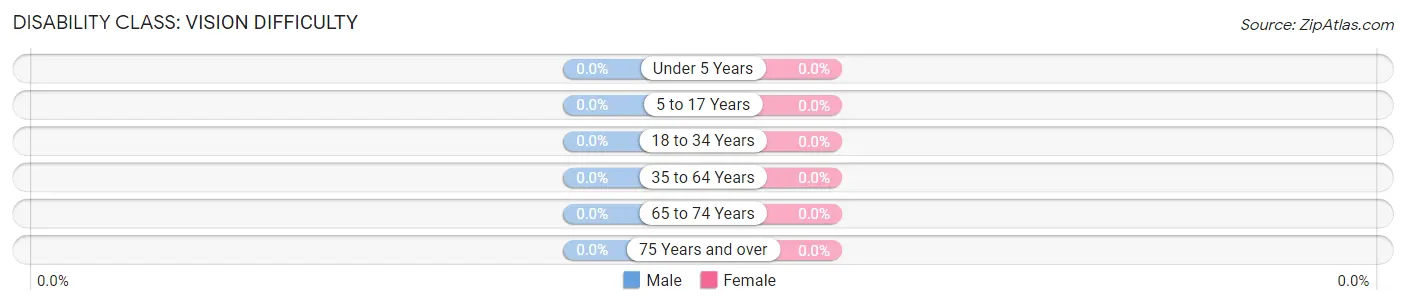
| Age Bracket | Male | Female |
| Under 5 Years | 0 (0.0%) | 0 (0.0%) |
| 5 to 17 Years | 0 (0.0%) | 0 (0.0%) |
| 18 to 34 Years | 0 (0.0%) | 0 (0.0%) |
| 35 to 64 Years | 0 (0.0%) | 0 (0.0%) |
| 65 to 74 Years | 0 (0.0%) | 0 (0.0%) |
| 75 Years and over | 0 (0.0%) | 0 (0.0%) |
Disability Class: Cognitive Difficulty
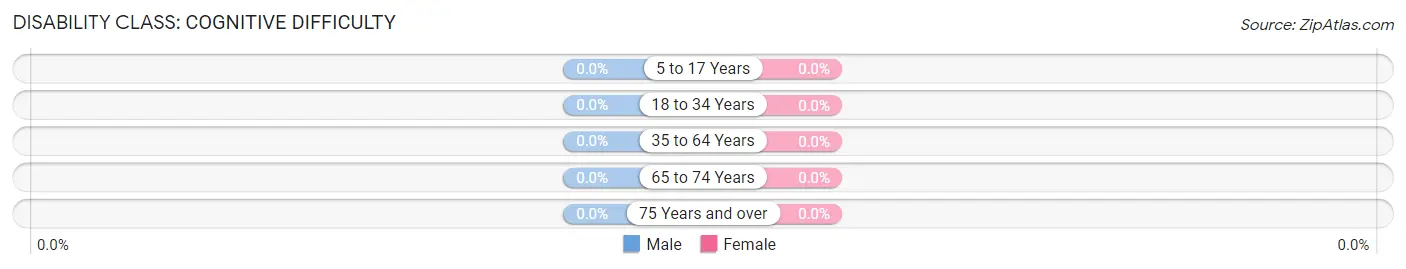
| Age Bracket | Male | Female |
| 5 to 17 Years | 0 (0.0%) | 0 (0.0%) |
| 18 to 34 Years | 0 (0.0%) | 0 (0.0%) |
| 35 to 64 Years | 0 (0.0%) | 0 (0.0%) |
| 65 to 74 Years | 0 (0.0%) | 0 (0.0%) |
| 75 Years and over | 0 (0.0%) | 0 (0.0%) |
Disability Class: Ambulatory Difficulty
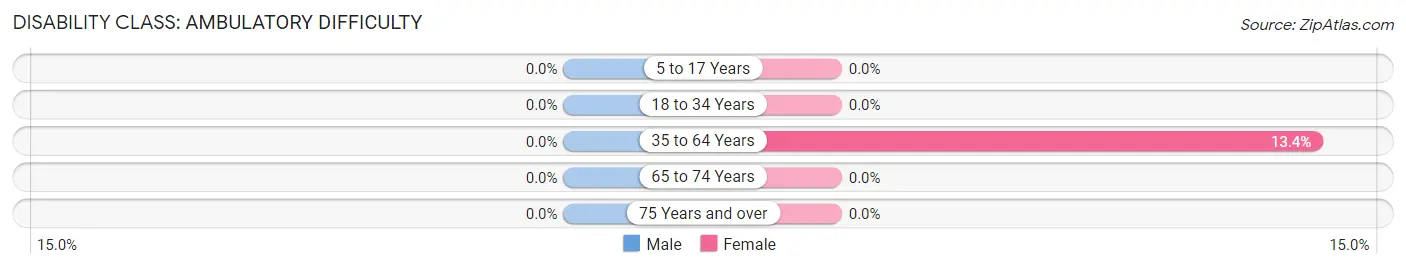
| Age Bracket | Male | Female |
| 5 to 17 Years | 0 (0.0%) | 0 (0.0%) |
| 18 to 34 Years | 0 (0.0%) | 0 (0.0%) |
| 35 to 64 Years | 0 (0.0%) | 13 (13.4%) |
| 65 to 74 Years | 0 (0.0%) | 0 (0.0%) |
| 75 Years and over | 0 (0.0%) | 0 (0.0%) |
Disability Class: Self-Care Difficulty
| Age Bracket | Male | Female |
| 5 to 17 Years | 0 (0.0%) | 0 (0.0%) |
| 18 to 34 Years | 0 (0.0%) | 0 (0.0%) |
| 35 to 64 Years | 0 (0.0%) | 0 (0.0%) |
| 65 to 74 Years | 0 (0.0%) | 0 (0.0%) |
| 75 Years and over | 0 (0.0%) | 0 (0.0%) |
Technology Access in Pinesburg
Computing Device Access in Pinesburg
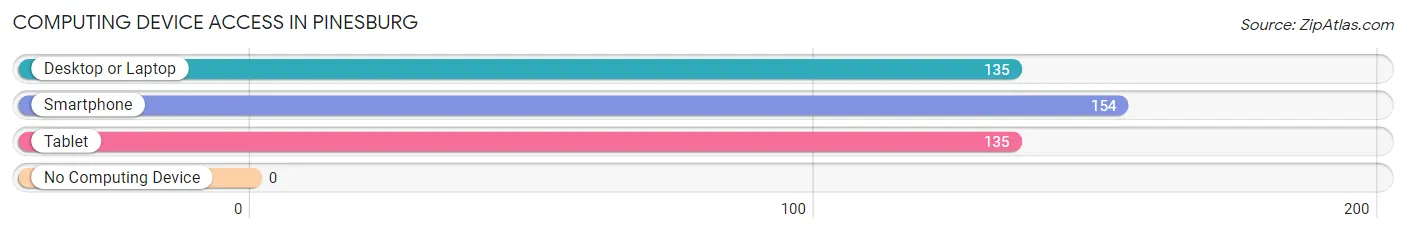
| Device Type | # Households | % Households |
| Desktop or Laptop | 135 | 87.7% |
| Smartphone | 154 | 100.0% |
| Tablet | 135 | 87.7% |
| No Computing Device | 0 | 0.0% |
| Total | 154 | 100.0% |
Internet Access in Pinesburg
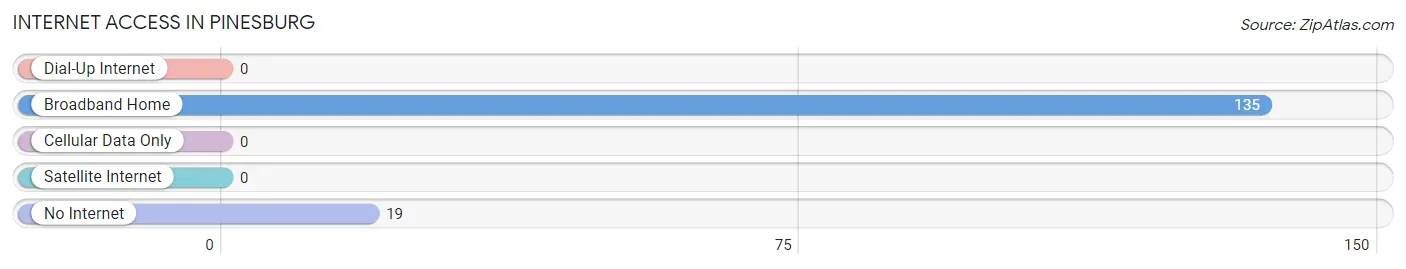
| Internet Type | # Households | % Households |
| Dial-Up Internet | 0 | 0.0% |
| Broadband Home | 135 | 87.7% |
| Cellular Data Only | 0 | 0.0% |
| Satellite Internet | 0 | 0.0% |
| No Internet | 19 | 12.3% |
| Total | 154 | 100.0% |
Pinesburg Summary
Pinesburg, Maryland is a small town located in Washington County, Maryland. It is situated in the Appalachian Mountains, approximately 30 miles west of Hagerstown. The town has a population of approximately 1,000 people and is known for its rural charm and small-town atmosphere.
History
Pinesburg was first settled in the late 1700s by German immigrants. The town was originally known as “Pineburg” and was named after the abundance of pine trees in the area. The town was officially incorporated in 1872 and was home to a variety of businesses, including a sawmill, a gristmill, a blacksmith shop, and a general store.
In the early 1900s, the town experienced a period of growth and development. The railroad was extended to Pinesburg in 1906, and the town became a popular destination for tourists. The town also became a center for the lumber industry, with several sawmills operating in the area.
Geography
Pinesburg is located in the Appalachian Mountains, approximately 30 miles west of Hagerstown. The town is situated in a valley surrounded by rolling hills and mountains. The town is located at an elevation of 1,400 feet and is surrounded by the Catoctin Mountains to the east and the South Mountain range to the west.
The town is located in a temperate climate, with hot summers and cold winters. The average annual temperature is around 50 degrees Fahrenheit. The town receives an average of 40 inches of precipitation per year, with most of it falling in the form of snow during the winter months.
Economy
The economy of Pinesburg is largely based on tourism and agriculture. The town is home to several tourist attractions, including the Catoctin Wildlife Preserve and Zoo, the Appalachian Trail, and the South Mountain State Park. The town also has several wineries and breweries, as well as a variety of restaurants and shops.
Agriculture is also an important part of the local economy. The town is home to several farms, which produce a variety of crops, including corn, soybeans, wheat, and hay. The town also has several dairy farms, which produce milk, cheese, and other dairy products.
Demographics
As of the 2010 census, the population of Pinesburg was 1,000 people. The town is predominantly white, with approximately 95% of the population identifying as Caucasian. The town also has a small Hispanic population, with approximately 3% of the population identifying as Hispanic or Latino.
The median household income in Pinesburg is $45,000, and the median home value is $150,000. The town has a low unemployment rate, with only 4.5% of the population unemployed. The town also has a low poverty rate, with only 8.5% of the population living below the poverty line.
Conclusion
Pinesburg, Maryland is a small town located in Washington County, Maryland. It is situated in the Appalachian Mountains, approximately 30 miles west of Hagerstown. The town has a population of approximately 1,000 people and is known for its rural charm and small-town atmosphere. The economy of Pinesburg is largely based on tourism and agriculture, and the town is predominantly white, with a small Hispanic population. The median household income in Pinesburg is $45,000, and the median home value is $150,000. The town has a low unemployment rate and a low poverty rate.
Common Questions
What is Per Capita Income in Pinesburg?
Per Capita income in Pinesburg is $22,831.
What is Inequality or Gini Index in Pinesburg?
Inequality or Gini Index in Pinesburg is 0.45.
What is the Total Population of Pinesburg?
Total Population of Pinesburg is 511.
What is the Total Male Population of Pinesburg?
Total Male Population of Pinesburg is 254.
What is the Total Female Population of Pinesburg?
Total Female Population of Pinesburg is 257.
What is the Ratio of Males per 100 Females in Pinesburg?
There are 98.83 Males per 100 Females in Pinesburg.
What is the Ratio of Females per 100 Males in Pinesburg?
There are 101.18 Females per 100 Males in Pinesburg.
What is the Median Population Age in Pinesburg?
Median Population Age in Pinesburg is 29.6 Years.
What is the Average Family Size in Pinesburg
Average Family Size in Pinesburg is 3.3 People.
What is the Average Household Size in Pinesburg
Average Household Size in Pinesburg is 3.3 People.
How Large is the Labor Force in Pinesburg?
There are 314 People in the Labor Forcein in Pinesburg.
What is the Percentage of People in the Labor Force in Pinesburg?
83.1% of People are in the Labor Force in Pinesburg.
What is the Unemployment Rate in Pinesburg?
Unemployment Rate in Pinesburg is 3.8%.