Landover Hills, MD Map & Demographics
Landover Hills Map
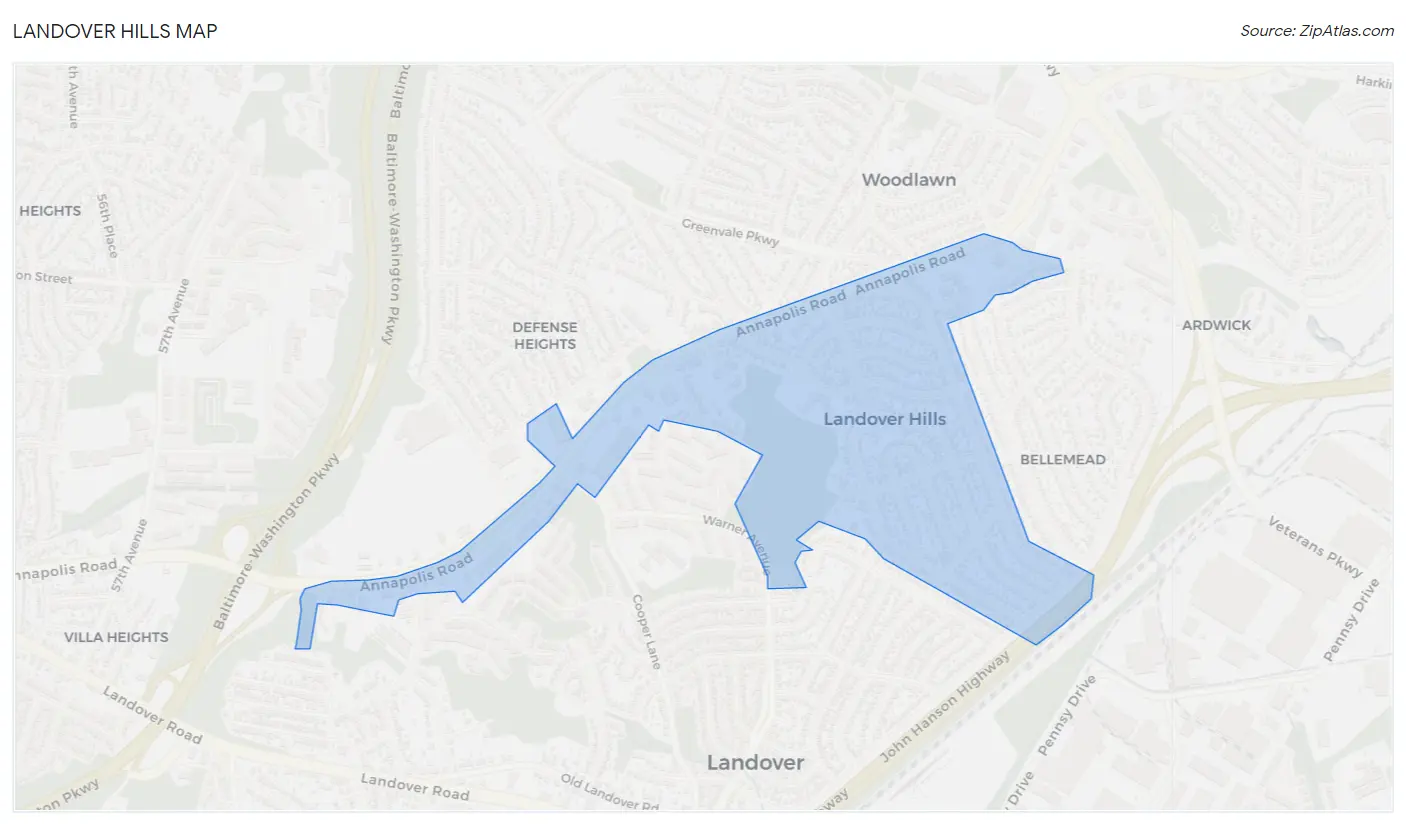
Landover Hills Overview
$35,791
PER CAPITA INCOME
$105,469
AVG FAMILY INCOME
$100,739
AVG HOUSEHOLD INCOME
4.9%
WAGE / INCOME GAP [ % ]
95.1¢/ $1
WAGE / INCOME GAP [ $ ]
0.37
INEQUALITY / GINI INDEX
2,118
TOTAL POPULATION
1,153
MALE POPULATION
965
FEMALE POPULATION
119.48
MALES / 100 FEMALES
83.69
FEMALES / 100 MALES
36.0
MEDIAN AGE
4.2
AVG FAMILY SIZE
3.6
AVG HOUSEHOLD SIZE
1,134
LABOR FORCE [ PEOPLE ]
70.5%
PERCENT IN LABOR FORCE
11.3%
UNEMPLOYMENT RATE
Landover Hills Area Codes
Income in Landover Hills
Income Overview in Landover Hills
Per Capita Income in Landover Hills is $35,791, while median incomes of families and households are $105,469 and $100,739 respectively.
| Characteristic | Number | Measure |
| Per Capita Income | 2,118 | $35,791 |
| Median Family Income | 453 | $105,469 |
| Mean Family Income | 453 | $122,965 |
| Median Household Income | 583 | $100,739 |
| Mean Household Income | 583 | $118,992 |
| Income Deficit | 453 | $0 |
| Wage / Income Gap (%) | 2,118 | 4.89% |
| Wage / Income Gap ($) | 2,118 | 95.11¢ per $1 |
| Gini / Inequality Index | 2,118 | 0.37 |
Earnings by Sex in Landover Hills
Average Earnings in Landover Hills are $40,435, $41,818 for men and $39,773 for women, a difference of 4.9%.

| Sex | Number | Average Earnings |
| Male | 650 (57.6%) | $41,818 |
| Female | 478 (42.4%) | $39,773 |
| Total | 1,128 (100.0%) | $40,435 |
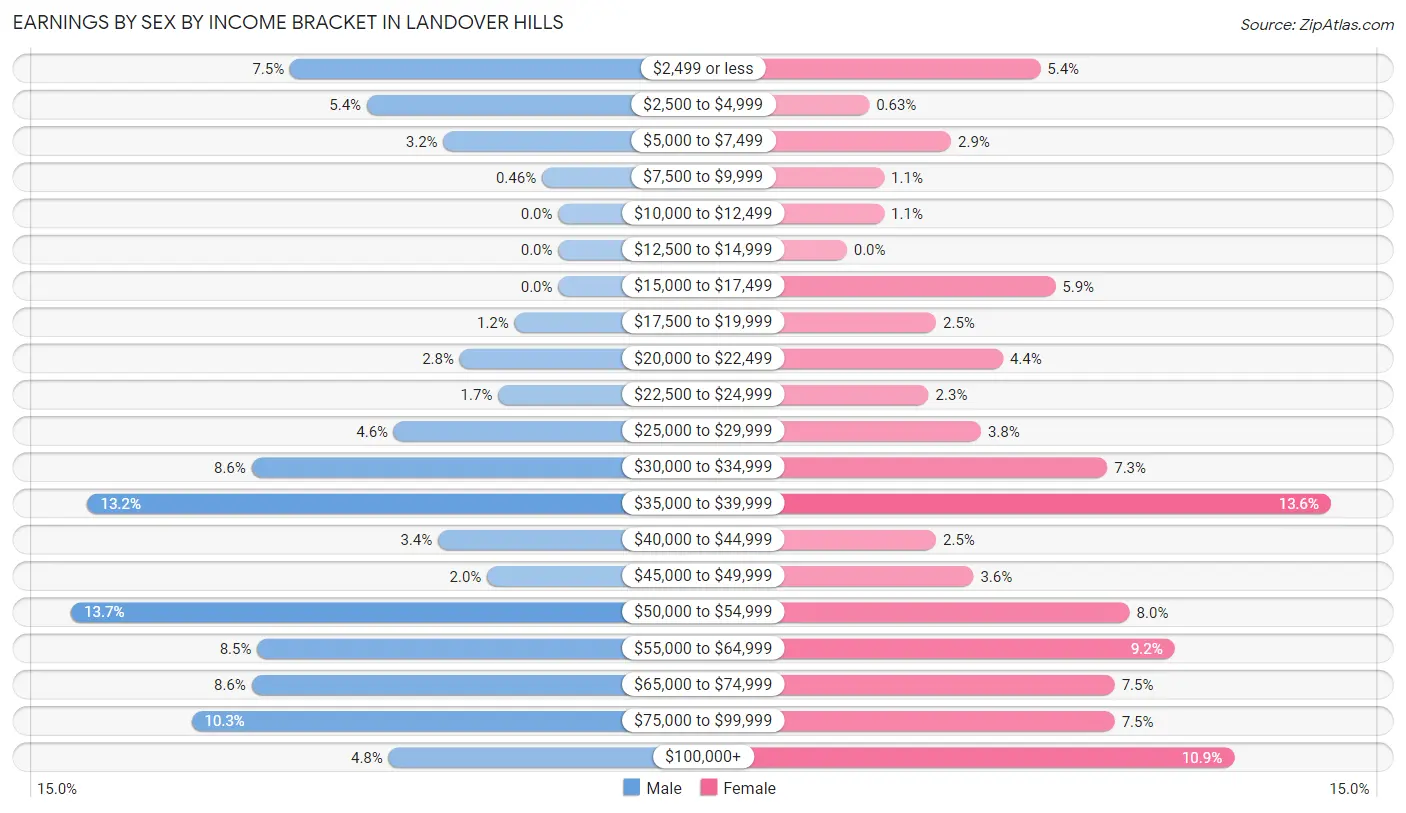
Earnings by Sex by Income Bracket in Landover Hills
The most common earnings brackets in Landover Hills are $50,000 to $54,999 for men (89 | 13.7%) and $35,000 to $39,999 for women (65 | 13.6%).
| Income | Male | Female |
| $2,499 or less | 49 (7.5%) | 26 (5.4%) |
| $2,500 to $4,999 | 35 (5.4%) | 3 (0.6%) |
| $5,000 to $7,499 | 21 (3.2%) | 14 (2.9%) |
| $7,500 to $9,999 | 3 (0.5%) | 5 (1.1%) |
| $10,000 to $12,499 | 0 (0.0%) | 5 (1.1%) |
| $12,500 to $14,999 | 0 (0.0%) | 0 (0.0%) |
| $15,000 to $17,499 | 0 (0.0%) | 28 (5.9%) |
| $17,500 to $19,999 | 8 (1.2%) | 12 (2.5%) |
| $20,000 to $22,499 | 18 (2.8%) | 21 (4.4%) |
| $22,500 to $24,999 | 11 (1.7%) | 11 (2.3%) |
| $25,000 to $29,999 | 30 (4.6%) | 18 (3.8%) |
| $30,000 to $34,999 | 56 (8.6%) | 35 (7.3%) |
| $35,000 to $39,999 | 86 (13.2%) | 65 (13.6%) |
| $40,000 to $44,999 | 22 (3.4%) | 12 (2.5%) |
| $45,000 to $49,999 | 13 (2.0%) | 17 (3.6%) |
| $50,000 to $54,999 | 89 (13.7%) | 38 (8.0%) |
| $55,000 to $64,999 | 55 (8.5%) | 44 (9.2%) |
| $65,000 to $74,999 | 56 (8.6%) | 36 (7.5%) |
| $75,000 to $99,999 | 67 (10.3%) | 36 (7.5%) |
| $100,000+ | 31 (4.8%) | 52 (10.9%) |
| Total | 650 (100.0%) | 478 (100.0%) |
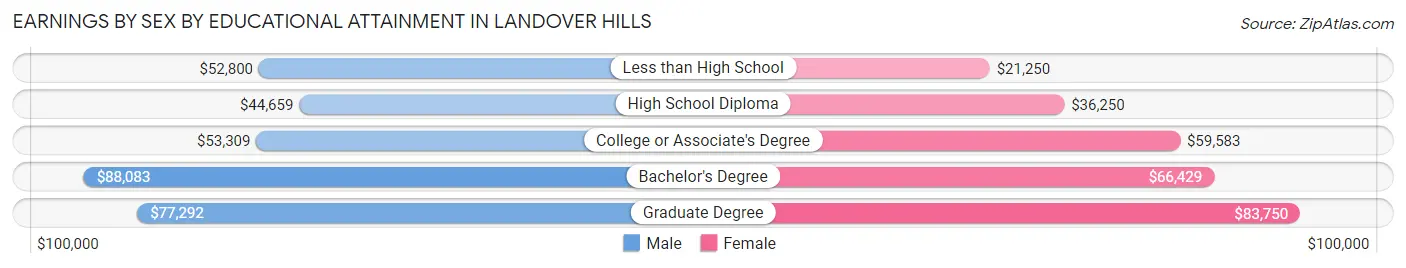
Earnings by Sex by Educational Attainment in Landover Hills
Average earnings in Landover Hills are $52,543 for men and $46,875 for women, a difference of 10.8%. Men with an educational attainment of bachelor's degree enjoy the highest average annual earnings of $88,083, while those with high school diploma education earn the least with $44,659. Women with an educational attainment of graduate degree earn the most with the average annual earnings of $83,750, while those with less than high school education have the smallest earnings of $21,250.
| Educational Attainment | Male Income | Female Income |
| Less than High School | $52,800 | $21,250 |
| High School Diploma | $44,659 | $36,250 |
| College or Associate's Degree | $53,309 | $59,583 |
| Bachelor's Degree | $88,083 | $66,429 |
| Graduate Degree | $77,292 | $83,750 |
| Total | $52,543 | $46,875 |
Family Income in Landover Hills
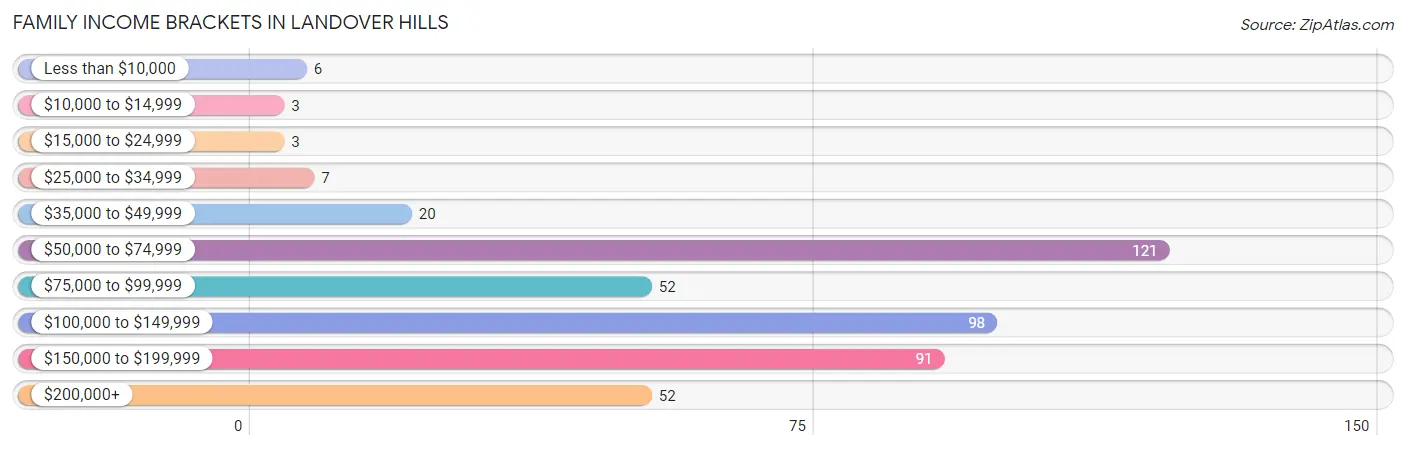
Family Income Brackets in Landover Hills
According to the Landover Hills family income data, there are 121 families falling into the $50,000 to $74,999 income range, which is the most common income bracket and makes up 26.7% of all families. Conversely, the $10,000 to $14,999 income bracket is the least frequent group with only 3 families (0.7%) belonging to this category.
| Income Bracket | # Families | % Families |
| Less than $10,000 | 6 | 1.3% |
| $10,000 to $14,999 | 3 | 0.7% |
| $15,000 to $24,999 | 3 | 0.7% |
| $25,000 to $34,999 | 7 | 1.5% |
| $35,000 to $49,999 | 20 | 4.4% |
| $50,000 to $74,999 | 121 | 26.7% |
| $75,000 to $99,999 | 52 | 11.5% |
| $100,000 to $149,999 | 98 | 21.6% |
| $150,000 to $199,999 | 91 | 20.1% |
| $200,000+ | 52 | 11.5% |
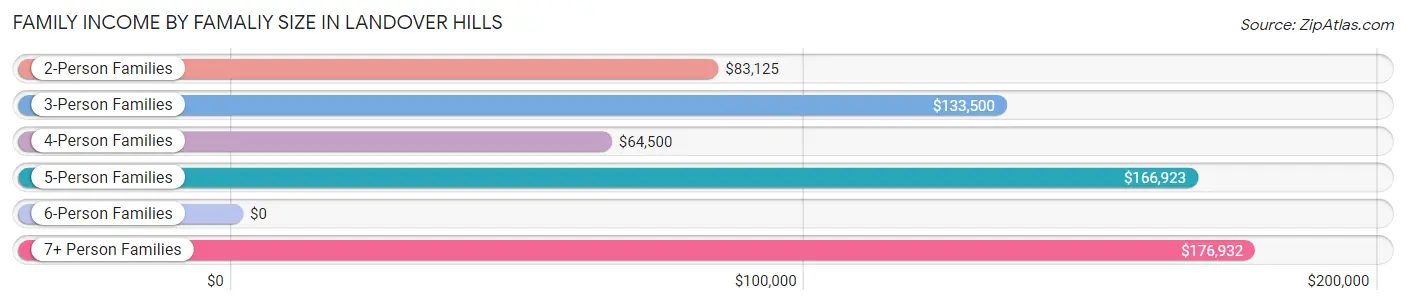
Family Income by Famaliy Size in Landover Hills
7+ person families (57 | 12.6%) account for the highest median family income in Landover Hills with $176,932 per family, while 3-person families (82 | 18.1%) have the highest median income of $44,500 per family member.
| Income Bracket | # Families | Median Income |
| 2-Person Families | 165 (36.4%) | $83,125 |
| 3-Person Families | 82 (18.1%) | $133,500 |
| 4-Person Families | 88 (19.4%) | $64,500 |
| 5-Person Families | 54 (11.9%) | $166,923 |
| 6-Person Families | 7 (1.5%) | $0 |
| 7+ Person Families | 57 (12.6%) | $176,932 |
| Total | 453 (100.0%) | $105,469 |
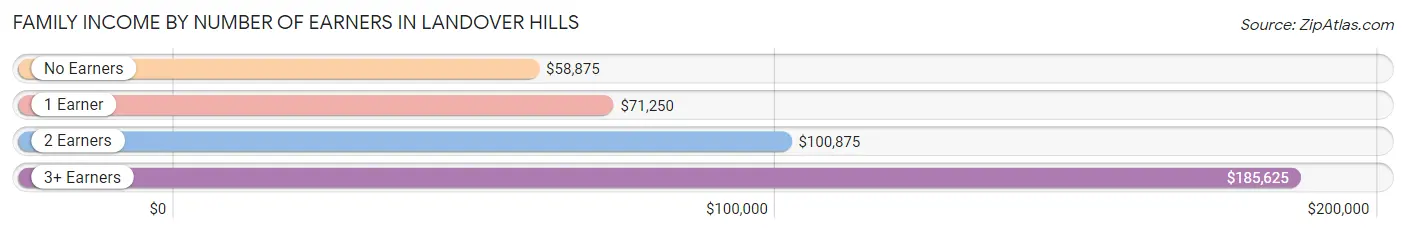
Family Income by Number of Earners in Landover Hills
The median family income in Landover Hills is $105,469, with families comprising 3+ earners (119) having the highest median family income of $185,625, while families with no earners (59) have the lowest median family income of $58,875, accounting for 26.3% and 13.0% of families, respectively.
| Number of Earners | # Families | Median Income |
| No Earners | 59 (13.0%) | $58,875 |
| 1 Earner | 110 (24.3%) | $71,250 |
| 2 Earners | 165 (36.4%) | $100,875 |
| 3+ Earners | 119 (26.3%) | $185,625 |
| Total | 453 (100.0%) | $105,469 |
Household Income in Landover Hills
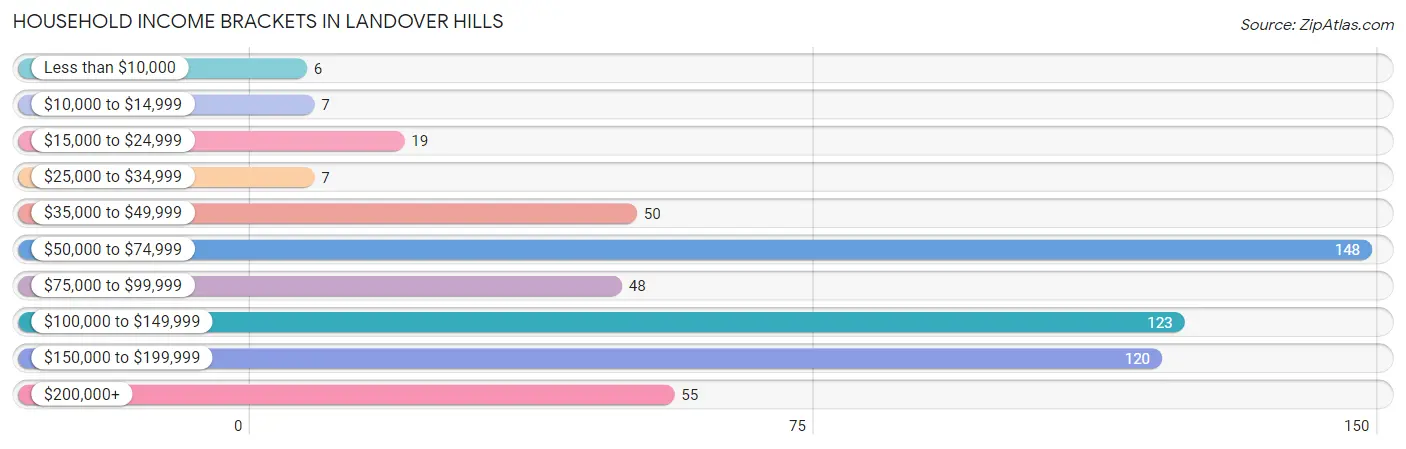
Household Income Brackets in Landover Hills
With 148 households falling in the category, the $50,000 to $74,999 income range is the most frequent in Landover Hills, accounting for 25.4% of all households. In contrast, only 6 households (1.0%) fall into the less than $10,000 income bracket, making it the least populous group.
| Income Bracket | # Households | % Households |
| Less than $10,000 | 6 | 1.0% |
| $10,000 to $14,999 | 7 | 1.2% |
| $15,000 to $24,999 | 19 | 3.3% |
| $25,000 to $34,999 | 7 | 1.2% |
| $35,000 to $49,999 | 50 | 8.6% |
| $50,000 to $74,999 | 148 | 25.4% |
| $75,000 to $99,999 | 48 | 8.2% |
| $100,000 to $149,999 | 123 | 21.1% |
| $150,000 to $199,999 | 120 | 20.6% |
| $200,000+ | 55 | 9.4% |
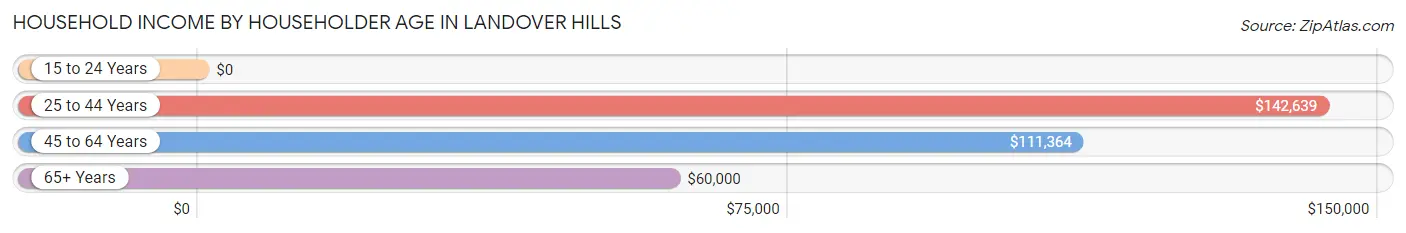
Household Income by Householder Age in Landover Hills
The median household income in Landover Hills is $100,739, with the highest median household income of $142,639 found in the 25 to 44 years age bracket for the primary householder. A total of 175 households (30.0%) fall into this category. Meanwhile, the 15 to 24 years age bracket for the primary householder has the lowest median household income of $0, with 4 households (0.7%) in this group.
| Income Bracket | # Households | Median Income |
| 15 to 24 Years | 4 (0.7%) | $0 |
| 25 to 44 Years | 175 (30.0%) | $142,639 |
| 45 to 64 Years | 226 (38.8%) | $111,364 |
| 65+ Years | 178 (30.5%) | $60,000 |
| Total | 583 (100.0%) | $100,739 |
Poverty in Landover Hills
Income Below Poverty by Sex and Age in Landover Hills
With 4.7% poverty level for males and 3.3% for females among the residents of Landover Hills, 16 and 17 year old males and 75 year old and over females are the most vulnerable to poverty, with 9 males (18.8%) and 4 females (18.2%) in their respective age groups living below the poverty level.
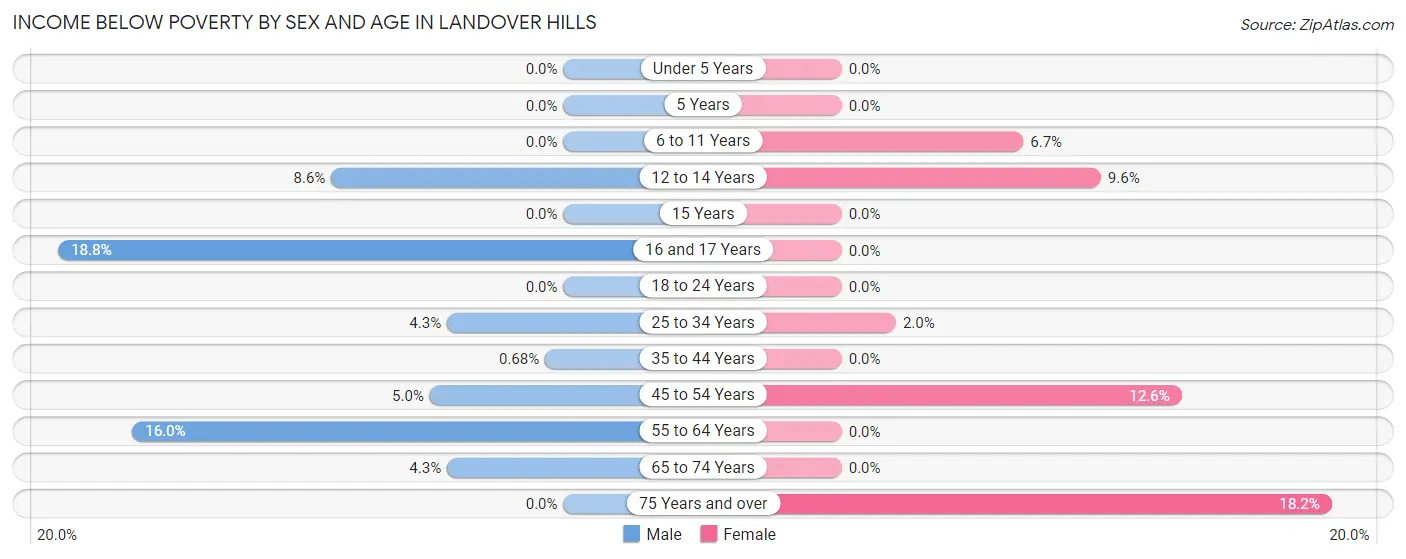
| Age Bracket | Male | Female |
| Under 5 Years | 0 (0.0%) | 0 (0.0%) |
| 5 Years | 0 (0.0%) | 0 (0.0%) |
| 6 to 11 Years | 0 (0.0%) | 6 (6.7%) |
| 12 to 14 Years | 5 (8.6%) | 5 (9.6%) |
| 15 Years | 0 (0.0%) | 0 (0.0%) |
| 16 and 17 Years | 9 (18.8%) | 0 (0.0%) |
| 18 to 24 Years | 0 (0.0%) | 0 (0.0%) |
| 25 to 34 Years | 6 (4.3%) | 3 (2.0%) |
| 35 to 44 Years | 1 (0.7%) | 0 (0.0%) |
| 45 to 54 Years | 7 (5.0%) | 14 (12.6%) |
| 55 to 64 Years | 20 (16.0%) | 0 (0.0%) |
| 65 to 74 Years | 6 (4.3%) | 0 (0.0%) |
| 75 Years and over | 0 (0.0%) | 4 (18.2%) |
| Total | 54 (4.7%) | 32 (3.3%) |
Income Above Poverty by Sex and Age in Landover Hills
According to the poverty statistics in Landover Hills, males aged under 5 years and females aged under 5 years are the age groups that are most secure financially, with 100.0% of males and 100.0% of females in these age groups living above the poverty line.
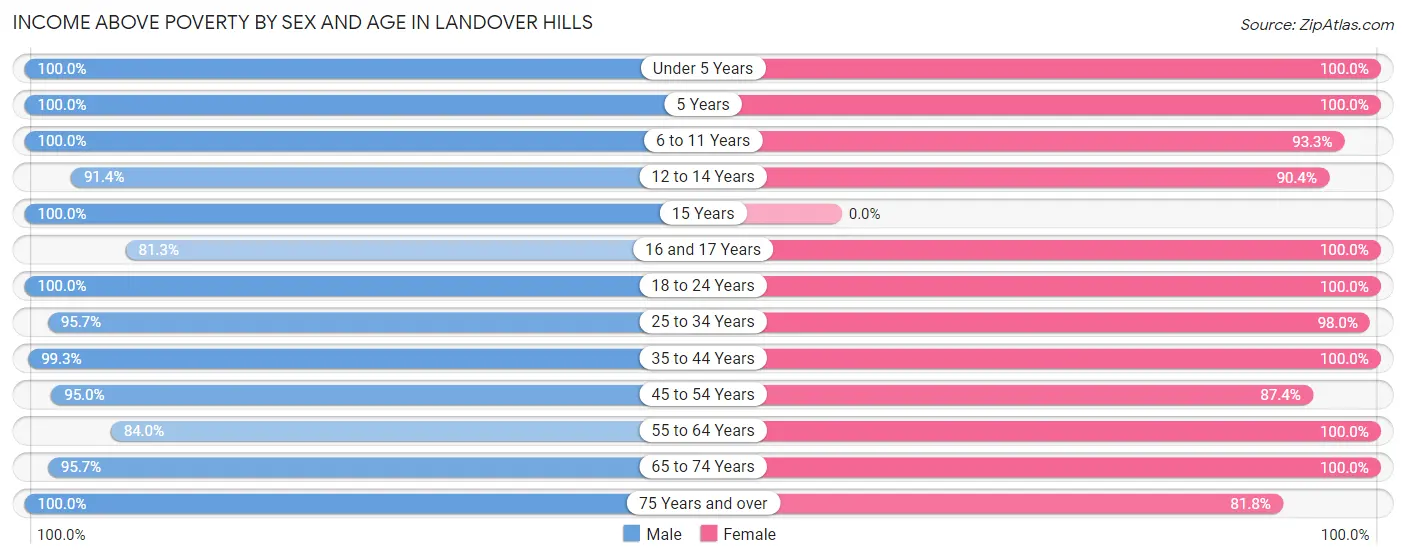
| Age Bracket | Male | Female |
| Under 5 Years | 72 (100.0%) | 69 (100.0%) |
| 5 Years | 30 (100.0%) | 14 (100.0%) |
| 6 to 11 Years | 102 (100.0%) | 83 (93.3%) |
| 12 to 14 Years | 53 (91.4%) | 47 (90.4%) |
| 15 Years | 24 (100.0%) | 0 (0.0%) |
| 16 and 17 Years | 39 (81.2%) | 20 (100.0%) |
| 18 to 24 Years | 112 (100.0%) | 53 (100.0%) |
| 25 to 34 Years | 133 (95.7%) | 146 (98.0%) |
| 35 to 44 Years | 147 (99.3%) | 126 (100.0%) |
| 45 to 54 Years | 134 (95.0%) | 97 (87.4%) |
| 55 to 64 Years | 105 (84.0%) | 107 (100.0%) |
| 65 to 74 Years | 133 (95.7%) | 152 (100.0%) |
| 75 Years and over | 15 (100.0%) | 18 (81.8%) |
| Total | 1,099 (95.3%) | 932 (96.7%) |
Income Below Poverty Among Married-Couple Families in Landover Hills
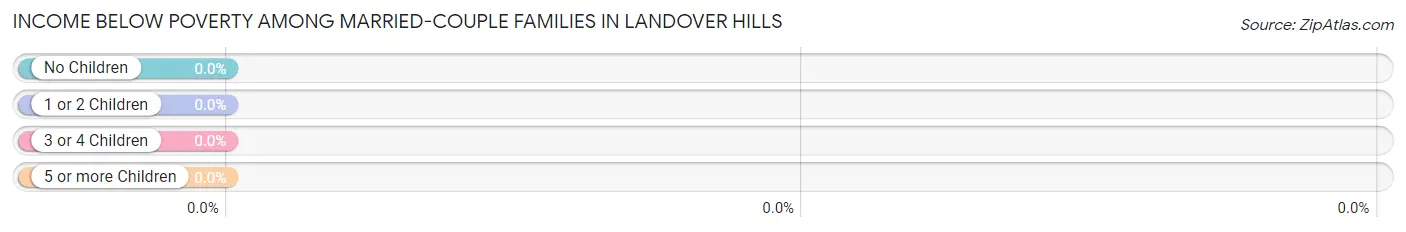
| Children | Above Poverty | Below Poverty |
| No Children | 137 (100.0%) | 0 (0.0%) |
| 1 or 2 Children | 107 (100.0%) | 0 (0.0%) |
| 3 or 4 Children | 49 (100.0%) | 0 (0.0%) |
| 5 or more Children | 0 (0.0%) | 0 (0.0%) |
| Total | 293 (100.0%) | 0 (0.0%) |
Income Below Poverty Among Single-Parent Households in Landover Hills
According to the poverty data in Landover Hills, 16.4% or 9 single-father households and 2.9% or 3 single-mother households are living below the poverty line. Among single-father households, those with no children have the highest poverty rate, with 9 households (36.0%) experiencing poverty. Likewise, among single-mother households, those with 3 or 4 children have the highest poverty rate, with 3 households (100.0%) falling below the poverty line.
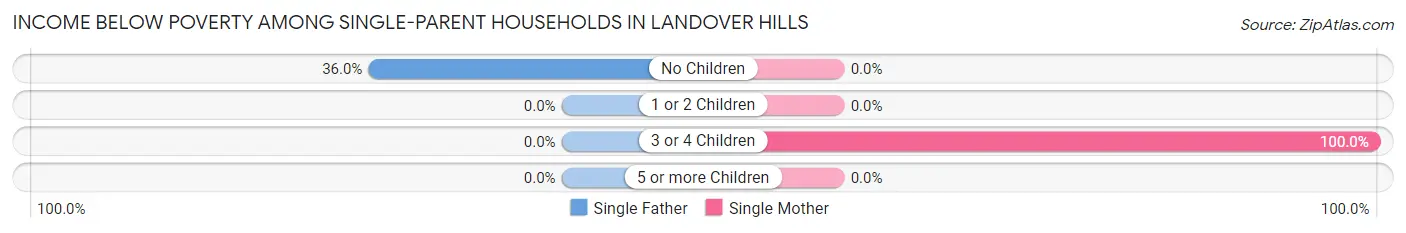
| Children | Single Father | Single Mother |
| No Children | 9 (36.0%) | 0 (0.0%) |
| 1 or 2 Children | 0 (0.0%) | 0 (0.0%) |
| 3 or 4 Children | 0 (0.0%) | 3 (100.0%) |
| 5 or more Children | 0 (0.0%) | 0 (0.0%) |
| Total | 9 (16.4%) | 3 (2.9%) |
Income Below Poverty Among Married-Couple vs Single-Parent Households in Landover Hills
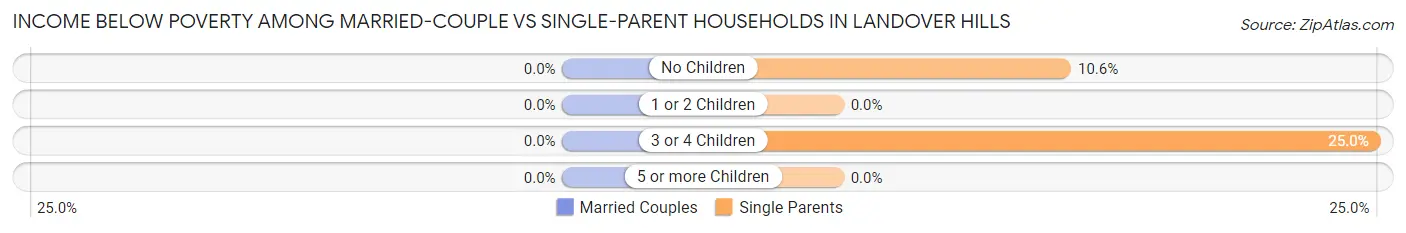
| Children | Married-Couple Families | Single-Parent Households |
| No Children | 0 (0.0%) | 9 (10.6%) |
| 1 or 2 Children | 0 (0.0%) | 0 (0.0%) |
| 3 or 4 Children | 0 (0.0%) | 3 (25.0%) |
| 5 or more Children | 0 (0.0%) | 0 (0.0%) |
| Total | 0 (0.0%) | 12 (7.5%) |
Race in Landover Hills
The most populous races in Landover Hills are Hispanic or Latino (1,280 | 60.4%), Some other Race (918 | 43.3%), and Black / African American (645 | 30.4%).
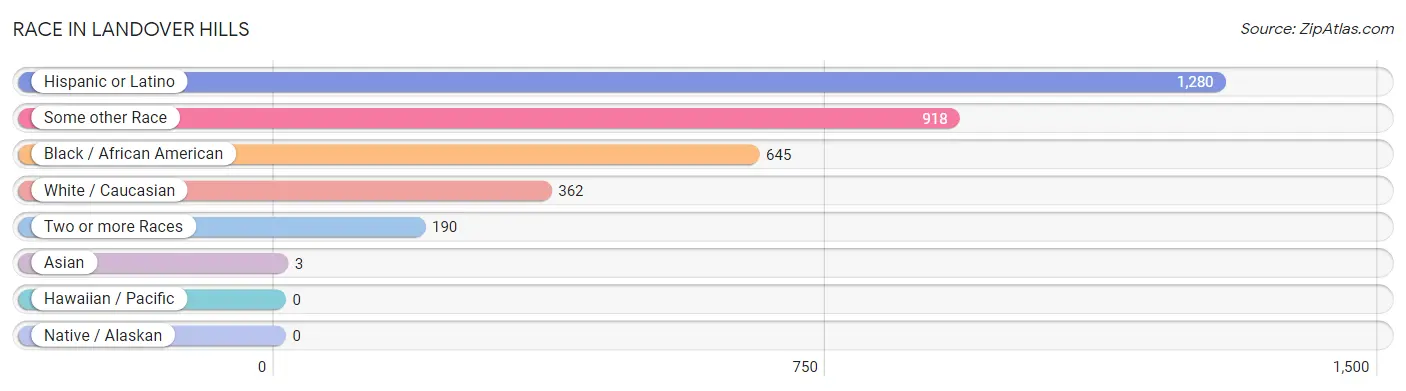
| Race | # Population | % Population |
| Asian | 3 | 0.1% |
| Black / African American | 645 | 30.4% |
| Hawaiian / Pacific | 0 | 0.0% |
| Hispanic or Latino | 1,280 | 60.4% |
| Native / Alaskan | 0 | 0.0% |
| White / Caucasian | 362 | 17.1% |
| Two or more Races | 190 | 9.0% |
| Some other Race | 918 | 43.3% |
| Total | 2,118 | 100.0% |
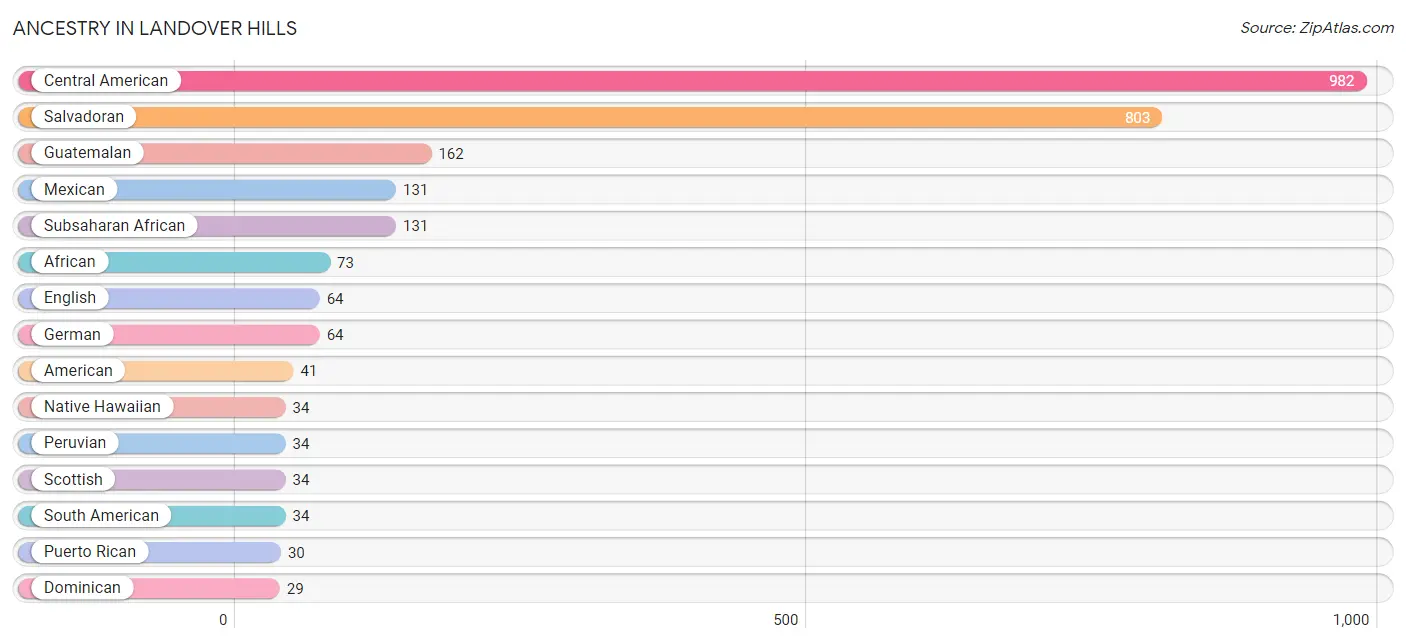
Ancestry in Landover Hills
The most populous ancestries reported in Landover Hills are Central American (982 | 46.4%), Salvadoran (803 | 37.9%), Guatemalan (162 | 7.6%), Mexican (131 | 6.2%), and Subsaharan African (131 | 6.2%), together accounting for 104.3% of all Landover Hills residents.
| Ancestry | # Population | % Population |
| African | 73 | 3.5% |
| American | 41 | 1.9% |
| Apache | 5 | 0.2% |
| Arab | 3 | 0.1% |
| Central American | 982 | 46.4% |
| Cherokee | 12 | 0.6% |
| Danish | 4 | 0.2% |
| Dominican | 29 | 1.4% |
| English | 64 | 3.0% |
| European | 11 | 0.5% |
| French | 8 | 0.4% |
| German | 64 | 3.0% |
| Ghanaian | 4 | 0.2% |
| Guatemalan | 162 | 7.6% |
| Guyanese | 4 | 0.2% |
| Honduran | 4 | 0.2% |
| Irish | 24 | 1.1% |
| Italian | 2 | 0.1% |
| Jamaican | 28 | 1.3% |
| Kenyan | 27 | 1.3% |
| Korean | 3 | 0.1% |
| Mexican | 131 | 6.2% |
| Moroccan | 3 | 0.1% |
| Native Hawaiian | 34 | 1.6% |
| Nicaraguan | 13 | 0.6% |
| Nigerian | 20 | 0.9% |
| Norwegian | 10 | 0.5% |
| Peruvian | 34 | 1.6% |
| Polish | 12 | 0.6% |
| Portuguese | 2 | 0.1% |
| Puerto Rican | 30 | 1.4% |
| Salvadoran | 803 | 37.9% |
| Scotch-Irish | 17 | 0.8% |
| Scottish | 34 | 1.6% |
| South American | 34 | 1.6% |
| Spanish | 5 | 0.2% |
| Subsaharan African | 131 | 6.2% |
| Thai | 6 | 0.3% |
| Trinidadian and Tobagonian | 11 | 0.5% |
| West Indian | 4 | 0.2% | View All 40 Rows |
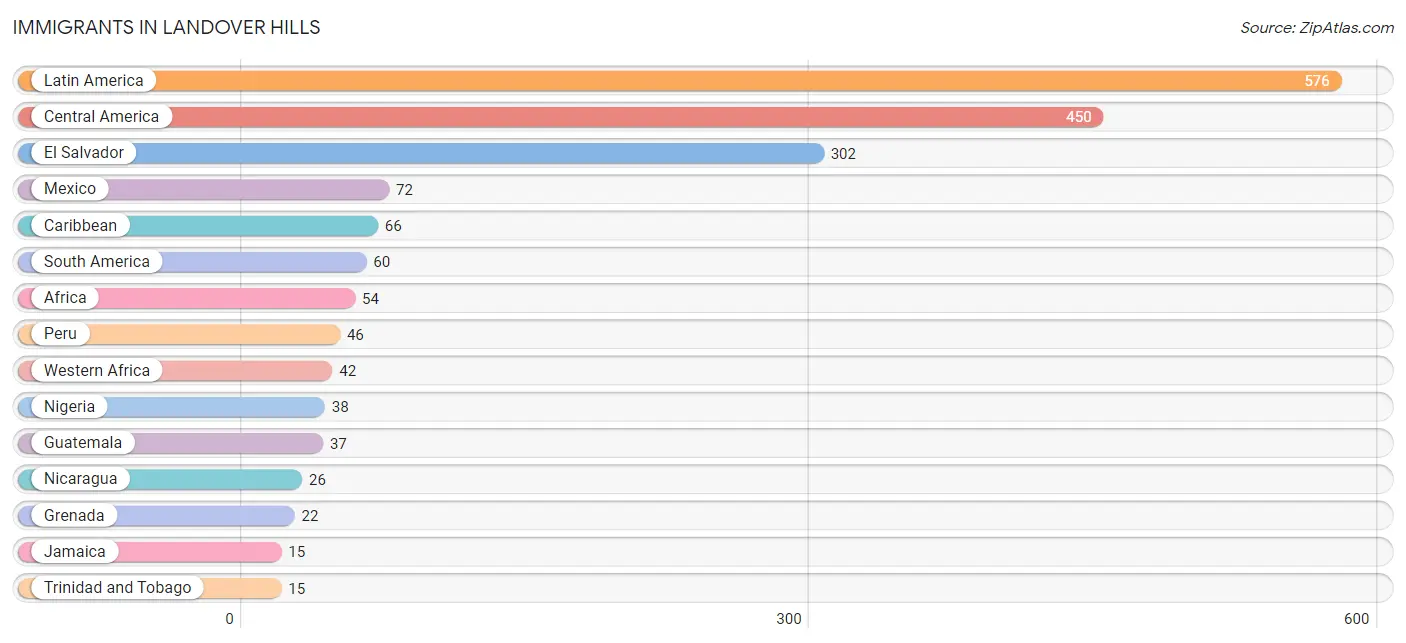
Immigrants in Landover Hills
The most numerous immigrant groups reported in Landover Hills came from Latin America (576 | 27.2%), Central America (450 | 21.2%), El Salvador (302 | 14.3%), Mexico (72 | 3.4%), and Caribbean (66 | 3.1%), together accounting for 69.2% of all Landover Hills residents.
| Immigration Origin | # Population | % Population |
| Africa | 54 | 2.5% |
| Asia | 3 | 0.1% |
| Brazil | 6 | 0.3% |
| Cameroon | 9 | 0.4% |
| Caribbean | 66 | 3.1% |
| Central America | 450 | 21.2% |
| Dominican Republic | 14 | 0.7% |
| El Salvador | 302 | 14.3% |
| Ghana | 4 | 0.2% |
| Grenada | 22 | 1.0% |
| Guatemala | 37 | 1.8% |
| Guyana | 4 | 0.2% |
| Honduras | 13 | 0.6% |
| Jamaica | 15 | 0.7% |
| Latin America | 576 | 27.2% |
| Mexico | 72 | 3.4% |
| Middle Africa | 9 | 0.4% |
| Morocco | 3 | 0.1% |
| Nicaragua | 26 | 1.2% |
| Nigeria | 38 | 1.8% |
| Northern Africa | 3 | 0.1% |
| Peru | 46 | 2.2% |
| Philippines | 3 | 0.1% |
| South America | 60 | 2.8% |
| South Eastern Asia | 3 | 0.1% |
| Trinidad and Tobago | 15 | 0.7% |
| Western Africa | 42 | 2.0% | View All 27 Rows |
Sex and Age in Landover Hills
Sex and Age in Landover Hills
The most populous age groups in Landover Hills are 45 to 49 Years (121 | 10.5%) for men and 10 to 14 Years (107 | 11.1%) for women.
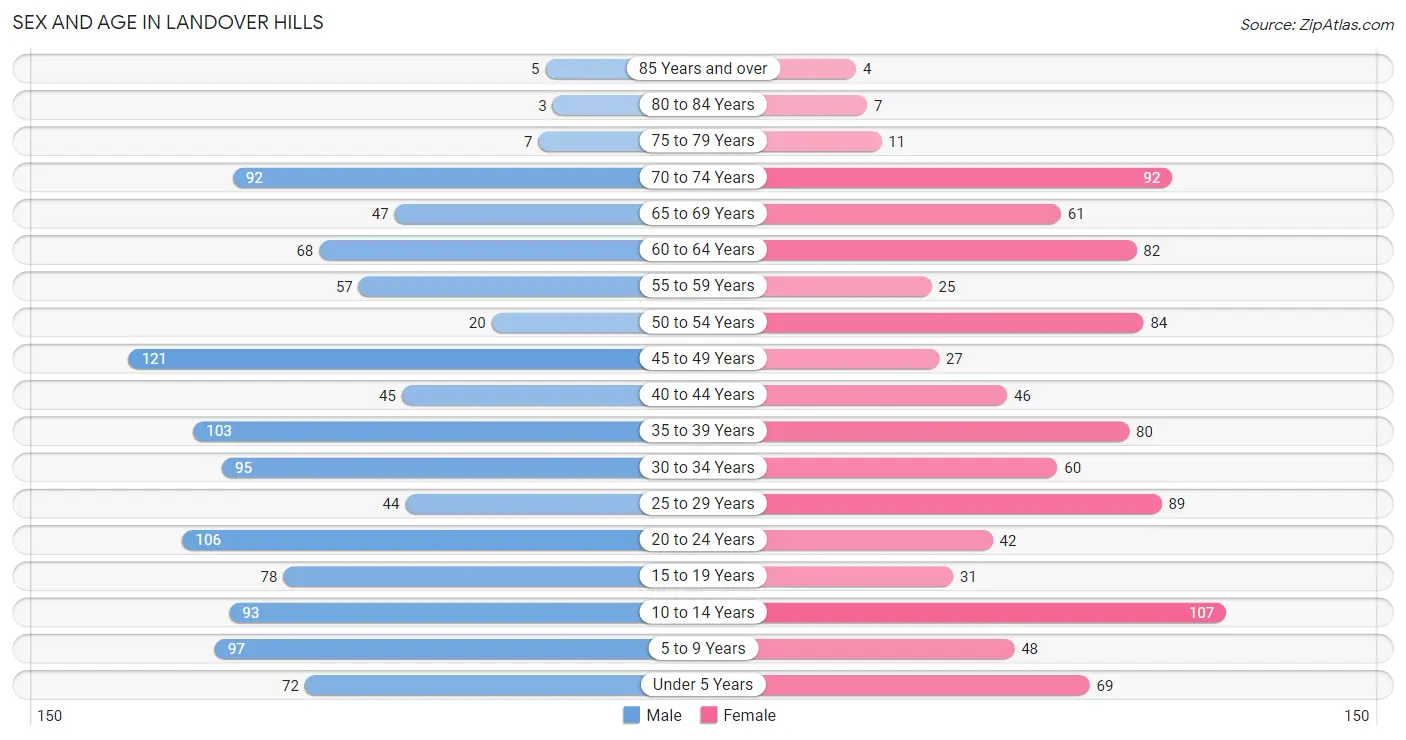
| Age Bracket | Male | Female |
| Under 5 Years | 72 (6.2%) | 69 (7.1%) |
| 5 to 9 Years | 97 (8.4%) | 48 (5.0%) |
| 10 to 14 Years | 93 (8.1%) | 107 (11.1%) |
| 15 to 19 Years | 78 (6.8%) | 31 (3.2%) |
| 20 to 24 Years | 106 (9.2%) | 42 (4.3%) |
| 25 to 29 Years | 44 (3.8%) | 89 (9.2%) |
| 30 to 34 Years | 95 (8.2%) | 60 (6.2%) |
| 35 to 39 Years | 103 (8.9%) | 80 (8.3%) |
| 40 to 44 Years | 45 (3.9%) | 46 (4.8%) |
| 45 to 49 Years | 121 (10.5%) | 27 (2.8%) |
| 50 to 54 Years | 20 (1.7%) | 84 (8.7%) |
| 55 to 59 Years | 57 (4.9%) | 25 (2.6%) |
| 60 to 64 Years | 68 (5.9%) | 82 (8.5%) |
| 65 to 69 Years | 47 (4.1%) | 61 (6.3%) |
| 70 to 74 Years | 92 (8.0%) | 92 (9.5%) |
| 75 to 79 Years | 7 (0.6%) | 11 (1.1%) |
| 80 to 84 Years | 3 (0.3%) | 7 (0.7%) |
| 85 Years and over | 5 (0.4%) | 4 (0.4%) |
| Total | 1,153 (100.0%) | 965 (100.0%) |
Families and Households in Landover Hills
Median Family Size in Landover Hills
The median family size in Landover Hills is 4.18 persons per family, with married-couple families (293 | 64.7%) accounting for the largest median family size of 4.4 persons per family. On the other hand, single male/father families (55 | 12.1%) represent the smallest median family size with 3.00 persons per family.
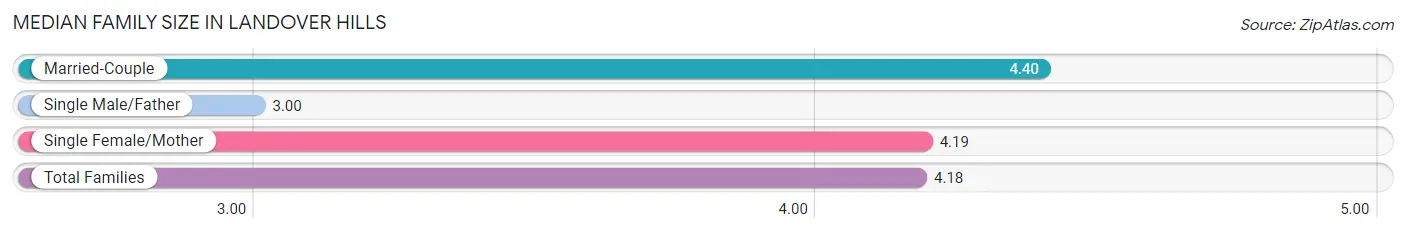
| Family Type | # Families | Family Size |
| Married-Couple | 293 (64.7%) | 4.40 |
| Single Male/Father | 55 (12.1%) | 3.00 |
| Single Female/Mother | 105 (23.2%) | 4.19 |
| Total Families | 453 (100.0%) | 4.18 |
Median Household Size in Landover Hills
The median household size in Landover Hills is 3.62 persons per household, with married-couple households (293 | 50.3%) accounting for the largest median household size of 4.53 persons per household. non-family households (130 | 22.3%) represent the smallest median household size with 1.11 persons per household.
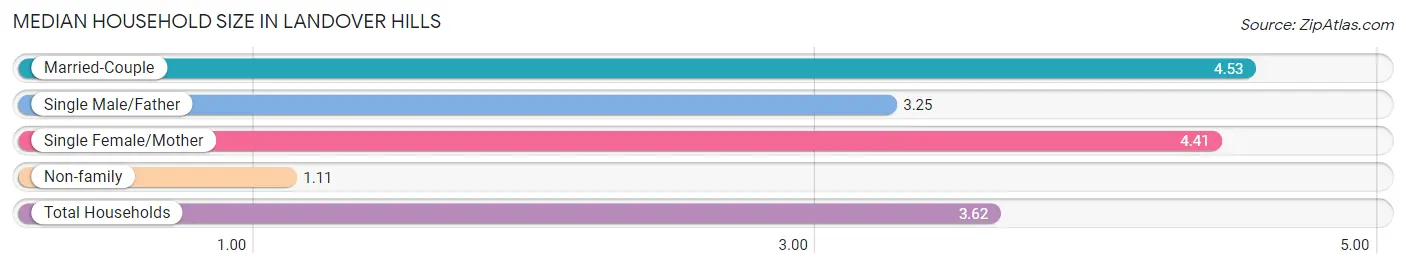
| Household Type | # Households | Household Size |
| Married-Couple | 293 (50.3%) | 4.53 |
| Single Male/Father | 55 (9.4%) | 3.25 |
| Single Female/Mother | 105 (18.0%) | 4.41 |
| Non-family | 130 (22.3%) | 1.11 |
| Total Households | 583 (100.0%) | 3.62 |
Household Size by Marriage Status in Landover Hills
Out of a total of 583 households in Landover Hills, 453 (77.7%) are family households, while 130 (22.3%) are nonfamily households. The most numerous type of family households are 2-person households, comprising 150, and the most common type of nonfamily households are 1-person households, comprising 116.
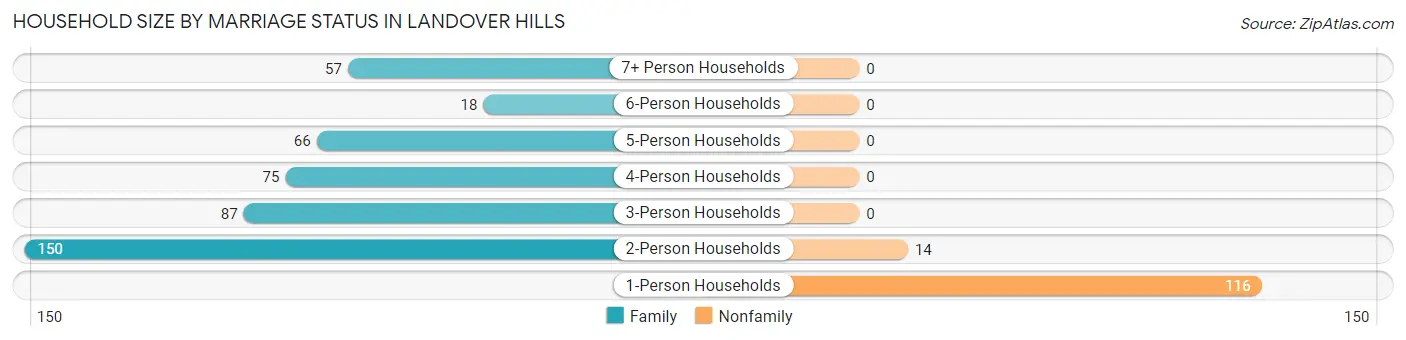
| Household Size | Family Households | Nonfamily Households |
| 1-Person Households | - | 116 (19.9%) |
| 2-Person Households | 150 (25.7%) | 14 (2.4%) |
| 3-Person Households | 87 (14.9%) | 0 (0.0%) |
| 4-Person Households | 75 (12.9%) | 0 (0.0%) |
| 5-Person Households | 66 (11.3%) | 0 (0.0%) |
| 6-Person Households | 18 (3.1%) | 0 (0.0%) |
| 7+ Person Households | 57 (9.8%) | 0 (0.0%) |
| Total | 453 (77.7%) | 130 (22.3%) |
Female Fertility in Landover Hills
Fertility by Age in Landover Hills
Average fertility rate in Landover Hills is 85.0 births per 1,000 women. Women in the age bracket of 20 to 34 years have the highest fertility rate with 105.0 births per 1,000 women. Women in the age bracket of 20 to 34 years acount for 57.1% of all women with births.
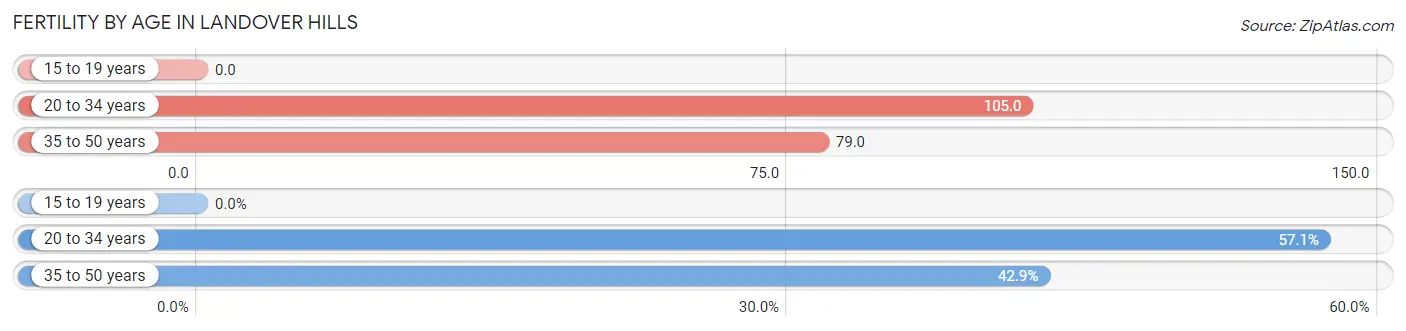
| Age Bracket | Women with Births | Births / 1,000 Women |
| 15 to 19 years | 0 (0.0%) | 0.0 |
| 20 to 34 years | 20 (57.1%) | 105.0 |
| 35 to 50 years | 15 (42.9%) | 79.0 |
| Total | 35 (100.0%) | 85.0 |
Fertility by Age by Marriage Status in Landover Hills
71.4% of women with births (35) in Landover Hills are married. The highest percentage of unmarried women with births falls into 20 to 34 years age bracket with 50.0% of them unmarried at the time of birth, while the lowest percentage of unmarried women with births belong to 35 to 50 years age bracket with 0.0% of them unmarried.
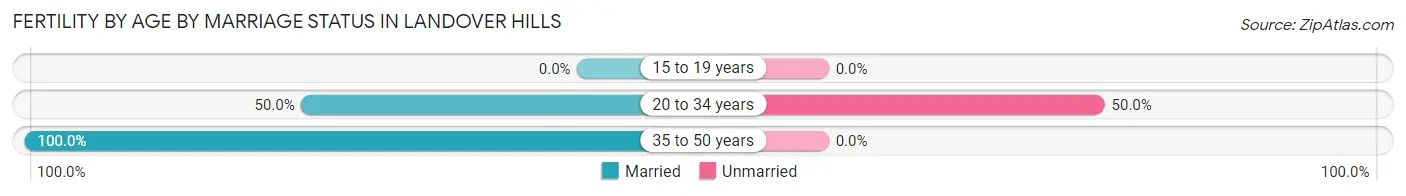
| Age Bracket | Married | Unmarried |
| 15 to 19 years | 0 (0.0%) | 0 (0.0%) |
| 20 to 34 years | 10 (50.0%) | 10 (50.0%) |
| 35 to 50 years | 15 (100.0%) | 0 (0.0%) |
| Total | 25 (71.4%) | 10 (28.6%) |
Fertility by Education in Landover Hills
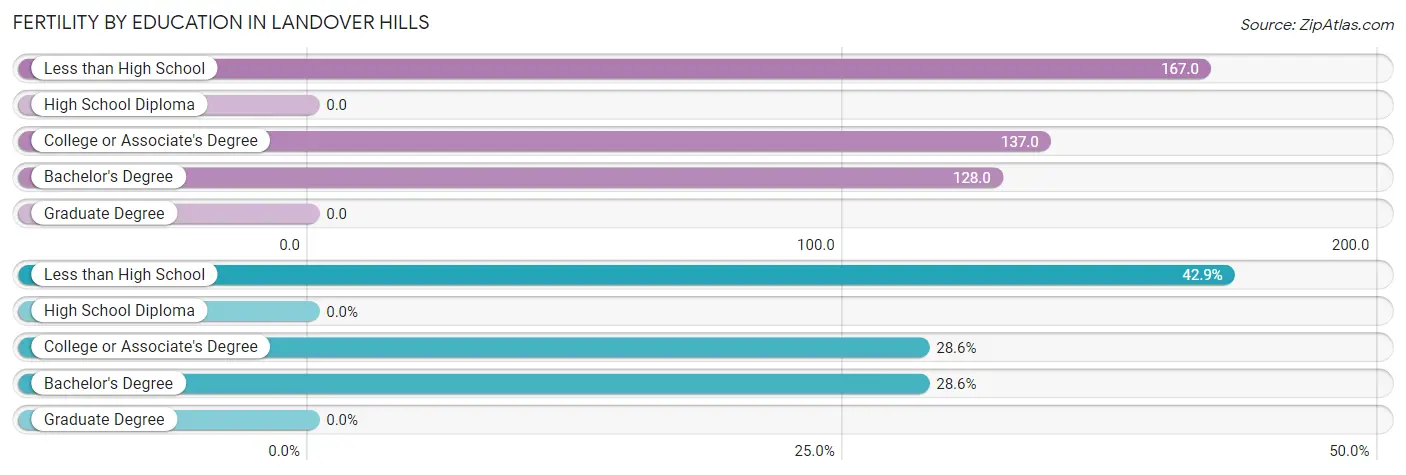
| Educational Attainment | Women with Births | Births / 1,000 Women |
| Less than High School | 15 (42.9%) | 167.0 |
| High School Diploma | 0 (0.0%) | 0.0 |
| College or Associate's Degree | 10 (28.6%) | 137.0 |
| Bachelor's Degree | 10 (28.6%) | 128.0 |
| Graduate Degree | 0 (0.0%) | 0.0 |
| Total | 35 (100.0%) | 85.0 |
Fertility by Education by Marriage Status in Landover Hills
28.6% of women with births in Landover Hills are unmarried. Women with the educational attainment of less than high school are most likely to be married with 100.0% of them married at childbirth, while women with the educational attainment of bachelor's degree are least likely to be married with 100.0% of them unmarried at childbirth.
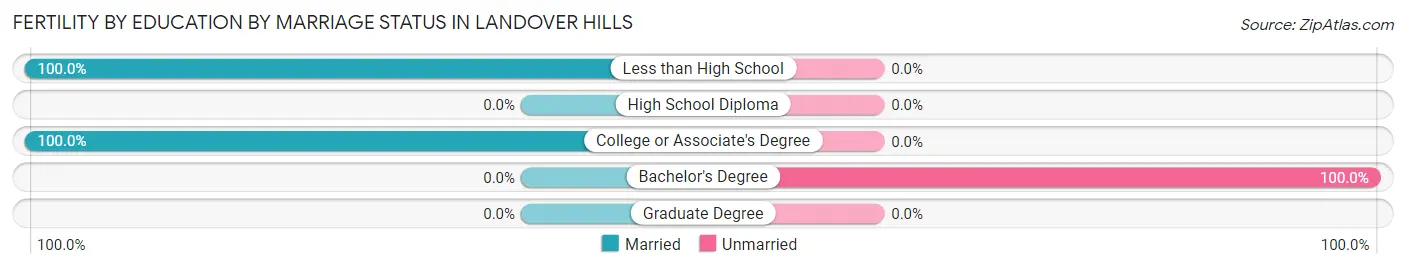
| Educational Attainment | Married | Unmarried |
| Less than High School | 15 (100.0%) | 0 (0.0%) |
| High School Diploma | 0 (0.0%) | 0 (0.0%) |
| College or Associate's Degree | 10 (100.0%) | 0 (0.0%) |
| Bachelor's Degree | 0 (0.0%) | 10 (100.0%) |
| Graduate Degree | 0 (0.0%) | 0 (0.0%) |
| Total | 25 (71.4%) | 10 (28.6%) |
Employment Characteristics in Landover Hills
Employment by Class of Employer in Landover Hills
Among the 988 employed individuals in Landover Hills, private company employees (641 | 64.9%), local government employees (100 | 10.1%), and self-employed (not incorporated) (86 | 8.7%) make up the most common classes of employment.
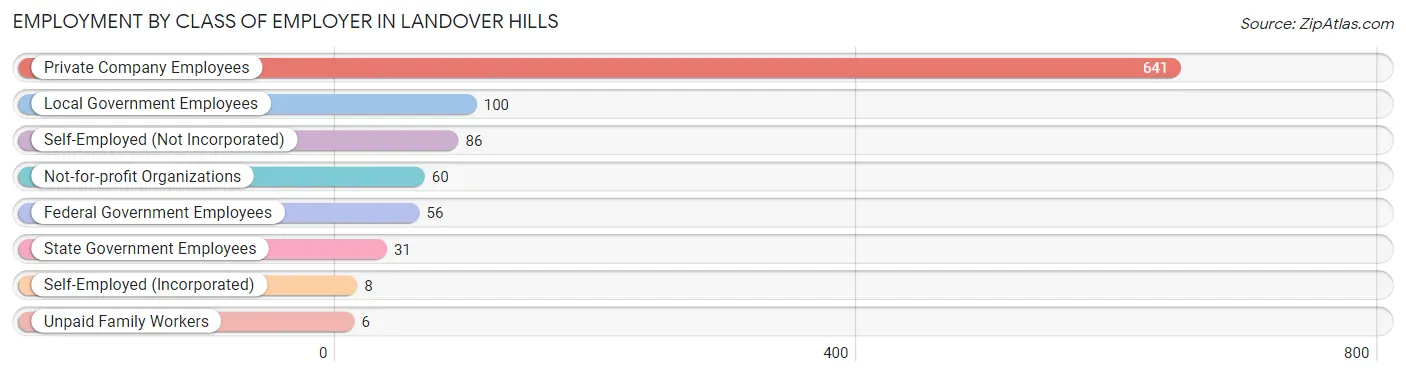
| Employer Class | # Employees | % Employees |
| Private Company Employees | 641 | 64.9% |
| Self-Employed (Incorporated) | 8 | 0.8% |
| Self-Employed (Not Incorporated) | 86 | 8.7% |
| Not-for-profit Organizations | 60 | 6.1% |
| Local Government Employees | 100 | 10.1% |
| State Government Employees | 31 | 3.1% |
| Federal Government Employees | 56 | 5.7% |
| Unpaid Family Workers | 6 | 0.6% |
| Total | 988 | 100.0% |
Employment Status by Age in Landover Hills
According to the labor force statistics for Landover Hills, out of the total population over 16 years of age (1,608), 70.5% or 1,134 individuals are in the labor force, with 11.3% or 128 of them unemployed. The age group with the highest labor force participation rate is 20 to 24 years, with 96.6% or 143 individuals in the labor force. Within the labor force, the 20 to 24 years age range has the highest percentage of unemployed individuals, with 23.8% or 34 of them being unemployed.
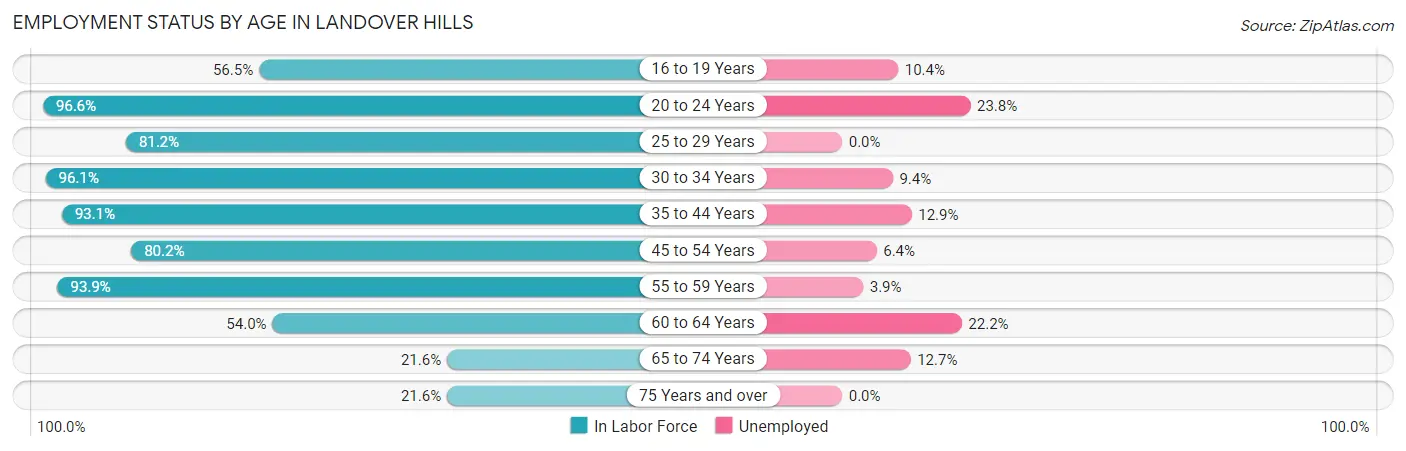
| Age Bracket | In Labor Force | Unemployed |
| 16 to 19 Years | 48 (56.5%) | 5 (10.4%) |
| 20 to 24 Years | 143 (96.6%) | 34 (23.8%) |
| 25 to 29 Years | 108 (81.2%) | 0 (0.0%) |
| 30 to 34 Years | 149 (96.1%) | 14 (9.4%) |
| 35 to 44 Years | 255 (93.1%) | 33 (12.9%) |
| 45 to 54 Years | 202 (80.2%) | 13 (6.4%) |
| 55 to 59 Years | 77 (93.9%) | 3 (3.9%) |
| 60 to 64 Years | 81 (54.0%) | 18 (22.2%) |
| 65 to 74 Years | 63 (21.6%) | 8 (12.7%) |
| 75 Years and over | 8 (21.6%) | 0 (0.0%) |
| Total | 1,134 (70.5%) | 128 (11.3%) |
Employment Status by Educational Attainment in Landover Hills
According to labor force statistics for Landover Hills, 83.4% of individuals (872) out of the total population between 25 and 64 years of age (1,046) are in the labor force, with 9.3% or 81 of them being unemployed. The group with the highest labor force participation rate are those with the educational attainment of bachelor's degree or higher, with 97.3% or 177 individuals in the labor force. Within the labor force, individuals with less than high school education have the highest percentage of unemployment, with 19.2% or 41 of them being unemployed.
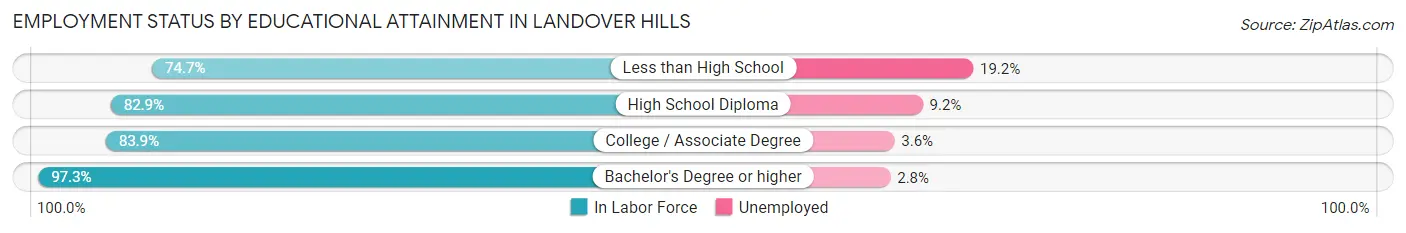
| Educational Attainment | In Labor Force | Unemployed |
| Less than High School | 213 (74.7%) | 55 (19.2%) |
| High School Diploma | 315 (82.9%) | 35 (9.2%) |
| College / Associate Degree | 167 (83.9%) | 7 (3.6%) |
| Bachelor's Degree or higher | 177 (97.3%) | 5 (2.8%) |
| Total | 872 (83.4%) | 97 (9.3%) |
Employment Occupations by Sex in Landover Hills
Management, Business, Science and Arts Occupations
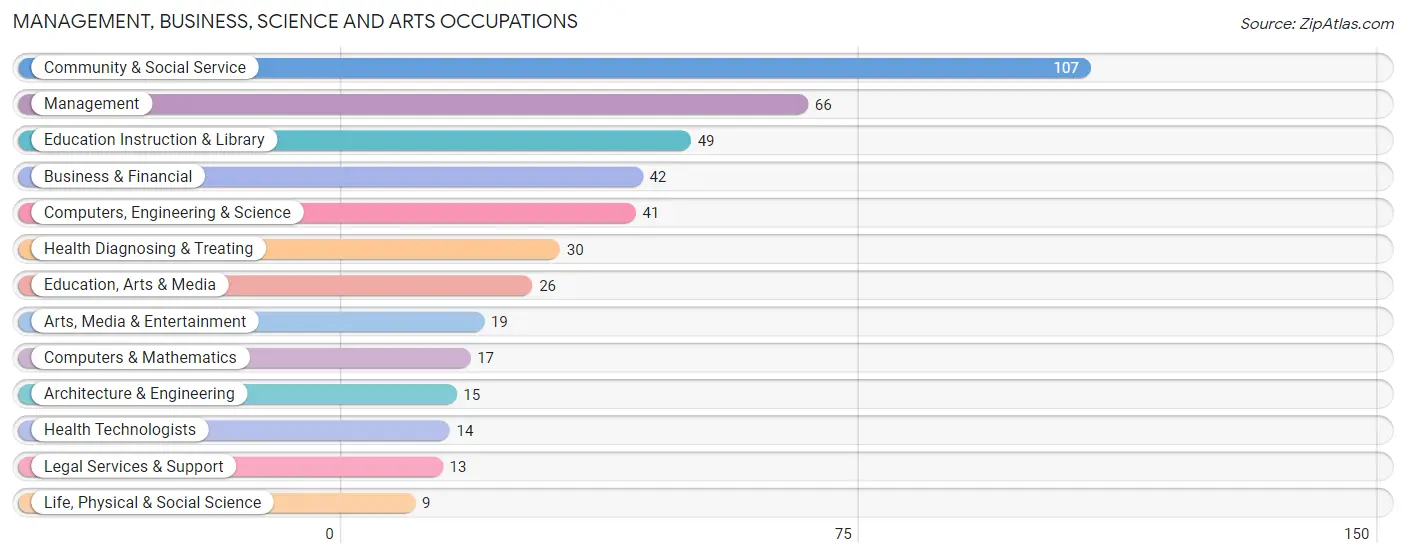
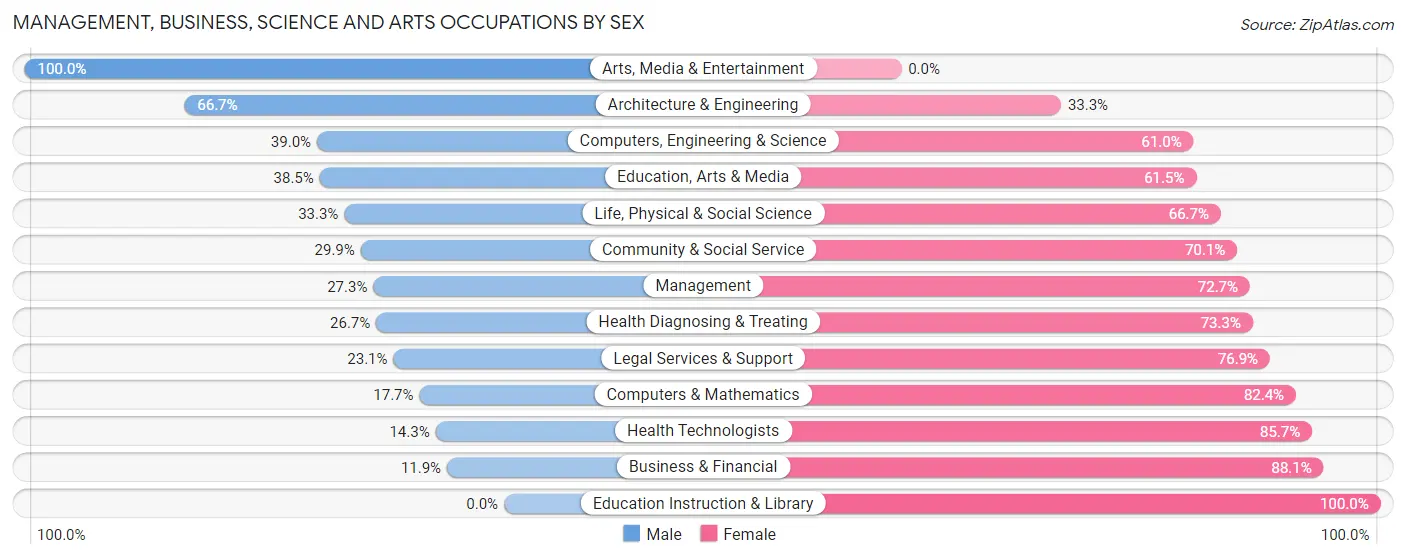
The most common Management, Business, Science and Arts occupations in Landover Hills are Community & Social Service (107 | 10.6%), Management (66 | 6.6%), Education Instruction & Library (49 | 4.9%), Business & Financial (42 | 4.2%), and Computers, Engineering & Science (41 | 4.1%).
Management, Business, Science and Arts Occupations by Sex
Within the Management, Business, Science and Arts occupations in Landover Hills, the most male-oriented occupations are Arts, Media & Entertainment (100.0%), Architecture & Engineering (66.7%), and Computers, Engineering & Science (39.0%), while the most female-oriented occupations are Education Instruction & Library (100.0%), Business & Financial (88.1%), and Health Technologists (85.7%).
| Occupation | Male | Female |
| Management | 18 (27.3%) | 48 (72.7%) |
| Business & Financial | 5 (11.9%) | 37 (88.1%) |
| Computers, Engineering & Science | 16 (39.0%) | 25 (61.0%) |
| Computers & Mathematics | 3 (17.6%) | 14 (82.4%) |
| Architecture & Engineering | 10 (66.7%) | 5 (33.3%) |
| Life, Physical & Social Science | 3 (33.3%) | 6 (66.7%) |
| Community & Social Service | 32 (29.9%) | 75 (70.1%) |
| Education, Arts & Media | 10 (38.5%) | 16 (61.5%) |
| Legal Services & Support | 3 (23.1%) | 10 (76.9%) |
| Education Instruction & Library | 0 (0.0%) | 49 (100.0%) |
| Arts, Media & Entertainment | 19 (100.0%) | 0 (0.0%) |
| Health Diagnosing & Treating | 8 (26.7%) | 22 (73.3%) |
| Health Technologists | 2 (14.3%) | 12 (85.7%) |
| Total (Category) | 79 (27.6%) | 207 (72.4%) |
| Total (Overall) | 591 (58.8%) | 415 (41.2%) |
Services Occupations
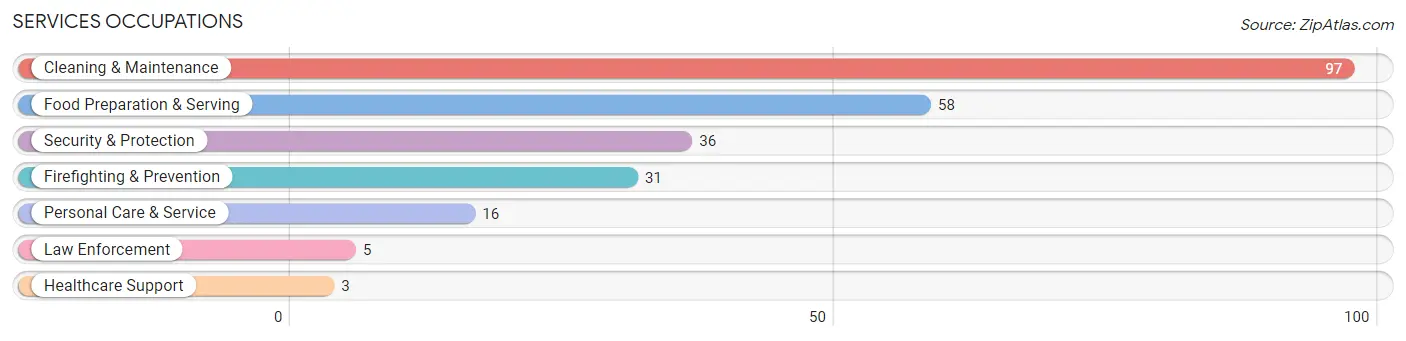
The most common Services occupations in Landover Hills are Cleaning & Maintenance (97 | 9.6%), Food Preparation & Serving (58 | 5.8%), Security & Protection (36 | 3.6%), Firefighting & Prevention (31 | 3.1%), and Personal Care & Service (16 | 1.6%).
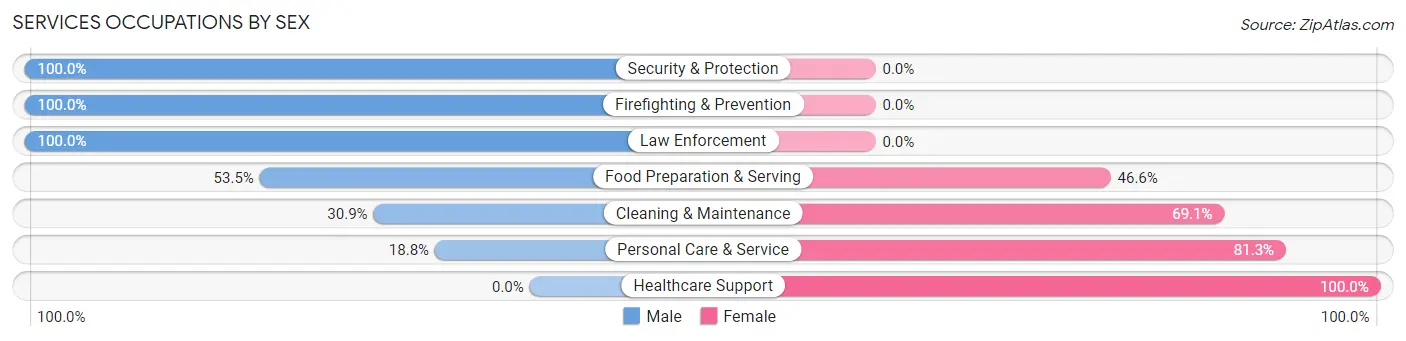
Services Occupations by Sex
Within the Services occupations in Landover Hills, the most male-oriented occupations are Security & Protection (100.0%), Firefighting & Prevention (100.0%), and Law Enforcement (100.0%), while the most female-oriented occupations are Healthcare Support (100.0%), Personal Care & Service (81.2%), and Cleaning & Maintenance (69.1%).
| Occupation | Male | Female |
| Healthcare Support | 0 (0.0%) | 3 (100.0%) |
| Security & Protection | 36 (100.0%) | 0 (0.0%) |
| Firefighting & Prevention | 31 (100.0%) | 0 (0.0%) |
| Law Enforcement | 5 (100.0%) | 0 (0.0%) |
| Food Preparation & Serving | 31 (53.4%) | 27 (46.6%) |
| Cleaning & Maintenance | 30 (30.9%) | 67 (69.1%) |
| Personal Care & Service | 3 (18.8%) | 13 (81.2%) |
| Total (Category) | 100 (47.6%) | 110 (52.4%) |
| Total (Overall) | 591 (58.8%) | 415 (41.2%) |
Sales and Office Occupations
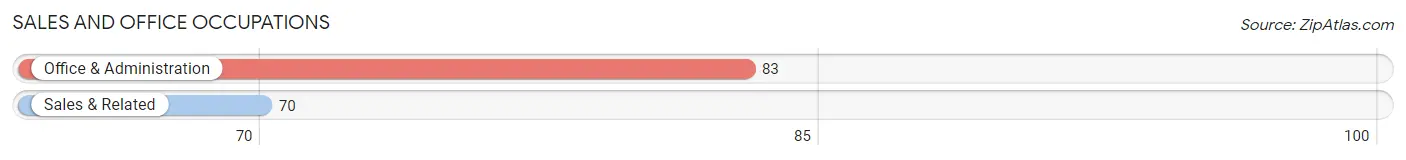
The most common Sales and Office occupations in Landover Hills are Office & Administration (83 | 8.3%), and Sales & Related (70 | 7.0%).
Sales and Office Occupations by Sex

| Occupation | Male | Female |
| Sales & Related | 44 (62.9%) | 26 (37.1%) |
| Office & Administration | 30 (36.1%) | 53 (63.9%) |
| Total (Category) | 74 (48.4%) | 79 (51.6%) |
| Total (Overall) | 591 (58.8%) | 415 (41.2%) |
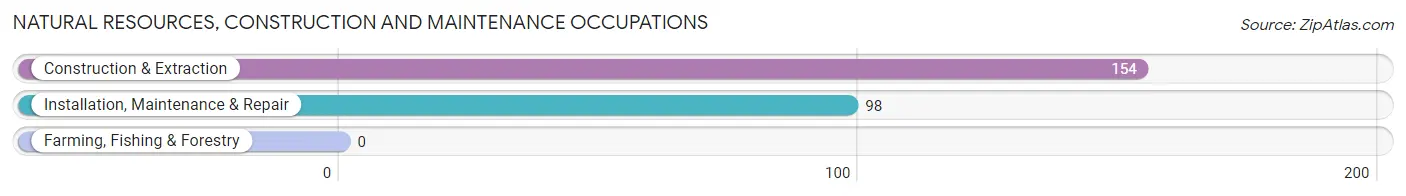
Natural Resources, Construction and Maintenance Occupations
The most common Natural Resources, Construction and Maintenance occupations in Landover Hills are Construction & Extraction (154 | 15.3%), and Installation, Maintenance & Repair (98 | 9.7%).
Natural Resources, Construction and Maintenance Occupations by Sex
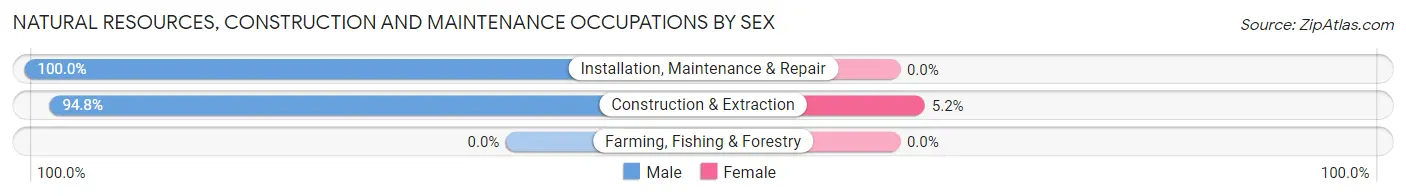
| Occupation | Male | Female |
| Farming, Fishing & Forestry | 0 (0.0%) | 0 (0.0%) |
| Construction & Extraction | 146 (94.8%) | 8 (5.2%) |
| Installation, Maintenance & Repair | 98 (100.0%) | 0 (0.0%) |
| Total (Category) | 244 (96.8%) | 8 (3.2%) |
| Total (Overall) | 591 (58.8%) | 415 (41.2%) |
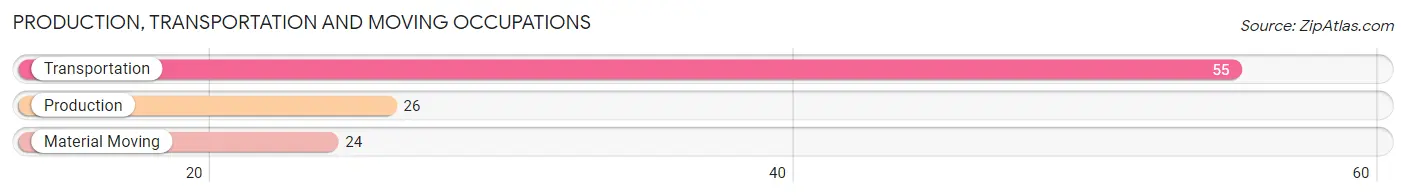
Production, Transportation and Moving Occupations
The most common Production, Transportation and Moving occupations in Landover Hills are Transportation (55 | 5.5%), Production (26 | 2.6%), and Material Moving (24 | 2.4%).
Production, Transportation and Moving Occupations by Sex
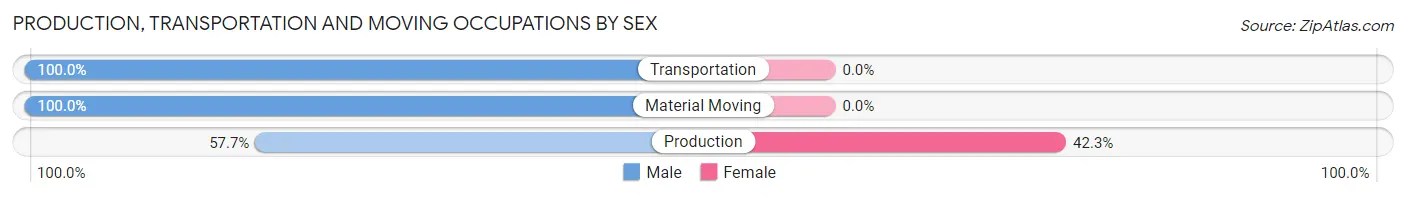
| Occupation | Male | Female |
| Production | 15 (57.7%) | 11 (42.3%) |
| Transportation | 55 (100.0%) | 0 (0.0%) |
| Material Moving | 24 (100.0%) | 0 (0.0%) |
| Total (Category) | 94 (89.5%) | 11 (10.5%) |
| Total (Overall) | 591 (58.8%) | 415 (41.2%) |
Employment Industries by Sex in Landover Hills
Employment Industries in Landover Hills
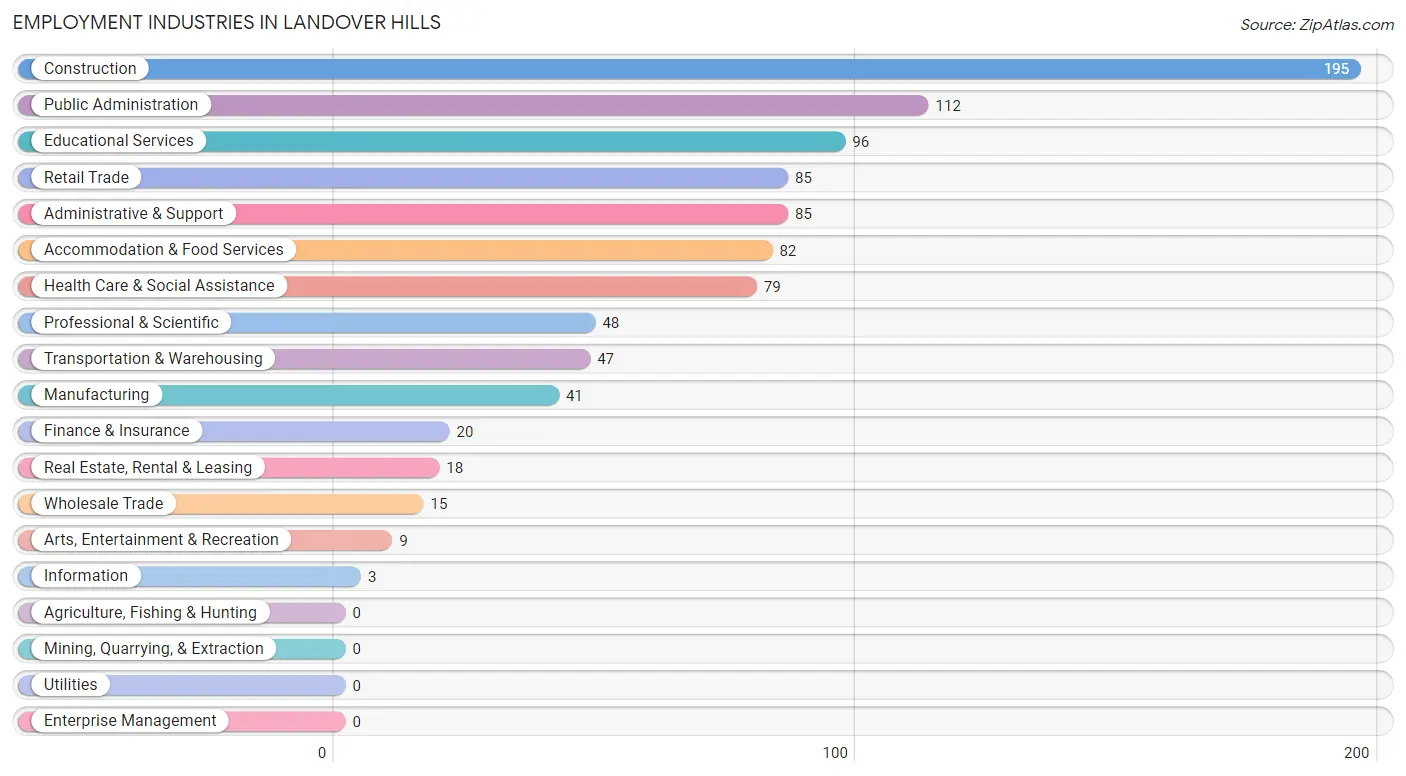
The major employment industries in Landover Hills include Construction (195 | 19.4%), Public Administration (112 | 11.1%), Educational Services (96 | 9.5%), Retail Trade (85 | 8.5%), and Administrative & Support (85 | 8.5%).
Employment Industries by Sex in Landover Hills
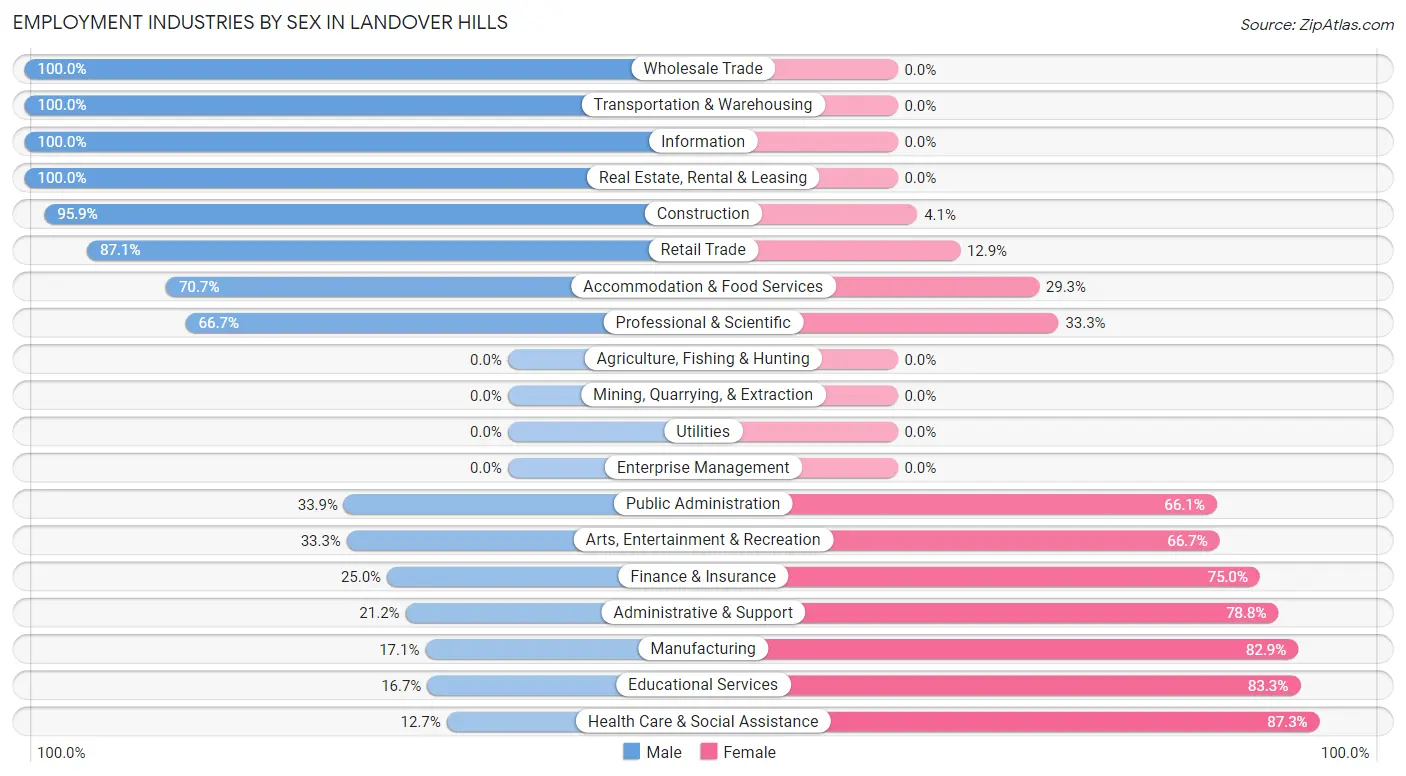
The Landover Hills industries that see more men than women are Wholesale Trade (100.0%), Transportation & Warehousing (100.0%), and Information (100.0%), whereas the industries that tend to have a higher number of women are Health Care & Social Assistance (87.3%), Educational Services (83.3%), and Manufacturing (82.9%).
| Industry | Male | Female |
| Agriculture, Fishing & Hunting | 0 (0.0%) | 0 (0.0%) |
| Mining, Quarrying, & Extraction | 0 (0.0%) | 0 (0.0%) |
| Construction | 187 (95.9%) | 8 (4.1%) |
| Manufacturing | 7 (17.1%) | 34 (82.9%) |
| Wholesale Trade | 15 (100.0%) | 0 (0.0%) |
| Retail Trade | 74 (87.1%) | 11 (12.9%) |
| Transportation & Warehousing | 47 (100.0%) | 0 (0.0%) |
| Utilities | 0 (0.0%) | 0 (0.0%) |
| Information | 3 (100.0%) | 0 (0.0%) |
| Finance & Insurance | 5 (25.0%) | 15 (75.0%) |
| Real Estate, Rental & Leasing | 18 (100.0%) | 0 (0.0%) |
| Professional & Scientific | 32 (66.7%) | 16 (33.3%) |
| Enterprise Management | 0 (0.0%) | 0 (0.0%) |
| Administrative & Support | 18 (21.2%) | 67 (78.8%) |
| Educational Services | 16 (16.7%) | 80 (83.3%) |
| Health Care & Social Assistance | 10 (12.7%) | 69 (87.3%) |
| Arts, Entertainment & Recreation | 3 (33.3%) | 6 (66.7%) |
| Accommodation & Food Services | 58 (70.7%) | 24 (29.3%) |
| Public Administration | 38 (33.9%) | 74 (66.1%) |
| Total | 591 (58.8%) | 415 (41.2%) |
Education in Landover Hills
School Enrollment in Landover Hills
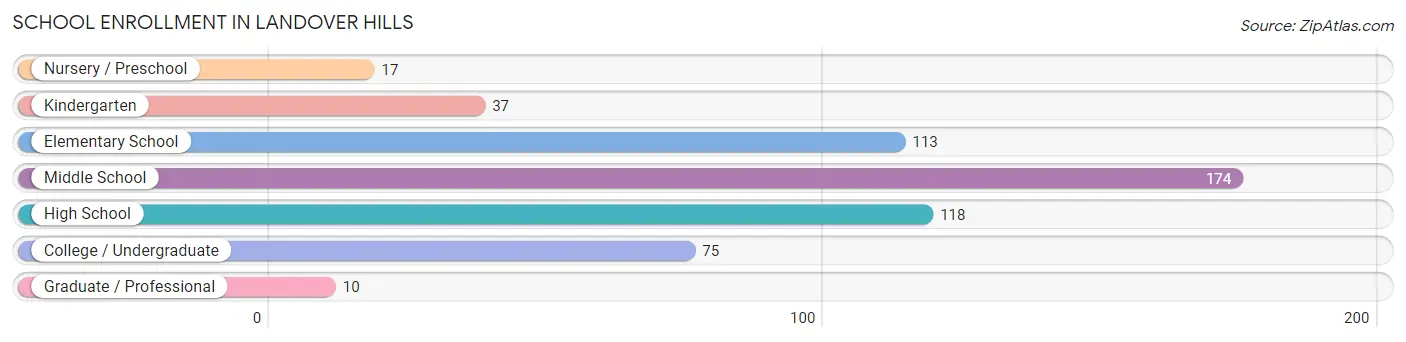
The most common levels of schooling among the 544 students in Landover Hills are middle school (174 | 32.0%), high school (118 | 21.7%), and elementary school (113 | 20.8%).
| School Level | # Students | % Students |
| Nursery / Preschool | 17 | 3.1% |
| Kindergarten | 37 | 6.8% |
| Elementary School | 113 | 20.8% |
| Middle School | 174 | 32.0% |
| High School | 118 | 21.7% |
| College / Undergraduate | 75 | 13.8% |
| Graduate / Professional | 10 | 1.8% |
| Total | 544 | 100.0% |
School Enrollment by Age by Funding Source in Landover Hills
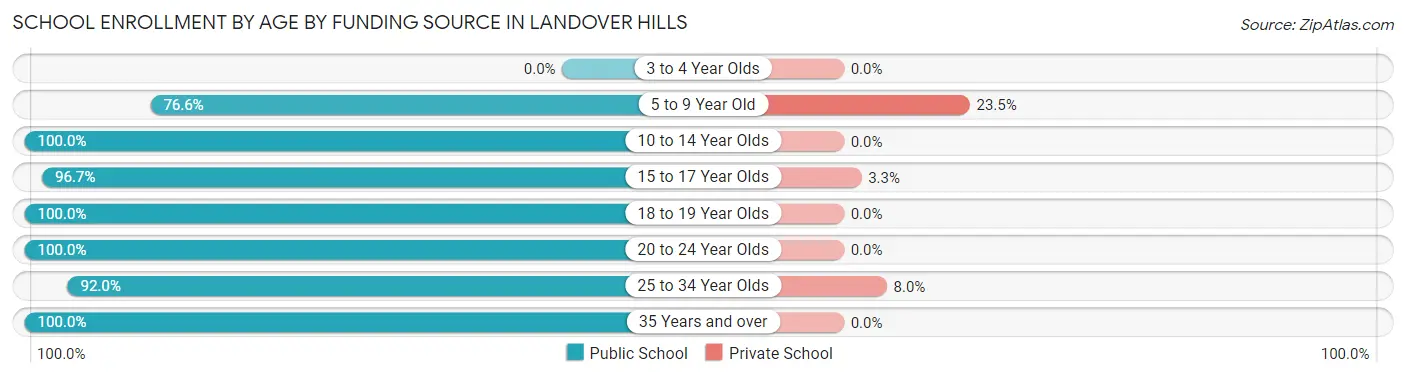
Out of a total of 544 students who are enrolled in schools in Landover Hills, 39 (7.2%) attend a private institution, while the remaining 505 (92.8%) are enrolled in public schools. The age group of 5 to 9 year old has the highest likelihood of being enrolled in private schools, with 34 (23.4% in the age bracket) enrolled. Conversely, the age group of 10 to 14 year olds has the lowest likelihood of being enrolled in a private school, with 200 (100.0% in the age bracket) attending a public institution.
| Age Bracket | Public School | Private School |
| 3 to 4 Year Olds | 0 (0.0%) | 0 (0.0%) |
| 5 to 9 Year Old | 111 (76.5%) | 34 (23.4%) |
| 10 to 14 Year Olds | 200 (100.0%) | 0 (0.0%) |
| 15 to 17 Year Olds | 89 (96.7%) | 3 (3.3%) |
| 18 to 19 Year Olds | 11 (100.0%) | 0 (0.0%) |
| 20 to 24 Year Olds | 63 (100.0%) | 0 (0.0%) |
| 25 to 34 Year Olds | 23 (92.0%) | 2 (8.0%) |
| 35 Years and over | 8 (100.0%) | 0 (0.0%) |
| Total | 505 (92.8%) | 39 (7.2%) |
Educational Attainment by Field of Study in Landover Hills
Science & technology (43 | 17.7%), social sciences (30 | 12.3%), arts & humanities (29 | 11.9%), computers & mathematics (23 | 9.5%), and physical & health sciences (21 | 8.6%) are the most common fields of study among 243 individuals in Landover Hills who have obtained a bachelor's degree or higher.
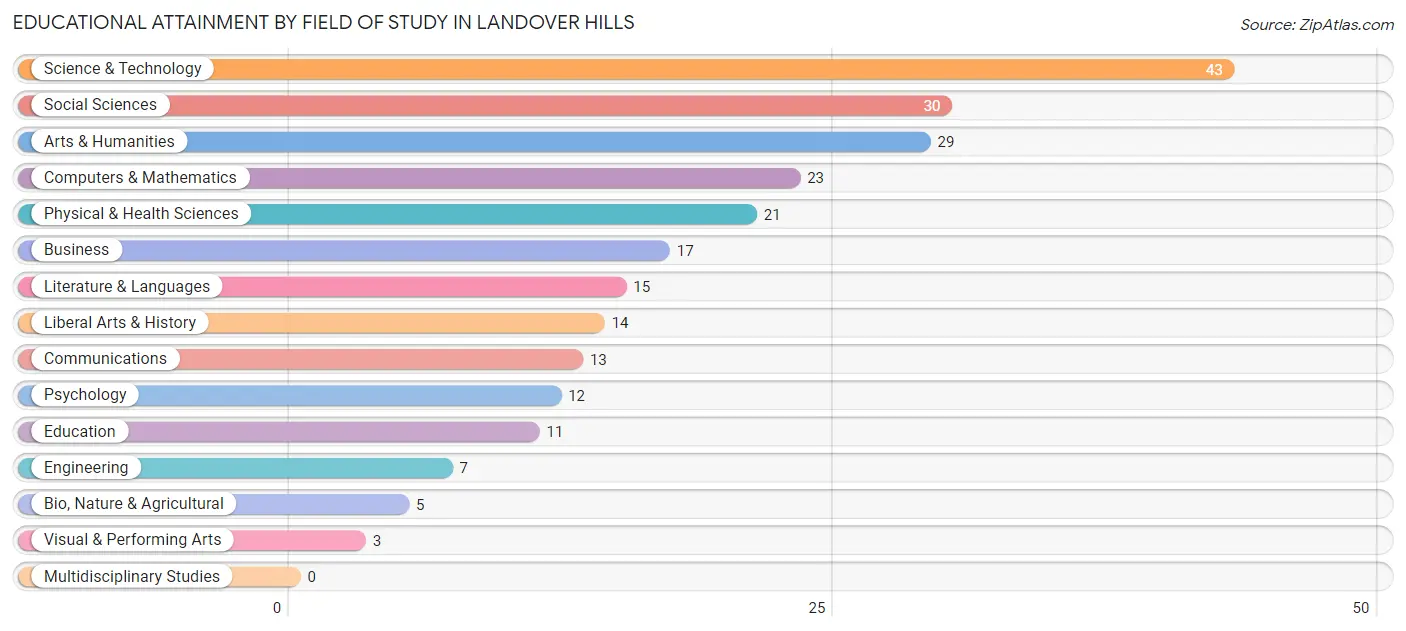
| Field of Study | # Graduates | % Graduates |
| Computers & Mathematics | 23 | 9.5% |
| Bio, Nature & Agricultural | 5 | 2.1% |
| Physical & Health Sciences | 21 | 8.6% |
| Psychology | 12 | 4.9% |
| Social Sciences | 30 | 12.3% |
| Engineering | 7 | 2.9% |
| Multidisciplinary Studies | 0 | 0.0% |
| Science & Technology | 43 | 17.7% |
| Business | 17 | 7.0% |
| Education | 11 | 4.5% |
| Literature & Languages | 15 | 6.2% |
| Liberal Arts & History | 14 | 5.8% |
| Visual & Performing Arts | 3 | 1.2% |
| Communications | 13 | 5.3% |
| Arts & Humanities | 29 | 11.9% |
| Total | 243 | 100.0% |
Transportation & Commute in Landover Hills
Vehicle Availability by Sex in Landover Hills
The most prevalent vehicle ownership categories in Landover Hills are males with 2 vehicles (249, accounting for 43.1%) and females with 2 vehicles (188, making up 60.7%).
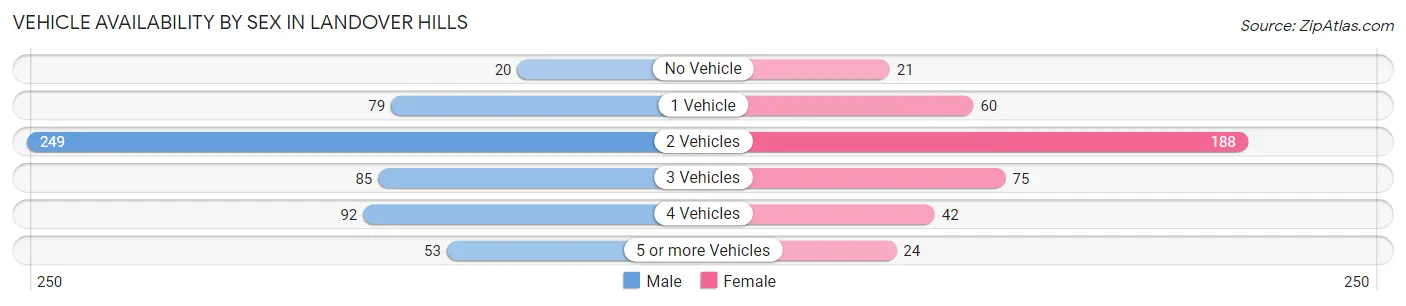
| Vehicles Available | Male | Female |
| No Vehicle | 20 (3.5%) | 21 (5.1%) |
| 1 Vehicle | 79 (13.7%) | 60 (14.6%) |
| 2 Vehicles | 249 (43.1%) | 188 (45.9%) |
| 3 Vehicles | 85 (14.7%) | 75 (18.3%) |
| 4 Vehicles | 92 (15.9%) | 42 (10.2%) |
| 5 or more Vehicles | 53 (9.2%) | 24 (5.9%) |
| Total | 578 (100.0%) | 410 (100.0%) |
Commute Time in Landover Hills
The most frequently occuring commute durations in Landover Hills are 45 to 59 minutes (223 commuters, 23.5%), 30 to 34 minutes (157 commuters, 16.5%), and 20 to 24 minutes (119 commuters, 12.5%).
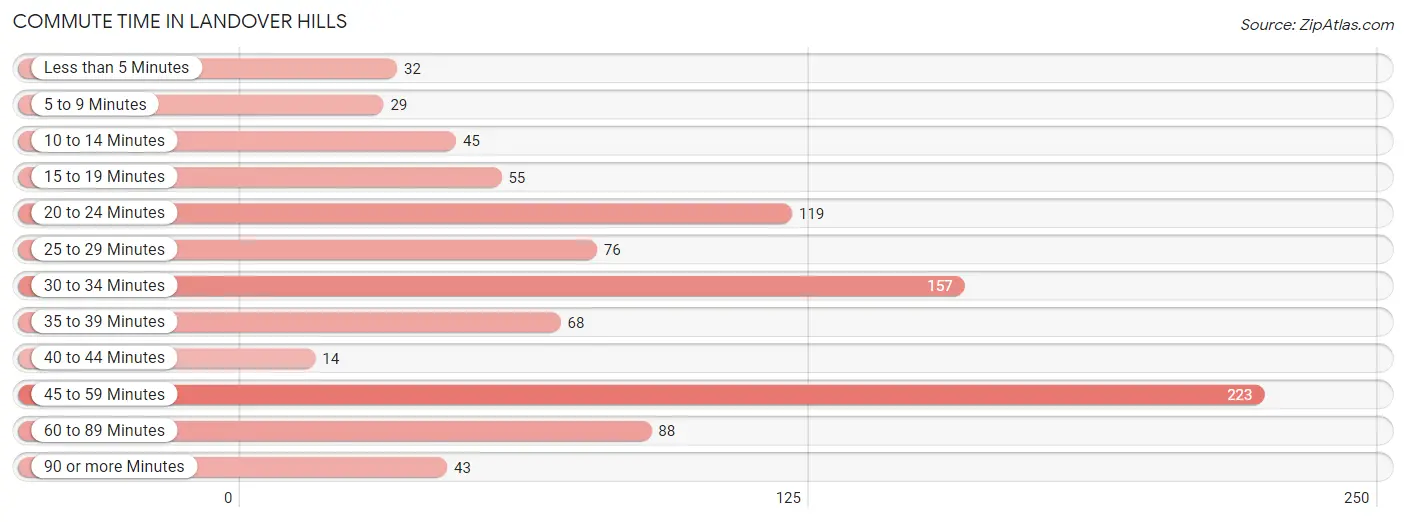
| Commute Time | # Commuters | % Commuters |
| Less than 5 Minutes | 32 | 3.4% |
| 5 to 9 Minutes | 29 | 3.1% |
| 10 to 14 Minutes | 45 | 4.7% |
| 15 to 19 Minutes | 55 | 5.8% |
| 20 to 24 Minutes | 119 | 12.5% |
| 25 to 29 Minutes | 76 | 8.0% |
| 30 to 34 Minutes | 157 | 16.5% |
| 35 to 39 Minutes | 68 | 7.2% |
| 40 to 44 Minutes | 14 | 1.5% |
| 45 to 59 Minutes | 223 | 23.5% |
| 60 to 89 Minutes | 88 | 9.3% |
| 90 or more Minutes | 43 | 4.5% |
Commute Time by Sex in Landover Hills
The most common commute times in Landover Hills are 45 to 59 minutes (130 commuters, 23.1%) for males and 45 to 59 minutes (93 commuters, 24.2%) for females.
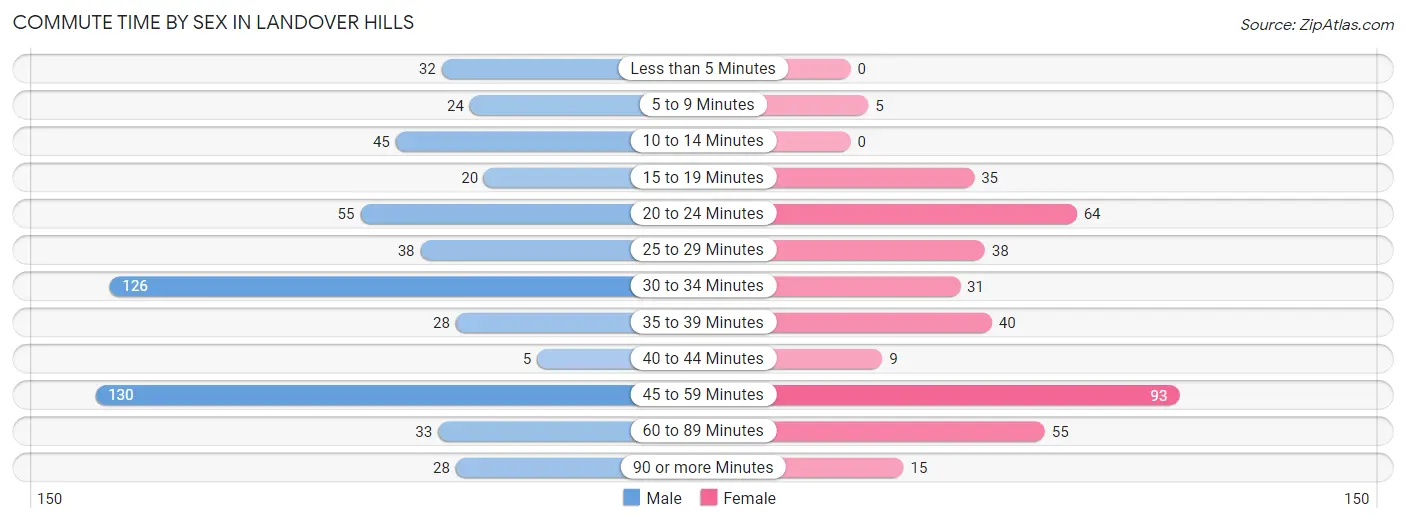
| Commute Time | Male | Female |
| Less than 5 Minutes | 32 (5.7%) | 0 (0.0%) |
| 5 to 9 Minutes | 24 (4.3%) | 5 (1.3%) |
| 10 to 14 Minutes | 45 (8.0%) | 0 (0.0%) |
| 15 to 19 Minutes | 20 (3.5%) | 35 (9.1%) |
| 20 to 24 Minutes | 55 (9.8%) | 64 (16.6%) |
| 25 to 29 Minutes | 38 (6.7%) | 38 (9.9%) |
| 30 to 34 Minutes | 126 (22.3%) | 31 (8.1%) |
| 35 to 39 Minutes | 28 (5.0%) | 40 (10.4%) |
| 40 to 44 Minutes | 5 (0.9%) | 9 (2.3%) |
| 45 to 59 Minutes | 130 (23.1%) | 93 (24.2%) |
| 60 to 89 Minutes | 33 (5.9%) | 55 (14.3%) |
| 90 or more Minutes | 28 (5.0%) | 15 (3.9%) |
Time of Departure to Work by Sex in Landover Hills
The most frequent times of departure to work in Landover Hills are 5:00 AM to 5:29 AM (77, 13.7%) for males and 8:00 AM to 8:29 AM (89, 23.1%) for females.
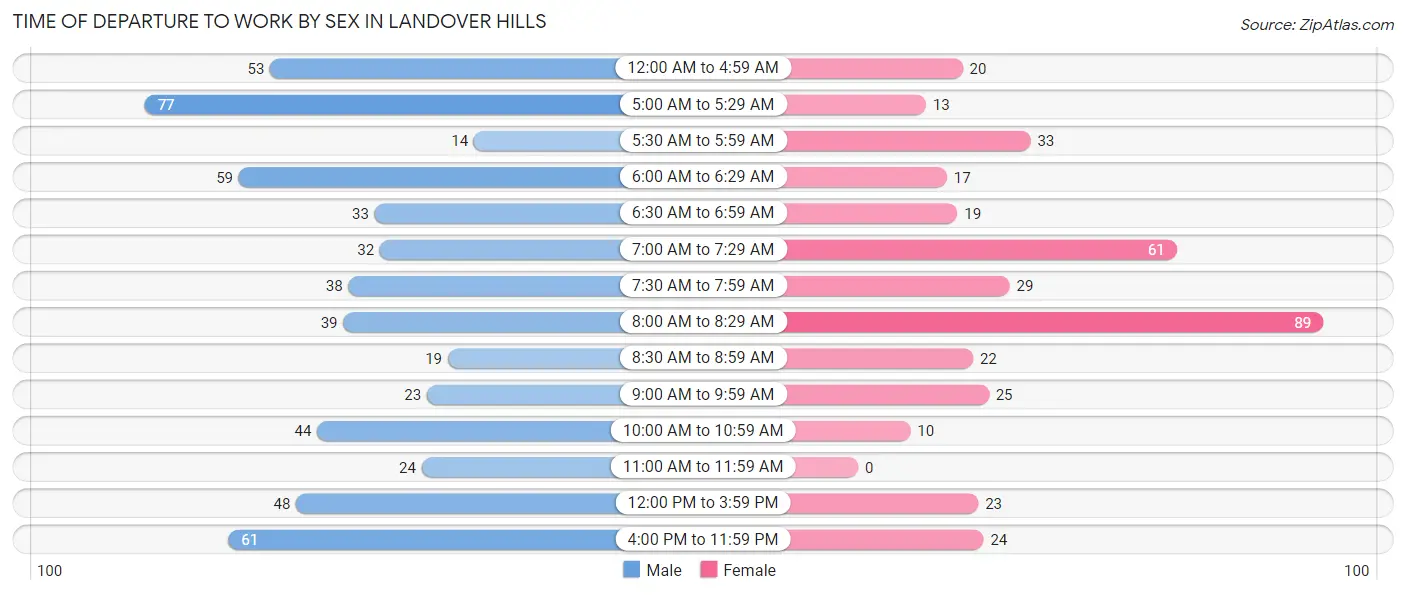
| Time of Departure | Male | Female |
| 12:00 AM to 4:59 AM | 53 (9.4%) | 20 (5.2%) |
| 5:00 AM to 5:29 AM | 77 (13.7%) | 13 (3.4%) |
| 5:30 AM to 5:59 AM | 14 (2.5%) | 33 (8.6%) |
| 6:00 AM to 6:29 AM | 59 (10.5%) | 17 (4.4%) |
| 6:30 AM to 6:59 AM | 33 (5.9%) | 19 (4.9%) |
| 7:00 AM to 7:29 AM | 32 (5.7%) | 61 (15.8%) |
| 7:30 AM to 7:59 AM | 38 (6.7%) | 29 (7.5%) |
| 8:00 AM to 8:29 AM | 39 (6.9%) | 89 (23.1%) |
| 8:30 AM to 8:59 AM | 19 (3.4%) | 22 (5.7%) |
| 9:00 AM to 9:59 AM | 23 (4.1%) | 25 (6.5%) |
| 10:00 AM to 10:59 AM | 44 (7.8%) | 10 (2.6%) |
| 11:00 AM to 11:59 AM | 24 (4.3%) | 0 (0.0%) |
| 12:00 PM to 3:59 PM | 48 (8.5%) | 23 (6.0%) |
| 4:00 PM to 11:59 PM | 61 (10.8%) | 24 (6.2%) |
| Total | 564 (100.0%) | 385 (100.0%) |
Housing Occupancy in Landover Hills
Occupancy by Ownership in Landover Hills
Of the total 583 dwellings in Landover Hills, owner-occupied units account for 532 (91.2%), while renter-occupied units make up 51 (8.7%).
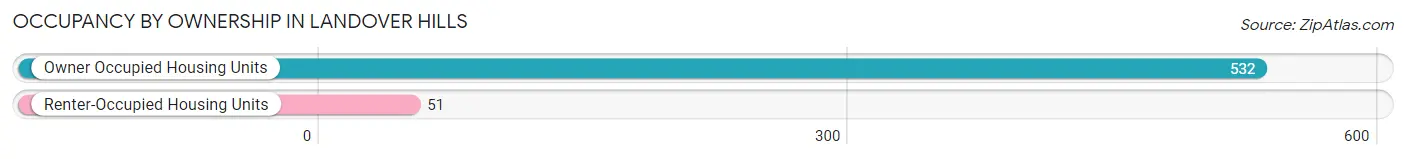
| Occupancy | # Housing Units | % Housing Units |
| Owner Occupied Housing Units | 532 | 91.2% |
| Renter-Occupied Housing Units | 51 | 8.7% |
| Total Occupied Housing Units | 583 | 100.0% |
Occupancy by Household Size in Landover Hills
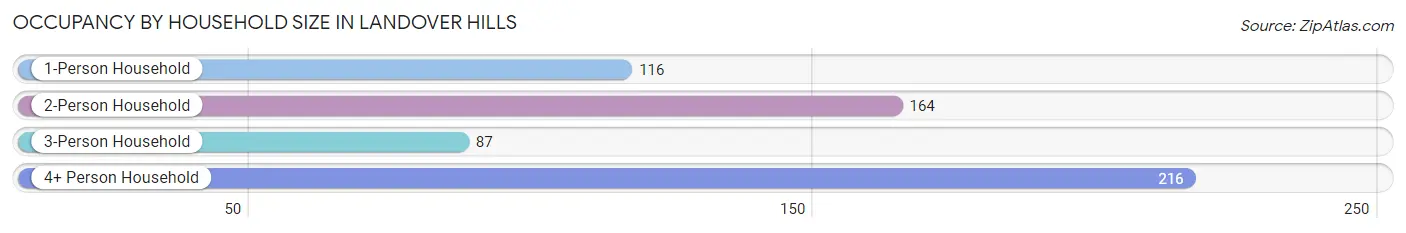
| Household Size | # Housing Units | % Housing Units |
| 1-Person Household | 116 | 19.9% |
| 2-Person Household | 164 | 28.1% |
| 3-Person Household | 87 | 14.9% |
| 4+ Person Household | 216 | 37.0% |
| Total Housing Units | 583 | 100.0% |
Occupancy by Ownership by Household Size in Landover Hills
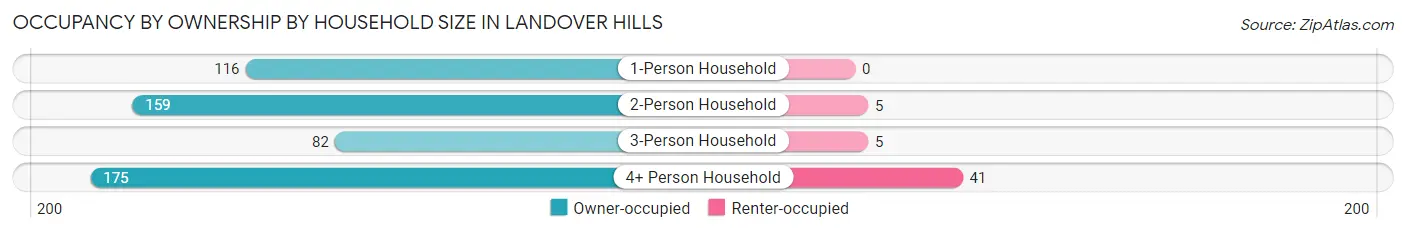
| Household Size | Owner-occupied | Renter-occupied |
| 1-Person Household | 116 (100.0%) | 0 (0.0%) |
| 2-Person Household | 159 (97.0%) | 5 (3.0%) |
| 3-Person Household | 82 (94.3%) | 5 (5.8%) |
| 4+ Person Household | 175 (81.0%) | 41 (19.0%) |
| Total Housing Units | 532 (91.2%) | 51 (8.7%) |
Occupancy by Educational Attainment in Landover Hills
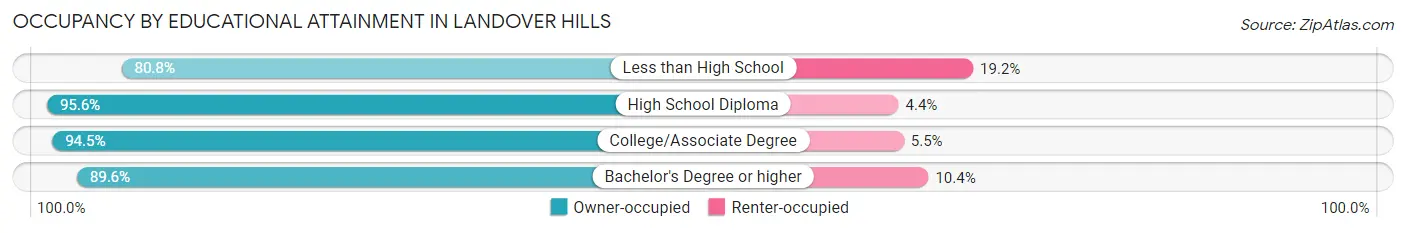
| Household Size | Owner-occupied | Renter-occupied |
| Less than High School | 84 (80.8%) | 20 (19.2%) |
| High School Diploma | 172 (95.6%) | 8 (4.4%) |
| College/Associate Degree | 155 (94.5%) | 9 (5.5%) |
| Bachelor's Degree or higher | 121 (89.6%) | 14 (10.4%) |
Occupancy by Age of Householder in Landover Hills
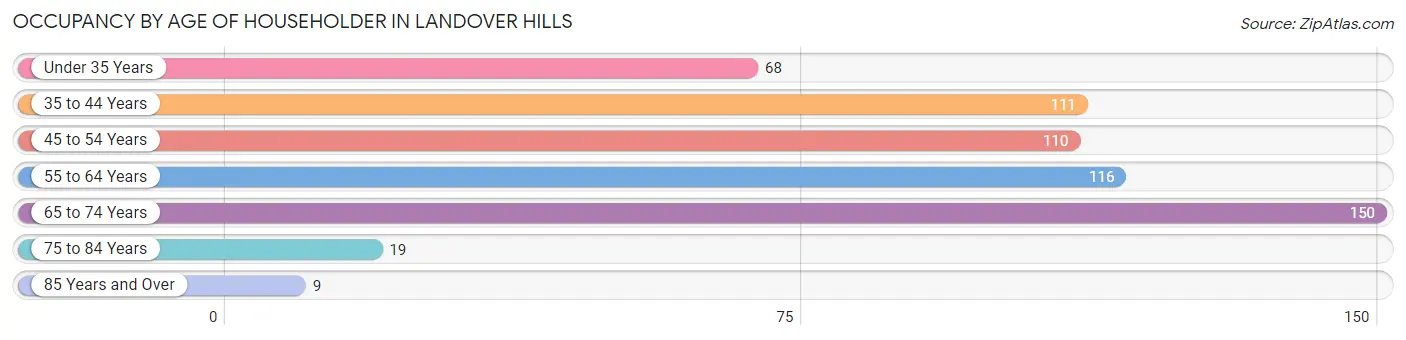
| Age Bracket | # Households | % Households |
| Under 35 Years | 68 | 11.7% |
| 35 to 44 Years | 111 | 19.0% |
| 45 to 54 Years | 110 | 18.9% |
| 55 to 64 Years | 116 | 19.9% |
| 65 to 74 Years | 150 | 25.7% |
| 75 to 84 Years | 19 | 3.3% |
| 85 Years and Over | 9 | 1.5% |
| Total | 583 | 100.0% |
Housing Finances in Landover Hills
Median Income by Occupancy in Landover Hills
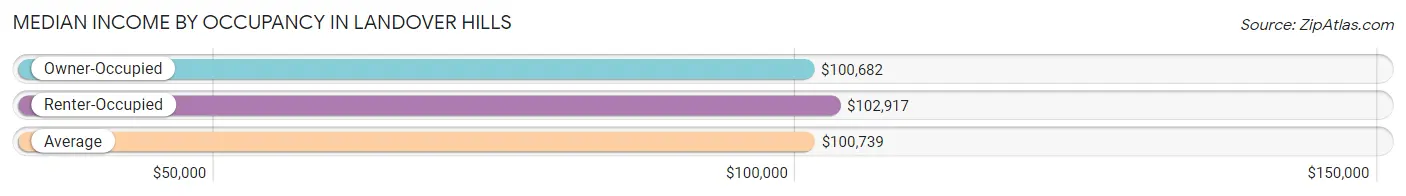
| Occupancy Type | # Households | Median Income |
| Owner-Occupied | 532 (91.2%) | $100,682 |
| Renter-Occupied | 51 (8.7%) | $102,917 |
| Average | 583 (100.0%) | $100,739 |
Occupancy by Householder Income Bracket in Landover Hills
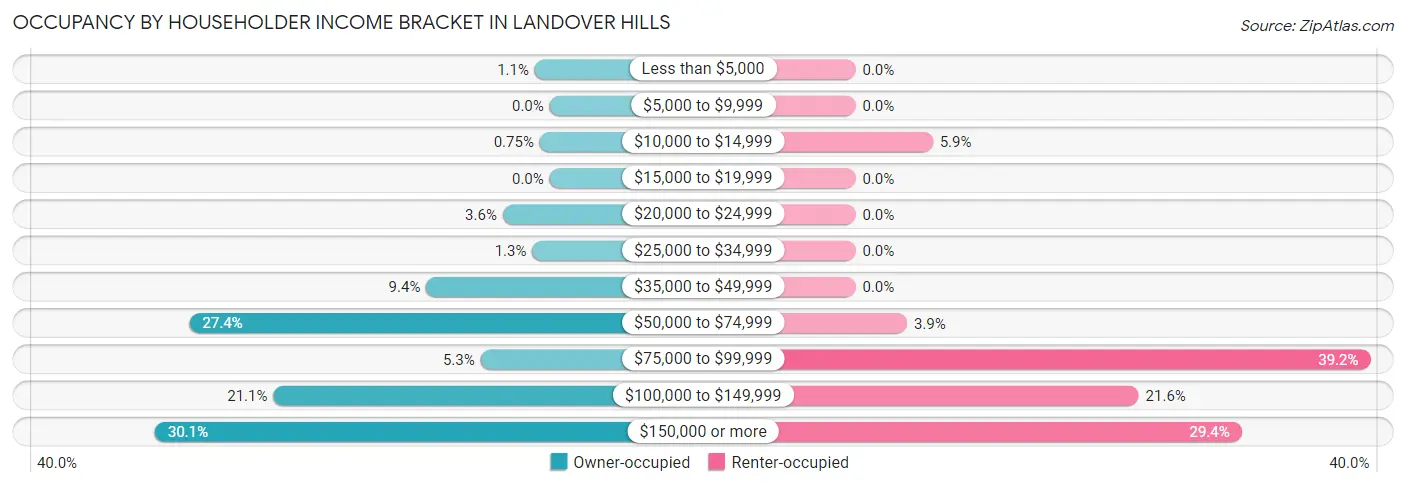
| Income Bracket | Owner-occupied | Renter-occupied |
| Less than $5,000 | 6 (1.1%) | 0 (0.0%) |
| $5,000 to $9,999 | 0 (0.0%) | 0 (0.0%) |
| $10,000 to $14,999 | 4 (0.7%) | 3 (5.9%) |
| $15,000 to $19,999 | 0 (0.0%) | 0 (0.0%) |
| $20,000 to $24,999 | 19 (3.6%) | 0 (0.0%) |
| $25,000 to $34,999 | 7 (1.3%) | 0 (0.0%) |
| $35,000 to $49,999 | 50 (9.4%) | 0 (0.0%) |
| $50,000 to $74,999 | 146 (27.4%) | 2 (3.9%) |
| $75,000 to $99,999 | 28 (5.3%) | 20 (39.2%) |
| $100,000 to $149,999 | 112 (21.0%) | 11 (21.6%) |
| $150,000 or more | 160 (30.1%) | 15 (29.4%) |
| Total | 532 (100.0%) | 51 (100.0%) |
Monthly Housing Cost Tiers in Landover Hills
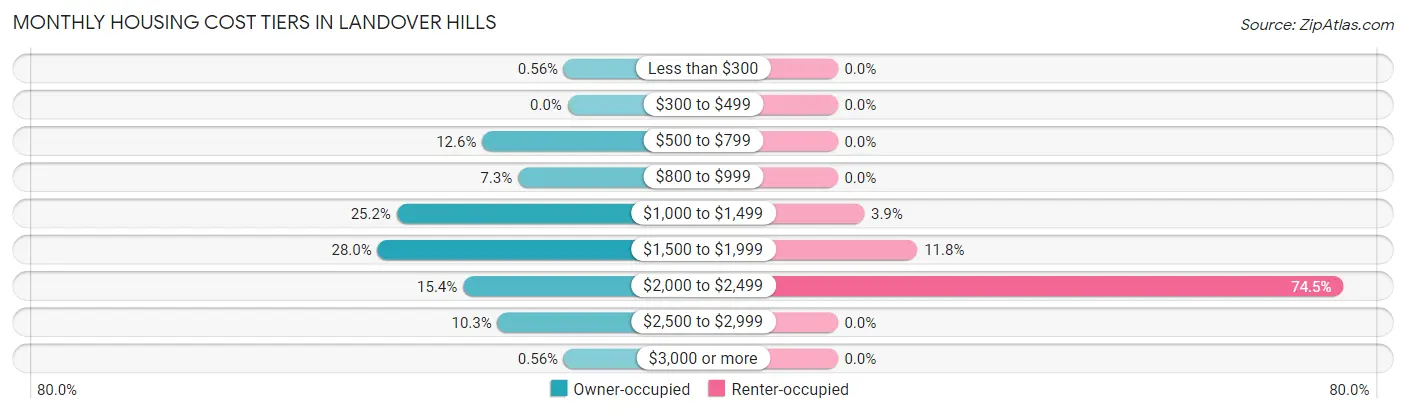
| Monthly Cost | Owner-occupied | Renter-occupied |
| Less than $300 | 3 (0.6%) | 0 (0.0%) |
| $300 to $499 | 0 (0.0%) | 0 (0.0%) |
| $500 to $799 | 67 (12.6%) | 0 (0.0%) |
| $800 to $999 | 39 (7.3%) | 0 (0.0%) |
| $1,000 to $1,499 | 134 (25.2%) | 2 (3.9%) |
| $1,500 to $1,999 | 149 (28.0%) | 6 (11.8%) |
| $2,000 to $2,499 | 82 (15.4%) | 38 (74.5%) |
| $2,500 to $2,999 | 55 (10.3%) | 0 (0.0%) |
| $3,000 or more | 3 (0.6%) | 0 (0.0%) |
| Total | 532 (100.0%) | 51 (100.0%) |
Physical Housing Characteristics in Landover Hills
Housing Structures in Landover Hills
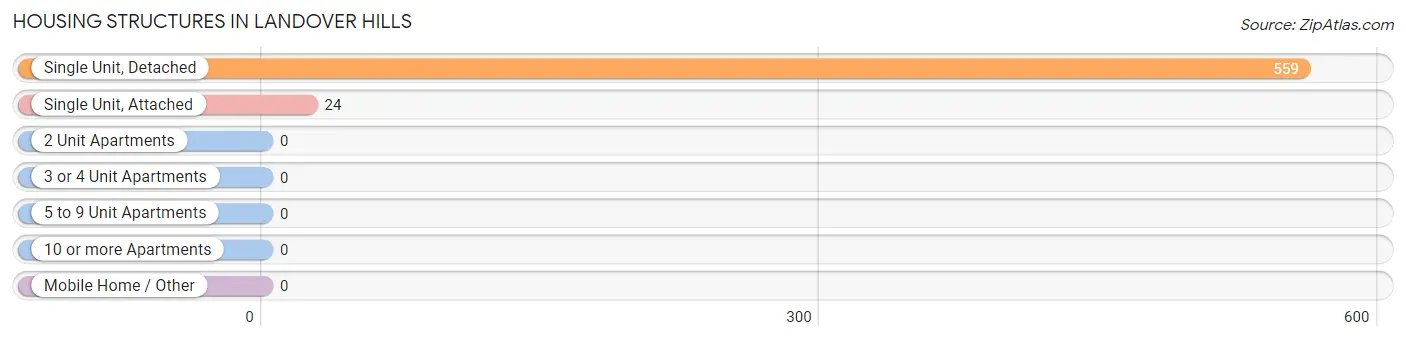
| Structure Type | # Housing Units | % Housing Units |
| Single Unit, Detached | 559 | 95.9% |
| Single Unit, Attached | 24 | 4.1% |
| 2 Unit Apartments | 0 | 0.0% |
| 3 or 4 Unit Apartments | 0 | 0.0% |
| 5 to 9 Unit Apartments | 0 | 0.0% |
| 10 or more Apartments | 0 | 0.0% |
| Mobile Home / Other | 0 | 0.0% |
| Total | 583 | 100.0% |
Housing Structures by Occupancy in Landover Hills
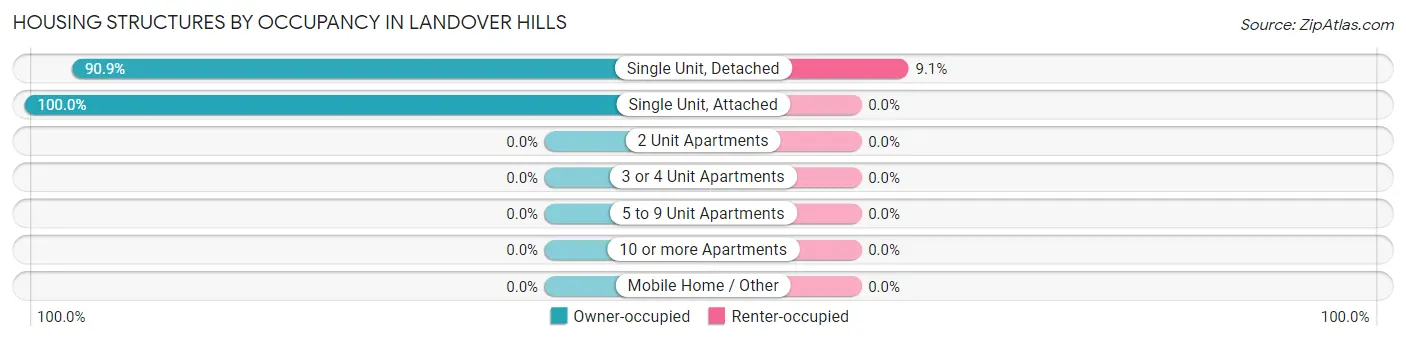
| Structure Type | Owner-occupied | Renter-occupied |
| Single Unit, Detached | 508 (90.9%) | 51 (9.1%) |
| Single Unit, Attached | 24 (100.0%) | 0 (0.0%) |
| 2 Unit Apartments | 0 (0.0%) | 0 (0.0%) |
| 3 or 4 Unit Apartments | 0 (0.0%) | 0 (0.0%) |
| 5 to 9 Unit Apartments | 0 (0.0%) | 0 (0.0%) |
| 10 or more Apartments | 0 (0.0%) | 0 (0.0%) |
| Mobile Home / Other | 0 (0.0%) | 0 (0.0%) |
| Total | 532 (91.2%) | 51 (8.7%) |
Housing Structures by Number of Rooms in Landover Hills
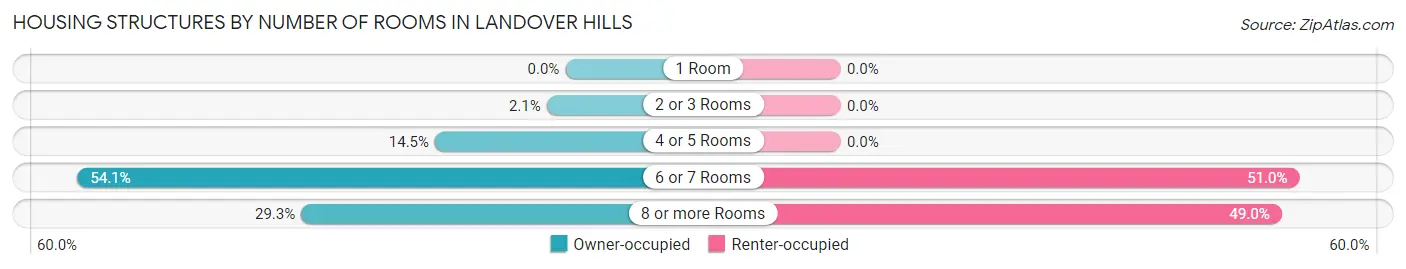
| Number of Rooms | Owner-occupied | Renter-occupied |
| 1 Room | 0 (0.0%) | 0 (0.0%) |
| 2 or 3 Rooms | 11 (2.1%) | 0 (0.0%) |
| 4 or 5 Rooms | 77 (14.5%) | 0 (0.0%) |
| 6 or 7 Rooms | 288 (54.1%) | 26 (51.0%) |
| 8 or more Rooms | 156 (29.3%) | 25 (49.0%) |
| Total | 532 (100.0%) | 51 (100.0%) |
Housing Structure by Heating Type in Landover Hills
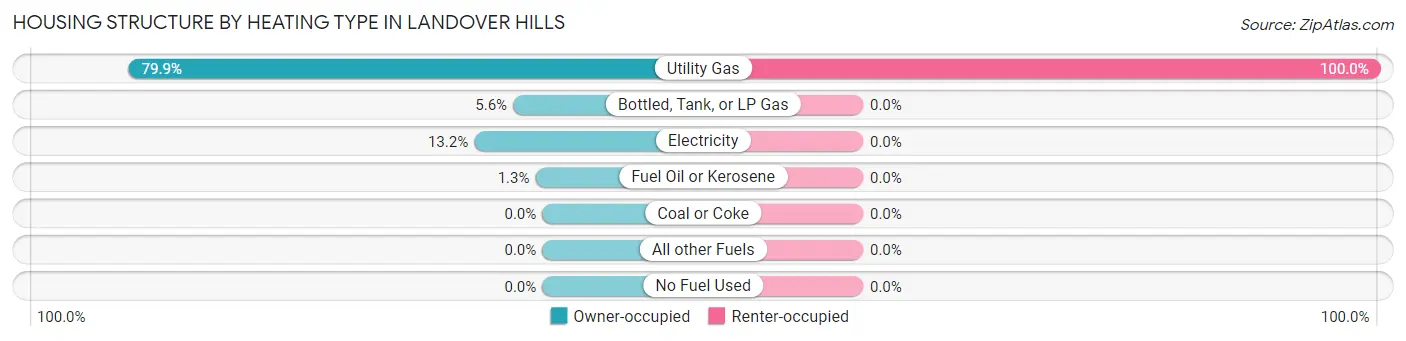
| Heating Type | Owner-occupied | Renter-occupied |
| Utility Gas | 425 (79.9%) | 51 (100.0%) |
| Bottled, Tank, or LP Gas | 30 (5.6%) | 0 (0.0%) |
| Electricity | 70 (13.2%) | 0 (0.0%) |
| Fuel Oil or Kerosene | 7 (1.3%) | 0 (0.0%) |
| Coal or Coke | 0 (0.0%) | 0 (0.0%) |
| All other Fuels | 0 (0.0%) | 0 (0.0%) |
| No Fuel Used | 0 (0.0%) | 0 (0.0%) |
| Total | 532 (100.0%) | 51 (100.0%) |
Household Vehicle Usage in Landover Hills
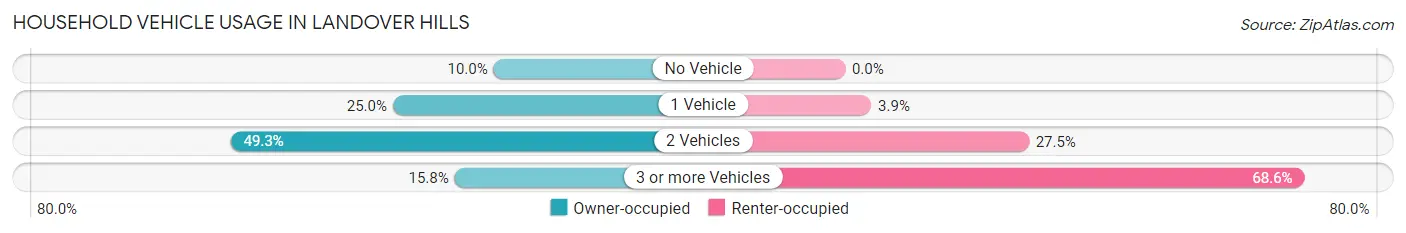
| Vehicles per Household | Owner-occupied | Renter-occupied |
| No Vehicle | 53 (10.0%) | 0 (0.0%) |
| 1 Vehicle | 133 (25.0%) | 2 (3.9%) |
| 2 Vehicles | 262 (49.2%) | 14 (27.5%) |
| 3 or more Vehicles | 84 (15.8%) | 35 (68.6%) |
| Total | 532 (100.0%) | 51 (100.0%) |
Real Estate & Mortgages in Landover Hills
Real Estate and Mortgage Overview in Landover Hills
| Characteristic | Without Mortgage | With Mortgage |
| Housing Units | 126 | 406 |
| Median Property Value | $232,500 | $332,100 |
| Median Household Income | $64,167 | $149 |
| Monthly Housing Costs | $800 | $3 |
| Real Estate Taxes | $4,492 | $9 |
Property Value by Mortgage Status in Landover Hills
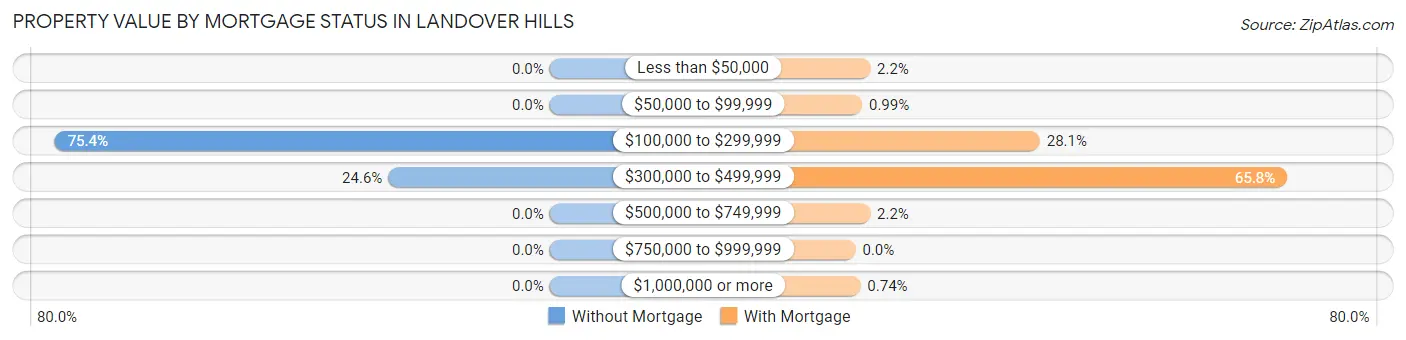
| Property Value | Without Mortgage | With Mortgage |
| Less than $50,000 | 0 (0.0%) | 9 (2.2%) |
| $50,000 to $99,999 | 0 (0.0%) | 4 (1.0%) |
| $100,000 to $299,999 | 95 (75.4%) | 114 (28.1%) |
| $300,000 to $499,999 | 31 (24.6%) | 267 (65.8%) |
| $500,000 to $749,999 | 0 (0.0%) | 9 (2.2%) |
| $750,000 to $999,999 | 0 (0.0%) | 0 (0.0%) |
| $1,000,000 or more | 0 (0.0%) | 3 (0.7%) |
| Total | 126 (100.0%) | 406 (100.0%) |
Household Income by Mortgage Status in Landover Hills
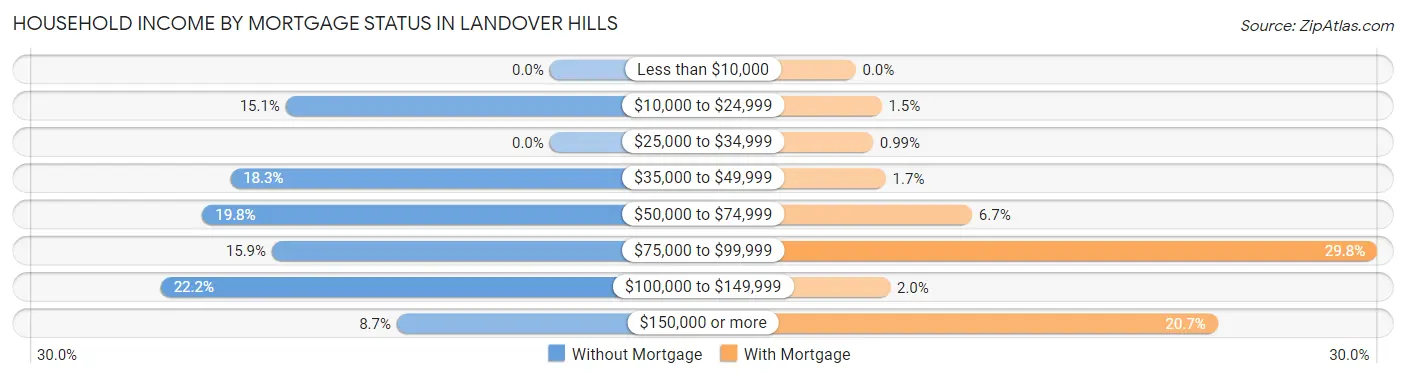
| Household Income | Without Mortgage | With Mortgage |
| Less than $10,000 | 0 (0.0%) | 0 (0.0%) |
| $10,000 to $24,999 | 19 (15.1%) | 6 (1.5%) |
| $25,000 to $34,999 | 0 (0.0%) | 4 (1.0%) |
| $35,000 to $49,999 | 23 (18.2%) | 7 (1.7%) |
| $50,000 to $74,999 | 25 (19.8%) | 27 (6.7%) |
| $75,000 to $99,999 | 20 (15.9%) | 121 (29.8%) |
| $100,000 to $149,999 | 28 (22.2%) | 8 (2.0%) |
| $150,000 or more | 11 (8.7%) | 84 (20.7%) |
| Total | 126 (100.0%) | 406 (100.0%) |
Property Value to Household Income Ratio in Landover Hills
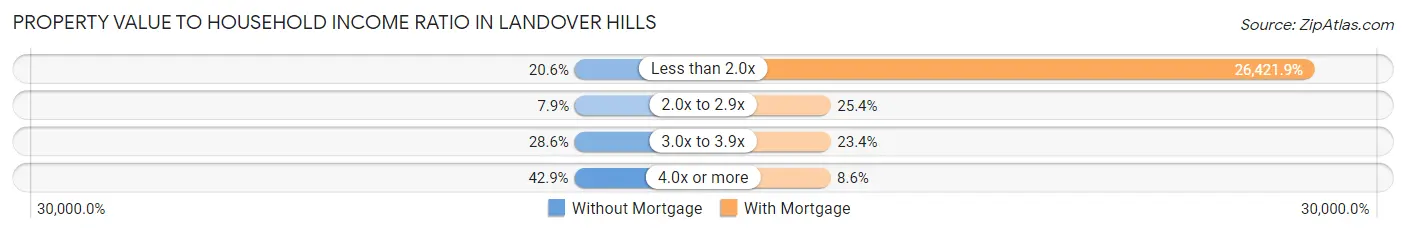
| Value-to-Income Ratio | Without Mortgage | With Mortgage |
| Less than 2.0x | 26 (20.6%) | 107,273 (26,421.9%) |
| 2.0x to 2.9x | 10 (7.9%) | 103 (25.4%) |
| 3.0x to 3.9x | 36 (28.6%) | 95 (23.4%) |
| 4.0x or more | 54 (42.9%) | 35 (8.6%) |
| Total | 126 (100.0%) | 406 (100.0%) |
Real Estate Taxes by Mortgage Status in Landover Hills
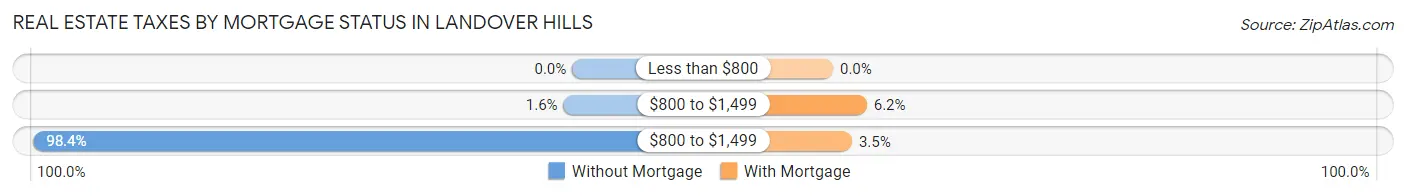
| Property Taxes | Without Mortgage | With Mortgage |
| Less than $800 | 0 (0.0%) | 0 (0.0%) |
| $800 to $1,499 | 2 (1.6%) | 25 (6.2%) |
| $800 to $1,499 | 124 (98.4%) | 14 (3.5%) |
| Total | 126 (100.0%) | 406 (100.0%) |
Health & Disability in Landover Hills
Health Insurance Coverage by Age in Landover Hills
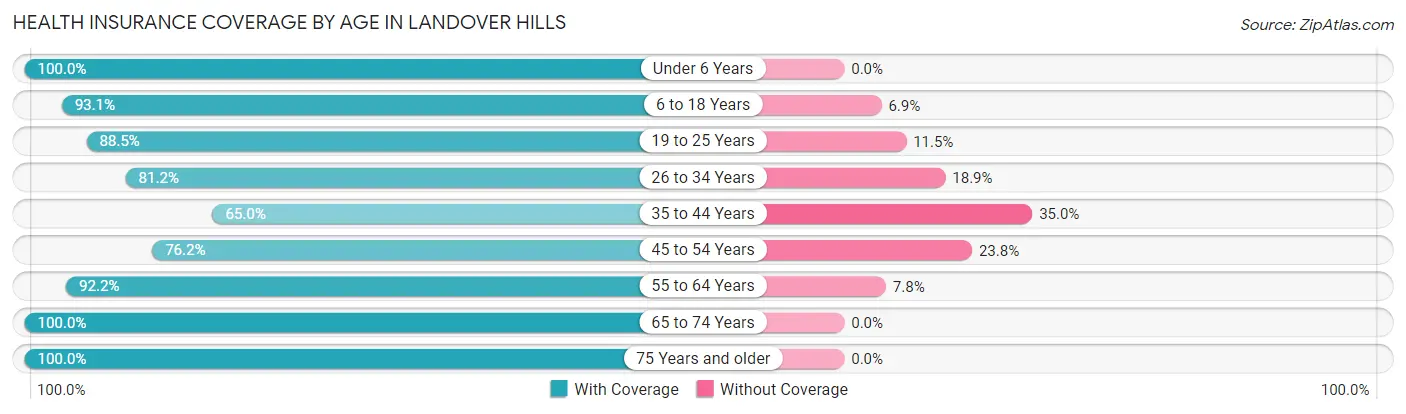
| Age Bracket | With Coverage | Without Coverage |
| Under 6 Years | 185 (100.0%) | 0 (0.0%) |
| 6 to 18 Years | 376 (93.1%) | 28 (6.9%) |
| 19 to 25 Years | 161 (88.5%) | 21 (11.5%) |
| 26 to 34 Years | 211 (81.1%) | 49 (18.9%) |
| 35 to 44 Years | 178 (65.0%) | 96 (35.0%) |
| 45 to 54 Years | 192 (76.2%) | 60 (23.8%) |
| 55 to 64 Years | 214 (92.2%) | 18 (7.8%) |
| 65 to 74 Years | 291 (100.0%) | 0 (0.0%) |
| 75 Years and older | 37 (100.0%) | 0 (0.0%) |
| Total | 1,845 (87.2%) | 272 (12.9%) |
Health Insurance Coverage by Citizenship Status in Landover Hills
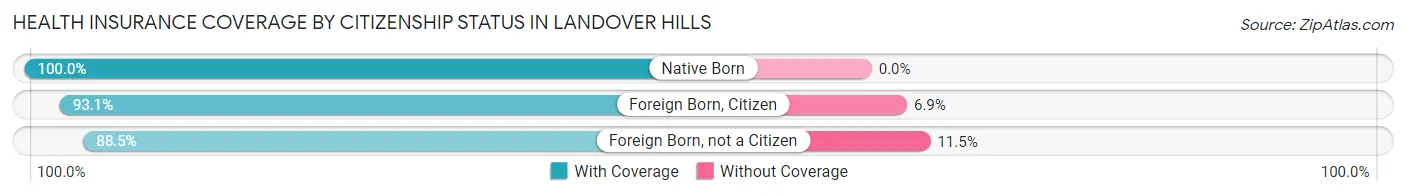
| Citizenship Status | With Coverage | Without Coverage |
| Native Born | 185 (100.0%) | 0 (0.0%) |
| Foreign Born, Citizen | 376 (93.1%) | 28 (6.9%) |
| Foreign Born, not a Citizen | 161 (88.5%) | 21 (11.5%) |
Health Insurance Coverage by Household Income in Landover Hills
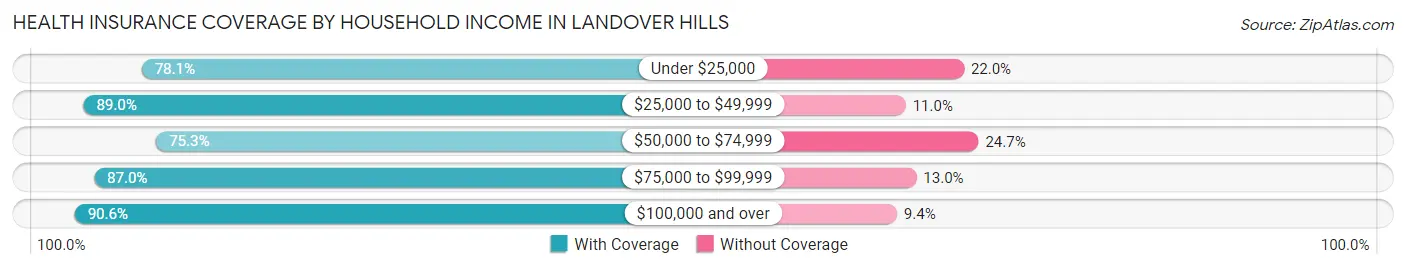
| Household Income | With Coverage | Without Coverage |
| Under $25,000 | 32 (78.0%) | 9 (22.0%) |
| $25,000 to $49,999 | 145 (89.0%) | 18 (11.0%) |
| $50,000 to $74,999 | 287 (75.3%) | 94 (24.7%) |
| $75,000 to $99,999 | 180 (87.0%) | 27 (13.0%) |
| $100,000 and over | 1,196 (90.6%) | 124 (9.4%) |
Public vs Private Health Insurance Coverage by Age in Landover Hills
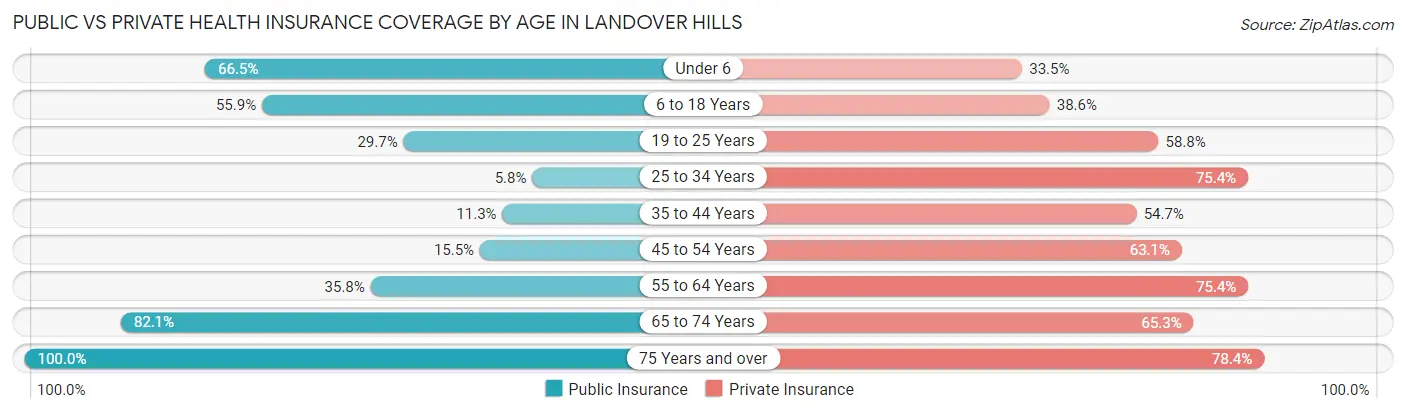
| Age Bracket | Public Insurance | Private Insurance |
| Under 6 | 123 (66.5%) | 62 (33.5%) |
| 6 to 18 Years | 226 (55.9%) | 156 (38.6%) |
| 19 to 25 Years | 54 (29.7%) | 107 (58.8%) |
| 25 to 34 Years | 15 (5.8%) | 196 (75.4%) |
| 35 to 44 Years | 31 (11.3%) | 150 (54.7%) |
| 45 to 54 Years | 39 (15.5%) | 159 (63.1%) |
| 55 to 64 Years | 83 (35.8%) | 175 (75.4%) |
| 65 to 74 Years | 239 (82.1%) | 190 (65.3%) |
| 75 Years and over | 37 (100.0%) | 29 (78.4%) |
| Total | 847 (40.0%) | 1,224 (57.8%) |
Disability Status by Sex by Age in Landover Hills
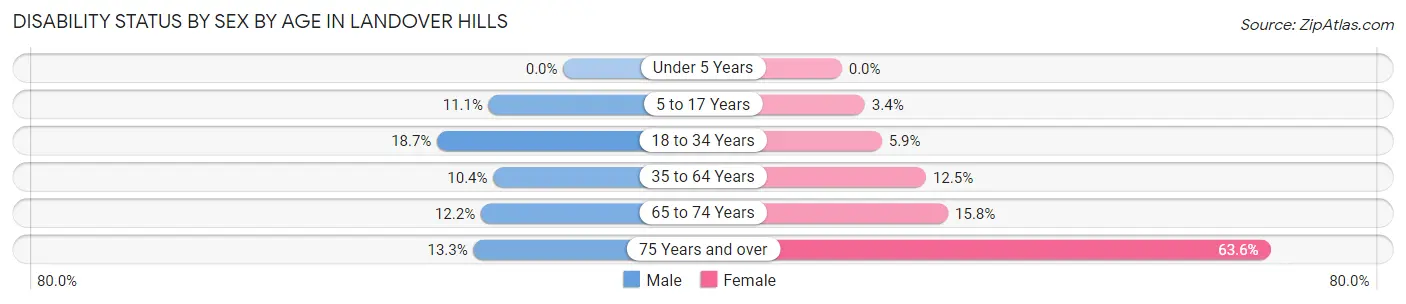
| Age Bracket | Male | Female |
| Under 5 Years | 0 (0.0%) | 0 (0.0%) |
| 5 to 17 Years | 29 (11.1%) | 6 (3.4%) |
| 18 to 34 Years | 47 (18.7%) | 12 (5.9%) |
| 35 to 64 Years | 43 (10.4%) | 43 (12.5%) |
| 65 to 74 Years | 17 (12.2%) | 24 (15.8%) |
| 75 Years and over | 2 (13.3%) | 14 (63.6%) |
Disability Class by Sex by Age in Landover Hills
Disability Class: Hearing Difficulty
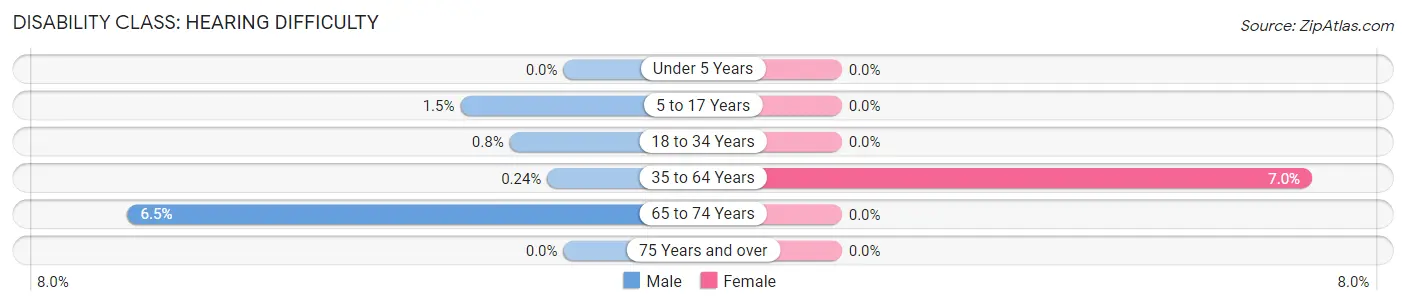
| Age Bracket | Male | Female |
| Under 5 Years | 0 (0.0%) | 0 (0.0%) |
| 5 to 17 Years | 4 (1.5%) | 0 (0.0%) |
| 18 to 34 Years | 2 (0.8%) | 0 (0.0%) |
| 35 to 64 Years | 1 (0.2%) | 24 (7.0%) |
| 65 to 74 Years | 9 (6.5%) | 0 (0.0%) |
| 75 Years and over | 0 (0.0%) | 0 (0.0%) |
Disability Class: Vision Difficulty
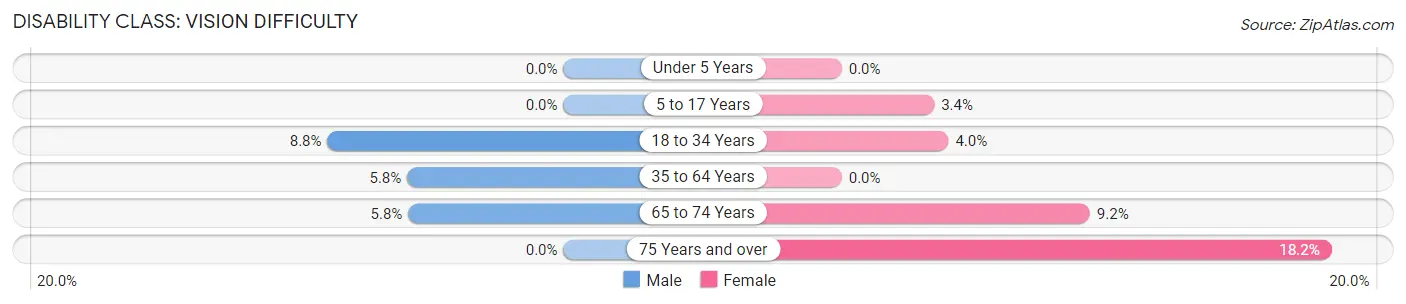
| Age Bracket | Male | Female |
| Under 5 Years | 0 (0.0%) | 0 (0.0%) |
| 5 to 17 Years | 0 (0.0%) | 6 (3.4%) |
| 18 to 34 Years | 22 (8.8%) | 8 (4.0%) |
| 35 to 64 Years | 24 (5.8%) | 0 (0.0%) |
| 65 to 74 Years | 8 (5.8%) | 14 (9.2%) |
| 75 Years and over | 0 (0.0%) | 4 (18.2%) |
Disability Class: Cognitive Difficulty
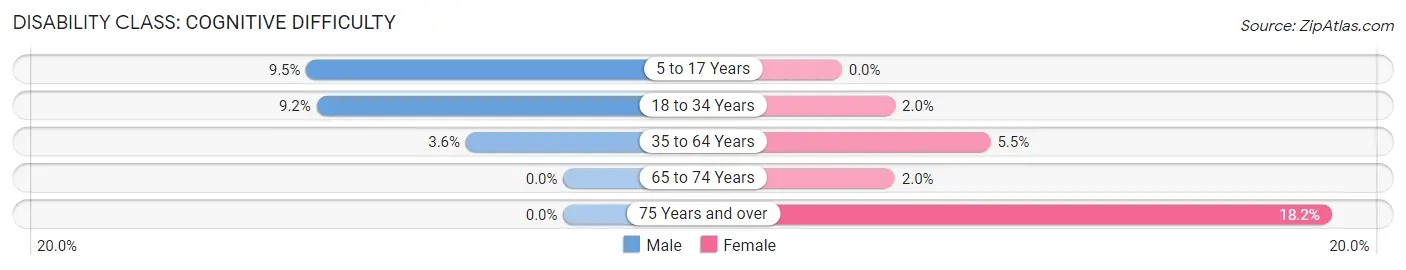
| Age Bracket | Male | Female |
| 5 to 17 Years | 25 (9.5%) | 0 (0.0%) |
| 18 to 34 Years | 23 (9.2%) | 4 (2.0%) |
| 35 to 64 Years | 15 (3.6%) | 19 (5.5%) |
| 65 to 74 Years | 0 (0.0%) | 3 (2.0%) |
| 75 Years and over | 0 (0.0%) | 4 (18.2%) |
Disability Class: Ambulatory Difficulty
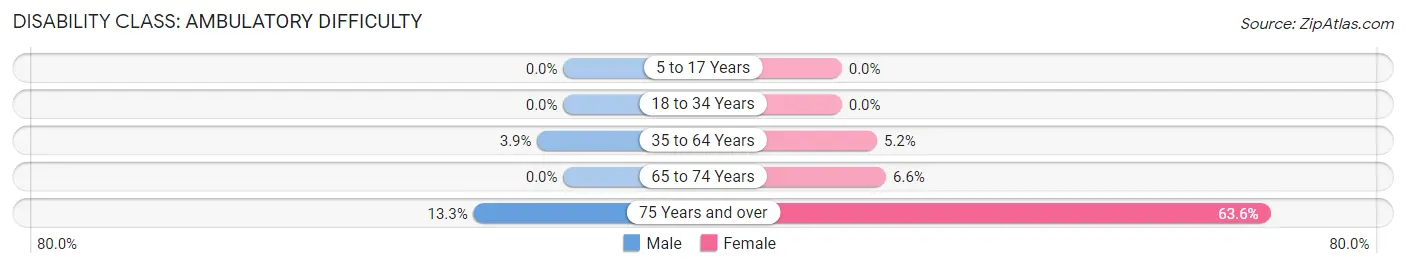
| Age Bracket | Male | Female |
| 5 to 17 Years | 0 (0.0%) | 0 (0.0%) |
| 18 to 34 Years | 0 (0.0%) | 0 (0.0%) |
| 35 to 64 Years | 16 (3.9%) | 18 (5.2%) |
| 65 to 74 Years | 0 (0.0%) | 10 (6.6%) |
| 75 Years and over | 2 (13.3%) | 14 (63.6%) |
Disability Class: Self-Care Difficulty
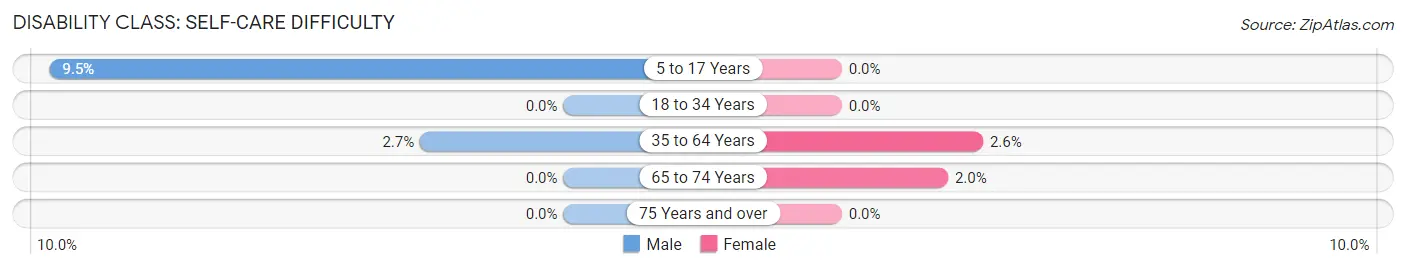
| Age Bracket | Male | Female |
| 5 to 17 Years | 25 (9.5%) | 0 (0.0%) |
| 18 to 34 Years | 0 (0.0%) | 0 (0.0%) |
| 35 to 64 Years | 11 (2.7%) | 9 (2.6%) |
| 65 to 74 Years | 0 (0.0%) | 3 (2.0%) |
| 75 Years and over | 0 (0.0%) | 0 (0.0%) |
Technology Access in Landover Hills
Computing Device Access in Landover Hills
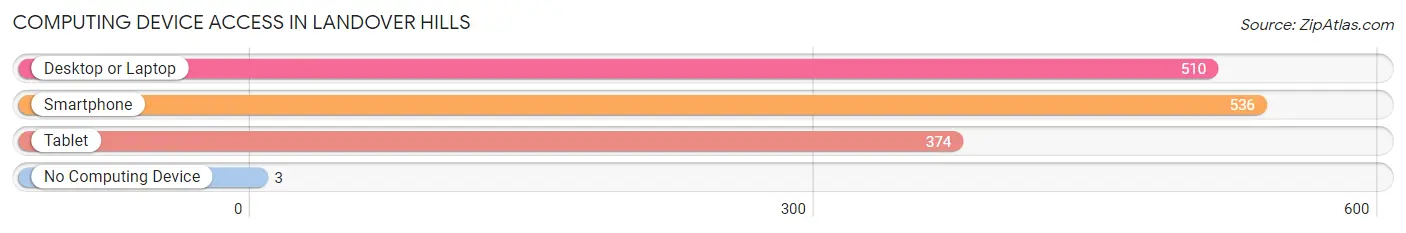
| Device Type | # Households | % Households |
| Desktop or Laptop | 510 | 87.5% |
| Smartphone | 536 | 91.9% |
| Tablet | 374 | 64.1% |
| No Computing Device | 3 | 0.5% |
| Total | 583 | 100.0% |
Internet Access in Landover Hills
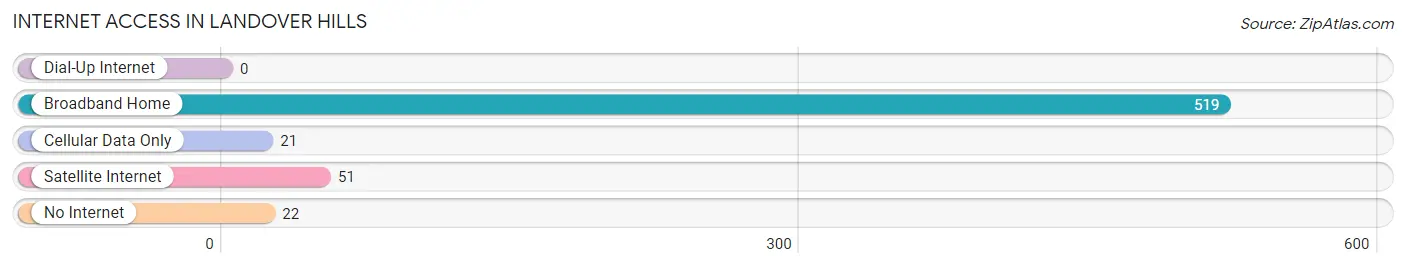
| Internet Type | # Households | % Households |
| Dial-Up Internet | 0 | 0.0% |
| Broadband Home | 519 | 89.0% |
| Cellular Data Only | 21 | 3.6% |
| Satellite Internet | 51 | 8.7% |
| No Internet | 22 | 3.8% |
| Total | 583 | 100.0% |
Landover Hills Summary
Landover Hills is a town located in Prince George’s County, Maryland, United States. It is a suburb of Washington, D.C., and is located approximately 8 miles east of the city. The population of Landover Hills was 1,687 at the 2010 census.
History
Landover Hills was founded in 1945 by a group of African-American veterans who had served in World War II. The town was incorporated in 1947 and was the first African-American-majority town in Prince George’s County. The town was named after the nearby Landover Hills Golf Course, which was owned by the veterans who founded the town.
Geography
Landover Hills is located at 38°56'45" North, 76°53'45" West (38.94583, -76.89583). According to the United States Census Bureau, the town has a total area of 0.3 square miles, all of it land.
Economy
The economy of Landover Hills is largely based on the service industry. The town is home to a variety of restaurants, retail stores, and other businesses. The town also has a number of government offices, including the Prince George’s County Police Department and the Prince George’s County Fire Department.
Demographics
As of the 2010 census, there were 1,687 people, 645 households, and 441 families residing in the town. The population density was 5,717.3 people per square mile. The racial makeup of the town was 57.3% African American, 33.2% White, 0.2% Native American, 0.7% Asian, 0.1% Pacific Islander, 5.7% from other races, and 2.9% from two or more races. Hispanic or Latino of any race were 11.2% of the population.
The median income for a household in the town was $50,000, and the median income for a family was $60,000. The per capita income for the town was $22,845. About 11.2% of families and 14.2% of the population were below the poverty line, including 18.2% of those under age 18 and 8.3% of those age 65 or over.
Common Questions
What is Per Capita Income in Landover Hills?
Per Capita income in Landover Hills is $35,791.
What is the Median Family Income in Landover Hills?
Median Family Income in Landover Hills is $105,469.
What is the Median Household income in Landover Hills?
Median Household Income in Landover Hills is $100,739.
What is Income or Wage Gap in Landover Hills?
Income or Wage Gap in Landover Hills is 4.9%.
Women in Landover Hills earn 95.1 cents for every dollar earned by a man.
What is Inequality or Gini Index in Landover Hills?
Inequality or Gini Index in Landover Hills is 0.37.
What is the Total Population of Landover Hills?
Total Population of Landover Hills is 2,118.
What is the Total Male Population of Landover Hills?
Total Male Population of Landover Hills is 1,153.
What is the Total Female Population of Landover Hills?
Total Female Population of Landover Hills is 965.
What is the Ratio of Males per 100 Females in Landover Hills?
There are 119.48 Males per 100 Females in Landover Hills.
What is the Ratio of Females per 100 Males in Landover Hills?
There are 83.69 Females per 100 Males in Landover Hills.
What is the Median Population Age in Landover Hills?
Median Population Age in Landover Hills is 36.0 Years.
What is the Average Family Size in Landover Hills
Average Family Size in Landover Hills is 4.2 People.
What is the Average Household Size in Landover Hills
Average Household Size in Landover Hills is 3.6 People.
How Large is the Labor Force in Landover Hills?
There are 1,134 People in the Labor Forcein in Landover Hills.
What is the Percentage of People in the Labor Force in Landover Hills?
70.5% of People are in the Labor Force in Landover Hills.
What is the Unemployment Rate in Landover Hills?
Unemployment Rate in Landover Hills is 11.3%.