Zip Codes with the Highest Percentage of Population Employed in Administrative & Support Services in Upper Marlboro, MD
RELATED REPORTS & OPTIONS
Administrative & Support Services
Upper Marlboro
Compare Zip Codes
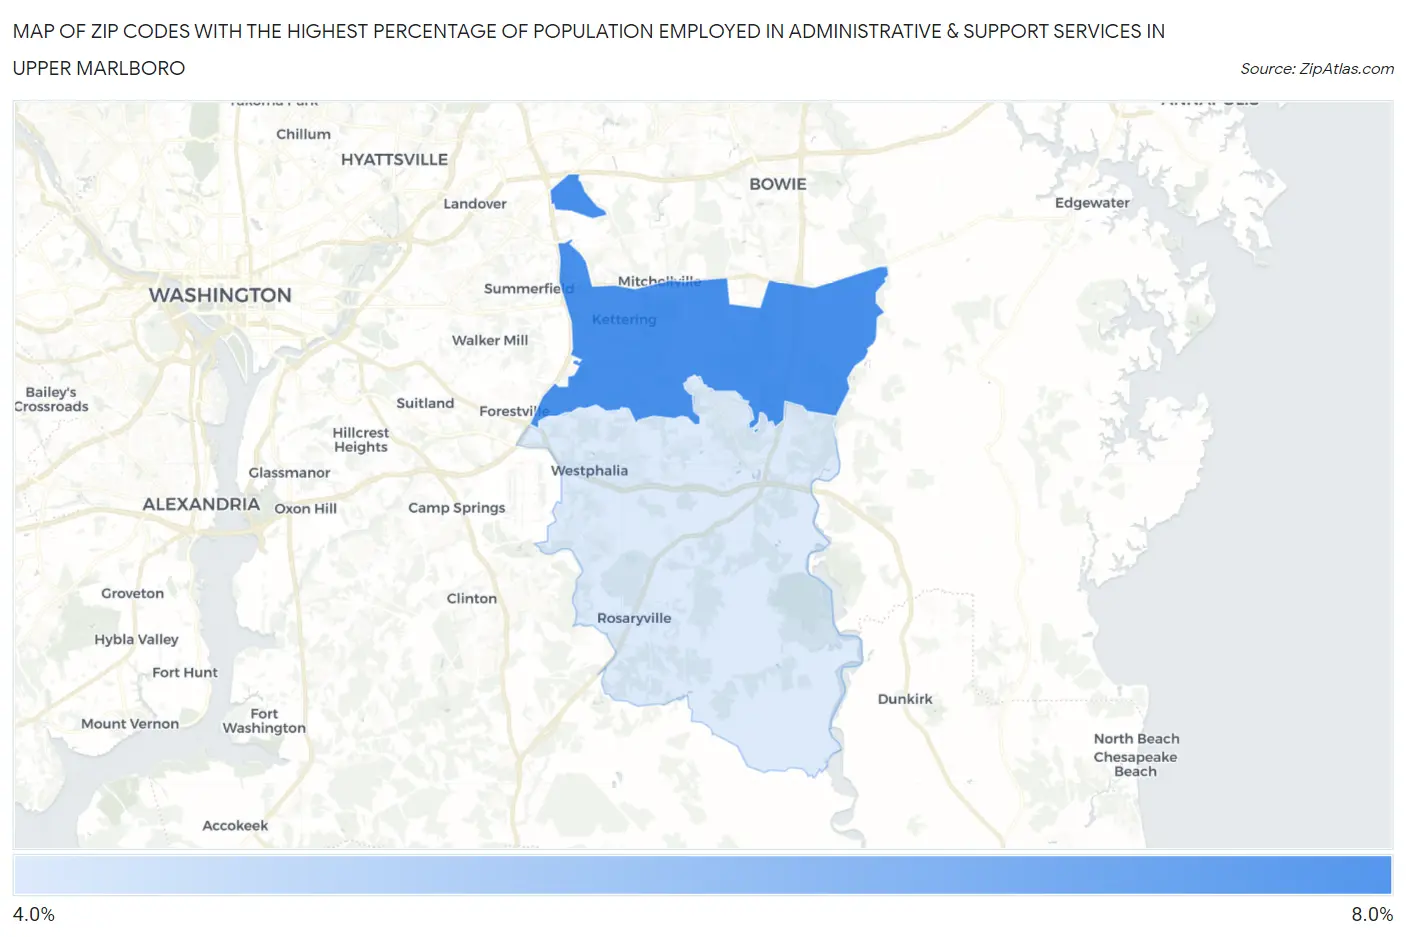
Map of Zip Codes with the Highest Percentage of Population Employed in Administrative & Support Services in Upper Marlboro
4.5%
6.4%
Zip Codes with the Highest Percentage of Population Employed in Administrative & Support Services in Upper Marlboro, MD
| Zip Code | % Employed | vs State | vs National | |
| 1. | 20774 | 6.4% | 4.2%(+2.18)#72 | 4.1%(+2.26)#4,054 |
| 2. | 20772 | 4.5% | 4.2%(+0.304)#145 | 4.1%(+0.387)#8,602 |
1
Common Questions
What are the Top Zip Codes with the Highest Percentage of Population Employed in Administrative & Support Services in Upper Marlboro, MD?
Top Zip Codes with the Highest Percentage of Population Employed in Administrative & Support Services in Upper Marlboro, MD are:
What zip code has the Highest Percentage of Population Employed in Administrative & Support Services in Upper Marlboro, MD?
20774 has the Highest Percentage of Population Employed in Administrative & Support Services in Upper Marlboro, MD with 6.4%.
What is the Percentage of Population Employed in Administrative & Support Services in Upper Marlboro, MD?
Percentage of Population Employed in Administrative & Support Services in Upper Marlboro is 6.0%.
What is the Percentage of Population Employed in Administrative & Support Services in Maryland?
Percentage of Population Employed in Administrative & Support Services in Maryland is 4.2%.
What is the Percentage of Population Employed in Administrative & Support Services in the United States?
Percentage of Population Employed in Administrative & Support Services in the United States is 4.1%.