North Brentwood, MD Map & Demographics
North Brentwood Map
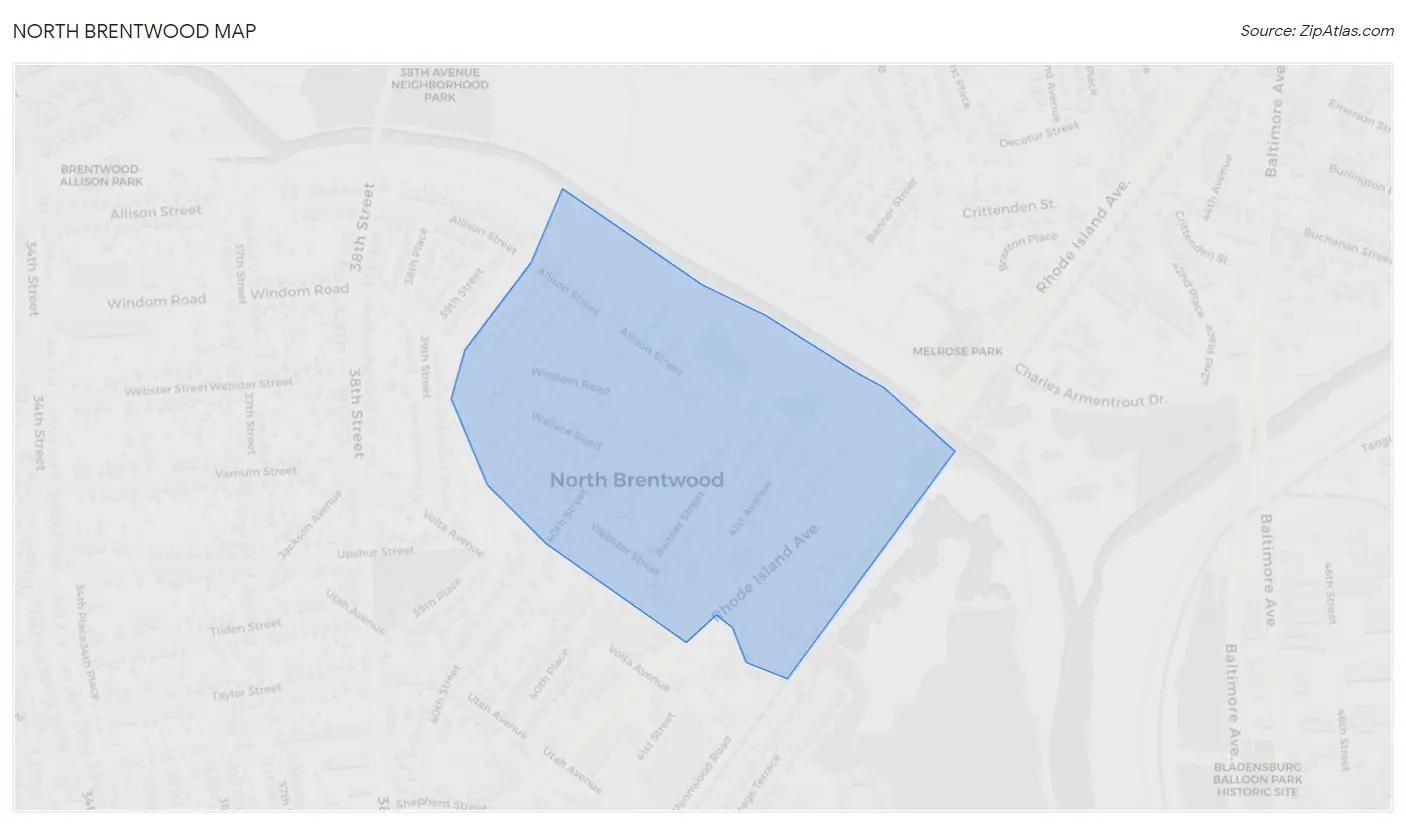
North Brentwood Overview
$35,616
PER CAPITA INCOME
$92,500
AVG FAMILY INCOME
$90,104
AVG HOUSEHOLD INCOME
39.6%
WAGE / INCOME GAP [ % ]
60.4¢/ $1
WAGE / INCOME GAP [ $ ]
0.38
INEQUALITY / GINI INDEX
766
TOTAL POPULATION
392
MALE POPULATION
374
FEMALE POPULATION
104.81
MALES / 100 FEMALES
95.41
FEMALES / 100 MALES
38.3
MEDIAN AGE
3.5
AVG FAMILY SIZE
3.1
AVG HOUSEHOLD SIZE
438
LABOR FORCE [ PEOPLE ]
73.5%
PERCENT IN LABOR FORCE
6.8%
UNEMPLOYMENT RATE
Income in North Brentwood
Income Overview in North Brentwood
Per Capita Income in North Brentwood is $35,616, while median incomes of families and households are $92,500 and $90,104 respectively.
| Characteristic | Number | Measure |
| Per Capita Income | 766 | $35,616 |
| Median Family Income | 170 | $92,500 |
| Mean Family Income | 170 | $109,475 |
| Median Household Income | 245 | $90,104 |
| Mean Household Income | 245 | $109,346 |
| Income Deficit | 170 | $0 |
| Wage / Income Gap (%) | 766 | 39.63% |
| Wage / Income Gap ($) | 766 | 60.37¢ per $1 |
| Gini / Inequality Index | 766 | 0.38 |
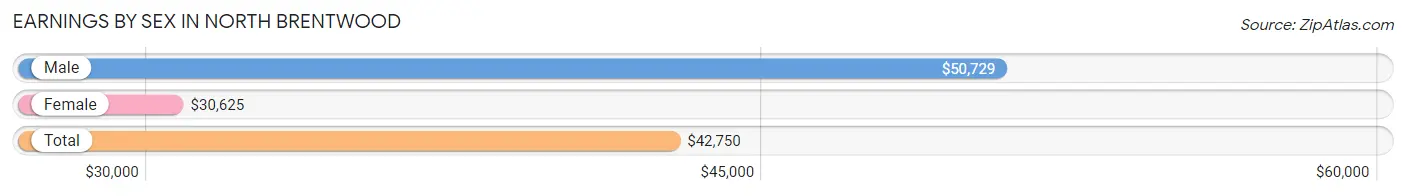
Earnings by Sex in North Brentwood
Average Earnings in North Brentwood are $42,750, $50,729 for men and $30,625 for women, a difference of 39.6%.
| Sex | Number | Average Earnings |
| Male | 229 (52.3%) | $50,729 |
| Female | 209 (47.7%) | $30,625 |
| Total | 438 (100.0%) | $42,750 |
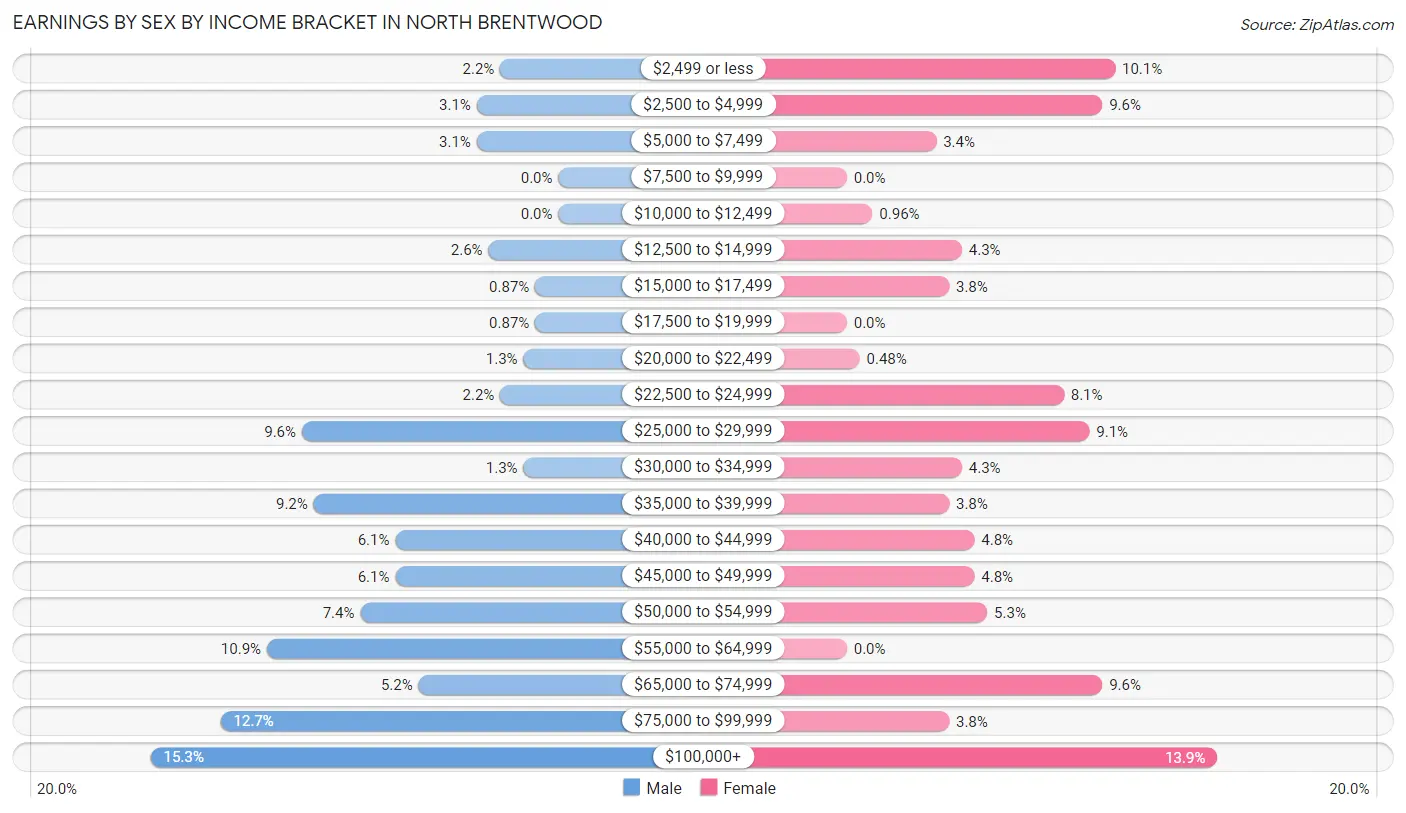
Earnings by Sex by Income Bracket in North Brentwood
The most common earnings brackets in North Brentwood are $100,000+ for men (35 | 15.3%) and $100,000+ for women (29 | 13.9%).
| Income | Male | Female |
| $2,499 or less | 5 (2.2%) | 21 (10.1%) |
| $2,500 to $4,999 | 7 (3.1%) | 20 (9.6%) |
| $5,000 to $7,499 | 7 (3.1%) | 7 (3.4%) |
| $7,500 to $9,999 | 0 (0.0%) | 0 (0.0%) |
| $10,000 to $12,499 | 0 (0.0%) | 2 (1.0%) |
| $12,500 to $14,999 | 6 (2.6%) | 9 (4.3%) |
| $15,000 to $17,499 | 2 (0.9%) | 8 (3.8%) |
| $17,500 to $19,999 | 2 (0.9%) | 0 (0.0%) |
| $20,000 to $22,499 | 3 (1.3%) | 1 (0.5%) |
| $22,500 to $24,999 | 5 (2.2%) | 17 (8.1%) |
| $25,000 to $29,999 | 22 (9.6%) | 19 (9.1%) |
| $30,000 to $34,999 | 3 (1.3%) | 9 (4.3%) |
| $35,000 to $39,999 | 21 (9.2%) | 8 (3.8%) |
| $40,000 to $44,999 | 14 (6.1%) | 10 (4.8%) |
| $45,000 to $49,999 | 14 (6.1%) | 10 (4.8%) |
| $50,000 to $54,999 | 17 (7.4%) | 11 (5.3%) |
| $55,000 to $64,999 | 25 (10.9%) | 0 (0.0%) |
| $65,000 to $74,999 | 12 (5.2%) | 20 (9.6%) |
| $75,000 to $99,999 | 29 (12.7%) | 8 (3.8%) |
| $100,000+ | 35 (15.3%) | 29 (13.9%) |
| Total | 229 (100.0%) | 209 (100.0%) |
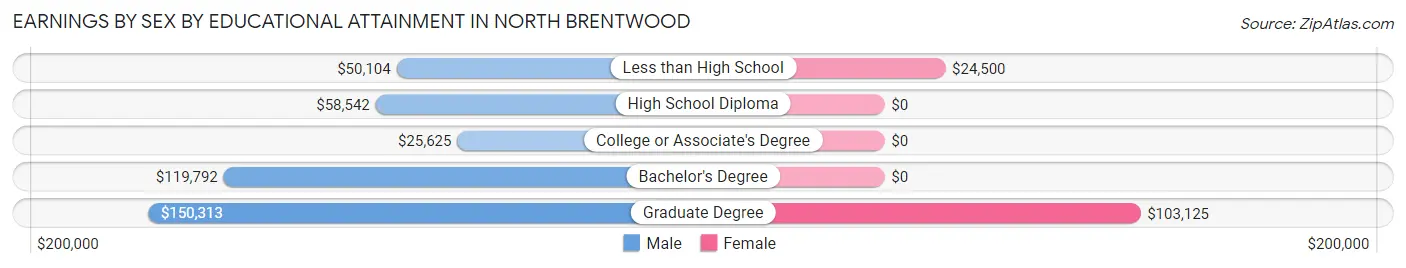
Earnings by Sex by Educational Attainment in North Brentwood
Average earnings in North Brentwood are $51,458 for men and $37,344 for women, a difference of 27.4%. Men with an educational attainment of graduate degree enjoy the highest average annual earnings of $150,313, while those with college or associate's degree education earn the least with $25,625. Women with an educational attainment of graduate degree earn the most with the average annual earnings of $103,125, while those with less than high school education have the smallest earnings of $24,500.
| Educational Attainment | Male Income | Female Income |
| Less than High School | $50,104 | $24,500 |
| High School Diploma | $58,542 | $0 |
| College or Associate's Degree | $25,625 | $0 |
| Bachelor's Degree | $119,792 | $0 |
| Graduate Degree | $150,313 | $103,125 |
| Total | $51,458 | $37,344 |
Family Income in North Brentwood
Family Income Brackets in North Brentwood
According to the North Brentwood family income data, there are 39 families falling into the $100,000 to $149,999 income range, which is the most common income bracket and makes up 22.9% of all families.
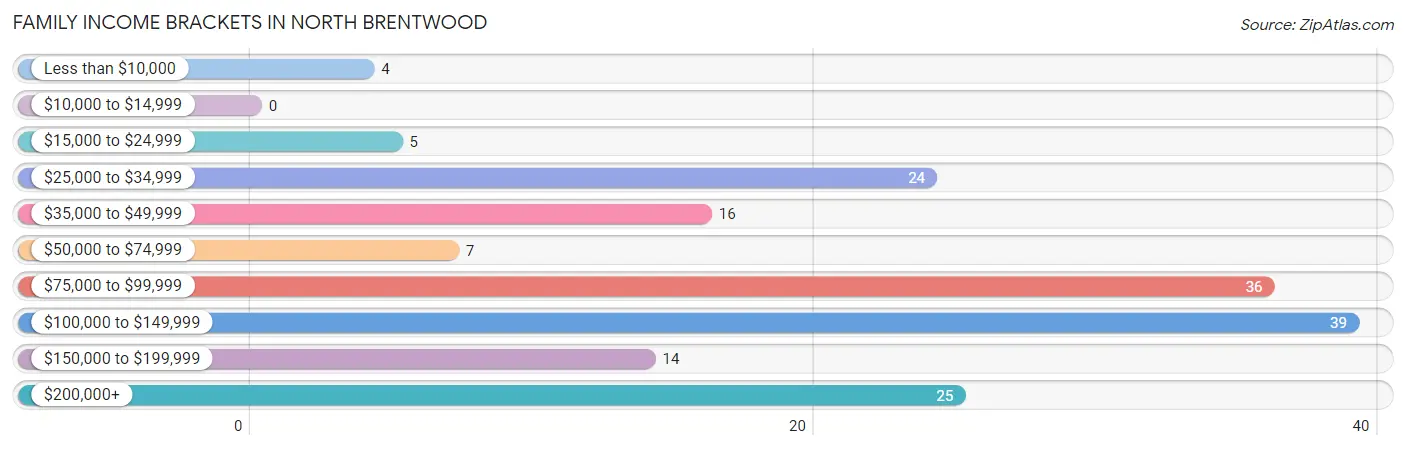
| Income Bracket | # Families | % Families |
| Less than $10,000 | 4 | 2.4% |
| $10,000 to $14,999 | 0 | 0.0% |
| $15,000 to $24,999 | 5 | 2.9% |
| $25,000 to $34,999 | 24 | 14.1% |
| $35,000 to $49,999 | 16 | 9.4% |
| $50,000 to $74,999 | 7 | 4.1% |
| $75,000 to $99,999 | 36 | 21.2% |
| $100,000 to $149,999 | 39 | 22.9% |
| $150,000 to $199,999 | 14 | 8.2% |
| $200,000+ | 25 | 14.7% |
Family Income by Famaliy Size in North Brentwood
5-person families (27 | 15.9%) account for the highest median family income in North Brentwood with $117,604 per family, while 2-person families (74 | 43.5%) have the highest median income of $44,062 per family member.
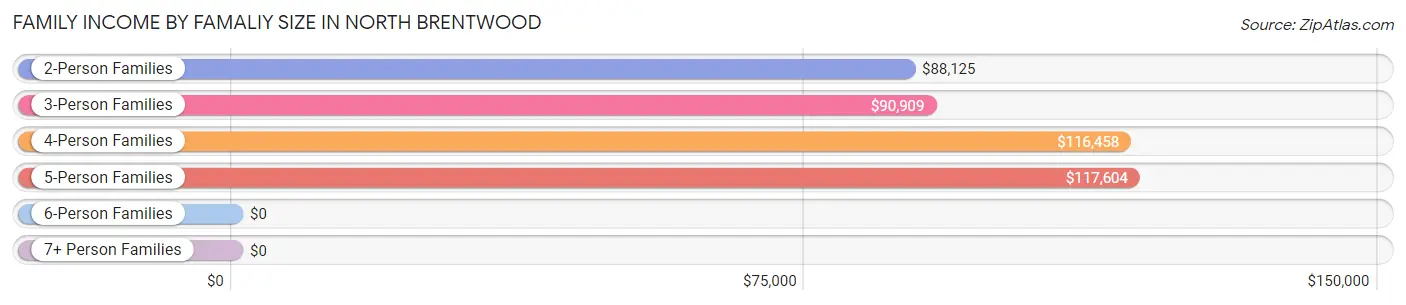
| Income Bracket | # Families | Median Income |
| 2-Person Families | 74 (43.5%) | $88,125 |
| 3-Person Families | 34 (20.0%) | $90,909 |
| 4-Person Families | 17 (10.0%) | $116,458 |
| 5-Person Families | 27 (15.9%) | $117,604 |
| 6-Person Families | 8 (4.7%) | $0 |
| 7+ Person Families | 10 (5.9%) | $0 |
| Total | 170 (100.0%) | $92,500 |
Family Income by Number of Earners in North Brentwood
The median family income in North Brentwood is $92,500, with families comprising 3+ earners (25) having the highest median family income of $196,563, while families with 1 earner (56) have the lowest median family income of $34,722, accounting for 14.7% and 32.9% of families, respectively.
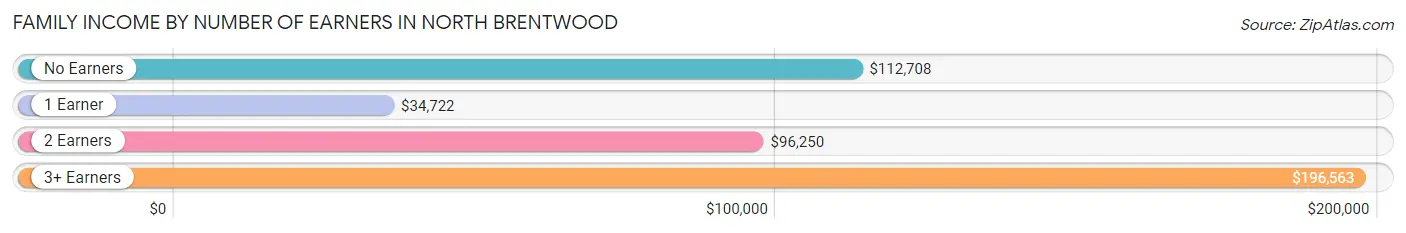
| Number of Earners | # Families | Median Income |
| No Earners | 11 (6.5%) | $112,708 |
| 1 Earner | 56 (32.9%) | $34,722 |
| 2 Earners | 78 (45.9%) | $96,250 |
| 3+ Earners | 25 (14.7%) | $196,563 |
| Total | 170 (100.0%) | $92,500 |
Household Income in North Brentwood
Household Income Brackets in North Brentwood
With 49 households falling in the category, the $100,000 to $149,999 income range is the most frequent in North Brentwood, accounting for 20.0% of all households.
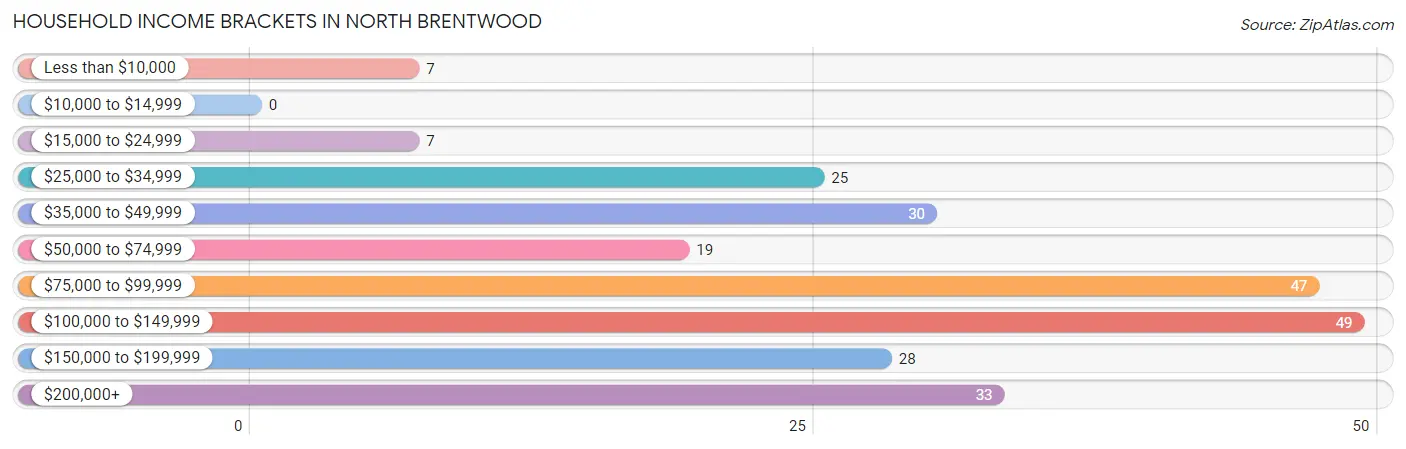
| Income Bracket | # Households | % Households |
| Less than $10,000 | 7 | 2.9% |
| $10,000 to $14,999 | 0 | 0.0% |
| $15,000 to $24,999 | 7 | 2.9% |
| $25,000 to $34,999 | 25 | 10.2% |
| $35,000 to $49,999 | 30 | 12.2% |
| $50,000 to $74,999 | 19 | 7.8% |
| $75,000 to $99,999 | 47 | 19.2% |
| $100,000 to $149,999 | 49 | 20.0% |
| $150,000 to $199,999 | 28 | 11.4% |
| $200,000+ | 33 | 13.5% |
Household Income by Householder Age in North Brentwood
The median household income in North Brentwood is $90,104, with the highest median household income of $114,375 found in the 45 to 64 years age bracket for the primary householder. A total of 115 households (46.9%) fall into this category. Meanwhile, the 15 to 24 years age bracket for the primary householder has the lowest median household income of $0, with 5 households (2.0%) in this group.
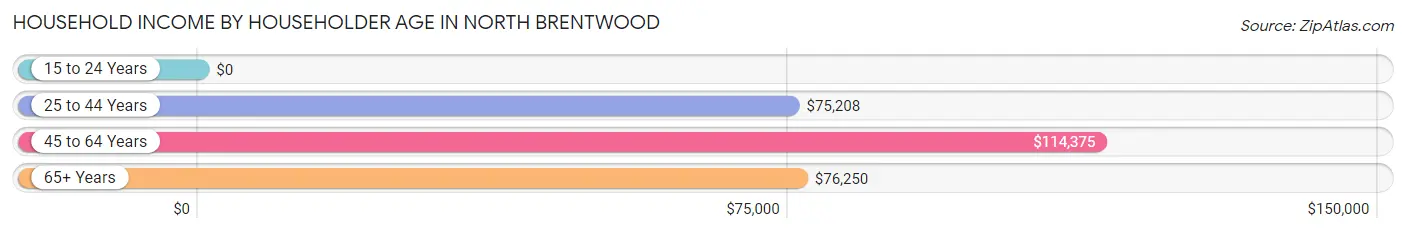
| Income Bracket | # Households | Median Income |
| 15 to 24 Years | 5 (2.0%) | $0 |
| 25 to 44 Years | 67 (27.4%) | $75,208 |
| 45 to 64 Years | 115 (46.9%) | $114,375 |
| 65+ Years | 58 (23.7%) | $76,250 |
| Total | 245 (100.0%) | $90,104 |
Poverty in North Brentwood
Income Below Poverty by Sex and Age in North Brentwood
With 9.5% poverty level for males and 7.0% for females among the residents of North Brentwood, 65 to 74 year old males and 6 to 11 year old females are the most vulnerable to poverty, with 17 males (35.4%) and 6 females (42.9%) in their respective age groups living below the poverty level.
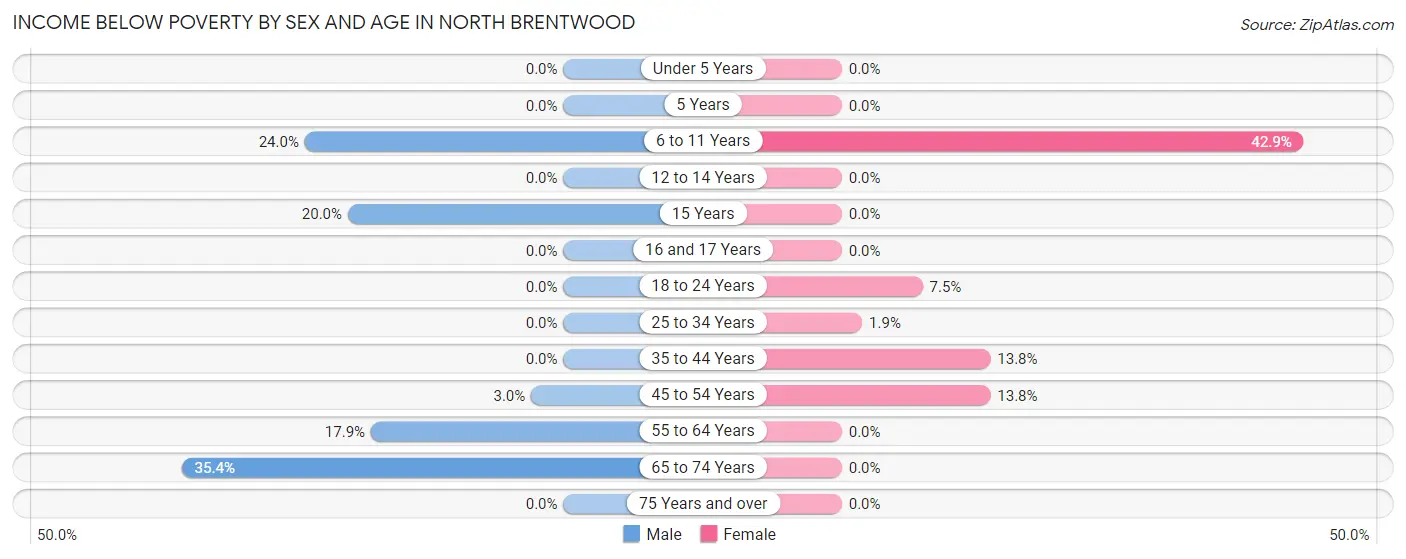
| Age Bracket | Male | Female |
| Under 5 Years | 0 (0.0%) | 0 (0.0%) |
| 5 Years | 0 (0.0%) | 0 (0.0%) |
| 6 to 11 Years | 6 (24.0%) | 6 (42.9%) |
| 12 to 14 Years | 0 (0.0%) | 0 (0.0%) |
| 15 Years | 2 (20.0%) | 0 (0.0%) |
| 16 and 17 Years | 0 (0.0%) | 0 (0.0%) |
| 18 to 24 Years | 0 (0.0%) | 3 (7.5%) |
| 25 to 34 Years | 0 (0.0%) | 1 (1.9%) |
| 35 to 44 Years | 0 (0.0%) | 8 (13.8%) |
| 45 to 54 Years | 2 (3.0%) | 8 (13.8%) |
| 55 to 64 Years | 10 (17.9%) | 0 (0.0%) |
| 65 to 74 Years | 17 (35.4%) | 0 (0.0%) |
| 75 Years and over | 0 (0.0%) | 0 (0.0%) |
| Total | 37 (9.5%) | 26 (7.0%) |
Income Above Poverty by Sex and Age in North Brentwood
According to the poverty statistics in North Brentwood, males aged under 5 years and females aged under 5 years are the age groups that are most secure financially, with 100.0% of males and 100.0% of females in these age groups living above the poverty line.
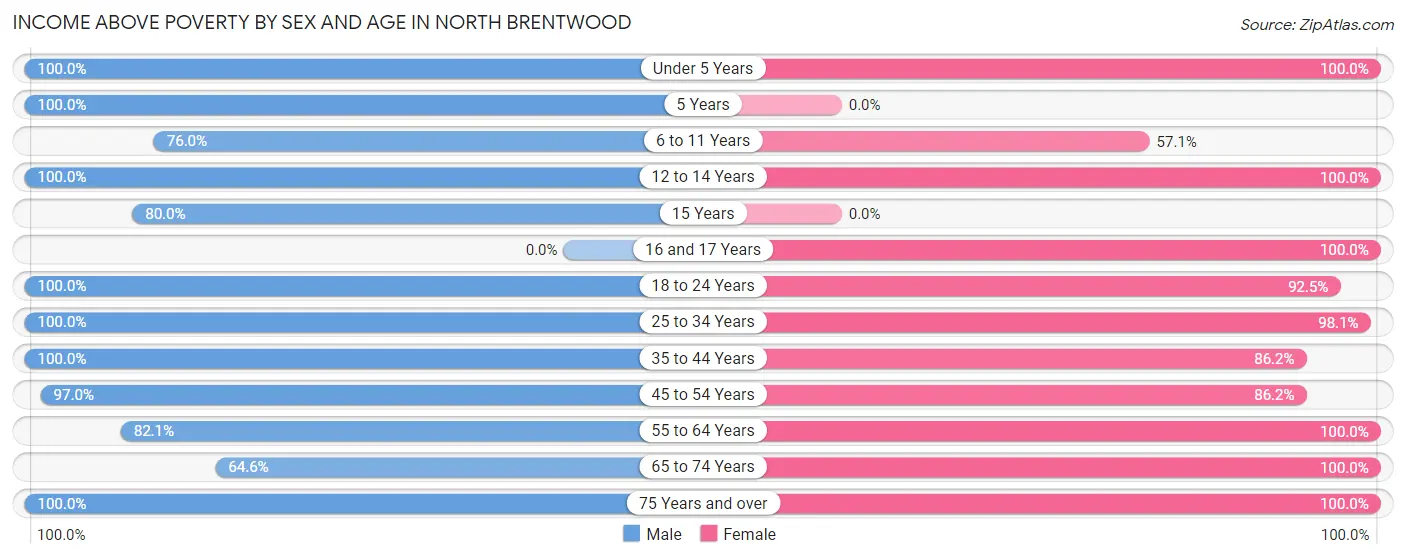
| Age Bracket | Male | Female |
| Under 5 Years | 22 (100.0%) | 50 (100.0%) |
| 5 Years | 9 (100.0%) | 0 (0.0%) |
| 6 to 11 Years | 19 (76.0%) | 8 (57.1%) |
| 12 to 14 Years | 25 (100.0%) | 13 (100.0%) |
| 15 Years | 8 (80.0%) | 0 (0.0%) |
| 16 and 17 Years | 0 (0.0%) | 10 (100.0%) |
| 18 to 24 Years | 33 (100.0%) | 37 (92.5%) |
| 25 to 34 Years | 35 (100.0%) | 52 (98.1%) |
| 35 to 44 Years | 48 (100.0%) | 50 (86.2%) |
| 45 to 54 Years | 65 (97.0%) | 50 (86.2%) |
| 55 to 64 Years | 46 (82.1%) | 34 (100.0%) |
| 65 to 74 Years | 31 (64.6%) | 27 (100.0%) |
| 75 Years and over | 12 (100.0%) | 17 (100.0%) |
| Total | 353 (90.5%) | 348 (93.0%) |
Income Below Poverty Among Married-Couple Families in North Brentwood
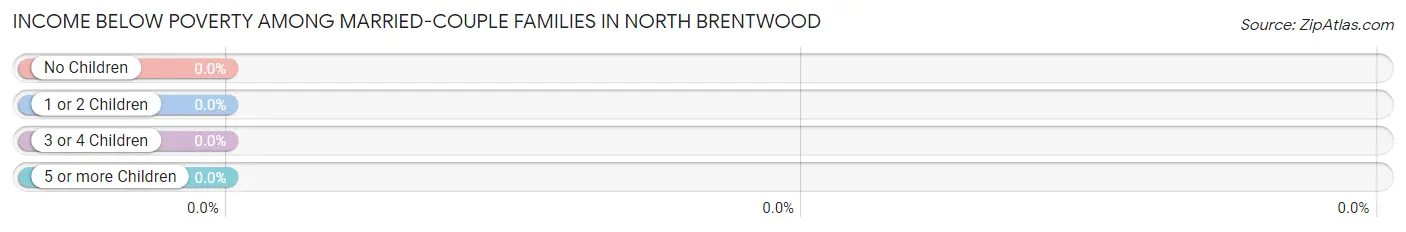
| Children | Above Poverty | Below Poverty |
| No Children | 36 (100.0%) | 0 (0.0%) |
| 1 or 2 Children | 23 (100.0%) | 0 (0.0%) |
| 3 or 4 Children | 11 (100.0%) | 0 (0.0%) |
| 5 or more Children | 0 (0.0%) | 0 (0.0%) |
| Total | 70 (100.0%) | 0 (0.0%) |
Income Below Poverty Among Single-Parent Households in North Brentwood
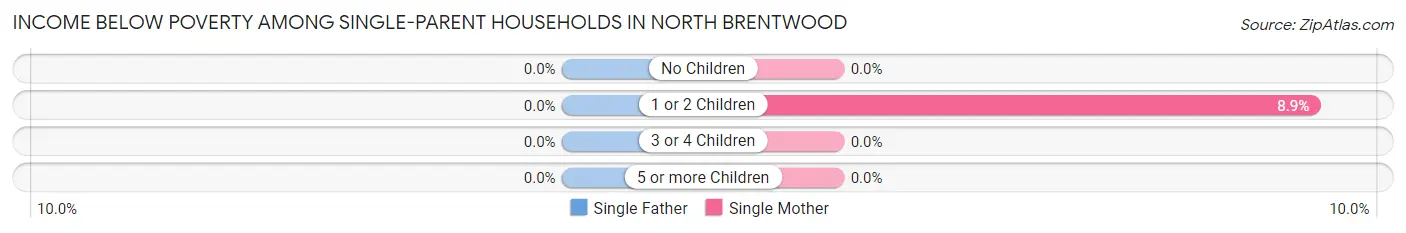
| Children | Single Father | Single Mother |
| No Children | 0 (0.0%) | 0 (0.0%) |
| 1 or 2 Children | 0 (0.0%) | 4 (8.9%) |
| 3 or 4 Children | 0 (0.0%) | 0 (0.0%) |
| 5 or more Children | 0 (0.0%) | 0 (0.0%) |
| Total | 0 (0.0%) | 4 (5.6%) |
Income Below Poverty Among Married-Couple vs Single-Parent Households in North Brentwood
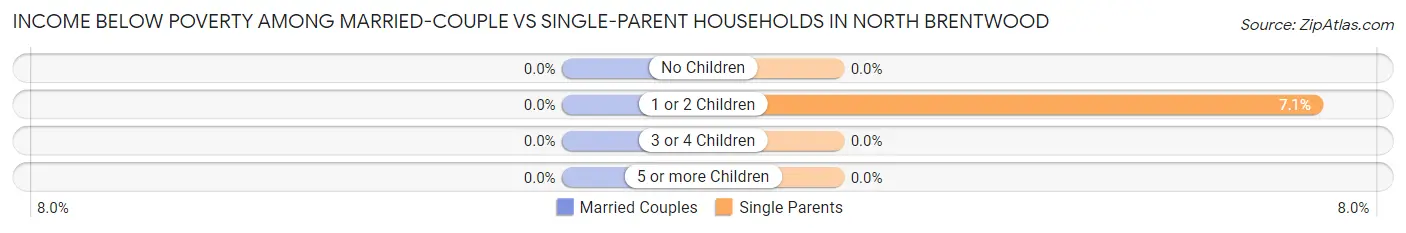
| Children | Married-Couple Families | Single-Parent Households |
| No Children | 0 (0.0%) | 0 (0.0%) |
| 1 or 2 Children | 0 (0.0%) | 4 (7.1%) |
| 3 or 4 Children | 0 (0.0%) | 0 (0.0%) |
| 5 or more Children | 0 (0.0%) | 0 (0.0%) |
| Total | 0 (0.0%) | 4 (4.0%) |
Race in North Brentwood
The most populous races in North Brentwood are Black / African American (371 | 48.4%), Hispanic or Latino (331 | 43.2%), and Some other Race (291 | 38.0%).
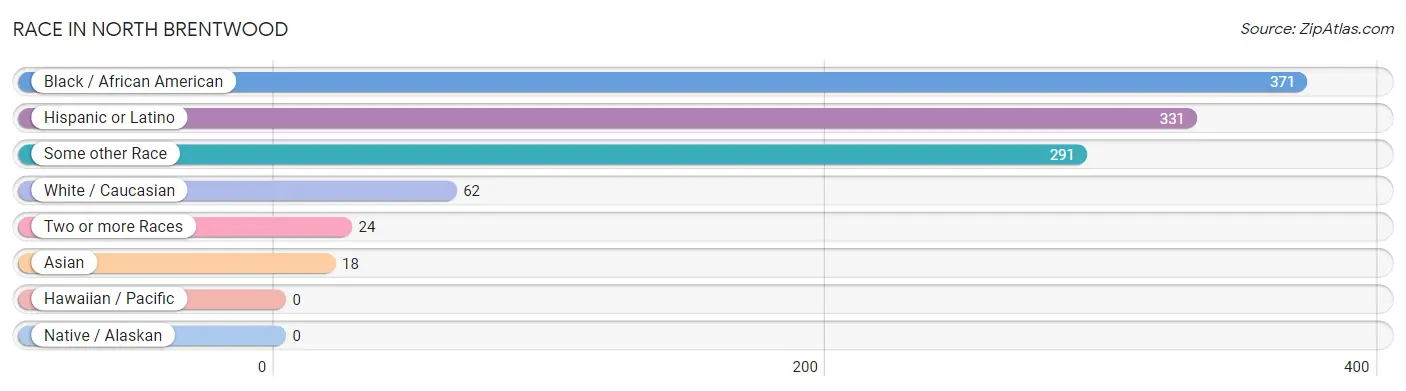
| Race | # Population | % Population |
| Asian | 18 | 2.4% |
| Black / African American | 371 | 48.4% |
| Hawaiian / Pacific | 0 | 0.0% |
| Hispanic or Latino | 331 | 43.2% |
| Native / Alaskan | 0 | 0.0% |
| White / Caucasian | 62 | 8.1% |
| Two or more Races | 24 | 3.1% |
| Some other Race | 291 | 38.0% |
| Total | 766 | 100.0% |
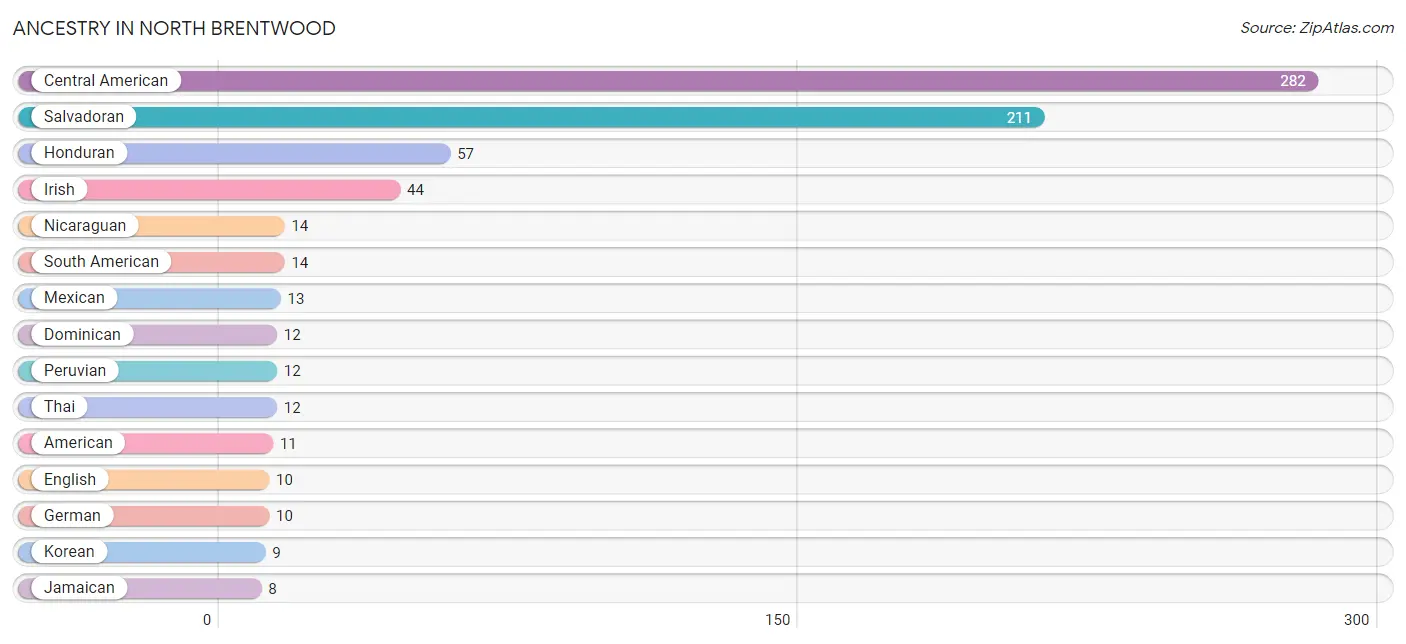
Ancestry in North Brentwood
The most populous ancestries reported in North Brentwood are Central American (282 | 36.8%), Salvadoran (211 | 27.6%), Honduran (57 | 7.4%), Irish (44 | 5.7%), and Nicaraguan (14 | 1.8%), together accounting for 79.4% of all North Brentwood residents.
| Ancestry | # Population | % Population |
| African | 2 | 0.3% |
| American | 11 | 1.4% |
| Arab | 2 | 0.3% |
| Bhutanese | 2 | 0.3% |
| British | 4 | 0.5% |
| Central American | 282 | 36.8% |
| Central American Indian | 2 | 0.3% |
| Colombian | 2 | 0.3% |
| Dominican | 12 | 1.6% |
| English | 10 | 1.3% |
| Ethiopian | 2 | 0.3% |
| European | 3 | 0.4% |
| French | 6 | 0.8% |
| French Canadian | 2 | 0.3% |
| German | 10 | 1.3% |
| Guyanese | 3 | 0.4% |
| Honduran | 57 | 7.4% |
| Indian (Asian) | 2 | 0.3% |
| Irish | 44 | 5.7% |
| Italian | 1 | 0.1% |
| Jamaican | 8 | 1.0% |
| Korean | 9 | 1.2% |
| Lebanese | 2 | 0.3% |
| Mexican | 13 | 1.7% |
| Nicaraguan | 14 | 1.8% |
| Nigerian | 4 | 0.5% |
| Peruvian | 12 | 1.6% |
| Puerto Rican | 8 | 1.0% |
| Salvadoran | 211 | 27.6% |
| Scotch-Irish | 6 | 0.8% |
| Scottish | 2 | 0.3% |
| South American | 14 | 1.8% |
| Spanish | 2 | 0.3% |
| Subsaharan African | 8 | 1.0% |
| Thai | 12 | 1.6% |
| Trinidadian and Tobagonian | 2 | 0.3% | View All 36 Rows |
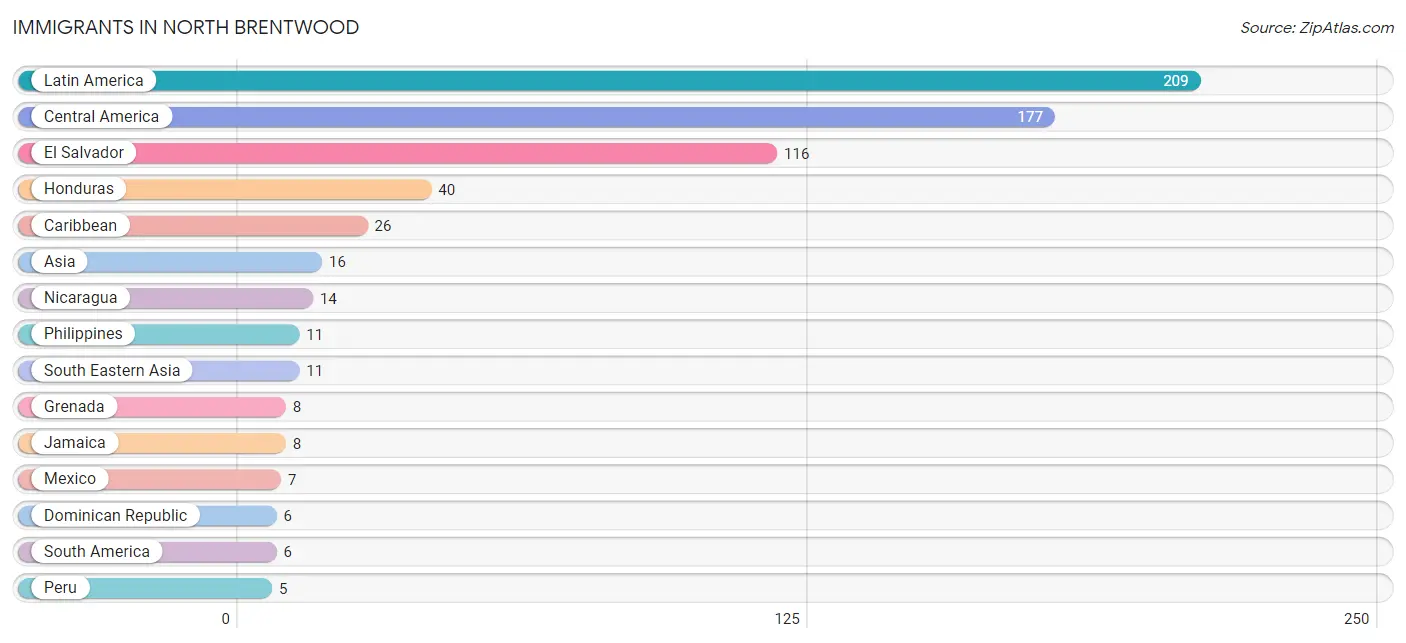
Immigrants in North Brentwood
The most numerous immigrant groups reported in North Brentwood came from Latin America (209 | 27.3%), Central America (177 | 23.1%), El Salvador (116 | 15.1%), Honduras (40 | 5.2%), and Caribbean (26 | 3.4%), together accounting for 74.1% of all North Brentwood residents.
| Immigration Origin | # Population | % Population |
| Africa | 4 | 0.5% |
| Asia | 16 | 2.1% |
| Caribbean | 26 | 3.4% |
| Central America | 177 | 23.1% |
| China | 2 | 0.3% |
| Dominican Republic | 6 | 0.8% |
| Eastern Africa | 2 | 0.3% |
| Eastern Asia | 2 | 0.3% |
| El Salvador | 116 | 15.1% |
| Ethiopia | 2 | 0.3% |
| Europe | 3 | 0.4% |
| Germany | 3 | 0.4% |
| Grenada | 8 | 1.0% |
| Guyana | 1 | 0.1% |
| Honduras | 40 | 5.2% |
| Jamaica | 8 | 1.0% |
| Latin America | 209 | 27.3% |
| Lebanon | 2 | 0.3% |
| Mexico | 7 | 0.9% |
| Nicaragua | 14 | 1.8% |
| Nigeria | 2 | 0.3% |
| Pakistan | 1 | 0.1% |
| Peru | 5 | 0.6% |
| Philippines | 11 | 1.4% |
| South America | 6 | 0.8% |
| South Central Asia | 1 | 0.1% |
| South Eastern Asia | 11 | 1.4% |
| Trinidad and Tobago | 4 | 0.5% |
| Western Africa | 2 | 0.3% |
| Western Asia | 2 | 0.3% |
| Western Europe | 3 | 0.4% | View All 31 Rows |
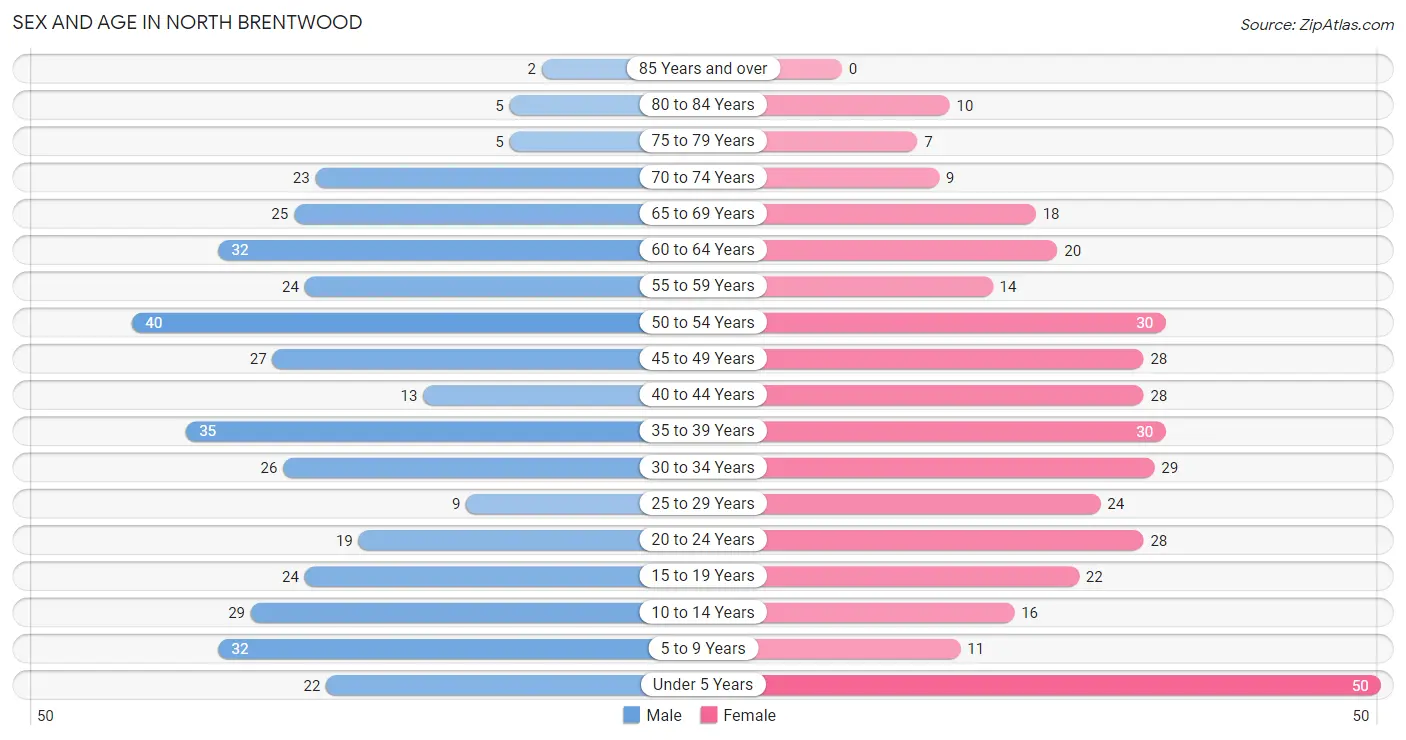
Sex and Age in North Brentwood
Sex and Age in North Brentwood
The most populous age groups in North Brentwood are 50 to 54 Years (40 | 10.2%) for men and Under 5 Years (50 | 13.4%) for women.
| Age Bracket | Male | Female |
| Under 5 Years | 22 (5.6%) | 50 (13.4%) |
| 5 to 9 Years | 32 (8.2%) | 11 (2.9%) |
| 10 to 14 Years | 29 (7.4%) | 16 (4.3%) |
| 15 to 19 Years | 24 (6.1%) | 22 (5.9%) |
| 20 to 24 Years | 19 (4.9%) | 28 (7.5%) |
| 25 to 29 Years | 9 (2.3%) | 24 (6.4%) |
| 30 to 34 Years | 26 (6.6%) | 29 (7.7%) |
| 35 to 39 Years | 35 (8.9%) | 30 (8.0%) |
| 40 to 44 Years | 13 (3.3%) | 28 (7.5%) |
| 45 to 49 Years | 27 (6.9%) | 28 (7.5%) |
| 50 to 54 Years | 40 (10.2%) | 30 (8.0%) |
| 55 to 59 Years | 24 (6.1%) | 14 (3.7%) |
| 60 to 64 Years | 32 (8.2%) | 20 (5.3%) |
| 65 to 69 Years | 25 (6.4%) | 18 (4.8%) |
| 70 to 74 Years | 23 (5.9%) | 9 (2.4%) |
| 75 to 79 Years | 5 (1.3%) | 7 (1.9%) |
| 80 to 84 Years | 5 (1.3%) | 10 (2.7%) |
| 85 Years and over | 2 (0.5%) | 0 (0.0%) |
| Total | 392 (100.0%) | 374 (100.0%) |
Families and Households in North Brentwood
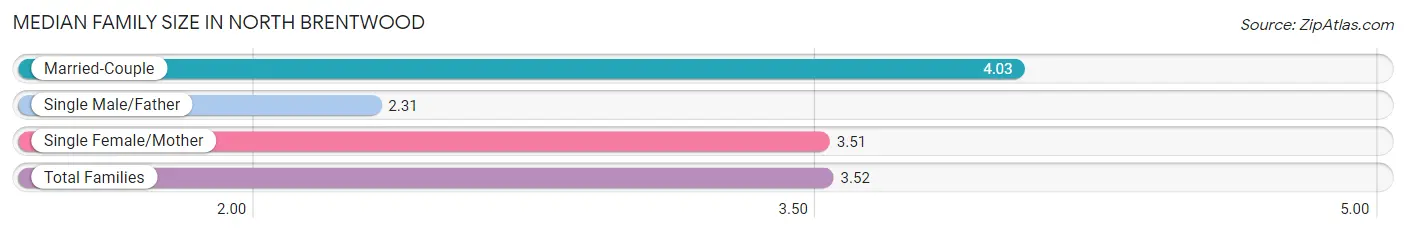
Median Family Size in North Brentwood
The median family size in North Brentwood is 3.52 persons per family, with married-couple families (70 | 41.2%) accounting for the largest median family size of 4.03 persons per family. On the other hand, single male/father families (29 | 17.1%) represent the smallest median family size with 2.31 persons per family.
| Family Type | # Families | Family Size |
| Married-Couple | 70 (41.2%) | 4.03 |
| Single Male/Father | 29 (17.1%) | 2.31 |
| Single Female/Mother | 71 (41.8%) | 3.51 |
| Total Families | 170 (100.0%) | 3.52 |
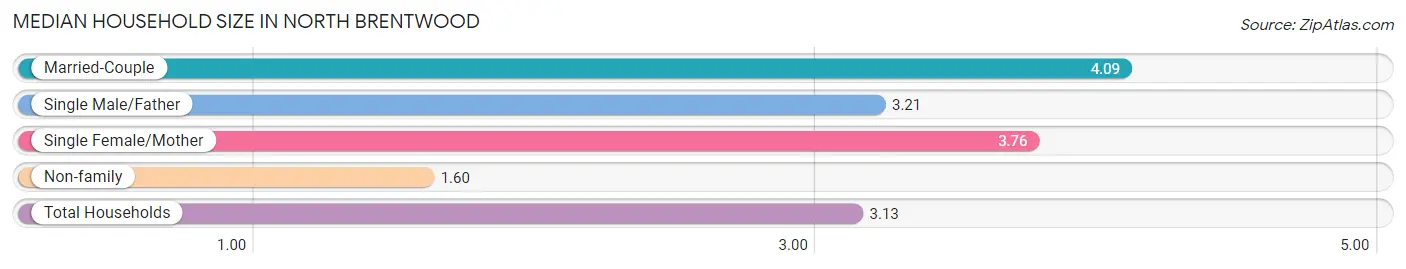
Median Household Size in North Brentwood
The median household size in North Brentwood is 3.13 persons per household, with married-couple households (70 | 28.6%) accounting for the largest median household size of 4.09 persons per household. non-family households (75 | 30.6%) represent the smallest median household size with 1.60 persons per household.
| Household Type | # Households | Household Size |
| Married-Couple | 70 (28.6%) | 4.09 |
| Single Male/Father | 29 (11.8%) | 3.21 |
| Single Female/Mother | 71 (29.0%) | 3.76 |
| Non-family | 75 (30.6%) | 1.60 |
| Total Households | 245 (100.0%) | 3.13 |
Household Size by Marriage Status in North Brentwood
Out of a total of 245 households in North Brentwood, 170 (69.4%) are family households, while 75 (30.6%) are nonfamily households. The most numerous type of family households are 3-person households, comprising 48, and the most common type of nonfamily households are 1-person households, comprising 54.
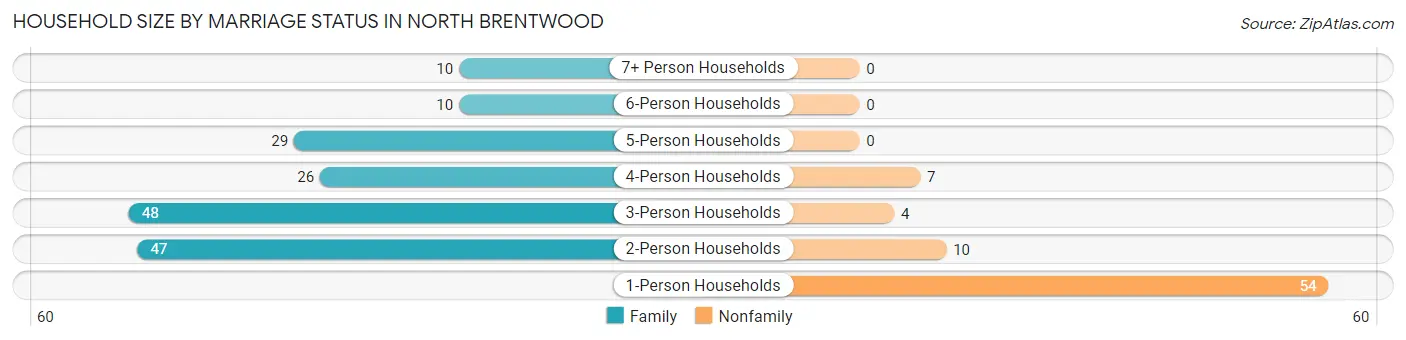
| Household Size | Family Households | Nonfamily Households |
| 1-Person Households | - | 54 (22.0%) |
| 2-Person Households | 47 (19.2%) | 10 (4.1%) |
| 3-Person Households | 48 (19.6%) | 4 (1.6%) |
| 4-Person Households | 26 (10.6%) | 7 (2.9%) |
| 5-Person Households | 29 (11.8%) | 0 (0.0%) |
| 6-Person Households | 10 (4.1%) | 0 (0.0%) |
| 7+ Person Households | 10 (4.1%) | 0 (0.0%) |
| Total | 170 (69.4%) | 75 (30.6%) |
Female Fertility in North Brentwood
Fertility by Age in North Brentwood
Average fertility rate in North Brentwood is 154.0 births per 1,000 women. Women in the age bracket of 20 to 34 years have the highest fertility rate with 247.0 births per 1,000 women. Women in the age bracket of 20 to 34 years acount for 64.5% of all women with births.
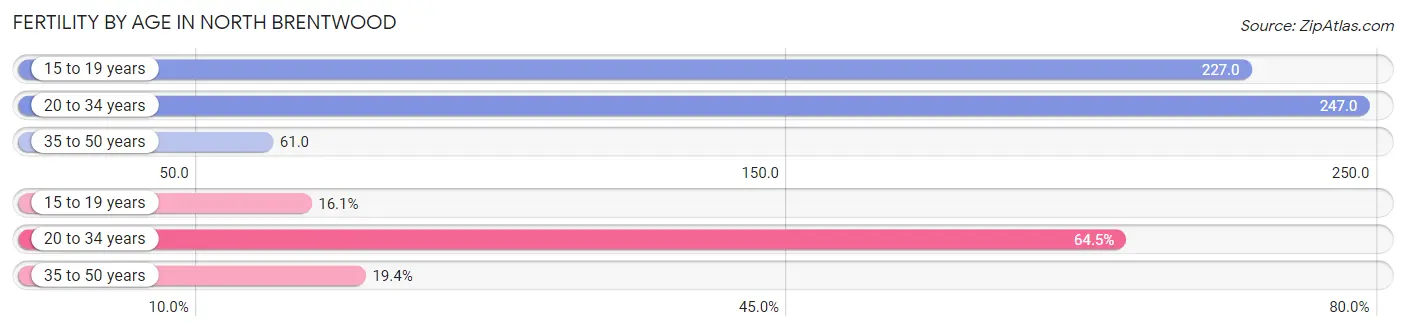
| Age Bracket | Women with Births | Births / 1,000 Women |
| 15 to 19 years | 5 (16.1%) | 227.0 |
| 20 to 34 years | 20 (64.5%) | 247.0 |
| 35 to 50 years | 6 (19.4%) | 61.0 |
| Total | 31 (100.0%) | 154.0 |
Fertility by Age by Marriage Status in North Brentwood
80.6% of women with births (31) in North Brentwood are married. The highest percentage of unmarried women with births falls into 15 to 19 years age bracket with 100.0% of them unmarried at the time of birth, while the lowest percentage of unmarried women with births belong to 20 to 34 years age bracket with 0.0% of them unmarried.
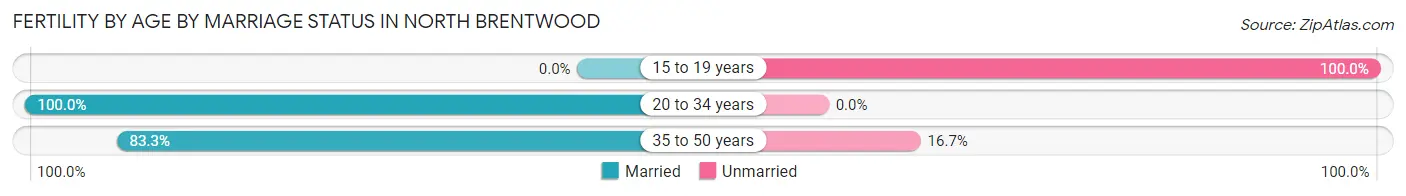
| Age Bracket | Married | Unmarried |
| 15 to 19 years | 0 (0.0%) | 5 (100.0%) |
| 20 to 34 years | 20 (100.0%) | 0 (0.0%) |
| 35 to 50 years | 5 (83.3%) | 1 (16.7%) |
| Total | 25 (80.6%) | 6 (19.4%) |
Fertility by Education in North Brentwood
Average fertility rate in North Brentwood is 154.0 births per 1,000 women. Women with the education attainment of college or associate's degree have the highest fertility rate of 405.0 births per 1,000 women, while women with the education attainment of graduate degree have the lowest fertility at 36.0 births per 1,000 women. Women with the education attainment of college or associate's degree represent 54.8% of all women with births.
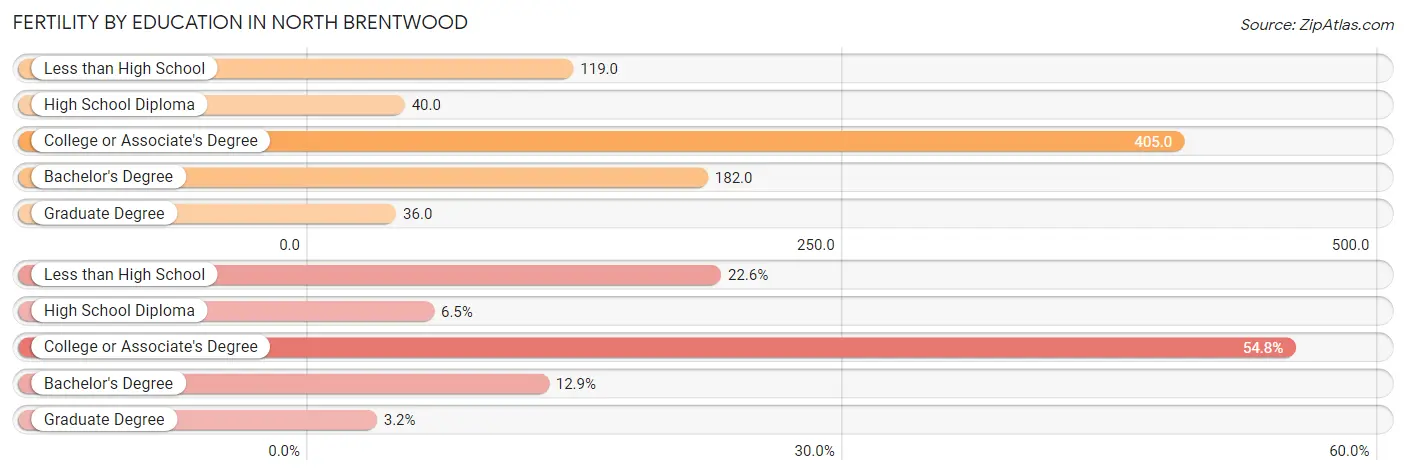
| Educational Attainment | Women with Births | Births / 1,000 Women |
| Less than High School | 7 (22.6%) | 119.0 |
| High School Diploma | 2 (6.5%) | 40.0 |
| College or Associate's Degree | 17 (54.8%) | 405.0 |
| Bachelor's Degree | 4 (12.9%) | 182.0 |
| Graduate Degree | 1 (3.2%) | 36.0 |
| Total | 31 (100.0%) | 154.0 |
Fertility by Education by Marriage Status in North Brentwood
19.4% of women with births in North Brentwood are unmarried. Women with the educational attainment of high school diploma are most likely to be married with 100.0% of them married at childbirth, while women with the educational attainment of less than high school are least likely to be married with 71.4% of them unmarried at childbirth.
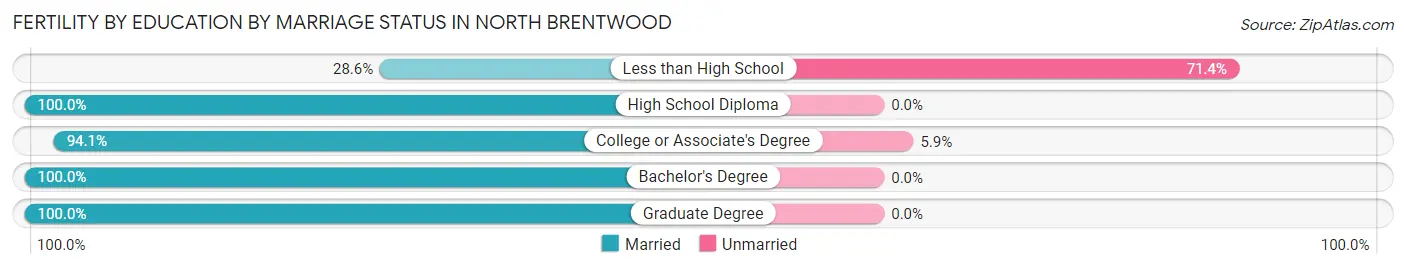
| Educational Attainment | Married | Unmarried |
| Less than High School | 2 (28.6%) | 5 (71.4%) |
| High School Diploma | 2 (100.0%) | 0 (0.0%) |
| College or Associate's Degree | 16 (94.1%) | 1 (5.9%) |
| Bachelor's Degree | 4 (100.0%) | 0 (0.0%) |
| Graduate Degree | 1 (100.0%) | 0 (0.0%) |
| Total | 25 (80.6%) | 6 (19.4%) |
Employment Characteristics in North Brentwood
Employment by Class of Employer in North Brentwood
Among the 406 employed individuals in North Brentwood, private company employees (266 | 65.5%), federal government employees (63 | 15.5%), and not-for-profit organizations (34 | 8.4%) make up the most common classes of employment.
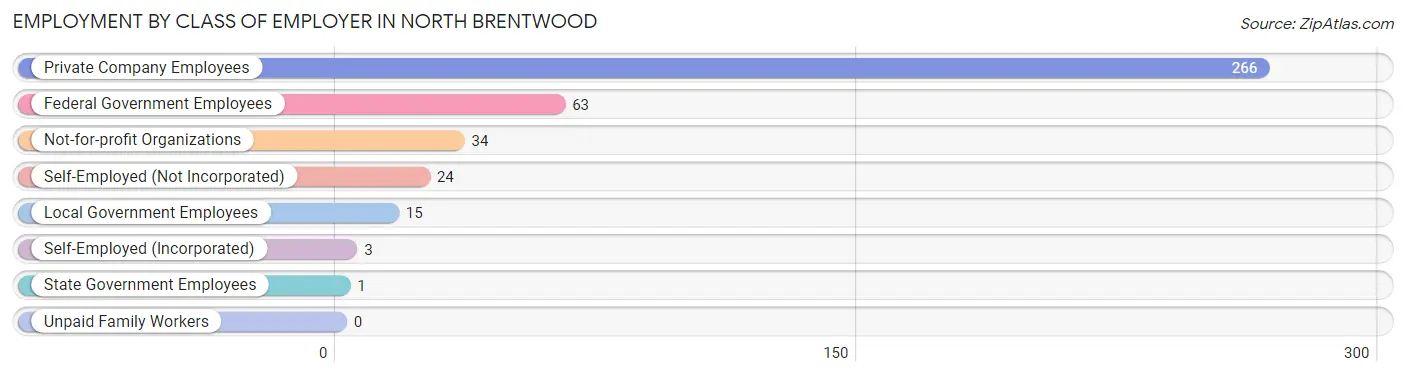
| Employer Class | # Employees | % Employees |
| Private Company Employees | 266 | 65.5% |
| Self-Employed (Incorporated) | 3 | 0.7% |
| Self-Employed (Not Incorporated) | 24 | 5.9% |
| Not-for-profit Organizations | 34 | 8.4% |
| Local Government Employees | 15 | 3.7% |
| State Government Employees | 1 | 0.3% |
| Federal Government Employees | 63 | 15.5% |
| Unpaid Family Workers | 0 | 0.0% |
| Total | 406 | 100.0% |
Employment Status by Age in North Brentwood
According to the labor force statistics for North Brentwood, out of the total population over 16 years of age (596), 73.5% or 438 individuals are in the labor force, with 6.8% or 30 of them unemployed. The age group with the highest labor force participation rate is 30 to 34 years, with 100.0% or 55 individuals in the labor force. Within the labor force, the 16 to 19 years age range has the highest percentage of unemployed individuals, with 32.0% or 8 of them being unemployed.
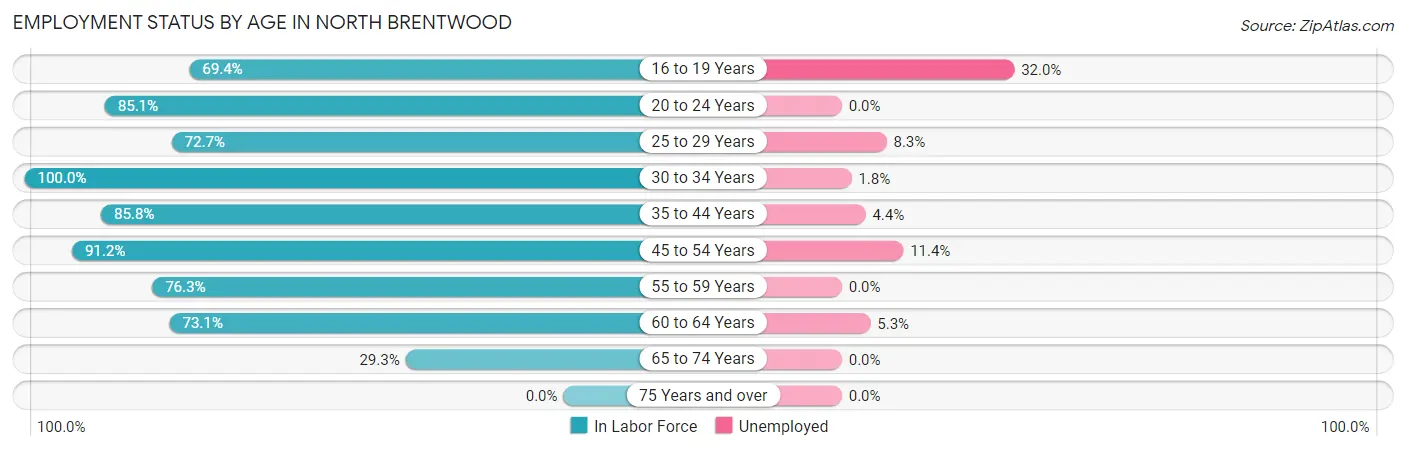
| Age Bracket | In Labor Force | Unemployed |
| 16 to 19 Years | 25 (69.4%) | 8 (32.0%) |
| 20 to 24 Years | 40 (85.1%) | 0 (0.0%) |
| 25 to 29 Years | 24 (72.7%) | 2 (8.3%) |
| 30 to 34 Years | 55 (100.0%) | 1 (1.8%) |
| 35 to 44 Years | 91 (85.8%) | 4 (4.4%) |
| 45 to 54 Years | 114 (91.2%) | 13 (11.4%) |
| 55 to 59 Years | 29 (76.3%) | 0 (0.0%) |
| 60 to 64 Years | 38 (73.1%) | 2 (5.3%) |
| 65 to 74 Years | 22 (29.3%) | 0 (0.0%) |
| 75 Years and over | 0 (0.0%) | 0 (0.0%) |
| Total | 438 (73.5%) | 30 (6.8%) |
Employment Status by Educational Attainment in North Brentwood
According to labor force statistics for North Brentwood, 85.8% of individuals (351) out of the total population between 25 and 64 years of age (409) are in the labor force, with 6.3% or 22 of them being unemployed. The group with the highest labor force participation rate are those with the educational attainment of bachelor's degree or higher, with 97.1% or 100 individuals in the labor force. Within the labor force, individuals with high school diploma education have the highest percentage of unemployment, with 15.8% or 15 of them being unemployed.
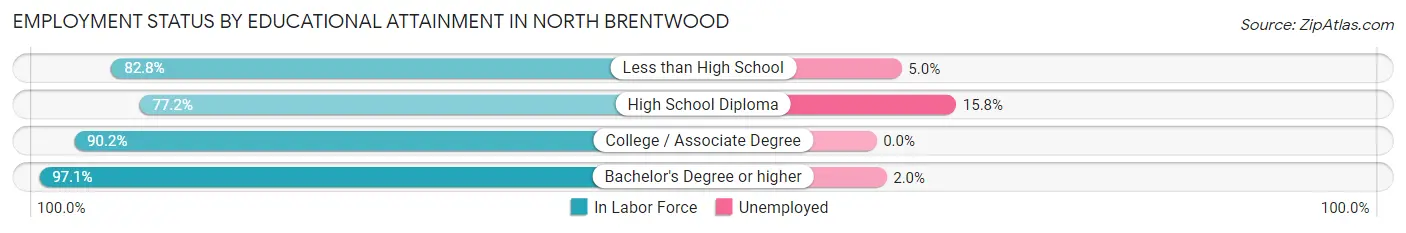
| Educational Attainment | In Labor Force | Unemployed |
| Less than High School | 101 (82.8%) | 6 (5.0%) |
| High School Diploma | 95 (77.2%) | 19 (15.8%) |
| College / Associate Degree | 55 (90.2%) | 0 (0.0%) |
| Bachelor's Degree or higher | 100 (97.1%) | 2 (2.0%) |
| Total | 351 (85.8%) | 26 (6.3%) |
Employment Occupations by Sex in North Brentwood
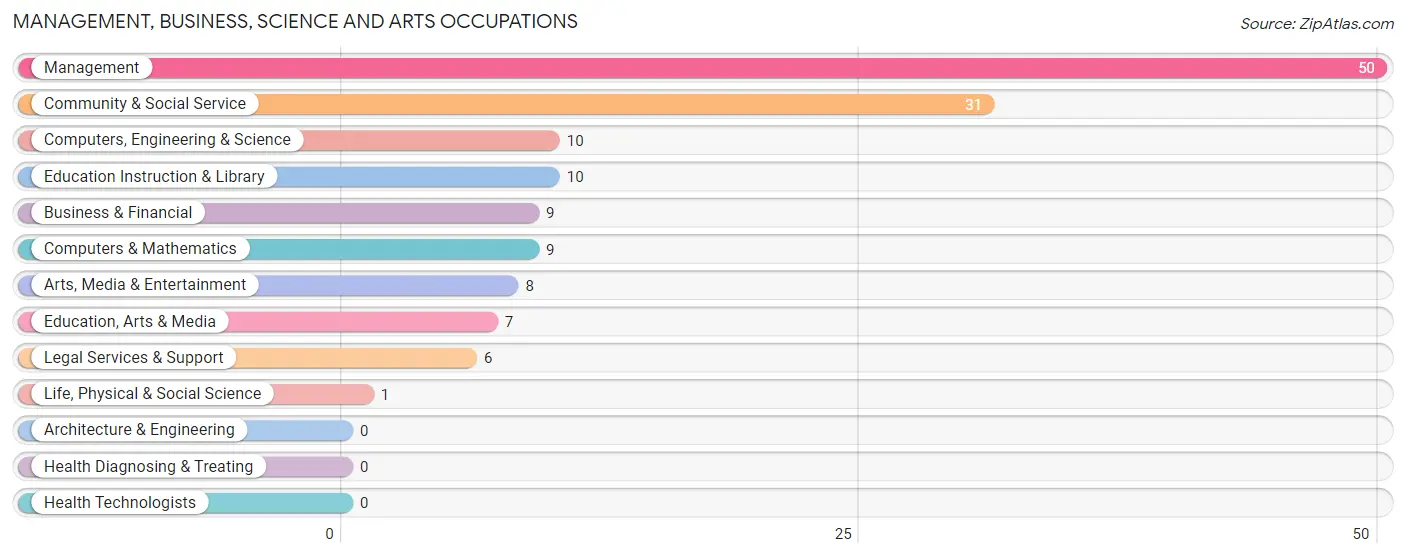
Management, Business, Science and Arts Occupations
The most common Management, Business, Science and Arts occupations in North Brentwood are Management (50 | 12.2%), Community & Social Service (31 | 7.6%), Computers, Engineering & Science (10 | 2.5%), Education Instruction & Library (10 | 2.5%), and Business & Financial (9 | 2.2%).
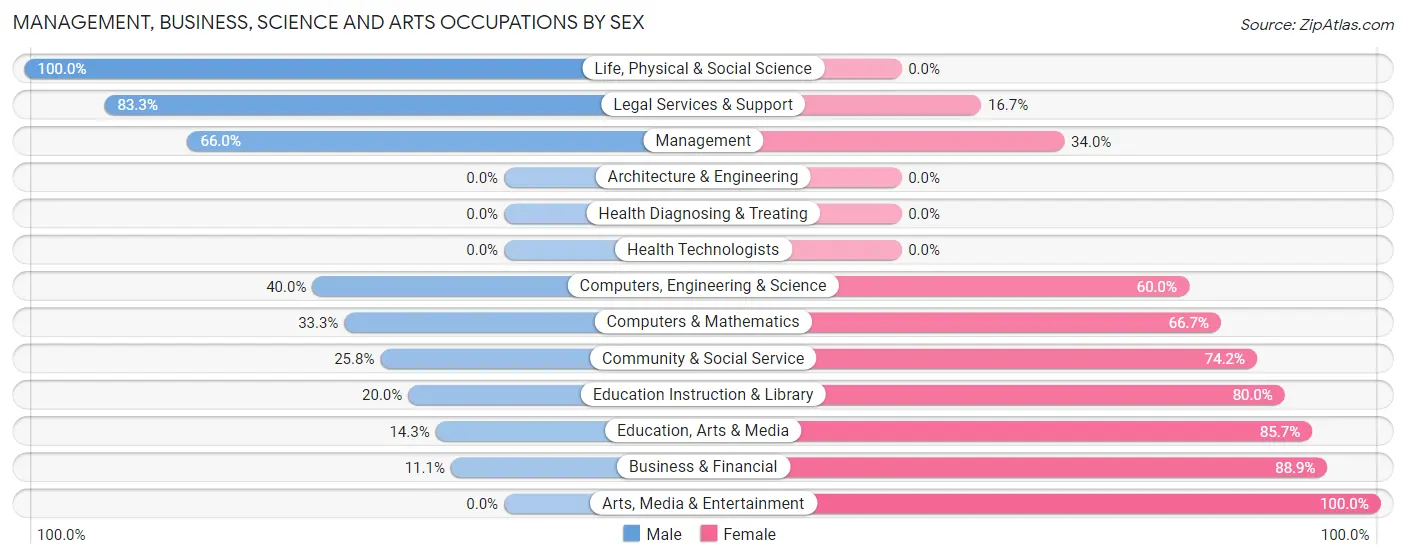
Management, Business, Science and Arts Occupations by Sex
Within the Management, Business, Science and Arts occupations in North Brentwood, the most male-oriented occupations are Life, Physical & Social Science (100.0%), Legal Services & Support (83.3%), and Management (66.0%), while the most female-oriented occupations are Arts, Media & Entertainment (100.0%), Business & Financial (88.9%), and Education, Arts & Media (85.7%).
| Occupation | Male | Female |
| Management | 33 (66.0%) | 17 (34.0%) |
| Business & Financial | 1 (11.1%) | 8 (88.9%) |
| Computers, Engineering & Science | 4 (40.0%) | 6 (60.0%) |
| Computers & Mathematics | 3 (33.3%) | 6 (66.7%) |
| Architecture & Engineering | 0 (0.0%) | 0 (0.0%) |
| Life, Physical & Social Science | 1 (100.0%) | 0 (0.0%) |
| Community & Social Service | 8 (25.8%) | 23 (74.2%) |
| Education, Arts & Media | 1 (14.3%) | 6 (85.7%) |
| Legal Services & Support | 5 (83.3%) | 1 (16.7%) |
| Education Instruction & Library | 2 (20.0%) | 8 (80.0%) |
| Arts, Media & Entertainment | 0 (0.0%) | 8 (100.0%) |
| Health Diagnosing & Treating | 0 (0.0%) | 0 (0.0%) |
| Health Technologists | 0 (0.0%) | 0 (0.0%) |
| Total (Category) | 46 (46.0%) | 54 (54.0%) |
| Total (Overall) | 222 (54.4%) | 186 (45.6%) |
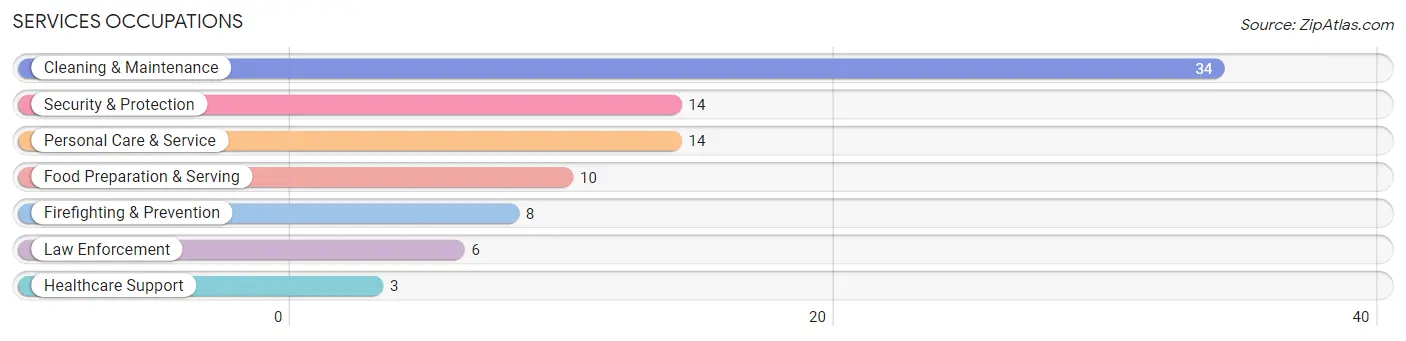
Services Occupations
The most common Services occupations in North Brentwood are Cleaning & Maintenance (34 | 8.3%), Security & Protection (14 | 3.4%), Personal Care & Service (14 | 3.4%), Food Preparation & Serving (10 | 2.5%), and Firefighting & Prevention (8 | 2.0%).
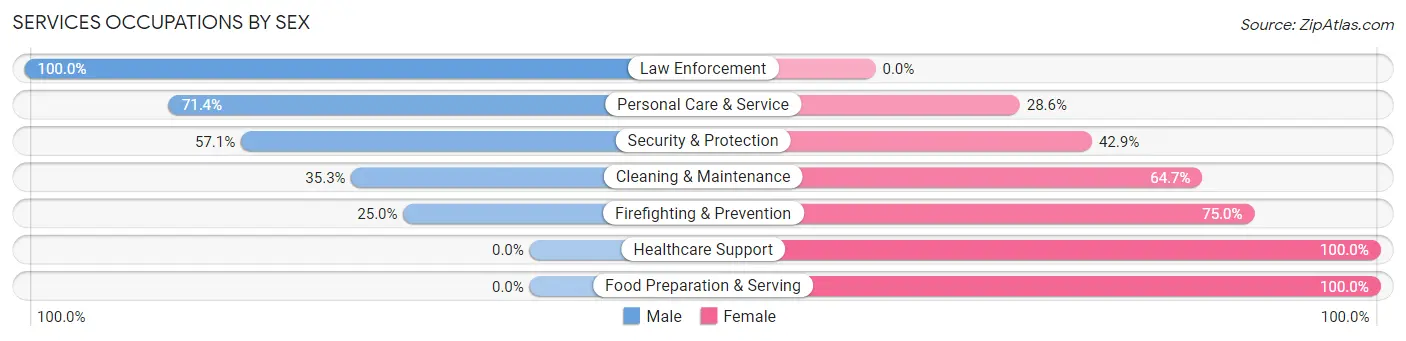
Services Occupations by Sex
Within the Services occupations in North Brentwood, the most male-oriented occupations are Law Enforcement (100.0%), Personal Care & Service (71.4%), and Security & Protection (57.1%), while the most female-oriented occupations are Healthcare Support (100.0%), Food Preparation & Serving (100.0%), and Firefighting & Prevention (75.0%).
| Occupation | Male | Female |
| Healthcare Support | 0 (0.0%) | 3 (100.0%) |
| Security & Protection | 8 (57.1%) | 6 (42.9%) |
| Firefighting & Prevention | 2 (25.0%) | 6 (75.0%) |
| Law Enforcement | 6 (100.0%) | 0 (0.0%) |
| Food Preparation & Serving | 0 (0.0%) | 10 (100.0%) |
| Cleaning & Maintenance | 12 (35.3%) | 22 (64.7%) |
| Personal Care & Service | 10 (71.4%) | 4 (28.6%) |
| Total (Category) | 30 (40.0%) | 45 (60.0%) |
| Total (Overall) | 222 (54.4%) | 186 (45.6%) |
Sales and Office Occupations
The most common Sales and Office occupations in North Brentwood are Office & Administration (62 | 15.2%), and Sales & Related (51 | 12.5%).
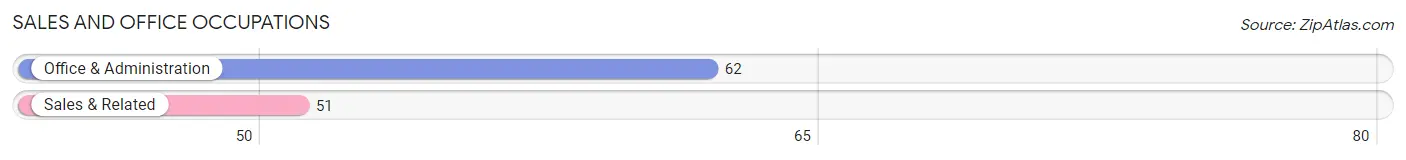
Sales and Office Occupations by Sex
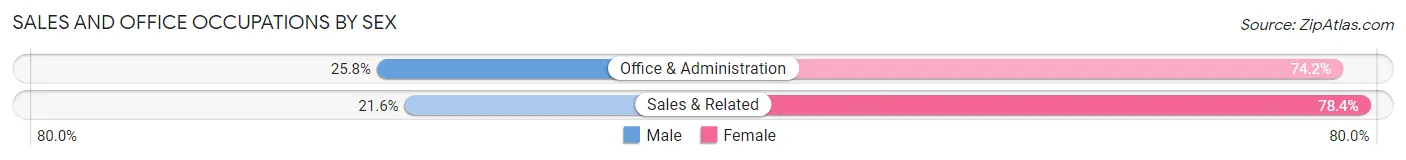
| Occupation | Male | Female |
| Sales & Related | 11 (21.6%) | 40 (78.4%) |
| Office & Administration | 16 (25.8%) | 46 (74.2%) |
| Total (Category) | 27 (23.9%) | 86 (76.1%) |
| Total (Overall) | 222 (54.4%) | 186 (45.6%) |
Natural Resources, Construction and Maintenance Occupations
The most common Natural Resources, Construction and Maintenance occupations in North Brentwood are Construction & Extraction (54 | 13.2%), and Installation, Maintenance & Repair (11 | 2.7%).
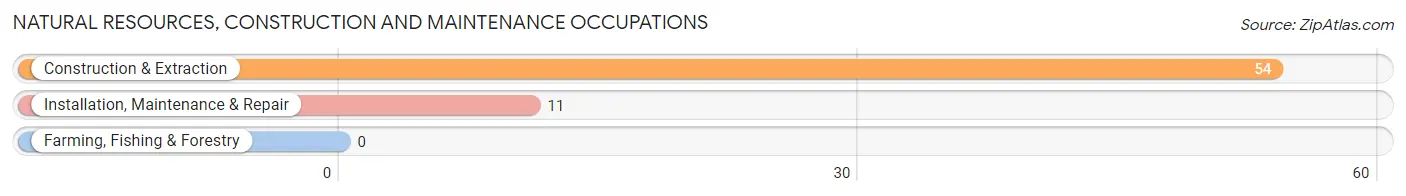
Natural Resources, Construction and Maintenance Occupations by Sex

| Occupation | Male | Female |
| Farming, Fishing & Forestry | 0 (0.0%) | 0 (0.0%) |
| Construction & Extraction | 54 (100.0%) | 0 (0.0%) |
| Installation, Maintenance & Repair | 11 (100.0%) | 0 (0.0%) |
| Total (Category) | 65 (100.0%) | 0 (0.0%) |
| Total (Overall) | 222 (54.4%) | 186 (45.6%) |
Production, Transportation and Moving Occupations
The most common Production, Transportation and Moving occupations in North Brentwood are Transportation (31 | 7.6%), Production (18 | 4.4%), and Material Moving (6 | 1.5%).
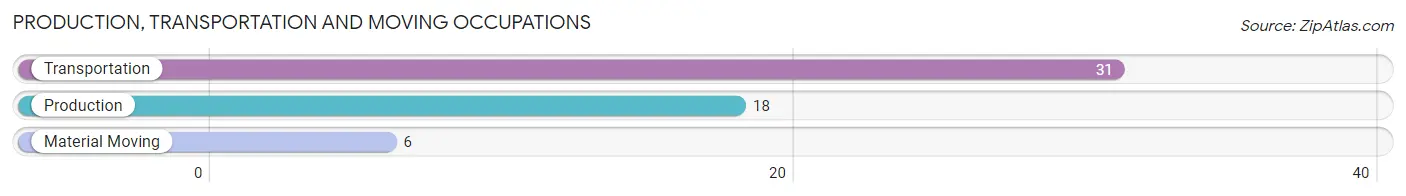
Production, Transportation and Moving Occupations by Sex
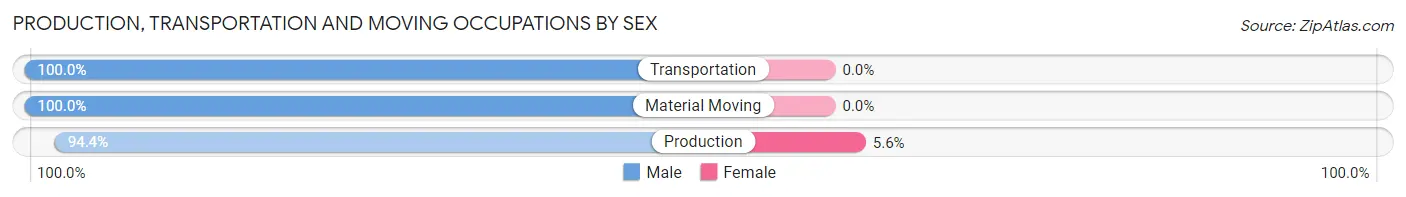
| Occupation | Male | Female |
| Production | 17 (94.4%) | 1 (5.6%) |
| Transportation | 31 (100.0%) | 0 (0.0%) |
| Material Moving | 6 (100.0%) | 0 (0.0%) |
| Total (Category) | 54 (98.2%) | 1 (1.8%) |
| Total (Overall) | 222 (54.4%) | 186 (45.6%) |
Employment Industries by Sex in North Brentwood
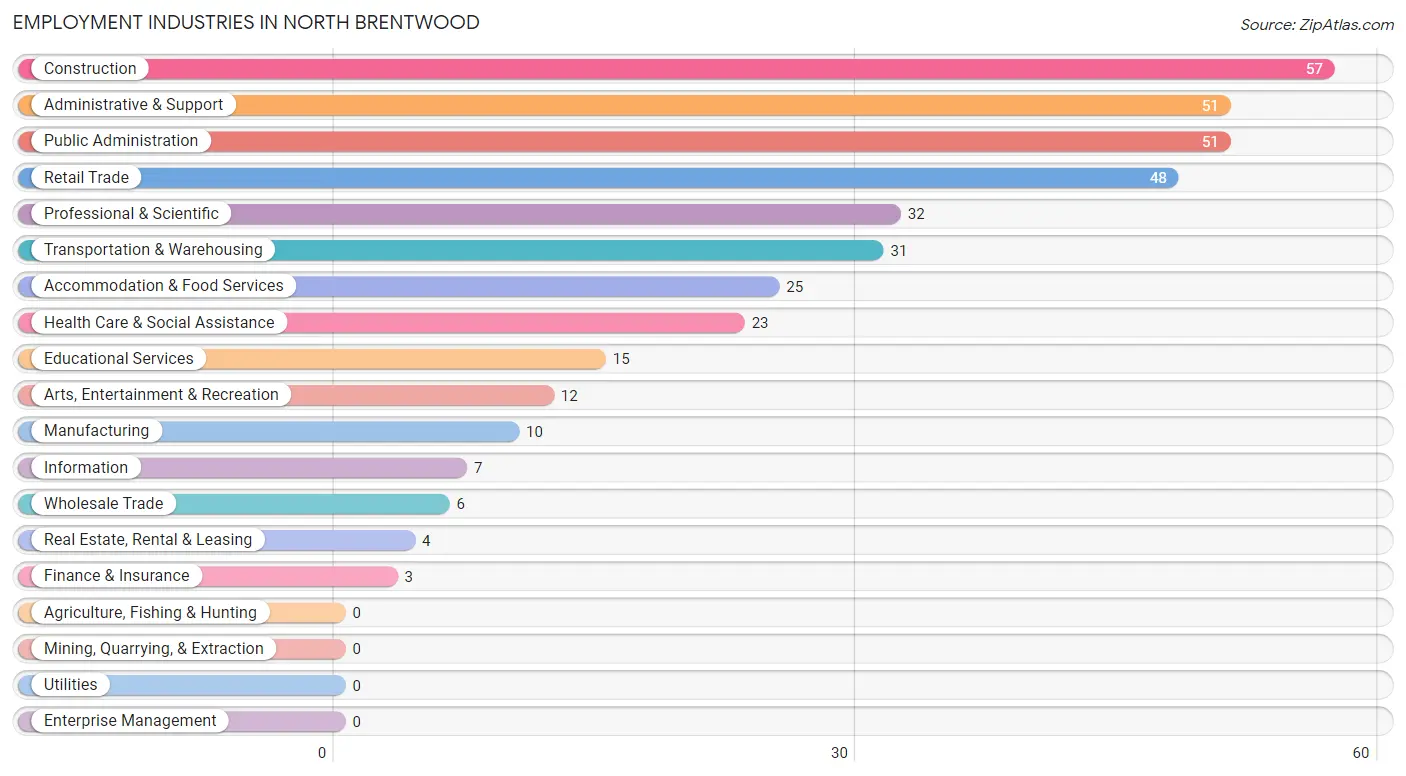
Employment Industries in North Brentwood
The major employment industries in North Brentwood include Construction (57 | 14.0%), Administrative & Support (51 | 12.5%), Public Administration (51 | 12.5%), Retail Trade (48 | 11.8%), and Professional & Scientific (32 | 7.8%).
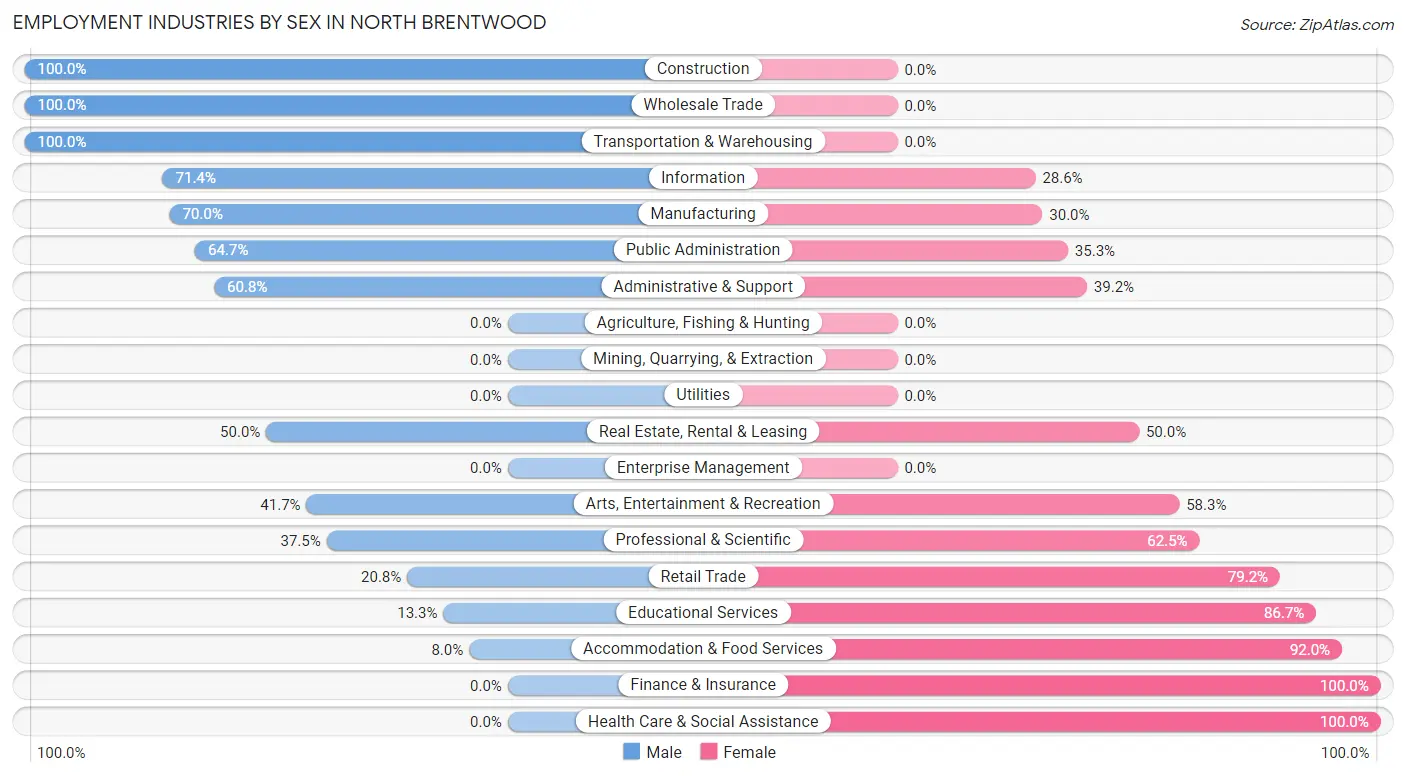
Employment Industries by Sex in North Brentwood
The North Brentwood industries that see more men than women are Construction (100.0%), Wholesale Trade (100.0%), and Transportation & Warehousing (100.0%), whereas the industries that tend to have a higher number of women are Finance & Insurance (100.0%), Health Care & Social Assistance (100.0%), and Accommodation & Food Services (92.0%).
| Industry | Male | Female |
| Agriculture, Fishing & Hunting | 0 (0.0%) | 0 (0.0%) |
| Mining, Quarrying, & Extraction | 0 (0.0%) | 0 (0.0%) |
| Construction | 57 (100.0%) | 0 (0.0%) |
| Manufacturing | 7 (70.0%) | 3 (30.0%) |
| Wholesale Trade | 6 (100.0%) | 0 (0.0%) |
| Retail Trade | 10 (20.8%) | 38 (79.2%) |
| Transportation & Warehousing | 31 (100.0%) | 0 (0.0%) |
| Utilities | 0 (0.0%) | 0 (0.0%) |
| Information | 5 (71.4%) | 2 (28.6%) |
| Finance & Insurance | 0 (0.0%) | 3 (100.0%) |
| Real Estate, Rental & Leasing | 2 (50.0%) | 2 (50.0%) |
| Professional & Scientific | 12 (37.5%) | 20 (62.5%) |
| Enterprise Management | 0 (0.0%) | 0 (0.0%) |
| Administrative & Support | 31 (60.8%) | 20 (39.2%) |
| Educational Services | 2 (13.3%) | 13 (86.7%) |
| Health Care & Social Assistance | 0 (0.0%) | 23 (100.0%) |
| Arts, Entertainment & Recreation | 5 (41.7%) | 7 (58.3%) |
| Accommodation & Food Services | 2 (8.0%) | 23 (92.0%) |
| Public Administration | 33 (64.7%) | 18 (35.3%) |
| Total | 222 (54.4%) | 186 (45.6%) |
Education in North Brentwood
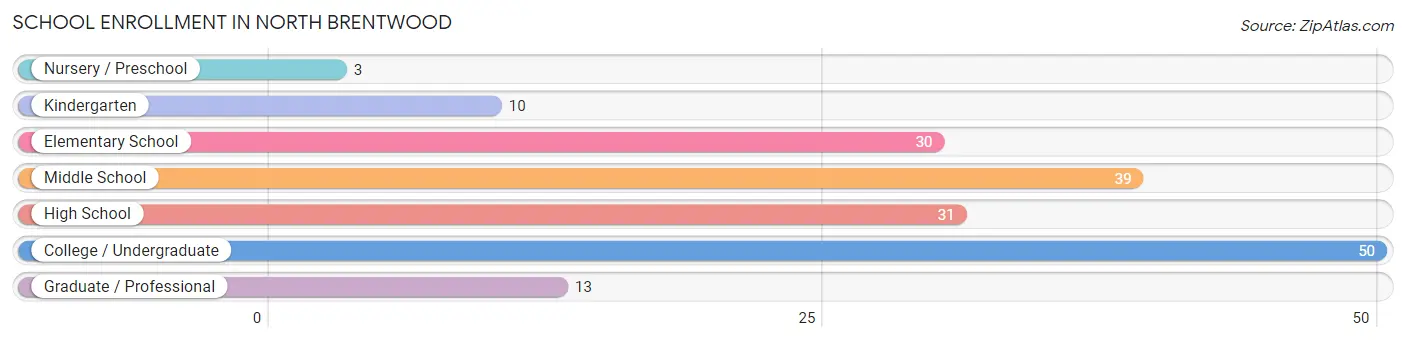
School Enrollment in North Brentwood
The most common levels of schooling among the 176 students in North Brentwood are college / undergraduate (50 | 28.4%), middle school (39 | 22.2%), and high school (31 | 17.6%).
| School Level | # Students | % Students |
| Nursery / Preschool | 3 | 1.7% |
| Kindergarten | 10 | 5.7% |
| Elementary School | 30 | 17.1% |
| Middle School | 39 | 22.2% |
| High School | 31 | 17.6% |
| College / Undergraduate | 50 | 28.4% |
| Graduate / Professional | 13 | 7.4% |
| Total | 176 | 100.0% |
School Enrollment by Age by Funding Source in North Brentwood
Out of a total of 176 students who are enrolled in schools in North Brentwood, 9 (5.1%) attend a private institution, while the remaining 167 (94.9%) are enrolled in public schools. The age group of 3 to 4 year olds has the highest likelihood of being enrolled in private schools, with 1 (33.3% in the age bracket) enrolled. Conversely, the age group of 15 to 17 year olds has the lowest likelihood of being enrolled in a private school, with 20 (100.0% in the age bracket) attending a public institution.
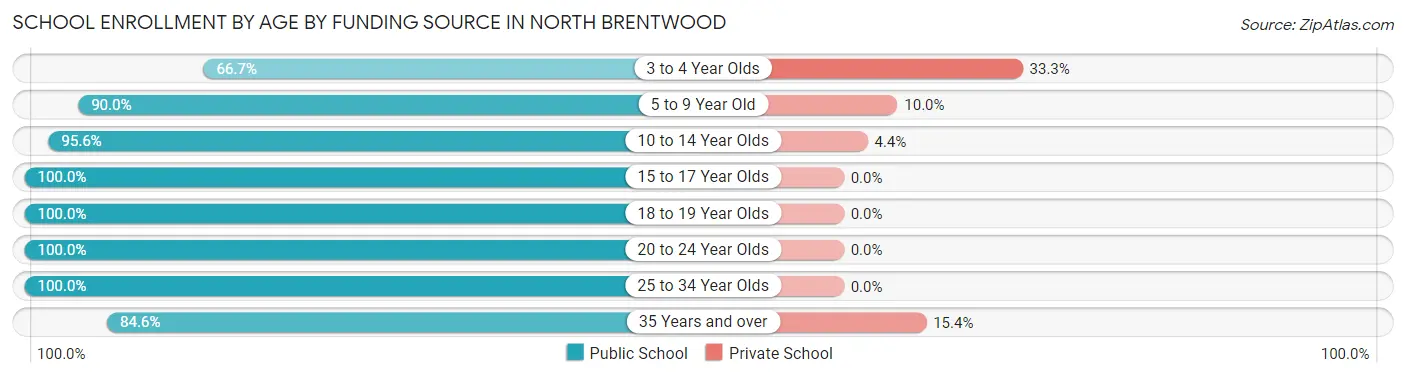
| Age Bracket | Public School | Private School |
| 3 to 4 Year Olds | 2 (66.7%) | 1 (33.3%) |
| 5 to 9 Year Old | 36 (90.0%) | 4 (10.0%) |
| 10 to 14 Year Olds | 43 (95.6%) | 2 (4.4%) |
| 15 to 17 Year Olds | 20 (100.0%) | 0 (0.0%) |
| 18 to 19 Year Olds | 16 (100.0%) | 0 (0.0%) |
| 20 to 24 Year Olds | 21 (100.0%) | 0 (0.0%) |
| 25 to 34 Year Olds | 18 (100.0%) | 0 (0.0%) |
| 35 Years and over | 11 (84.6%) | 2 (15.4%) |
| Total | 167 (94.9%) | 9 (5.1%) |
Educational Attainment by Field of Study in North Brentwood
Education (25 | 17.9%), business (15 | 10.7%), social sciences (13 | 9.3%), bio, nature & agricultural (11 | 7.9%), and science & technology (11 | 7.9%) are the most common fields of study among 140 individuals in North Brentwood who have obtained a bachelor's degree or higher.
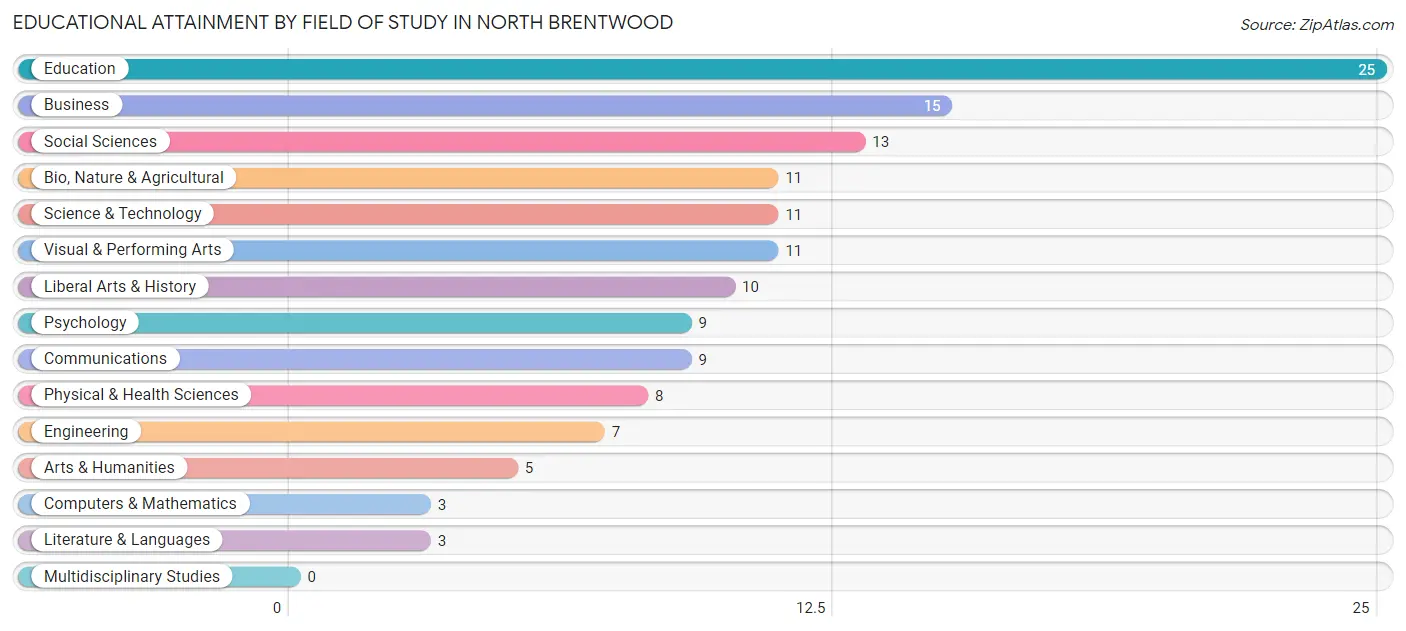
| Field of Study | # Graduates | % Graduates |
| Computers & Mathematics | 3 | 2.1% |
| Bio, Nature & Agricultural | 11 | 7.9% |
| Physical & Health Sciences | 8 | 5.7% |
| Psychology | 9 | 6.4% |
| Social Sciences | 13 | 9.3% |
| Engineering | 7 | 5.0% |
| Multidisciplinary Studies | 0 | 0.0% |
| Science & Technology | 11 | 7.9% |
| Business | 15 | 10.7% |
| Education | 25 | 17.9% |
| Literature & Languages | 3 | 2.1% |
| Liberal Arts & History | 10 | 7.1% |
| Visual & Performing Arts | 11 | 7.9% |
| Communications | 9 | 6.4% |
| Arts & Humanities | 5 | 3.6% |
| Total | 140 | 100.0% |
Transportation & Commute in North Brentwood
Vehicle Availability by Sex in North Brentwood
The most prevalent vehicle ownership categories in North Brentwood are males with 2 vehicles (62, accounting for 27.9%) and females with 2 vehicles (36, making up 33.7%).
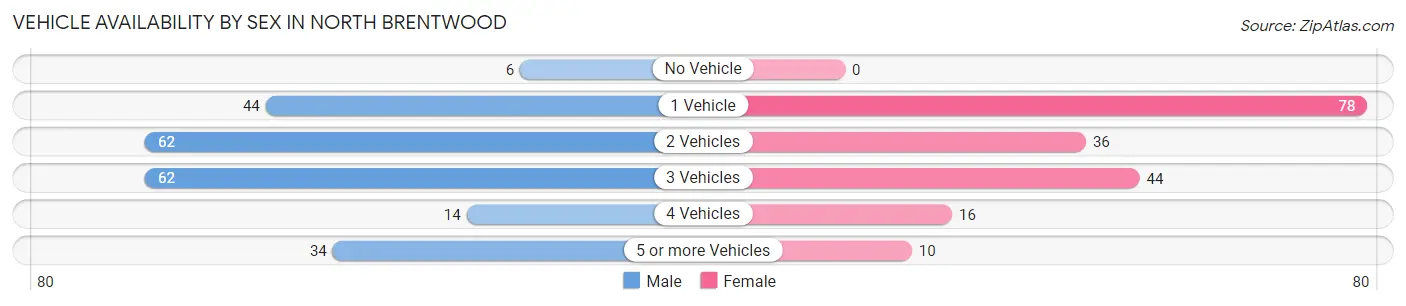
| Vehicles Available | Male | Female |
| No Vehicle | 6 (2.7%) | 0 (0.0%) |
| 1 Vehicle | 44 (19.8%) | 78 (42.4%) |
| 2 Vehicles | 62 (27.9%) | 36 (19.6%) |
| 3 Vehicles | 62 (27.9%) | 44 (23.9%) |
| 4 Vehicles | 14 (6.3%) | 16 (8.7%) |
| 5 or more Vehicles | 34 (15.3%) | 10 (5.4%) |
| Total | 222 (100.0%) | 184 (100.0%) |
Commute Time in North Brentwood
The most frequently occuring commute durations in North Brentwood are 60 to 89 minutes (55 commuters, 14.5%), 30 to 34 minutes (54 commuters, 14.2%), and 35 to 39 minutes (44 commuters, 11.6%).
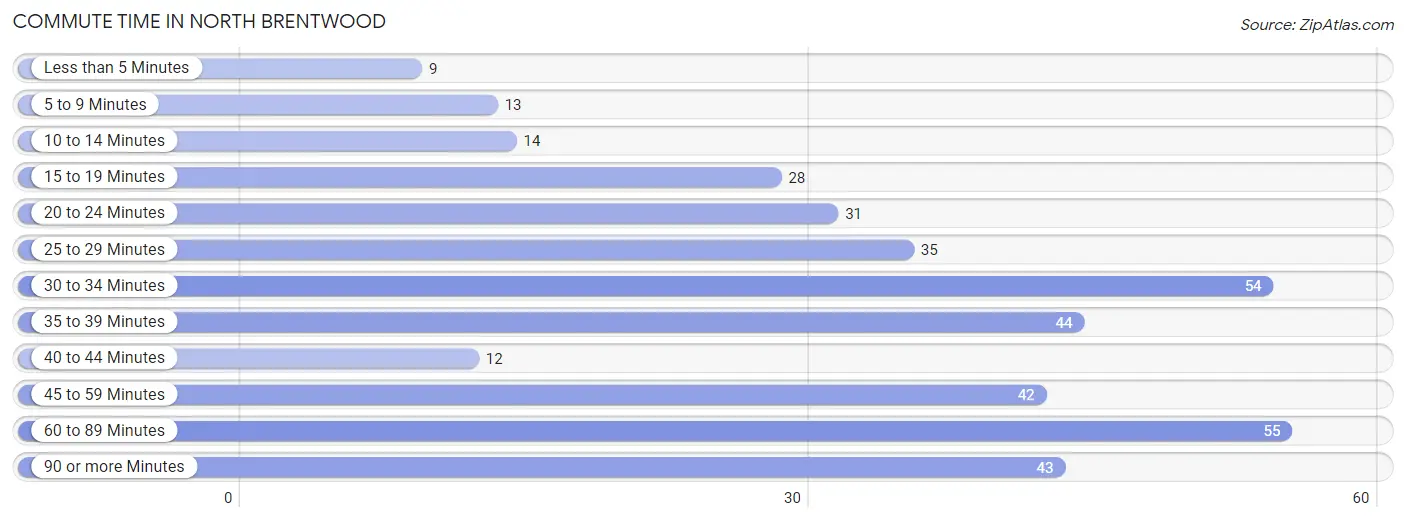
| Commute Time | # Commuters | % Commuters |
| Less than 5 Minutes | 9 | 2.4% |
| 5 to 9 Minutes | 13 | 3.4% |
| 10 to 14 Minutes | 14 | 3.7% |
| 15 to 19 Minutes | 28 | 7.4% |
| 20 to 24 Minutes | 31 | 8.2% |
| 25 to 29 Minutes | 35 | 9.2% |
| 30 to 34 Minutes | 54 | 14.2% |
| 35 to 39 Minutes | 44 | 11.6% |
| 40 to 44 Minutes | 12 | 3.2% |
| 45 to 59 Minutes | 42 | 11.1% |
| 60 to 89 Minutes | 55 | 14.5% |
| 90 or more Minutes | 43 | 11.3% |
Commute Time by Sex in North Brentwood
The most common commute times in North Brentwood are 30 to 34 minutes (47 commuters, 22.7%) for males and 35 to 39 minutes (44 commuters, 25.4%) for females.
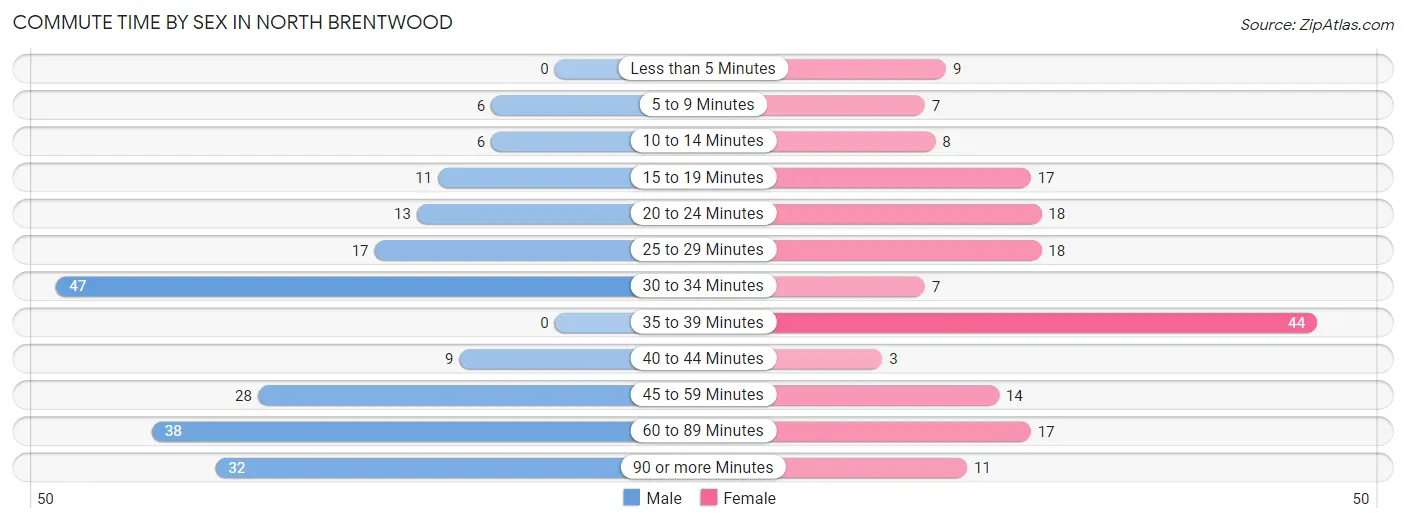
| Commute Time | Male | Female |
| Less than 5 Minutes | 0 (0.0%) | 9 (5.2%) |
| 5 to 9 Minutes | 6 (2.9%) | 7 (4.1%) |
| 10 to 14 Minutes | 6 (2.9%) | 8 (4.6%) |
| 15 to 19 Minutes | 11 (5.3%) | 17 (9.8%) |
| 20 to 24 Minutes | 13 (6.3%) | 18 (10.4%) |
| 25 to 29 Minutes | 17 (8.2%) | 18 (10.4%) |
| 30 to 34 Minutes | 47 (22.7%) | 7 (4.1%) |
| 35 to 39 Minutes | 0 (0.0%) | 44 (25.4%) |
| 40 to 44 Minutes | 9 (4.3%) | 3 (1.7%) |
| 45 to 59 Minutes | 28 (13.5%) | 14 (8.1%) |
| 60 to 89 Minutes | 38 (18.4%) | 17 (9.8%) |
| 90 or more Minutes | 32 (15.5%) | 11 (6.4%) |
Time of Departure to Work by Sex in North Brentwood
The most frequent times of departure to work in North Brentwood are 6:00 AM to 6:29 AM (45, 21.7%) for males and 6:30 AM to 6:59 AM (33, 19.1%) for females.
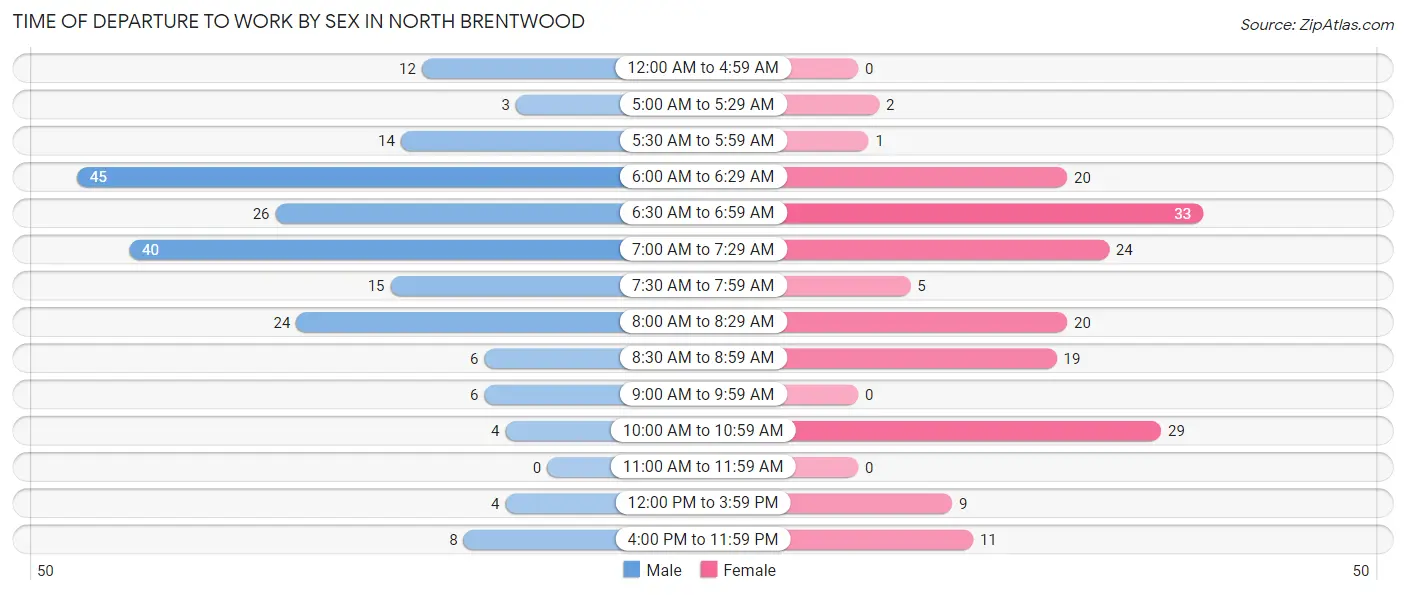
| Time of Departure | Male | Female |
| 12:00 AM to 4:59 AM | 12 (5.8%) | 0 (0.0%) |
| 5:00 AM to 5:29 AM | 3 (1.5%) | 2 (1.2%) |
| 5:30 AM to 5:59 AM | 14 (6.8%) | 1 (0.6%) |
| 6:00 AM to 6:29 AM | 45 (21.7%) | 20 (11.6%) |
| 6:30 AM to 6:59 AM | 26 (12.6%) | 33 (19.1%) |
| 7:00 AM to 7:29 AM | 40 (19.3%) | 24 (13.9%) |
| 7:30 AM to 7:59 AM | 15 (7.2%) | 5 (2.9%) |
| 8:00 AM to 8:29 AM | 24 (11.6%) | 20 (11.6%) |
| 8:30 AM to 8:59 AM | 6 (2.9%) | 19 (11.0%) |
| 9:00 AM to 9:59 AM | 6 (2.9%) | 0 (0.0%) |
| 10:00 AM to 10:59 AM | 4 (1.9%) | 29 (16.8%) |
| 11:00 AM to 11:59 AM | 0 (0.0%) | 0 (0.0%) |
| 12:00 PM to 3:59 PM | 4 (1.9%) | 9 (5.2%) |
| 4:00 PM to 11:59 PM | 8 (3.9%) | 11 (6.4%) |
| Total | 207 (100.0%) | 173 (100.0%) |
Housing Occupancy in North Brentwood
Occupancy by Ownership in North Brentwood
Of the total 245 dwellings in North Brentwood, owner-occupied units account for 200 (81.6%), while renter-occupied units make up 45 (18.4%).
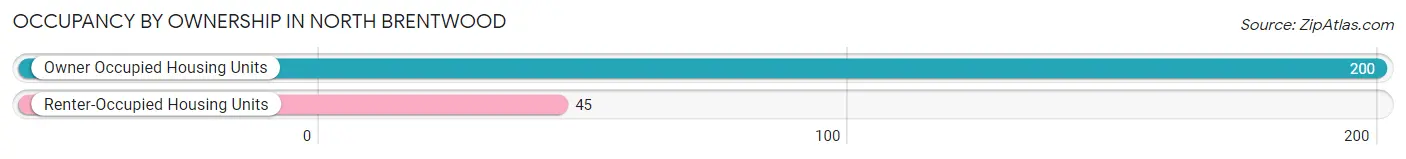
| Occupancy | # Housing Units | % Housing Units |
| Owner Occupied Housing Units | 200 | 81.6% |
| Renter-Occupied Housing Units | 45 | 18.4% |
| Total Occupied Housing Units | 245 | 100.0% |
Occupancy by Household Size in North Brentwood
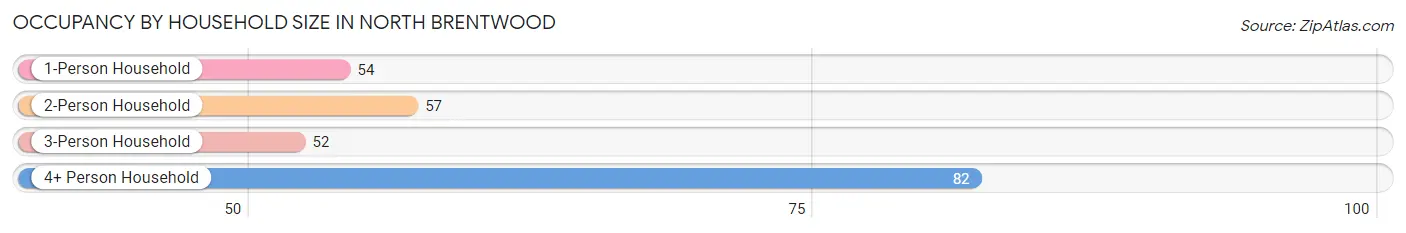
| Household Size | # Housing Units | % Housing Units |
| 1-Person Household | 54 | 22.0% |
| 2-Person Household | 57 | 23.3% |
| 3-Person Household | 52 | 21.2% |
| 4+ Person Household | 82 | 33.5% |
| Total Housing Units | 245 | 100.0% |
Occupancy by Ownership by Household Size in North Brentwood
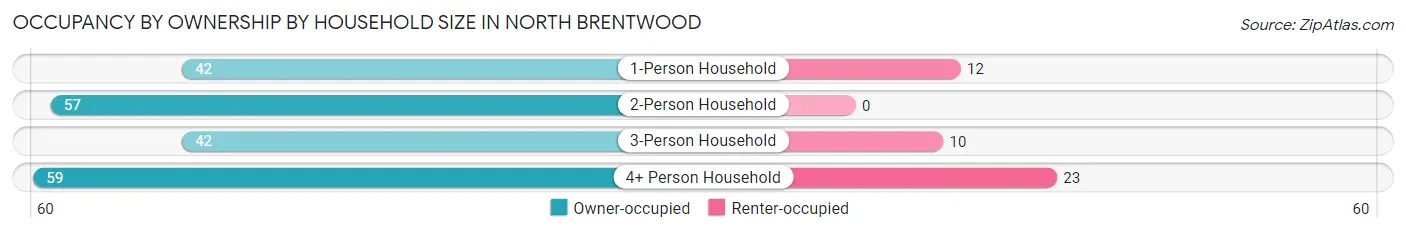
| Household Size | Owner-occupied | Renter-occupied |
| 1-Person Household | 42 (77.8%) | 12 (22.2%) |
| 2-Person Household | 57 (100.0%) | 0 (0.0%) |
| 3-Person Household | 42 (80.8%) | 10 (19.2%) |
| 4+ Person Household | 59 (72.0%) | 23 (28.1%) |
| Total Housing Units | 200 (81.6%) | 45 (18.4%) |
Occupancy by Educational Attainment in North Brentwood
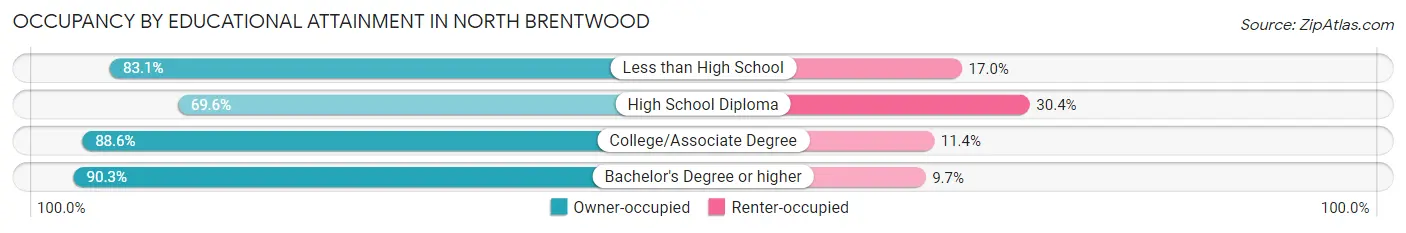
| Household Size | Owner-occupied | Renter-occupied |
| Less than High School | 49 (83.1%) | 10 (17.0%) |
| High School Diploma | 55 (69.6%) | 24 (30.4%) |
| College/Associate Degree | 31 (88.6%) | 4 (11.4%) |
| Bachelor's Degree or higher | 65 (90.3%) | 7 (9.7%) |
Occupancy by Age of Householder in North Brentwood
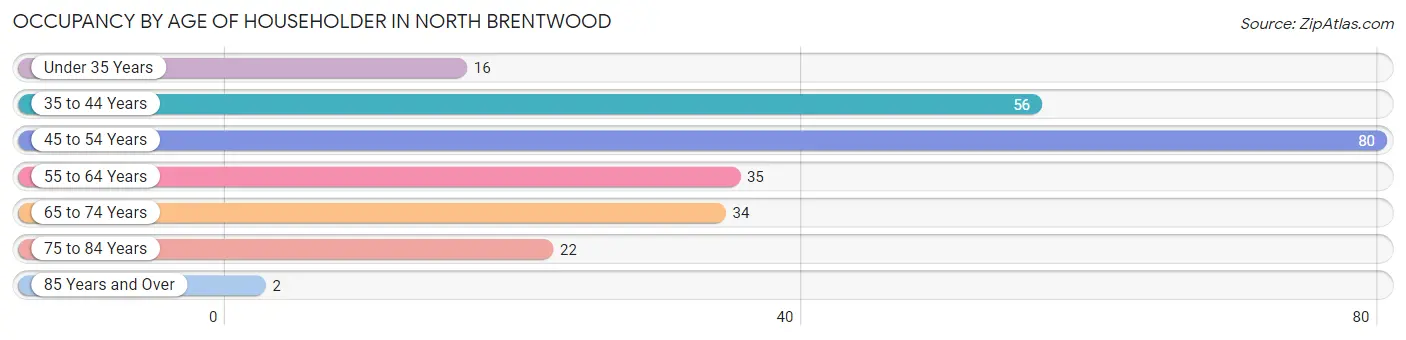
| Age Bracket | # Households | % Households |
| Under 35 Years | 16 | 6.5% |
| 35 to 44 Years | 56 | 22.9% |
| 45 to 54 Years | 80 | 32.7% |
| 55 to 64 Years | 35 | 14.3% |
| 65 to 74 Years | 34 | 13.9% |
| 75 to 84 Years | 22 | 9.0% |
| 85 Years and Over | 2 | 0.8% |
| Total | 245 | 100.0% |
Housing Finances in North Brentwood
Median Income by Occupancy in North Brentwood
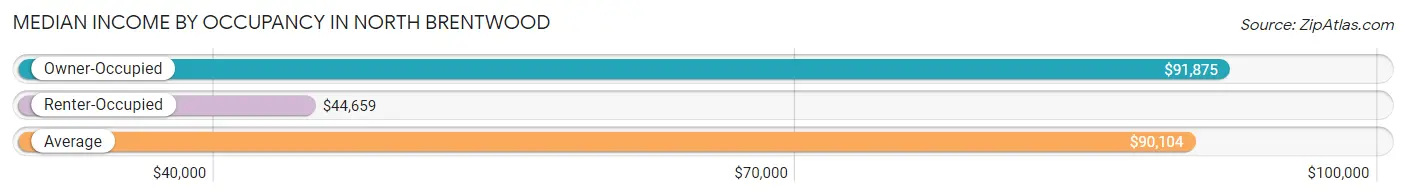
| Occupancy Type | # Households | Median Income |
| Owner-Occupied | 200 (81.6%) | $91,875 |
| Renter-Occupied | 45 (18.4%) | $44,659 |
| Average | 245 (100.0%) | $90,104 |
Occupancy by Householder Income Bracket in North Brentwood
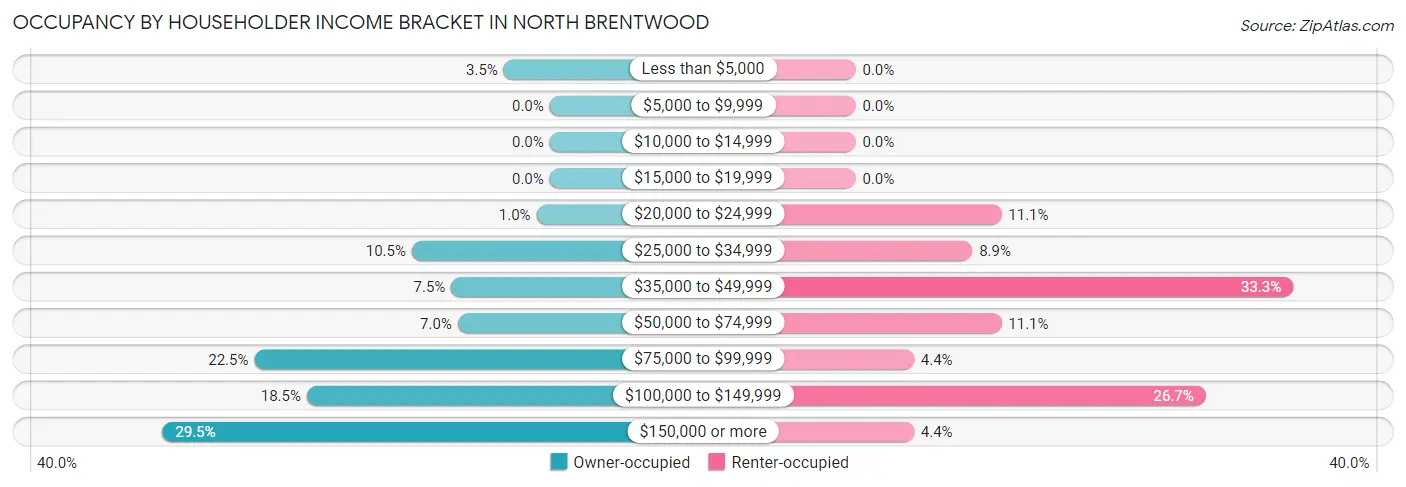
| Income Bracket | Owner-occupied | Renter-occupied |
| Less than $5,000 | 7 (3.5%) | 0 (0.0%) |
| $5,000 to $9,999 | 0 (0.0%) | 0 (0.0%) |
| $10,000 to $14,999 | 0 (0.0%) | 0 (0.0%) |
| $15,000 to $19,999 | 0 (0.0%) | 0 (0.0%) |
| $20,000 to $24,999 | 2 (1.0%) | 5 (11.1%) |
| $25,000 to $34,999 | 21 (10.5%) | 4 (8.9%) |
| $35,000 to $49,999 | 15 (7.5%) | 15 (33.3%) |
| $50,000 to $74,999 | 14 (7.0%) | 5 (11.1%) |
| $75,000 to $99,999 | 45 (22.5%) | 2 (4.4%) |
| $100,000 to $149,999 | 37 (18.5%) | 12 (26.7%) |
| $150,000 or more | 59 (29.5%) | 2 (4.4%) |
| Total | 200 (100.0%) | 45 (100.0%) |
Monthly Housing Cost Tiers in North Brentwood
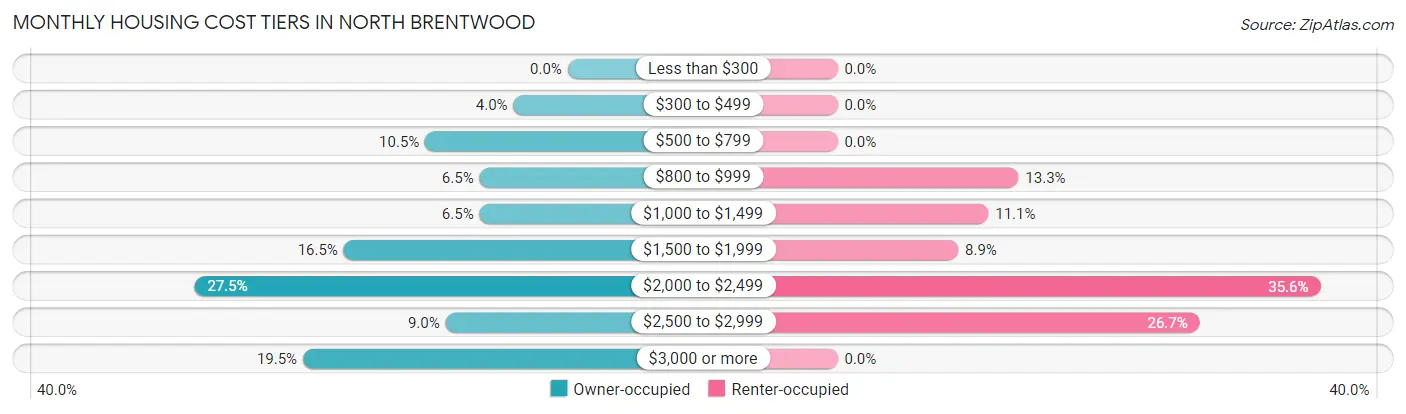
| Monthly Cost | Owner-occupied | Renter-occupied |
| Less than $300 | 0 (0.0%) | 0 (0.0%) |
| $300 to $499 | 8 (4.0%) | 0 (0.0%) |
| $500 to $799 | 21 (10.5%) | 0 (0.0%) |
| $800 to $999 | 13 (6.5%) | 6 (13.3%) |
| $1,000 to $1,499 | 13 (6.5%) | 5 (11.1%) |
| $1,500 to $1,999 | 33 (16.5%) | 4 (8.9%) |
| $2,000 to $2,499 | 55 (27.5%) | 16 (35.6%) |
| $2,500 to $2,999 | 18 (9.0%) | 12 (26.7%) |
| $3,000 or more | 39 (19.5%) | 0 (0.0%) |
| Total | 200 (100.0%) | 45 (100.0%) |
Physical Housing Characteristics in North Brentwood
Housing Structures in North Brentwood
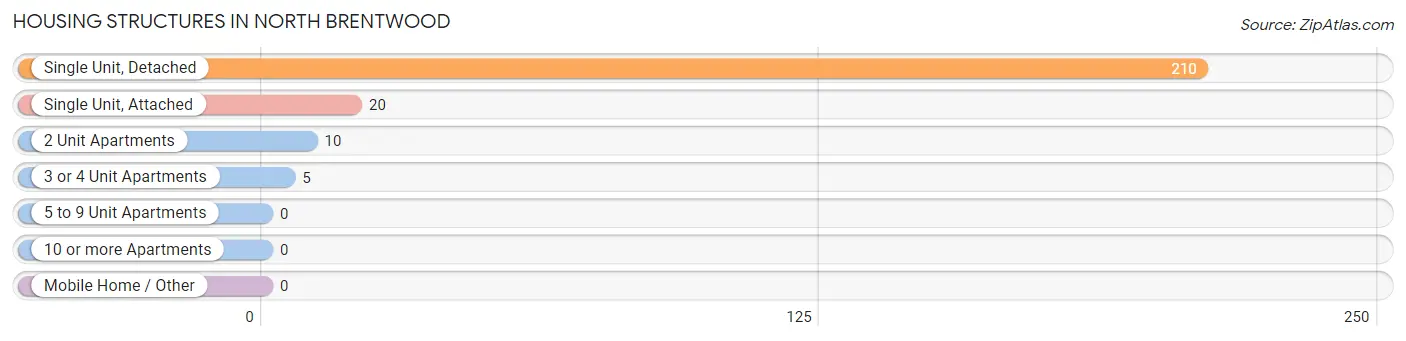
| Structure Type | # Housing Units | % Housing Units |
| Single Unit, Detached | 210 | 85.7% |
| Single Unit, Attached | 20 | 8.2% |
| 2 Unit Apartments | 10 | 4.1% |
| 3 or 4 Unit Apartments | 5 | 2.0% |
| 5 to 9 Unit Apartments | 0 | 0.0% |
| 10 or more Apartments | 0 | 0.0% |
| Mobile Home / Other | 0 | 0.0% |
| Total | 245 | 100.0% |
Housing Structures by Occupancy in North Brentwood
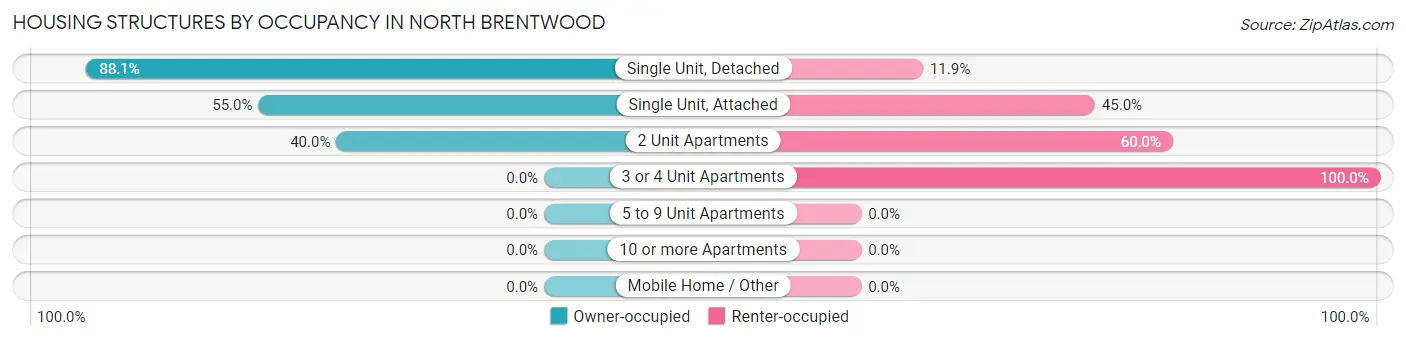
| Structure Type | Owner-occupied | Renter-occupied |
| Single Unit, Detached | 185 (88.1%) | 25 (11.9%) |
| Single Unit, Attached | 11 (55.0%) | 9 (45.0%) |
| 2 Unit Apartments | 4 (40.0%) | 6 (60.0%) |
| 3 or 4 Unit Apartments | 0 (0.0%) | 5 (100.0%) |
| 5 to 9 Unit Apartments | 0 (0.0%) | 0 (0.0%) |
| 10 or more Apartments | 0 (0.0%) | 0 (0.0%) |
| Mobile Home / Other | 0 (0.0%) | 0 (0.0%) |
| Total | 200 (81.6%) | 45 (18.4%) |
Housing Structures by Number of Rooms in North Brentwood
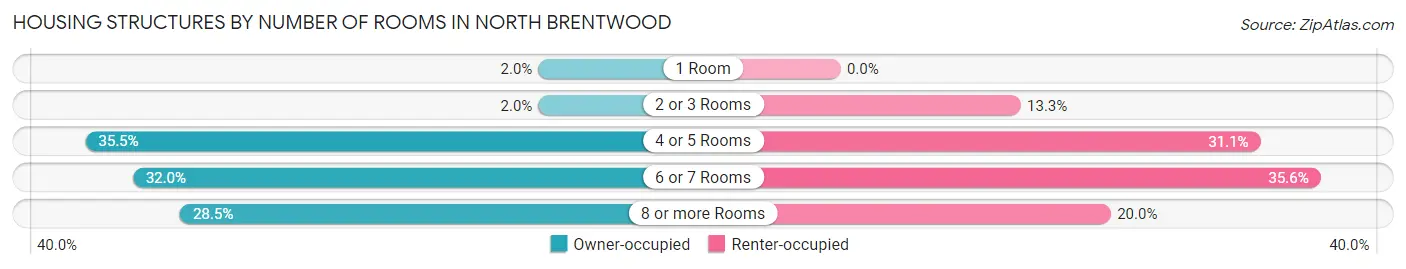
| Number of Rooms | Owner-occupied | Renter-occupied |
| 1 Room | 4 (2.0%) | 0 (0.0%) |
| 2 or 3 Rooms | 4 (2.0%) | 6 (13.3%) |
| 4 or 5 Rooms | 71 (35.5%) | 14 (31.1%) |
| 6 or 7 Rooms | 64 (32.0%) | 16 (35.6%) |
| 8 or more Rooms | 57 (28.5%) | 9 (20.0%) |
| Total | 200 (100.0%) | 45 (100.0%) |
Housing Structure by Heating Type in North Brentwood
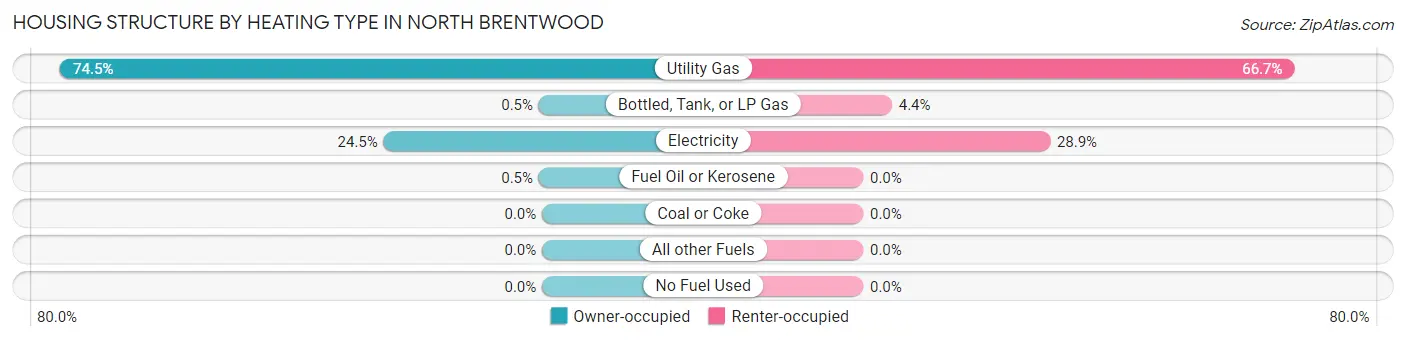
| Heating Type | Owner-occupied | Renter-occupied |
| Utility Gas | 149 (74.5%) | 30 (66.7%) |
| Bottled, Tank, or LP Gas | 1 (0.5%) | 2 (4.4%) |
| Electricity | 49 (24.5%) | 13 (28.9%) |
| Fuel Oil or Kerosene | 1 (0.5%) | 0 (0.0%) |
| Coal or Coke | 0 (0.0%) | 0 (0.0%) |
| All other Fuels | 0 (0.0%) | 0 (0.0%) |
| No Fuel Used | 0 (0.0%) | 0 (0.0%) |
| Total | 200 (100.0%) | 45 (100.0%) |
Household Vehicle Usage in North Brentwood
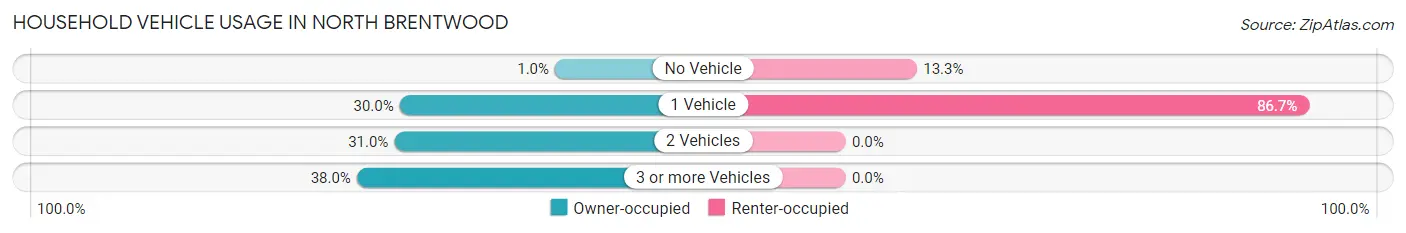
| Vehicles per Household | Owner-occupied | Renter-occupied |
| No Vehicle | 2 (1.0%) | 6 (13.3%) |
| 1 Vehicle | 60 (30.0%) | 39 (86.7%) |
| 2 Vehicles | 62 (31.0%) | 0 (0.0%) |
| 3 or more Vehicles | 76 (38.0%) | 0 (0.0%) |
| Total | 200 (100.0%) | 45 (100.0%) |
Real Estate & Mortgages in North Brentwood
Real Estate and Mortgage Overview in North Brentwood
| Characteristic | Without Mortgage | With Mortgage |
| Housing Units | 52 | 148 |
| Median Property Value | $344,000 | $387,300 |
| Median Household Income | $83,750 | $52 |
| Monthly Housing Costs | $786 | $39 |
| Real Estate Taxes | $4,474 | $2 |
Property Value by Mortgage Status in North Brentwood
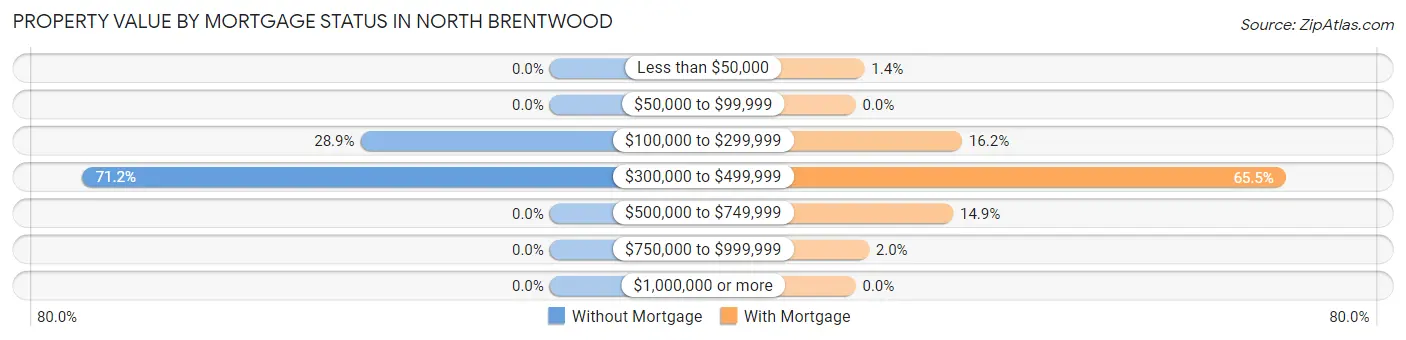
| Property Value | Without Mortgage | With Mortgage |
| Less than $50,000 | 0 (0.0%) | 2 (1.3%) |
| $50,000 to $99,999 | 0 (0.0%) | 0 (0.0%) |
| $100,000 to $299,999 | 15 (28.8%) | 24 (16.2%) |
| $300,000 to $499,999 | 37 (71.2%) | 97 (65.5%) |
| $500,000 to $749,999 | 0 (0.0%) | 22 (14.9%) |
| $750,000 to $999,999 | 0 (0.0%) | 3 (2.0%) |
| $1,000,000 or more | 0 (0.0%) | 0 (0.0%) |
| Total | 52 (100.0%) | 148 (100.0%) |
Household Income by Mortgage Status in North Brentwood
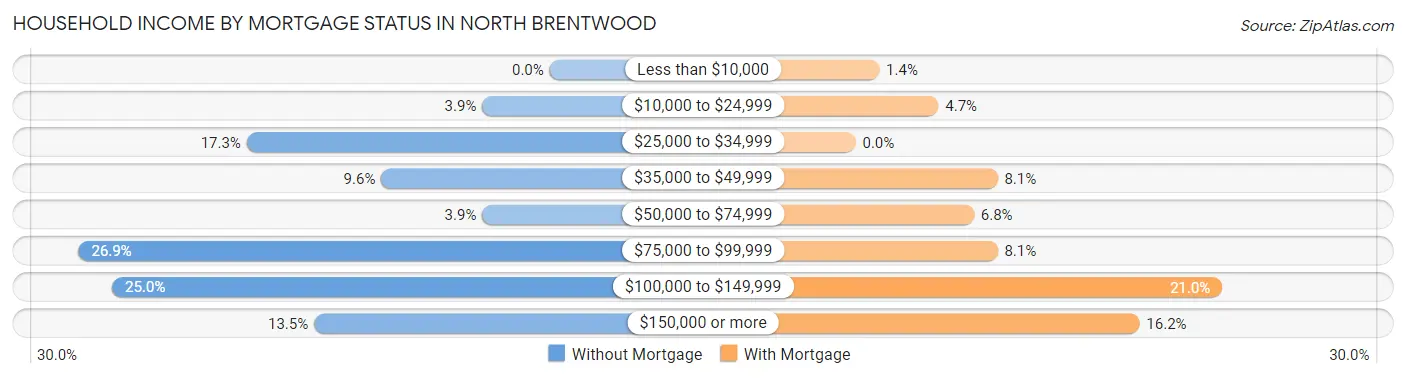
| Household Income | Without Mortgage | With Mortgage |
| Less than $10,000 | 0 (0.0%) | 2 (1.3%) |
| $10,000 to $24,999 | 2 (3.8%) | 7 (4.7%) |
| $25,000 to $34,999 | 9 (17.3%) | 0 (0.0%) |
| $35,000 to $49,999 | 5 (9.6%) | 12 (8.1%) |
| $50,000 to $74,999 | 2 (3.8%) | 10 (6.8%) |
| $75,000 to $99,999 | 14 (26.9%) | 12 (8.1%) |
| $100,000 to $149,999 | 13 (25.0%) | 31 (20.9%) |
| $150,000 or more | 7 (13.5%) | 24 (16.2%) |
| Total | 52 (100.0%) | 148 (100.0%) |
Property Value to Household Income Ratio in North Brentwood
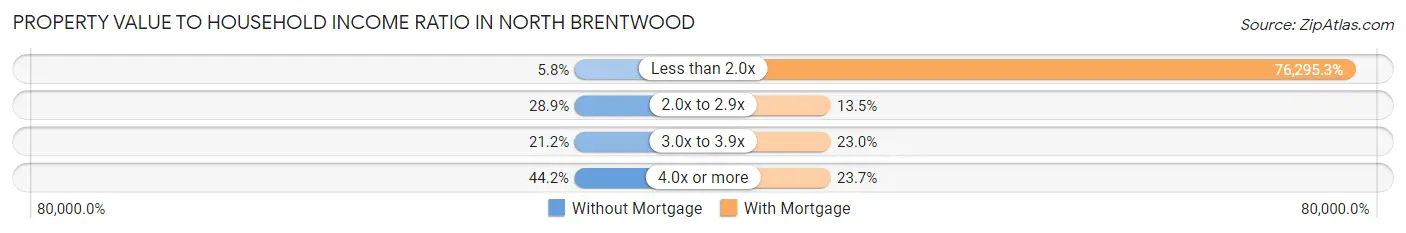
| Value-to-Income Ratio | Without Mortgage | With Mortgage |
| Less than 2.0x | 3 (5.8%) | 112,917 (76,295.3%) |
| 2.0x to 2.9x | 15 (28.8%) | 20 (13.5%) |
| 3.0x to 3.9x | 11 (21.1%) | 34 (23.0%) |
| 4.0x or more | 23 (44.2%) | 35 (23.6%) |
| Total | 52 (100.0%) | 148 (100.0%) |
Real Estate Taxes by Mortgage Status in North Brentwood
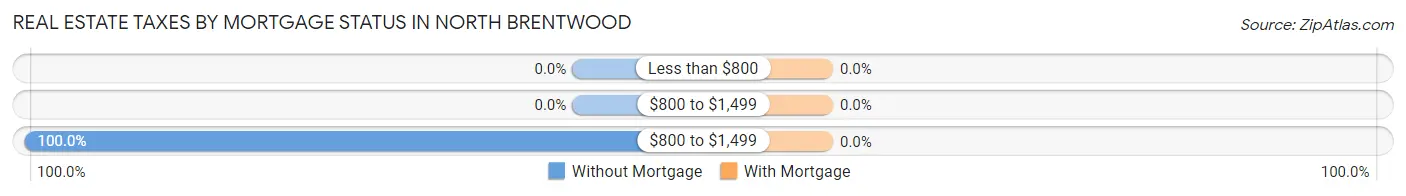
| Property Taxes | Without Mortgage | With Mortgage |
| Less than $800 | 0 (0.0%) | 0 (0.0%) |
| $800 to $1,499 | 0 (0.0%) | 0 (0.0%) |
| $800 to $1,499 | 52 (100.0%) | 0 (0.0%) |
| Total | 52 (100.0%) | 148 (100.0%) |
Health & Disability in North Brentwood
Health Insurance Coverage by Age in North Brentwood
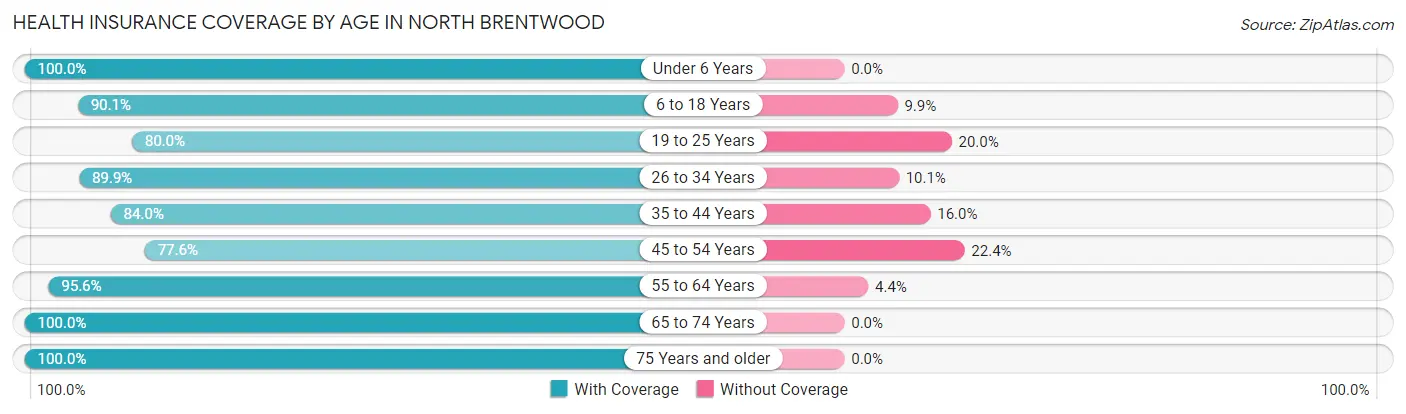
| Age Bracket | With Coverage | Without Coverage |
| Under 6 Years | 81 (100.0%) | 0 (0.0%) |
| 6 to 18 Years | 100 (90.1%) | 11 (9.9%) |
| 19 to 25 Years | 64 (80.0%) | 16 (20.0%) |
| 26 to 34 Years | 62 (89.9%) | 7 (10.1%) |
| 35 to 44 Years | 89 (84.0%) | 17 (16.0%) |
| 45 to 54 Years | 97 (77.6%) | 28 (22.4%) |
| 55 to 64 Years | 86 (95.6%) | 4 (4.4%) |
| 65 to 74 Years | 75 (100.0%) | 0 (0.0%) |
| 75 Years and older | 29 (100.0%) | 0 (0.0%) |
| Total | 683 (89.2%) | 83 (10.8%) |
Health Insurance Coverage by Citizenship Status in North Brentwood
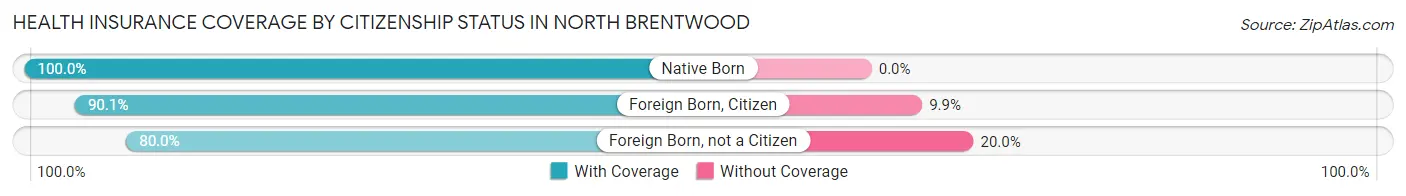
| Citizenship Status | With Coverage | Without Coverage |
| Native Born | 81 (100.0%) | 0 (0.0%) |
| Foreign Born, Citizen | 100 (90.1%) | 11 (9.9%) |
| Foreign Born, not a Citizen | 64 (80.0%) | 16 (20.0%) |
Health Insurance Coverage by Household Income in North Brentwood
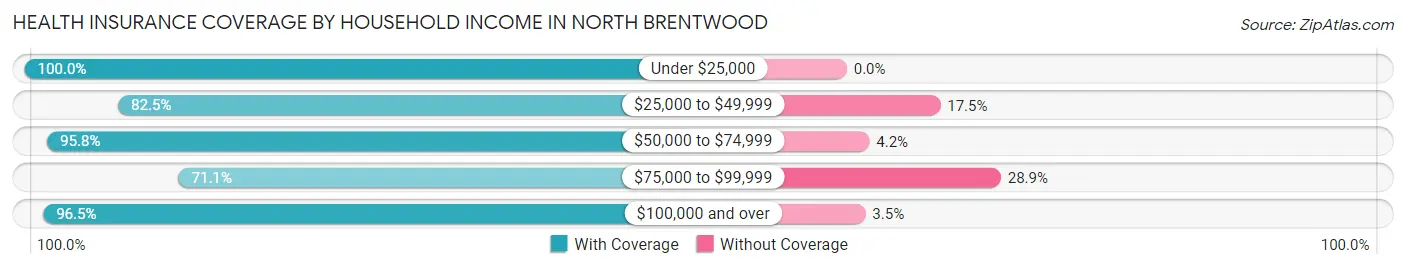
| Household Income | With Coverage | Without Coverage |
| Under $25,000 | 36 (100.0%) | 0 (0.0%) |
| $25,000 to $49,999 | 113 (82.5%) | 24 (17.5%) |
| $50,000 to $74,999 | 68 (95.8%) | 3 (4.2%) |
| $75,000 to $99,999 | 106 (71.1%) | 43 (28.9%) |
| $100,000 and over | 360 (96.5%) | 13 (3.5%) |
Public vs Private Health Insurance Coverage by Age in North Brentwood
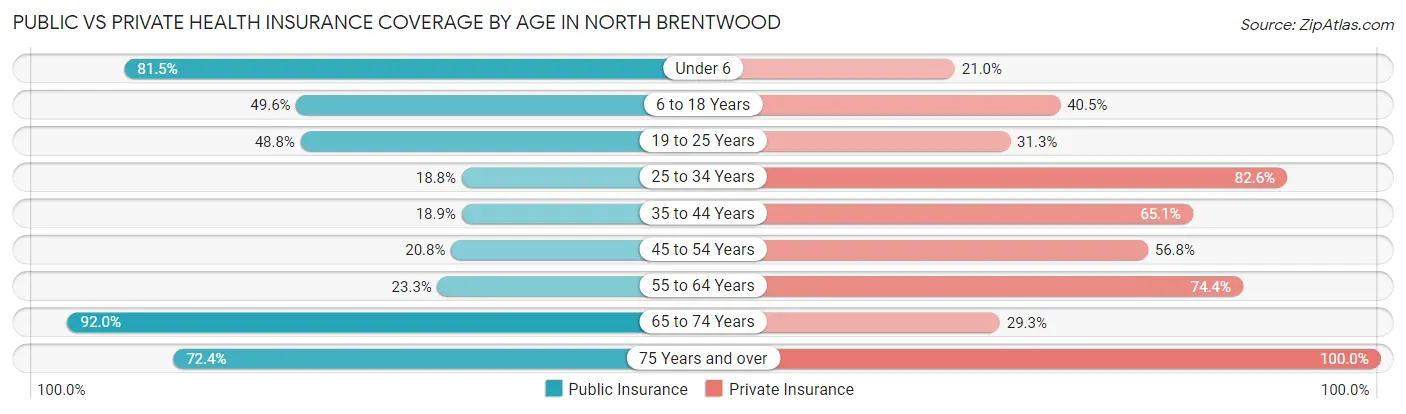
| Age Bracket | Public Insurance | Private Insurance |
| Under 6 | 66 (81.5%) | 17 (21.0%) |
| 6 to 18 Years | 55 (49.5%) | 45 (40.5%) |
| 19 to 25 Years | 39 (48.7%) | 25 (31.2%) |
| 25 to 34 Years | 13 (18.8%) | 57 (82.6%) |
| 35 to 44 Years | 20 (18.9%) | 69 (65.1%) |
| 45 to 54 Years | 26 (20.8%) | 71 (56.8%) |
| 55 to 64 Years | 21 (23.3%) | 67 (74.4%) |
| 65 to 74 Years | 69 (92.0%) | 22 (29.3%) |
| 75 Years and over | 21 (72.4%) | 29 (100.0%) |
| Total | 330 (43.1%) | 402 (52.5%) |
Disability Status by Sex by Age in North Brentwood
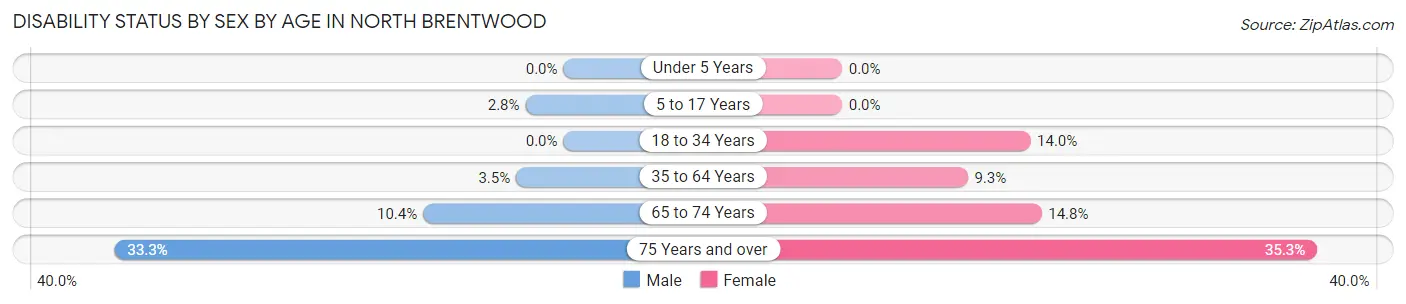
| Age Bracket | Male | Female |
| Under 5 Years | 0 (0.0%) | 0 (0.0%) |
| 5 to 17 Years | 2 (2.8%) | 0 (0.0%) |
| 18 to 34 Years | 0 (0.0%) | 13 (14.0%) |
| 35 to 64 Years | 6 (3.5%) | 14 (9.3%) |
| 65 to 74 Years | 5 (10.4%) | 4 (14.8%) |
| 75 Years and over | 4 (33.3%) | 6 (35.3%) |
Disability Class by Sex by Age in North Brentwood
Disability Class: Hearing Difficulty
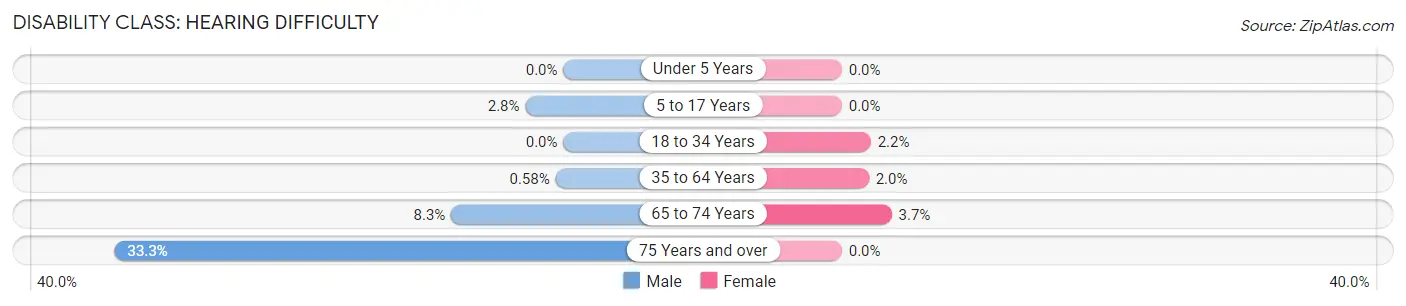
| Age Bracket | Male | Female |
| Under 5 Years | 0 (0.0%) | 0 (0.0%) |
| 5 to 17 Years | 2 (2.8%) | 0 (0.0%) |
| 18 to 34 Years | 0 (0.0%) | 2 (2.1%) |
| 35 to 64 Years | 1 (0.6%) | 3 (2.0%) |
| 65 to 74 Years | 4 (8.3%) | 1 (3.7%) |
| 75 Years and over | 4 (33.3%) | 0 (0.0%) |
Disability Class: Vision Difficulty
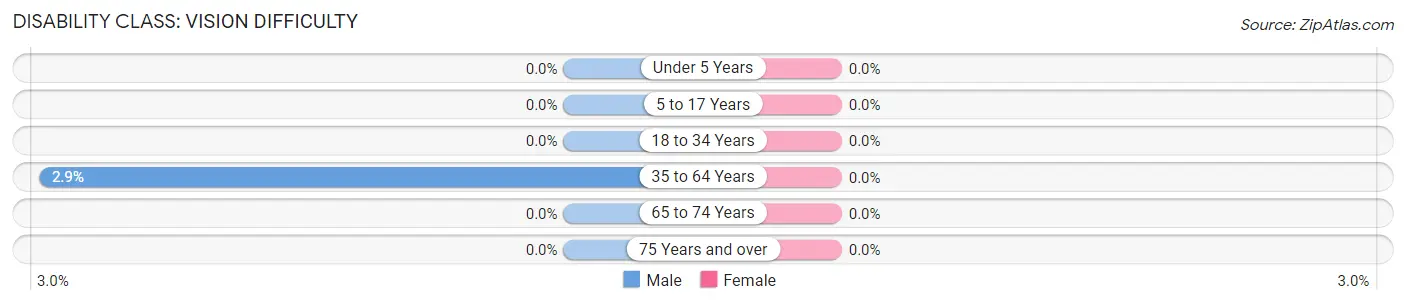
| Age Bracket | Male | Female |
| Under 5 Years | 0 (0.0%) | 0 (0.0%) |
| 5 to 17 Years | 0 (0.0%) | 0 (0.0%) |
| 18 to 34 Years | 0 (0.0%) | 0 (0.0%) |
| 35 to 64 Years | 5 (2.9%) | 0 (0.0%) |
| 65 to 74 Years | 0 (0.0%) | 0 (0.0%) |
| 75 Years and over | 0 (0.0%) | 0 (0.0%) |
Disability Class: Cognitive Difficulty
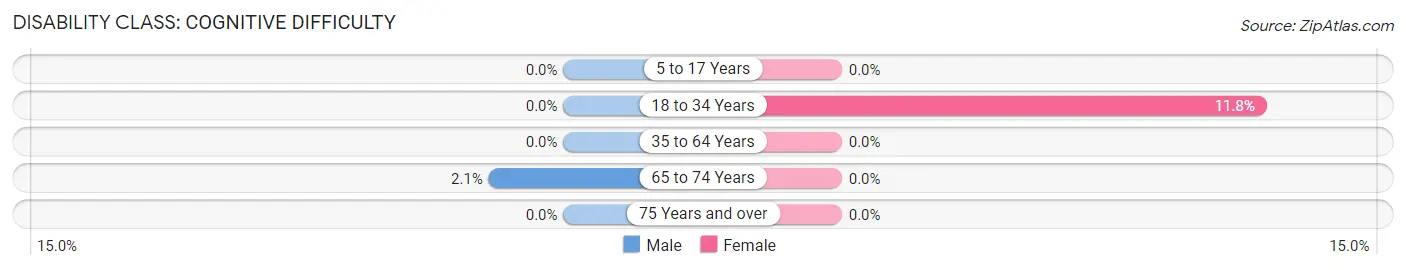
| Age Bracket | Male | Female |
| 5 to 17 Years | 0 (0.0%) | 0 (0.0%) |
| 18 to 34 Years | 0 (0.0%) | 11 (11.8%) |
| 35 to 64 Years | 0 (0.0%) | 0 (0.0%) |
| 65 to 74 Years | 1 (2.1%) | 0 (0.0%) |
| 75 Years and over | 0 (0.0%) | 0 (0.0%) |
Disability Class: Ambulatory Difficulty
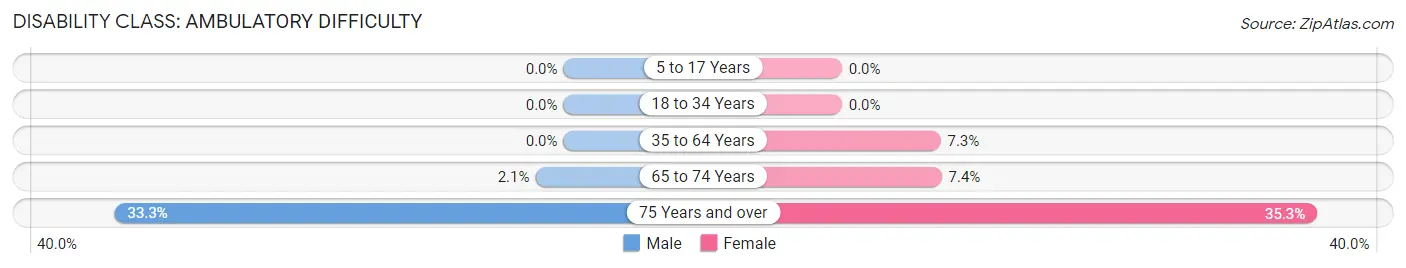
| Age Bracket | Male | Female |
| 5 to 17 Years | 0 (0.0%) | 0 (0.0%) |
| 18 to 34 Years | 0 (0.0%) | 0 (0.0%) |
| 35 to 64 Years | 0 (0.0%) | 11 (7.3%) |
| 65 to 74 Years | 1 (2.1%) | 2 (7.4%) |
| 75 Years and over | 4 (33.3%) | 6 (35.3%) |
Disability Class: Self-Care Difficulty
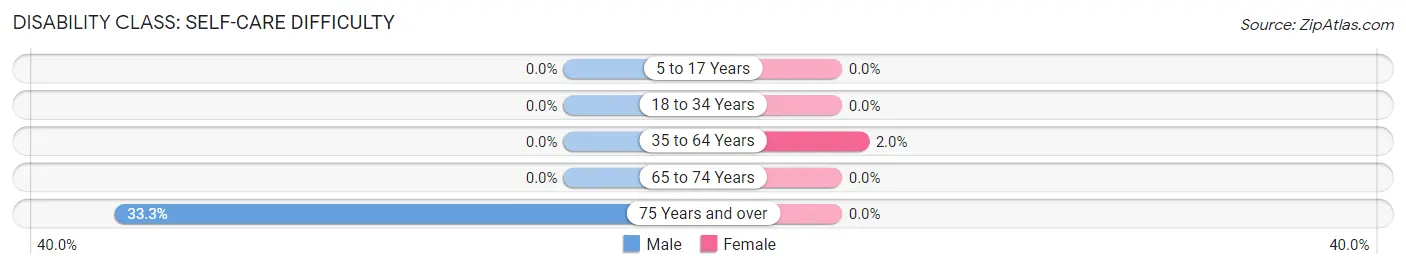
| Age Bracket | Male | Female |
| 5 to 17 Years | 0 (0.0%) | 0 (0.0%) |
| 18 to 34 Years | 0 (0.0%) | 0 (0.0%) |
| 35 to 64 Years | 0 (0.0%) | 3 (2.0%) |
| 65 to 74 Years | 0 (0.0%) | 0 (0.0%) |
| 75 Years and over | 4 (33.3%) | 0 (0.0%) |
Technology Access in North Brentwood
Computing Device Access in North Brentwood
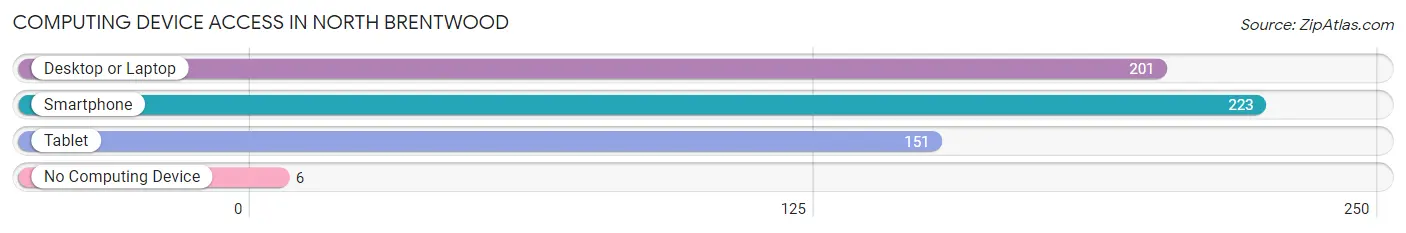
| Device Type | # Households | % Households |
| Desktop or Laptop | 201 | 82.0% |
| Smartphone | 223 | 91.0% |
| Tablet | 151 | 61.6% |
| No Computing Device | 6 | 2.5% |
| Total | 245 | 100.0% |
Internet Access in North Brentwood
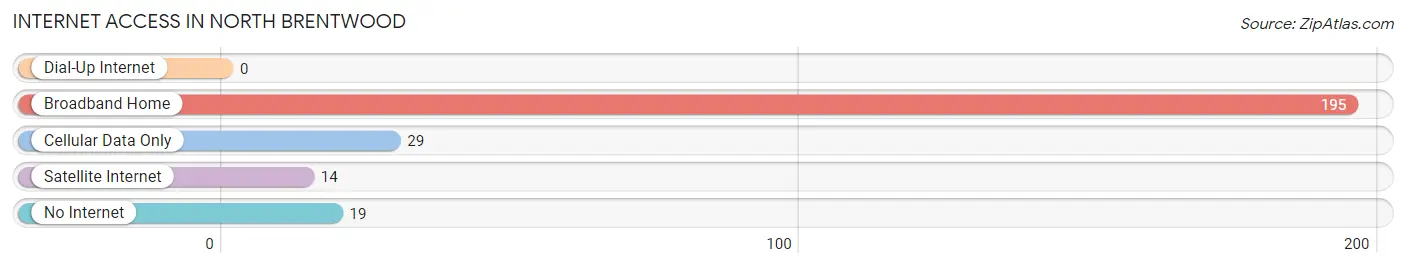
| Internet Type | # Households | % Households |
| Dial-Up Internet | 0 | 0.0% |
| Broadband Home | 195 | 79.6% |
| Cellular Data Only | 29 | 11.8% |
| Satellite Internet | 14 | 5.7% |
| No Internet | 19 | 7.8% |
| Total | 245 | 100.0% |
North Brentwood Summary
History
North Brentwood is a small town located in Prince George’s County, Maryland. It is located just outside of Washington, D.C. and is part of the Washington metropolitan area. The town was founded in 1877 and was originally known as “Brentwood”. The name was changed to “North Brentwood” in 1891 to distinguish it from the nearby town of Brentwood, Maryland.
North Brentwood was originally a farming community, but it began to grow in the early 20th century as Washington, D.C. expanded. The town was incorporated in 1924 and was the first African-American municipality in Prince George’s County. The town was home to a number of prominent African-American leaders, including Mary Church Terrell, who was the first president of the National Association of Colored Women.
Geography
North Brentwood is located in Prince George’s County, Maryland. It is situated just outside of Washington, D.C. and is part of the Washington metropolitan area. The town is bordered by the towns of Brentwood, Hyattsville, and Colmar Manor. The town is located on the banks of the Anacostia River and is approximately 5 miles from the center of Washington, D.C.
The town has a total area of 0.4 square miles, all of which is land. The town is located at an elevation of approximately 100 feet above sea level. The climate in North Brentwood is classified as humid subtropical, with hot, humid summers and mild winters.
Economy
North Brentwood has a small but vibrant economy. The town is home to a number of small businesses, including restaurants, retail stores, and professional services. The town is also home to a number of government offices, including the Prince George’s County Department of Social Services and the Maryland Department of Transportation.
The town is also home to a number of educational institutions, including the University of Maryland University College and the Prince George’s Community College. The town is also home to a number of churches, including the historic Mount Zion United Methodist Church.
Demographics
As of the 2010 census, the population of North Brentwood was 1,922. The racial makeup of the town was 79.3% African American, 15.2% White, 1.2% Asian, 0.2% Native American, and 4.1% from other races. The median household income in the town was $45,938, and the median family income was $50,938. The per capita income in the town was $20,938.
The town is served by the Prince George’s County Public Schools system. The town is home to the North Brentwood Elementary School, which serves students in grades K-5. The town is also home to the Prince George’s Community College, which offers a variety of educational programs.
Conclusion
North Brentwood is a small town located in Prince George’s County, Maryland. It is located just outside of Washington, D.C. and is part of the Washington metropolitan area. The town was founded in 1877 and was originally known as “Brentwood”. The town has a small but vibrant economy and is home to a number of small businesses, government offices, educational institutions, and churches. The population of North Brentwood was 1,922 as of the 2010 census, and the racial makeup of the town was 79.3% African American, 15.2% White, 1.2% Asian, 0.2% Native American, and 4.1% from other races. The town is served by the Prince George’s County Public Schools system and is home to the North Brentwood Elementary School and the Prince George’s Community College.
Common Questions
What is Per Capita Income in North Brentwood?
Per Capita income in North Brentwood is $35,616.
What is the Median Family Income in North Brentwood?
Median Family Income in North Brentwood is $92,500.
What is the Median Household income in North Brentwood?
Median Household Income in North Brentwood is $90,104.
What is Income or Wage Gap in North Brentwood?
Income or Wage Gap in North Brentwood is 39.6%.
Women in North Brentwood earn 60.4 cents for every dollar earned by a man.
What is Inequality or Gini Index in North Brentwood?
Inequality or Gini Index in North Brentwood is 0.38.
What is the Total Population of North Brentwood?
Total Population of North Brentwood is 766.
What is the Total Male Population of North Brentwood?
Total Male Population of North Brentwood is 392.
What is the Total Female Population of North Brentwood?
Total Female Population of North Brentwood is 374.
What is the Ratio of Males per 100 Females in North Brentwood?
There are 104.81 Males per 100 Females in North Brentwood.
What is the Ratio of Females per 100 Males in North Brentwood?
There are 95.41 Females per 100 Males in North Brentwood.
What is the Median Population Age in North Brentwood?
Median Population Age in North Brentwood is 38.3 Years.
What is the Average Family Size in North Brentwood
Average Family Size in North Brentwood is 3.5 People.
What is the Average Household Size in North Brentwood
Average Household Size in North Brentwood is 3.1 People.
How Large is the Labor Force in North Brentwood?
There are 438 People in the Labor Forcein in North Brentwood.
What is the Percentage of People in the Labor Force in North Brentwood?
73.5% of People are in the Labor Force in North Brentwood.
What is the Unemployment Rate in North Brentwood?
Unemployment Rate in North Brentwood is 6.8%.