Bagtown, MD Map & Demographics
Bagtown Map
Bagtown Overview
$37,667
PER CAPITA INCOME
$125,329
AVG FAMILY INCOME
$122,083
AVG HOUSEHOLD INCOME
0.27
INEQUALITY / GINI INDEX
521
TOTAL POPULATION
282
MALE POPULATION
239
FEMALE POPULATION
117.99
MALES / 100 FEMALES
84.75
FEMALES / 100 MALES
36.2
MEDIAN AGE
3.0
AVG FAMILY SIZE
3.6
AVG HOUSEHOLD SIZE
274
LABOR FORCE [ PEOPLE ]
67.7%
PERCENT IN LABOR FORCE
2.6%
UNEMPLOYMENT RATE
Income in Bagtown
Income Overview in Bagtown
Per Capita Income in Bagtown is $37,667, while median incomes of families and households are $125,329 and $122,083 respectively.
| Characteristic | Number | Measure |
| Per Capita Income | 521 | $37,667 |
| Median Family Income | 135 | $125,329 |
| Mean Family Income | 135 | $126,771 |
| Median Household Income | 144 | $122,083 |
| Mean Household Income | 144 | $123,950 |
| Income Deficit | 135 | $0 |
| Wage / Income Gap (%) | 521 | 0.00% |
| Wage / Income Gap ($) | 521 | 100.00¢ per $1 |
| Gini / Inequality Index | 521 | 0.27 |
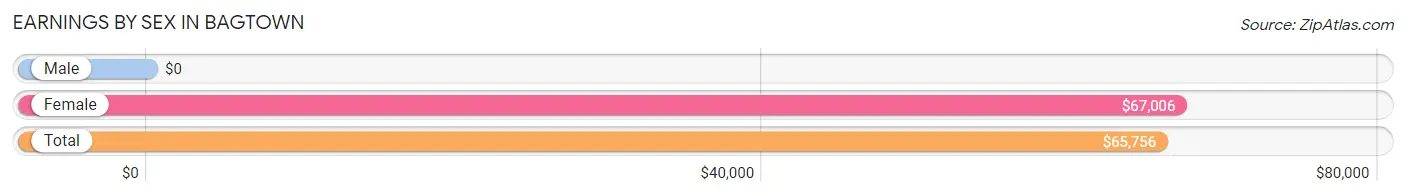
Earnings by Sex in Bagtown
| Sex | Number | Average Earnings |
| Male | 173 (63.1%) | $0 |
| Female | 101 (36.9%) | $67,006 |
| Total | 274 (100.0%) | $65,756 |
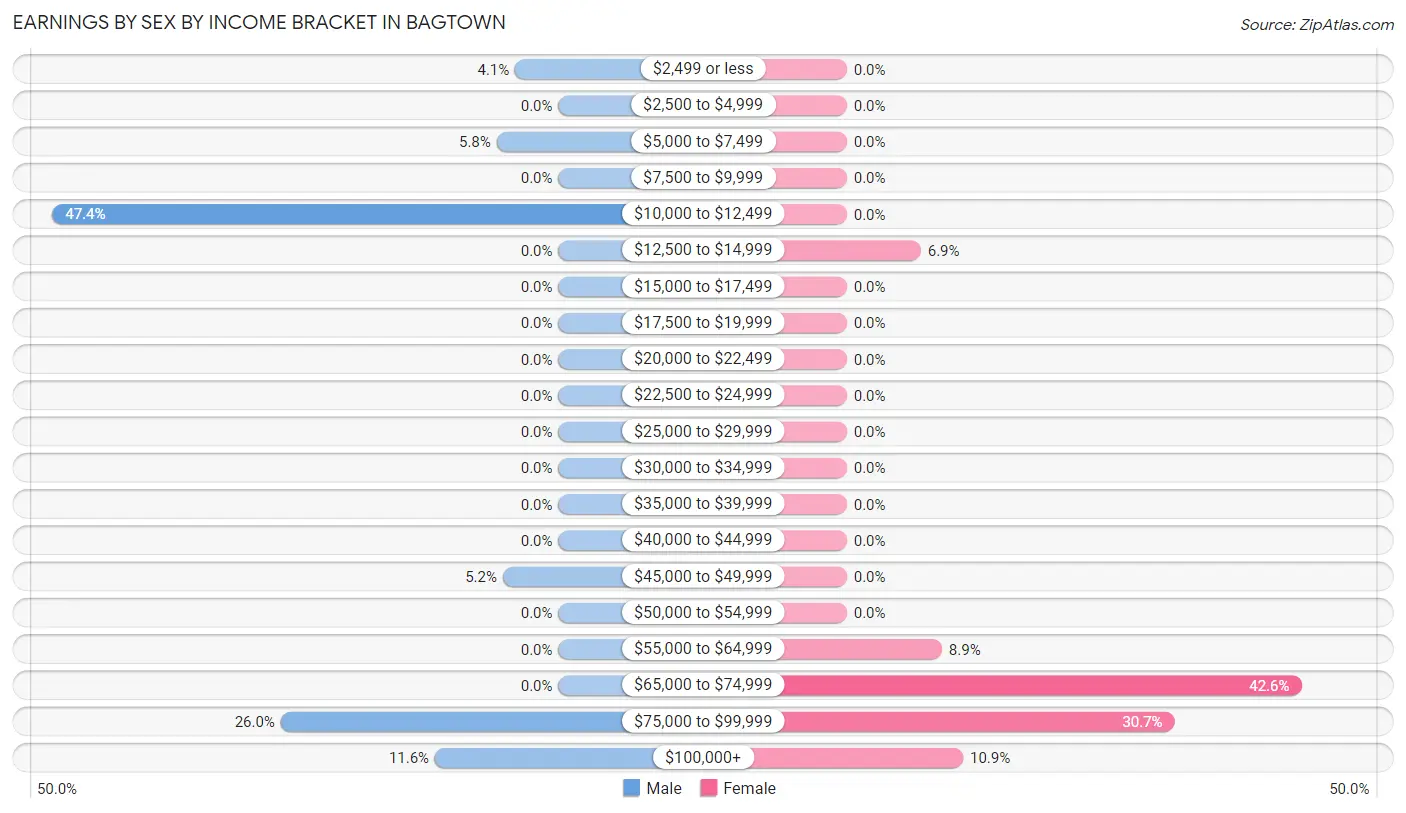
Earnings by Sex by Income Bracket in Bagtown
The most common earnings brackets in Bagtown are $10,000 to $12,499 for men (82 | 47.4%) and $65,000 to $74,999 for women (43 | 42.6%).
| Income | Male | Female |
| $2,499 or less | 7 (4.1%) | 0 (0.0%) |
| $2,500 to $4,999 | 0 (0.0%) | 0 (0.0%) |
| $5,000 to $7,499 | 10 (5.8%) | 0 (0.0%) |
| $7,500 to $9,999 | 0 (0.0%) | 0 (0.0%) |
| $10,000 to $12,499 | 82 (47.4%) | 0 (0.0%) |
| $12,500 to $14,999 | 0 (0.0%) | 7 (6.9%) |
| $15,000 to $17,499 | 0 (0.0%) | 0 (0.0%) |
| $17,500 to $19,999 | 0 (0.0%) | 0 (0.0%) |
| $20,000 to $22,499 | 0 (0.0%) | 0 (0.0%) |
| $22,500 to $24,999 | 0 (0.0%) | 0 (0.0%) |
| $25,000 to $29,999 | 0 (0.0%) | 0 (0.0%) |
| $30,000 to $34,999 | 0 (0.0%) | 0 (0.0%) |
| $35,000 to $39,999 | 0 (0.0%) | 0 (0.0%) |
| $40,000 to $44,999 | 0 (0.0%) | 0 (0.0%) |
| $45,000 to $49,999 | 9 (5.2%) | 0 (0.0%) |
| $50,000 to $54,999 | 0 (0.0%) | 0 (0.0%) |
| $55,000 to $64,999 | 0 (0.0%) | 9 (8.9%) |
| $65,000 to $74,999 | 0 (0.0%) | 43 (42.6%) |
| $75,000 to $99,999 | 45 (26.0%) | 31 (30.7%) |
| $100,000+ | 20 (11.6%) | 11 (10.9%) |
| Total | 173 (100.0%) | 101 (100.0%) |
Earnings by Sex by Educational Attainment in Bagtown
| Educational Attainment | Male Income | Female Income |
| Less than High School | - | - |
| High School Diploma | - | - |
| College or Associate's Degree | - | - |
| Bachelor's Degree | - | - |
| Graduate Degree | - | - |
| Total | - | - |
Family Income in Bagtown
Family Income Brackets in Bagtown
According to the Bagtown family income data, there are 42 families falling into the $150,000 to $199,999 income range, which is the most common income bracket and makes up 31.1% of all families.
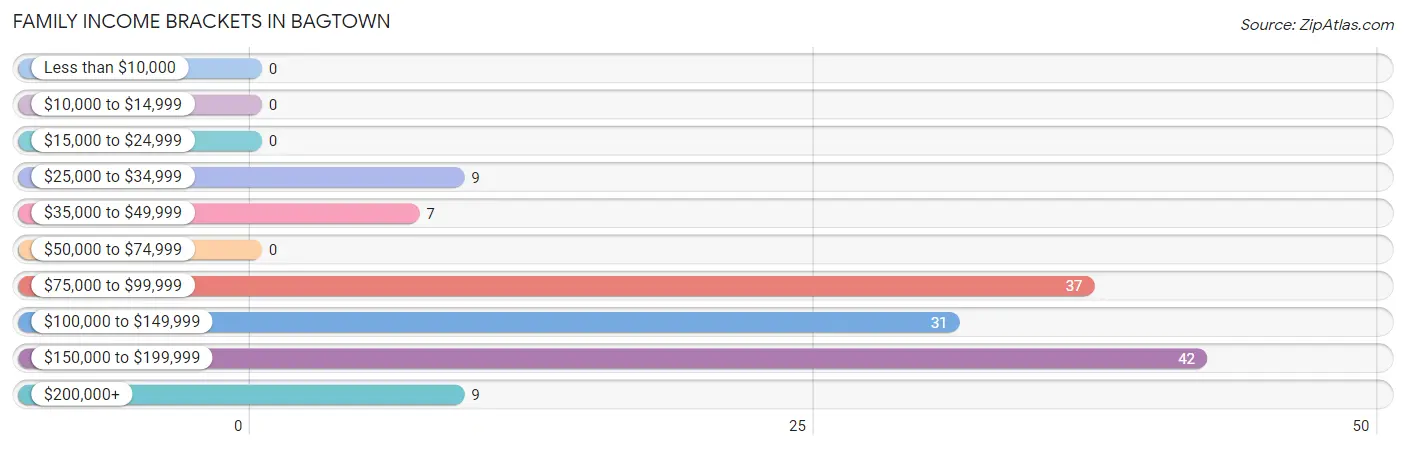
| Income Bracket | # Families | % Families |
| Less than $10,000 | 0 | 0.0% |
| $10,000 to $14,999 | 0 | 0.0% |
| $15,000 to $24,999 | 0 | 0.0% |
| $25,000 to $34,999 | 9 | 6.7% |
| $35,000 to $49,999 | 7 | 5.2% |
| $50,000 to $74,999 | 0 | 0.0% |
| $75,000 to $99,999 | 37 | 27.4% |
| $100,000 to $149,999 | 31 | 23.0% |
| $150,000 to $199,999 | 42 | 31.1% |
| $200,000+ | 9 | 6.7% |
Family Income by Famaliy Size in Bagtown
2-person families (67 | 49.6%) account for the highest median family income in Bagtown with $111,771 per family, while 2-person families (67 | 49.6%) have the highest median income of $55,886 per family member.
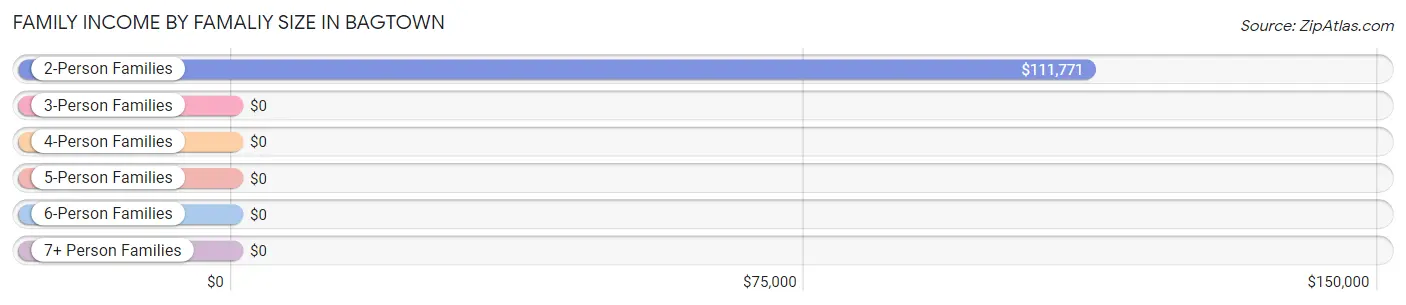
| Income Bracket | # Families | Median Income |
| 2-Person Families | 67 (49.6%) | $111,771 |
| 3-Person Families | 9 (6.7%) | $0 |
| 4-Person Families | 59 (43.7%) | $0 |
| 5-Person Families | 0 (0.0%) | $0 |
| 6-Person Families | 0 (0.0%) | $0 |
| 7+ Person Families | 0 (0.0%) | $0 |
| Total | 135 (100.0%) | $125,329 |
Family Income by Number of Earners in Bagtown
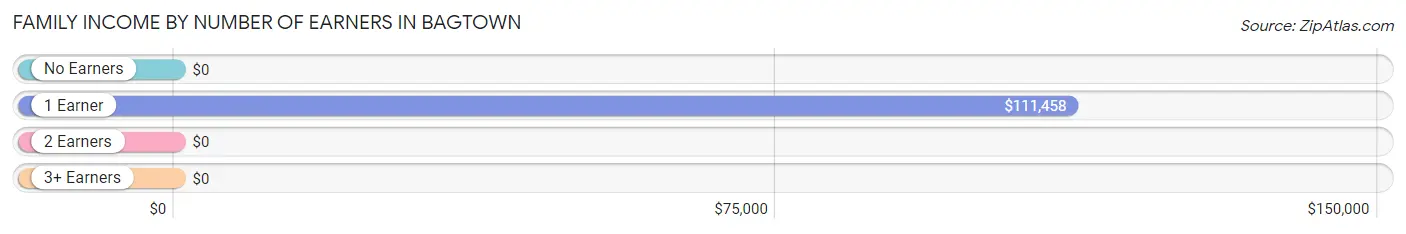
| Number of Earners | # Families | Median Income |
| No Earners | 24 (17.8%) | $0 |
| 1 Earner | 32 (23.7%) | $111,458 |
| 2 Earners | 70 (51.8%) | $0 |
| 3+ Earners | 9 (6.7%) | $0 |
| Total | 135 (100.0%) | $125,329 |
Household Income in Bagtown
Household Income Brackets in Bagtown
With 42 households falling in the category, the $150,000 to $199,999 income range is the most frequent in Bagtown, accounting for 29.2% of all households.
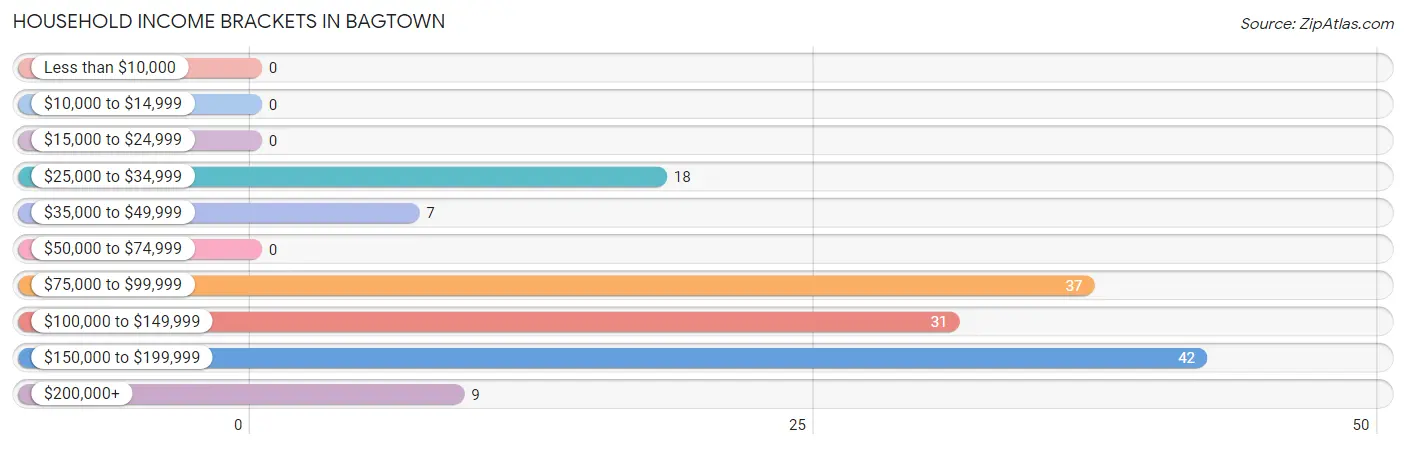
| Income Bracket | # Households | % Households |
| Less than $10,000 | 0 | 0.0% |
| $10,000 to $14,999 | 0 | 0.0% |
| $15,000 to $24,999 | 0 | 0.0% |
| $25,000 to $34,999 | 18 | 12.5% |
| $35,000 to $49,999 | 7 | 4.9% |
| $50,000 to $74,999 | 0 | 0.0% |
| $75,000 to $99,999 | 37 | 25.7% |
| $100,000 to $149,999 | 31 | 21.5% |
| $150,000 to $199,999 | 42 | 29.2% |
| $200,000+ | 9 | 6.3% |
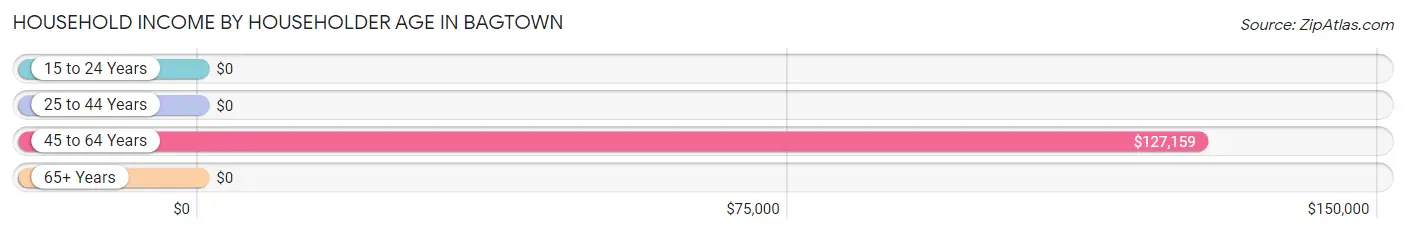
Household Income by Householder Age in Bagtown
The median household income in Bagtown is $122,083, with the highest median household income of $127,159 found in the 45 to 64 years age bracket for the primary householder. A total of 43 households (29.9%) fall into this category.
| Income Bracket | # Households | Median Income |
| 15 to 24 Years | 0 (0.0%) | $0 |
| 25 to 44 Years | 59 (41.0%) | $0 |
| 45 to 64 Years | 43 (29.9%) | $127,159 |
| 65+ Years | 42 (29.2%) | $0 |
| Total | 144 (100.0%) | $122,083 |
Poverty in Bagtown
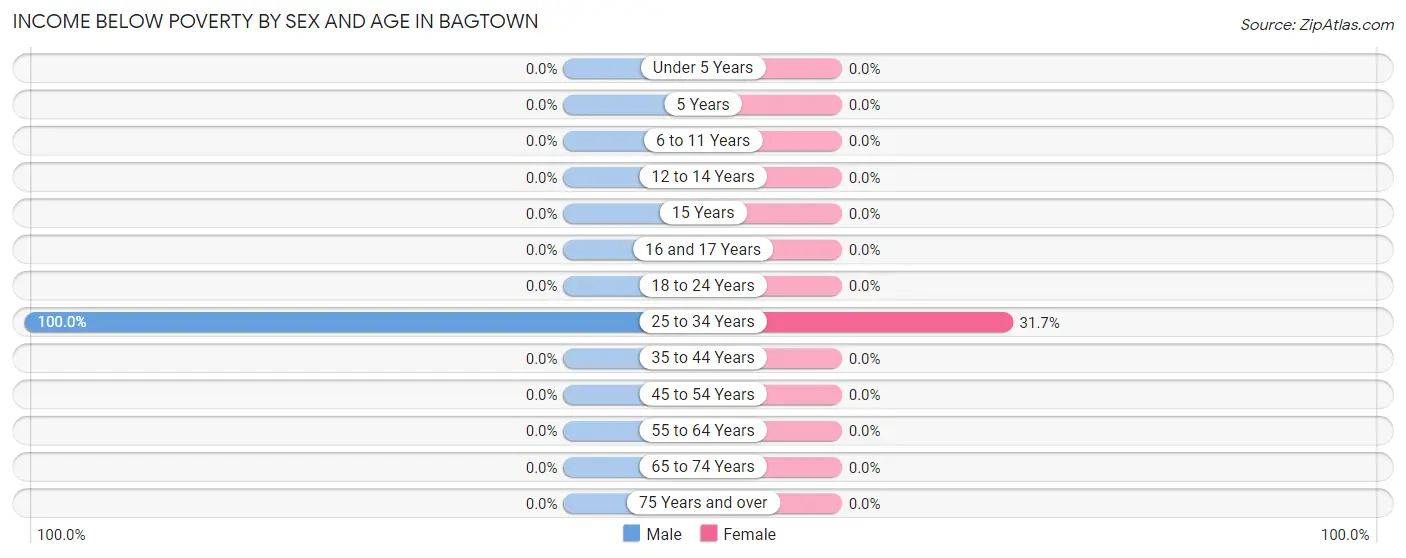
Income Below Poverty by Sex and Age in Bagtown
With 30.5% poverty level for males and 5.4% for females among the residents of Bagtown, 25 to 34 year old males and 25 to 34 year old females are the most vulnerable to poverty, with 82 males (100.0%) and 13 females (31.7%) in their respective age groups living below the poverty level.
| Age Bracket | Male | Female |
| Under 5 Years | 0 (0.0%) | 0 (0.0%) |
| 5 Years | 0 (0.0%) | 0 (0.0%) |
| 6 to 11 Years | 0 (0.0%) | 0 (0.0%) |
| 12 to 14 Years | 0 (0.0%) | 0 (0.0%) |
| 15 Years | 0 (0.0%) | 0 (0.0%) |
| 16 and 17 Years | 0 (0.0%) | 0 (0.0%) |
| 18 to 24 Years | 0 (0.0%) | 0 (0.0%) |
| 25 to 34 Years | 82 (100.0%) | 13 (31.7%) |
| 35 to 44 Years | 0 (0.0%) | 0 (0.0%) |
| 45 to 54 Years | 0 (0.0%) | 0 (0.0%) |
| 55 to 64 Years | 0 (0.0%) | 0 (0.0%) |
| 65 to 74 Years | 0 (0.0%) | 0 (0.0%) |
| 75 Years and over | 0 (0.0%) | 0 (0.0%) |
| Total | 82 (30.5%) | 13 (5.4%) |
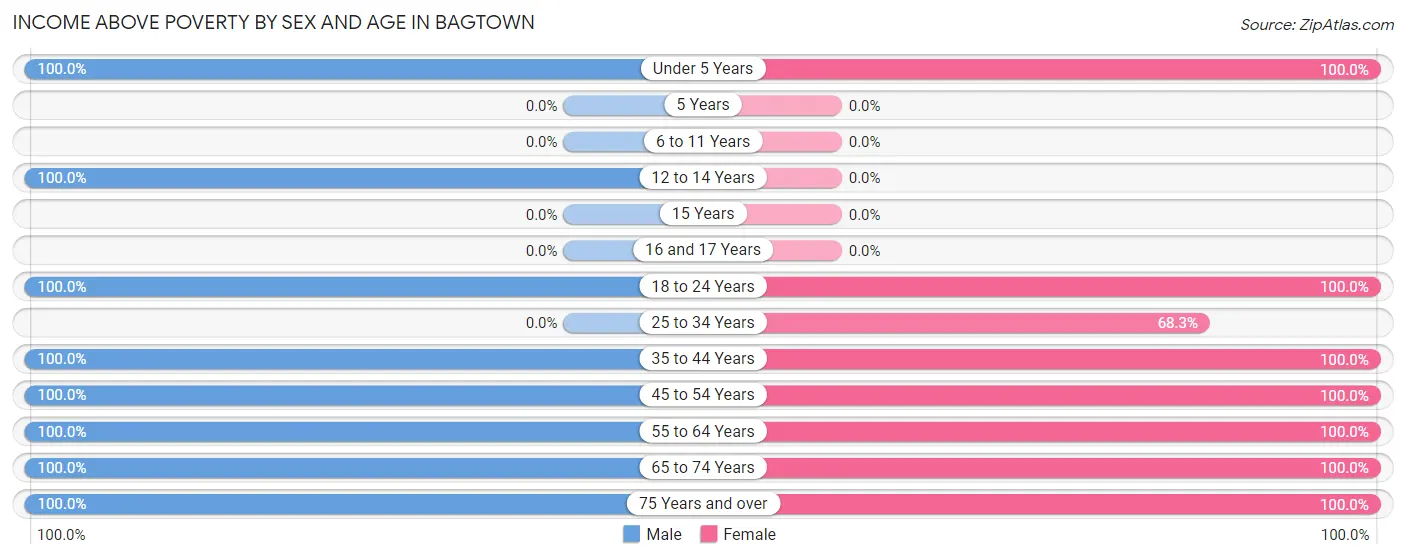
Income Above Poverty by Sex and Age in Bagtown
According to the poverty statistics in Bagtown, males aged under 5 years and females aged under 5 years are the age groups that are most secure financially, with 100.0% of males and 100.0% of females in these age groups living above the poverty line.
| Age Bracket | Male | Female |
| Under 5 Years | 40 (100.0%) | 31 (100.0%) |
| 5 Years | 0 (0.0%) | 0 (0.0%) |
| 6 to 11 Years | 0 (0.0%) | 0 (0.0%) |
| 12 to 14 Years | 32 (100.0%) | 0 (0.0%) |
| 15 Years | 0 (0.0%) | 0 (0.0%) |
| 16 and 17 Years | 0 (0.0%) | 0 (0.0%) |
| 18 to 24 Years | 7 (100.0%) | 7 (100.0%) |
| 25 to 34 Years | 0 (0.0%) | 28 (68.3%) |
| 35 to 44 Years | 32 (100.0%) | 31 (100.0%) |
| 45 to 54 Years | 9 (100.0%) | 9 (100.0%) |
| 55 to 64 Years | 21 (100.0%) | 74 (100.0%) |
| 65 to 74 Years | 29 (100.0%) | 27 (100.0%) |
| 75 Years and over | 17 (100.0%) | 19 (100.0%) |
| Total | 187 (69.5%) | 226 (94.6%) |
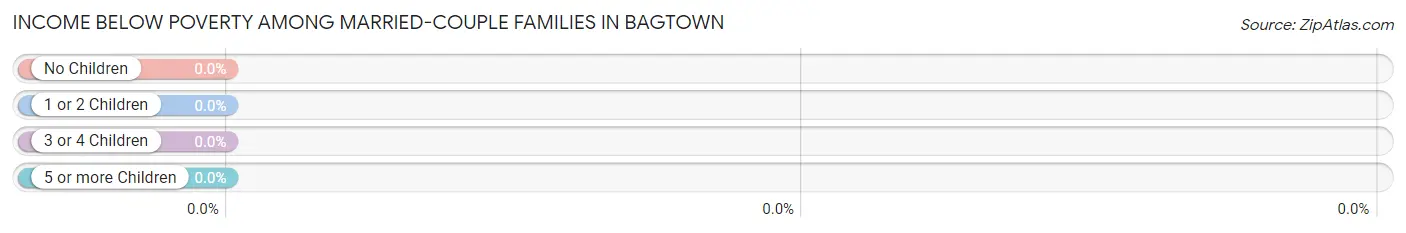
Income Below Poverty Among Married-Couple Families in Bagtown
| Children | Above Poverty | Below Poverty |
| No Children | 76 (100.0%) | 0 (0.0%) |
| 1 or 2 Children | 31 (100.0%) | 0 (0.0%) |
| 3 or 4 Children | 0 (0.0%) | 0 (0.0%) |
| 5 or more Children | 0 (0.0%) | 0 (0.0%) |
| Total | 107 (100.0%) | 0 (0.0%) |
Income Below Poverty Among Single-Parent Households in Bagtown
| Children | Single Father | Single Mother |
| No Children | 0 (0.0%) | 0 (0.0%) |
| 1 or 2 Children | 0 (0.0%) | 0 (0.0%) |
| 3 or 4 Children | 0 (0.0%) | 0 (0.0%) |
| 5 or more Children | 0 (0.0%) | 0 (0.0%) |
| Total | 0 (0.0%) | 0 (0.0%) |
Income Below Poverty Among Married-Couple vs Single-Parent Households in Bagtown
| Children | Married-Couple Families | Single-Parent Households |
| No Children | 0 (0.0%) | 0 (0.0%) |
| 1 or 2 Children | 0 (0.0%) | 0 (0.0%) |
| 3 or 4 Children | 0 (0.0%) | 0 (0.0%) |
| 5 or more Children | 0 (0.0%) | 0 (0.0%) |
| Total | 0 (0.0%) | 0 (0.0%) |
Race in Bagtown
The most populous races in Bagtown are White / Caucasian (342 | 65.6%), Hispanic or Latino (122 | 23.4%), and Two or more Races (97 | 18.6%).
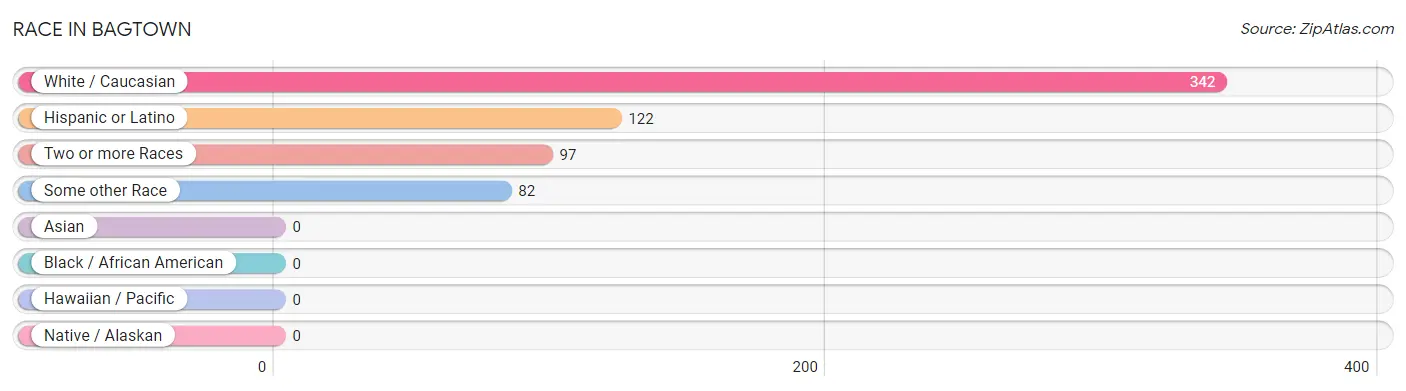
| Race | # Population | % Population |
| Asian | 0 | 0.0% |
| Black / African American | 0 | 0.0% |
| Hawaiian / Pacific | 0 | 0.0% |
| Hispanic or Latino | 122 | 23.4% |
| Native / Alaskan | 0 | 0.0% |
| White / Caucasian | 342 | 65.6% |
| Two or more Races | 97 | 18.6% |
| Some other Race | 82 | 15.7% |
| Total | 521 | 100.0% |
Ancestry in Bagtown
The most populous ancestries reported in Bagtown are German (125 | 24.0%), Central American (122 | 23.4%), Salvadoran (122 | 23.4%), French (95 | 18.2%), and English (36 | 6.9%), together accounting for 96.0% of all Bagtown residents.
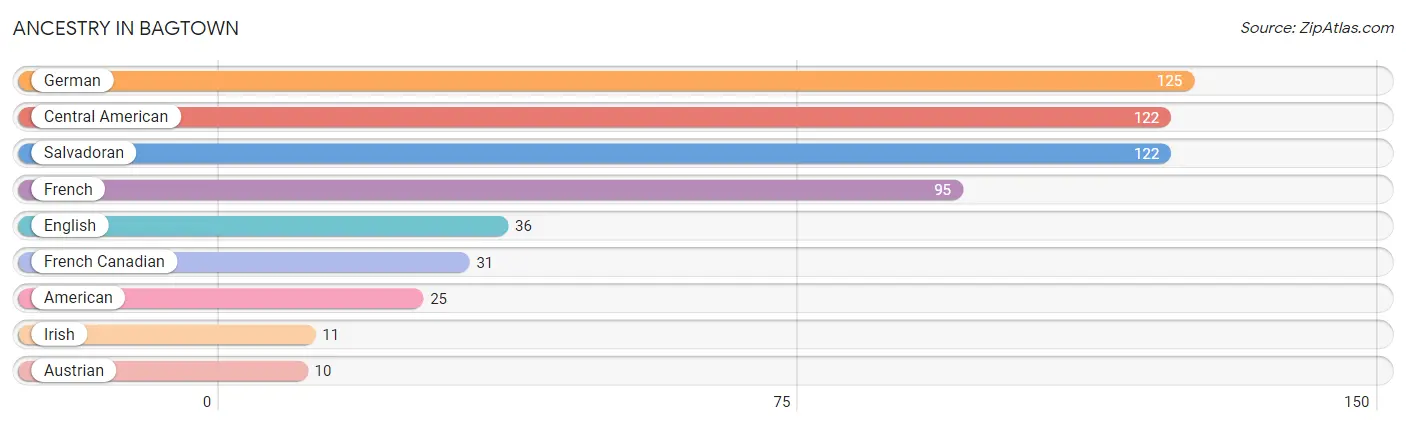
| Ancestry | # Population | % Population |
| American | 25 | 4.8% |
| Austrian | 10 | 1.9% |
| Central American | 122 | 23.4% |
| English | 36 | 6.9% |
| French | 95 | 18.2% |
| French Canadian | 31 | 5.9% |
| German | 125 | 24.0% |
| Irish | 11 | 2.1% |
| Salvadoran | 122 | 23.4% | View All 9 Rows |
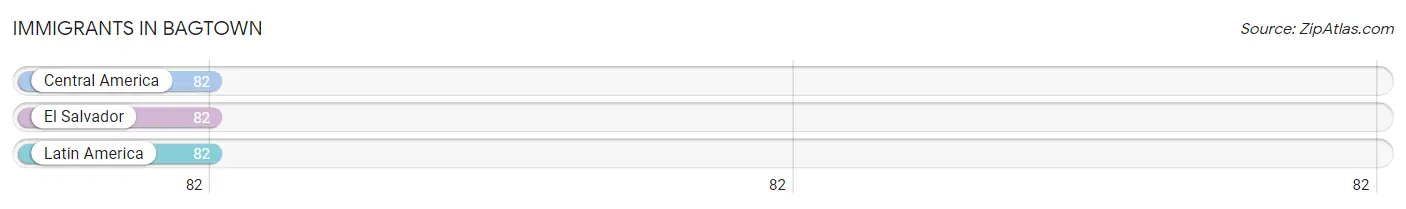
Immigrants in Bagtown
The most numerous immigrant groups reported in Bagtown came from Central America (82 | 15.7%), El Salvador (82 | 15.7%), and Latin America (82 | 15.7%), together accounting for 47.2% of all Bagtown residents.
| Immigration Origin | # Population | % Population |
| Central America | 82 | 15.7% |
| El Salvador | 82 | 15.7% |
| Latin America | 82 | 15.7% | View All 3 Rows |
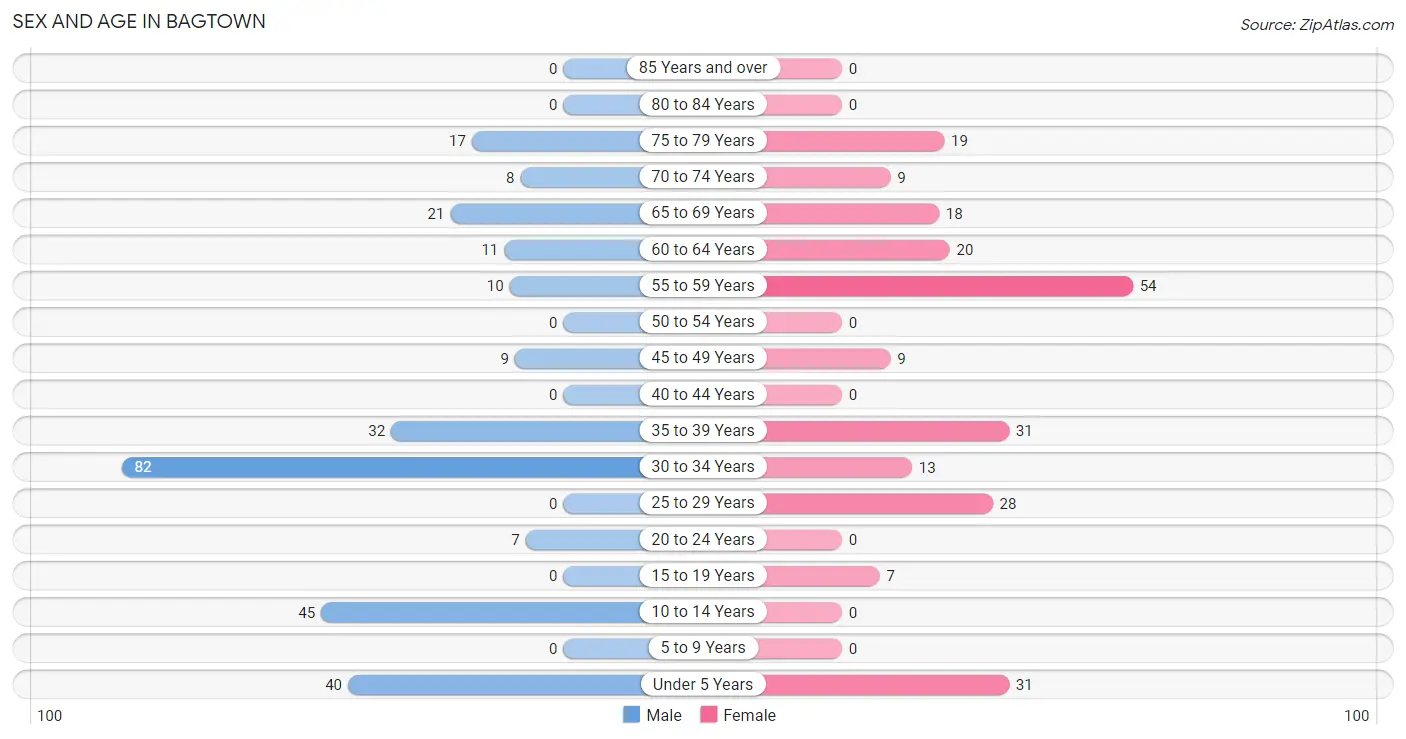
Sex and Age in Bagtown
Sex and Age in Bagtown
The most populous age groups in Bagtown are 30 to 34 Years (82 | 29.1%) for men and 55 to 59 Years (54 | 22.6%) for women.
| Age Bracket | Male | Female |
| Under 5 Years | 40 (14.2%) | 31 (13.0%) |
| 5 to 9 Years | 0 (0.0%) | 0 (0.0%) |
| 10 to 14 Years | 45 (16.0%) | 0 (0.0%) |
| 15 to 19 Years | 0 (0.0%) | 7 (2.9%) |
| 20 to 24 Years | 7 (2.5%) | 0 (0.0%) |
| 25 to 29 Years | 0 (0.0%) | 28 (11.7%) |
| 30 to 34 Years | 82 (29.1%) | 13 (5.4%) |
| 35 to 39 Years | 32 (11.4%) | 31 (13.0%) |
| 40 to 44 Years | 0 (0.0%) | 0 (0.0%) |
| 45 to 49 Years | 9 (3.2%) | 9 (3.8%) |
| 50 to 54 Years | 0 (0.0%) | 0 (0.0%) |
| 55 to 59 Years | 10 (3.5%) | 54 (22.6%) |
| 60 to 64 Years | 11 (3.9%) | 20 (8.4%) |
| 65 to 69 Years | 21 (7.4%) | 18 (7.5%) |
| 70 to 74 Years | 8 (2.8%) | 9 (3.8%) |
| 75 to 79 Years | 17 (6.0%) | 19 (8.0%) |
| 80 to 84 Years | 0 (0.0%) | 0 (0.0%) |
| 85 Years and over | 0 (0.0%) | 0 (0.0%) |
| Total | 282 (100.0%) | 239 (100.0%) |
Families and Households in Bagtown
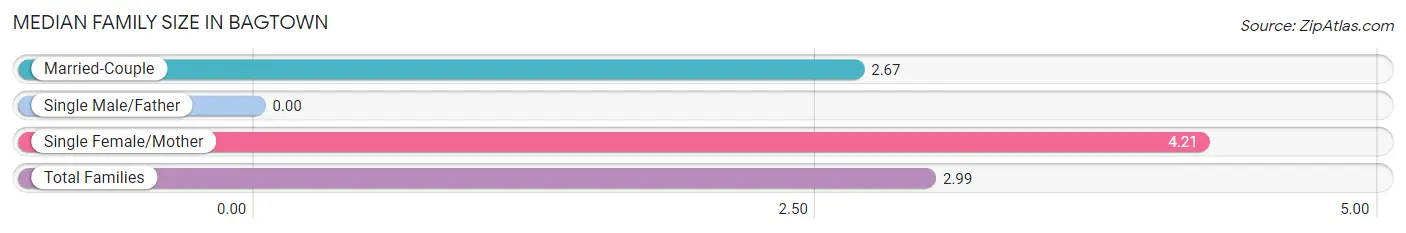
Median Family Size in Bagtown
| Family Type | # Families | Family Size |
| Married-Couple | 107 (79.3%) | 2.67 |
| Single Male/Father | 0 (0.0%) | - |
| Single Female/Mother | 28 (20.7%) | 4.21 |
| Total Families | 135 (100.0%) | 2.99 |
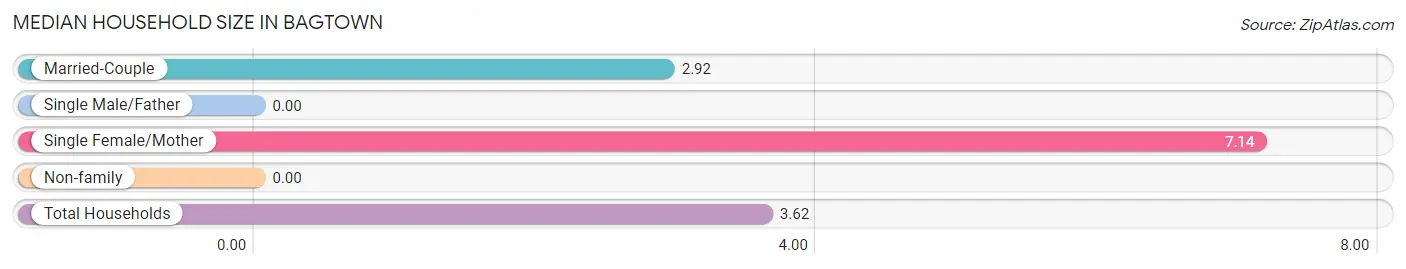
Median Household Size in Bagtown
| Household Type | # Households | Household Size |
| Married-Couple | 107 (74.3%) | 2.92 |
| Single Male/Father | 0 (0.0%) | - |
| Single Female/Mother | 28 (19.4%) | 7.14 |
| Non-family | 9 (6.2%) | - |
| Total Households | 144 (100.0%) | 3.62 |
Household Size by Marriage Status in Bagtown
Out of a total of 144 households in Bagtown, 135 (93.8%) are family households, while 9 (6.2%) are nonfamily households. The most numerous type of family households are 2-person households, comprising 55, and the most common type of nonfamily households are 1-person households, comprising 9.
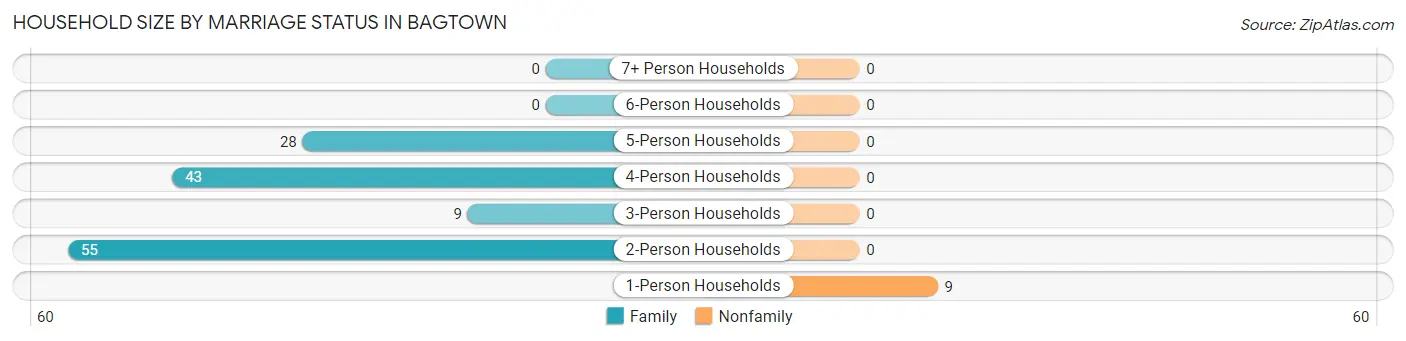
| Household Size | Family Households | Nonfamily Households |
| 1-Person Households | - | 9 (6.2%) |
| 2-Person Households | 55 (38.2%) | 0 (0.0%) |
| 3-Person Households | 9 (6.2%) | 0 (0.0%) |
| 4-Person Households | 43 (29.9%) | 0 (0.0%) |
| 5-Person Households | 28 (19.4%) | 0 (0.0%) |
| 6-Person Households | 0 (0.0%) | 0 (0.0%) |
| 7+ Person Households | 0 (0.0%) | 0 (0.0%) |
| Total | 135 (93.8%) | 9 (6.2%) |
Female Fertility in Bagtown
Fertility by Age in Bagtown
Average fertility rate in Bagtown is 318.0 births per 1,000 women. Women in the age bracket of 20 to 34 years have the highest fertility rate with 683.0 births per 1,000 women. Women in the age bracket of 20 to 34 years acount for 100.0% of all women with births.
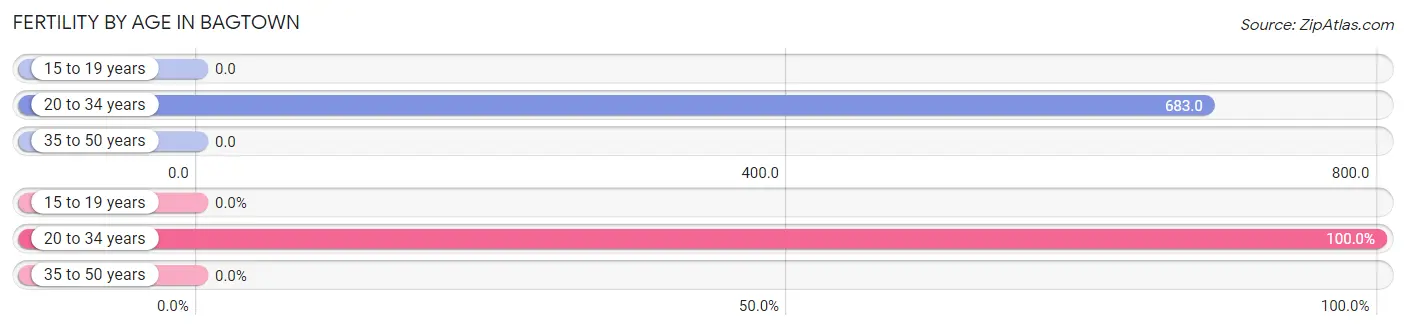
| Age Bracket | Women with Births | Births / 1,000 Women |
| 15 to 19 years | 0 (0.0%) | 0.0 |
| 20 to 34 years | 28 (100.0%) | 683.0 |
| 35 to 50 years | 0 (0.0%) | 0.0 |
| Total | 28 (100.0%) | 318.0 |
Fertility by Age by Marriage Status in Bagtown
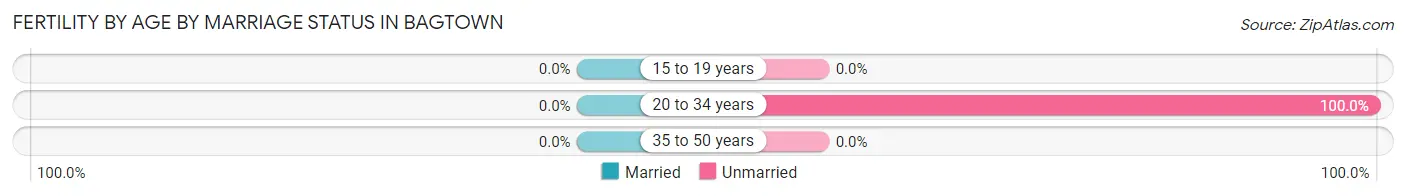
| Age Bracket | Married | Unmarried |
| 15 to 19 years | 0 (0.0%) | 0 (0.0%) |
| 20 to 34 years | 0 (0.0%) | 28 (100.0%) |
| 35 to 50 years | 0 (0.0%) | 0 (0.0%) |
| Total | 0 (0.0%) | 28 (100.0%) |
Fertility by Education in Bagtown
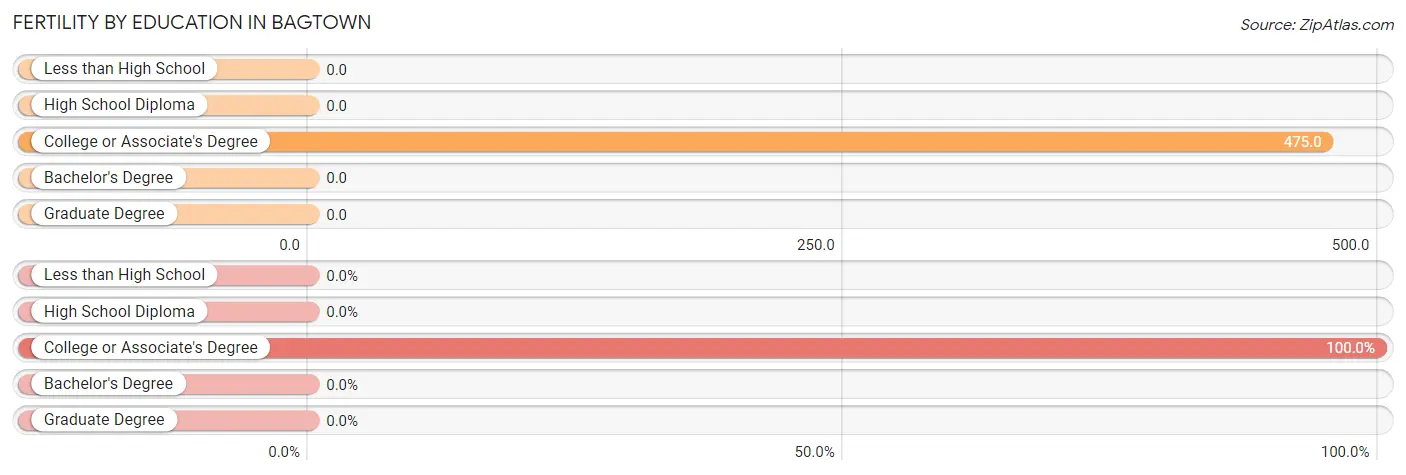
| Educational Attainment | Women with Births | Births / 1,000 Women |
| Less than High School | 0 (0.0%) | 0.0 |
| High School Diploma | 0 (0.0%) | 0.0 |
| College or Associate's Degree | 28 (100.0%) | 475.0 |
| Bachelor's Degree | 0 (0.0%) | 0.0 |
| Graduate Degree | 0 (0.0%) | 0.0 |
| Total | 28 (100.0%) | 318.0 |
Fertility by Education by Marriage Status in Bagtown
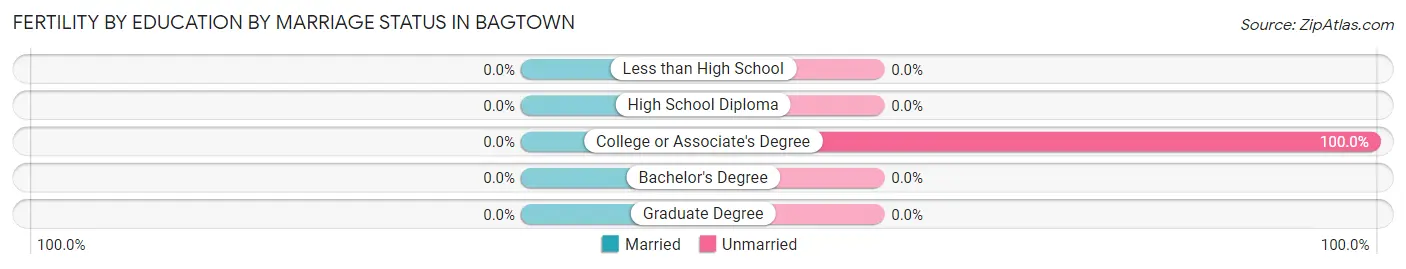
| Educational Attainment | Married | Unmarried |
| Less than High School | 0 (0.0%) | 0 (0.0%) |
| High School Diploma | 0 (0.0%) | 0 (0.0%) |
| College or Associate's Degree | 0 (0.0%) | 28 (100.0%) |
| Bachelor's Degree | 0 (0.0%) | 0 (0.0%) |
| Graduate Degree | 0 (0.0%) | 0 (0.0%) |
| Total | 0 (0.0%) | 28 (100.0%) |
Employment Characteristics in Bagtown
Employment by Class of Employer in Bagtown
Among the 267 employed individuals in Bagtown, private company employees (215 | 80.5%), state government employees (31 | 11.6%), and self-employed (not incorporated) (21 | 7.9%) make up the most common classes of employment.
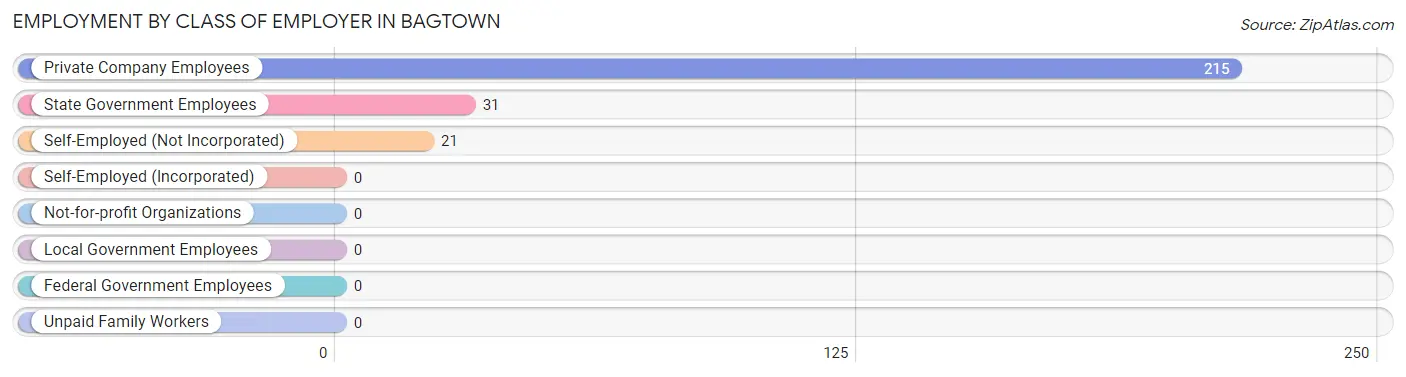
| Employer Class | # Employees | % Employees |
| Private Company Employees | 215 | 80.5% |
| Self-Employed (Incorporated) | 0 | 0.0% |
| Self-Employed (Not Incorporated) | 21 | 7.9% |
| Not-for-profit Organizations | 0 | 0.0% |
| Local Government Employees | 0 | 0.0% |
| State Government Employees | 31 | 11.6% |
| Federal Government Employees | 0 | 0.0% |
| Unpaid Family Workers | 0 | 0.0% |
| Total | 267 | 100.0% |
Employment Status by Age in Bagtown
According to the labor force statistics for Bagtown, out of the total population over 16 years of age (405), 67.7% or 274 individuals are in the labor force, with 2.6% or 7 of them unemployed. The age group with the highest labor force participation rate is 16 to 19 years, with 100.0% or 7 individuals in the labor force. Within the labor force, the 20 to 24 years age range has the highest percentage of unemployed individuals, with 100.0% or 7 of them being unemployed.
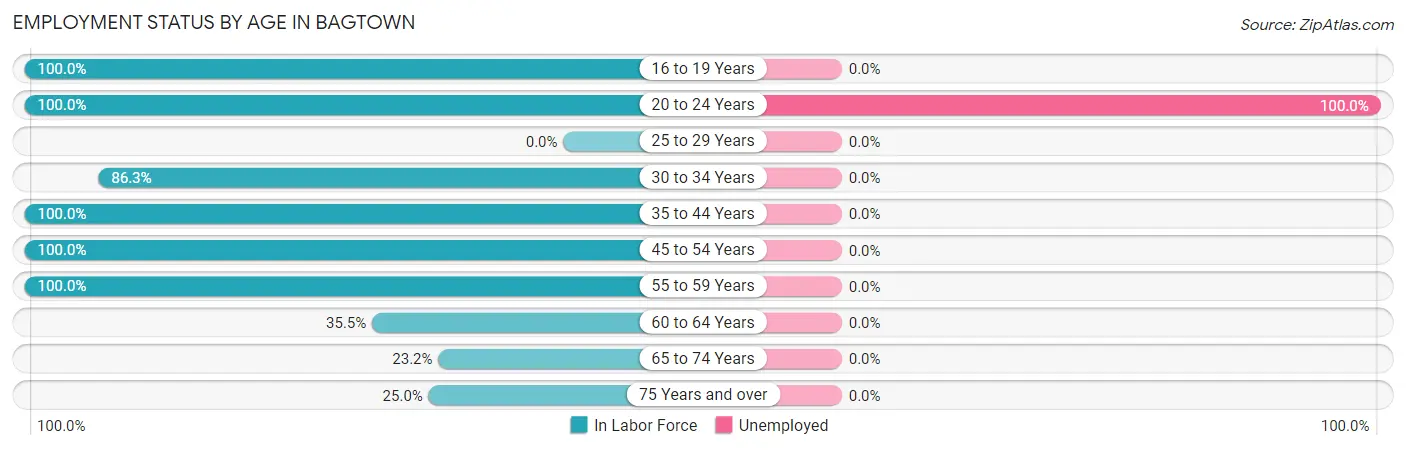
| Age Bracket | In Labor Force | Unemployed |
| 16 to 19 Years | 7 (100.0%) | 0 (0.0%) |
| 20 to 24 Years | 7 (100.0%) | 7 (100.0%) |
| 25 to 29 Years | 0 (0.0%) | 0 (0.0%) |
| 30 to 34 Years | 82 (86.3%) | 0 (0.0%) |
| 35 to 44 Years | 63 (100.0%) | 0 (0.0%) |
| 45 to 54 Years | 18 (100.0%) | 0 (0.0%) |
| 55 to 59 Years | 64 (100.0%) | 0 (0.0%) |
| 60 to 64 Years | 11 (35.5%) | 0 (0.0%) |
| 65 to 74 Years | 13 (23.2%) | 0 (0.0%) |
| 75 Years and over | 9 (25.0%) | 0 (0.0%) |
| Total | 274 (67.7%) | 7 (2.6%) |
Employment Status by Educational Attainment in Bagtown
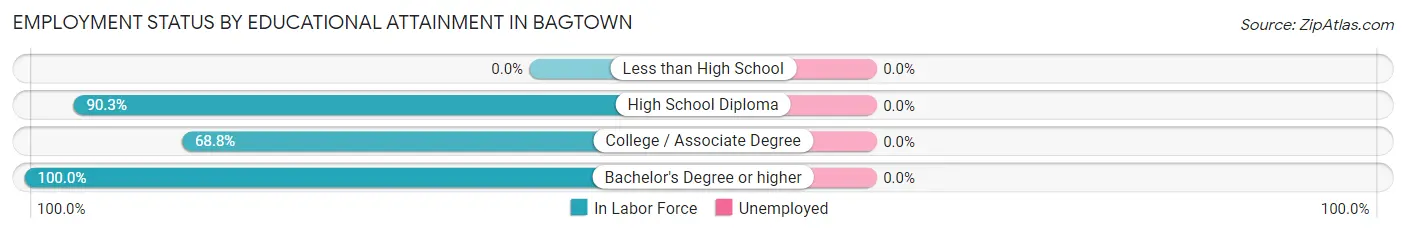
| Educational Attainment | In Labor Force | Unemployed |
| Less than High School | 0 (0.0%) | 0 (0.0%) |
| High School Diploma | 121 (90.3%) | 0 (0.0%) |
| College / Associate Degree | 106 (68.8%) | 0 (0.0%) |
| Bachelor's Degree or higher | 11 (100.0%) | 0 (0.0%) |
| Total | 238 (79.6%) | 0 (0.0%) |
Employment Occupations by Sex in Bagtown
Management, Business, Science and Arts Occupations
The most common Management, Business, Science and Arts occupations in Bagtown are Health Diagnosing & Treating (31 | 11.6%), Health Technologists (31 | 11.6%), and Business & Financial (11 | 4.1%).
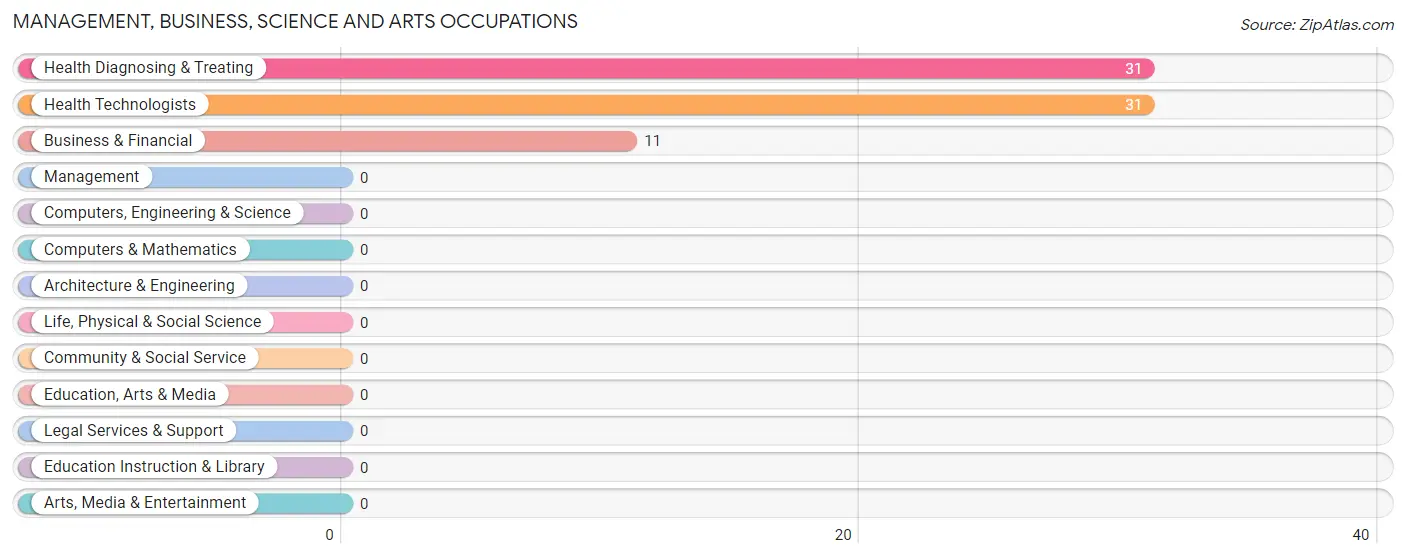
Management, Business, Science and Arts Occupations by Sex
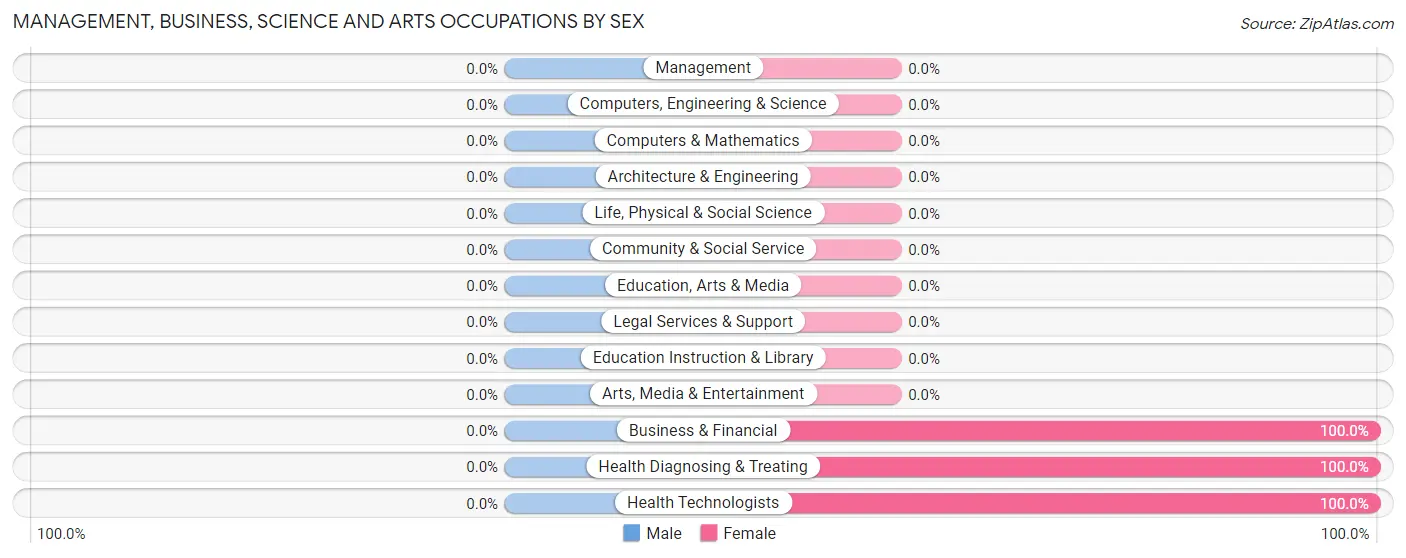
| Occupation | Male | Female |
| Management | 0 (0.0%) | 0 (0.0%) |
| Business & Financial | 0 (0.0%) | 11 (100.0%) |
| Computers, Engineering & Science | 0 (0.0%) | 0 (0.0%) |
| Computers & Mathematics | 0 (0.0%) | 0 (0.0%) |
| Architecture & Engineering | 0 (0.0%) | 0 (0.0%) |
| Life, Physical & Social Science | 0 (0.0%) | 0 (0.0%) |
| Community & Social Service | 0 (0.0%) | 0 (0.0%) |
| Education, Arts & Media | 0 (0.0%) | 0 (0.0%) |
| Legal Services & Support | 0 (0.0%) | 0 (0.0%) |
| Education Instruction & Library | 0 (0.0%) | 0 (0.0%) |
| Arts, Media & Entertainment | 0 (0.0%) | 0 (0.0%) |
| Health Diagnosing & Treating | 0 (0.0%) | 31 (100.0%) |
| Health Technologists | 0 (0.0%) | 31 (100.0%) |
| Total (Category) | 0 (0.0%) | 42 (100.0%) |
| Total (Overall) | 166 (62.2%) | 101 (37.8%) |
Services Occupations
The most common Services occupations in Bagtown are Cleaning & Maintenance (92 | 34.5%), and Food Preparation & Serving (7 | 2.6%).
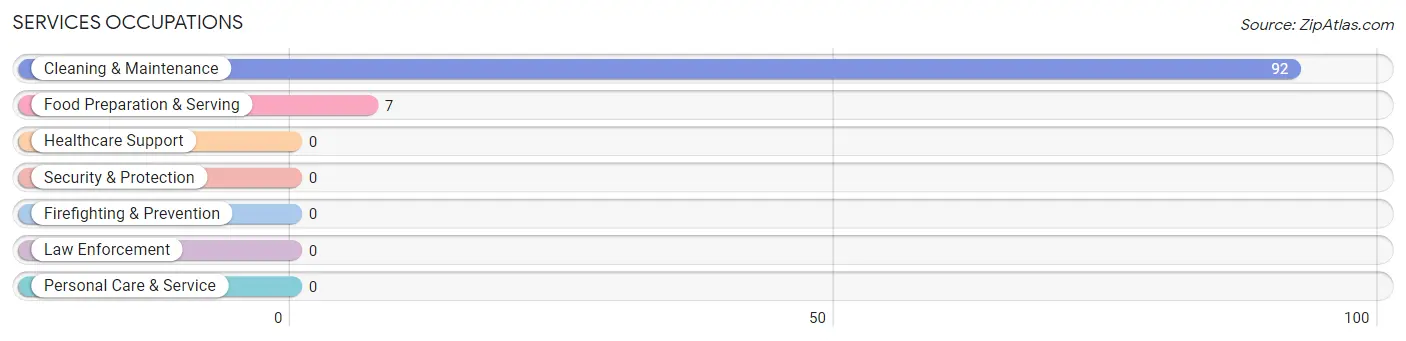
Services Occupations by Sex
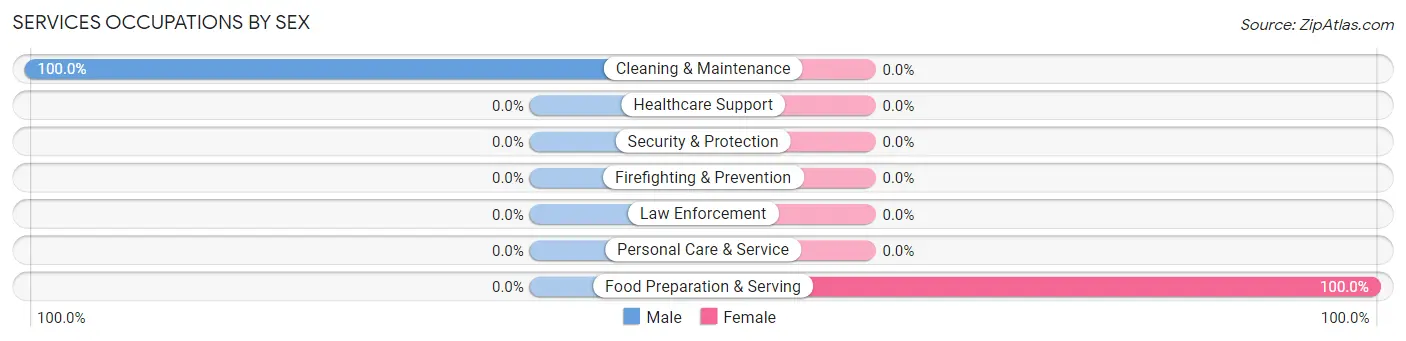
| Occupation | Male | Female |
| Healthcare Support | 0 (0.0%) | 0 (0.0%) |
| Security & Protection | 0 (0.0%) | 0 (0.0%) |
| Firefighting & Prevention | 0 (0.0%) | 0 (0.0%) |
| Law Enforcement | 0 (0.0%) | 0 (0.0%) |
| Food Preparation & Serving | 0 (0.0%) | 7 (100.0%) |
| Cleaning & Maintenance | 92 (100.0%) | 0 (0.0%) |
| Personal Care & Service | 0 (0.0%) | 0 (0.0%) |
| Total (Category) | 92 (92.9%) | 7 (7.1%) |
| Total (Overall) | 166 (62.2%) | 101 (37.8%) |
Sales and Office Occupations
The most common Sales and Office occupations in Bagtown are Office & Administration (56 | 21.0%), and Sales & Related (9 | 3.4%).
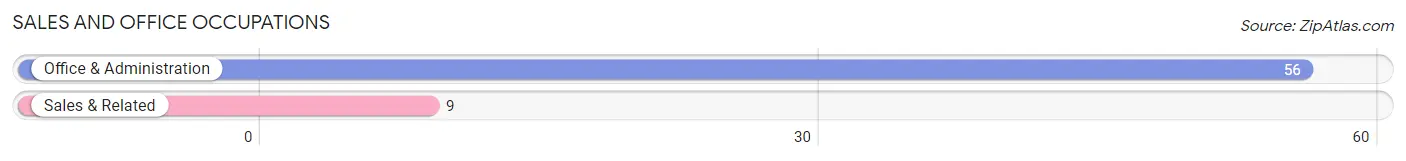
Sales and Office Occupations by Sex

| Occupation | Male | Female |
| Sales & Related | 9 (100.0%) | 0 (0.0%) |
| Office & Administration | 13 (23.2%) | 43 (76.8%) |
| Total (Category) | 22 (33.9%) | 43 (66.1%) |
| Total (Overall) | 166 (62.2%) | 101 (37.8%) |
Natural Resources, Construction and Maintenance Occupations
The most common Natural Resources, Construction and Maintenance occupations in Bagtown are Installation, Maintenance & Repair (32 | 12.0%), and Construction & Extraction (9 | 3.4%).
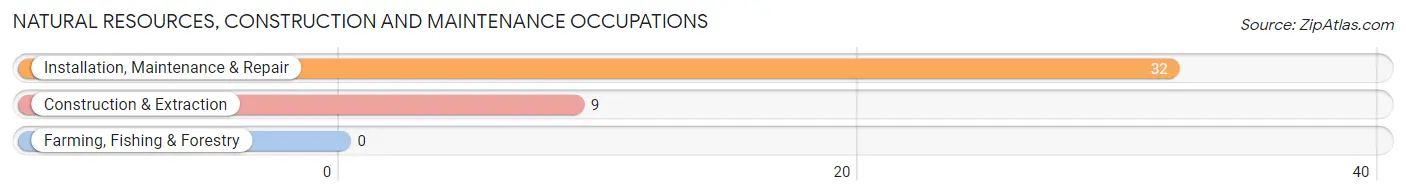
Natural Resources, Construction and Maintenance Occupations by Sex
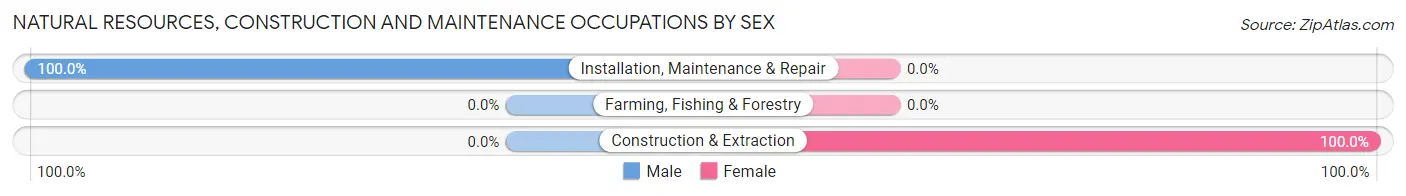
| Occupation | Male | Female |
| Farming, Fishing & Forestry | 0 (0.0%) | 0 (0.0%) |
| Construction & Extraction | 0 (0.0%) | 9 (100.0%) |
| Installation, Maintenance & Repair | 32 (100.0%) | 0 (0.0%) |
| Total (Category) | 32 (78.0%) | 9 (22.0%) |
| Total (Overall) | 166 (62.2%) | 101 (37.8%) |
Production, Transportation and Moving Occupations
The most common Production, Transportation and Moving occupations in Bagtown are Production (11 | 4.1%), and Transportation (9 | 3.4%).
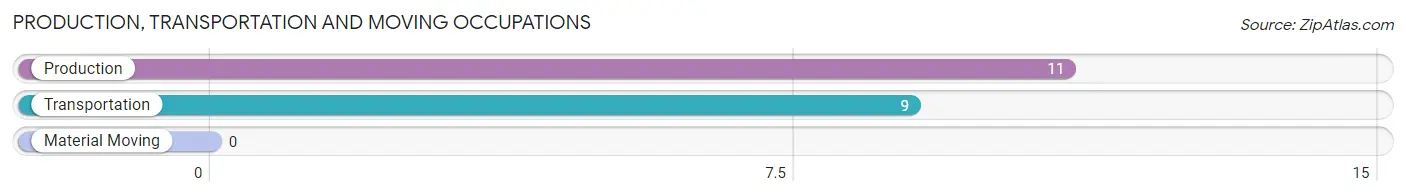
Production, Transportation and Moving Occupations by Sex
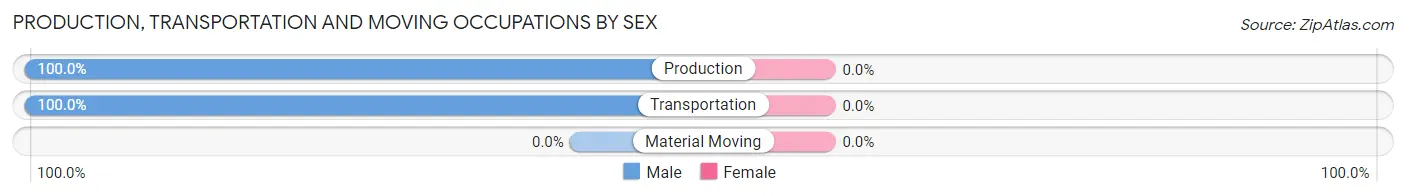
| Occupation | Male | Female |
| Production | 11 (100.0%) | 0 (0.0%) |
| Transportation | 9 (100.0%) | 0 (0.0%) |
| Material Moving | 0 (0.0%) | 0 (0.0%) |
| Total (Category) | 20 (100.0%) | 0 (0.0%) |
| Total (Overall) | 166 (62.2%) | 101 (37.8%) |
Employment Industries by Sex in Bagtown
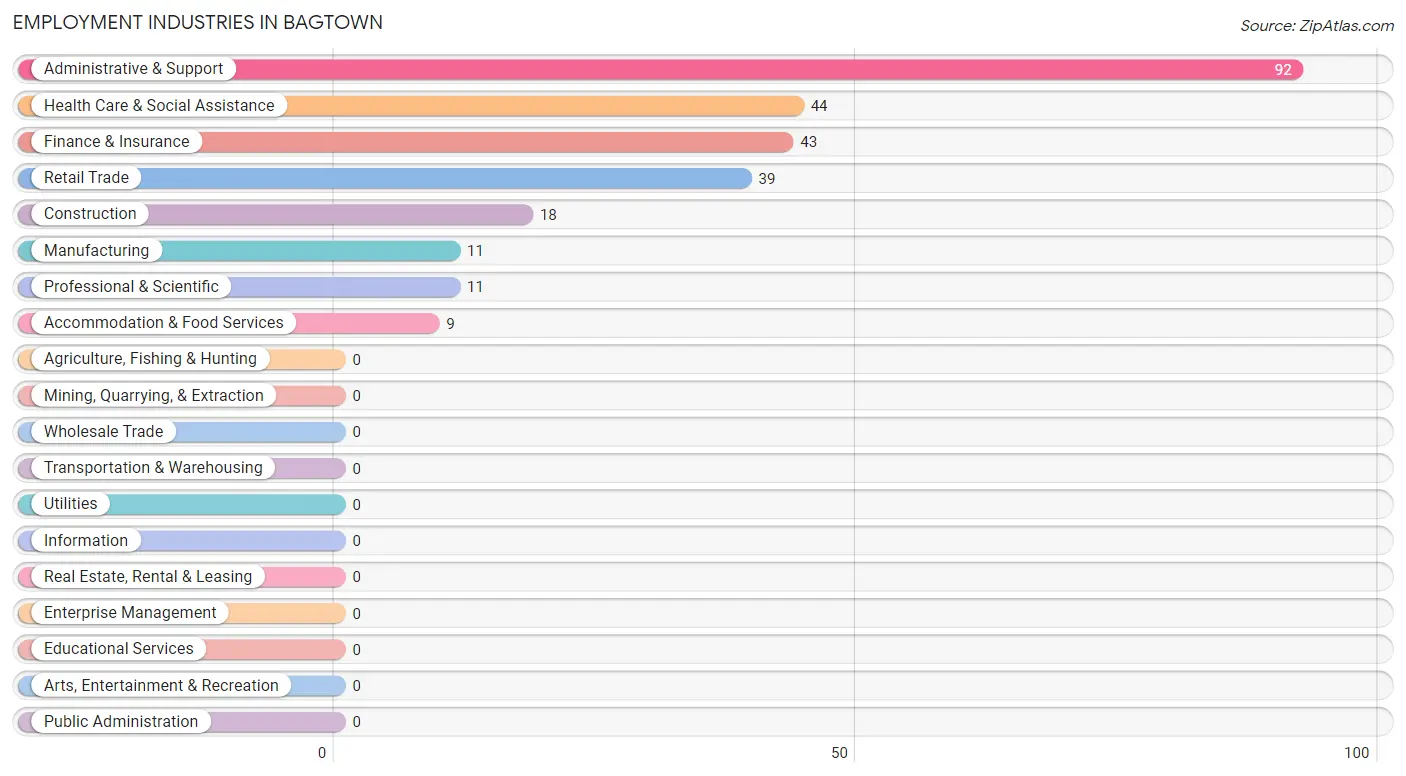
Employment Industries in Bagtown
The major employment industries in Bagtown include Administrative & Support (92 | 34.5%), Health Care & Social Assistance (44 | 16.5%), Finance & Insurance (43 | 16.1%), Retail Trade (39 | 14.6%), and Construction (18 | 6.7%).
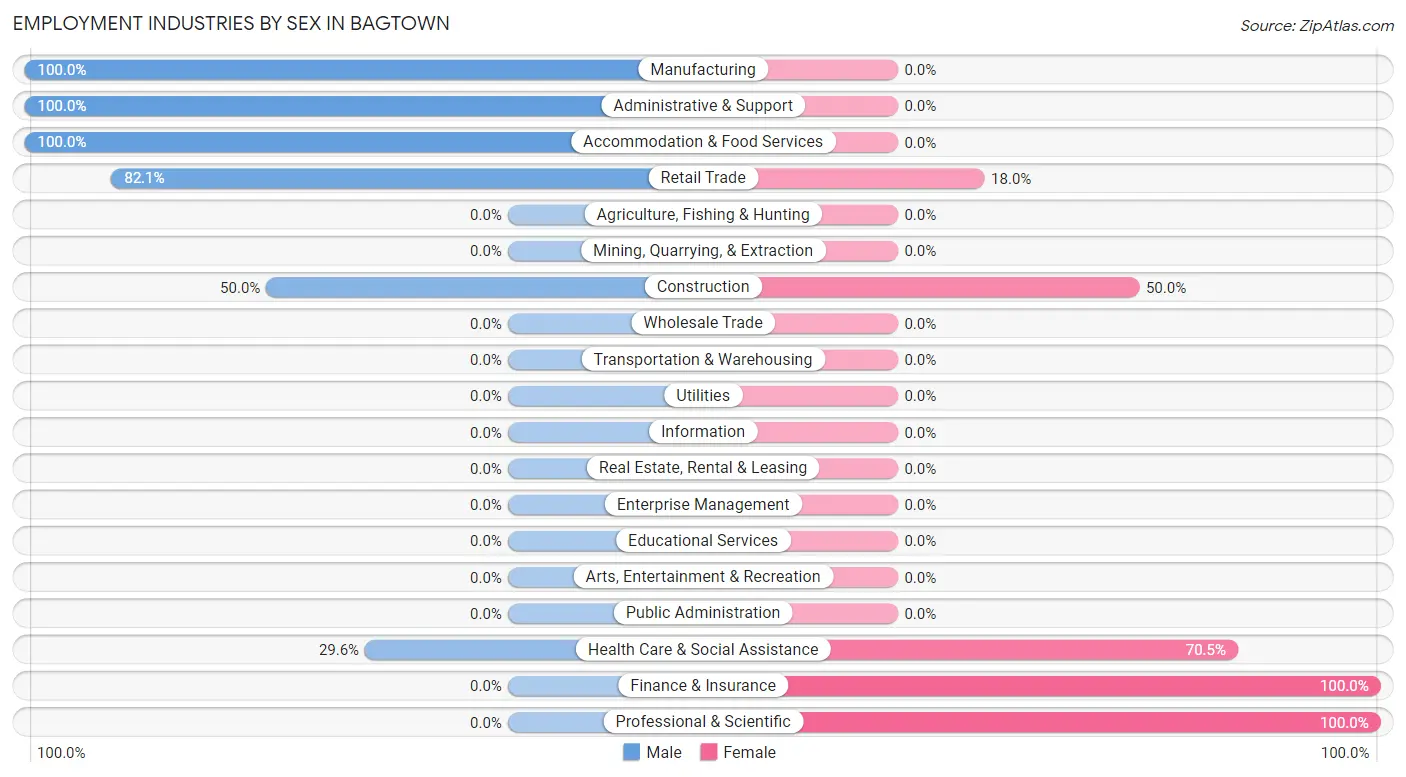
Employment Industries by Sex in Bagtown
The Bagtown industries that see more men than women are Manufacturing (100.0%), Administrative & Support (100.0%), and Accommodation & Food Services (100.0%), whereas the industries that tend to have a higher number of women are Finance & Insurance (100.0%), Professional & Scientific (100.0%), and Health Care & Social Assistance (70.5%).
| Industry | Male | Female |
| Agriculture, Fishing & Hunting | 0 (0.0%) | 0 (0.0%) |
| Mining, Quarrying, & Extraction | 0 (0.0%) | 0 (0.0%) |
| Construction | 9 (50.0%) | 9 (50.0%) |
| Manufacturing | 11 (100.0%) | 0 (0.0%) |
| Wholesale Trade | 0 (0.0%) | 0 (0.0%) |
| Retail Trade | 32 (82.1%) | 7 (17.9%) |
| Transportation & Warehousing | 0 (0.0%) | 0 (0.0%) |
| Utilities | 0 (0.0%) | 0 (0.0%) |
| Information | 0 (0.0%) | 0 (0.0%) |
| Finance & Insurance | 0 (0.0%) | 43 (100.0%) |
| Real Estate, Rental & Leasing | 0 (0.0%) | 0 (0.0%) |
| Professional & Scientific | 0 (0.0%) | 11 (100.0%) |
| Enterprise Management | 0 (0.0%) | 0 (0.0%) |
| Administrative & Support | 92 (100.0%) | 0 (0.0%) |
| Educational Services | 0 (0.0%) | 0 (0.0%) |
| Health Care & Social Assistance | 13 (29.5%) | 31 (70.5%) |
| Arts, Entertainment & Recreation | 0 (0.0%) | 0 (0.0%) |
| Accommodation & Food Services | 9 (100.0%) | 0 (0.0%) |
| Public Administration | 0 (0.0%) | 0 (0.0%) |
| Total | 166 (62.2%) | 101 (37.8%) |
Education in Bagtown
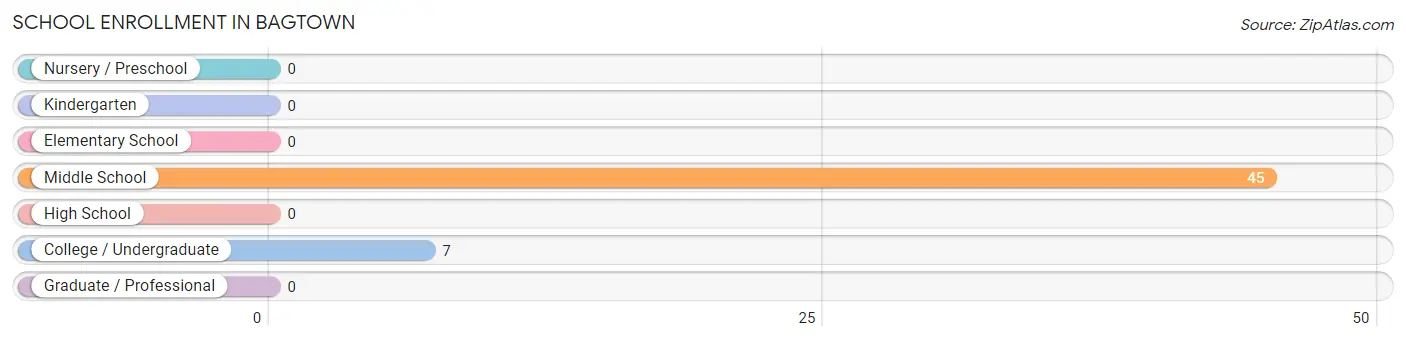
School Enrollment in Bagtown
The most common levels of schooling among the 52 students in Bagtown are middle school (45 | 86.5%), and college / undergraduate (7 | 13.5%).
| School Level | # Students | % Students |
| Nursery / Preschool | 0 | 0.0% |
| Kindergarten | 0 | 0.0% |
| Elementary School | 0 | 0.0% |
| Middle School | 45 | 86.5% |
| High School | 0 | 0.0% |
| College / Undergraduate | 7 | 13.5% |
| Graduate / Professional | 0 | 0.0% |
| Total | 52 | 100.0% |
School Enrollment by Age by Funding Source in Bagtown
Out of a total of 52 students who are enrolled in schools in Bagtown, 20 (38.5%) attend a private institution, while the remaining 32 (61.5%) are enrolled in public schools. The age group of 18 to 19 year olds has the highest likelihood of being enrolled in private schools, with 7 (100.0% in the age bracket) enrolled. Conversely, the age group of 10 to 14 year olds has the lowest likelihood of being enrolled in a private school, with 32 (71.1% in the age bracket) attending a public institution.
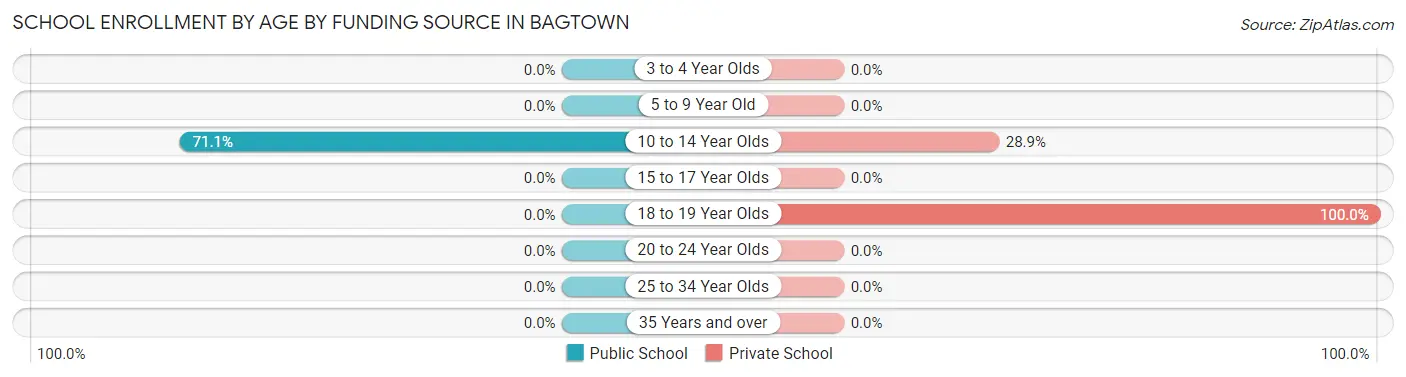
| Age Bracket | Public School | Private School |
| 3 to 4 Year Olds | 0 (0.0%) | 0 (0.0%) |
| 5 to 9 Year Old | 0 (0.0%) | 0 (0.0%) |
| 10 to 14 Year Olds | 32 (71.1%) | 13 (28.9%) |
| 15 to 17 Year Olds | 0 (0.0%) | 0 (0.0%) |
| 18 to 19 Year Olds | 0 (0.0%) | 7 (100.0%) |
| 20 to 24 Year Olds | 0 (0.0%) | 0 (0.0%) |
| 25 to 34 Year Olds | 0 (0.0%) | 0 (0.0%) |
| 35 Years and over | 0 (0.0%) | 0 (0.0%) |
| Total | 32 (61.5%) | 20 (38.5%) |
Educational Attainment by Field of Study in Bagtown
Business (11 | 57.9%), and bio, nature & agricultural (8 | 42.1%) are the most common fields of study among 19 individuals in Bagtown who have obtained a bachelor's degree or higher.
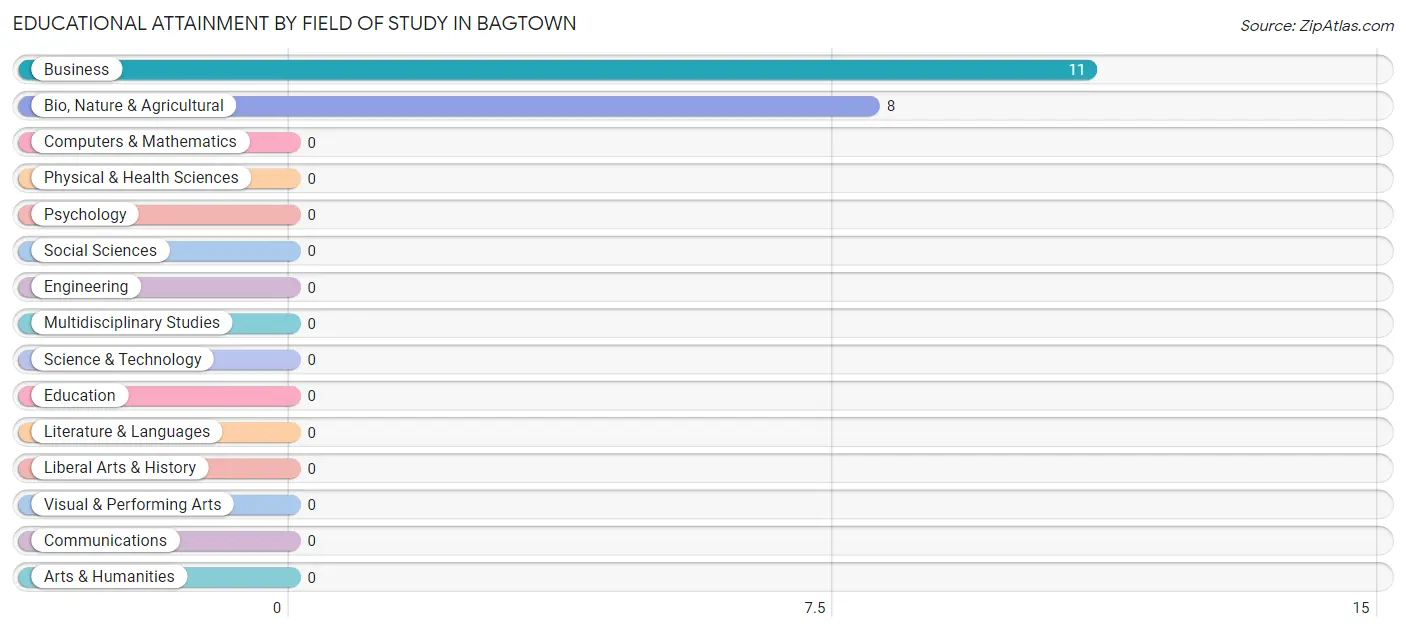
| Field of Study | # Graduates | % Graduates |
| Computers & Mathematics | 0 | 0.0% |
| Bio, Nature & Agricultural | 8 | 42.1% |
| Physical & Health Sciences | 0 | 0.0% |
| Psychology | 0 | 0.0% |
| Social Sciences | 0 | 0.0% |
| Engineering | 0 | 0.0% |
| Multidisciplinary Studies | 0 | 0.0% |
| Science & Technology | 0 | 0.0% |
| Business | 11 | 57.9% |
| Education | 0 | 0.0% |
| Literature & Languages | 0 | 0.0% |
| Liberal Arts & History | 0 | 0.0% |
| Visual & Performing Arts | 0 | 0.0% |
| Communications | 0 | 0.0% |
| Arts & Humanities | 0 | 0.0% |
| Total | 19 | 100.0% |
Transportation & Commute in Bagtown
Vehicle Availability by Sex in Bagtown
The most prevalent vehicle ownership categories in Bagtown are males with 3 vehicles (82, accounting for 49.4%) and females with 3 vehicles (43, making up 81.2%).
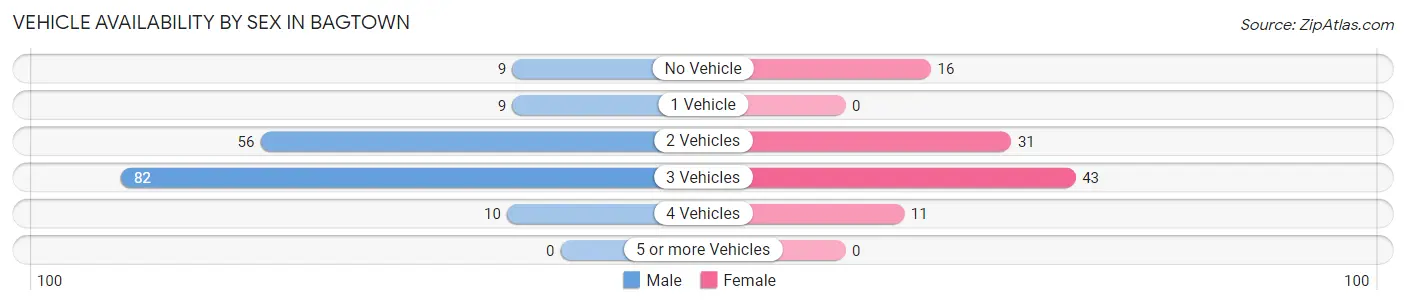
| Vehicles Available | Male | Female |
| No Vehicle | 9 (5.4%) | 16 (15.8%) |
| 1 Vehicle | 9 (5.4%) | 0 (0.0%) |
| 2 Vehicles | 56 (33.7%) | 31 (30.7%) |
| 3 Vehicles | 82 (49.4%) | 43 (42.6%) |
| 4 Vehicles | 10 (6.0%) | 11 (10.9%) |
| 5 or more Vehicles | 0 (0.0%) | 0 (0.0%) |
| Total | 166 (100.0%) | 101 (100.0%) |
Commute Time in Bagtown
The most frequently occuring commute durations in Bagtown are 15 to 19 minutes (102 commuters, 39.7%), 25 to 29 minutes (72 commuters, 28.0%), and 30 to 34 minutes (43 commuters, 16.7%).
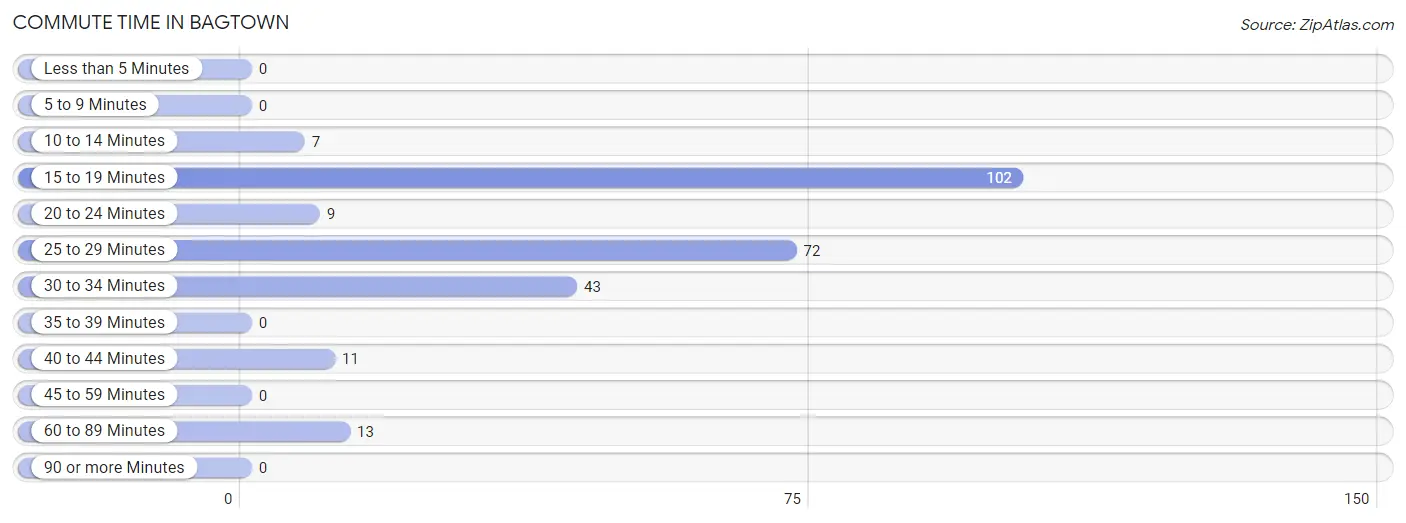
| Commute Time | # Commuters | % Commuters |
| Less than 5 Minutes | 0 | 0.0% |
| 5 to 9 Minutes | 0 | 0.0% |
| 10 to 14 Minutes | 7 | 2.7% |
| 15 to 19 Minutes | 102 | 39.7% |
| 20 to 24 Minutes | 9 | 3.5% |
| 25 to 29 Minutes | 72 | 28.0% |
| 30 to 34 Minutes | 43 | 16.7% |
| 35 to 39 Minutes | 0 | 0.0% |
| 40 to 44 Minutes | 11 | 4.3% |
| 45 to 59 Minutes | 0 | 0.0% |
| 60 to 89 Minutes | 13 | 5.1% |
| 90 or more Minutes | 0 | 0.0% |
Commute Time by Sex in Bagtown
The most common commute times in Bagtown are 15 to 19 minutes (91 commuters, 58.3%) for males and 30 to 34 minutes (43 commuters, 42.6%) for females.
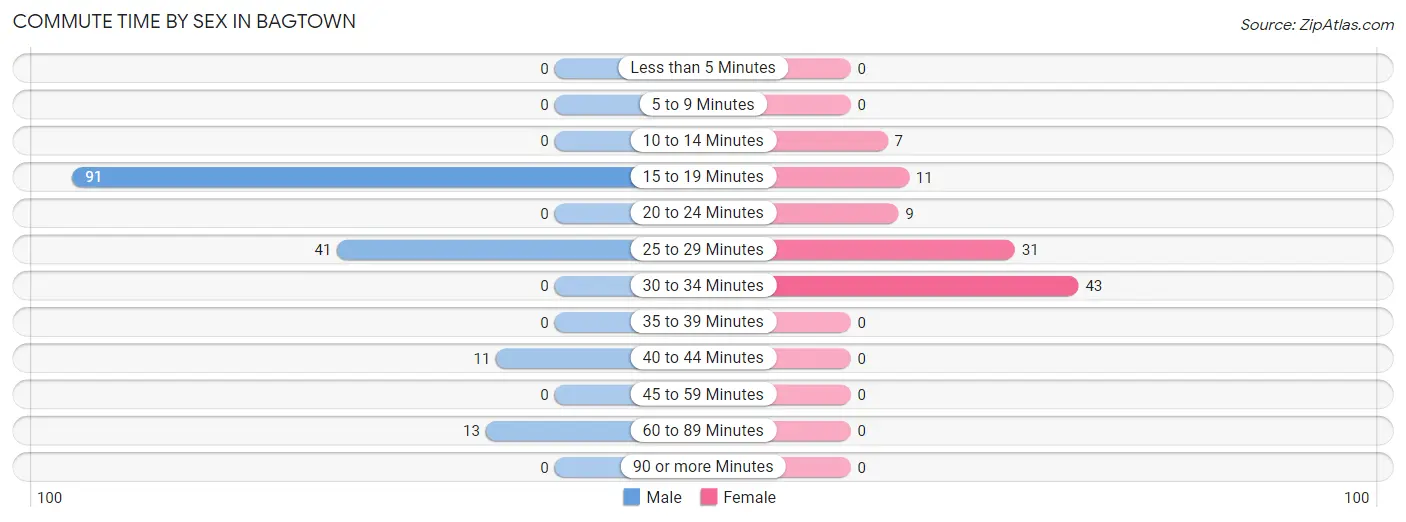
| Commute Time | Male | Female |
| Less than 5 Minutes | 0 (0.0%) | 0 (0.0%) |
| 5 to 9 Minutes | 0 (0.0%) | 0 (0.0%) |
| 10 to 14 Minutes | 0 (0.0%) | 7 (6.9%) |
| 15 to 19 Minutes | 91 (58.3%) | 11 (10.9%) |
| 20 to 24 Minutes | 0 (0.0%) | 9 (8.9%) |
| 25 to 29 Minutes | 41 (26.3%) | 31 (30.7%) |
| 30 to 34 Minutes | 0 (0.0%) | 43 (42.6%) |
| 35 to 39 Minutes | 0 (0.0%) | 0 (0.0%) |
| 40 to 44 Minutes | 11 (7.0%) | 0 (0.0%) |
| 45 to 59 Minutes | 0 (0.0%) | 0 (0.0%) |
| 60 to 89 Minutes | 13 (8.3%) | 0 (0.0%) |
| 90 or more Minutes | 0 (0.0%) | 0 (0.0%) |
Time of Departure to Work by Sex in Bagtown
The most frequent times of departure to work in Bagtown are 12:00 AM to 4:59 AM (91, 58.3%) for males and 9:00 AM to 9:59 AM (63, 62.4%) for females.
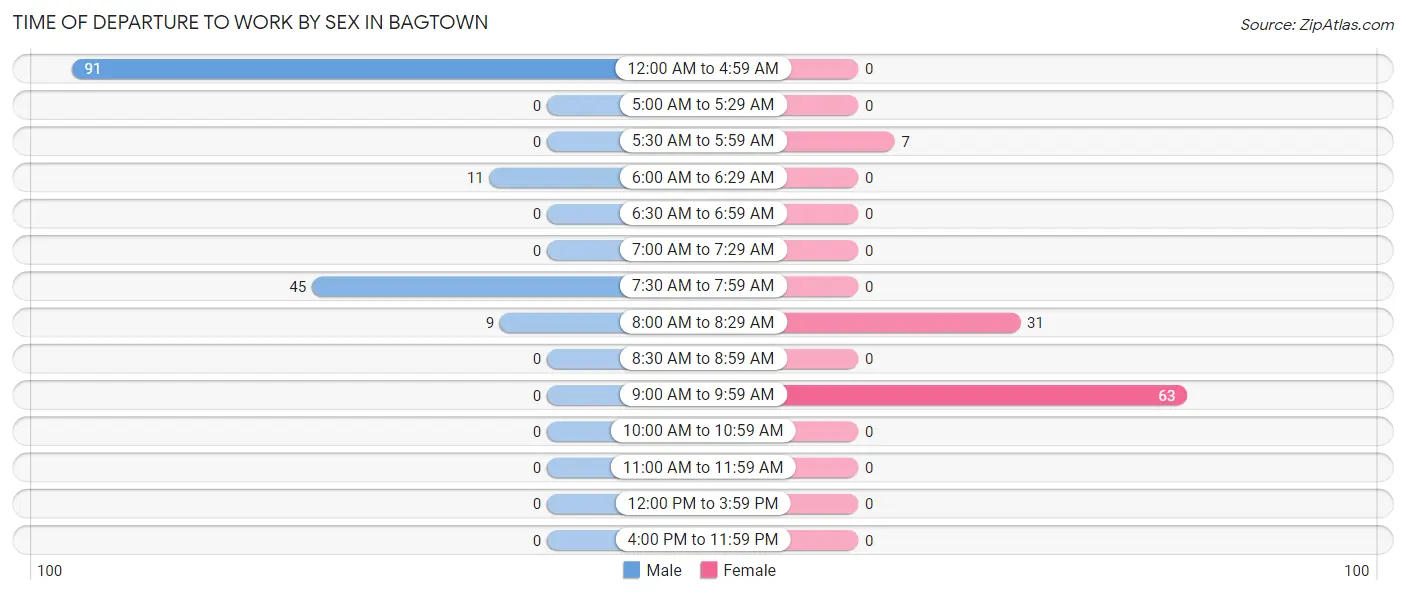
| Time of Departure | Male | Female |
| 12:00 AM to 4:59 AM | 91 (58.3%) | 0 (0.0%) |
| 5:00 AM to 5:29 AM | 0 (0.0%) | 0 (0.0%) |
| 5:30 AM to 5:59 AM | 0 (0.0%) | 7 (6.9%) |
| 6:00 AM to 6:29 AM | 11 (7.0%) | 0 (0.0%) |
| 6:30 AM to 6:59 AM | 0 (0.0%) | 0 (0.0%) |
| 7:00 AM to 7:29 AM | 0 (0.0%) | 0 (0.0%) |
| 7:30 AM to 7:59 AM | 45 (28.8%) | 0 (0.0%) |
| 8:00 AM to 8:29 AM | 9 (5.8%) | 31 (30.7%) |
| 8:30 AM to 8:59 AM | 0 (0.0%) | 0 (0.0%) |
| 9:00 AM to 9:59 AM | 0 (0.0%) | 63 (62.4%) |
| 10:00 AM to 10:59 AM | 0 (0.0%) | 0 (0.0%) |
| 11:00 AM to 11:59 AM | 0 (0.0%) | 0 (0.0%) |
| 12:00 PM to 3:59 PM | 0 (0.0%) | 0 (0.0%) |
| 4:00 PM to 11:59 PM | 0 (0.0%) | 0 (0.0%) |
| Total | 156 (100.0%) | 101 (100.0%) |
Housing Occupancy in Bagtown
Occupancy by Ownership in Bagtown
Of the total 144 dwellings in Bagtown, owner-occupied units account for 137 (95.1%), while renter-occupied units make up 7 (4.9%).
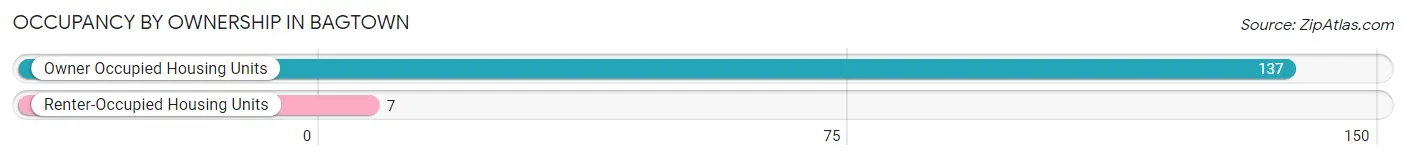
| Occupancy | # Housing Units | % Housing Units |
| Owner Occupied Housing Units | 137 | 95.1% |
| Renter-Occupied Housing Units | 7 | 4.9% |
| Total Occupied Housing Units | 144 | 100.0% |
Occupancy by Household Size in Bagtown
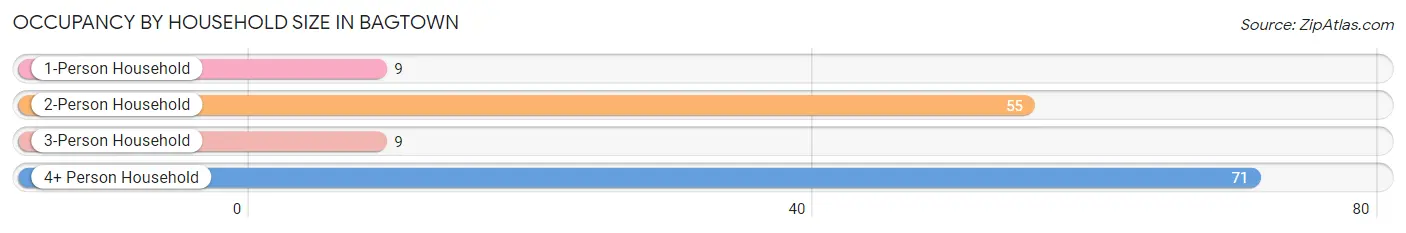
| Household Size | # Housing Units | % Housing Units |
| 1-Person Household | 9 | 6.2% |
| 2-Person Household | 55 | 38.2% |
| 3-Person Household | 9 | 6.2% |
| 4+ Person Household | 71 | 49.3% |
| Total Housing Units | 144 | 100.0% |
Occupancy by Ownership by Household Size in Bagtown
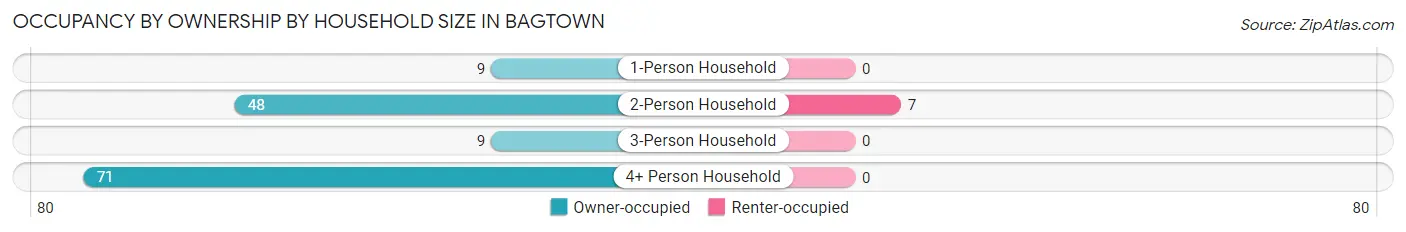
| Household Size | Owner-occupied | Renter-occupied |
| 1-Person Household | 9 (100.0%) | 0 (0.0%) |
| 2-Person Household | 48 (87.3%) | 7 (12.7%) |
| 3-Person Household | 9 (100.0%) | 0 (0.0%) |
| 4+ Person Household | 71 (100.0%) | 0 (0.0%) |
| Total Housing Units | 137 (95.1%) | 7 (4.9%) |
Occupancy by Educational Attainment in Bagtown
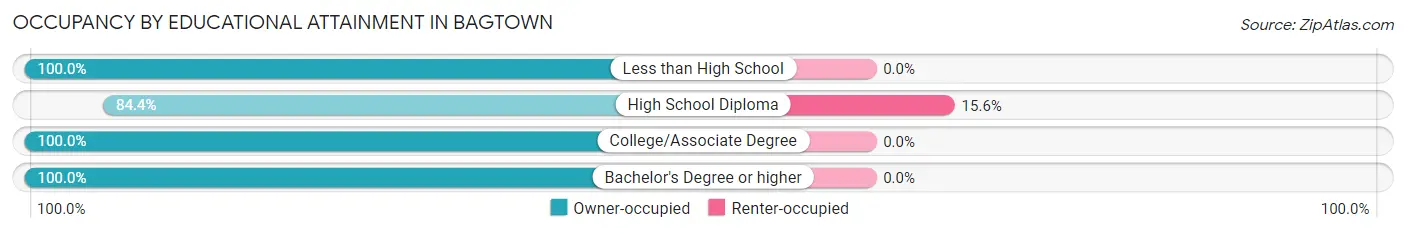
| Household Size | Owner-occupied | Renter-occupied |
| Less than High School | 9 (100.0%) | 0 (0.0%) |
| High School Diploma | 38 (84.4%) | 7 (15.6%) |
| College/Associate Degree | 71 (100.0%) | 0 (0.0%) |
| Bachelor's Degree or higher | 19 (100.0%) | 0 (0.0%) |
Occupancy by Age of Householder in Bagtown
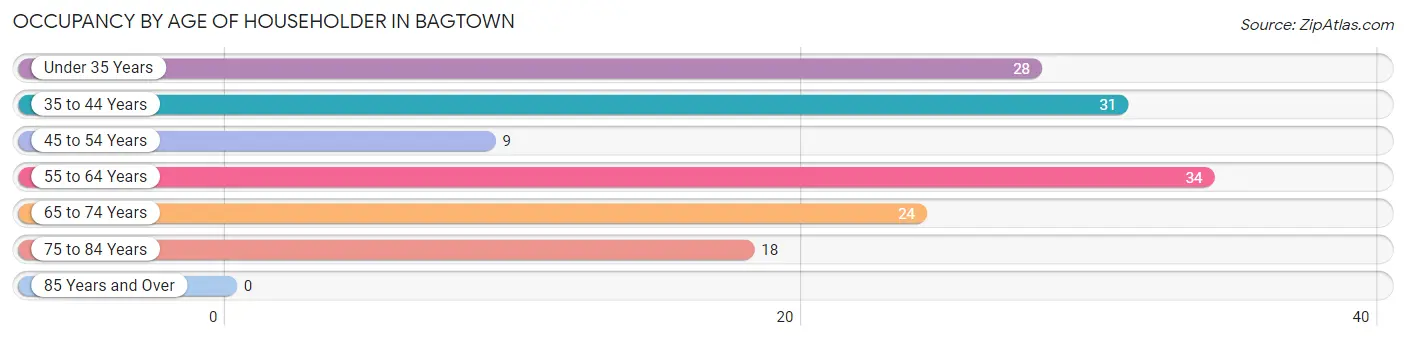
| Age Bracket | # Households | % Households |
| Under 35 Years | 28 | 19.4% |
| 35 to 44 Years | 31 | 21.5% |
| 45 to 54 Years | 9 | 6.2% |
| 55 to 64 Years | 34 | 23.6% |
| 65 to 74 Years | 24 | 16.7% |
| 75 to 84 Years | 18 | 12.5% |
| 85 Years and Over | 0 | 0.0% |
| Total | 144 | 100.0% |
Housing Finances in Bagtown
Median Income by Occupancy in Bagtown
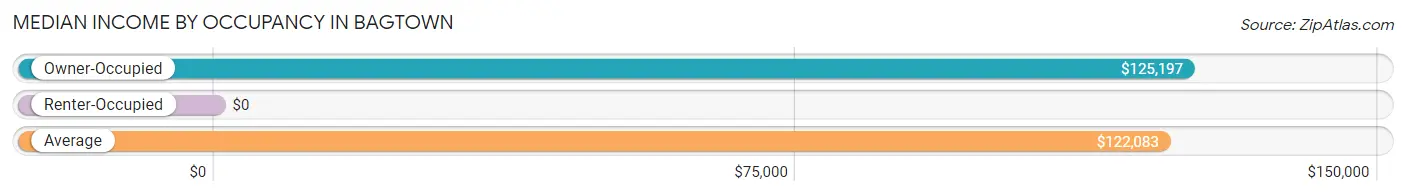
| Occupancy Type | # Households | Median Income |
| Owner-Occupied | 137 (95.1%) | $125,197 |
| Renter-Occupied | 7 (4.9%) | $0 |
| Average | 144 (100.0%) | $122,083 |
Occupancy by Householder Income Bracket in Bagtown
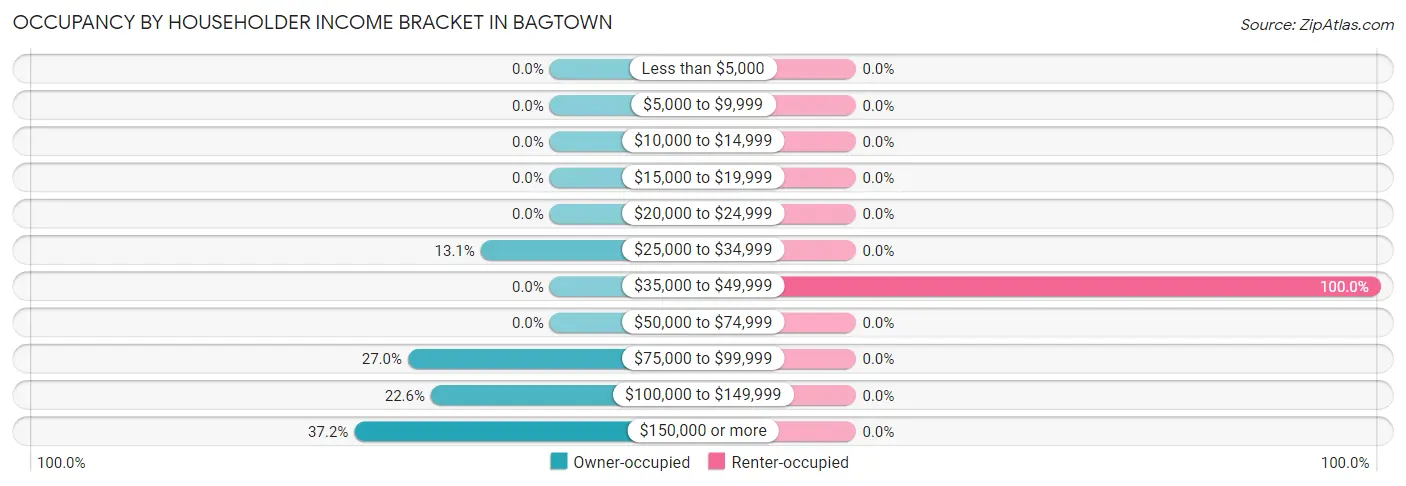
| Income Bracket | Owner-occupied | Renter-occupied |
| Less than $5,000 | 0 (0.0%) | 0 (0.0%) |
| $5,000 to $9,999 | 0 (0.0%) | 0 (0.0%) |
| $10,000 to $14,999 | 0 (0.0%) | 0 (0.0%) |
| $15,000 to $19,999 | 0 (0.0%) | 0 (0.0%) |
| $20,000 to $24,999 | 0 (0.0%) | 0 (0.0%) |
| $25,000 to $34,999 | 18 (13.1%) | 0 (0.0%) |
| $35,000 to $49,999 | 0 (0.0%) | 7 (100.0%) |
| $50,000 to $74,999 | 0 (0.0%) | 0 (0.0%) |
| $75,000 to $99,999 | 37 (27.0%) | 0 (0.0%) |
| $100,000 to $149,999 | 31 (22.6%) | 0 (0.0%) |
| $150,000 or more | 51 (37.2%) | 0 (0.0%) |
| Total | 137 (100.0%) | 7 (100.0%) |
Monthly Housing Cost Tiers in Bagtown
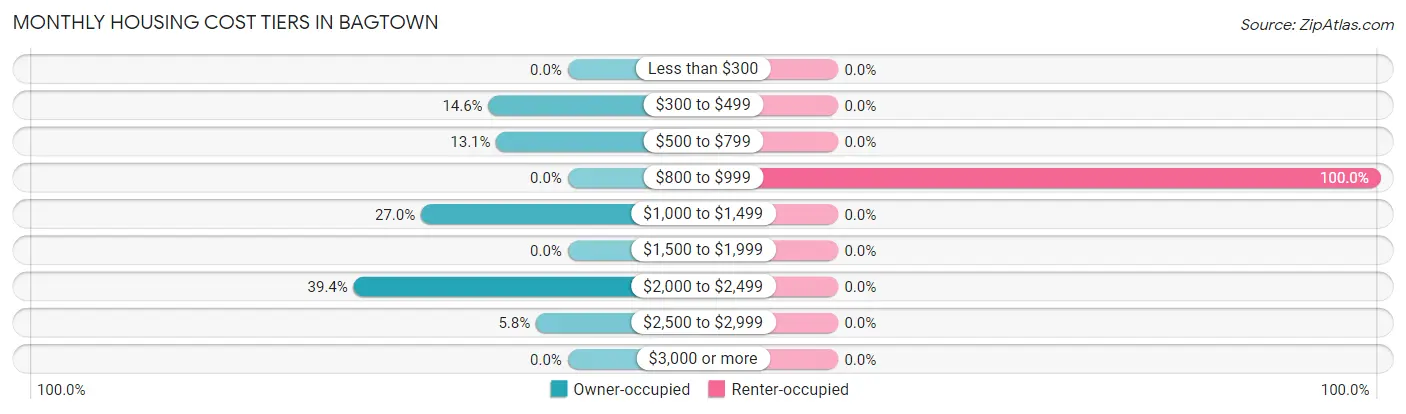
| Monthly Cost | Owner-occupied | Renter-occupied |
| Less than $300 | 0 (0.0%) | 0 (0.0%) |
| $300 to $499 | 20 (14.6%) | 0 (0.0%) |
| $500 to $799 | 18 (13.1%) | 0 (0.0%) |
| $800 to $999 | 0 (0.0%) | 7 (100.0%) |
| $1,000 to $1,499 | 37 (27.0%) | 0 (0.0%) |
| $1,500 to $1,999 | 0 (0.0%) | 0 (0.0%) |
| $2,000 to $2,499 | 54 (39.4%) | 0 (0.0%) |
| $2,500 to $2,999 | 8 (5.8%) | 0 (0.0%) |
| $3,000 or more | 0 (0.0%) | 0 (0.0%) |
| Total | 137 (100.0%) | 7 (100.0%) |
Physical Housing Characteristics in Bagtown
Housing Structures in Bagtown
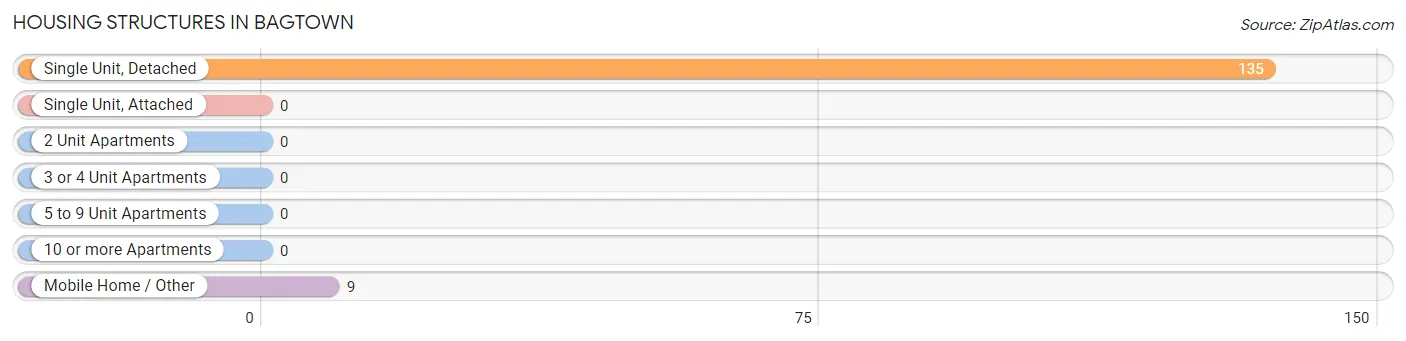
| Structure Type | # Housing Units | % Housing Units |
| Single Unit, Detached | 135 | 93.8% |
| Single Unit, Attached | 0 | 0.0% |
| 2 Unit Apartments | 0 | 0.0% |
| 3 or 4 Unit Apartments | 0 | 0.0% |
| 5 to 9 Unit Apartments | 0 | 0.0% |
| 10 or more Apartments | 0 | 0.0% |
| Mobile Home / Other | 9 | 6.2% |
| Total | 144 | 100.0% |
Housing Structures by Occupancy in Bagtown
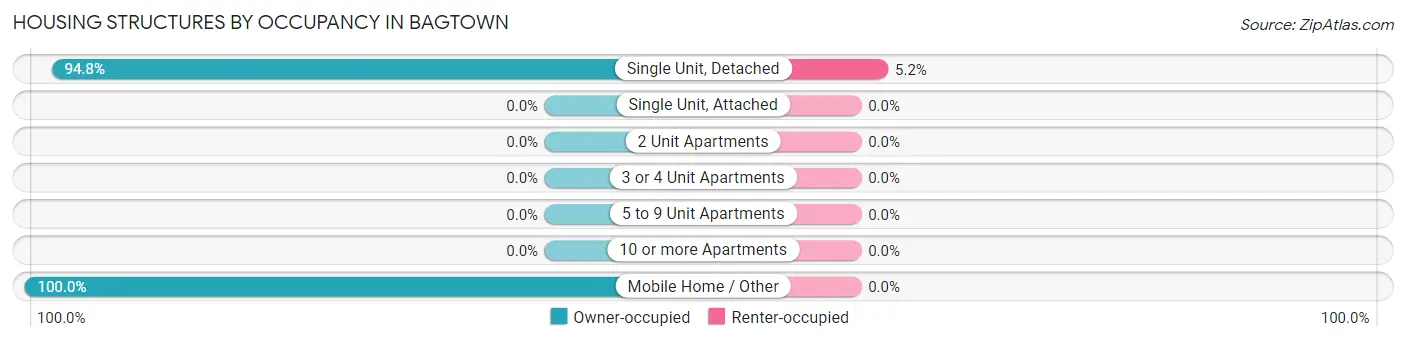
| Structure Type | Owner-occupied | Renter-occupied |
| Single Unit, Detached | 128 (94.8%) | 7 (5.2%) |
| Single Unit, Attached | 0 (0.0%) | 0 (0.0%) |
| 2 Unit Apartments | 0 (0.0%) | 0 (0.0%) |
| 3 or 4 Unit Apartments | 0 (0.0%) | 0 (0.0%) |
| 5 to 9 Unit Apartments | 0 (0.0%) | 0 (0.0%) |
| 10 or more Apartments | 0 (0.0%) | 0 (0.0%) |
| Mobile Home / Other | 9 (100.0%) | 0 (0.0%) |
| Total | 137 (95.1%) | 7 (4.9%) |
Housing Structures by Number of Rooms in Bagtown
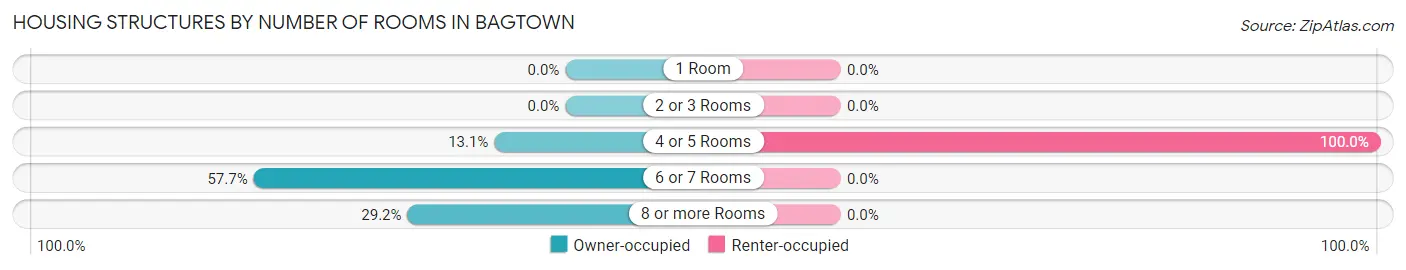
| Number of Rooms | Owner-occupied | Renter-occupied |
| 1 Room | 0 (0.0%) | 0 (0.0%) |
| 2 or 3 Rooms | 0 (0.0%) | 0 (0.0%) |
| 4 or 5 Rooms | 18 (13.1%) | 7 (100.0%) |
| 6 or 7 Rooms | 79 (57.7%) | 0 (0.0%) |
| 8 or more Rooms | 40 (29.2%) | 0 (0.0%) |
| Total | 137 (100.0%) | 7 (100.0%) |
Housing Structure by Heating Type in Bagtown
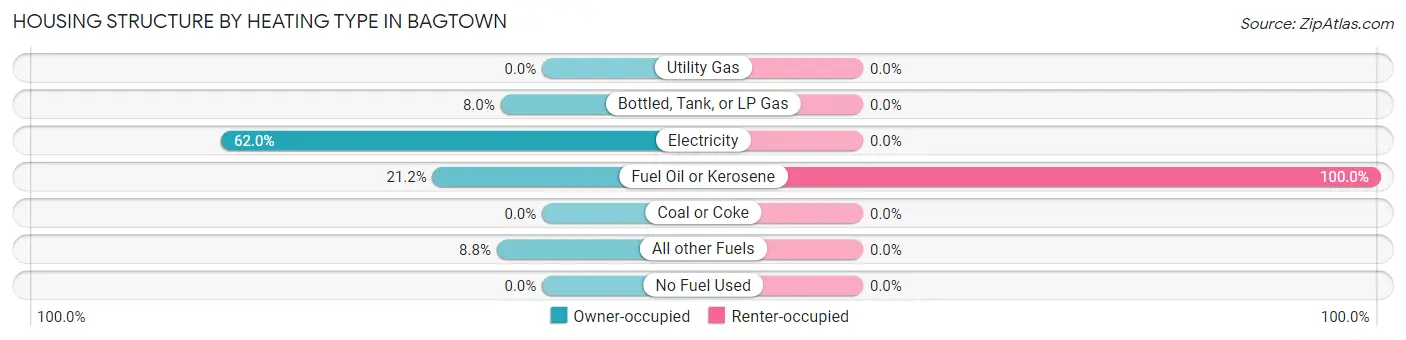
| Heating Type | Owner-occupied | Renter-occupied |
| Utility Gas | 0 (0.0%) | 0 (0.0%) |
| Bottled, Tank, or LP Gas | 11 (8.0%) | 0 (0.0%) |
| Electricity | 85 (62.0%) | 0 (0.0%) |
| Fuel Oil or Kerosene | 29 (21.2%) | 7 (100.0%) |
| Coal or Coke | 0 (0.0%) | 0 (0.0%) |
| All other Fuels | 12 (8.8%) | 0 (0.0%) |
| No Fuel Used | 0 (0.0%) | 0 (0.0%) |
| Total | 137 (100.0%) | 7 (100.0%) |
Household Vehicle Usage in Bagtown
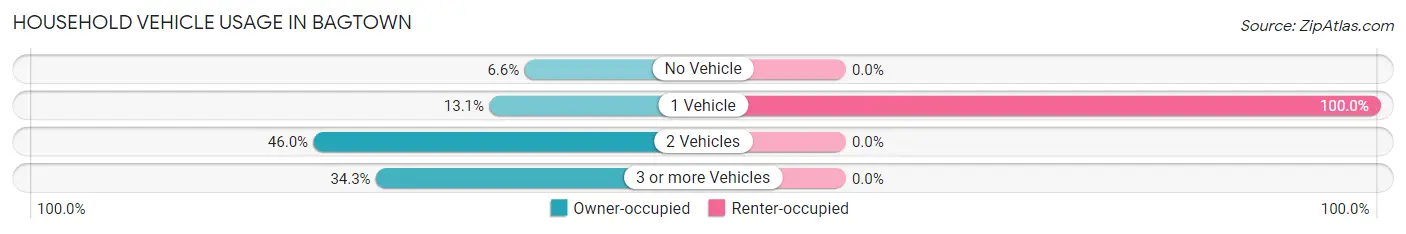
| Vehicles per Household | Owner-occupied | Renter-occupied |
| No Vehicle | 9 (6.6%) | 0 (0.0%) |
| 1 Vehicle | 18 (13.1%) | 7 (100.0%) |
| 2 Vehicles | 63 (46.0%) | 0 (0.0%) |
| 3 or more Vehicles | 47 (34.3%) | 0 (0.0%) |
| Total | 137 (100.0%) | 7 (100.0%) |
Real Estate & Mortgages in Bagtown
Real Estate and Mortgage Overview in Bagtown
| Characteristic | Without Mortgage | With Mortgage |
| Housing Units | 18 | 119 |
| Median Property Value | - | - |
| Median Household Income | - | - |
| Monthly Housing Costs | - | - |
| Real Estate Taxes | - | - |
Property Value by Mortgage Status in Bagtown
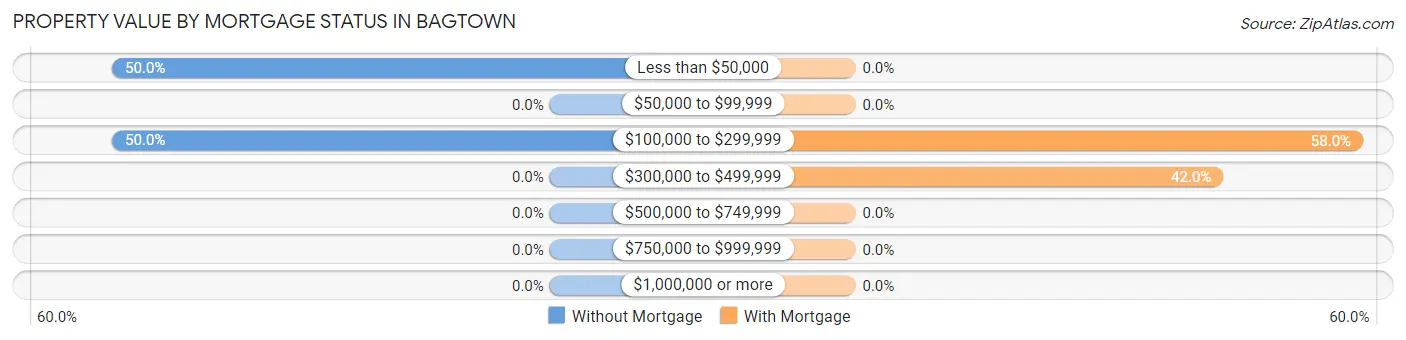
| Property Value | Without Mortgage | With Mortgage |
| Less than $50,000 | 9 (50.0%) | 0 (0.0%) |
| $50,000 to $99,999 | 0 (0.0%) | 0 (0.0%) |
| $100,000 to $299,999 | 9 (50.0%) | 69 (58.0%) |
| $300,000 to $499,999 | 0 (0.0%) | 50 (42.0%) |
| $500,000 to $749,999 | 0 (0.0%) | 0 (0.0%) |
| $750,000 to $999,999 | 0 (0.0%) | 0 (0.0%) |
| $1,000,000 or more | 0 (0.0%) | 0 (0.0%) |
| Total | 18 (100.0%) | 119 (100.0%) |
Household Income by Mortgage Status in Bagtown
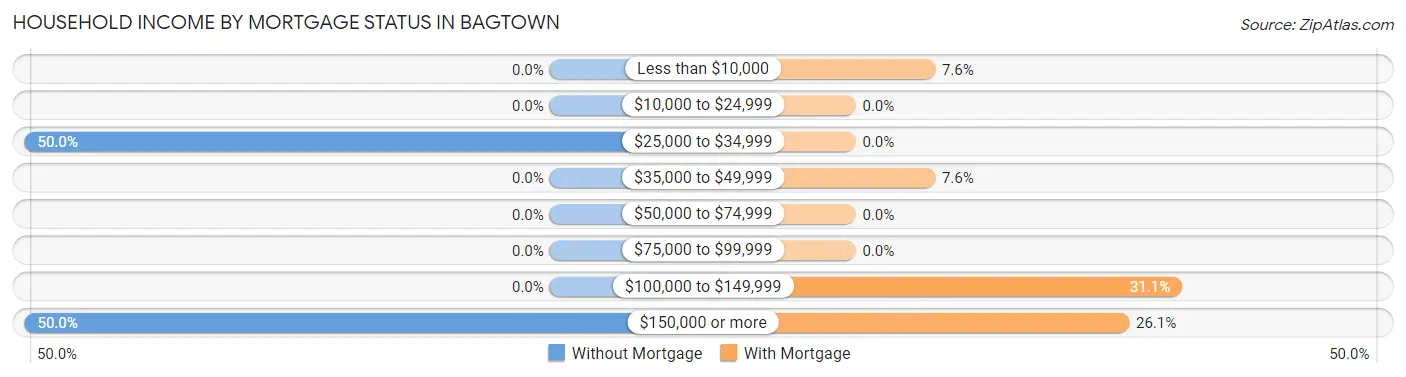
| Household Income | Without Mortgage | With Mortgage |
| Less than $10,000 | 0 (0.0%) | 9 (7.6%) |
| $10,000 to $24,999 | 0 (0.0%) | 0 (0.0%) |
| $25,000 to $34,999 | 9 (50.0%) | 0 (0.0%) |
| $35,000 to $49,999 | 0 (0.0%) | 9 (7.6%) |
| $50,000 to $74,999 | 0 (0.0%) | 0 (0.0%) |
| $75,000 to $99,999 | 0 (0.0%) | 0 (0.0%) |
| $100,000 to $149,999 | 0 (0.0%) | 37 (31.1%) |
| $150,000 or more | 9 (50.0%) | 31 (26.1%) |
| Total | 18 (100.0%) | 119 (100.0%) |
Property Value to Household Income Ratio in Bagtown
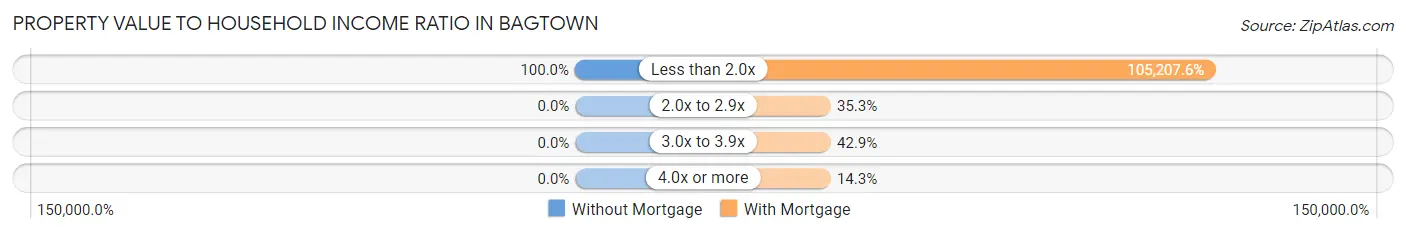
| Value-to-Income Ratio | Without Mortgage | With Mortgage |
| Less than 2.0x | 18 (100.0%) | 125,197 (105,207.6%) |
| 2.0x to 2.9x | 0 (0.0%) | 42 (35.3%) |
| 3.0x to 3.9x | 0 (0.0%) | 51 (42.9%) |
| 4.0x or more | 0 (0.0%) | 17 (14.3%) |
| Total | 18 (100.0%) | 119 (100.0%) |
Real Estate Taxes by Mortgage Status in Bagtown
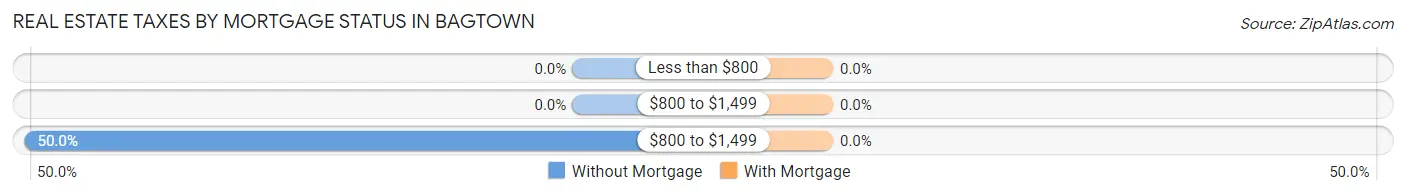
| Property Taxes | Without Mortgage | With Mortgage |
| Less than $800 | 0 (0.0%) | 0 (0.0%) |
| $800 to $1,499 | 0 (0.0%) | 0 (0.0%) |
| $800 to $1,499 | 9 (50.0%) | 0 (0.0%) |
| Total | 18 (100.0%) | 119 (100.0%) |
Health & Disability in Bagtown
Health Insurance Coverage by Age in Bagtown
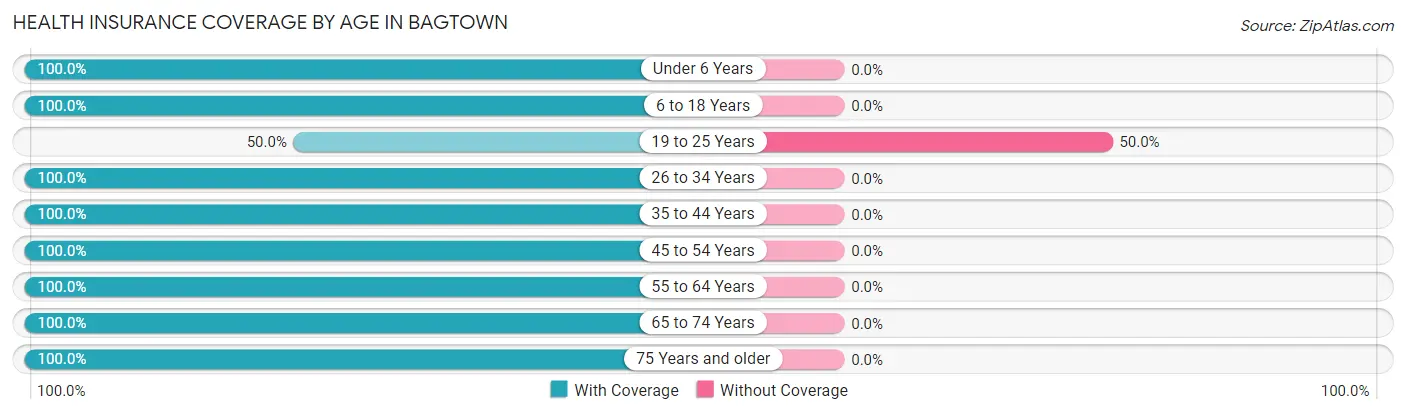
| Age Bracket | With Coverage | Without Coverage |
| Under 6 Years | 71 (100.0%) | 0 (0.0%) |
| 6 to 18 Years | 45 (100.0%) | 0 (0.0%) |
| 19 to 25 Years | 7 (50.0%) | 7 (50.0%) |
| 26 to 34 Years | 123 (100.0%) | 0 (0.0%) |
| 35 to 44 Years | 63 (100.0%) | 0 (0.0%) |
| 45 to 54 Years | 18 (100.0%) | 0 (0.0%) |
| 55 to 64 Years | 95 (100.0%) | 0 (0.0%) |
| 65 to 74 Years | 56 (100.0%) | 0 (0.0%) |
| 75 Years and older | 36 (100.0%) | 0 (0.0%) |
| Total | 514 (98.7%) | 7 (1.3%) |
Health Insurance Coverage by Citizenship Status in Bagtown
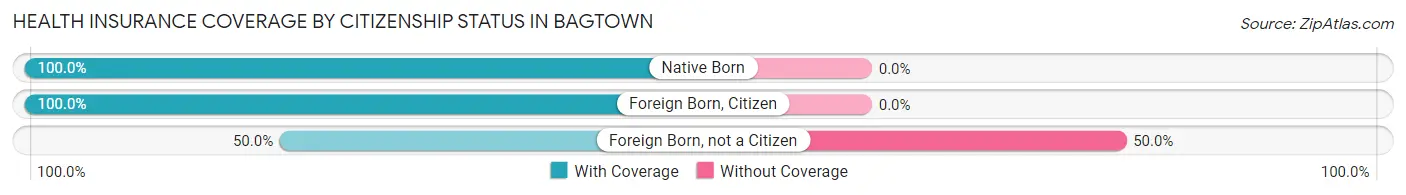
| Citizenship Status | With Coverage | Without Coverage |
| Native Born | 71 (100.0%) | 0 (0.0%) |
| Foreign Born, Citizen | 45 (100.0%) | 0 (0.0%) |
| Foreign Born, not a Citizen | 7 (50.0%) | 7 (50.0%) |
Health Insurance Coverage by Household Income in Bagtown
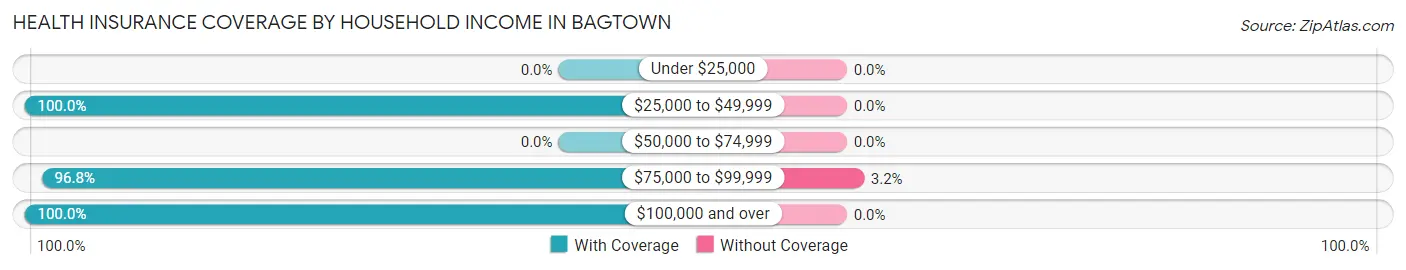
| Household Income | With Coverage | Without Coverage |
| Under $25,000 | 0 (0.0%) | 0 (0.0%) |
| $25,000 to $49,999 | 41 (100.0%) | 0 (0.0%) |
| $50,000 to $74,999 | 0 (0.0%) | 0 (0.0%) |
| $75,000 to $99,999 | 212 (96.8%) | 7 (3.2%) |
| $100,000 and over | 261 (100.0%) | 0 (0.0%) |
Public vs Private Health Insurance Coverage by Age in Bagtown
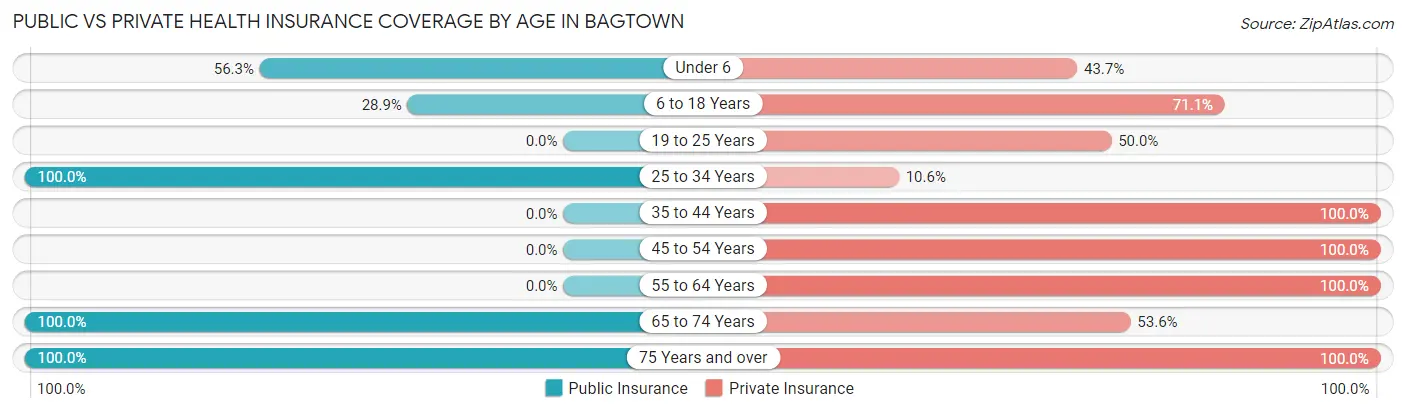
| Age Bracket | Public Insurance | Private Insurance |
| Under 6 | 40 (56.3%) | 31 (43.7%) |
| 6 to 18 Years | 13 (28.9%) | 32 (71.1%) |
| 19 to 25 Years | 0 (0.0%) | 7 (50.0%) |
| 25 to 34 Years | 123 (100.0%) | 13 (10.6%) |
| 35 to 44 Years | 0 (0.0%) | 63 (100.0%) |
| 45 to 54 Years | 0 (0.0%) | 18 (100.0%) |
| 55 to 64 Years | 0 (0.0%) | 95 (100.0%) |
| 65 to 74 Years | 56 (100.0%) | 30 (53.6%) |
| 75 Years and over | 36 (100.0%) | 36 (100.0%) |
| Total | 268 (51.4%) | 325 (62.4%) |
Disability Status by Sex by Age in Bagtown
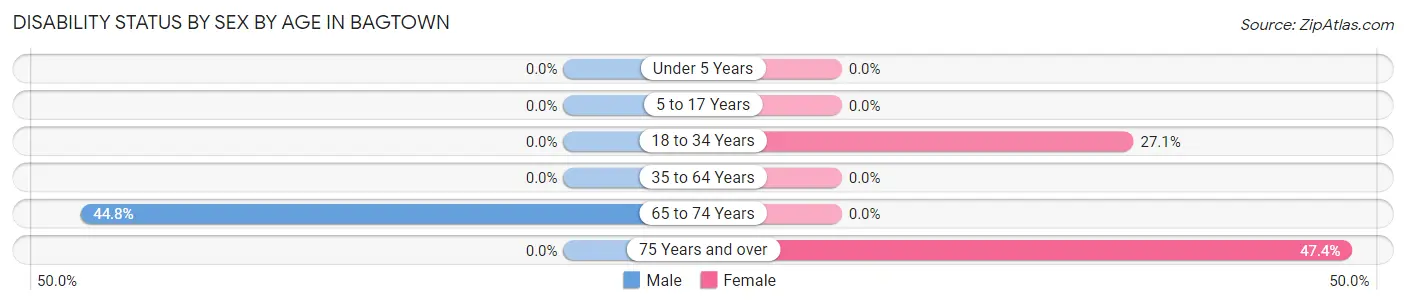
| Age Bracket | Male | Female |
| Under 5 Years | 0 (0.0%) | 0 (0.0%) |
| 5 to 17 Years | 0 (0.0%) | 0 (0.0%) |
| 18 to 34 Years | 0 (0.0%) | 13 (27.1%) |
| 35 to 64 Years | 0 (0.0%) | 0 (0.0%) |
| 65 to 74 Years | 13 (44.8%) | 0 (0.0%) |
| 75 Years and over | 0 (0.0%) | 9 (47.4%) |
Disability Class by Sex by Age in Bagtown
Disability Class: Hearing Difficulty
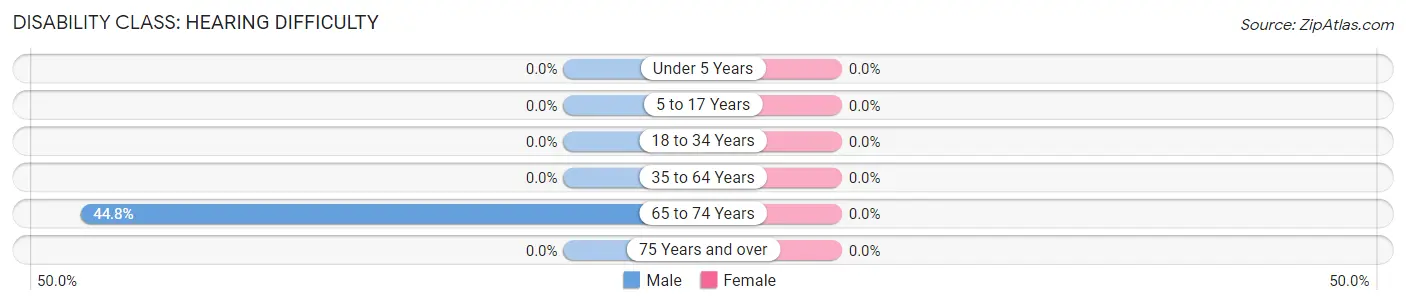
| Age Bracket | Male | Female |
| Under 5 Years | 0 (0.0%) | 0 (0.0%) |
| 5 to 17 Years | 0 (0.0%) | 0 (0.0%) |
| 18 to 34 Years | 0 (0.0%) | 0 (0.0%) |
| 35 to 64 Years | 0 (0.0%) | 0 (0.0%) |
| 65 to 74 Years | 13 (44.8%) | 0 (0.0%) |
| 75 Years and over | 0 (0.0%) | 0 (0.0%) |
Disability Class: Vision Difficulty
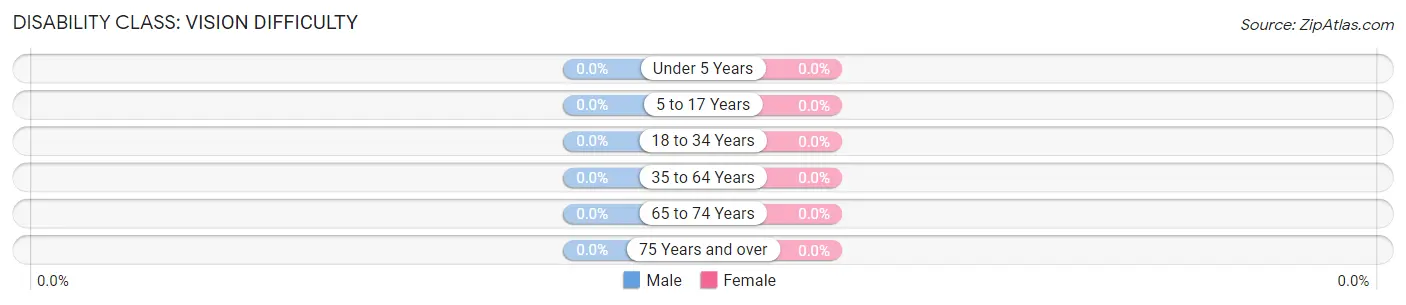
| Age Bracket | Male | Female |
| Under 5 Years | 0 (0.0%) | 0 (0.0%) |
| 5 to 17 Years | 0 (0.0%) | 0 (0.0%) |
| 18 to 34 Years | 0 (0.0%) | 0 (0.0%) |
| 35 to 64 Years | 0 (0.0%) | 0 (0.0%) |
| 65 to 74 Years | 0 (0.0%) | 0 (0.0%) |
| 75 Years and over | 0 (0.0%) | 0 (0.0%) |
Disability Class: Cognitive Difficulty
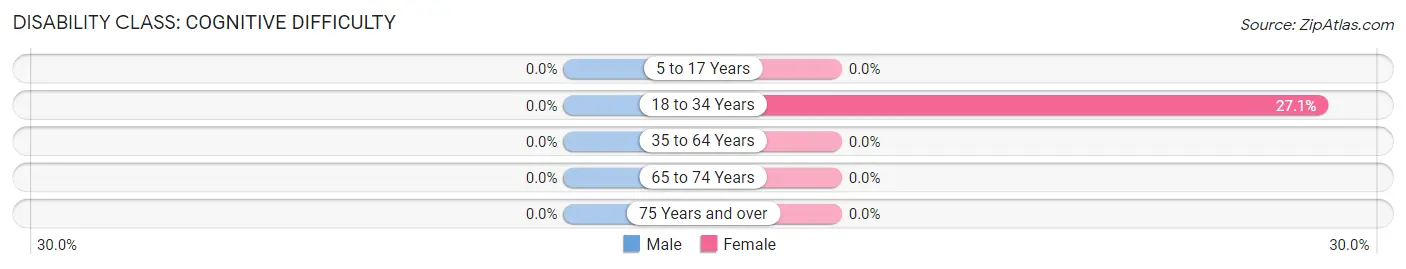
| Age Bracket | Male | Female |
| 5 to 17 Years | 0 (0.0%) | 0 (0.0%) |
| 18 to 34 Years | 0 (0.0%) | 13 (27.1%) |
| 35 to 64 Years | 0 (0.0%) | 0 (0.0%) |
| 65 to 74 Years | 0 (0.0%) | 0 (0.0%) |
| 75 Years and over | 0 (0.0%) | 0 (0.0%) |
Disability Class: Ambulatory Difficulty
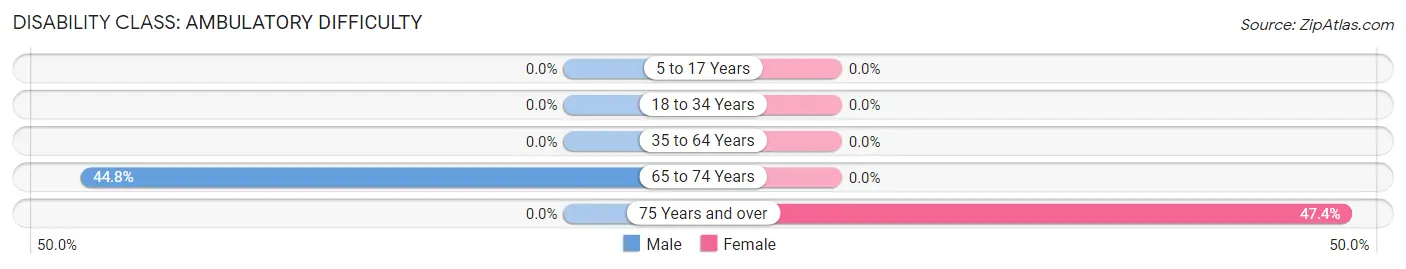
| Age Bracket | Male | Female |
| 5 to 17 Years | 0 (0.0%) | 0 (0.0%) |
| 18 to 34 Years | 0 (0.0%) | 0 (0.0%) |
| 35 to 64 Years | 0 (0.0%) | 0 (0.0%) |
| 65 to 74 Years | 13 (44.8%) | 0 (0.0%) |
| 75 Years and over | 0 (0.0%) | 9 (47.4%) |
Disability Class: Self-Care Difficulty
| Age Bracket | Male | Female |
| 5 to 17 Years | 0 (0.0%) | 0 (0.0%) |
| 18 to 34 Years | 0 (0.0%) | 0 (0.0%) |
| 35 to 64 Years | 0 (0.0%) | 0 (0.0%) |
| 65 to 74 Years | 0 (0.0%) | 0 (0.0%) |
| 75 Years and over | 0 (0.0%) | 0 (0.0%) |
Technology Access in Bagtown
Computing Device Access in Bagtown
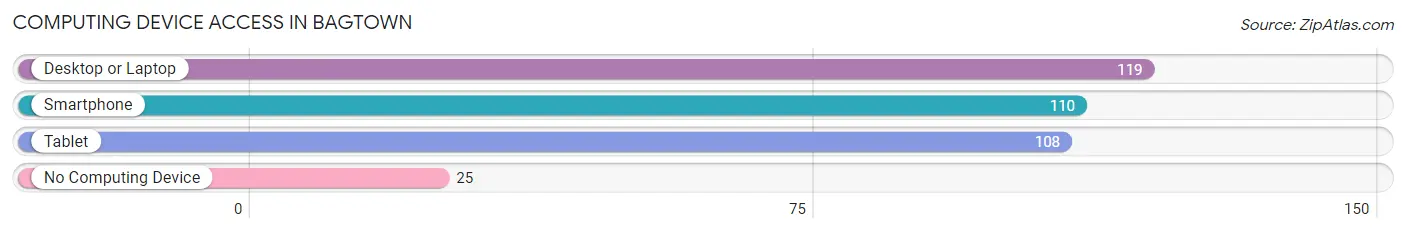
| Device Type | # Households | % Households |
| Desktop or Laptop | 119 | 82.6% |
| Smartphone | 110 | 76.4% |
| Tablet | 108 | 75.0% |
| No Computing Device | 25 | 17.4% |
| Total | 144 | 100.0% |
Internet Access in Bagtown
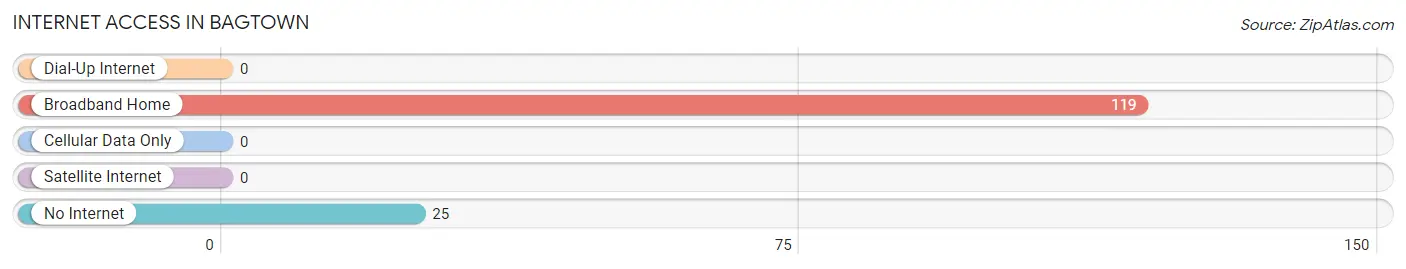
| Internet Type | # Households | % Households |
| Dial-Up Internet | 0 | 0.0% |
| Broadband Home | 119 | 82.6% |
| Cellular Data Only | 0 | 0.0% |
| Satellite Internet | 0 | 0.0% |
| No Internet | 25 | 17.4% |
| Total | 144 | 100.0% |
Bagtown Summary
Bagtown, Maryland is a small town located in the eastern part of the state, just outside of Baltimore. It is a rural community with a population of just over 1,000 people. The town is situated on the banks of the Patapsco River, and is surrounded by rolling hills and farmland.
History
Bagtown was founded in the late 1700s by a group of German immigrants who were looking for a place to settle and start a new life. The town was originally called “Bagtown” because the settlers used bags to carry their belongings as they traveled to the area. The town was officially incorporated in 1810, and it quickly became a thriving agricultural community. The town was known for its production of tobacco, corn, and wheat, and it was also home to a number of small businesses.
Geography
Bagtown is located in the eastern part of Maryland, just outside of Baltimore. It is situated on the banks of the Patapsco River, and is surrounded by rolling hills and farmland. The town is located in a rural area, and is about an hour’s drive from the nearest major city. The town is also close to the Chesapeake Bay, which provides a variety of recreational activities.
Economy
Bagtown’s economy is largely based on agriculture. The town is known for its production of tobacco, corn, and wheat, and it is also home to a number of small businesses. The town also has a few small manufacturing plants, and there are a few restaurants and shops in the area. The town is also home to a number of small farms, which provide fresh produce to the local community.
Demographics
As of the 2010 census, the population of Bagtown was 1,072. The town is predominantly white, with a small African American population. The median household income is $45,000, and the median age is 44. The town is also home to a number of churches, and there are a few schools in the area.
Bagtown is a small, rural community with a rich history and a strong sense of community. The town is known for its agricultural production, and it is also home to a number of small businesses. The town is close to the Chesapeake Bay, and it is a great place to live for those who enjoy the outdoors. Bagtown is a great place to call home, and it is a great place to visit.
Common Questions
What is Per Capita Income in Bagtown?
Per Capita income in Bagtown is $37,667.
What is the Median Family Income in Bagtown?
Median Family Income in Bagtown is $125,329.
What is the Median Household income in Bagtown?
Median Household Income in Bagtown is $122,083.
What is Inequality or Gini Index in Bagtown?
Inequality or Gini Index in Bagtown is 0.27.
What is the Total Population of Bagtown?
Total Population of Bagtown is 521.
What is the Total Male Population of Bagtown?
Total Male Population of Bagtown is 282.
What is the Total Female Population of Bagtown?
Total Female Population of Bagtown is 239.
What is the Ratio of Males per 100 Females in Bagtown?
There are 117.99 Males per 100 Females in Bagtown.
What is the Ratio of Females per 100 Males in Bagtown?
There are 84.75 Females per 100 Males in Bagtown.
What is the Median Population Age in Bagtown?
Median Population Age in Bagtown is 36.2 Years.
What is the Average Family Size in Bagtown
Average Family Size in Bagtown is 3.0 People.
What is the Average Household Size in Bagtown
Average Household Size in Bagtown is 3.6 People.
How Large is the Labor Force in Bagtown?
There are 274 People in the Labor Forcein in Bagtown.
What is the Percentage of People in the Labor Force in Bagtown?
67.7% of People are in the Labor Force in Bagtown.
What is the Unemployment Rate in Bagtown?
Unemployment Rate in Bagtown is 2.6%.