Colmar Manor, MD Map & Demographics
Colmar Manor Map
Colmar Manor Overview
$35,166
PER CAPITA INCOME
$81,900
AVG FAMILY INCOME
$91,250
AVG HOUSEHOLD INCOME
5.5%
WAGE / INCOME GAP [ % ]
94.5¢/ $1
WAGE / INCOME GAP [ $ ]
0.38
INEQUALITY / GINI INDEX
1,516
TOTAL POPULATION
725
MALE POPULATION
791
FEMALE POPULATION
91.66
MALES / 100 FEMALES
109.10
FEMALES / 100 MALES
31.8
MEDIAN AGE
4.4
AVG FAMILY SIZE
3.4
AVG HOUSEHOLD SIZE
904
LABOR FORCE [ PEOPLE ]
73.7%
PERCENT IN LABOR FORCE
7.8%
UNEMPLOYMENT RATE
Income in Colmar Manor
Income Overview in Colmar Manor
Per Capita Income in Colmar Manor is $35,166, while median incomes of families and households are $81,900 and $91,250 respectively.
| Characteristic | Number | Measure |
| Per Capita Income | 1,516 | $35,166 |
| Median Family Income | 292 | $81,900 |
| Mean Family Income | 292 | $126,729 |
| Median Household Income | 450 | $91,250 |
| Mean Household Income | 450 | $116,446 |
| Income Deficit | 292 | $0 |
| Wage / Income Gap (%) | 1,516 | 5.52% |
| Wage / Income Gap ($) | 1,516 | 94.48¢ per $1 |
| Gini / Inequality Index | 1,516 | 0.38 |
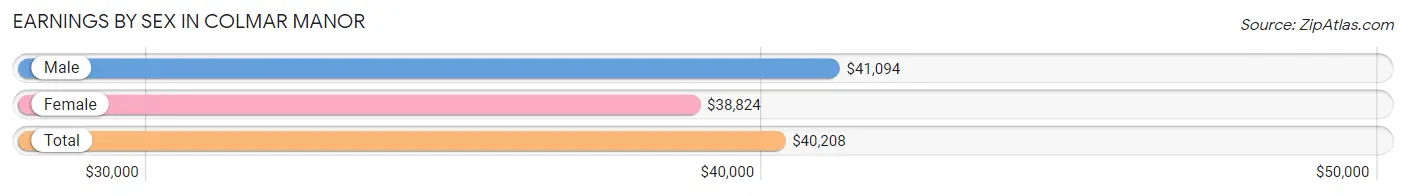
Earnings by Sex in Colmar Manor
Average Earnings in Colmar Manor are $40,208, $41,094 for men and $38,824 for women, a difference of 5.5%.
| Sex | Number | Average Earnings |
| Male | 455 (49.7%) | $41,094 |
| Female | 460 (50.3%) | $38,824 |
| Total | 915 (100.0%) | $40,208 |
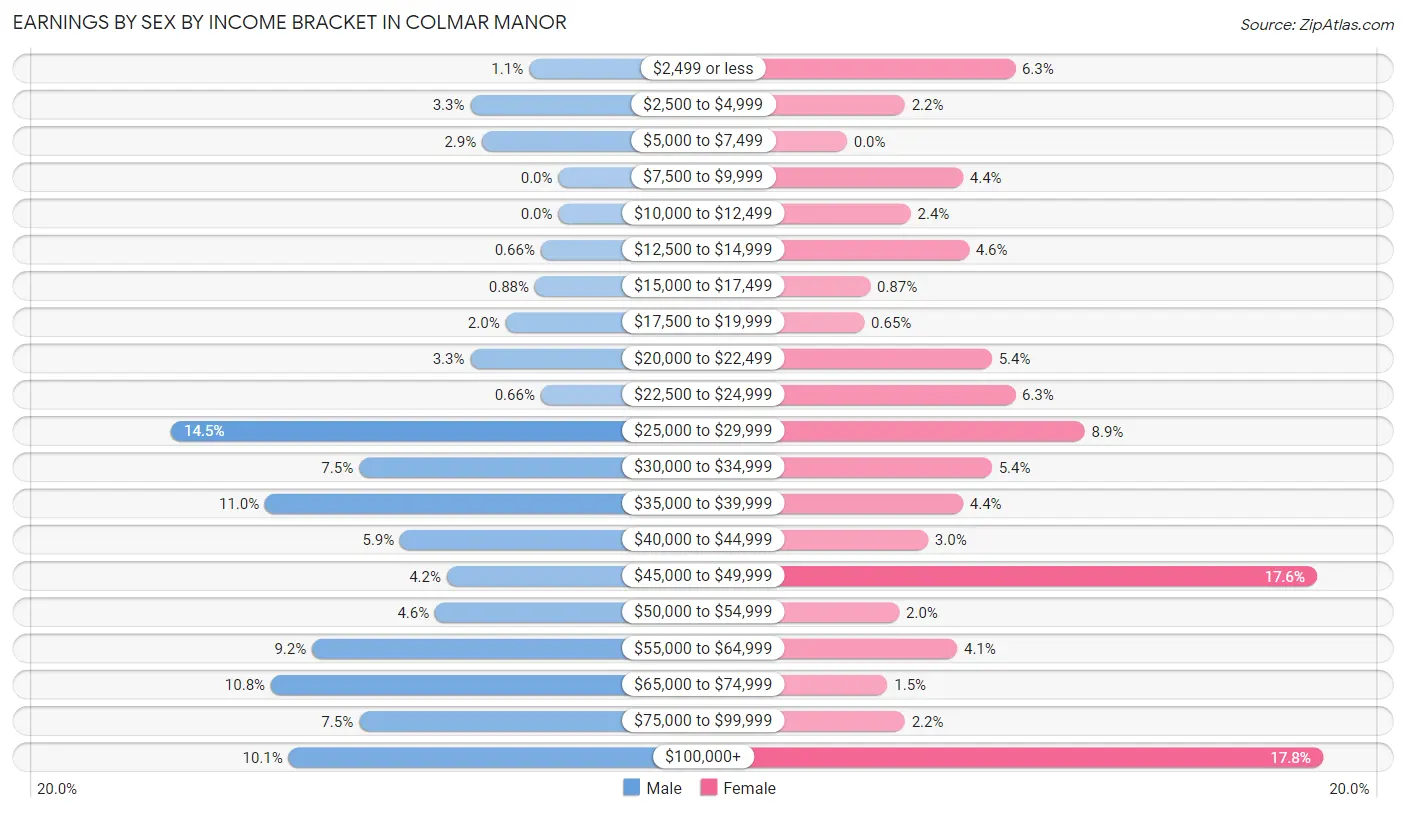
Earnings by Sex by Income Bracket in Colmar Manor
The most common earnings brackets in Colmar Manor are $25,000 to $29,999 for men (66 | 14.5%) and $100,000+ for women (82 | 17.8%).
| Income | Male | Female |
| $2,499 or less | 5 (1.1%) | 29 (6.3%) |
| $2,500 to $4,999 | 15 (3.3%) | 10 (2.2%) |
| $5,000 to $7,499 | 13 (2.9%) | 0 (0.0%) |
| $7,500 to $9,999 | 0 (0.0%) | 20 (4.3%) |
| $10,000 to $12,499 | 0 (0.0%) | 11 (2.4%) |
| $12,500 to $14,999 | 3 (0.7%) | 21 (4.6%) |
| $15,000 to $17,499 | 4 (0.9%) | 4 (0.9%) |
| $17,500 to $19,999 | 9 (2.0%) | 3 (0.6%) |
| $20,000 to $22,499 | 15 (3.3%) | 25 (5.4%) |
| $22,500 to $24,999 | 3 (0.7%) | 29 (6.3%) |
| $25,000 to $29,999 | 66 (14.5%) | 41 (8.9%) |
| $30,000 to $34,999 | 34 (7.5%) | 25 (5.4%) |
| $35,000 to $39,999 | 50 (11.0%) | 20 (4.3%) |
| $40,000 to $44,999 | 27 (5.9%) | 14 (3.0%) |
| $45,000 to $49,999 | 19 (4.2%) | 81 (17.6%) |
| $50,000 to $54,999 | 21 (4.6%) | 9 (2.0%) |
| $55,000 to $64,999 | 42 (9.2%) | 19 (4.1%) |
| $65,000 to $74,999 | 49 (10.8%) | 7 (1.5%) |
| $75,000 to $99,999 | 34 (7.5%) | 10 (2.2%) |
| $100,000+ | 46 (10.1%) | 82 (17.8%) |
| Total | 455 (100.0%) | 460 (100.0%) |
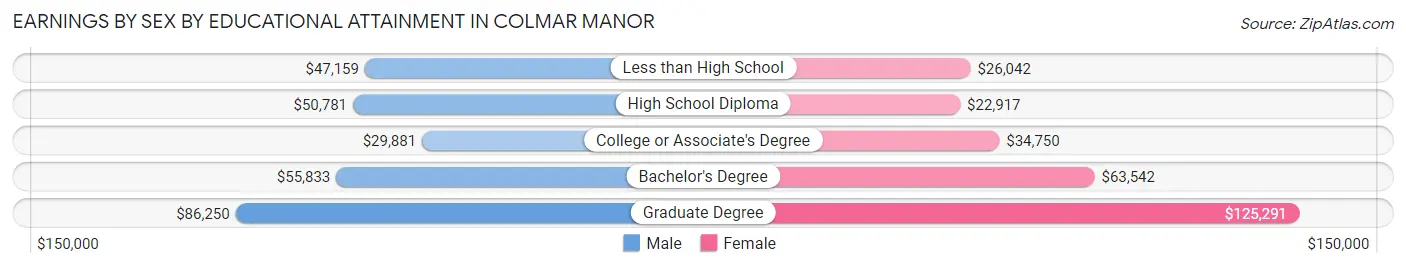
Earnings by Sex by Educational Attainment in Colmar Manor
Average earnings in Colmar Manor are $47,750 for men and $36,667 for women, a difference of 23.2%. Men with an educational attainment of graduate degree enjoy the highest average annual earnings of $86,250, while those with college or associate's degree education earn the least with $29,881. Women with an educational attainment of graduate degree earn the most with the average annual earnings of $125,291, while those with high school diploma education have the smallest earnings of $22,917.
| Educational Attainment | Male Income | Female Income |
| Less than High School | $47,159 | $26,042 |
| High School Diploma | $50,781 | $22,917 |
| College or Associate's Degree | $29,881 | $34,750 |
| Bachelor's Degree | $55,833 | $63,542 |
| Graduate Degree | $86,250 | $125,291 |
| Total | $47,750 | $36,667 |
Family Income in Colmar Manor
Family Income Brackets in Colmar Manor
According to the Colmar Manor family income data, there are 62 families falling into the $200,000+ income range, which is the most common income bracket and makes up 21.2% of all families.
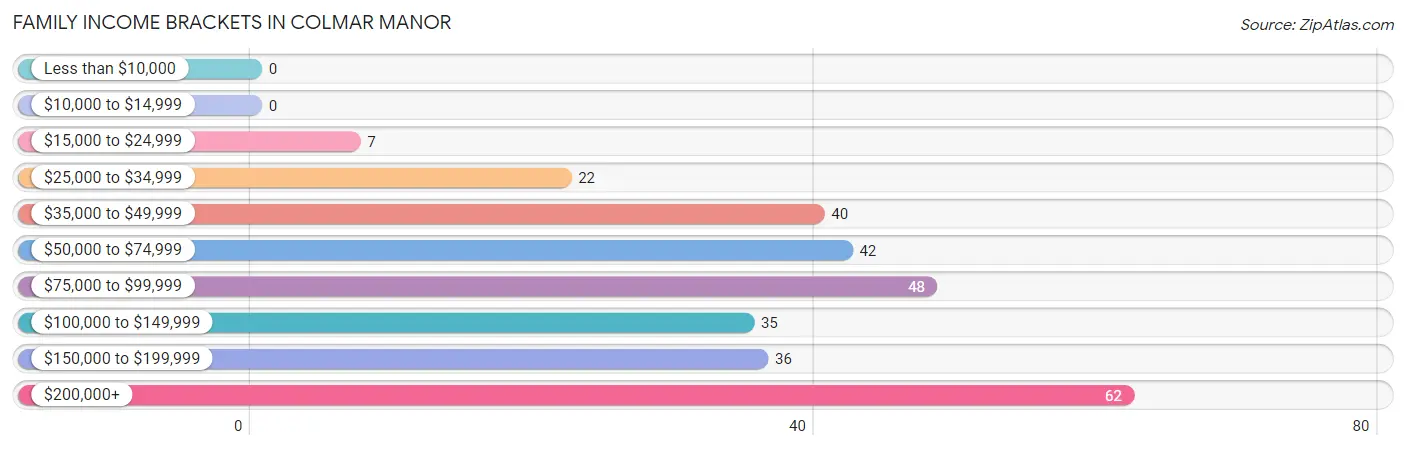
| Income Bracket | # Families | % Families |
| Less than $10,000 | 0 | 0.0% |
| $10,000 to $14,999 | 0 | 0.0% |
| $15,000 to $24,999 | 7 | 2.4% |
| $25,000 to $34,999 | 22 | 7.5% |
| $35,000 to $49,999 | 40 | 13.7% |
| $50,000 to $74,999 | 42 | 14.4% |
| $75,000 to $99,999 | 48 | 16.4% |
| $100,000 to $149,999 | 35 | 12.0% |
| $150,000 to $199,999 | 36 | 12.3% |
| $200,000+ | 62 | 21.2% |
Family Income by Famaliy Size in Colmar Manor
7+ person families (42 | 14.4%) account for the highest median family income in Colmar Manor with $250,001 per family, while 7+ person families (42 | 14.4%) have the highest median income of $35,714 per family member.
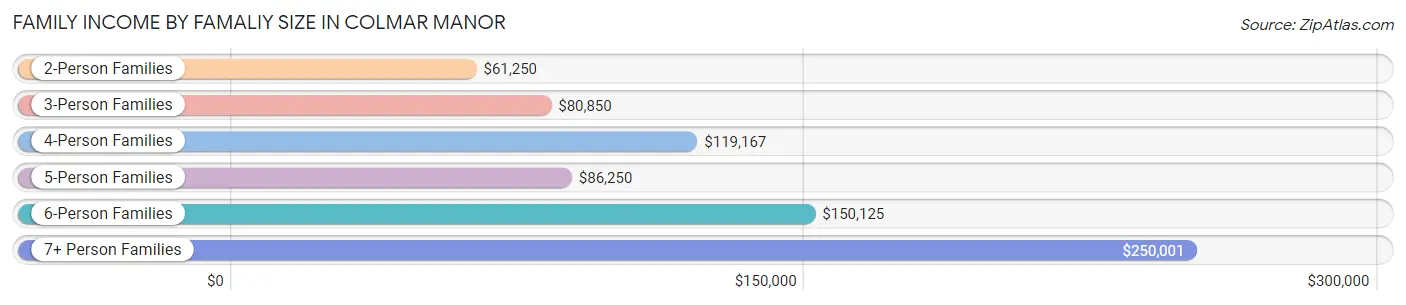
| Income Bracket | # Families | Median Income |
| 2-Person Families | 81 (27.7%) | $61,250 |
| 3-Person Families | 67 (23.0%) | $80,850 |
| 4-Person Families | 48 (16.4%) | $119,167 |
| 5-Person Families | 23 (7.9%) | $86,250 |
| 6-Person Families | 31 (10.6%) | $150,125 |
| 7+ Person Families | 42 (14.4%) | $250,001 |
| Total | 292 (100.0%) | $81,900 |
Family Income by Number of Earners in Colmar Manor
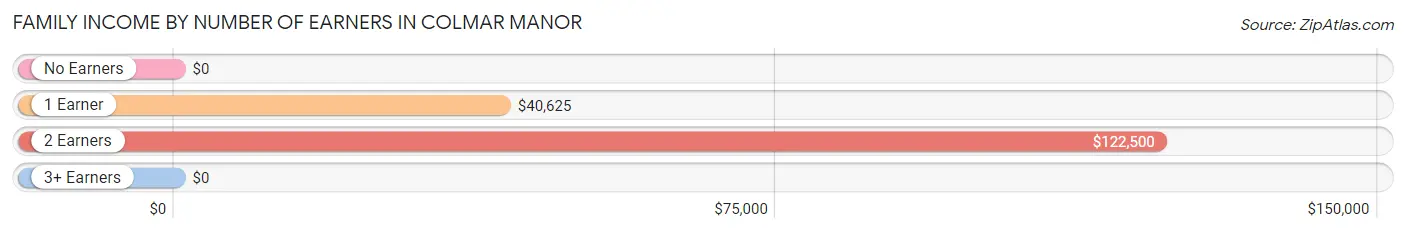
| Number of Earners | # Families | Median Income |
| No Earners | 28 (9.6%) | $0 |
| 1 Earner | 52 (17.8%) | $40,625 |
| 2 Earners | 110 (37.7%) | $122,500 |
| 3+ Earners | 102 (34.9%) | $0 |
| Total | 292 (100.0%) | $81,900 |
Household Income in Colmar Manor
Household Income Brackets in Colmar Manor
With 115 households falling in the category, the $100,000 to $149,999 income range is the most frequent in Colmar Manor, accounting for 25.6% of all households. In contrast, only 7 households (1.6%) fall into the $10,000 to $14,999 income bracket, making it the least populous group.
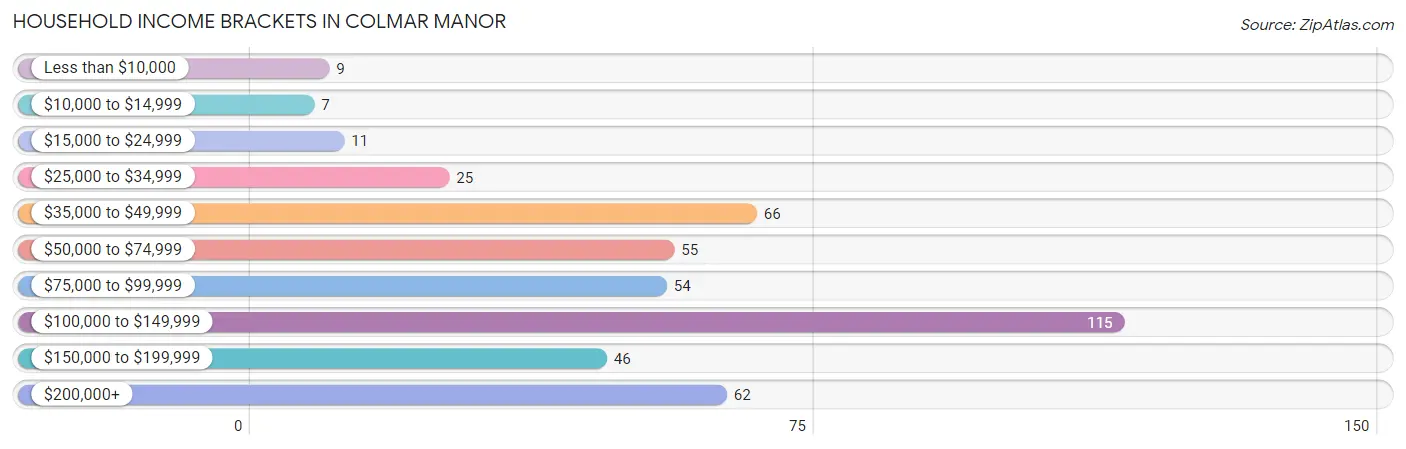
| Income Bracket | # Households | % Households |
| Less than $10,000 | 9 | 2.0% |
| $10,000 to $14,999 | 7 | 1.6% |
| $15,000 to $24,999 | 11 | 2.4% |
| $25,000 to $34,999 | 25 | 5.6% |
| $35,000 to $49,999 | 66 | 14.7% |
| $50,000 to $74,999 | 55 | 12.2% |
| $75,000 to $99,999 | 54 | 12.0% |
| $100,000 to $149,999 | 115 | 25.6% |
| $150,000 to $199,999 | 46 | 10.2% |
| $200,000+ | 62 | 13.8% |
Household Income by Householder Age in Colmar Manor
The median household income in Colmar Manor is $91,250, with the highest median household income of $147,645 found in the 45 to 64 years age bracket for the primary householder. A total of 229 households (50.9%) fall into this category. Meanwhile, the 65+ years age bracket for the primary householder has the lowest median household income of $44,000, with 104 households (23.1%) in this group.
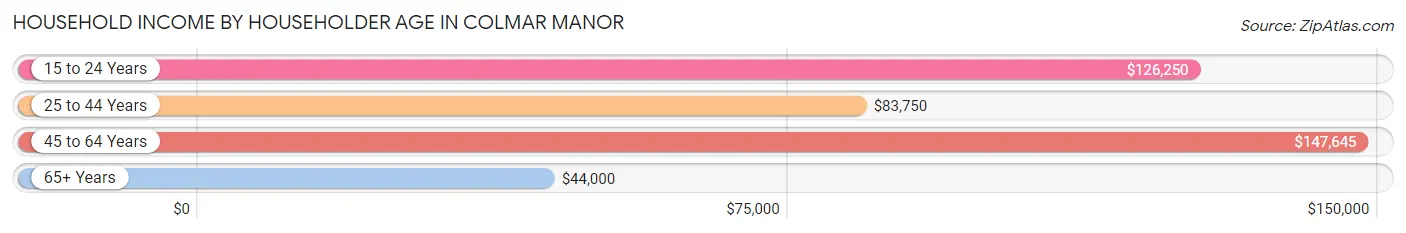
| Income Bracket | # Households | Median Income |
| 15 to 24 Years | 22 (4.9%) | $126,250 |
| 25 to 44 Years | 95 (21.1%) | $83,750 |
| 45 to 64 Years | 229 (50.9%) | $147,645 |
| 65+ Years | 104 (23.1%) | $44,000 |
| Total | 450 (100.0%) | $91,250 |
Poverty in Colmar Manor
Income Below Poverty by Sex and Age in Colmar Manor
With 2.6% poverty level for males and 6.2% for females among the residents of Colmar Manor, 18 to 24 year old males and 12 to 14 year old females are the most vulnerable to poverty, with 13 males (12.5%) and 3 females (13.0%) in their respective age groups living below the poverty level.
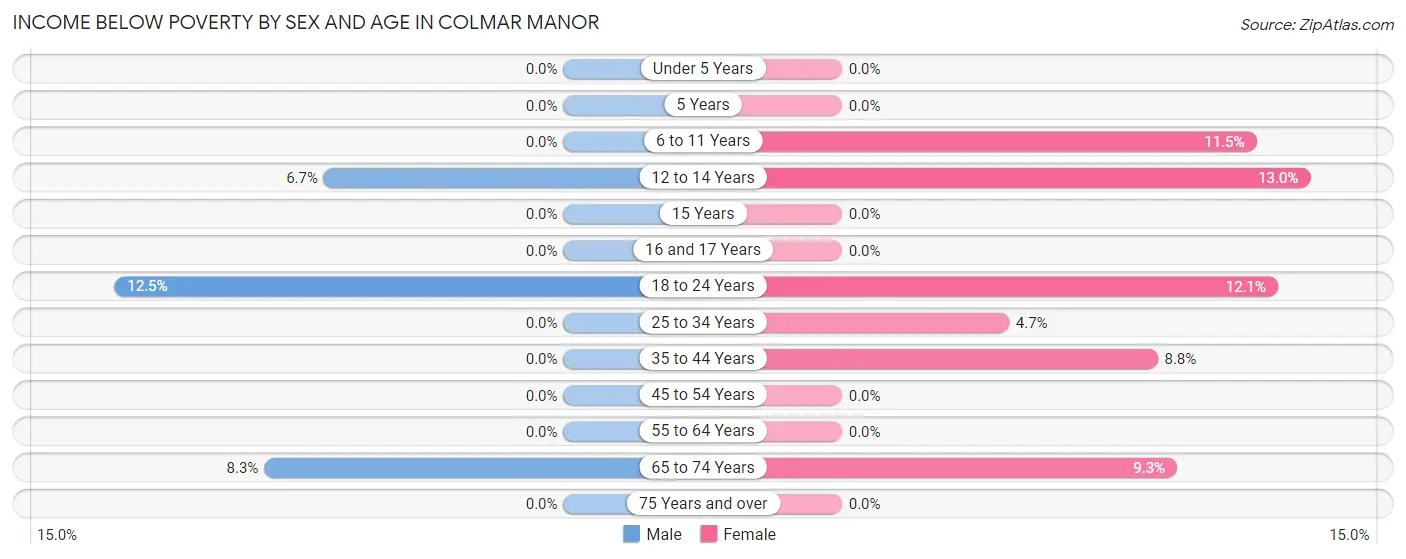
| Age Bracket | Male | Female |
| Under 5 Years | 0 (0.0%) | 0 (0.0%) |
| 5 Years | 0 (0.0%) | 0 (0.0%) |
| 6 to 11 Years | 0 (0.0%) | 6 (11.5%) |
| 12 to 14 Years | 3 (6.7%) | 3 (13.0%) |
| 15 Years | 0 (0.0%) | 0 (0.0%) |
| 16 and 17 Years | 0 (0.0%) | 0 (0.0%) |
| 18 to 24 Years | 13 (12.5%) | 21 (12.1%) |
| 25 to 34 Years | 0 (0.0%) | 4 (4.6%) |
| 35 to 44 Years | 0 (0.0%) | 8 (8.8%) |
| 45 to 54 Years | 0 (0.0%) | 0 (0.0%) |
| 55 to 64 Years | 0 (0.0%) | 0 (0.0%) |
| 65 to 74 Years | 3 (8.3%) | 7 (9.3%) |
| 75 Years and over | 0 (0.0%) | 0 (0.0%) |
| Total | 19 (2.6%) | 49 (6.2%) |
Income Above Poverty by Sex and Age in Colmar Manor
According to the poverty statistics in Colmar Manor, males aged under 5 years and females aged under 5 years are the age groups that are most secure financially, with 100.0% of males and 100.0% of females in these age groups living above the poverty line.
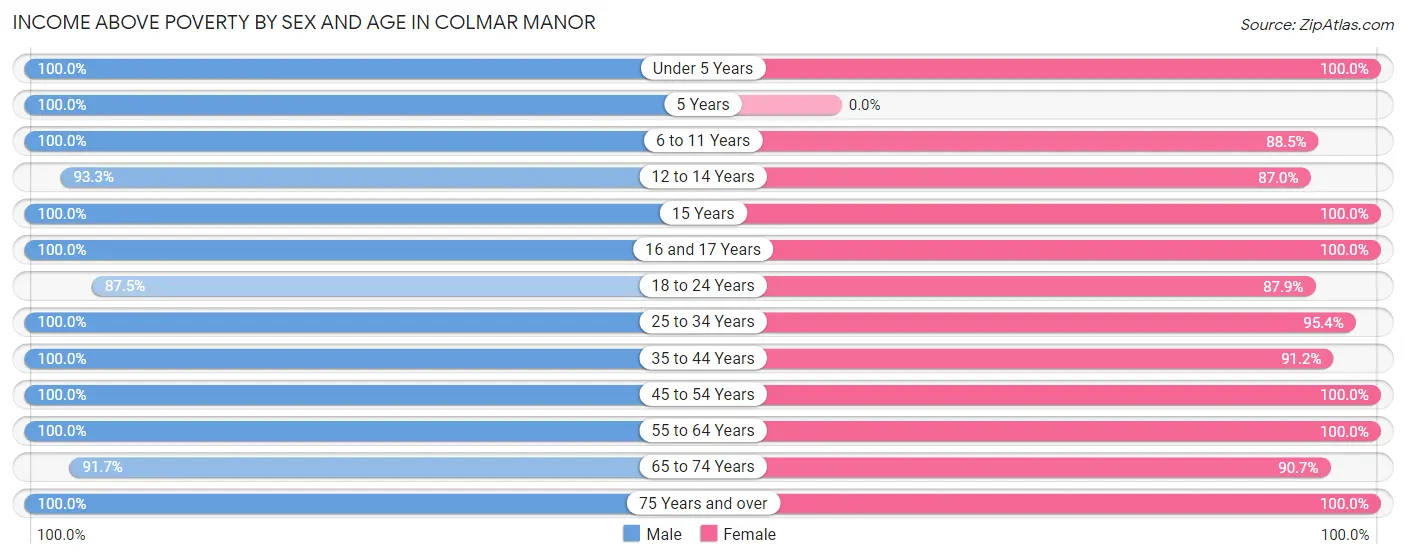
| Age Bracket | Male | Female |
| Under 5 Years | 57 (100.0%) | 45 (100.0%) |
| 5 Years | 6 (100.0%) | 0 (0.0%) |
| 6 to 11 Years | 49 (100.0%) | 46 (88.5%) |
| 12 to 14 Years | 42 (93.3%) | 20 (87.0%) |
| 15 Years | 11 (100.0%) | 2 (100.0%) |
| 16 and 17 Years | 24 (100.0%) | 27 (100.0%) |
| 18 to 24 Years | 91 (87.5%) | 152 (87.9%) |
| 25 to 34 Years | 105 (100.0%) | 82 (95.4%) |
| 35 to 44 Years | 84 (100.0%) | 83 (91.2%) |
| 45 to 54 Years | 126 (100.0%) | 79 (100.0%) |
| 55 to 64 Years | 61 (100.0%) | 126 (100.0%) |
| 65 to 74 Years | 33 (91.7%) | 68 (90.7%) |
| 75 Years and over | 17 (100.0%) | 12 (100.0%) |
| Total | 706 (97.4%) | 742 (93.8%) |
Income Below Poverty Among Married-Couple Families in Colmar Manor
The poverty statistics for married-couple families in Colmar Manor show that 1.5% or 3 of the total 204 families live below the poverty line. Families with 3 or 4 children have the highest poverty rate of 11.5%, comprising of 3 families. On the other hand, families with no children have the lowest poverty rate of 0.0%, which includes 0 families.
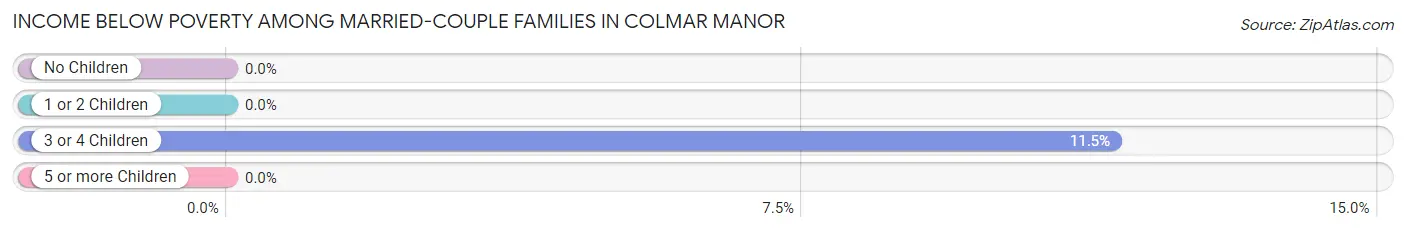
| Children | Above Poverty | Below Poverty |
| No Children | 75 (100.0%) | 0 (0.0%) |
| 1 or 2 Children | 103 (100.0%) | 0 (0.0%) |
| 3 or 4 Children | 23 (88.5%) | 3 (11.5%) |
| 5 or more Children | 0 (0.0%) | 0 (0.0%) |
| Total | 201 (98.5%) | 3 (1.5%) |
Income Below Poverty Among Single-Parent Households in Colmar Manor
| Children | Single Father | Single Mother |
| No Children | 0 (0.0%) | 0 (0.0%) |
| 1 or 2 Children | 0 (0.0%) | 0 (0.0%) |
| 3 or 4 Children | 0 (0.0%) | 0 (0.0%) |
| 5 or more Children | 0 (0.0%) | 0 (0.0%) |
| Total | 0 (0.0%) | 0 (0.0%) |
Income Below Poverty Among Married-Couple vs Single-Parent Households in Colmar Manor
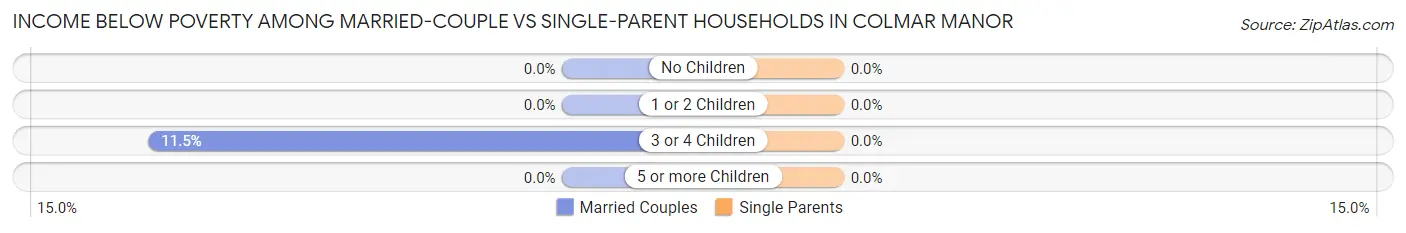
| Children | Married-Couple Families | Single-Parent Households |
| No Children | 0 (0.0%) | 0 (0.0%) |
| 1 or 2 Children | 0 (0.0%) | 0 (0.0%) |
| 3 or 4 Children | 3 (11.5%) | 0 (0.0%) |
| 5 or more Children | 0 (0.0%) | 0 (0.0%) |
| Total | 3 (1.5%) | 0 (0.0%) |
Race in Colmar Manor
The most populous races in Colmar Manor are Hispanic or Latino (834 | 55.0%), Some other Race (576 | 38.0%), and Black / African American (432 | 28.5%).
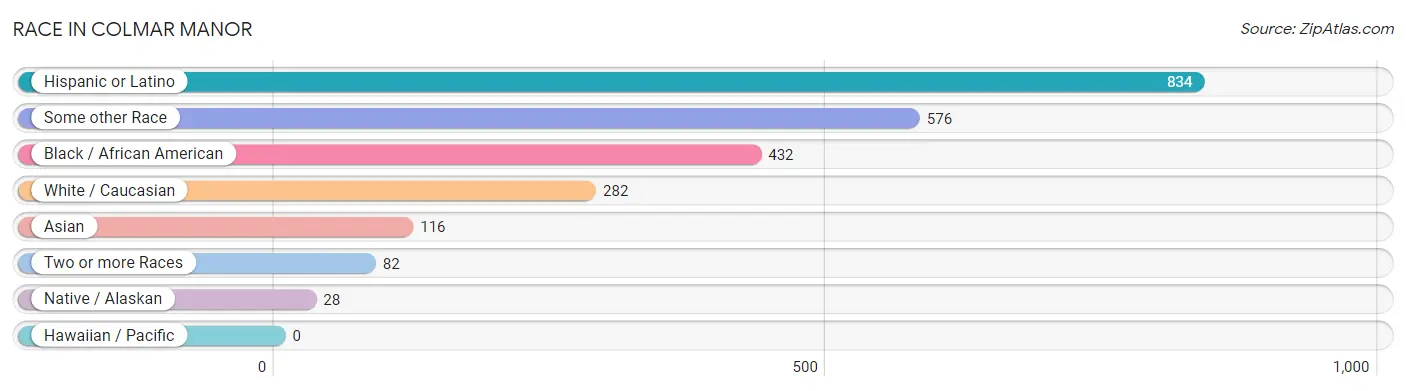
| Race | # Population | % Population |
| Asian | 116 | 7.6% |
| Black / African American | 432 | 28.5% |
| Hawaiian / Pacific | 0 | 0.0% |
| Hispanic or Latino | 834 | 55.0% |
| Native / Alaskan | 28 | 1.8% |
| White / Caucasian | 282 | 18.6% |
| Two or more Races | 82 | 5.4% |
| Some other Race | 576 | 38.0% |
| Total | 1,516 | 100.0% |
Ancestry in Colmar Manor
The most populous ancestries reported in Colmar Manor are Central American (533 | 35.2%), Salvadoran (489 | 32.3%), Mexican (128 | 8.4%), Korean (108 | 7.1%), and Subsaharan African (63 | 4.2%), together accounting for 87.1% of all Colmar Manor residents.
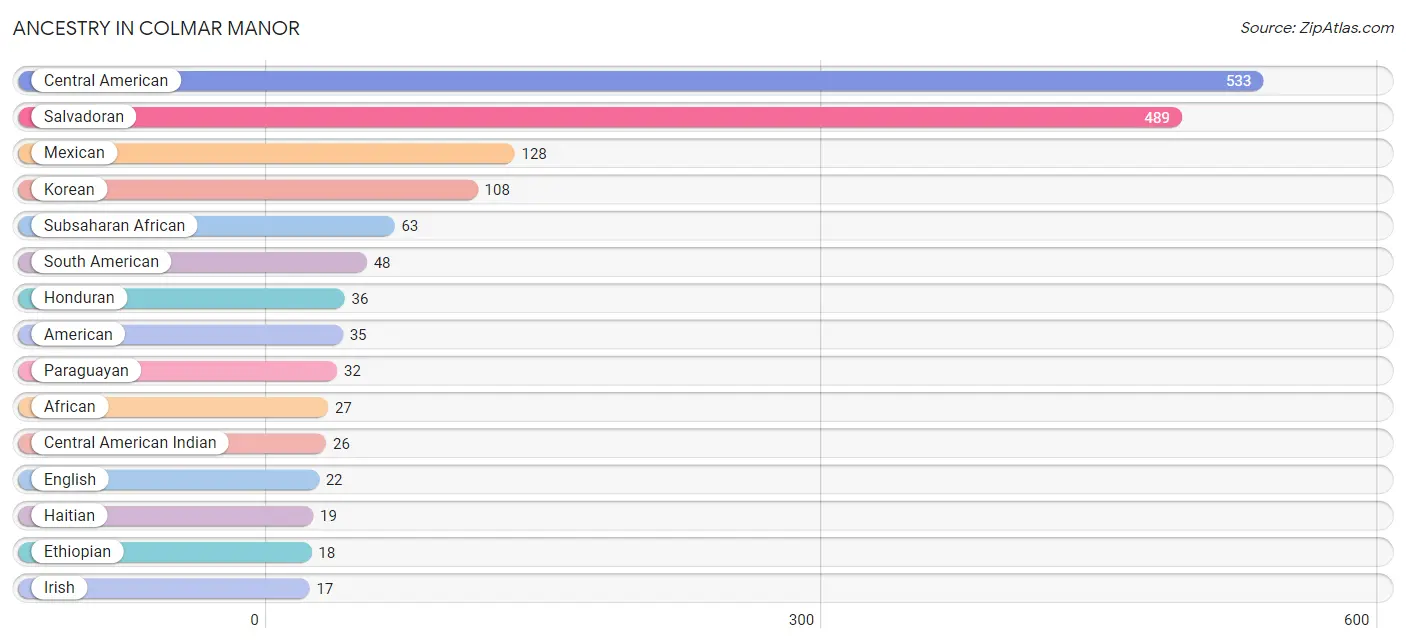
| Ancestry | # Population | % Population |
| African | 27 | 1.8% |
| American | 35 | 2.3% |
| Argentinean | 6 | 0.4% |
| Bolivian | 7 | 0.5% |
| British | 16 | 1.1% |
| British West Indian | 4 | 0.3% |
| Central American | 533 | 35.2% |
| Central American Indian | 26 | 1.7% |
| Dominican | 2 | 0.1% |
| Dutch | 6 | 0.4% |
| English | 22 | 1.5% |
| Ethiopian | 18 | 1.2% |
| European | 11 | 0.7% |
| French | 9 | 0.6% |
| French Canadian | 3 | 0.2% |
| German | 3 | 0.2% |
| Guatemalan | 8 | 0.5% |
| Haitian | 19 | 1.3% |
| Honduran | 36 | 2.4% |
| Indian (Asian) | 8 | 0.5% |
| Irish | 17 | 1.1% |
| Italian | 3 | 0.2% |
| Korean | 108 | 7.1% |
| Mexican | 128 | 8.4% |
| Mexican American Indian | 6 | 0.4% |
| Nigerian | 3 | 0.2% |
| Paraguayan | 32 | 2.1% |
| Peruvian | 3 | 0.2% |
| Polish | 13 | 0.9% |
| Puerto Rican | 11 | 0.7% |
| Russian | 3 | 0.2% |
| Salvadoran | 489 | 32.3% |
| Scottish | 6 | 0.4% |
| South American | 48 | 3.2% |
| Subsaharan African | 63 | 4.2% |
| Trinidadian and Tobagonian | 16 | 1.1% |
| Ugandan | 15 | 1.0% |
| Welsh | 4 | 0.3% | View All 38 Rows |
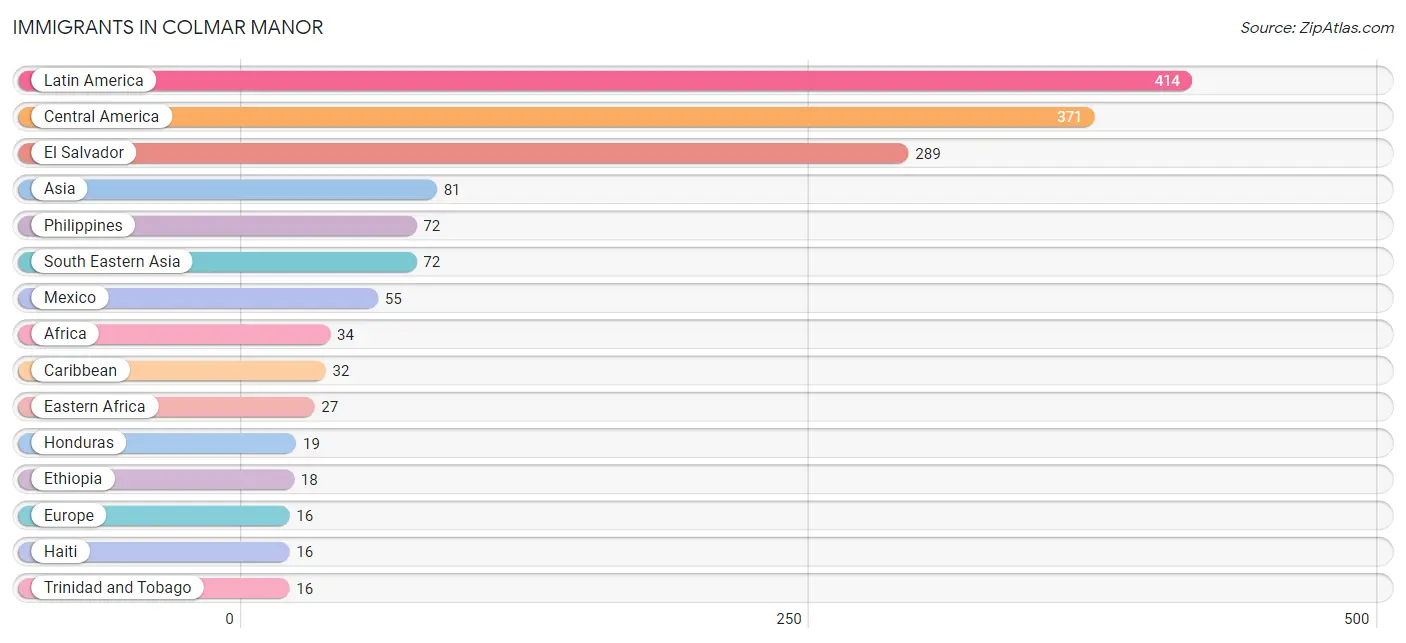
Immigrants in Colmar Manor
The most numerous immigrant groups reported in Colmar Manor came from Latin America (414 | 27.3%), Central America (371 | 24.5%), El Salvador (289 | 19.1%), Asia (81 | 5.3%), and Philippines (72 | 4.8%), together accounting for 80.9% of all Colmar Manor residents.
| Immigration Origin | # Population | % Population |
| Africa | 34 | 2.2% |
| Asia | 81 | 5.3% |
| Bolivia | 4 | 0.3% |
| Caribbean | 32 | 2.1% |
| Central America | 371 | 24.5% |
| China | 2 | 0.1% |
| Eastern Africa | 27 | 1.8% |
| Eastern Asia | 2 | 0.1% |
| Eastern Europe | 7 | 0.5% |
| El Salvador | 289 | 19.1% |
| Ethiopia | 18 | 1.2% |
| Europe | 16 | 1.1% |
| France | 9 | 0.6% |
| Guatemala | 8 | 0.5% |
| Haiti | 16 | 1.1% |
| Honduras | 19 | 1.3% |
| Hungary | 7 | 0.5% |
| Kenya | 3 | 0.2% |
| Latin America | 414 | 27.3% |
| Mexico | 55 | 3.6% |
| Nigeria | 7 | 0.5% |
| Pakistan | 5 | 0.3% |
| Philippines | 72 | 4.8% |
| South America | 11 | 0.7% |
| South Central Asia | 7 | 0.5% |
| South Eastern Asia | 72 | 4.8% |
| Sri Lanka | 2 | 0.1% |
| Trinidad and Tobago | 16 | 1.1% |
| Uganda | 6 | 0.4% |
| Western Africa | 7 | 0.5% |
| Western Europe | 9 | 0.6% | View All 31 Rows |
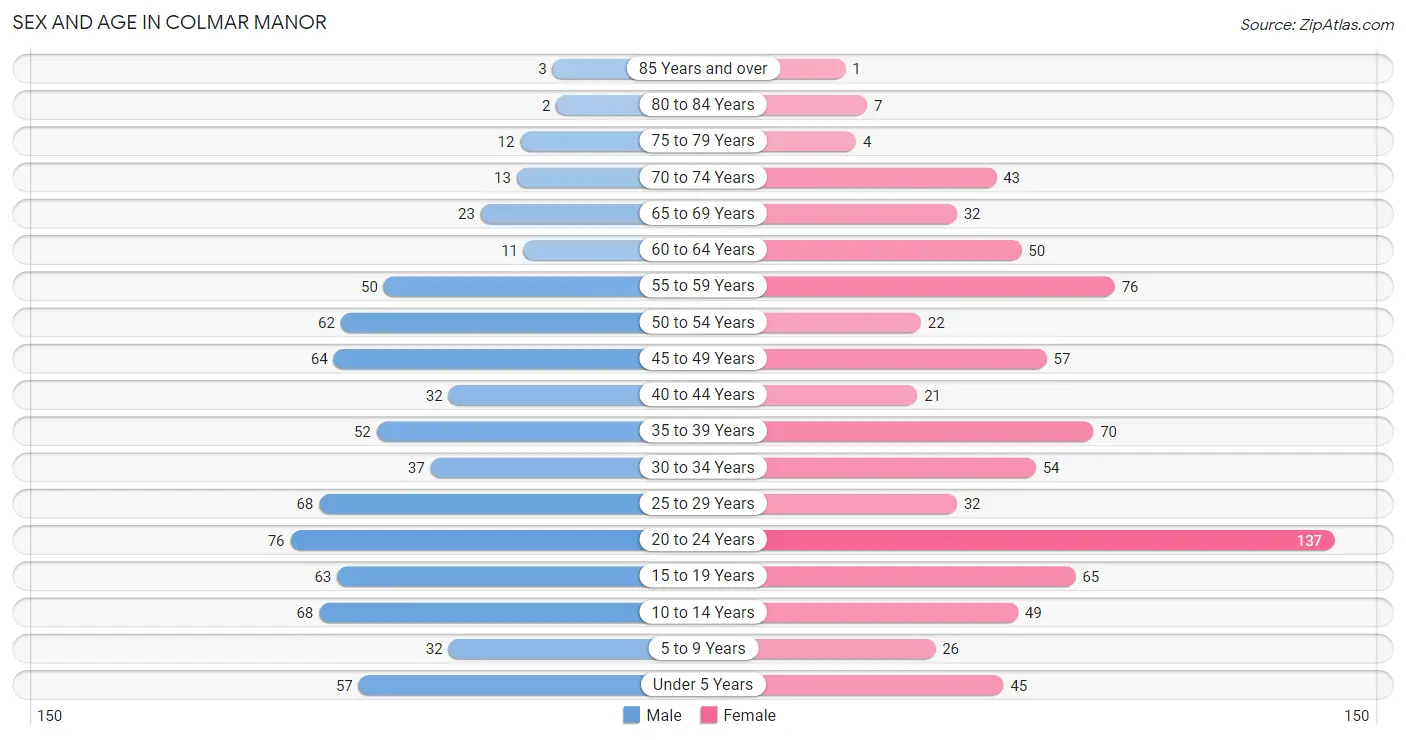
Sex and Age in Colmar Manor
Sex and Age in Colmar Manor
The most populous age groups in Colmar Manor are 20 to 24 Years (76 | 10.5%) for men and 20 to 24 Years (137 | 17.3%) for women.
| Age Bracket | Male | Female |
| Under 5 Years | 57 (7.9%) | 45 (5.7%) |
| 5 to 9 Years | 32 (4.4%) | 26 (3.3%) |
| 10 to 14 Years | 68 (9.4%) | 49 (6.2%) |
| 15 to 19 Years | 63 (8.7%) | 65 (8.2%) |
| 20 to 24 Years | 76 (10.5%) | 137 (17.3%) |
| 25 to 29 Years | 68 (9.4%) | 32 (4.1%) |
| 30 to 34 Years | 37 (5.1%) | 54 (6.8%) |
| 35 to 39 Years | 52 (7.2%) | 70 (8.8%) |
| 40 to 44 Years | 32 (4.4%) | 21 (2.6%) |
| 45 to 49 Years | 64 (8.8%) | 57 (7.2%) |
| 50 to 54 Years | 62 (8.6%) | 22 (2.8%) |
| 55 to 59 Years | 50 (6.9%) | 76 (9.6%) |
| 60 to 64 Years | 11 (1.5%) | 50 (6.3%) |
| 65 to 69 Years | 23 (3.2%) | 32 (4.1%) |
| 70 to 74 Years | 13 (1.8%) | 43 (5.4%) |
| 75 to 79 Years | 12 (1.7%) | 4 (0.5%) |
| 80 to 84 Years | 2 (0.3%) | 7 (0.9%) |
| 85 Years and over | 3 (0.4%) | 1 (0.1%) |
| Total | 725 (100.0%) | 791 (100.0%) |
Families and Households in Colmar Manor
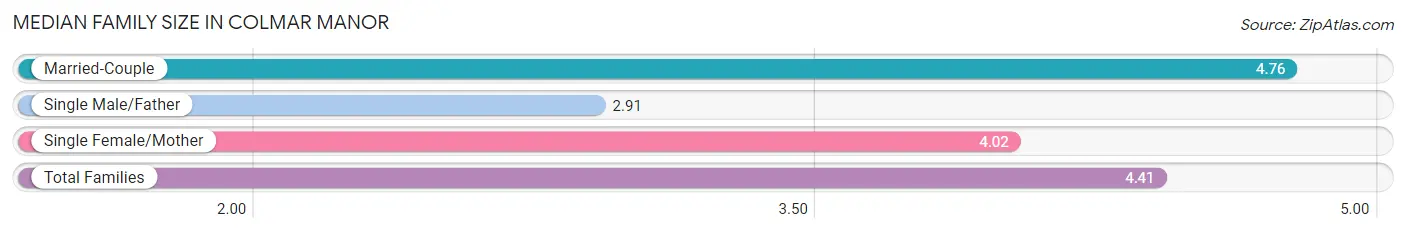
Median Family Size in Colmar Manor
The median family size in Colmar Manor is 4.41 persons per family, with married-couple families (204 | 69.9%) accounting for the largest median family size of 4.76 persons per family. On the other hand, single male/father families (33 | 11.3%) represent the smallest median family size with 2.91 persons per family.
| Family Type | # Families | Family Size |
| Married-Couple | 204 (69.9%) | 4.76 |
| Single Male/Father | 33 (11.3%) | 2.91 |
| Single Female/Mother | 55 (18.8%) | 4.02 |
| Total Families | 292 (100.0%) | 4.41 |
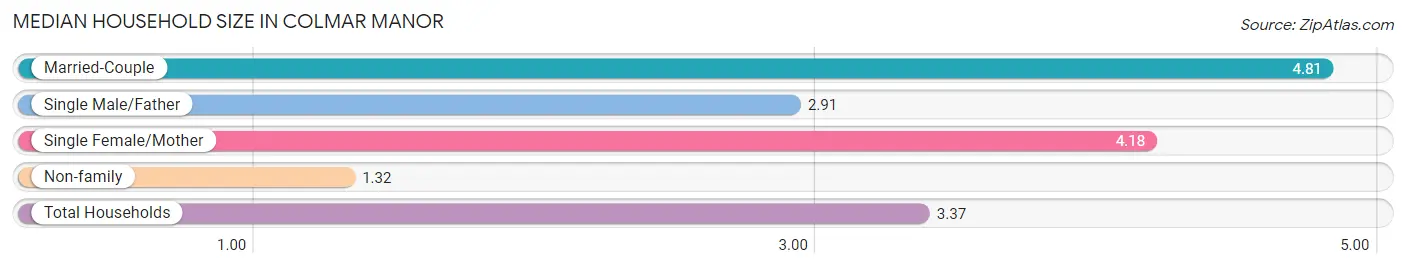
Median Household Size in Colmar Manor
The median household size in Colmar Manor is 3.37 persons per household, with married-couple households (204 | 45.3%) accounting for the largest median household size of 4.81 persons per household. non-family households (158 | 35.1%) represent the smallest median household size with 1.32 persons per household.
| Household Type | # Households | Household Size |
| Married-Couple | 204 (45.3%) | 4.81 |
| Single Male/Father | 33 (7.3%) | 2.91 |
| Single Female/Mother | 55 (12.2%) | 4.18 |
| Non-family | 158 (35.1%) | 1.32 |
| Total Households | 450 (100.0%) | 3.37 |
Household Size by Marriage Status in Colmar Manor
Out of a total of 450 households in Colmar Manor, 292 (64.9%) are family households, while 158 (35.1%) are nonfamily households. The most numerous type of family households are 2-person households, comprising 81, and the most common type of nonfamily households are 1-person households, comprising 134.
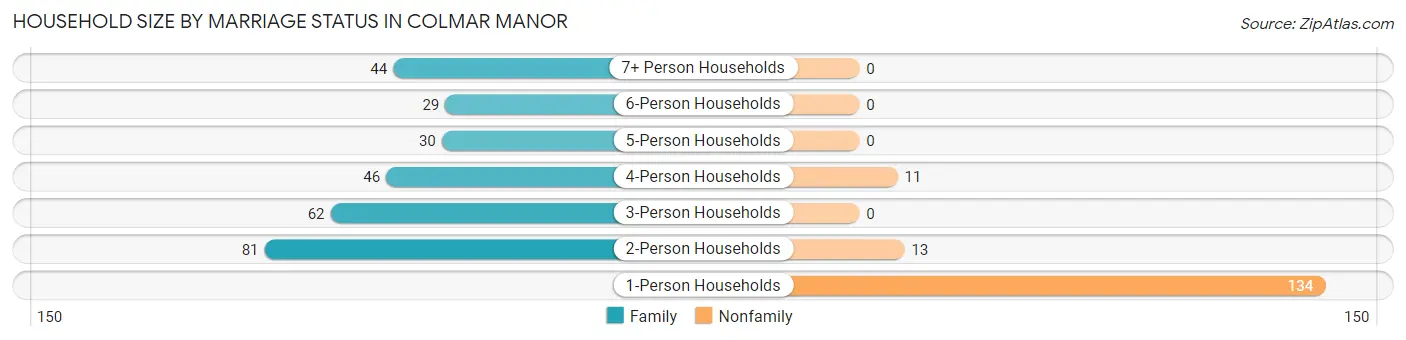
| Household Size | Family Households | Nonfamily Households |
| 1-Person Households | - | 134 (29.8%) |
| 2-Person Households | 81 (18.0%) | 13 (2.9%) |
| 3-Person Households | 62 (13.8%) | 0 (0.0%) |
| 4-Person Households | 46 (10.2%) | 11 (2.4%) |
| 5-Person Households | 30 (6.7%) | 0 (0.0%) |
| 6-Person Households | 29 (6.4%) | 0 (0.0%) |
| 7+ Person Households | 44 (9.8%) | 0 (0.0%) |
| Total | 292 (64.9%) | 158 (35.1%) |
Female Fertility in Colmar Manor
Fertility by Age in Colmar Manor
Average fertility rate in Colmar Manor is 25.0 births per 1,000 women. Women in the age bracket of 20 to 34 years have the highest fertility rate with 49.0 births per 1,000 women. Women in the age bracket of 20 to 34 years acount for 100.0% of all women with births.
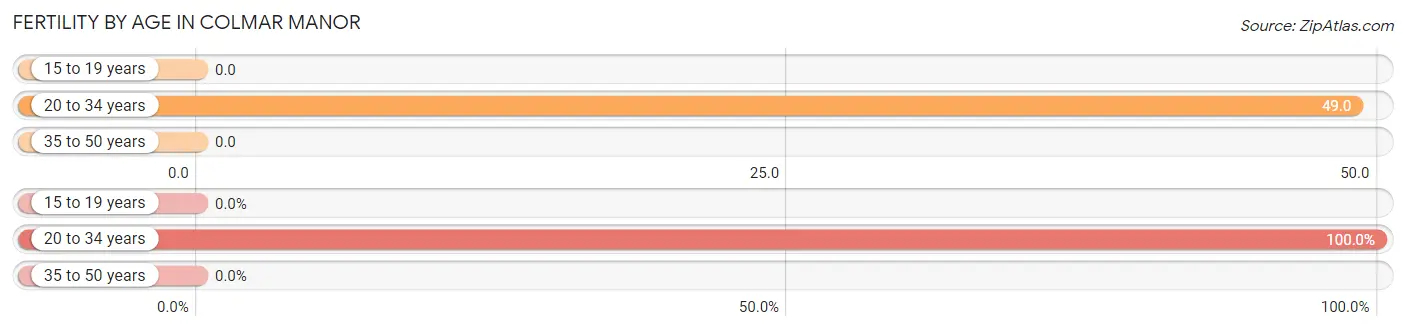
| Age Bracket | Women with Births | Births / 1,000 Women |
| 15 to 19 years | 0 (0.0%) | 0.0 |
| 20 to 34 years | 11 (100.0%) | 49.0 |
| 35 to 50 years | 0 (0.0%) | 0.0 |
| Total | 11 (100.0%) | 25.0 |
Fertility by Age by Marriage Status in Colmar Manor
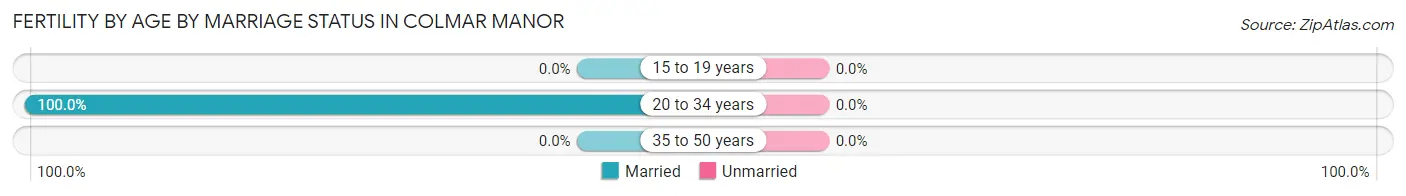
| Age Bracket | Married | Unmarried |
| 15 to 19 years | 0 (0.0%) | 0 (0.0%) |
| 20 to 34 years | 11 (100.0%) | 0 (0.0%) |
| 35 to 50 years | 0 (0.0%) | 0 (0.0%) |
| Total | 11 (100.0%) | 0 (0.0%) |
Fertility by Education in Colmar Manor
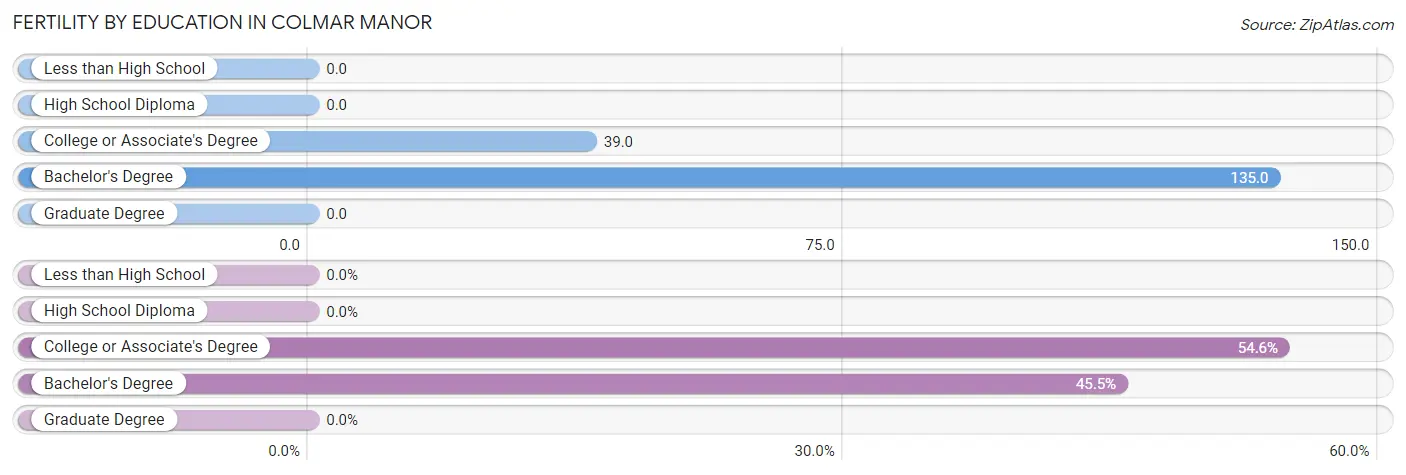
| Educational Attainment | Women with Births | Births / 1,000 Women |
| Less than High School | 0 (0.0%) | 0.0 |
| High School Diploma | 0 (0.0%) | 0.0 |
| College or Associate's Degree | 6 (54.5%) | 39.0 |
| Bachelor's Degree | 5 (45.5%) | 135.0 |
| Graduate Degree | 0 (0.0%) | 0.0 |
| Total | 11 (100.0%) | 25.0 |
Fertility by Education by Marriage Status in Colmar Manor
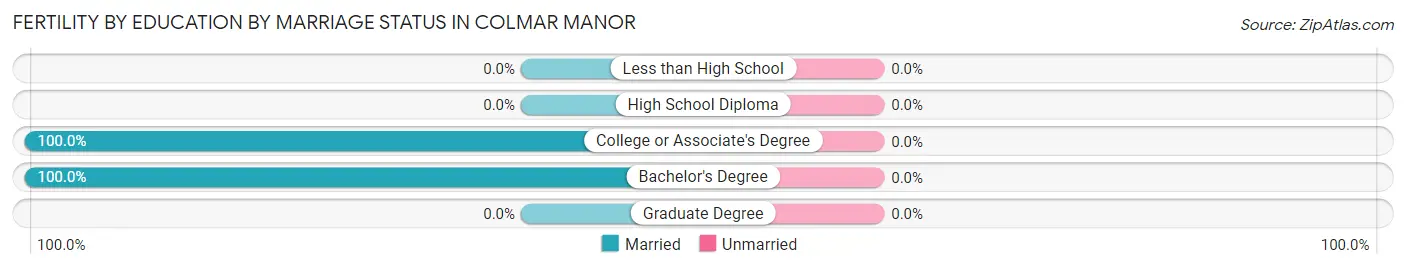
| Educational Attainment | Married | Unmarried |
| Less than High School | 0 (0.0%) | 0 (0.0%) |
| High School Diploma | 0 (0.0%) | 0 (0.0%) |
| College or Associate's Degree | 6 (100.0%) | 0 (0.0%) |
| Bachelor's Degree | 5 (100.0%) | 0 (0.0%) |
| Graduate Degree | 0 (0.0%) | 0 (0.0%) |
| Total | 11 (100.0%) | 0 (0.0%) |
Employment Characteristics in Colmar Manor
Employment by Class of Employer in Colmar Manor
Among the 817 employed individuals in Colmar Manor, private company employees (531 | 65.0%), not-for-profit organizations (133 | 16.3%), and federal government employees (48 | 5.9%) make up the most common classes of employment.
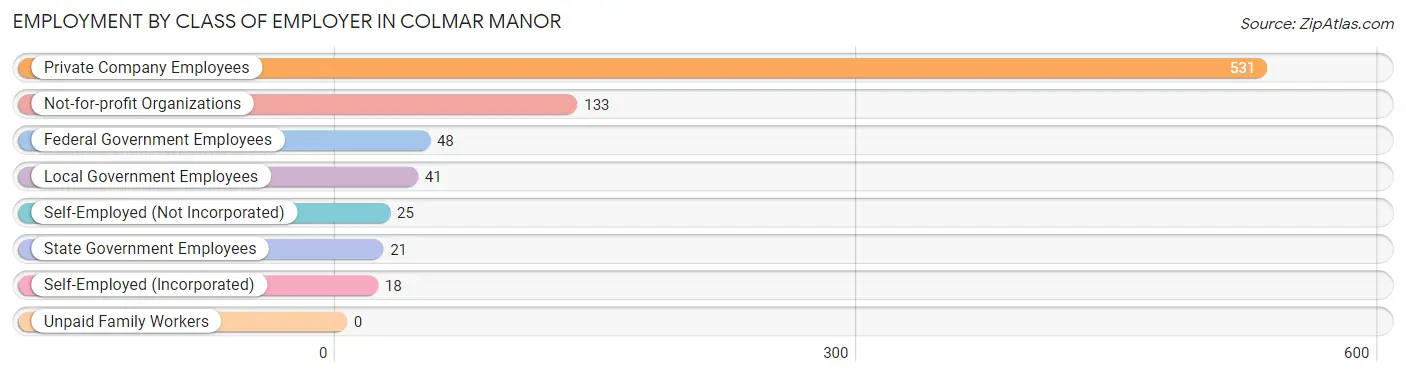
| Employer Class | # Employees | % Employees |
| Private Company Employees | 531 | 65.0% |
| Self-Employed (Incorporated) | 18 | 2.2% |
| Self-Employed (Not Incorporated) | 25 | 3.1% |
| Not-for-profit Organizations | 133 | 16.3% |
| Local Government Employees | 41 | 5.0% |
| State Government Employees | 21 | 2.6% |
| Federal Government Employees | 48 | 5.9% |
| Unpaid Family Workers | 0 | 0.0% |
| Total | 817 | 100.0% |
Employment Status by Age in Colmar Manor
According to the labor force statistics for Colmar Manor, out of the total population over 16 years of age (1,226), 73.7% or 904 individuals are in the labor force, with 7.8% or 71 of them unemployed. The age group with the highest labor force participation rate is 55 to 59 years, with 95.2% or 120 individuals in the labor force. Within the labor force, the 30 to 34 years age range has the highest percentage of unemployed individuals, with 18.3% or 15 of them being unemployed.
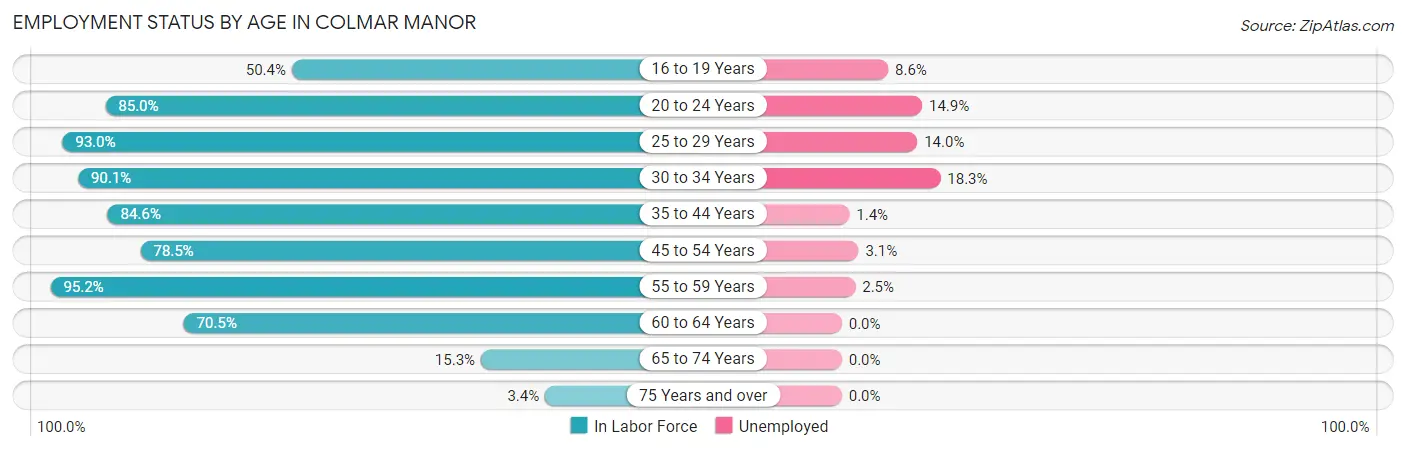
| Age Bracket | In Labor Force | Unemployed |
| 16 to 19 Years | 58 (50.4%) | 5 (8.6%) |
| 20 to 24 Years | 181 (85.0%) | 27 (14.9%) |
| 25 to 29 Years | 93 (93.0%) | 13 (14.0%) |
| 30 to 34 Years | 82 (90.1%) | 15 (18.3%) |
| 35 to 44 Years | 148 (84.6%) | 2 (1.4%) |
| 45 to 54 Years | 161 (78.5%) | 5 (3.1%) |
| 55 to 59 Years | 120 (95.2%) | 3 (2.5%) |
| 60 to 64 Years | 43 (70.5%) | 0 (0.0%) |
| 65 to 74 Years | 17 (15.3%) | 0 (0.0%) |
| 75 Years and over | 1 (3.4%) | 0 (0.0%) |
| Total | 904 (73.7%) | 71 (7.8%) |
Employment Status by Educational Attainment in Colmar Manor
According to labor force statistics for Colmar Manor, 85.4% of individuals (647) out of the total population between 25 and 64 years of age (758) are in the labor force, with 5.9% or 38 of them being unemployed. The group with the highest labor force participation rate are those with the educational attainment of high school diploma, with 92.5% or 160 individuals in the labor force. Within the labor force, individuals with high school diploma education have the highest percentage of unemployment, with 16.3% or 26 of them being unemployed.
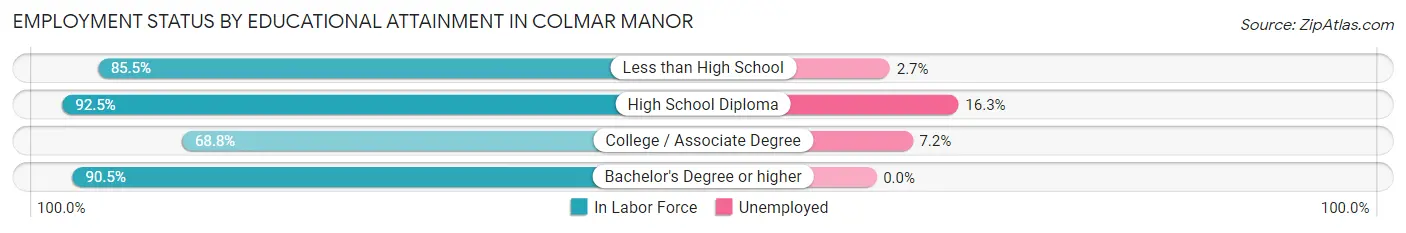
| Educational Attainment | In Labor Force | Unemployed |
| Less than High School | 188 (85.5%) | 6 (2.7%) |
| High School Diploma | 160 (92.5%) | 28 (16.3%) |
| College / Associate Degree | 99 (68.8%) | 10 (7.2%) |
| Bachelor's Degree or higher | 200 (90.5%) | 0 (0.0%) |
| Total | 647 (85.4%) | 45 (5.9%) |
Employment Occupations by Sex in Colmar Manor
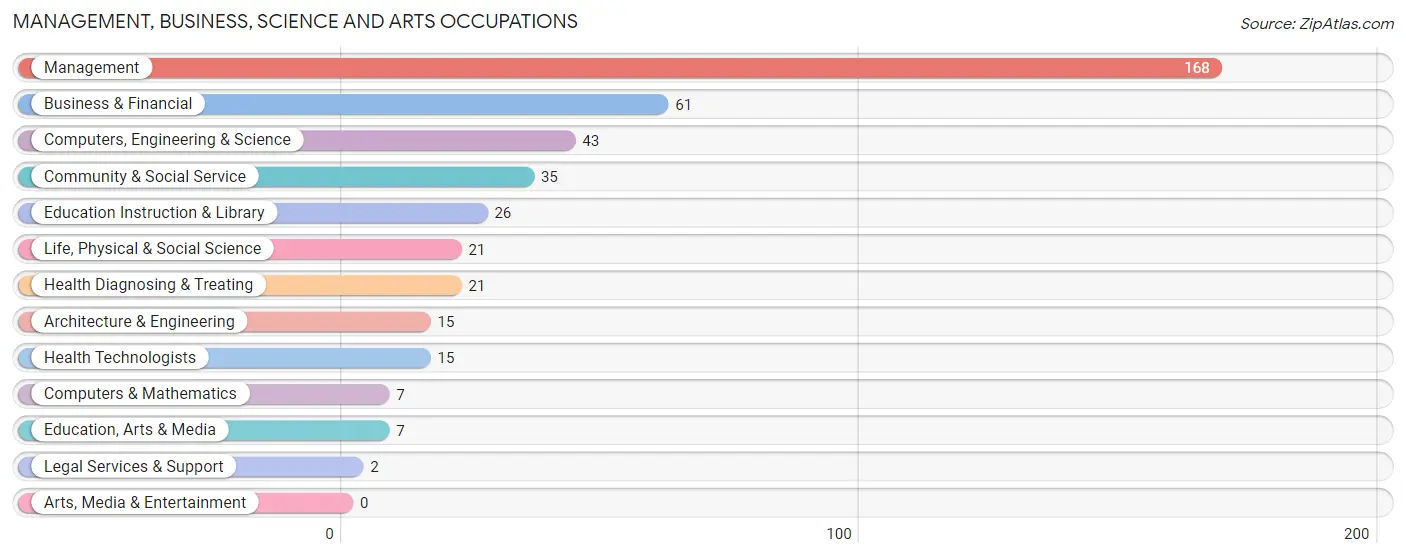
Management, Business, Science and Arts Occupations
The most common Management, Business, Science and Arts occupations in Colmar Manor are Management (168 | 20.3%), Business & Financial (61 | 7.4%), Computers, Engineering & Science (43 | 5.2%), Community & Social Service (35 | 4.2%), and Education Instruction & Library (26 | 3.2%).
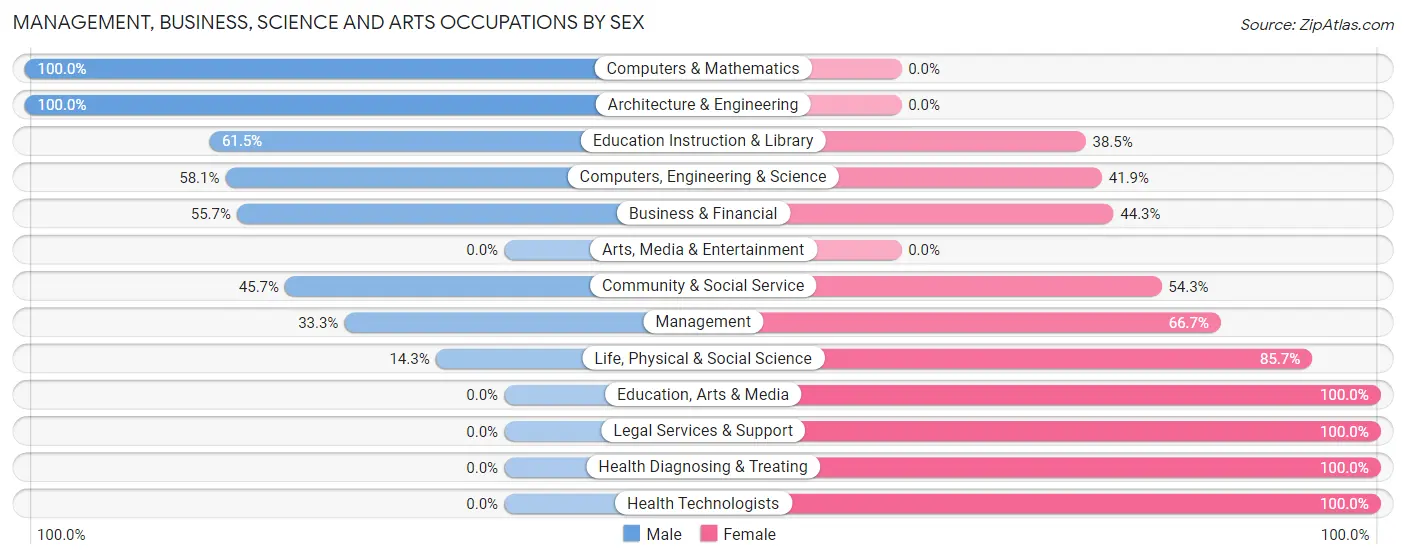
Management, Business, Science and Arts Occupations by Sex
Within the Management, Business, Science and Arts occupations in Colmar Manor, the most male-oriented occupations are Computers & Mathematics (100.0%), Architecture & Engineering (100.0%), and Education Instruction & Library (61.5%), while the most female-oriented occupations are Education, Arts & Media (100.0%), Legal Services & Support (100.0%), and Health Diagnosing & Treating (100.0%).
| Occupation | Male | Female |
| Management | 56 (33.3%) | 112 (66.7%) |
| Business & Financial | 34 (55.7%) | 27 (44.3%) |
| Computers, Engineering & Science | 25 (58.1%) | 18 (41.9%) |
| Computers & Mathematics | 7 (100.0%) | 0 (0.0%) |
| Architecture & Engineering | 15 (100.0%) | 0 (0.0%) |
| Life, Physical & Social Science | 3 (14.3%) | 18 (85.7%) |
| Community & Social Service | 16 (45.7%) | 19 (54.3%) |
| Education, Arts & Media | 0 (0.0%) | 7 (100.0%) |
| Legal Services & Support | 0 (0.0%) | 2 (100.0%) |
| Education Instruction & Library | 16 (61.5%) | 10 (38.5%) |
| Arts, Media & Entertainment | 0 (0.0%) | 0 (0.0%) |
| Health Diagnosing & Treating | 0 (0.0%) | 21 (100.0%) |
| Health Technologists | 0 (0.0%) | 15 (100.0%) |
| Total (Category) | 131 (39.9%) | 197 (60.1%) |
| Total (Overall) | 422 (51.1%) | 404 (48.9%) |
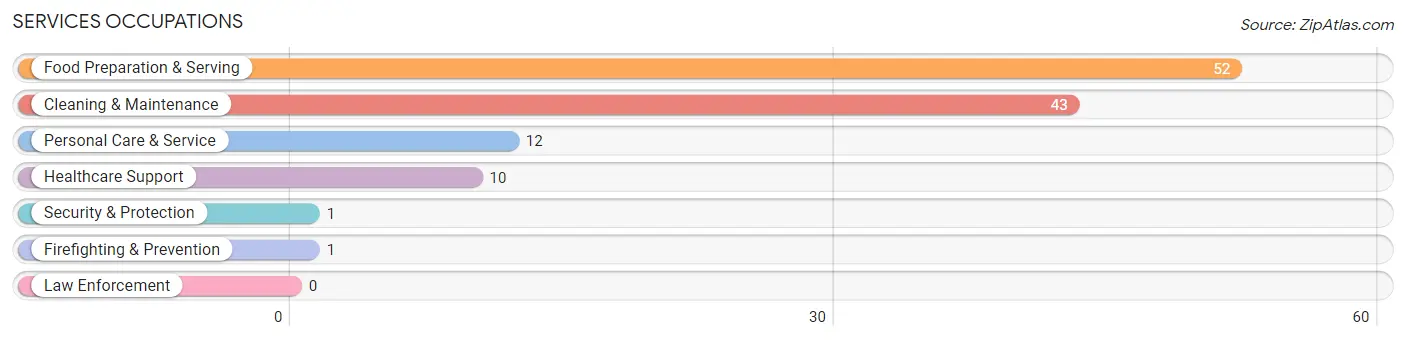
Services Occupations
The most common Services occupations in Colmar Manor are Food Preparation & Serving (52 | 6.3%), Cleaning & Maintenance (43 | 5.2%), Personal Care & Service (12 | 1.5%), Healthcare Support (10 | 1.2%), and Security & Protection (1 | 0.1%).
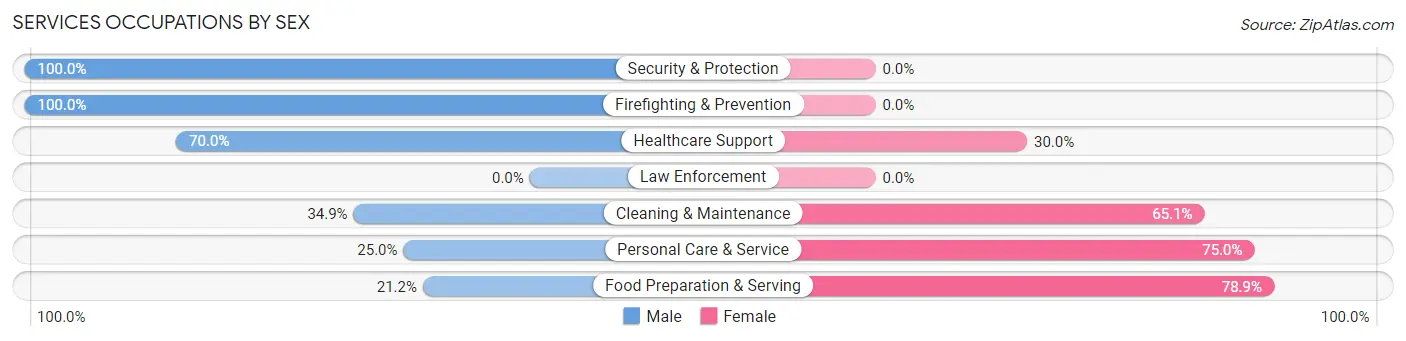
Services Occupations by Sex
Within the Services occupations in Colmar Manor, the most male-oriented occupations are Security & Protection (100.0%), Firefighting & Prevention (100.0%), and Healthcare Support (70.0%), while the most female-oriented occupations are Food Preparation & Serving (78.8%), Personal Care & Service (75.0%), and Cleaning & Maintenance (65.1%).
| Occupation | Male | Female |
| Healthcare Support | 7 (70.0%) | 3 (30.0%) |
| Security & Protection | 1 (100.0%) | 0 (0.0%) |
| Firefighting & Prevention | 1 (100.0%) | 0 (0.0%) |
| Law Enforcement | 0 (0.0%) | 0 (0.0%) |
| Food Preparation & Serving | 11 (21.1%) | 41 (78.8%) |
| Cleaning & Maintenance | 15 (34.9%) | 28 (65.1%) |
| Personal Care & Service | 3 (25.0%) | 9 (75.0%) |
| Total (Category) | 37 (31.4%) | 81 (68.6%) |
| Total (Overall) | 422 (51.1%) | 404 (48.9%) |
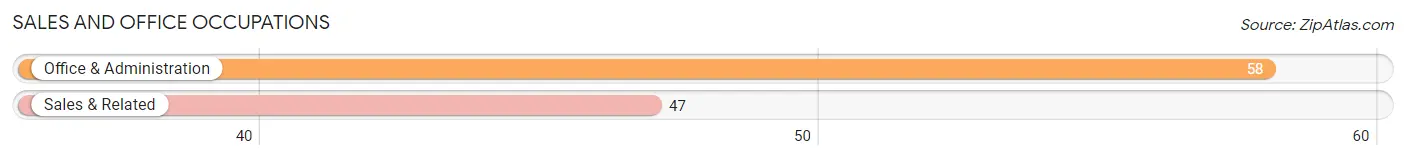
Sales and Office Occupations
The most common Sales and Office occupations in Colmar Manor are Office & Administration (58 | 7.0%), and Sales & Related (47 | 5.7%).
Sales and Office Occupations by Sex
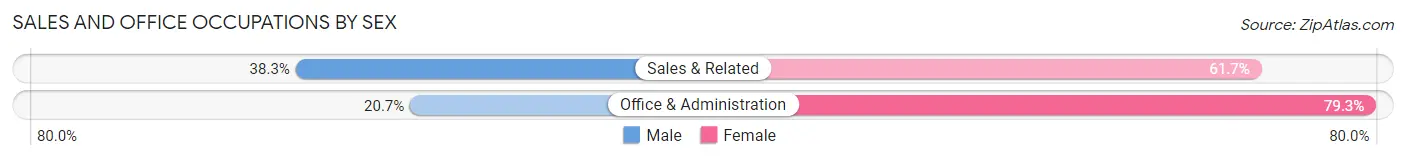
| Occupation | Male | Female |
| Sales & Related | 18 (38.3%) | 29 (61.7%) |
| Office & Administration | 12 (20.7%) | 46 (79.3%) |
| Total (Category) | 30 (28.6%) | 75 (71.4%) |
| Total (Overall) | 422 (51.1%) | 404 (48.9%) |
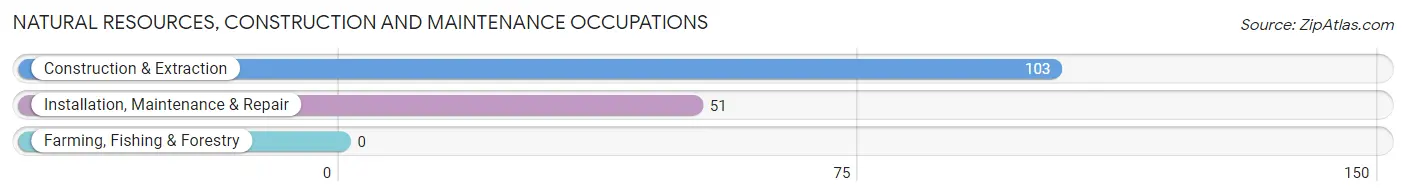
Natural Resources, Construction and Maintenance Occupations
The most common Natural Resources, Construction and Maintenance occupations in Colmar Manor are Construction & Extraction (103 | 12.5%), and Installation, Maintenance & Repair (51 | 6.2%).
Natural Resources, Construction and Maintenance Occupations by Sex
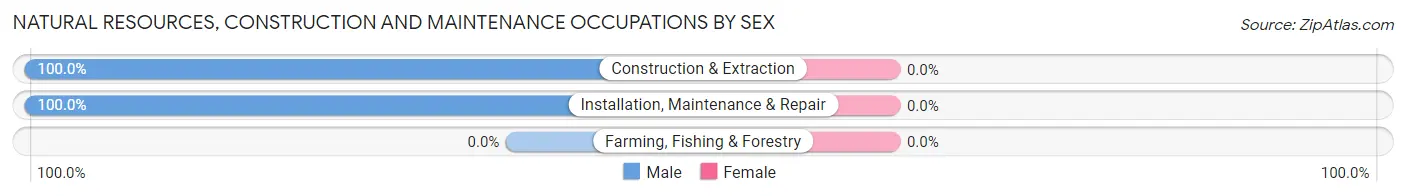
| Occupation | Male | Female |
| Farming, Fishing & Forestry | 0 (0.0%) | 0 (0.0%) |
| Construction & Extraction | 103 (100.0%) | 0 (0.0%) |
| Installation, Maintenance & Repair | 51 (100.0%) | 0 (0.0%) |
| Total (Category) | 154 (100.0%) | 0 (0.0%) |
| Total (Overall) | 422 (51.1%) | 404 (48.9%) |
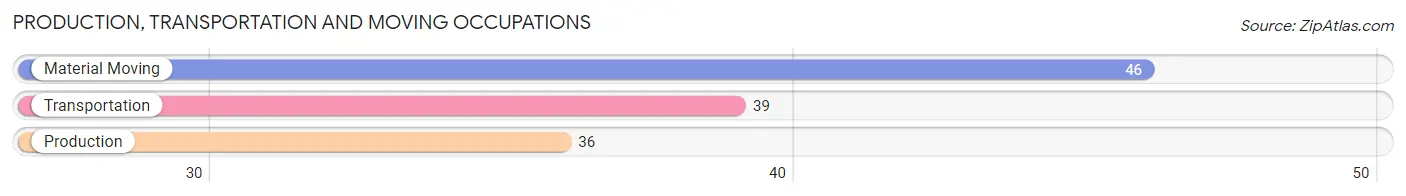
Production, Transportation and Moving Occupations
The most common Production, Transportation and Moving occupations in Colmar Manor are Material Moving (46 | 5.6%), Transportation (39 | 4.7%), and Production (36 | 4.4%).
Production, Transportation and Moving Occupations by Sex
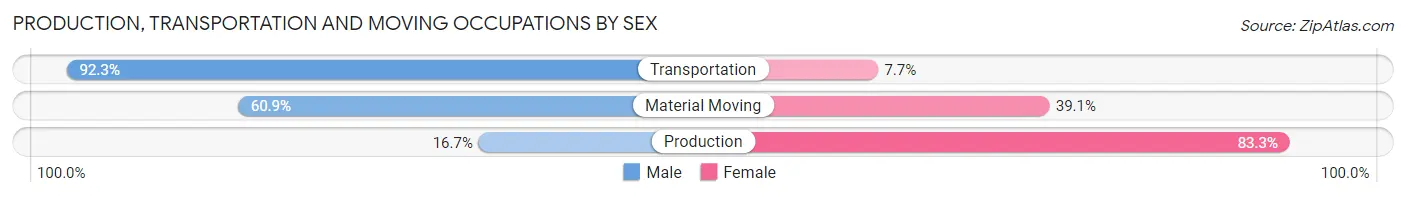
| Occupation | Male | Female |
| Production | 6 (16.7%) | 30 (83.3%) |
| Transportation | 36 (92.3%) | 3 (7.7%) |
| Material Moving | 28 (60.9%) | 18 (39.1%) |
| Total (Category) | 70 (57.9%) | 51 (42.1%) |
| Total (Overall) | 422 (51.1%) | 404 (48.9%) |
Employment Industries by Sex in Colmar Manor
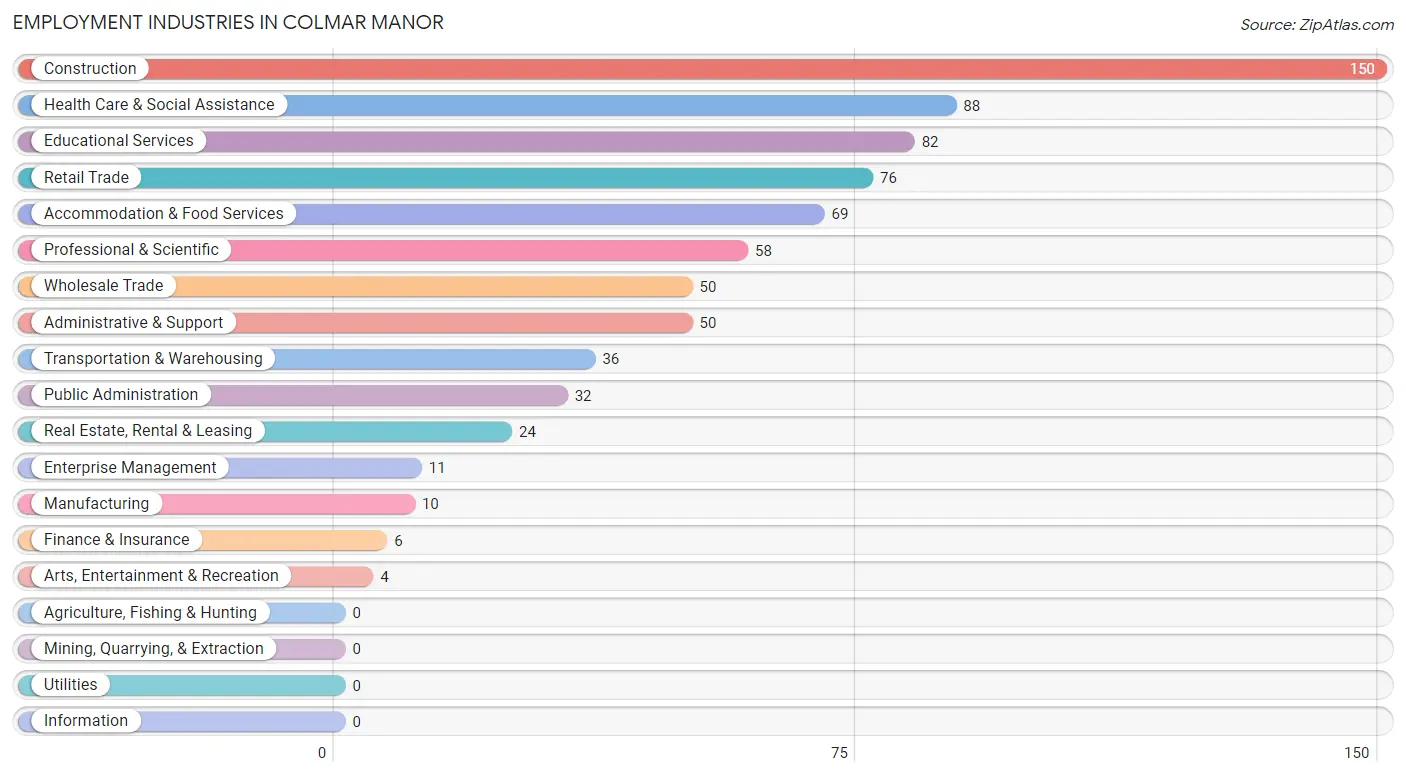
Employment Industries in Colmar Manor
The major employment industries in Colmar Manor include Construction (150 | 18.2%), Health Care & Social Assistance (88 | 10.6%), Educational Services (82 | 9.9%), Retail Trade (76 | 9.2%), and Accommodation & Food Services (69 | 8.4%).
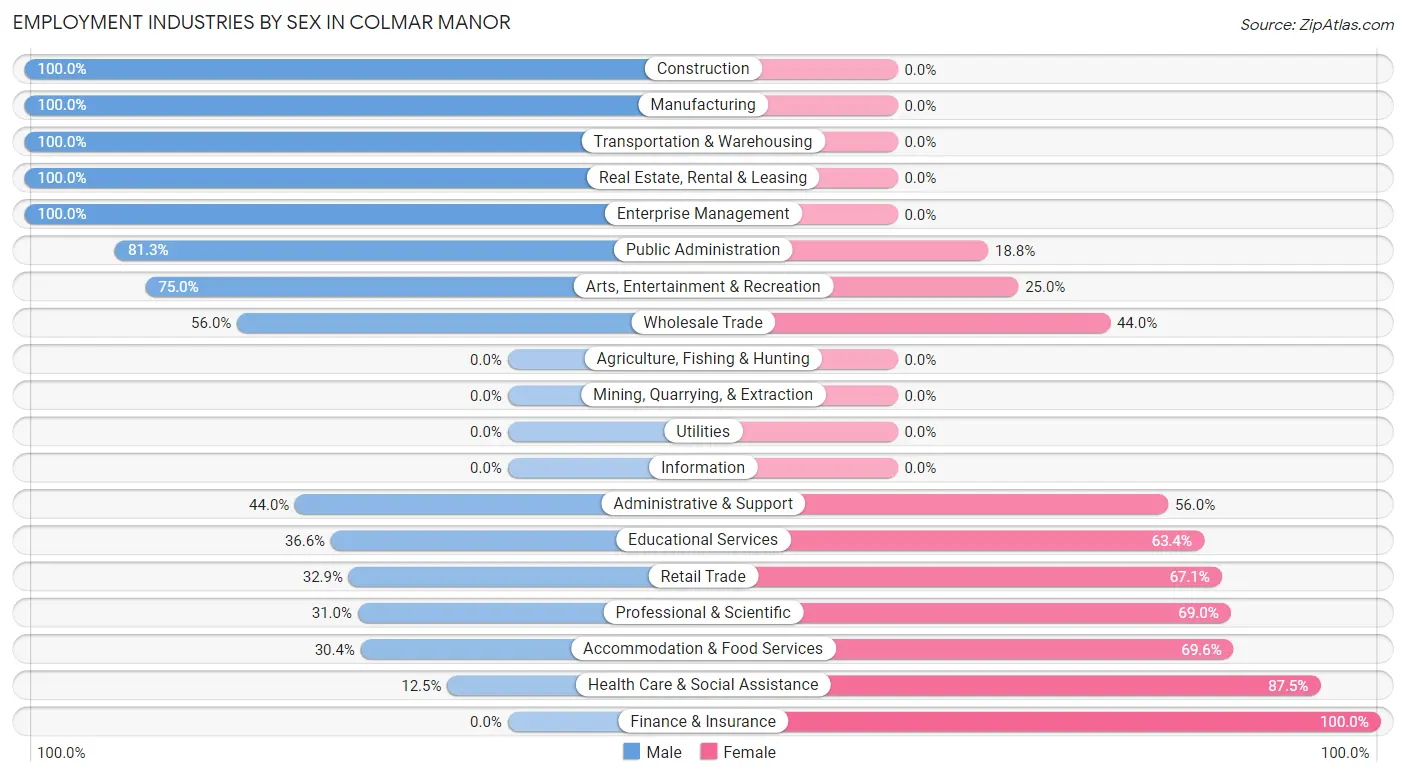
Employment Industries by Sex in Colmar Manor
The Colmar Manor industries that see more men than women are Construction (100.0%), Manufacturing (100.0%), and Transportation & Warehousing (100.0%), whereas the industries that tend to have a higher number of women are Finance & Insurance (100.0%), Health Care & Social Assistance (87.5%), and Accommodation & Food Services (69.6%).
| Industry | Male | Female |
| Agriculture, Fishing & Hunting | 0 (0.0%) | 0 (0.0%) |
| Mining, Quarrying, & Extraction | 0 (0.0%) | 0 (0.0%) |
| Construction | 150 (100.0%) | 0 (0.0%) |
| Manufacturing | 10 (100.0%) | 0 (0.0%) |
| Wholesale Trade | 28 (56.0%) | 22 (44.0%) |
| Retail Trade | 25 (32.9%) | 51 (67.1%) |
| Transportation & Warehousing | 36 (100.0%) | 0 (0.0%) |
| Utilities | 0 (0.0%) | 0 (0.0%) |
| Information | 0 (0.0%) | 0 (0.0%) |
| Finance & Insurance | 0 (0.0%) | 6 (100.0%) |
| Real Estate, Rental & Leasing | 24 (100.0%) | 0 (0.0%) |
| Professional & Scientific | 18 (31.0%) | 40 (69.0%) |
| Enterprise Management | 11 (100.0%) | 0 (0.0%) |
| Administrative & Support | 22 (44.0%) | 28 (56.0%) |
| Educational Services | 30 (36.6%) | 52 (63.4%) |
| Health Care & Social Assistance | 11 (12.5%) | 77 (87.5%) |
| Arts, Entertainment & Recreation | 3 (75.0%) | 1 (25.0%) |
| Accommodation & Food Services | 21 (30.4%) | 48 (69.6%) |
| Public Administration | 26 (81.2%) | 6 (18.8%) |
| Total | 422 (51.1%) | 404 (48.9%) |
Education in Colmar Manor
School Enrollment in Colmar Manor
The most common levels of schooling among the 357 students in Colmar Manor are middle school (104 | 29.1%), college / undergraduate (84 | 23.5%), and high school (83 | 23.3%).
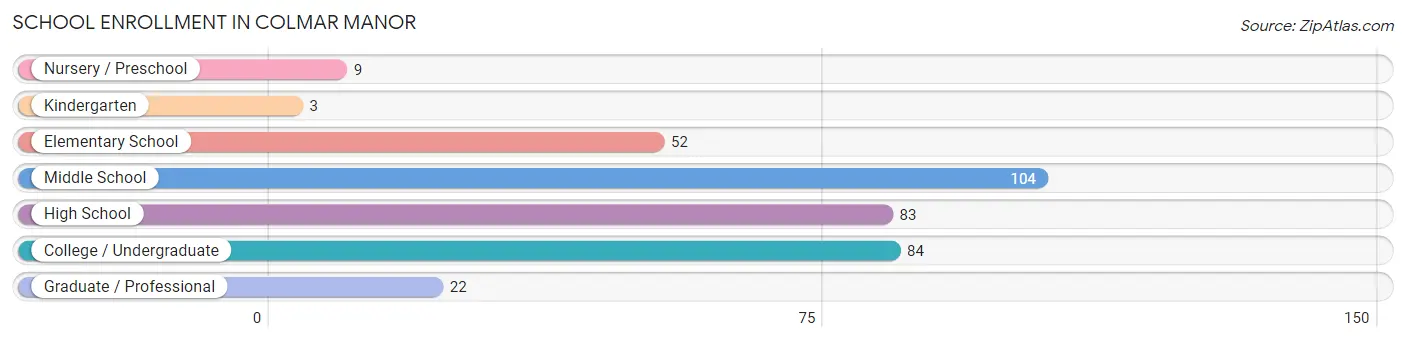
| School Level | # Students | % Students |
| Nursery / Preschool | 9 | 2.5% |
| Kindergarten | 3 | 0.8% |
| Elementary School | 52 | 14.6% |
| Middle School | 104 | 29.1% |
| High School | 83 | 23.3% |
| College / Undergraduate | 84 | 23.5% |
| Graduate / Professional | 22 | 6.2% |
| Total | 357 | 100.0% |
School Enrollment by Age by Funding Source in Colmar Manor
Out of a total of 357 students who are enrolled in schools in Colmar Manor, 86 (24.1%) attend a private institution, while the remaining 271 (75.9%) are enrolled in public schools. The age group of 20 to 24 year olds has the highest likelihood of being enrolled in private schools, with 60 (75.9% in the age bracket) enrolled. Conversely, the age group of 10 to 14 year olds has the lowest likelihood of being enrolled in a private school, with 116 (99.2% in the age bracket) attending a public institution.
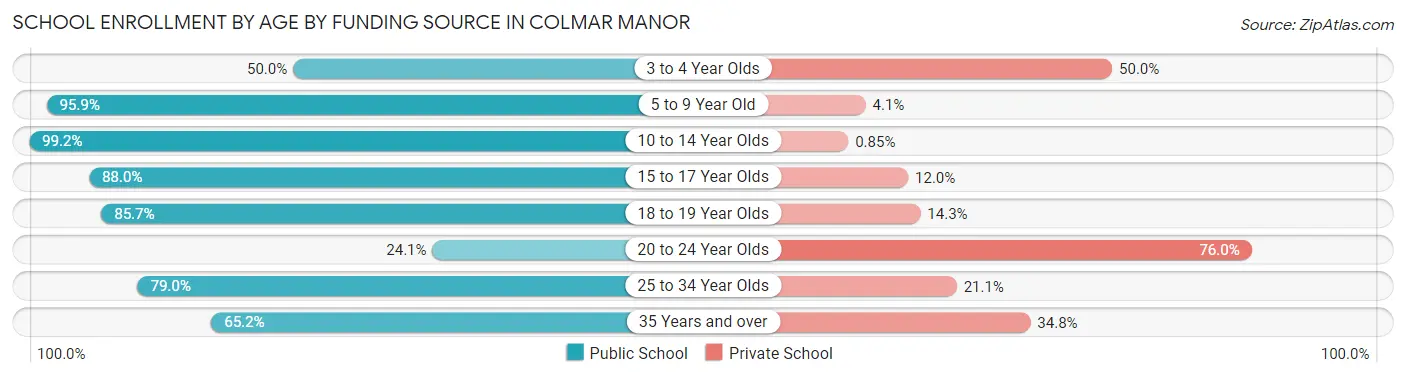
| Age Bracket | Public School | Private School |
| 3 to 4 Year Olds | 3 (50.0%) | 3 (50.0%) |
| 5 to 9 Year Old | 47 (95.9%) | 2 (4.1%) |
| 10 to 14 Year Olds | 116 (99.2%) | 1 (0.9%) |
| 15 to 17 Year Olds | 44 (88.0%) | 6 (12.0%) |
| 18 to 19 Year Olds | 12 (85.7%) | 2 (14.3%) |
| 20 to 24 Year Olds | 19 (24.0%) | 60 (75.9%) |
| 25 to 34 Year Olds | 15 (78.9%) | 4 (21.0%) |
| 35 Years and over | 15 (65.2%) | 8 (34.8%) |
| Total | 271 (75.9%) | 86 (24.1%) |
Educational Attainment by Field of Study in Colmar Manor
Social sciences (93 | 31.0%), literature & languages (78 | 26.0%), business (39 | 13.0%), science & technology (20 | 6.7%), and education (14 | 4.7%) are the most common fields of study among 300 individuals in Colmar Manor who have obtained a bachelor's degree or higher.
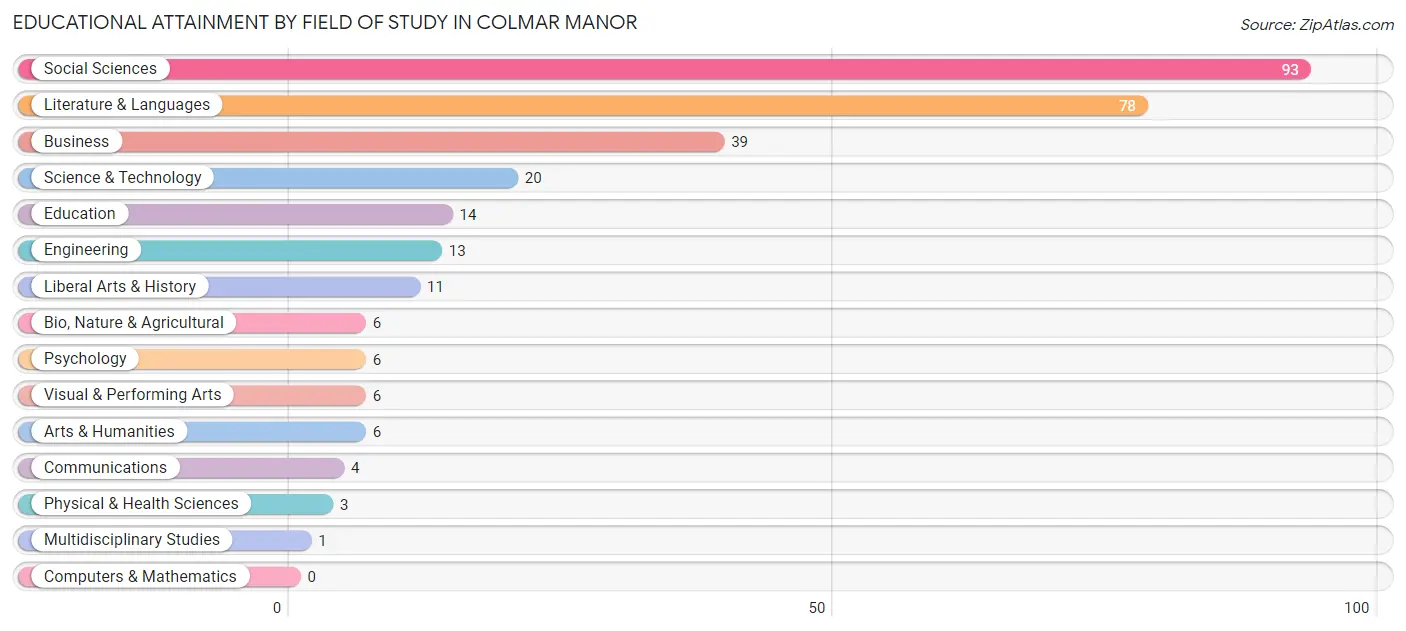
| Field of Study | # Graduates | % Graduates |
| Computers & Mathematics | 0 | 0.0% |
| Bio, Nature & Agricultural | 6 | 2.0% |
| Physical & Health Sciences | 3 | 1.0% |
| Psychology | 6 | 2.0% |
| Social Sciences | 93 | 31.0% |
| Engineering | 13 | 4.3% |
| Multidisciplinary Studies | 1 | 0.3% |
| Science & Technology | 20 | 6.7% |
| Business | 39 | 13.0% |
| Education | 14 | 4.7% |
| Literature & Languages | 78 | 26.0% |
| Liberal Arts & History | 11 | 3.7% |
| Visual & Performing Arts | 6 | 2.0% |
| Communications | 4 | 1.3% |
| Arts & Humanities | 6 | 2.0% |
| Total | 300 | 100.0% |
Transportation & Commute in Colmar Manor
Vehicle Availability by Sex in Colmar Manor
The most prevalent vehicle ownership categories in Colmar Manor are males with 2 vehicles (146, accounting for 34.7%) and females with 2 vehicles (106, making up 36.9%).
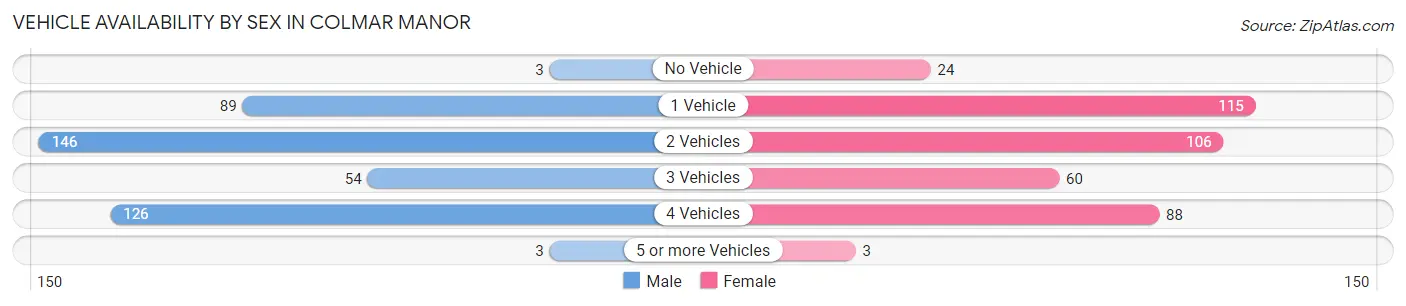
| Vehicles Available | Male | Female |
| No Vehicle | 3 (0.7%) | 24 (6.1%) |
| 1 Vehicle | 89 (21.1%) | 115 (29.0%) |
| 2 Vehicles | 146 (34.7%) | 106 (26.8%) |
| 3 Vehicles | 54 (12.8%) | 60 (15.1%) |
| 4 Vehicles | 126 (29.9%) | 88 (22.2%) |
| 5 or more Vehicles | 3 (0.7%) | 3 (0.8%) |
| Total | 421 (100.0%) | 396 (100.0%) |
Commute Time in Colmar Manor
The most frequently occuring commute durations in Colmar Manor are 20 to 24 minutes (104 commuters, 15.9%), 45 to 59 minutes (94 commuters, 14.4%), and 60 to 89 minutes (85 commuters, 13.0%).
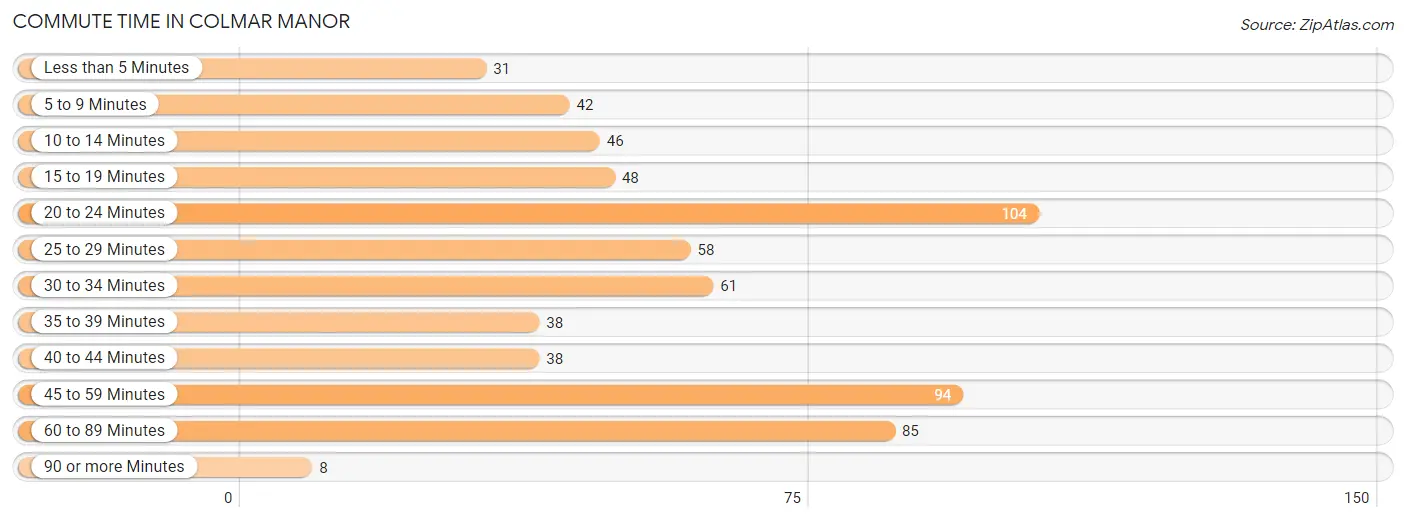
| Commute Time | # Commuters | % Commuters |
| Less than 5 Minutes | 31 | 4.8% |
| 5 to 9 Minutes | 42 | 6.4% |
| 10 to 14 Minutes | 46 | 7.0% |
| 15 to 19 Minutes | 48 | 7.3% |
| 20 to 24 Minutes | 104 | 15.9% |
| 25 to 29 Minutes | 58 | 8.9% |
| 30 to 34 Minutes | 61 | 9.3% |
| 35 to 39 Minutes | 38 | 5.8% |
| 40 to 44 Minutes | 38 | 5.8% |
| 45 to 59 Minutes | 94 | 14.4% |
| 60 to 89 Minutes | 85 | 13.0% |
| 90 or more Minutes | 8 | 1.2% |
Commute Time by Sex in Colmar Manor
The most common commute times in Colmar Manor are 20 to 24 minutes (62 commuters, 16.9%) for males and 45 to 59 minutes (59 commuters, 20.6%) for females.
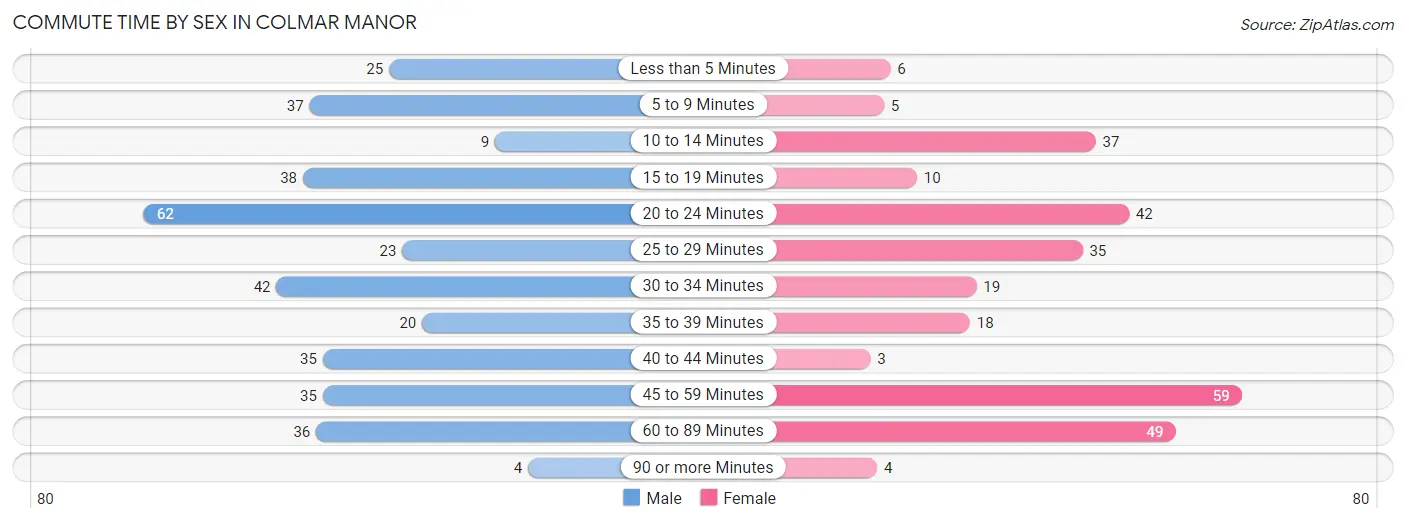
| Commute Time | Male | Female |
| Less than 5 Minutes | 25 (6.8%) | 6 (2.1%) |
| 5 to 9 Minutes | 37 (10.1%) | 5 (1.7%) |
| 10 to 14 Minutes | 9 (2.5%) | 37 (12.9%) |
| 15 to 19 Minutes | 38 (10.4%) | 10 (3.5%) |
| 20 to 24 Minutes | 62 (16.9%) | 42 (14.6%) |
| 25 to 29 Minutes | 23 (6.3%) | 35 (12.2%) |
| 30 to 34 Minutes | 42 (11.5%) | 19 (6.6%) |
| 35 to 39 Minutes | 20 (5.5%) | 18 (6.3%) |
| 40 to 44 Minutes | 35 (9.6%) | 3 (1.1%) |
| 45 to 59 Minutes | 35 (9.6%) | 59 (20.6%) |
| 60 to 89 Minutes | 36 (9.8%) | 49 (17.1%) |
| 90 or more Minutes | 4 (1.1%) | 4 (1.4%) |
Time of Departure to Work by Sex in Colmar Manor
The most frequent times of departure to work in Colmar Manor are 6:00 AM to 6:29 AM (108, 29.5%) for males and 7:00 AM to 7:29 AM (57, 19.9%) for females.
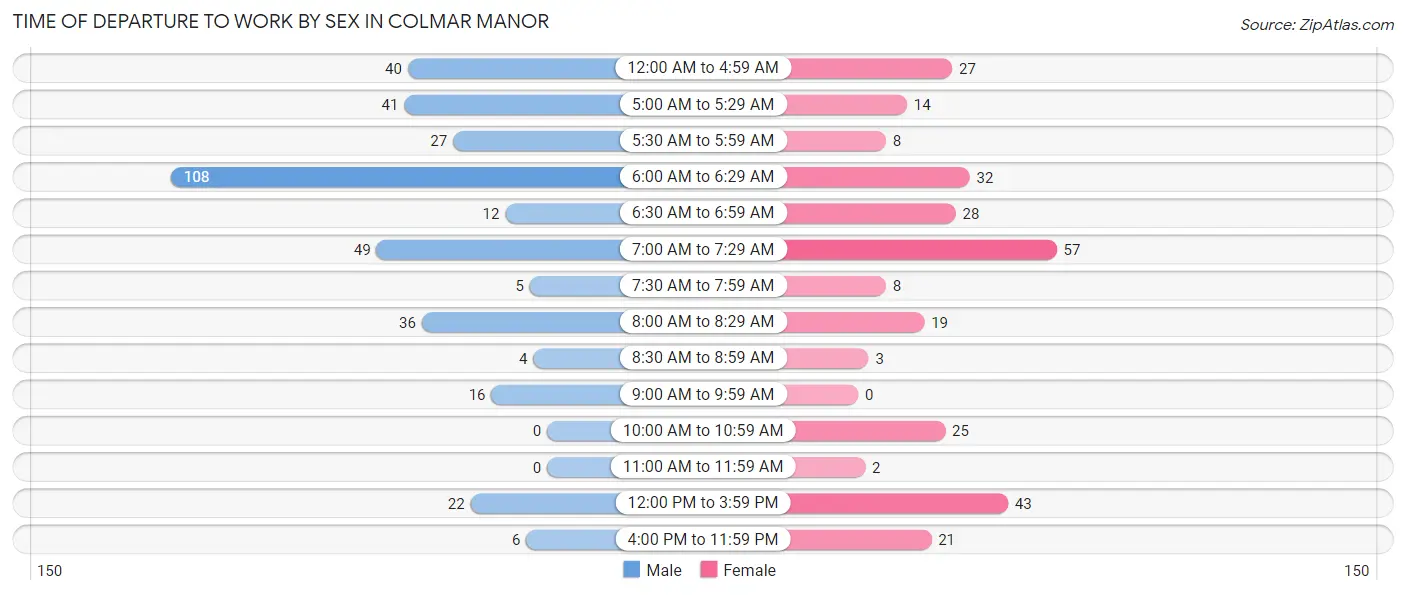
| Time of Departure | Male | Female |
| 12:00 AM to 4:59 AM | 40 (10.9%) | 27 (9.4%) |
| 5:00 AM to 5:29 AM | 41 (11.2%) | 14 (4.9%) |
| 5:30 AM to 5:59 AM | 27 (7.4%) | 8 (2.8%) |
| 6:00 AM to 6:29 AM | 108 (29.5%) | 32 (11.2%) |
| 6:30 AM to 6:59 AM | 12 (3.3%) | 28 (9.8%) |
| 7:00 AM to 7:29 AM | 49 (13.4%) | 57 (19.9%) |
| 7:30 AM to 7:59 AM | 5 (1.4%) | 8 (2.8%) |
| 8:00 AM to 8:29 AM | 36 (9.8%) | 19 (6.6%) |
| 8:30 AM to 8:59 AM | 4 (1.1%) | 3 (1.1%) |
| 9:00 AM to 9:59 AM | 16 (4.4%) | 0 (0.0%) |
| 10:00 AM to 10:59 AM | 0 (0.0%) | 25 (8.7%) |
| 11:00 AM to 11:59 AM | 0 (0.0%) | 2 (0.7%) |
| 12:00 PM to 3:59 PM | 22 (6.0%) | 43 (15.0%) |
| 4:00 PM to 11:59 PM | 6 (1.6%) | 21 (7.3%) |
| Total | 366 (100.0%) | 287 (100.0%) |
Housing Occupancy in Colmar Manor
Occupancy by Ownership in Colmar Manor
Of the total 450 dwellings in Colmar Manor, owner-occupied units account for 355 (78.9%), while renter-occupied units make up 95 (21.1%).
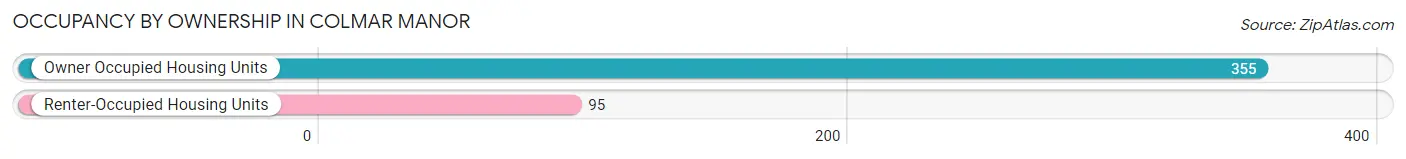
| Occupancy | # Housing Units | % Housing Units |
| Owner Occupied Housing Units | 355 | 78.9% |
| Renter-Occupied Housing Units | 95 | 21.1% |
| Total Occupied Housing Units | 450 | 100.0% |
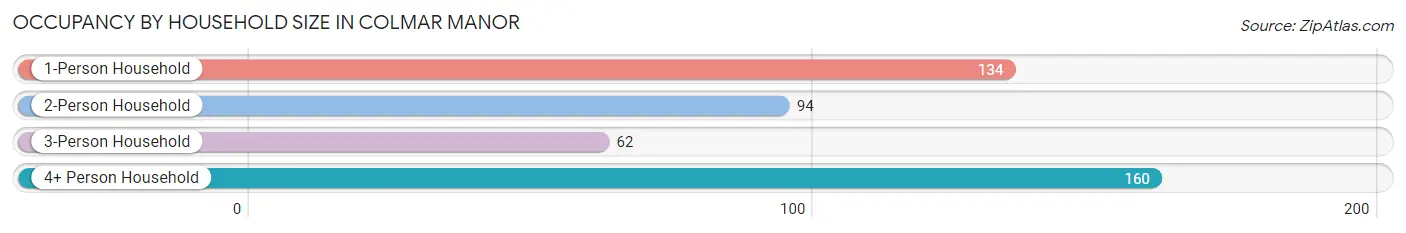
Occupancy by Household Size in Colmar Manor
| Household Size | # Housing Units | % Housing Units |
| 1-Person Household | 134 | 29.8% |
| 2-Person Household | 94 | 20.9% |
| 3-Person Household | 62 | 13.8% |
| 4+ Person Household | 160 | 35.6% |
| Total Housing Units | 450 | 100.0% |
Occupancy by Ownership by Household Size in Colmar Manor
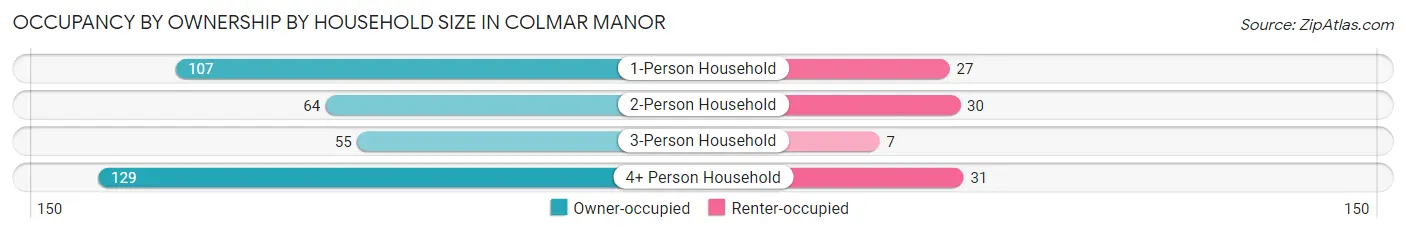
| Household Size | Owner-occupied | Renter-occupied |
| 1-Person Household | 107 (79.8%) | 27 (20.2%) |
| 2-Person Household | 64 (68.1%) | 30 (31.9%) |
| 3-Person Household | 55 (88.7%) | 7 (11.3%) |
| 4+ Person Household | 129 (80.6%) | 31 (19.4%) |
| Total Housing Units | 355 (78.9%) | 95 (21.1%) |
Occupancy by Educational Attainment in Colmar Manor
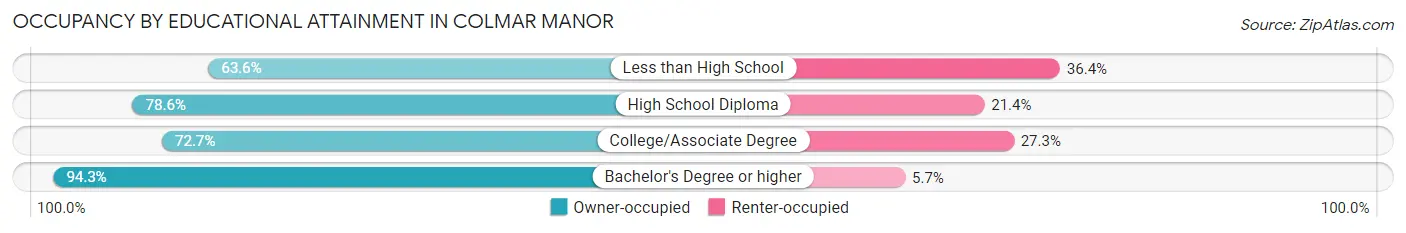
| Household Size | Owner-occupied | Renter-occupied |
| Less than High School | 82 (63.6%) | 47 (36.4%) |
| High School Diploma | 77 (78.6%) | 21 (21.4%) |
| College/Associate Degree | 48 (72.7%) | 18 (27.3%) |
| Bachelor's Degree or higher | 148 (94.3%) | 9 (5.7%) |
Occupancy by Age of Householder in Colmar Manor
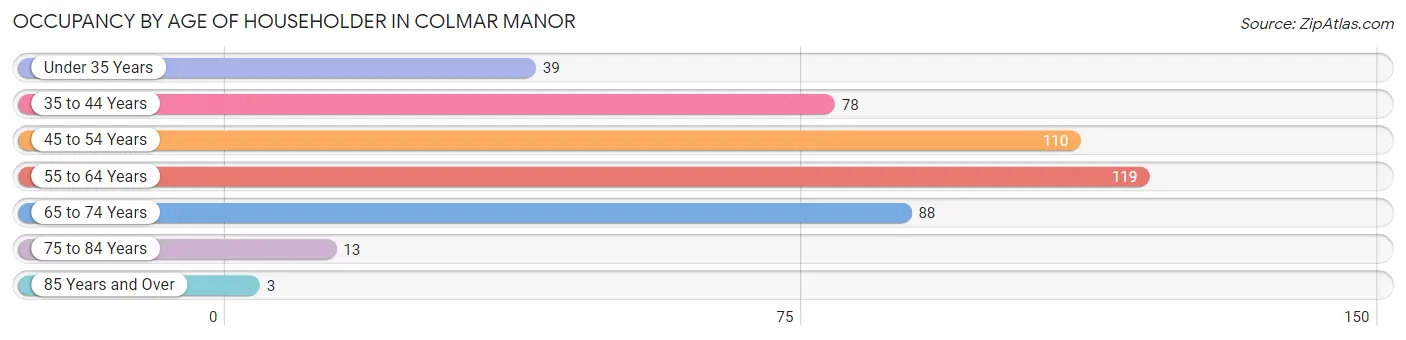
| Age Bracket | # Households | % Households |
| Under 35 Years | 39 | 8.7% |
| 35 to 44 Years | 78 | 17.3% |
| 45 to 54 Years | 110 | 24.4% |
| 55 to 64 Years | 119 | 26.4% |
| 65 to 74 Years | 88 | 19.6% |
| 75 to 84 Years | 13 | 2.9% |
| 85 Years and Over | 3 | 0.7% |
| Total | 450 | 100.0% |
Housing Finances in Colmar Manor
Median Income by Occupancy in Colmar Manor
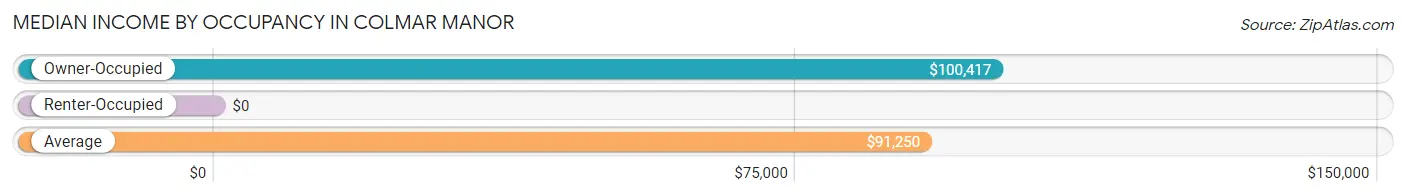
| Occupancy Type | # Households | Median Income |
| Owner-Occupied | 355 (78.9%) | $100,417 |
| Renter-Occupied | 95 (21.1%) | $0 |
| Average | 450 (100.0%) | $91,250 |
Occupancy by Householder Income Bracket in Colmar Manor
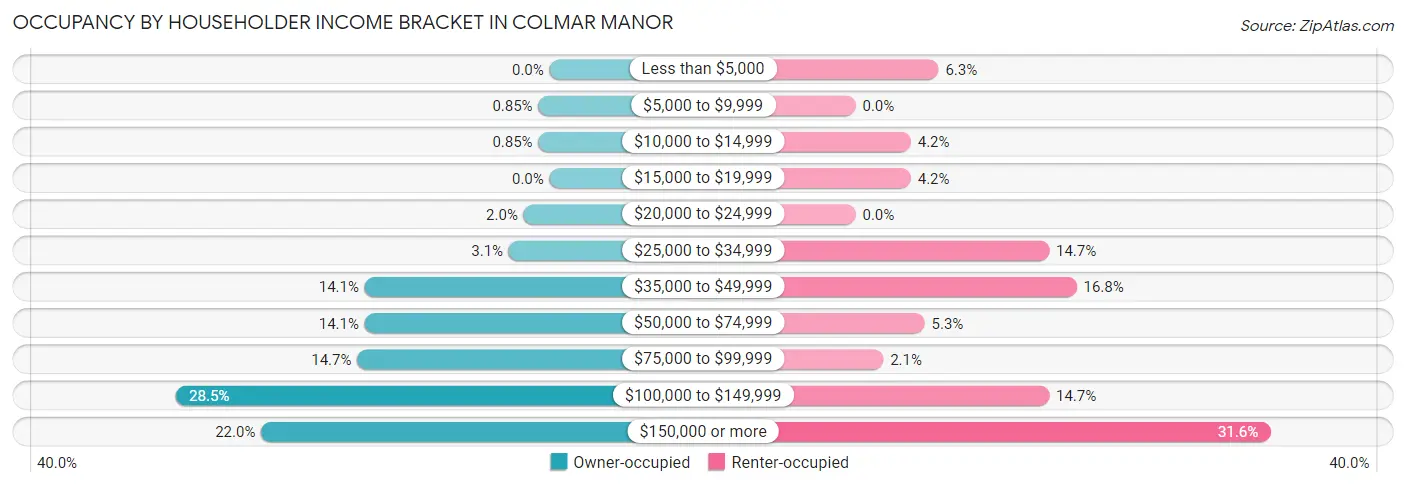
| Income Bracket | Owner-occupied | Renter-occupied |
| Less than $5,000 | 0 (0.0%) | 6 (6.3%) |
| $5,000 to $9,999 | 3 (0.9%) | 0 (0.0%) |
| $10,000 to $14,999 | 3 (0.9%) | 4 (4.2%) |
| $15,000 to $19,999 | 0 (0.0%) | 4 (4.2%) |
| $20,000 to $24,999 | 7 (2.0%) | 0 (0.0%) |
| $25,000 to $34,999 | 11 (3.1%) | 14 (14.7%) |
| $35,000 to $49,999 | 50 (14.1%) | 16 (16.8%) |
| $50,000 to $74,999 | 50 (14.1%) | 5 (5.3%) |
| $75,000 to $99,999 | 52 (14.6%) | 2 (2.1%) |
| $100,000 to $149,999 | 101 (28.4%) | 14 (14.7%) |
| $150,000 or more | 78 (22.0%) | 30 (31.6%) |
| Total | 355 (100.0%) | 95 (100.0%) |
Monthly Housing Cost Tiers in Colmar Manor
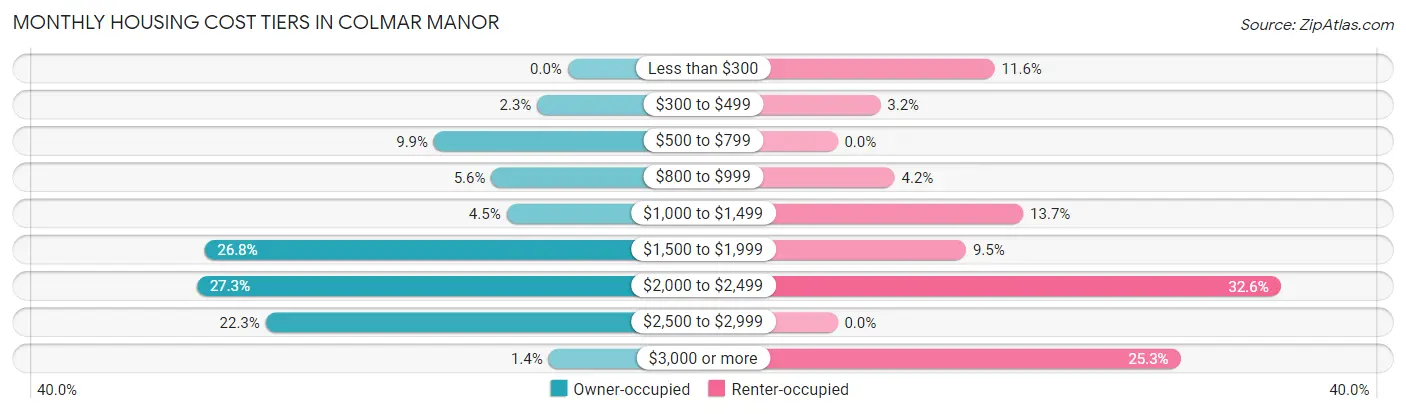
| Monthly Cost | Owner-occupied | Renter-occupied |
| Less than $300 | 0 (0.0%) | 11 (11.6%) |
| $300 to $499 | 8 (2.2%) | 3 (3.2%) |
| $500 to $799 | 35 (9.9%) | 0 (0.0%) |
| $800 to $999 | 20 (5.6%) | 4 (4.2%) |
| $1,000 to $1,499 | 16 (4.5%) | 13 (13.7%) |
| $1,500 to $1,999 | 95 (26.8%) | 9 (9.5%) |
| $2,000 to $2,499 | 97 (27.3%) | 31 (32.6%) |
| $2,500 to $2,999 | 79 (22.3%) | 0 (0.0%) |
| $3,000 or more | 5 (1.4%) | 24 (25.3%) |
| Total | 355 (100.0%) | 95 (100.0%) |
Physical Housing Characteristics in Colmar Manor
Housing Structures in Colmar Manor
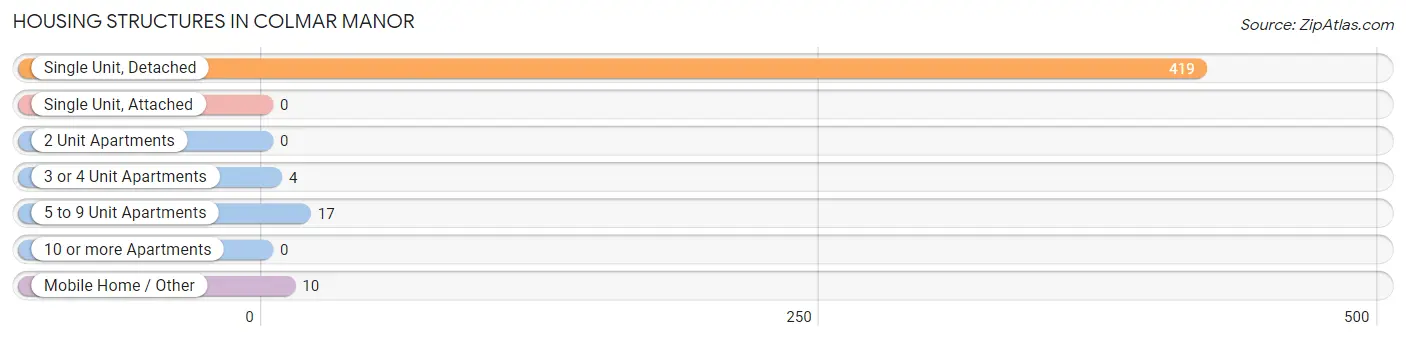
| Structure Type | # Housing Units | % Housing Units |
| Single Unit, Detached | 419 | 93.1% |
| Single Unit, Attached | 0 | 0.0% |
| 2 Unit Apartments | 0 | 0.0% |
| 3 or 4 Unit Apartments | 4 | 0.9% |
| 5 to 9 Unit Apartments | 17 | 3.8% |
| 10 or more Apartments | 0 | 0.0% |
| Mobile Home / Other | 10 | 2.2% |
| Total | 450 | 100.0% |
Housing Structures by Occupancy in Colmar Manor
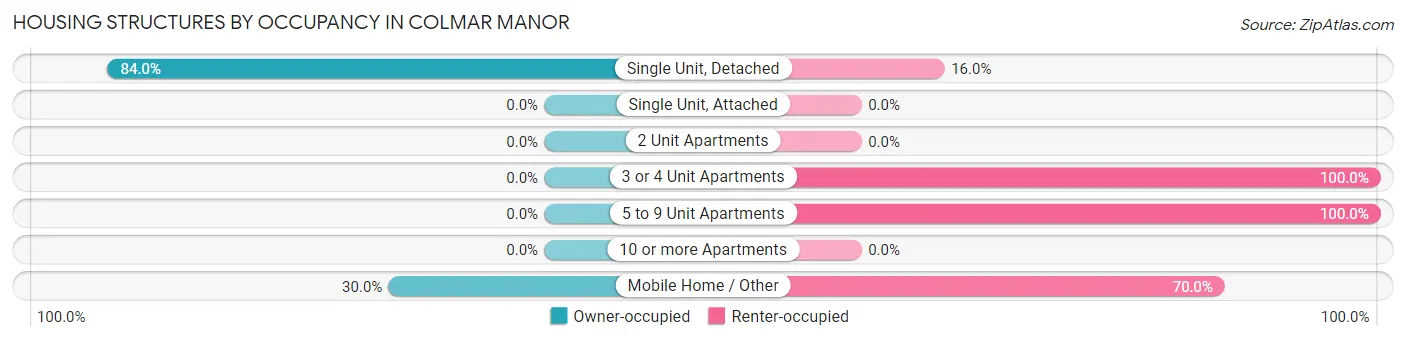
| Structure Type | Owner-occupied | Renter-occupied |
| Single Unit, Detached | 352 (84.0%) | 67 (16.0%) |
| Single Unit, Attached | 0 (0.0%) | 0 (0.0%) |
| 2 Unit Apartments | 0 (0.0%) | 0 (0.0%) |
| 3 or 4 Unit Apartments | 0 (0.0%) | 4 (100.0%) |
| 5 to 9 Unit Apartments | 0 (0.0%) | 17 (100.0%) |
| 10 or more Apartments | 0 (0.0%) | 0 (0.0%) |
| Mobile Home / Other | 3 (30.0%) | 7 (70.0%) |
| Total | 355 (78.9%) | 95 (21.1%) |
Housing Structures by Number of Rooms in Colmar Manor
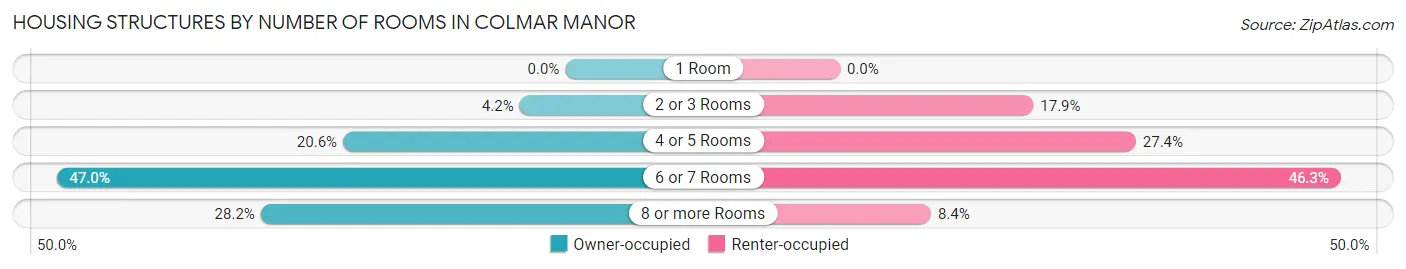
| Number of Rooms | Owner-occupied | Renter-occupied |
| 1 Room | 0 (0.0%) | 0 (0.0%) |
| 2 or 3 Rooms | 15 (4.2%) | 17 (17.9%) |
| 4 or 5 Rooms | 73 (20.6%) | 26 (27.4%) |
| 6 or 7 Rooms | 167 (47.0%) | 44 (46.3%) |
| 8 or more Rooms | 100 (28.2%) | 8 (8.4%) |
| Total | 355 (100.0%) | 95 (100.0%) |
Housing Structure by Heating Type in Colmar Manor
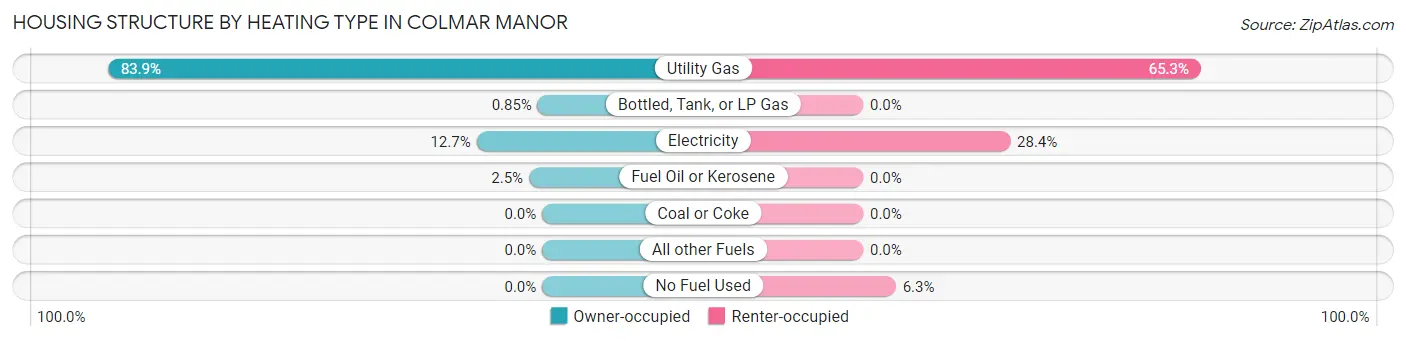
| Heating Type | Owner-occupied | Renter-occupied |
| Utility Gas | 298 (83.9%) | 62 (65.3%) |
| Bottled, Tank, or LP Gas | 3 (0.9%) | 0 (0.0%) |
| Electricity | 45 (12.7%) | 27 (28.4%) |
| Fuel Oil or Kerosene | 9 (2.5%) | 0 (0.0%) |
| Coal or Coke | 0 (0.0%) | 0 (0.0%) |
| All other Fuels | 0 (0.0%) | 0 (0.0%) |
| No Fuel Used | 0 (0.0%) | 6 (6.3%) |
| Total | 355 (100.0%) | 95 (100.0%) |
Household Vehicle Usage in Colmar Manor
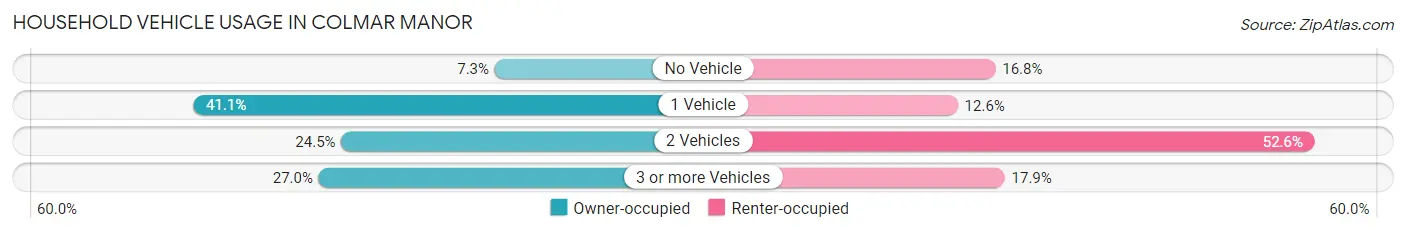
| Vehicles per Household | Owner-occupied | Renter-occupied |
| No Vehicle | 26 (7.3%) | 16 (16.8%) |
| 1 Vehicle | 146 (41.1%) | 12 (12.6%) |
| 2 Vehicles | 87 (24.5%) | 50 (52.6%) |
| 3 or more Vehicles | 96 (27.0%) | 17 (17.9%) |
| Total | 355 (100.0%) | 95 (100.0%) |
Real Estate & Mortgages in Colmar Manor
Real Estate and Mortgage Overview in Colmar Manor
| Characteristic | Without Mortgage | With Mortgage |
| Housing Units | 50 | 305 |
| Median Property Value | $340,000 | $352,500 |
| Median Household Income | $73,750 | $61 |
| Monthly Housing Costs | $685 | $5 |
| Real Estate Taxes | $4,353 | $10 |
Property Value by Mortgage Status in Colmar Manor
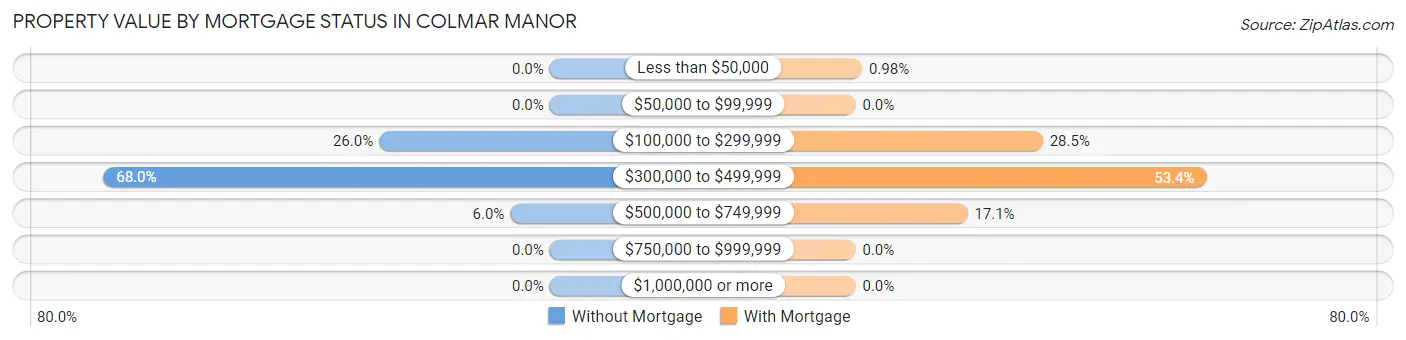
| Property Value | Without Mortgage | With Mortgage |
| Less than $50,000 | 0 (0.0%) | 3 (1.0%) |
| $50,000 to $99,999 | 0 (0.0%) | 0 (0.0%) |
| $100,000 to $299,999 | 13 (26.0%) | 87 (28.5%) |
| $300,000 to $499,999 | 34 (68.0%) | 163 (53.4%) |
| $500,000 to $749,999 | 3 (6.0%) | 52 (17.1%) |
| $750,000 to $999,999 | 0 (0.0%) | 0 (0.0%) |
| $1,000,000 or more | 0 (0.0%) | 0 (0.0%) |
| Total | 50 (100.0%) | 305 (100.0%) |
Household Income by Mortgage Status in Colmar Manor
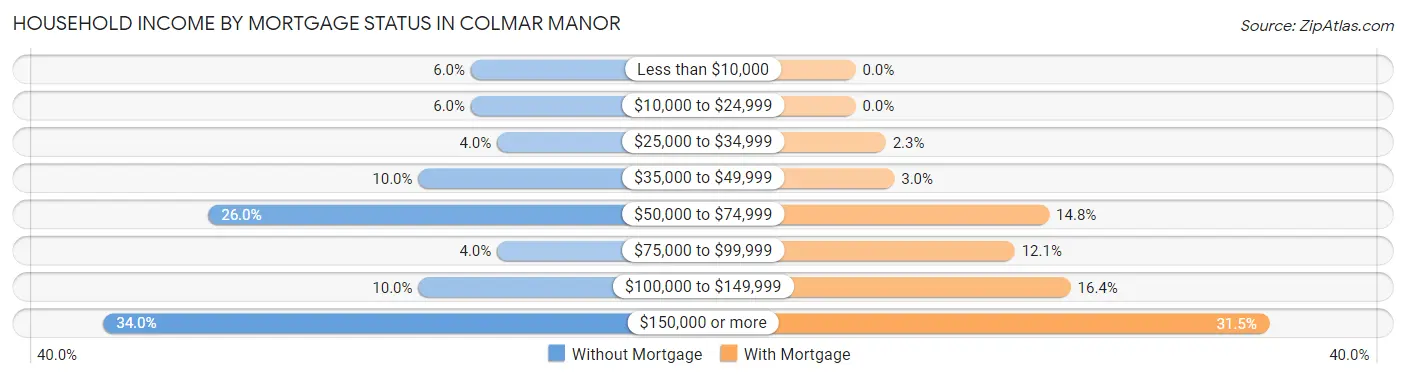
| Household Income | Without Mortgage | With Mortgage |
| Less than $10,000 | 3 (6.0%) | 0 (0.0%) |
| $10,000 to $24,999 | 3 (6.0%) | 0 (0.0%) |
| $25,000 to $34,999 | 2 (4.0%) | 7 (2.3%) |
| $35,000 to $49,999 | 5 (10.0%) | 9 (2.9%) |
| $50,000 to $74,999 | 13 (26.0%) | 45 (14.7%) |
| $75,000 to $99,999 | 2 (4.0%) | 37 (12.1%) |
| $100,000 to $149,999 | 5 (10.0%) | 50 (16.4%) |
| $150,000 or more | 17 (34.0%) | 96 (31.5%) |
| Total | 50 (100.0%) | 305 (100.0%) |
Property Value to Household Income Ratio in Colmar Manor
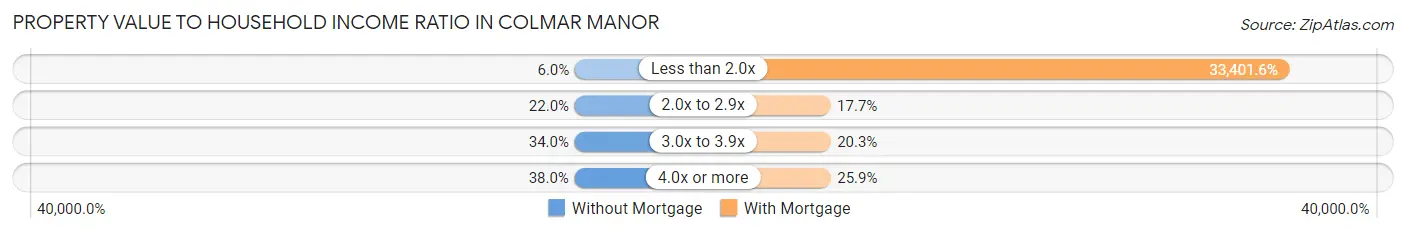
| Value-to-Income Ratio | Without Mortgage | With Mortgage |
| Less than 2.0x | 3 (6.0%) | 101,875 (33,401.6%) |
| 2.0x to 2.9x | 11 (22.0%) | 54 (17.7%) |
| 3.0x to 3.9x | 17 (34.0%) | 62 (20.3%) |
| 4.0x or more | 19 (38.0%) | 79 (25.9%) |
| Total | 50 (100.0%) | 305 (100.0%) |
Real Estate Taxes by Mortgage Status in Colmar Manor
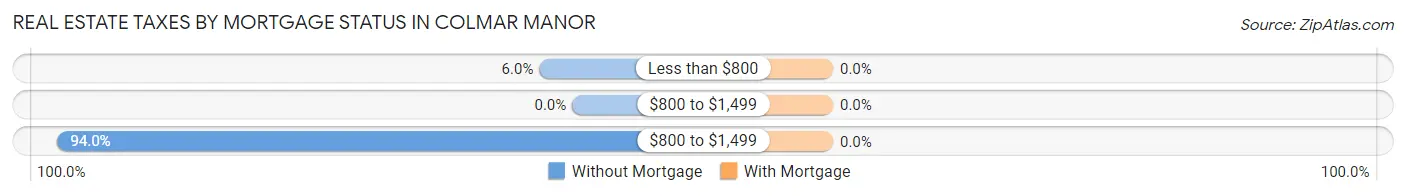
| Property Taxes | Without Mortgage | With Mortgage |
| Less than $800 | 3 (6.0%) | 0 (0.0%) |
| $800 to $1,499 | 0 (0.0%) | 0 (0.0%) |
| $800 to $1,499 | 47 (94.0%) | 0 (0.0%) |
| Total | 50 (100.0%) | 305 (100.0%) |
Health & Disability in Colmar Manor
Health Insurance Coverage by Age in Colmar Manor
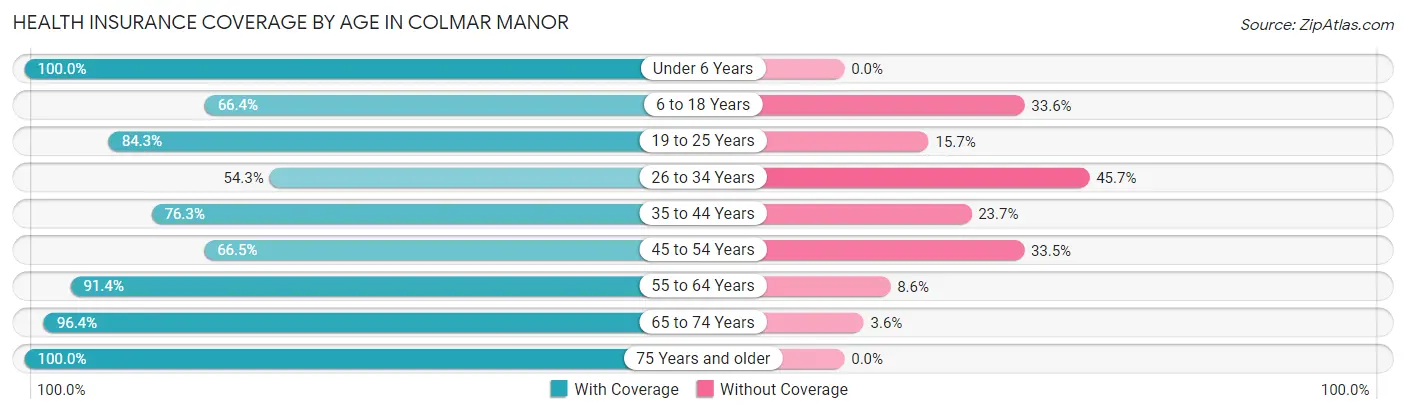
| Age Bracket | With Coverage | Without Coverage |
| Under 6 Years | 108 (100.0%) | 0 (0.0%) |
| 6 to 18 Years | 172 (66.4%) | 87 (33.6%) |
| 19 to 25 Years | 236 (84.3%) | 44 (15.7%) |
| 26 to 34 Years | 88 (54.3%) | 74 (45.7%) |
| 35 to 44 Years | 129 (76.3%) | 40 (23.7%) |
| 45 to 54 Years | 135 (66.5%) | 68 (33.5%) |
| 55 to 64 Years | 171 (91.4%) | 16 (8.6%) |
| 65 to 74 Years | 107 (96.4%) | 4 (3.6%) |
| 75 Years and older | 29 (100.0%) | 0 (0.0%) |
| Total | 1,175 (77.9%) | 333 (22.1%) |
Health Insurance Coverage by Citizenship Status in Colmar Manor
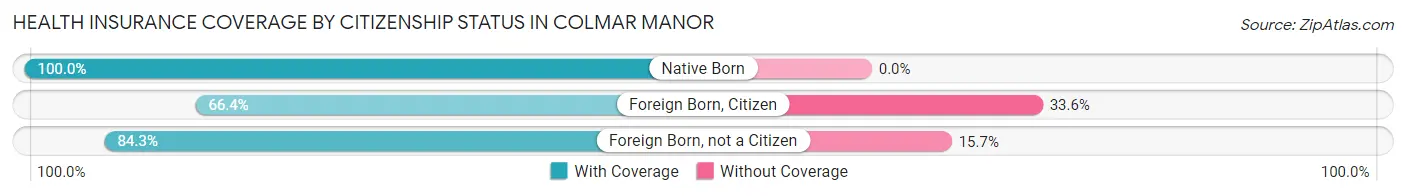
| Citizenship Status | With Coverage | Without Coverage |
| Native Born | 108 (100.0%) | 0 (0.0%) |
| Foreign Born, Citizen | 172 (66.4%) | 87 (33.6%) |
| Foreign Born, not a Citizen | 236 (84.3%) | 44 (15.7%) |
Health Insurance Coverage by Household Income in Colmar Manor
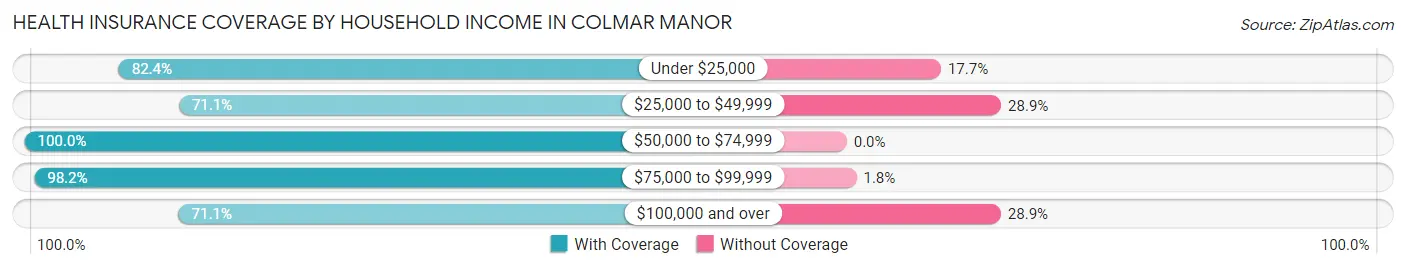
| Household Income | With Coverage | Without Coverage |
| Under $25,000 | 28 (82.4%) | 6 (17.6%) |
| $25,000 to $49,999 | 177 (71.1%) | 72 (28.9%) |
| $50,000 to $74,999 | 187 (100.0%) | 0 (0.0%) |
| $75,000 to $99,999 | 162 (98.2%) | 3 (1.8%) |
| $100,000 and over | 621 (71.1%) | 252 (28.9%) |
Public vs Private Health Insurance Coverage by Age in Colmar Manor
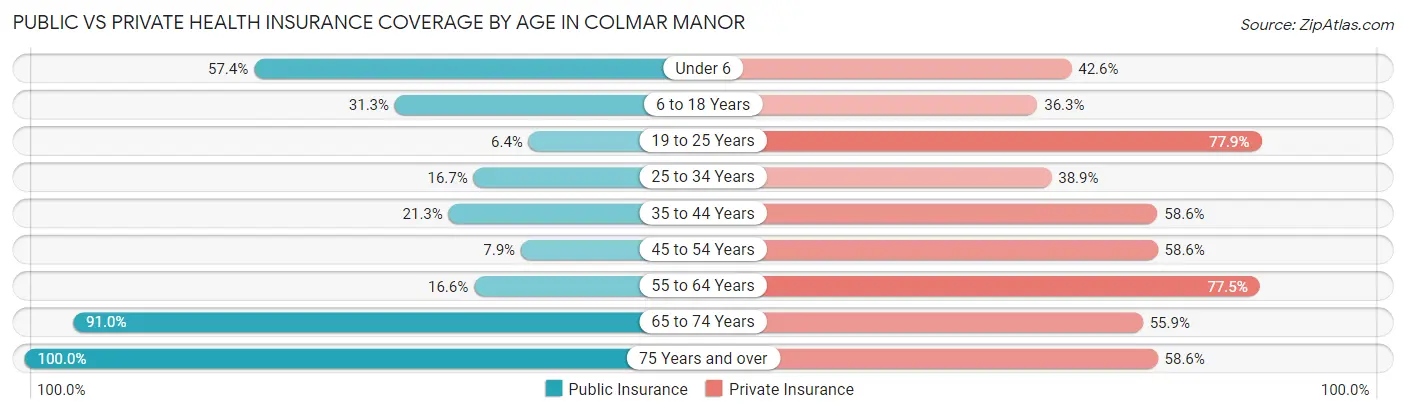
| Age Bracket | Public Insurance | Private Insurance |
| Under 6 | 62 (57.4%) | 46 (42.6%) |
| 6 to 18 Years | 81 (31.3%) | 94 (36.3%) |
| 19 to 25 Years | 18 (6.4%) | 218 (77.9%) |
| 25 to 34 Years | 27 (16.7%) | 63 (38.9%) |
| 35 to 44 Years | 36 (21.3%) | 99 (58.6%) |
| 45 to 54 Years | 16 (7.9%) | 119 (58.6%) |
| 55 to 64 Years | 31 (16.6%) | 145 (77.5%) |
| 65 to 74 Years | 101 (91.0%) | 62 (55.9%) |
| 75 Years and over | 29 (100.0%) | 17 (58.6%) |
| Total | 401 (26.6%) | 863 (57.2%) |
Disability Status by Sex by Age in Colmar Manor
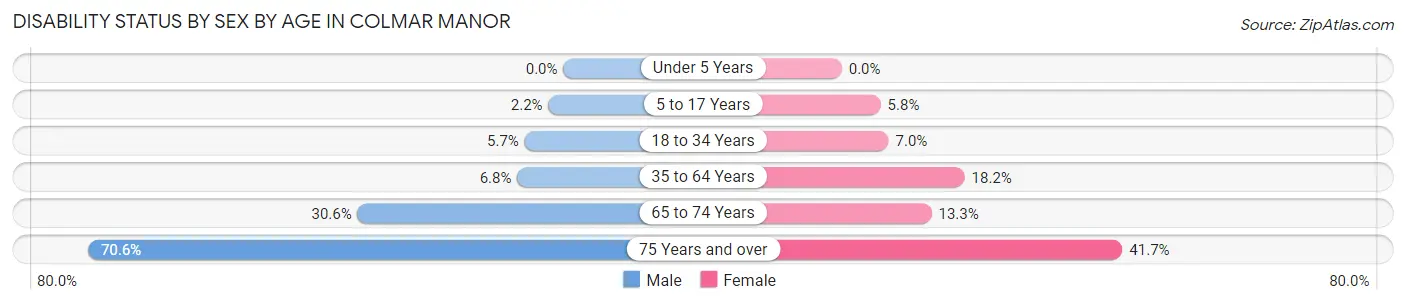
| Age Bracket | Male | Female |
| Under 5 Years | 0 (0.0%) | 0 (0.0%) |
| 5 to 17 Years | 3 (2.2%) | 6 (5.8%) |
| 18 to 34 Years | 12 (5.7%) | 18 (7.0%) |
| 35 to 64 Years | 18 (6.8%) | 54 (18.2%) |
| 65 to 74 Years | 11 (30.6%) | 10 (13.3%) |
| 75 Years and over | 12 (70.6%) | 5 (41.7%) |
Disability Class by Sex by Age in Colmar Manor
Disability Class: Hearing Difficulty
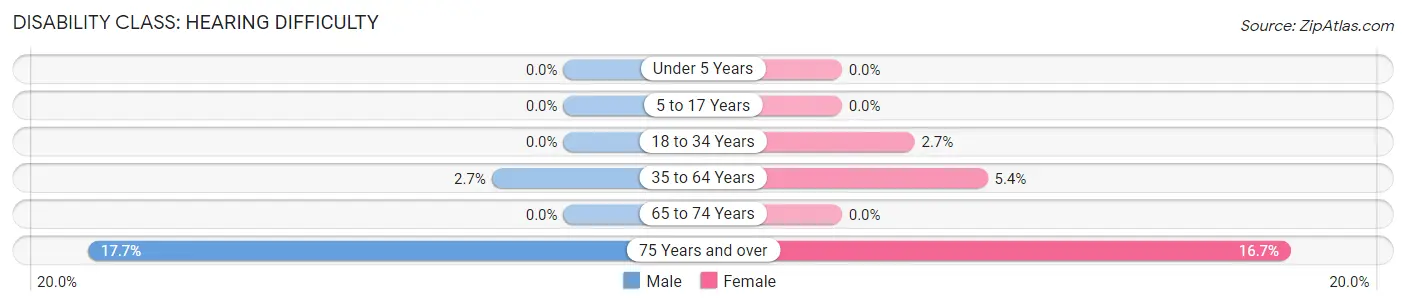
| Age Bracket | Male | Female |
| Under 5 Years | 0 (0.0%) | 0 (0.0%) |
| 5 to 17 Years | 0 (0.0%) | 0 (0.0%) |
| 18 to 34 Years | 0 (0.0%) | 7 (2.7%) |
| 35 to 64 Years | 7 (2.7%) | 16 (5.4%) |
| 65 to 74 Years | 0 (0.0%) | 0 (0.0%) |
| 75 Years and over | 3 (17.6%) | 2 (16.7%) |
Disability Class: Vision Difficulty
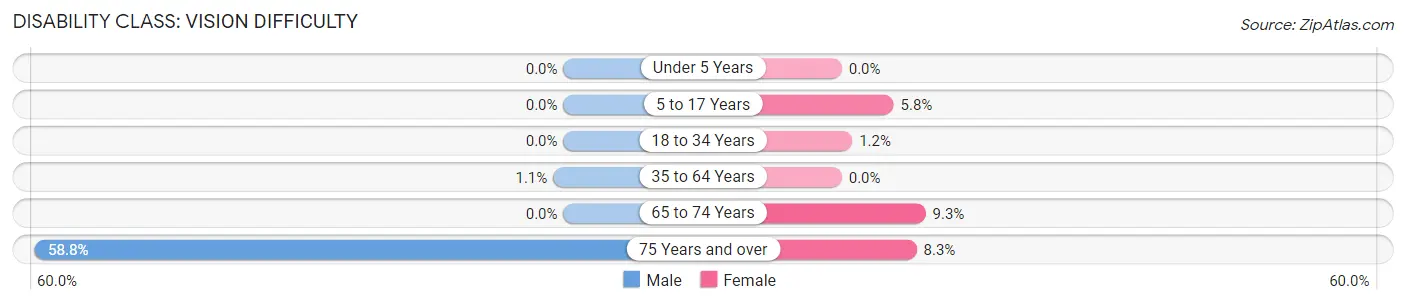
| Age Bracket | Male | Female |
| Under 5 Years | 0 (0.0%) | 0 (0.0%) |
| 5 to 17 Years | 0 (0.0%) | 6 (5.8%) |
| 18 to 34 Years | 0 (0.0%) | 3 (1.2%) |
| 35 to 64 Years | 3 (1.1%) | 0 (0.0%) |
| 65 to 74 Years | 0 (0.0%) | 7 (9.3%) |
| 75 Years and over | 10 (58.8%) | 1 (8.3%) |
Disability Class: Cognitive Difficulty
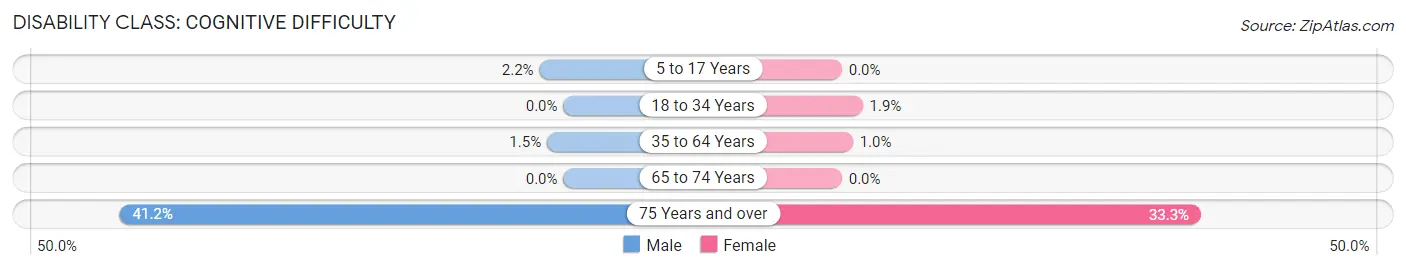
| Age Bracket | Male | Female |
| 5 to 17 Years | 3 (2.2%) | 0 (0.0%) |
| 18 to 34 Years | 0 (0.0%) | 5 (1.9%) |
| 35 to 64 Years | 4 (1.5%) | 3 (1.0%) |
| 65 to 74 Years | 0 (0.0%) | 0 (0.0%) |
| 75 Years and over | 7 (41.2%) | 4 (33.3%) |
Disability Class: Ambulatory Difficulty
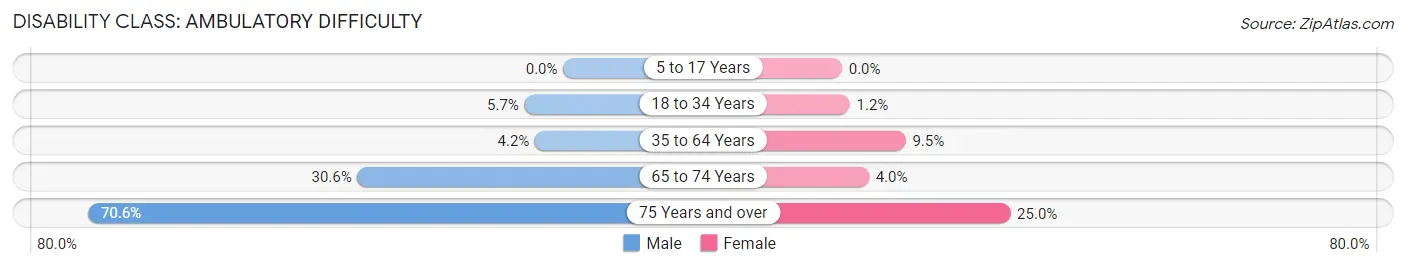
| Age Bracket | Male | Female |
| 5 to 17 Years | 0 (0.0%) | 0 (0.0%) |
| 18 to 34 Years | 12 (5.7%) | 3 (1.2%) |
| 35 to 64 Years | 11 (4.2%) | 28 (9.5%) |
| 65 to 74 Years | 11 (30.6%) | 3 (4.0%) |
| 75 Years and over | 12 (70.6%) | 3 (25.0%) |
Disability Class: Self-Care Difficulty
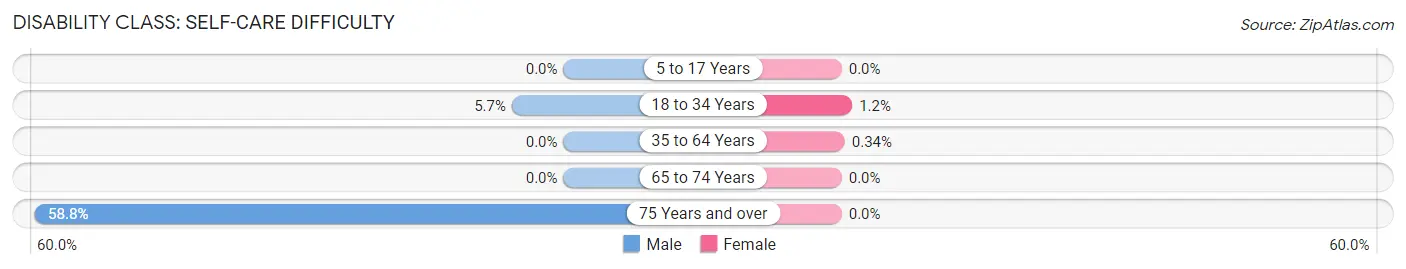
| Age Bracket | Male | Female |
| 5 to 17 Years | 0 (0.0%) | 0 (0.0%) |
| 18 to 34 Years | 12 (5.7%) | 3 (1.2%) |
| 35 to 64 Years | 0 (0.0%) | 1 (0.3%) |
| 65 to 74 Years | 0 (0.0%) | 0 (0.0%) |
| 75 Years and over | 10 (58.8%) | 0 (0.0%) |
Technology Access in Colmar Manor
Computing Device Access in Colmar Manor
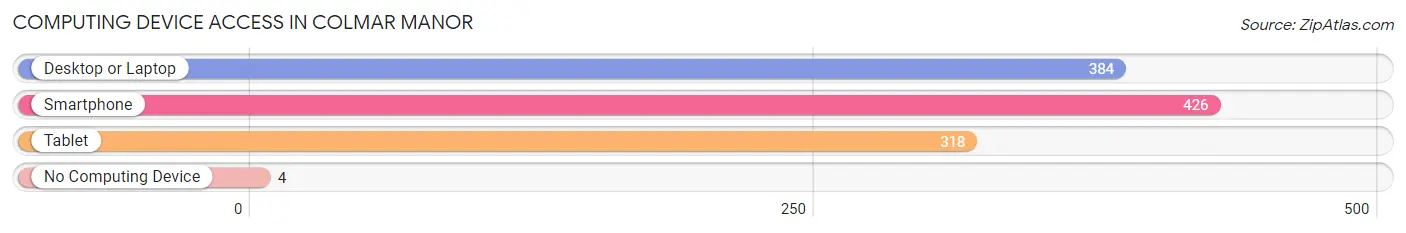
| Device Type | # Households | % Households |
| Desktop or Laptop | 384 | 85.3% |
| Smartphone | 426 | 94.7% |
| Tablet | 318 | 70.7% |
| No Computing Device | 4 | 0.9% |
| Total | 450 | 100.0% |
Internet Access in Colmar Manor
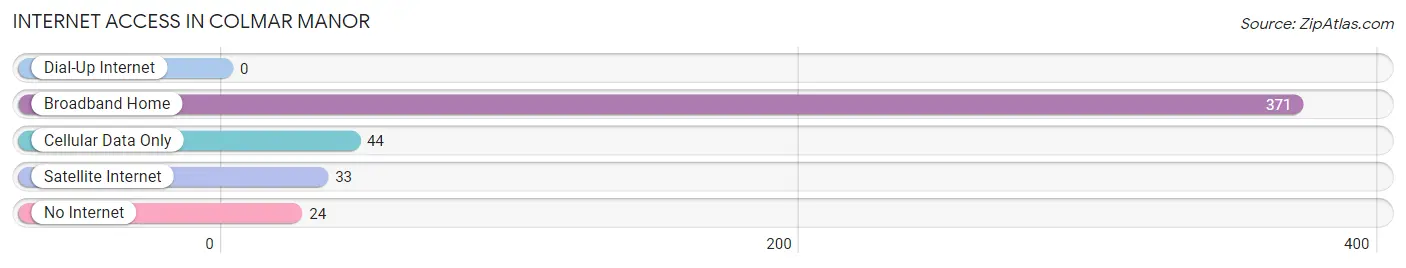
| Internet Type | # Households | % Households |
| Dial-Up Internet | 0 | 0.0% |
| Broadband Home | 371 | 82.4% |
| Cellular Data Only | 44 | 9.8% |
| Satellite Internet | 33 | 7.3% |
| No Internet | 24 | 5.3% |
| Total | 450 | 100.0% |
Colmar Manor Summary
Colmar Manor is a small town located in Prince George’s County, Maryland. It is situated on the eastern bank of the Anacostia River, just north of Washington, D.C. The town was founded in 1892 and incorporated in 1921. It is a small, rural community with a population of just over 1,000 people.
History
Colmar Manor was originally part of the large tract of land known as the “Manor of Colmar”, which was granted to the Calvert family in 1696. The land was then divided into several smaller tracts, and the area that is now Colmar Manor was purchased by the Colmar family in 1790. The family built a large manor house on the property, which still stands today.
The town of Colmar Manor was officially founded in 1892, when the Colmar family sold off some of their land to developers. The town was named after the Colmar family, and the manor house was used as the town hall. The town was incorporated in 1921, and the population grew steadily over the next few decades.
Geography
Colmar Manor is located in Prince George’s County, Maryland. It is situated on the eastern bank of the Anacostia River, just north of Washington, D.C. The town is bordered by the towns of Bladensburg to the north, Cheverly to the east, and Edmonston to the south. The town covers an area of just over one square mile, and is mostly residential.
Economy
The economy of Colmar Manor is largely based on small businesses and local services. The town is home to several small retail stores, restaurants, and other businesses. There are also several churches and other places of worship in the town.
Demographics
As of the 2010 census, the population of Colmar Manor was 1,068. The racial makeup of the town was 79.3% African American, 15.2% White, 2.2% Hispanic or Latino, and 3.3% other. The median household income was $45,938, and the median home value was $179,000.
Colmar Manor is a small, rural community with a rich history and a diverse population. It is a great place to live, work, and raise a family. The town is close to Washington, D.C., and offers a quiet, peaceful atmosphere.
Common Questions
What is Per Capita Income in Colmar Manor?
Per Capita income in Colmar Manor is $35,166.
What is the Median Family Income in Colmar Manor?
Median Family Income in Colmar Manor is $81,900.
What is the Median Household income in Colmar Manor?
Median Household Income in Colmar Manor is $91,250.
What is Income or Wage Gap in Colmar Manor?
Income or Wage Gap in Colmar Manor is 5.5%.
Women in Colmar Manor earn 94.5 cents for every dollar earned by a man.
What is Inequality or Gini Index in Colmar Manor?
Inequality or Gini Index in Colmar Manor is 0.38.
What is the Total Population of Colmar Manor?
Total Population of Colmar Manor is 1,516.
What is the Total Male Population of Colmar Manor?
Total Male Population of Colmar Manor is 725.
What is the Total Female Population of Colmar Manor?
Total Female Population of Colmar Manor is 791.
What is the Ratio of Males per 100 Females in Colmar Manor?
There are 91.66 Males per 100 Females in Colmar Manor.
What is the Ratio of Females per 100 Males in Colmar Manor?
There are 109.10 Females per 100 Males in Colmar Manor.
What is the Median Population Age in Colmar Manor?
Median Population Age in Colmar Manor is 31.8 Years.
What is the Average Family Size in Colmar Manor
Average Family Size in Colmar Manor is 4.4 People.
What is the Average Household Size in Colmar Manor
Average Household Size in Colmar Manor is 3.4 People.
How Large is the Labor Force in Colmar Manor?
There are 904 People in the Labor Forcein in Colmar Manor.
What is the Percentage of People in the Labor Force in Colmar Manor?
73.7% of People are in the Labor Force in Colmar Manor.
What is the Unemployment Rate in Colmar Manor?
Unemployment Rate in Colmar Manor is 7.8%.