Woodlawn CDP Prince George s County, MD Map & Demographics
Woodlawn CDP Prince George s County Overview
$30,594
PER CAPITA INCOME
$105,441
AVG FAMILY INCOME
$88,750
AVG HOUSEHOLD INCOME
28.6%
WAGE / INCOME GAP [ % ]
71.4¢/ $1
WAGE / INCOME GAP [ $ ]
0.38
INEQUALITY / GINI INDEX
7,515
TOTAL POPULATION
3,782
MALE POPULATION
3,733
FEMALE POPULATION
101.31
MALES / 100 FEMALES
98.70
FEMALES / 100 MALES
36.4
MEDIAN AGE
4.4
AVG FAMILY SIZE
3.7
AVG HOUSEHOLD SIZE
3,998
LABOR FORCE [ PEOPLE ]
71.6%
PERCENT IN LABOR FORCE
12.4%
UNEMPLOYMENT RATE
Income in Woodlawn CDP Prince George s County
Income Overview in Woodlawn CDP Prince George s County
Per Capita Income in Woodlawn CDP Prince George s County is $30,594, while median incomes of families and households are $105,441 and $88,750 respectively.
| Characteristic | Number | Measure |
| Per Capita Income | 7,515 | $30,594 |
| Median Family Income | 1,500 | $105,441 |
| Mean Family Income | 1,500 | $115,991 |
| Median Household Income | 2,038 | $88,750 |
| Mean Household Income | 2,038 | $107,250 |
| Income Deficit | 1,500 | $0 |
| Wage / Income Gap (%) | 7,515 | 28.64% |
| Wage / Income Gap ($) | 7,515 | 71.36¢ per $1 |
| Gini / Inequality Index | 7,515 | 0.38 |
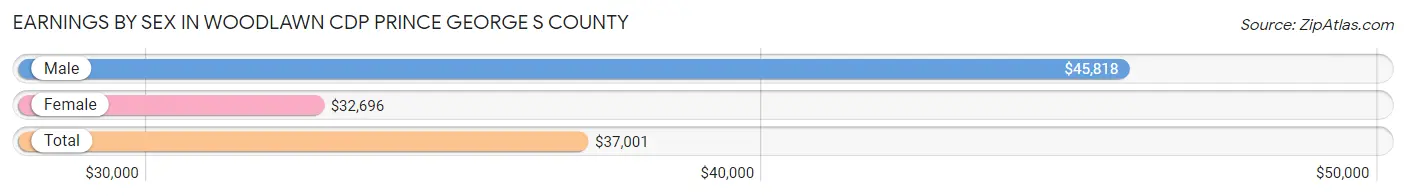
Earnings by Sex in Woodlawn CDP Prince George s County
Average Earnings in Woodlawn CDP Prince George s County are $37,001, $45,818 for men and $32,696 for women, a difference of 28.6%.
| Sex | Number | Average Earnings |
| Male | 2,108 (53.5%) | $45,818 |
| Female | 1,833 (46.5%) | $32,696 |
| Total | 3,941 (100.0%) | $37,001 |
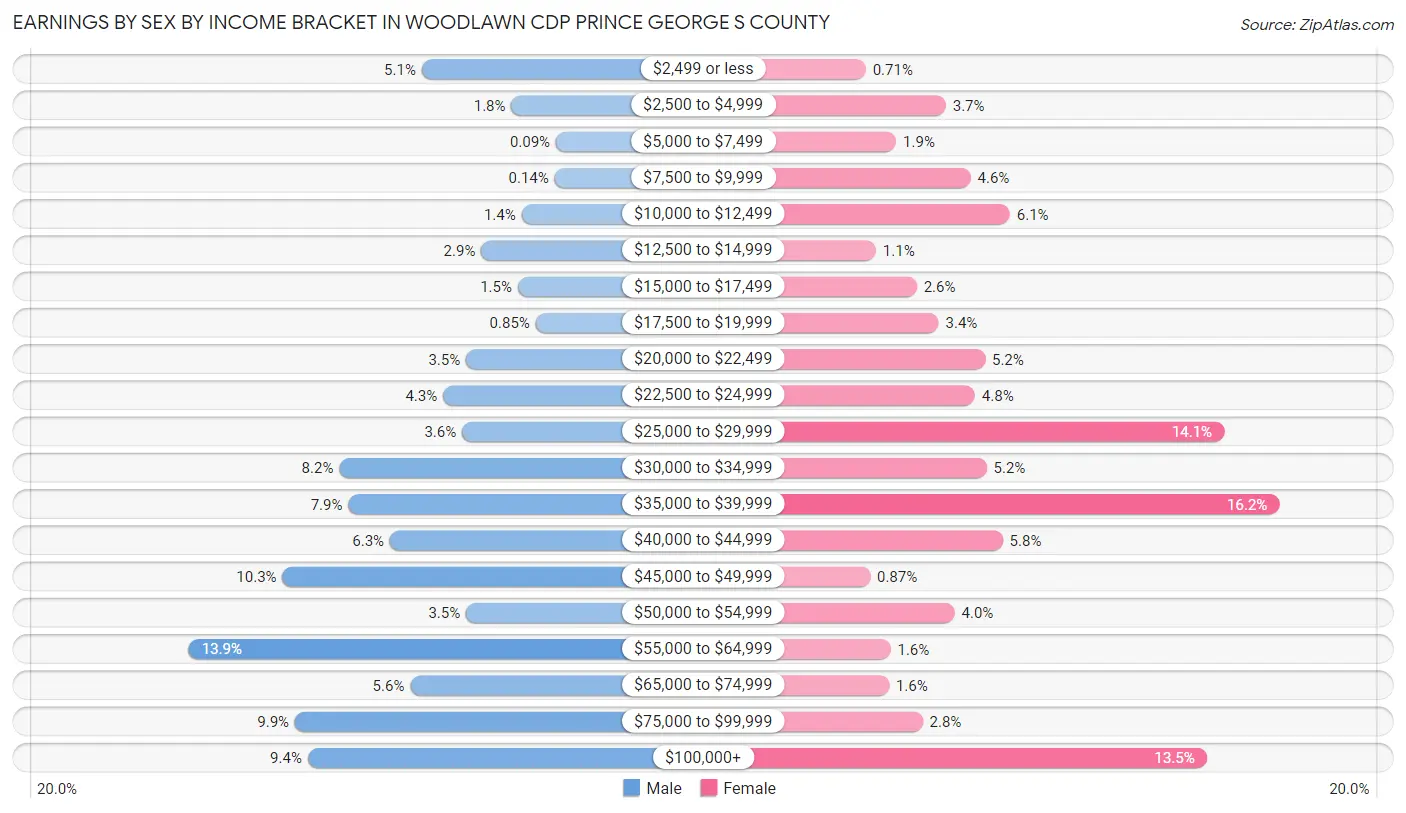
Earnings by Sex by Income Bracket in Woodlawn CDP Prince George s County
The most common earnings brackets in Woodlawn CDP Prince George s County are $55,000 to $64,999 for men (292 | 13.9%) and $35,000 to $39,999 for women (297 | 16.2%).
| Income | Male | Female |
| $2,499 or less | 108 (5.1%) | 13 (0.7%) |
| $2,500 to $4,999 | 37 (1.8%) | 68 (3.7%) |
| $5,000 to $7,499 | 2 (0.1%) | 34 (1.8%) |
| $7,500 to $9,999 | 3 (0.1%) | 85 (4.6%) |
| $10,000 to $12,499 | 29 (1.4%) | 112 (6.1%) |
| $12,500 to $14,999 | 61 (2.9%) | 20 (1.1%) |
| $15,000 to $17,499 | 32 (1.5%) | 48 (2.6%) |
| $17,500 to $19,999 | 18 (0.9%) | 63 (3.4%) |
| $20,000 to $22,499 | 73 (3.5%) | 95 (5.2%) |
| $22,500 to $24,999 | 91 (4.3%) | 88 (4.8%) |
| $25,000 to $29,999 | 76 (3.6%) | 259 (14.1%) |
| $30,000 to $34,999 | 173 (8.2%) | 96 (5.2%) |
| $35,000 to $39,999 | 166 (7.9%) | 297 (16.2%) |
| $40,000 to $44,999 | 133 (6.3%) | 107 (5.8%) |
| $45,000 to $49,999 | 218 (10.3%) | 16 (0.9%) |
| $50,000 to $54,999 | 73 (3.5%) | 74 (4.0%) |
| $55,000 to $64,999 | 292 (13.9%) | 30 (1.6%) |
| $65,000 to $74,999 | 117 (5.6%) | 29 (1.6%) |
| $75,000 to $99,999 | 208 (9.9%) | 52 (2.8%) |
| $100,000+ | 198 (9.4%) | 247 (13.5%) |
| Total | 2,108 (100.0%) | 1,833 (100.0%) |
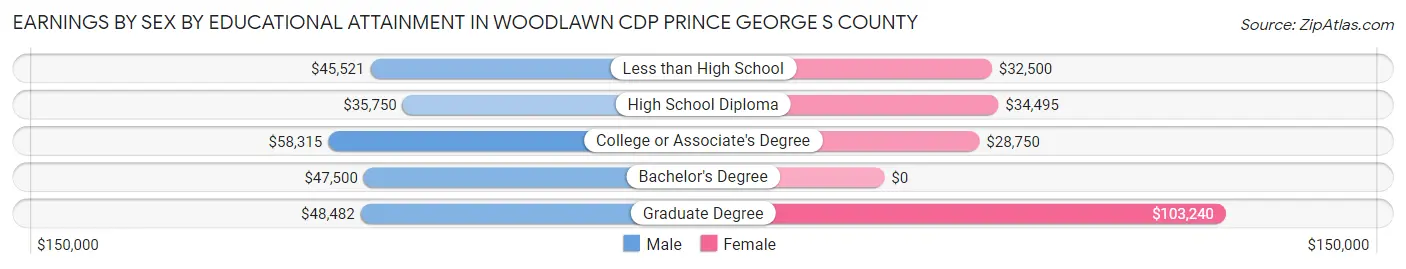
Earnings by Sex by Educational Attainment in Woodlawn CDP Prince George s County
Average earnings in Woodlawn CDP Prince George s County are $46,219 for men and $35,361 for women, a difference of 23.5%. Men with an educational attainment of college or associate's degree enjoy the highest average annual earnings of $58,315, while those with high school diploma education earn the least with $35,750. Women with an educational attainment of graduate degree earn the most with the average annual earnings of $103,240, while those with college or associate's degree education have the smallest earnings of $28,750.
| Educational Attainment | Male Income | Female Income |
| Less than High School | $45,521 | $32,500 |
| High School Diploma | $35,750 | $34,495 |
| College or Associate's Degree | $58,315 | $28,750 |
| Bachelor's Degree | $47,500 | $0 |
| Graduate Degree | $48,482 | $103,240 |
| Total | $46,219 | $35,361 |
Family Income in Woodlawn CDP Prince George s County
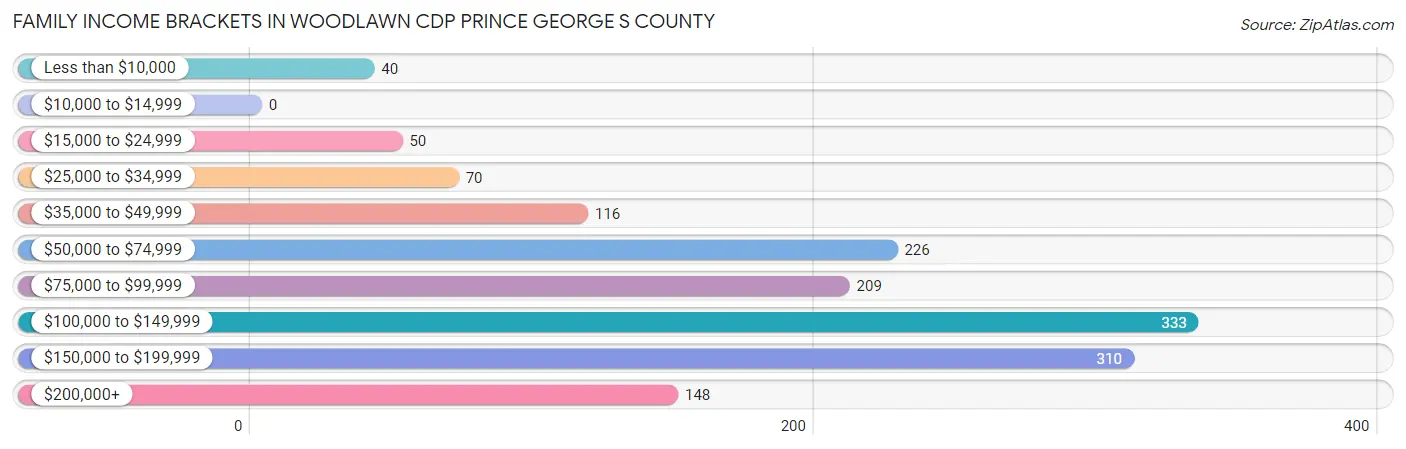
Family Income Brackets in Woodlawn CDP Prince George s County
According to the Woodlawn CDP Prince George s County family income data, there are 333 families falling into the $100,000 to $149,999 income range, which is the most common income bracket and makes up 22.2% of all families.
| Income Bracket | # Families | % Families |
| Less than $10,000 | 40 | 2.7% |
| $10,000 to $14,999 | 0 | 0.0% |
| $15,000 to $24,999 | 50 | 3.3% |
| $25,000 to $34,999 | 70 | 4.7% |
| $35,000 to $49,999 | 116 | 7.7% |
| $50,000 to $74,999 | 226 | 15.1% |
| $75,000 to $99,999 | 209 | 13.9% |
| $100,000 to $149,999 | 333 | 22.2% |
| $150,000 to $199,999 | 310 | 20.7% |
| $200,000+ | 148 | 9.9% |
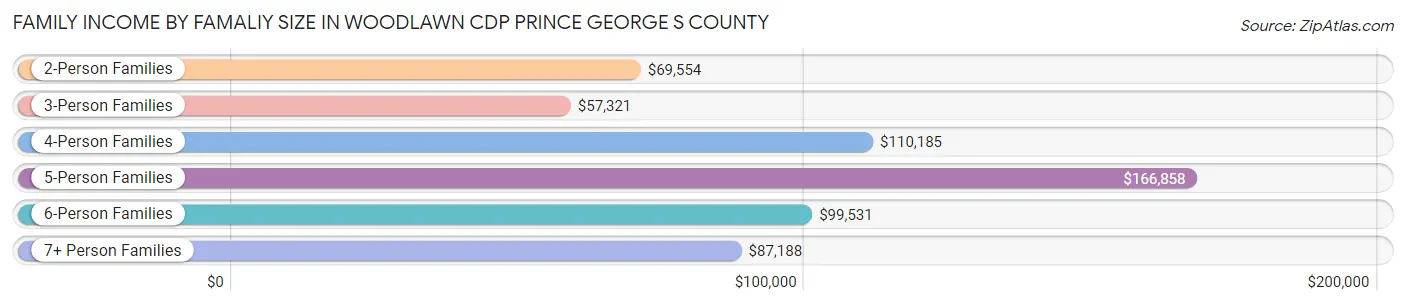
Family Income by Famaliy Size in Woodlawn CDP Prince George s County
5-person families (378 | 25.2%) account for the highest median family income in Woodlawn CDP Prince George s County with $166,858 per family, while 2-person families (295 | 19.7%) have the highest median income of $34,777 per family member.
| Income Bracket | # Families | Median Income |
| 2-Person Families | 295 (19.7%) | $69,554 |
| 3-Person Families | 198 (13.2%) | $57,321 |
| 4-Person Families | 390 (26.0%) | $110,185 |
| 5-Person Families | 378 (25.2%) | $166,858 |
| 6-Person Families | 61 (4.1%) | $99,531 |
| 7+ Person Families | 178 (11.9%) | $87,188 |
| Total | 1,500 (100.0%) | $105,441 |
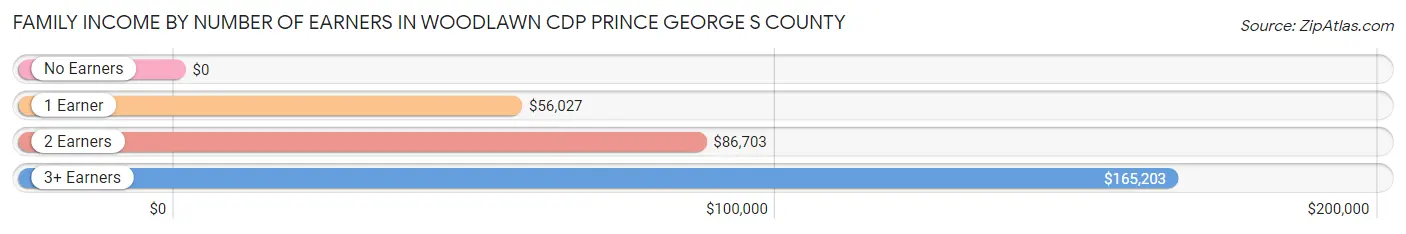
Family Income by Number of Earners in Woodlawn CDP Prince George s County
| Number of Earners | # Families | Median Income |
| No Earners | 62 (4.1%) | $0 |
| 1 Earner | 377 (25.1%) | $56,027 |
| 2 Earners | 559 (37.3%) | $86,703 |
| 3+ Earners | 502 (33.5%) | $165,203 |
| Total | 1,500 (100.0%) | $105,441 |
Household Income in Woodlawn CDP Prince George s County
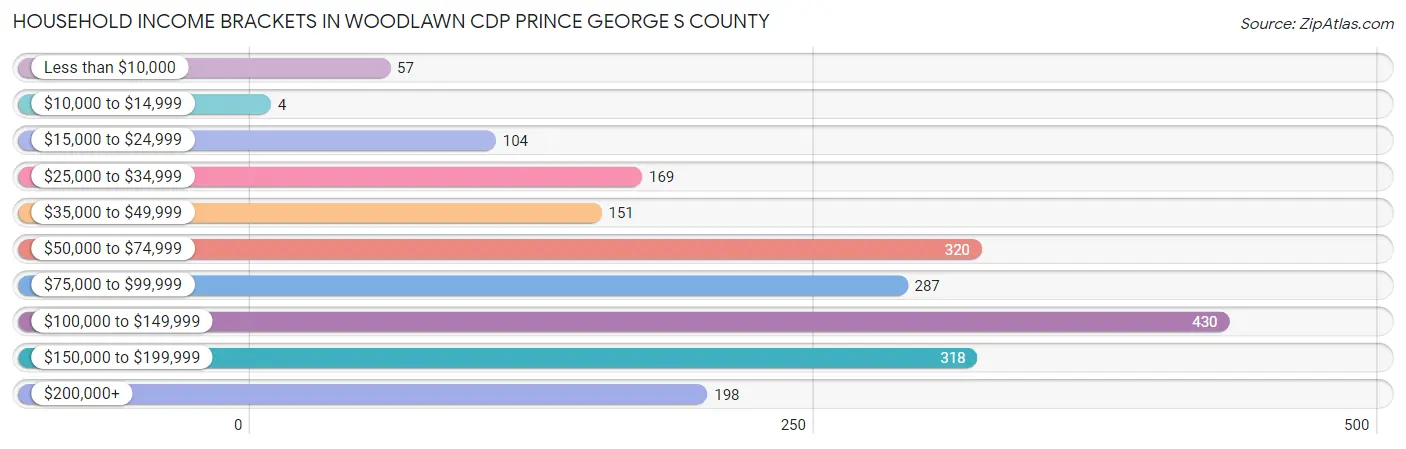
Household Income Brackets in Woodlawn CDP Prince George s County
With 430 households falling in the category, the $100,000 to $149,999 income range is the most frequent in Woodlawn CDP Prince George s County, accounting for 21.1% of all households. In contrast, only 4 households (0.2%) fall into the $10,000 to $14,999 income bracket, making it the least populous group.
| Income Bracket | # Households | % Households |
| Less than $10,000 | 57 | 2.8% |
| $10,000 to $14,999 | 4 | 0.2% |
| $15,000 to $24,999 | 104 | 5.1% |
| $25,000 to $34,999 | 169 | 8.3% |
| $35,000 to $49,999 | 151 | 7.4% |
| $50,000 to $74,999 | 320 | 15.7% |
| $75,000 to $99,999 | 287 | 14.1% |
| $100,000 to $149,999 | 430 | 21.1% |
| $150,000 to $199,999 | 318 | 15.6% |
| $200,000+ | 198 | 9.7% |
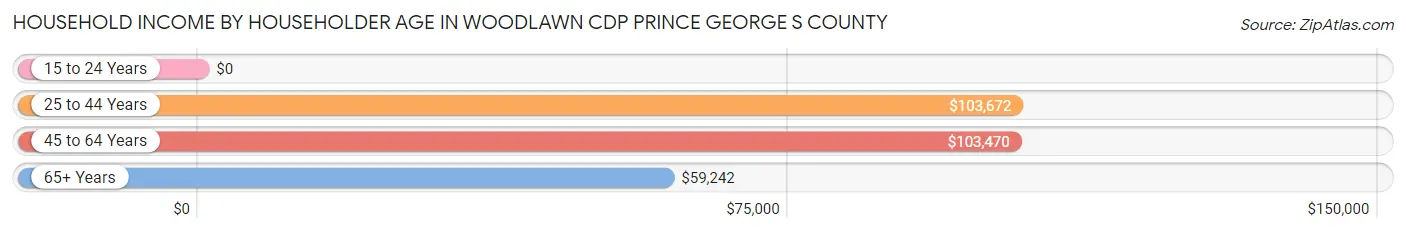
Household Income by Householder Age in Woodlawn CDP Prince George s County
The median household income in Woodlawn CDP Prince George s County is $88,750, with the highest median household income of $103,672 found in the 25 to 44 years age bracket for the primary householder. A total of 447 households (21.9%) fall into this category. Meanwhile, the 15 to 24 years age bracket for the primary householder has the lowest median household income of $0, with 24 households (1.2%) in this group.
| Income Bracket | # Households | Median Income |
| 15 to 24 Years | 24 (1.2%) | $0 |
| 25 to 44 Years | 447 (21.9%) | $103,672 |
| 45 to 64 Years | 1,004 (49.3%) | $103,470 |
| 65+ Years | 563 (27.6%) | $59,242 |
| Total | 2,038 (100.0%) | $88,750 |
Poverty in Woodlawn CDP Prince George s County
Income Below Poverty by Sex and Age in Woodlawn CDP Prince George s County
With 3.7% poverty level for males and 5.7% for females among the residents of Woodlawn CDP Prince George s County, 75 year old and over males and 15 year old females are the most vulnerable to poverty, with 32 males (42.7%) and 26 females (49.1%) in their respective age groups living below the poverty level.
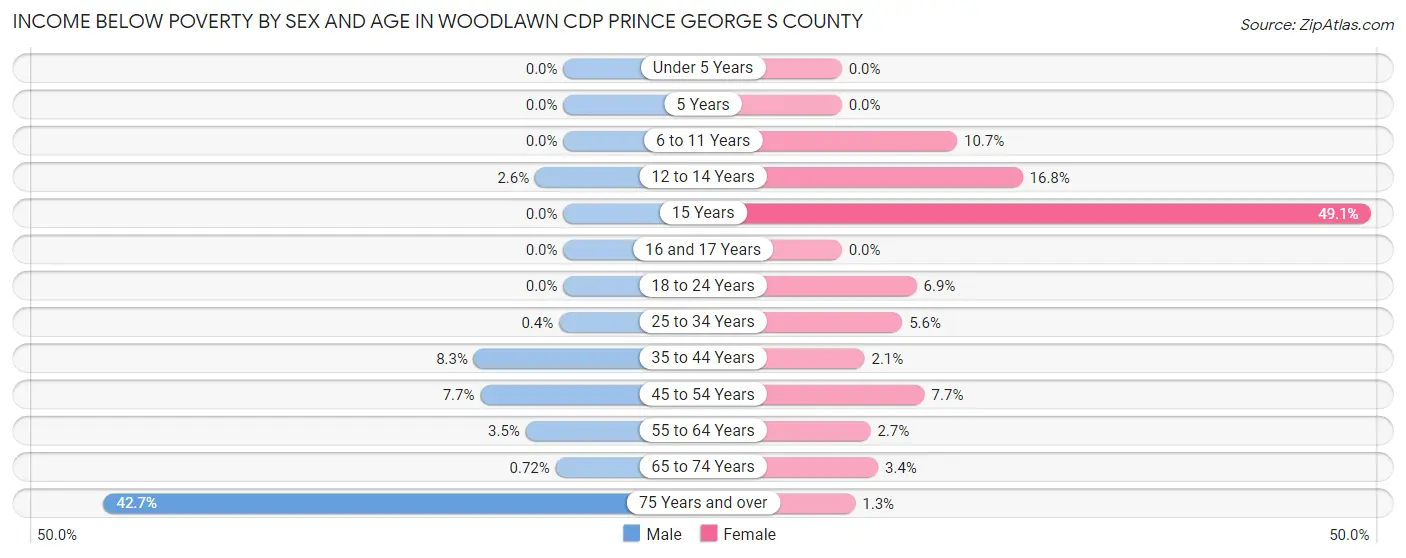
| Age Bracket | Male | Female |
| Under 5 Years | 0 (0.0%) | 0 (0.0%) |
| 5 Years | 0 (0.0%) | 0 (0.0%) |
| 6 to 11 Years | 0 (0.0%) | 32 (10.7%) |
| 12 to 14 Years | 4 (2.6%) | 24 (16.8%) |
| 15 Years | 0 (0.0%) | 26 (49.1%) |
| 16 and 17 Years | 0 (0.0%) | 0 (0.0%) |
| 18 to 24 Years | 0 (0.0%) | 22 (6.9%) |
| 25 to 34 Years | 2 (0.4%) | 25 (5.6%) |
| 35 to 44 Years | 55 (8.3%) | 10 (2.1%) |
| 45 to 54 Years | 31 (7.7%) | 48 (7.7%) |
| 55 to 64 Years | 15 (3.5%) | 13 (2.7%) |
| 65 to 74 Years | 2 (0.7%) | 9 (3.4%) |
| 75 Years and over | 32 (42.7%) | 3 (1.3%) |
| Total | 141 (3.7%) | 212 (5.7%) |
Income Above Poverty by Sex and Age in Woodlawn CDP Prince George s County
According to the poverty statistics in Woodlawn CDP Prince George s County, males aged under 5 years and females aged under 5 years are the age groups that are most secure financially, with 100.0% of males and 100.0% of females in these age groups living above the poverty line.
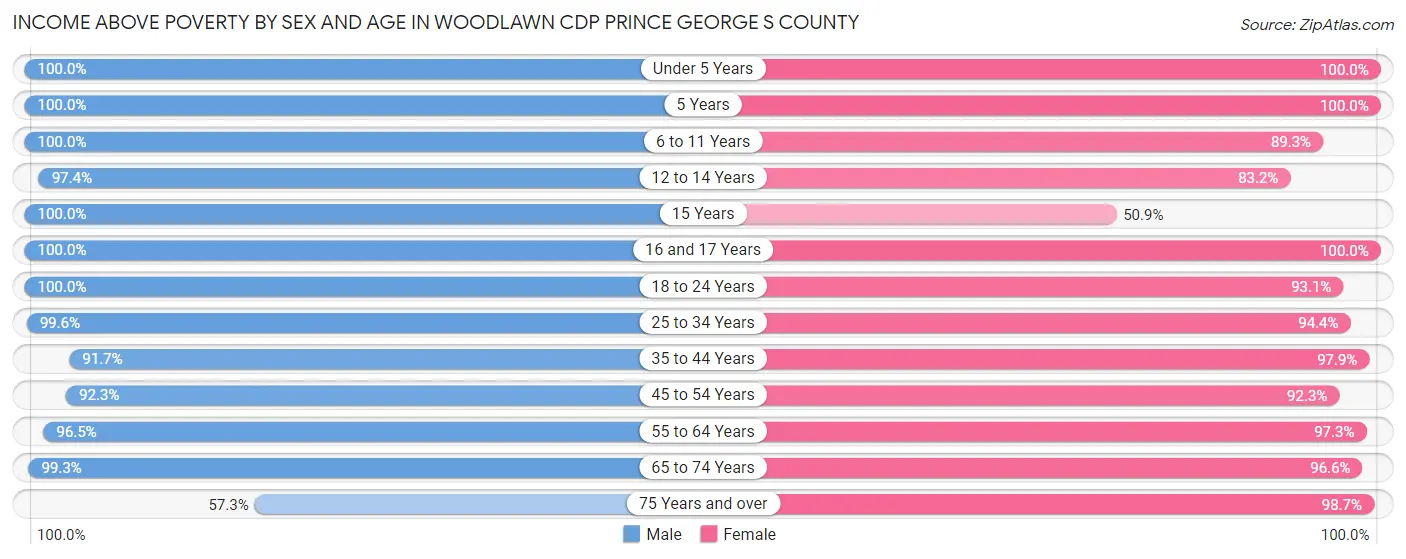
| Age Bracket | Male | Female |
| Under 5 Years | 552 (100.0%) | 262 (100.0%) |
| 5 Years | 81 (100.0%) | 16 (100.0%) |
| 6 to 11 Years | 334 (100.0%) | 267 (89.3%) |
| 12 to 14 Years | 148 (97.4%) | 119 (83.2%) |
| 15 Years | 39 (100.0%) | 27 (50.9%) |
| 16 and 17 Years | 66 (100.0%) | 104 (100.0%) |
| 18 to 24 Years | 200 (100.0%) | 295 (93.1%) |
| 25 to 34 Years | 504 (99.6%) | 421 (94.4%) |
| 35 to 44 Years | 607 (91.7%) | 465 (97.9%) |
| 45 to 54 Years | 371 (92.3%) | 576 (92.3%) |
| 55 to 64 Years | 413 (96.5%) | 475 (97.3%) |
| 65 to 74 Years | 274 (99.3%) | 258 (96.6%) |
| 75 Years and over | 43 (57.3%) | 236 (98.7%) |
| Total | 3,632 (96.3%) | 3,521 (94.3%) |
Income Below Poverty Among Married-Couple Families in Woodlawn CDP Prince George s County
The poverty statistics for married-couple families in Woodlawn CDP Prince George s County show that 6.4% or 57 of the total 892 families live below the poverty line. Families with 1 or 2 children have the highest poverty rate of 9.7%, comprising of 44 families. On the other hand, families with 3 or 4 children have the lowest poverty rate of 0.0%, which includes 0 families.
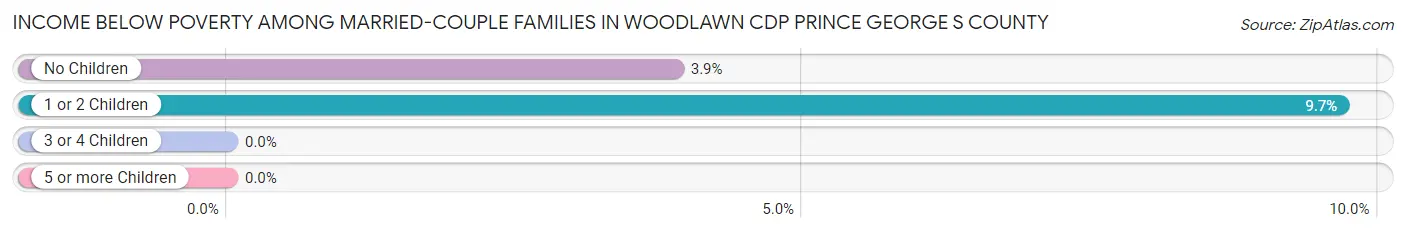
| Children | Above Poverty | Below Poverty |
| No Children | 322 (96.1%) | 13 (3.9%) |
| 1 or 2 Children | 411 (90.3%) | 44 (9.7%) |
| 3 or 4 Children | 76 (100.0%) | 0 (0.0%) |
| 5 or more Children | 26 (100.0%) | 0 (0.0%) |
| Total | 835 (93.6%) | 57 (6.4%) |
Income Below Poverty Among Single-Parent Households in Woodlawn CDP Prince George s County
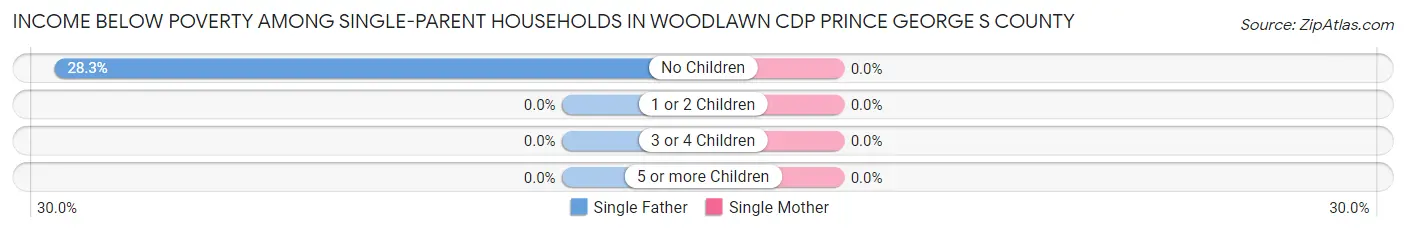
| Children | Single Father | Single Mother |
| No Children | 17 (28.3%) | 0 (0.0%) |
| 1 or 2 Children | 0 (0.0%) | 0 (0.0%) |
| 3 or 4 Children | 0 (0.0%) | 0 (0.0%) |
| 5 or more Children | 0 (0.0%) | 0 (0.0%) |
| Total | 17 (12.4%) | 0 (0.0%) |
Income Below Poverty Among Married-Couple vs Single-Parent Households in Woodlawn CDP Prince George s County
The poverty data for Woodlawn CDP Prince George s County shows that 57 of the married-couple family households (6.4%) and 17 of the single-parent households (2.8%) are living below the poverty level. Within the married-couple family households, those with 1 or 2 children have the highest poverty rate, with 44 households (9.7%) falling below the poverty line. Among the single-parent households, those with no children have the highest poverty rate, with 17 household (7.9%) living below poverty.
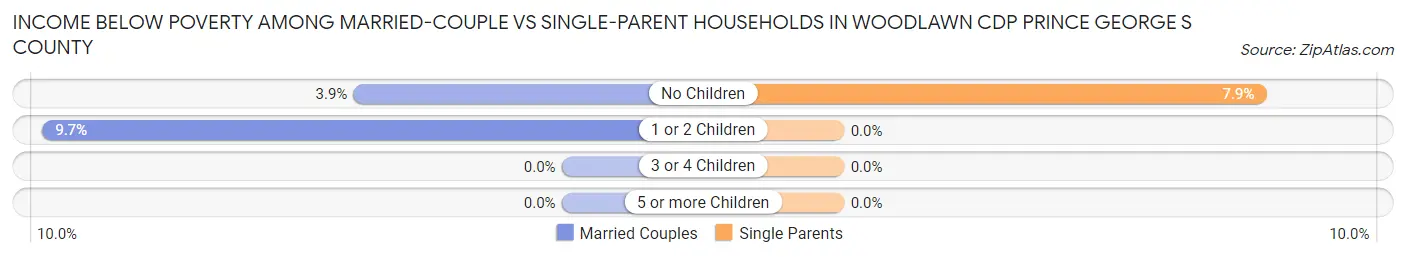
| Children | Married-Couple Families | Single-Parent Households |
| No Children | 13 (3.9%) | 17 (7.9%) |
| 1 or 2 Children | 44 (9.7%) | 0 (0.0%) |
| 3 or 4 Children | 0 (0.0%) | 0 (0.0%) |
| 5 or more Children | 0 (0.0%) | 0 (0.0%) |
| Total | 57 (6.4%) | 17 (2.8%) |
Race in Woodlawn CDP Prince George s County
The most populous races in Woodlawn CDP Prince George s County are Hispanic or Latino (4,079 | 54.3%), Some other Race (2,721 | 36.2%), and Black / African American (2,645 | 35.2%).
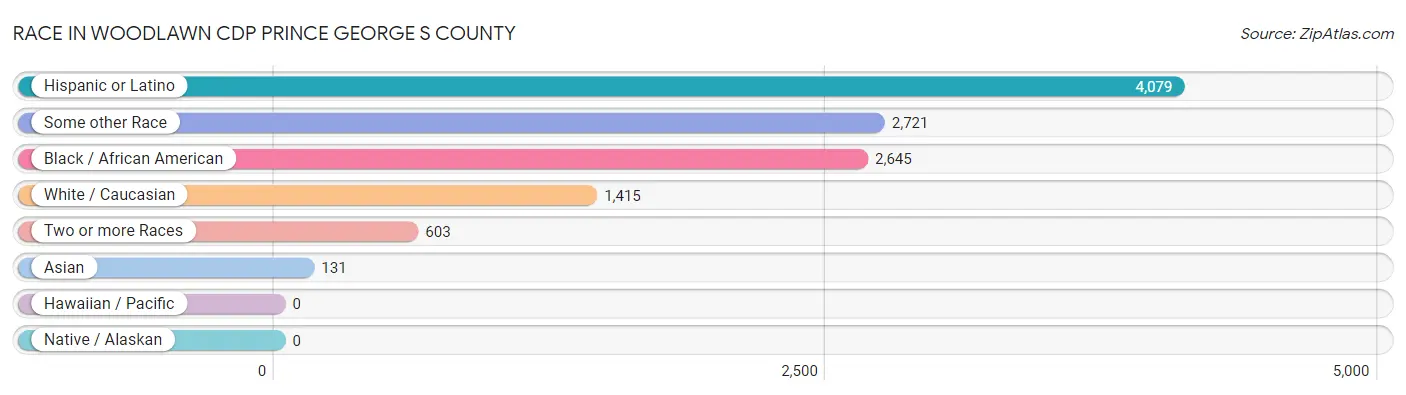
| Race | # Population | % Population |
| Asian | 131 | 1.7% |
| Black / African American | 2,645 | 35.2% |
| Hawaiian / Pacific | 0 | 0.0% |
| Hispanic or Latino | 4,079 | 54.3% |
| Native / Alaskan | 0 | 0.0% |
| White / Caucasian | 1,415 | 18.8% |
| Two or more Races | 603 | 8.0% |
| Some other Race | 2,721 | 36.2% |
| Total | 7,515 | 100.0% |
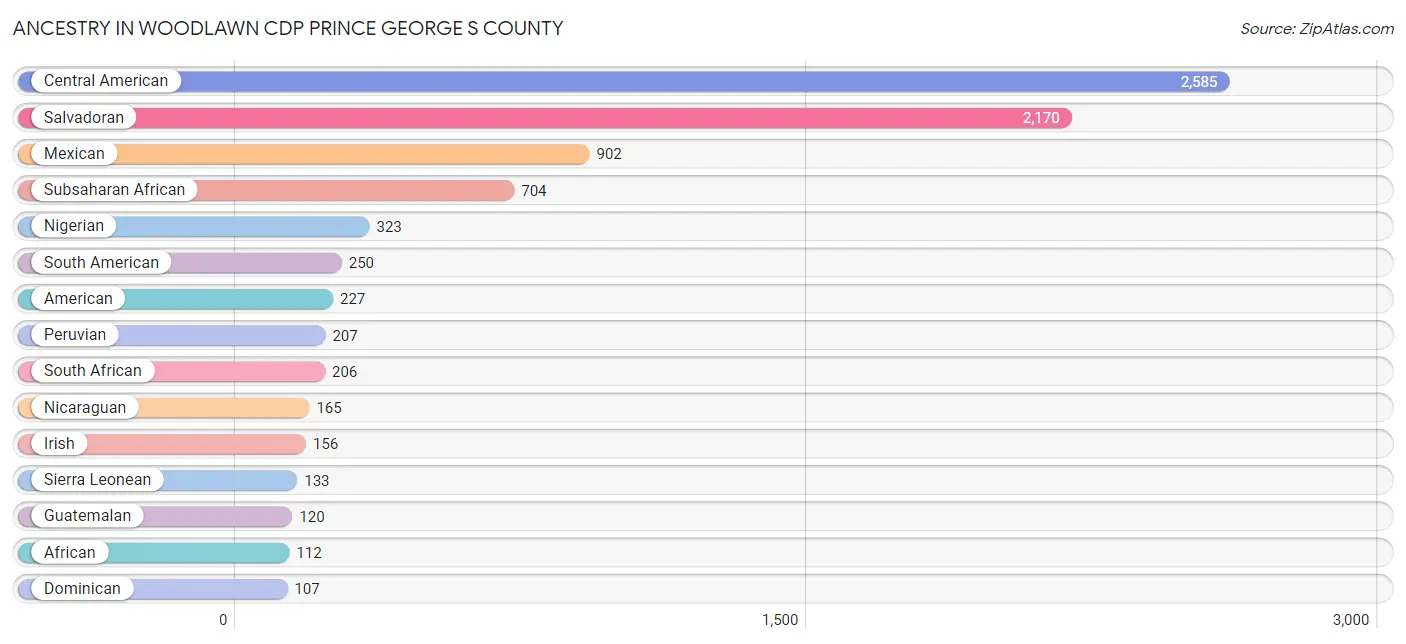
Ancestry in Woodlawn CDP Prince George s County
The most populous ancestries reported in Woodlawn CDP Prince George s County are Central American (2,585 | 34.4%), Salvadoran (2,170 | 28.9%), Mexican (902 | 12.0%), Subsaharan African (704 | 9.4%), and Nigerian (323 | 4.3%), together accounting for 89.0% of all Woodlawn CDP Prince George s County residents.
| Ancestry | # Population | % Population |
| African | 112 | 1.5% |
| American | 227 | 3.0% |
| Arab | 7 | 0.1% |
| Argentinean | 26 | 0.4% |
| Blackfeet | 33 | 0.4% |
| British | 45 | 0.6% |
| British West Indian | 56 | 0.7% |
| Central American | 2,585 | 34.4% |
| Dominican | 107 | 1.4% |
| English | 87 | 1.2% |
| European | 42 | 0.6% |
| French | 28 | 0.4% |
| German | 107 | 1.4% |
| German Russian | 61 | 0.8% |
| Guatemalan | 120 | 1.6% |
| Guyanese | 67 | 0.9% |
| Haitian | 70 | 0.9% |
| Honduran | 70 | 0.9% |
| Indian (Asian) | 10 | 0.1% |
| Irish | 156 | 2.1% |
| Italian | 57 | 0.8% |
| Jamaican | 69 | 0.9% |
| Jordanian | 7 | 0.1% |
| Korean | 47 | 0.6% |
| Lithuanian | 6 | 0.1% |
| Malaysian | 46 | 0.6% |
| Mexican | 902 | 12.0% |
| Nicaraguan | 165 | 2.2% |
| Nigerian | 323 | 4.3% |
| Norwegian | 7 | 0.1% |
| Panamanian | 60 | 0.8% |
| Peruvian | 207 | 2.8% |
| Polish | 6 | 0.1% |
| Puerto Rican | 8 | 0.1% |
| Salvadoran | 2,170 | 28.9% |
| Scotch-Irish | 7 | 0.1% |
| Sierra Leonean | 133 | 1.8% |
| South African | 206 | 2.7% |
| South American | 250 | 3.3% |
| Sri Lankan | 35 | 0.5% |
| Subsaharan African | 704 | 9.4% |
| Swedish | 11 | 0.2% |
| Trinidadian and Tobagonian | 7 | 0.1% |
| U.S. Virgin Islander | 8 | 0.1% |
| Uruguayan | 17 | 0.2% | View All 45 Rows |
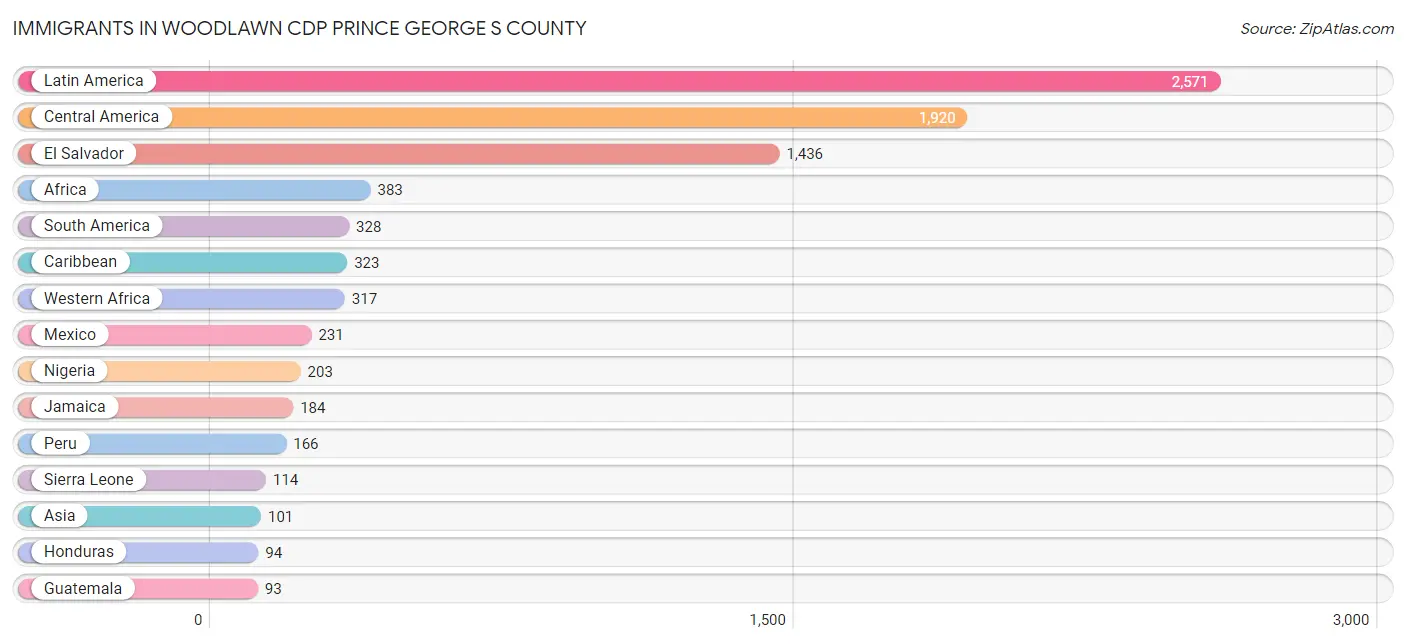
Immigrants in Woodlawn CDP Prince George s County
The most numerous immigrant groups reported in Woodlawn CDP Prince George s County came from Latin America (2,571 | 34.2%), Central America (1,920 | 25.6%), El Salvador (1,436 | 19.1%), Africa (383 | 5.1%), and South America (328 | 4.4%), together accounting for 88.3% of all Woodlawn CDP Prince George s County residents.
| Immigration Origin | # Population | % Population |
| Africa | 383 | 5.1% |
| Argentina | 26 | 0.4% |
| Asia | 101 | 1.3% |
| Bolivia | 27 | 0.4% |
| Caribbean | 323 | 4.3% |
| Central America | 1,920 | 25.6% |
| Colombia | 6 | 0.1% |
| Eastern Asia | 11 | 0.2% |
| El Salvador | 1,436 | 19.1% |
| England | 27 | 0.4% |
| Europe | 27 | 0.4% |
| Grenada | 34 | 0.4% |
| Guatemala | 93 | 1.2% |
| Guyana | 72 | 1.0% |
| Haiti | 74 | 1.0% |
| Honduras | 94 | 1.3% |
| India | 14 | 0.2% |
| Jamaica | 184 | 2.5% |
| Korea | 11 | 0.2% |
| Latin America | 2,571 | 34.2% |
| Mexico | 231 | 3.1% |
| Nicaragua | 66 | 0.9% |
| Nigeria | 203 | 2.7% |
| Northern Europe | 27 | 0.4% |
| Peru | 166 | 2.2% |
| Philippines | 41 | 0.5% |
| Sierra Leone | 114 | 1.5% |
| South Africa | 66 | 0.9% |
| South America | 328 | 4.4% |
| South Central Asia | 14 | 0.2% |
| South Eastern Asia | 76 | 1.0% |
| Trinidad and Tobago | 31 | 0.4% |
| Uruguay | 31 | 0.4% |
| Vietnam | 35 | 0.5% |
| Western Africa | 317 | 4.2% | View All 35 Rows |
Sex and Age in Woodlawn CDP Prince George s County
Sex and Age in Woodlawn CDP Prince George s County
The most populous age groups in Woodlawn CDP Prince George s County are Under 5 Years (552 | 14.6%) for men and 50 to 54 Years (430 | 11.5%) for women.
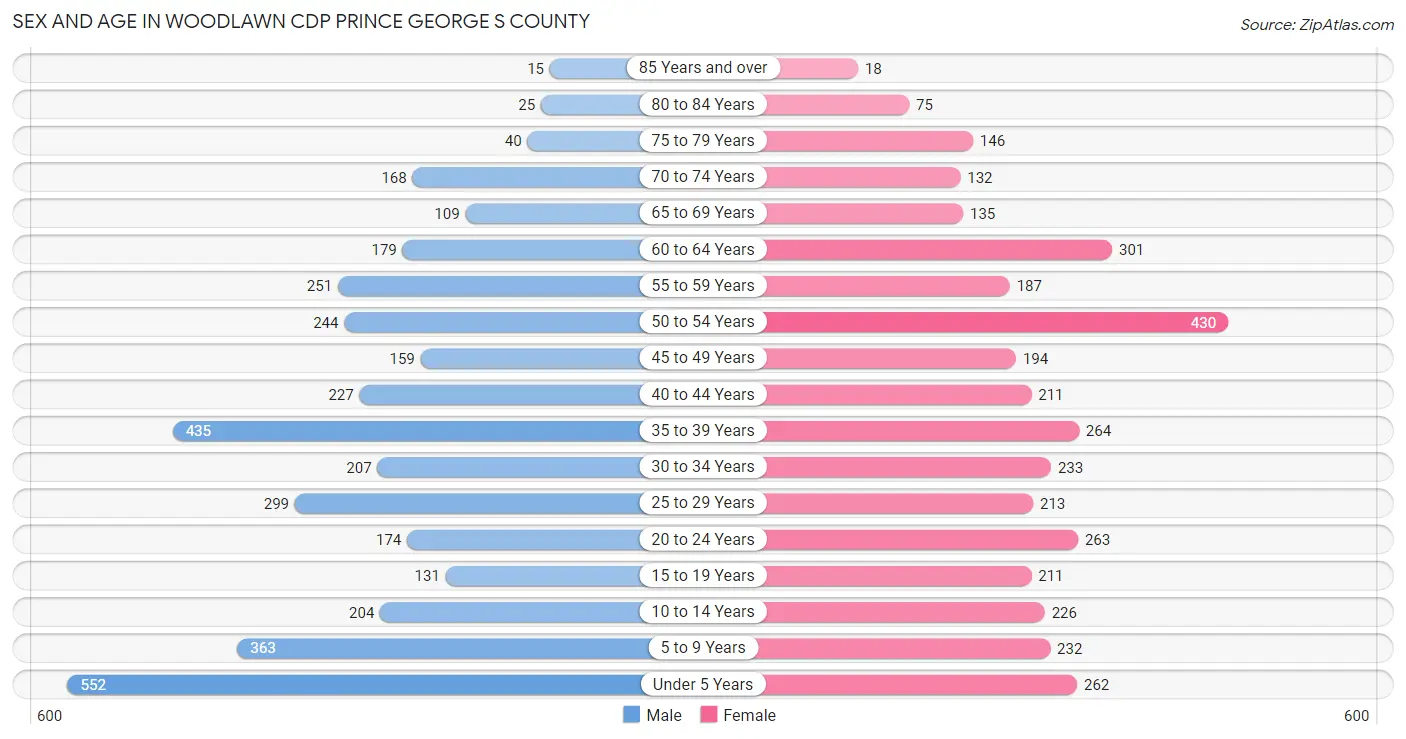
| Age Bracket | Male | Female |
| Under 5 Years | 552 (14.6%) | 262 (7.0%) |
| 5 to 9 Years | 363 (9.6%) | 232 (6.2%) |
| 10 to 14 Years | 204 (5.4%) | 226 (6.0%) |
| 15 to 19 Years | 131 (3.5%) | 211 (5.7%) |
| 20 to 24 Years | 174 (4.6%) | 263 (7.0%) |
| 25 to 29 Years | 299 (7.9%) | 213 (5.7%) |
| 30 to 34 Years | 207 (5.5%) | 233 (6.2%) |
| 35 to 39 Years | 435 (11.5%) | 264 (7.1%) |
| 40 to 44 Years | 227 (6.0%) | 211 (5.7%) |
| 45 to 49 Years | 159 (4.2%) | 194 (5.2%) |
| 50 to 54 Years | 244 (6.5%) | 430 (11.5%) |
| 55 to 59 Years | 251 (6.6%) | 187 (5.0%) |
| 60 to 64 Years | 179 (4.7%) | 301 (8.1%) |
| 65 to 69 Years | 109 (2.9%) | 135 (3.6%) |
| 70 to 74 Years | 168 (4.4%) | 132 (3.5%) |
| 75 to 79 Years | 40 (1.1%) | 146 (3.9%) |
| 80 to 84 Years | 25 (0.7%) | 75 (2.0%) |
| 85 Years and over | 15 (0.4%) | 18 (0.5%) |
| Total | 3,782 (100.0%) | 3,733 (100.0%) |
Families and Households in Woodlawn CDP Prince George s County
Median Family Size in Woodlawn CDP Prince George s County
The median family size in Woodlawn CDP Prince George s County is 4.44 persons per family, with married-couple families (892 | 59.5%) accounting for the largest median family size of 4.79 persons per family. On the other hand, single male/father families (137 | 9.1%) represent the smallest median family size with 2.96 persons per family.
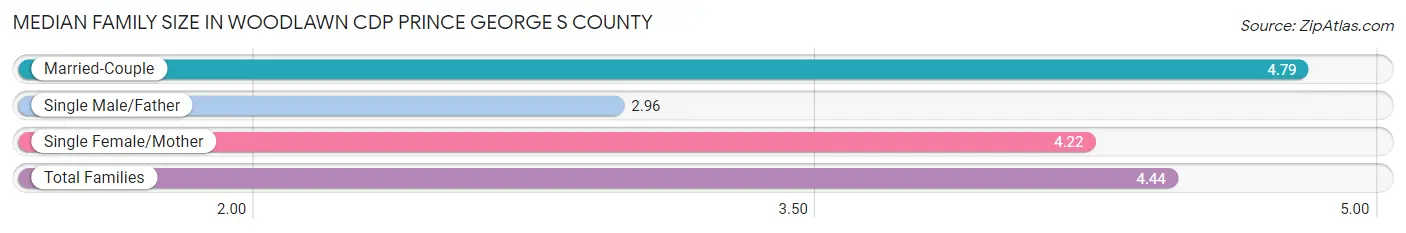
| Family Type | # Families | Family Size |
| Married-Couple | 892 (59.5%) | 4.79 |
| Single Male/Father | 137 (9.1%) | 2.96 |
| Single Female/Mother | 471 (31.4%) | 4.22 |
| Total Families | 1,500 (100.0%) | 4.44 |
Median Household Size in Woodlawn CDP Prince George s County
The median household size in Woodlawn CDP Prince George s County is 3.68 persons per household, with married-couple households (892 | 43.8%) accounting for the largest median household size of 4.91 persons per household. non-family households (538 | 26.4%) represent the smallest median household size with 1.21 persons per household.
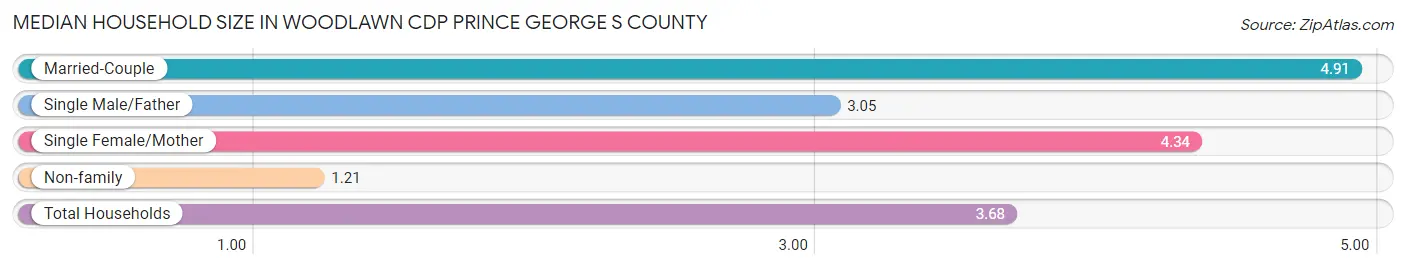
| Household Type | # Households | Household Size |
| Married-Couple | 892 (43.8%) | 4.91 |
| Single Male/Father | 137 (6.7%) | 3.05 |
| Single Female/Mother | 471 (23.1%) | 4.34 |
| Non-family | 538 (26.4%) | 1.21 |
| Total Households | 2,038 (100.0%) | 3.68 |
Household Size by Marriage Status in Woodlawn CDP Prince George s County
Out of a total of 2,038 households in Woodlawn CDP Prince George s County, 1,500 (73.6%) are family households, while 538 (26.4%) are nonfamily households. The most numerous type of family households are 4-person households, comprising 413, and the most common type of nonfamily households are 1-person households, comprising 439.
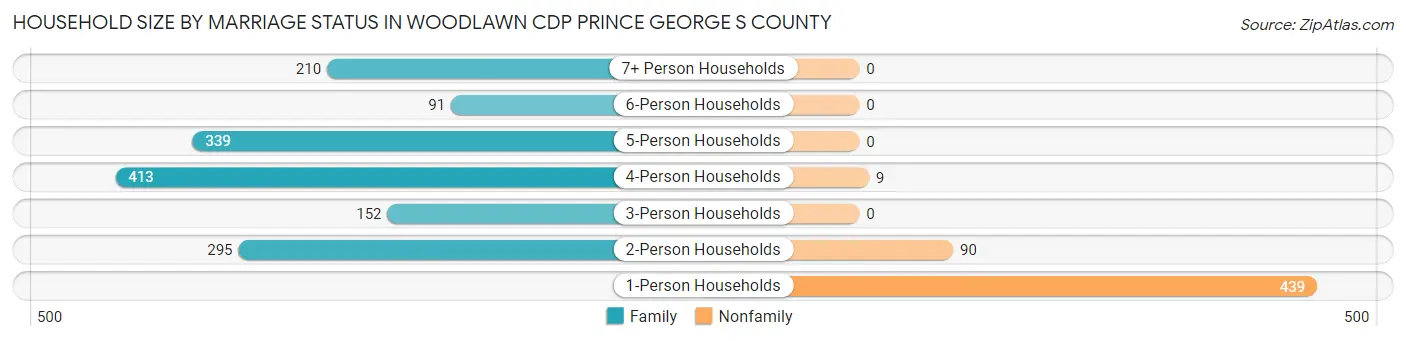
| Household Size | Family Households | Nonfamily Households |
| 1-Person Households | - | 439 (21.5%) |
| 2-Person Households | 295 (14.5%) | 90 (4.4%) |
| 3-Person Households | 152 (7.5%) | 0 (0.0%) |
| 4-Person Households | 413 (20.3%) | 9 (0.4%) |
| 5-Person Households | 339 (16.6%) | 0 (0.0%) |
| 6-Person Households | 91 (4.5%) | 0 (0.0%) |
| 7+ Person Households | 210 (10.3%) | 0 (0.0%) |
| Total | 1,500 (73.6%) | 538 (26.4%) |
Female Fertility in Woodlawn CDP Prince George s County
Fertility by Age in Woodlawn CDP Prince George s County
Average fertility rate in Woodlawn CDP Prince George s County is 104.0 births per 1,000 women. Women in the age bracket of 20 to 34 years have the highest fertility rate with 190.0 births per 1,000 women. Women in the age bracket of 20 to 34 years acount for 77.1% of all women with births.
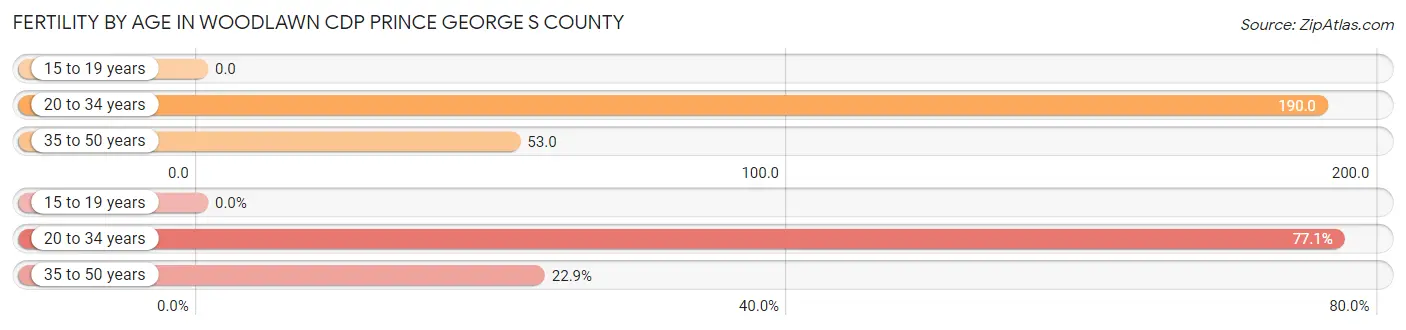
| Age Bracket | Women with Births | Births / 1,000 Women |
| 15 to 19 years | 0 (0.0%) | 0.0 |
| 20 to 34 years | 135 (77.1%) | 190.0 |
| 35 to 50 years | 40 (22.9%) | 53.0 |
| Total | 175 (100.0%) | 104.0 |
Fertility by Age by Marriage Status in Woodlawn CDP Prince George s County
36.0% of women with births (175) in Woodlawn CDP Prince George s County are married. The highest percentage of unmarried women with births falls into 20 to 34 years age bracket with 75.6% of them unmarried at the time of birth, while the lowest percentage of unmarried women with births belong to 35 to 50 years age bracket with 25.0% of them unmarried.
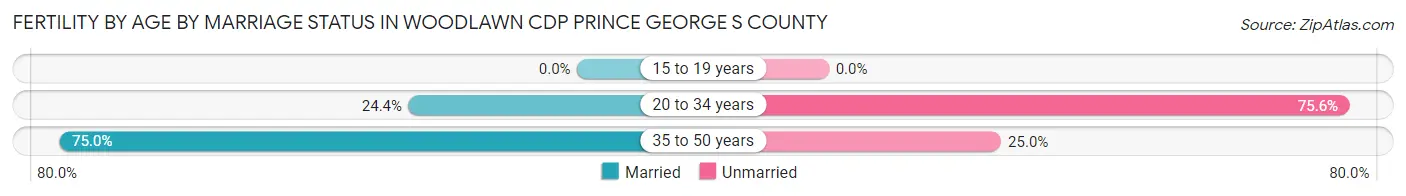
| Age Bracket | Married | Unmarried |
| 15 to 19 years | 0 (0.0%) | 0 (0.0%) |
| 20 to 34 years | 33 (24.4%) | 102 (75.6%) |
| 35 to 50 years | 30 (75.0%) | 10 (25.0%) |
| Total | 63 (36.0%) | 112 (64.0%) |
Fertility by Education in Woodlawn CDP Prince George s County
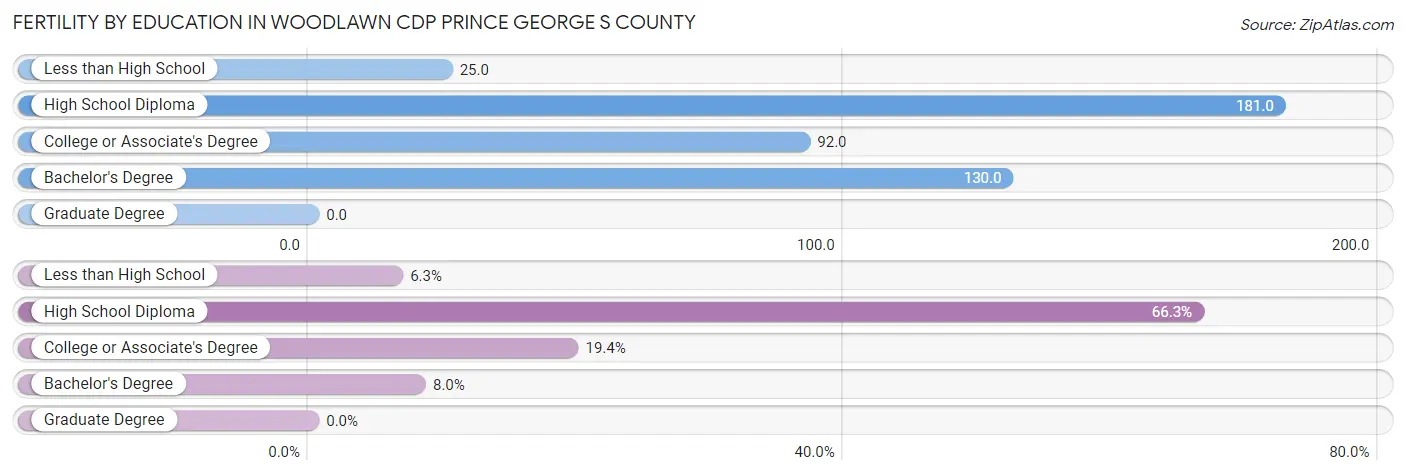
| Educational Attainment | Women with Births | Births / 1,000 Women |
| Less than High School | 11 (6.3%) | 25.0 |
| High School Diploma | 116 (66.3%) | 181.0 |
| College or Associate's Degree | 34 (19.4%) | 92.0 |
| Bachelor's Degree | 14 (8.0%) | 130.0 |
| Graduate Degree | 0 (0.0%) | 0.0 |
| Total | 175 (100.0%) | 104.0 |
Fertility by Education by Marriage Status in Woodlawn CDP Prince George s County
64.0% of women with births in Woodlawn CDP Prince George s County are unmarried. Women with the educational attainment of less than high school are most likely to be married with 100.0% of them married at childbirth, while women with the educational attainment of college or associate's degree are least likely to be married with 100.0% of them unmarried at childbirth.
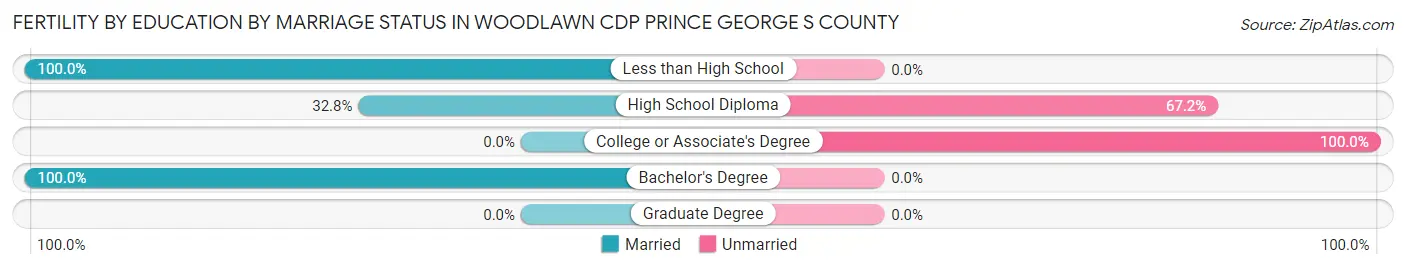
| Educational Attainment | Married | Unmarried |
| Less than High School | 11 (100.0%) | 0 (0.0%) |
| High School Diploma | 38 (32.8%) | 78 (67.2%) |
| College or Associate's Degree | 0 (0.0%) | 34 (100.0%) |
| Bachelor's Degree | 14 (100.0%) | 0 (0.0%) |
| Graduate Degree | 0 (0.0%) | 0 (0.0%) |
| Total | 63 (36.0%) | 112 (64.0%) |
Employment Characteristics in Woodlawn CDP Prince George s County
Employment by Class of Employer in Woodlawn CDP Prince George s County
Among the 3,481 employed individuals in Woodlawn CDP Prince George s County, private company employees (2,344 | 67.3%), self-employed (not incorporated) (297 | 8.5%), and federal government employees (272 | 7.8%) make up the most common classes of employment.
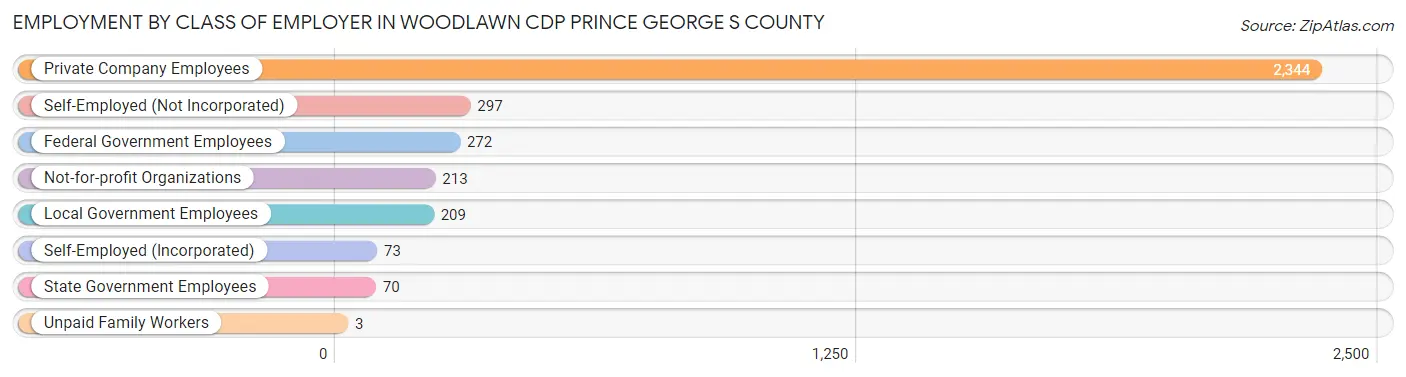
| Employer Class | # Employees | % Employees |
| Private Company Employees | 2,344 | 67.3% |
| Self-Employed (Incorporated) | 73 | 2.1% |
| Self-Employed (Not Incorporated) | 297 | 8.5% |
| Not-for-profit Organizations | 213 | 6.1% |
| Local Government Employees | 209 | 6.0% |
| State Government Employees | 70 | 2.0% |
| Federal Government Employees | 272 | 7.8% |
| Unpaid Family Workers | 3 | 0.1% |
| Total | 3,481 | 100.0% |
Employment Status by Age in Woodlawn CDP Prince George s County
According to the labor force statistics for Woodlawn CDP Prince George s County, out of the total population over 16 years of age (5,584), 71.6% or 3,998 individuals are in the labor force, with 12.4% or 496 of them unemployed. The age group with the highest labor force participation rate is 55 to 59 years, with 93.2% or 408 individuals in the labor force. Within the labor force, the 16 to 19 years age range has the highest percentage of unemployed individuals, with 38.7% or 24 of them being unemployed.
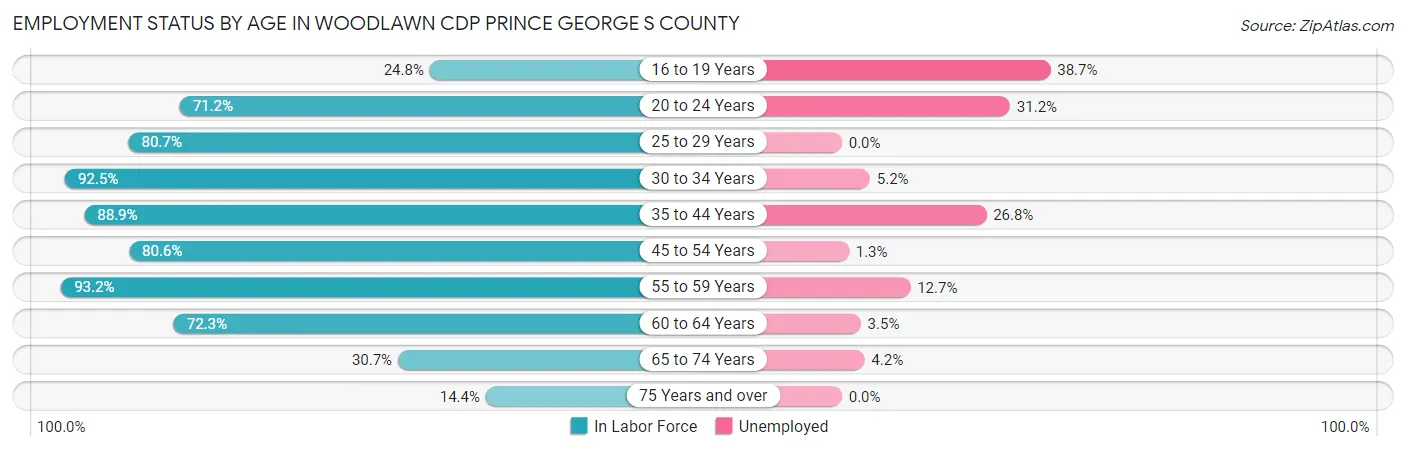
| Age Bracket | In Labor Force | Unemployed |
| 16 to 19 Years | 62 (24.8%) | 24 (38.7%) |
| 20 to 24 Years | 311 (71.2%) | 97 (31.2%) |
| 25 to 29 Years | 413 (80.7%) | 0 (0.0%) |
| 30 to 34 Years | 407 (92.5%) | 21 (5.2%) |
| 35 to 44 Years | 1,011 (88.9%) | 271 (26.8%) |
| 45 to 54 Years | 828 (80.6%) | 11 (1.3%) |
| 55 to 59 Years | 408 (93.2%) | 52 (12.7%) |
| 60 to 64 Years | 347 (72.3%) | 12 (3.5%) |
| 65 to 74 Years | 167 (30.7%) | 7 (4.2%) |
| 75 Years and over | 46 (14.4%) | 0 (0.0%) |
| Total | 3,998 (71.6%) | 496 (12.4%) |
Employment Status by Educational Attainment in Woodlawn CDP Prince George s County
According to labor force statistics for Woodlawn CDP Prince George s County, 84.6% of individuals (3,413) out of the total population between 25 and 64 years of age (4,034) are in the labor force, with 10.7% or 365 of them being unemployed. The group with the highest labor force participation rate are those with the educational attainment of college / associate degree, with 89.2% or 720 individuals in the labor force. Within the labor force, individuals with college / associate degree education have the highest percentage of unemployment, with 25.3% or 182 of them being unemployed.
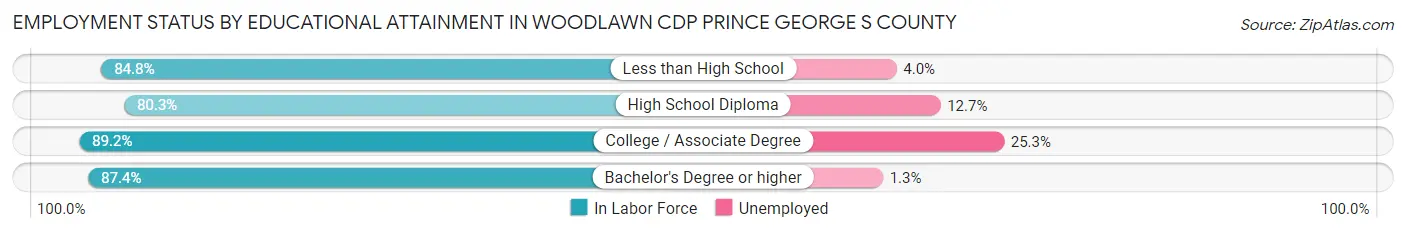
| Educational Attainment | In Labor Force | Unemployed |
| Less than High School | 1,018 (84.8%) | 48 (4.0%) |
| High School Diploma | 1,068 (80.3%) | 169 (12.7%) |
| College / Associate Degree | 720 (89.2%) | 204 (25.3%) |
| Bachelor's Degree or higher | 609 (87.4%) | 9 (1.3%) |
| Total | 3,413 (84.6%) | 432 (10.7%) |
Employment Occupations by Sex in Woodlawn CDP Prince George s County
Management, Business, Science and Arts Occupations
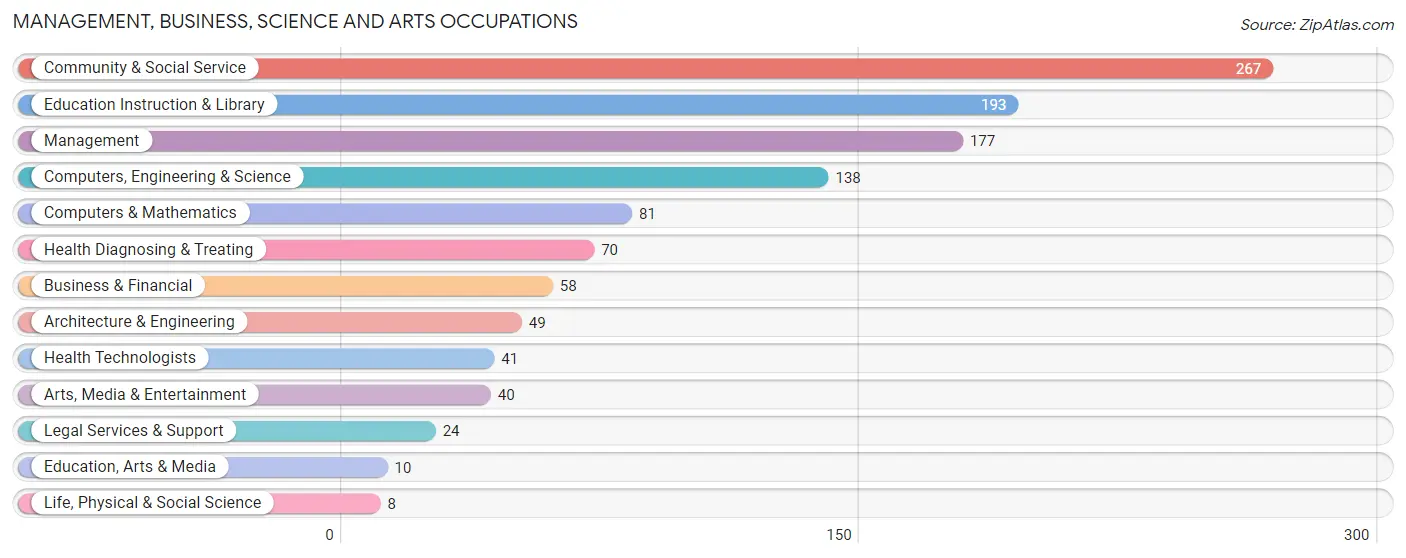
The most common Management, Business, Science and Arts occupations in Woodlawn CDP Prince George s County are Community & Social Service (267 | 7.6%), Education Instruction & Library (193 | 5.5%), Management (177 | 5.1%), Computers, Engineering & Science (138 | 3.9%), and Computers & Mathematics (81 | 2.3%).
Management, Business, Science and Arts Occupations by Sex
Within the Management, Business, Science and Arts occupations in Woodlawn CDP Prince George s County, the most male-oriented occupations are Architecture & Engineering (89.8%), Arts, Media & Entertainment (77.5%), and Computers, Engineering & Science (65.2%), while the most female-oriented occupations are Life, Physical & Social Science (100.0%), Education, Arts & Media (100.0%), and Health Technologists (100.0%).
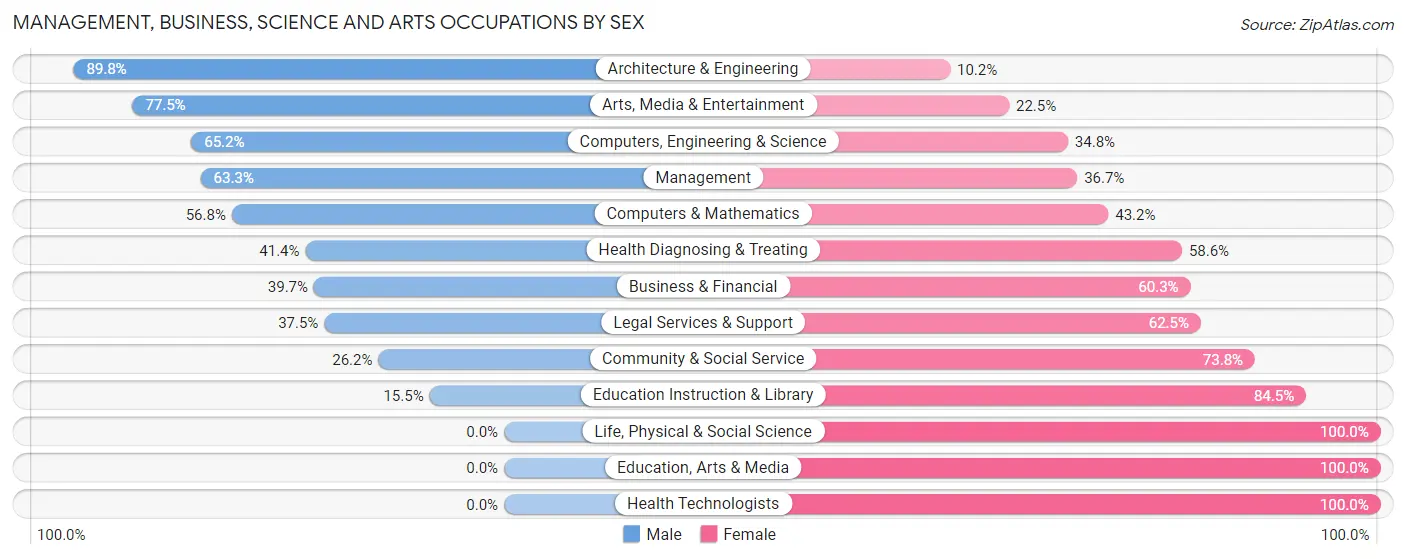
| Occupation | Male | Female |
| Management | 112 (63.3%) | 65 (36.7%) |
| Business & Financial | 23 (39.7%) | 35 (60.3%) |
| Computers, Engineering & Science | 90 (65.2%) | 48 (34.8%) |
| Computers & Mathematics | 46 (56.8%) | 35 (43.2%) |
| Architecture & Engineering | 44 (89.8%) | 5 (10.2%) |
| Life, Physical & Social Science | 0 (0.0%) | 8 (100.0%) |
| Community & Social Service | 70 (26.2%) | 197 (73.8%) |
| Education, Arts & Media | 0 (0.0%) | 10 (100.0%) |
| Legal Services & Support | 9 (37.5%) | 15 (62.5%) |
| Education Instruction & Library | 30 (15.5%) | 163 (84.5%) |
| Arts, Media & Entertainment | 31 (77.5%) | 9 (22.5%) |
| Health Diagnosing & Treating | 29 (41.4%) | 41 (58.6%) |
| Health Technologists | 0 (0.0%) | 41 (100.0%) |
| Total (Category) | 324 (45.6%) | 386 (54.4%) |
| Total (Overall) | 1,904 (54.3%) | 1,601 (45.7%) |
Services Occupations
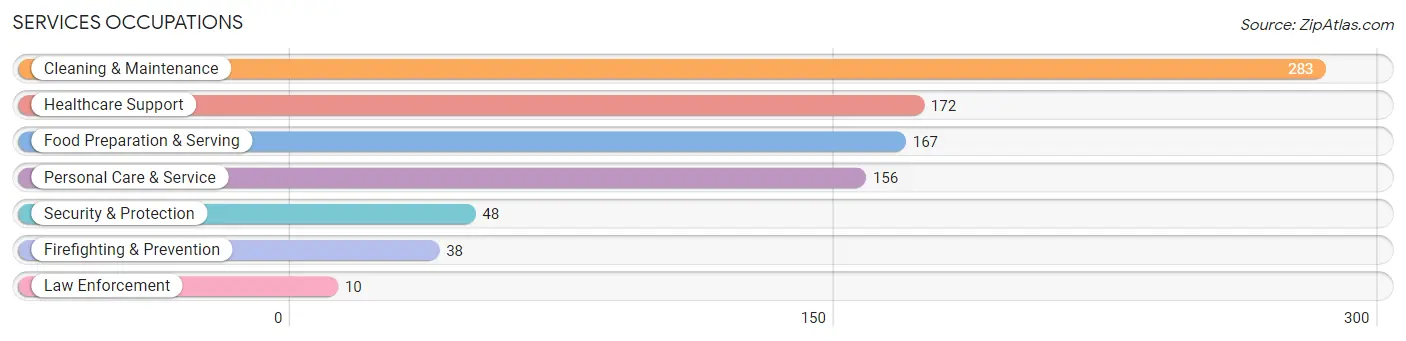
The most common Services occupations in Woodlawn CDP Prince George s County are Cleaning & Maintenance (283 | 8.1%), Healthcare Support (172 | 4.9%), Food Preparation & Serving (167 | 4.8%), Personal Care & Service (156 | 4.4%), and Security & Protection (48 | 1.4%).
Services Occupations by Sex
Within the Services occupations in Woodlawn CDP Prince George s County, the most male-oriented occupations are Law Enforcement (100.0%), Security & Protection (81.2%), and Firefighting & Prevention (76.3%), while the most female-oriented occupations are Healthcare Support (94.2%), Personal Care & Service (92.9%), and Food Preparation & Serving (73.7%).
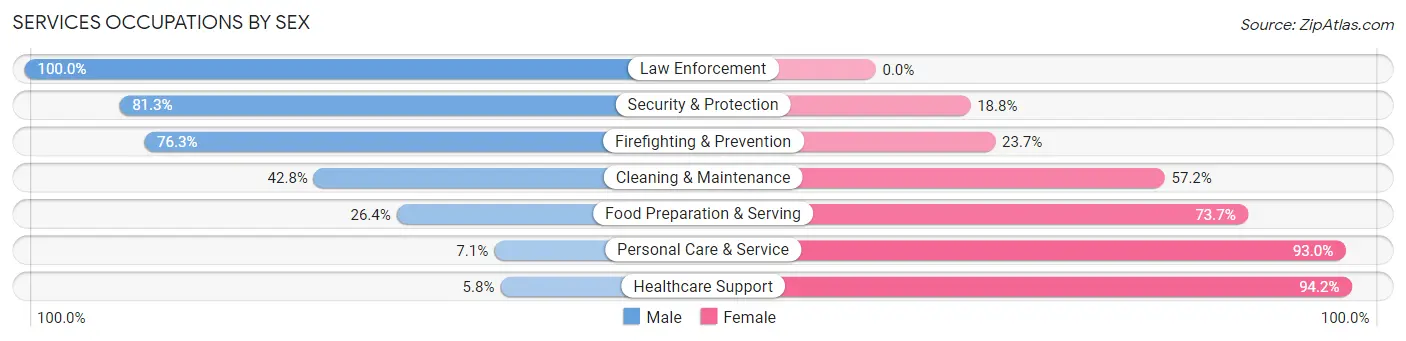
| Occupation | Male | Female |
| Healthcare Support | 10 (5.8%) | 162 (94.2%) |
| Security & Protection | 39 (81.2%) | 9 (18.8%) |
| Firefighting & Prevention | 29 (76.3%) | 9 (23.7%) |
| Law Enforcement | 10 (100.0%) | 0 (0.0%) |
| Food Preparation & Serving | 44 (26.4%) | 123 (73.7%) |
| Cleaning & Maintenance | 121 (42.8%) | 162 (57.2%) |
| Personal Care & Service | 11 (7.0%) | 145 (92.9%) |
| Total (Category) | 225 (27.2%) | 601 (72.8%) |
| Total (Overall) | 1,904 (54.3%) | 1,601 (45.7%) |
Sales and Office Occupations
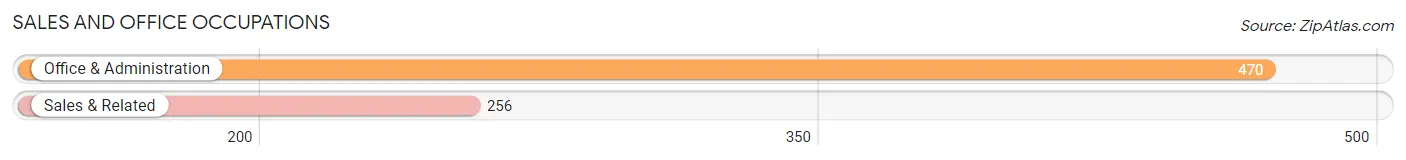
The most common Sales and Office occupations in Woodlawn CDP Prince George s County are Office & Administration (470 | 13.4%), and Sales & Related (256 | 7.3%).
Sales and Office Occupations by Sex
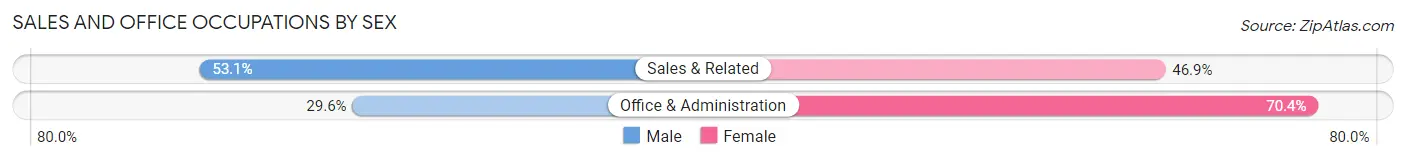
| Occupation | Male | Female |
| Sales & Related | 136 (53.1%) | 120 (46.9%) |
| Office & Administration | 139 (29.6%) | 331 (70.4%) |
| Total (Category) | 275 (37.9%) | 451 (62.1%) |
| Total (Overall) | 1,904 (54.3%) | 1,601 (45.7%) |
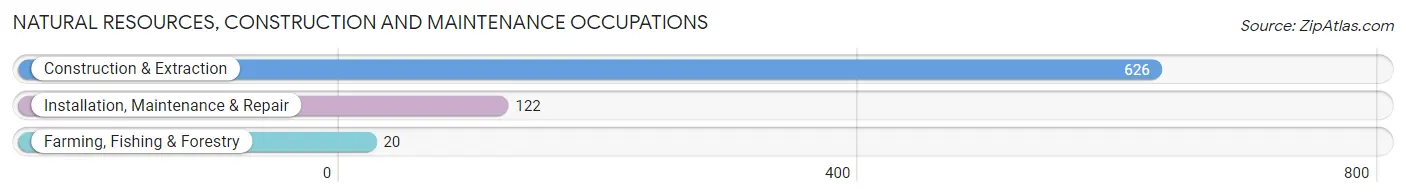
Natural Resources, Construction and Maintenance Occupations
The most common Natural Resources, Construction and Maintenance occupations in Woodlawn CDP Prince George s County are Construction & Extraction (626 | 17.9%), Installation, Maintenance & Repair (122 | 3.5%), and Farming, Fishing & Forestry (20 | 0.6%).
Natural Resources, Construction and Maintenance Occupations by Sex
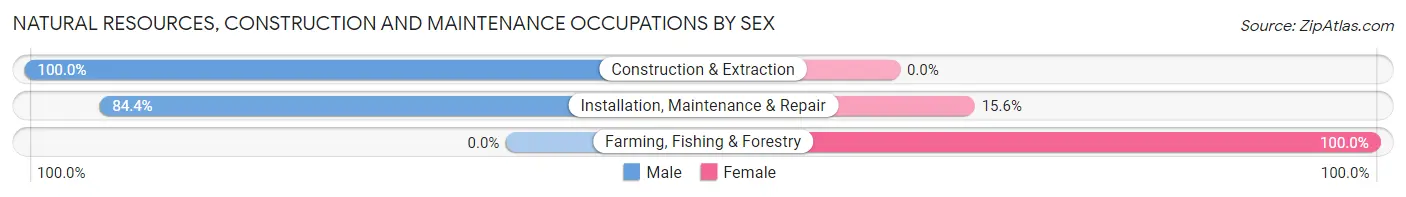
| Occupation | Male | Female |
| Farming, Fishing & Forestry | 0 (0.0%) | 20 (100.0%) |
| Construction & Extraction | 626 (100.0%) | 0 (0.0%) |
| Installation, Maintenance & Repair | 103 (84.4%) | 19 (15.6%) |
| Total (Category) | 729 (94.9%) | 39 (5.1%) |
| Total (Overall) | 1,904 (54.3%) | 1,601 (45.7%) |
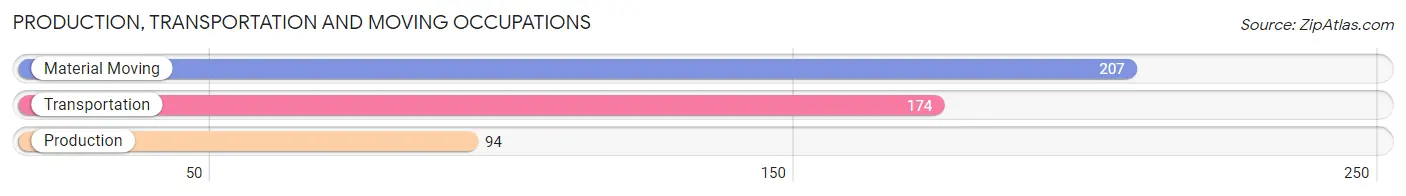
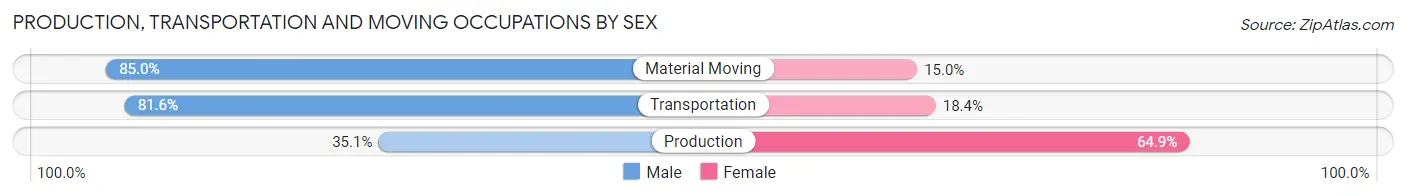
Production, Transportation and Moving Occupations
The most common Production, Transportation and Moving occupations in Woodlawn CDP Prince George s County are Material Moving (207 | 5.9%), Transportation (174 | 5.0%), and Production (94 | 2.7%).
Production, Transportation and Moving Occupations by Sex
| Occupation | Male | Female |
| Production | 33 (35.1%) | 61 (64.9%) |
| Transportation | 142 (81.6%) | 32 (18.4%) |
| Material Moving | 176 (85.0%) | 31 (15.0%) |
| Total (Category) | 351 (73.9%) | 124 (26.1%) |
| Total (Overall) | 1,904 (54.3%) | 1,601 (45.7%) |
Employment Industries by Sex in Woodlawn CDP Prince George s County
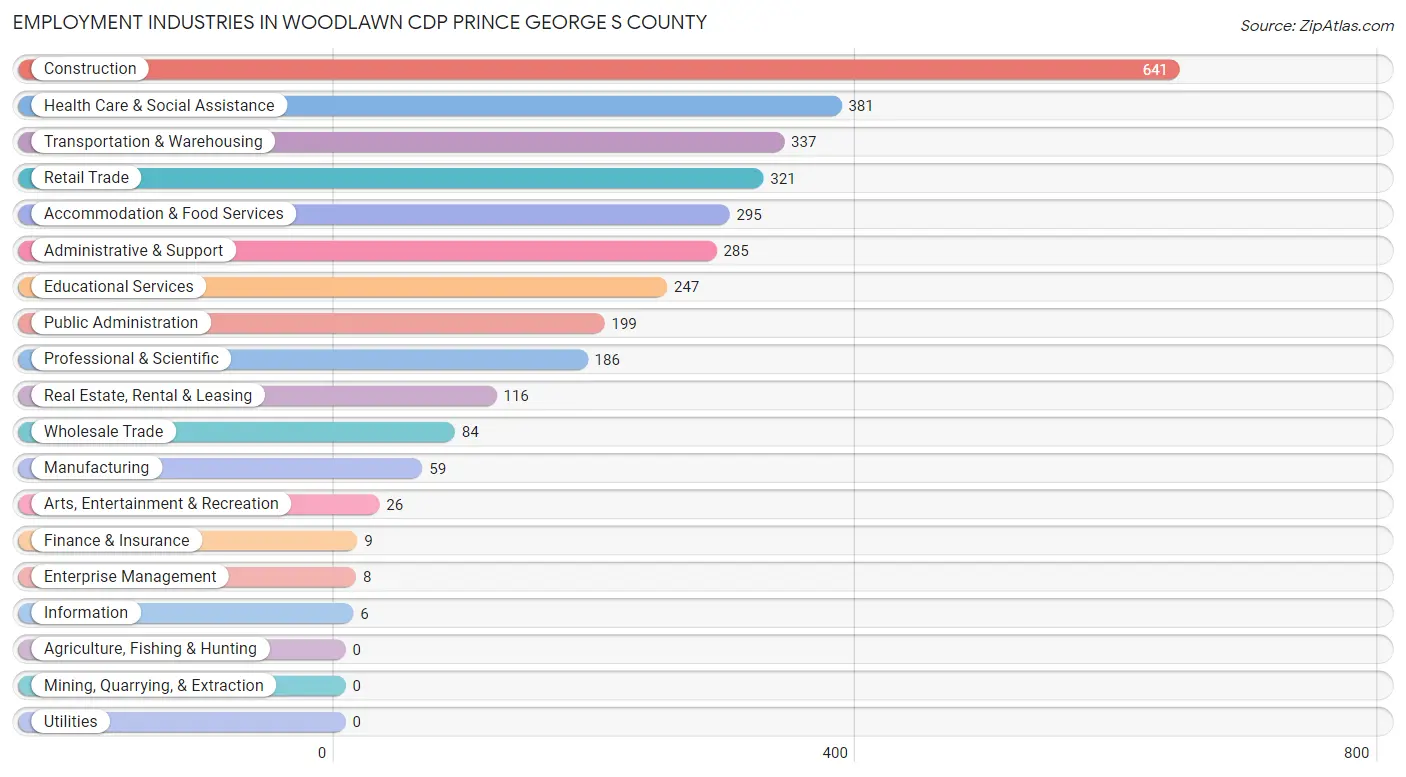
Employment Industries in Woodlawn CDP Prince George s County
The major employment industries in Woodlawn CDP Prince George s County include Construction (641 | 18.3%), Health Care & Social Assistance (381 | 10.9%), Transportation & Warehousing (337 | 9.6%), Retail Trade (321 | 9.2%), and Accommodation & Food Services (295 | 8.4%).
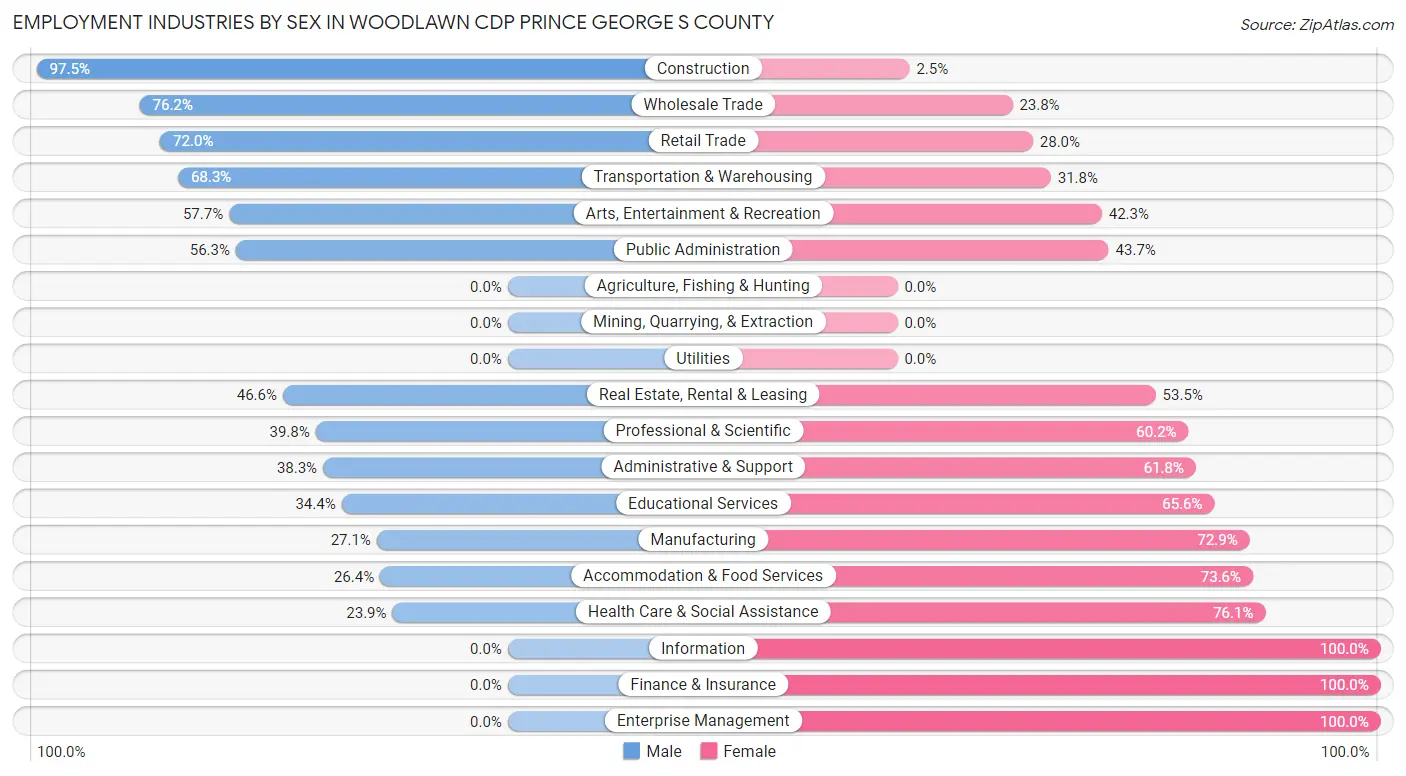
Employment Industries by Sex in Woodlawn CDP Prince George s County
The Woodlawn CDP Prince George s County industries that see more men than women are Construction (97.5%), Wholesale Trade (76.2%), and Retail Trade (72.0%), whereas the industries that tend to have a higher number of women are Information (100.0%), Finance & Insurance (100.0%), and Enterprise Management (100.0%).
| Industry | Male | Female |
| Agriculture, Fishing & Hunting | 0 (0.0%) | 0 (0.0%) |
| Mining, Quarrying, & Extraction | 0 (0.0%) | 0 (0.0%) |
| Construction | 625 (97.5%) | 16 (2.5%) |
| Manufacturing | 16 (27.1%) | 43 (72.9%) |
| Wholesale Trade | 64 (76.2%) | 20 (23.8%) |
| Retail Trade | 231 (72.0%) | 90 (28.0%) |
| Transportation & Warehousing | 230 (68.2%) | 107 (31.8%) |
| Utilities | 0 (0.0%) | 0 (0.0%) |
| Information | 0 (0.0%) | 6 (100.0%) |
| Finance & Insurance | 0 (0.0%) | 9 (100.0%) |
| Real Estate, Rental & Leasing | 54 (46.6%) | 62 (53.4%) |
| Professional & Scientific | 74 (39.8%) | 112 (60.2%) |
| Enterprise Management | 0 (0.0%) | 8 (100.0%) |
| Administrative & Support | 109 (38.3%) | 176 (61.8%) |
| Educational Services | 85 (34.4%) | 162 (65.6%) |
| Health Care & Social Assistance | 91 (23.9%) | 290 (76.1%) |
| Arts, Entertainment & Recreation | 15 (57.7%) | 11 (42.3%) |
| Accommodation & Food Services | 78 (26.4%) | 217 (73.6%) |
| Public Administration | 112 (56.3%) | 87 (43.7%) |
| Total | 1,904 (54.3%) | 1,601 (45.7%) |
Education in Woodlawn CDP Prince George s County
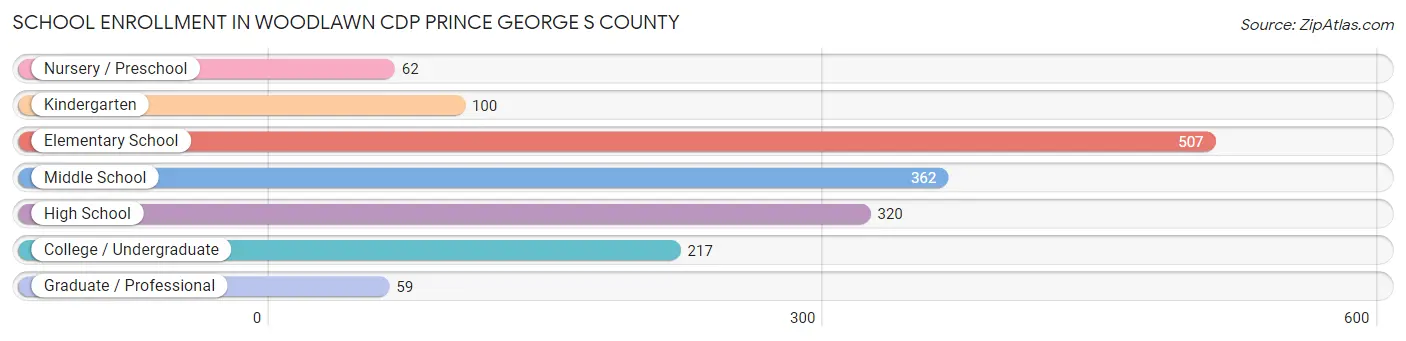
School Enrollment in Woodlawn CDP Prince George s County
The most common levels of schooling among the 1,627 students in Woodlawn CDP Prince George s County are elementary school (507 | 31.2%), middle school (362 | 22.3%), and high school (320 | 19.7%).
| School Level | # Students | % Students |
| Nursery / Preschool | 62 | 3.8% |
| Kindergarten | 100 | 6.1% |
| Elementary School | 507 | 31.2% |
| Middle School | 362 | 22.3% |
| High School | 320 | 19.7% |
| College / Undergraduate | 217 | 13.3% |
| Graduate / Professional | 59 | 3.6% |
| Total | 1,627 | 100.0% |
School Enrollment by Age by Funding Source in Woodlawn CDP Prince George s County
Out of a total of 1,627 students who are enrolled in schools in Woodlawn CDP Prince George s County, 179 (11.0%) attend a private institution, while the remaining 1,448 (89.0%) are enrolled in public schools. The age group of 20 to 24 year olds has the highest likelihood of being enrolled in private schools, with 21 (28.0% in the age bracket) enrolled. Conversely, the age group of 3 to 4 year olds has the lowest likelihood of being enrolled in a private school, with 40 (100.0% in the age bracket) attending a public institution.
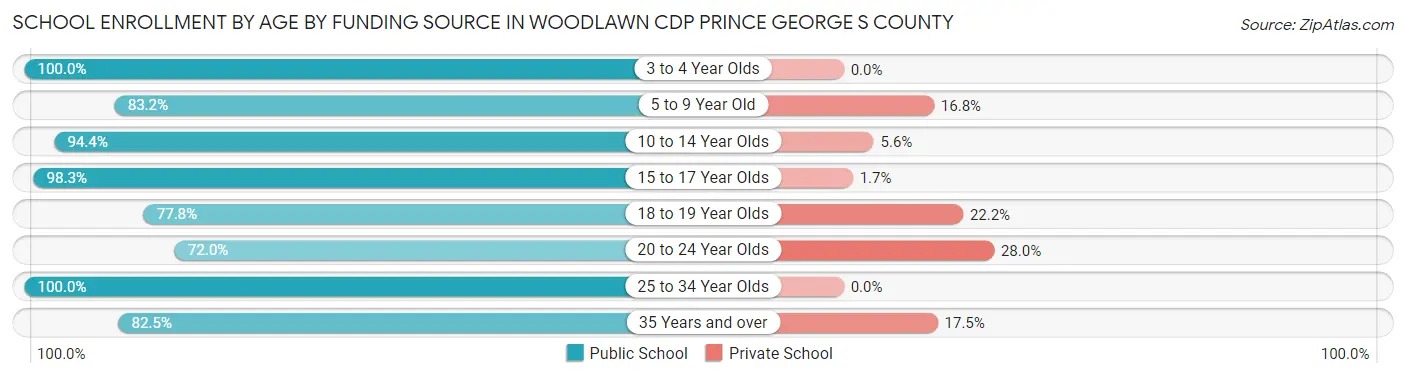
| Age Bracket | Public School | Private School |
| 3 to 4 Year Olds | 40 (100.0%) | 0 (0.0%) |
| 5 to 9 Year Old | 495 (83.2%) | 100 (16.8%) |
| 10 to 14 Year Olds | 406 (94.4%) | 24 (5.6%) |
| 15 to 17 Year Olds | 232 (98.3%) | 4 (1.7%) |
| 18 to 19 Year Olds | 56 (77.8%) | 16 (22.2%) |
| 20 to 24 Year Olds | 54 (72.0%) | 21 (28.0%) |
| 25 to 34 Year Olds | 99 (100.0%) | 0 (0.0%) |
| 35 Years and over | 66 (82.5%) | 14 (17.5%) |
| Total | 1,448 (89.0%) | 179 (11.0%) |
Educational Attainment by Field of Study in Woodlawn CDP Prince George s County
Business (236 | 28.6%), education (96 | 11.6%), science & technology (88 | 10.6%), arts & humanities (83 | 10.1%), and social sciences (78 | 9.4%) are the most common fields of study among 826 individuals in Woodlawn CDP Prince George s County who have obtained a bachelor's degree or higher.
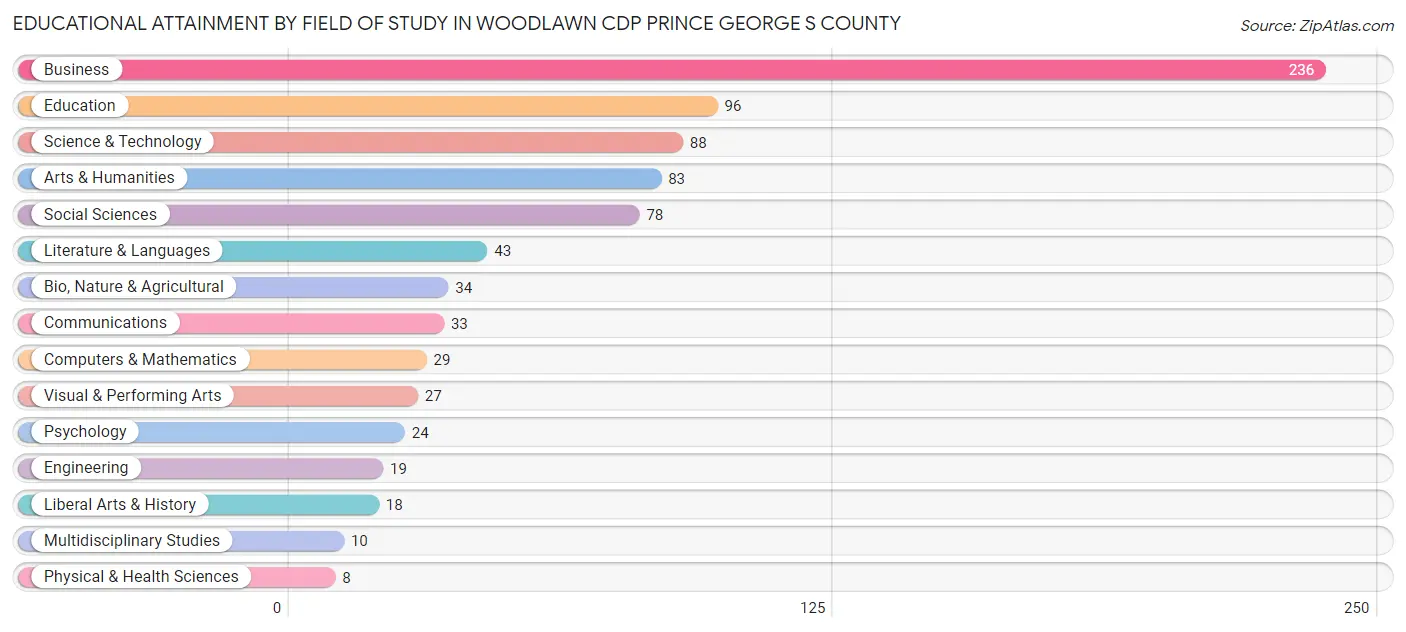
| Field of Study | # Graduates | % Graduates |
| Computers & Mathematics | 29 | 3.5% |
| Bio, Nature & Agricultural | 34 | 4.1% |
| Physical & Health Sciences | 8 | 1.0% |
| Psychology | 24 | 2.9% |
| Social Sciences | 78 | 9.4% |
| Engineering | 19 | 2.3% |
| Multidisciplinary Studies | 10 | 1.2% |
| Science & Technology | 88 | 10.6% |
| Business | 236 | 28.6% |
| Education | 96 | 11.6% |
| Literature & Languages | 43 | 5.2% |
| Liberal Arts & History | 18 | 2.2% |
| Visual & Performing Arts | 27 | 3.3% |
| Communications | 33 | 4.0% |
| Arts & Humanities | 83 | 10.1% |
| Total | 826 | 100.0% |
Transportation & Commute in Woodlawn CDP Prince George s County
Vehicle Availability by Sex in Woodlawn CDP Prince George s County
The most prevalent vehicle ownership categories in Woodlawn CDP Prince George s County are males with 2 vehicles (571, accounting for 30.1%) and females with 2 vehicles (566, making up 36.0%).
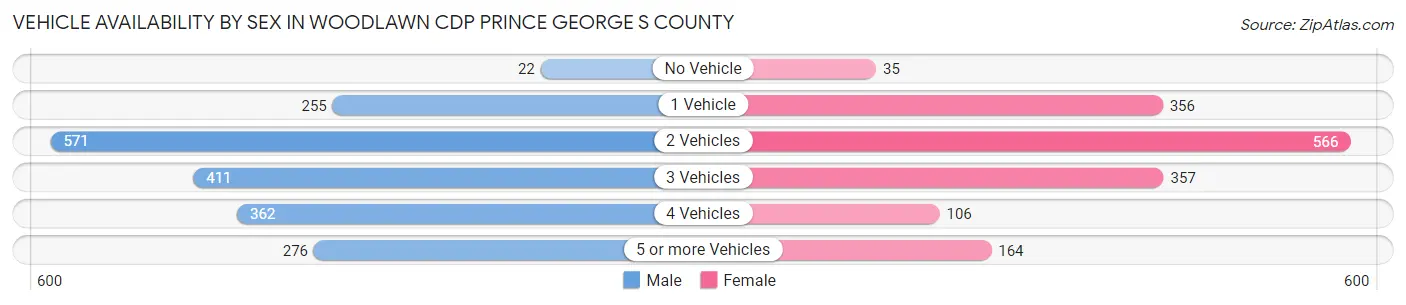
| Vehicles Available | Male | Female |
| No Vehicle | 22 (1.2%) | 35 (2.2%) |
| 1 Vehicle | 255 (13.4%) | 356 (22.5%) |
| 2 Vehicles | 571 (30.1%) | 566 (35.7%) |
| 3 Vehicles | 411 (21.7%) | 357 (22.5%) |
| 4 Vehicles | 362 (19.1%) | 106 (6.7%) |
| 5 or more Vehicles | 276 (14.5%) | 164 (10.3%) |
| Total | 1,897 (100.0%) | 1,584 (100.0%) |
Commute Time in Woodlawn CDP Prince George s County
The most frequently occuring commute durations in Woodlawn CDP Prince George s County are 30 to 34 minutes (709 commuters, 21.2%), 45 to 59 minutes (535 commuters, 16.0%), and 20 to 24 minutes (360 commuters, 10.8%).
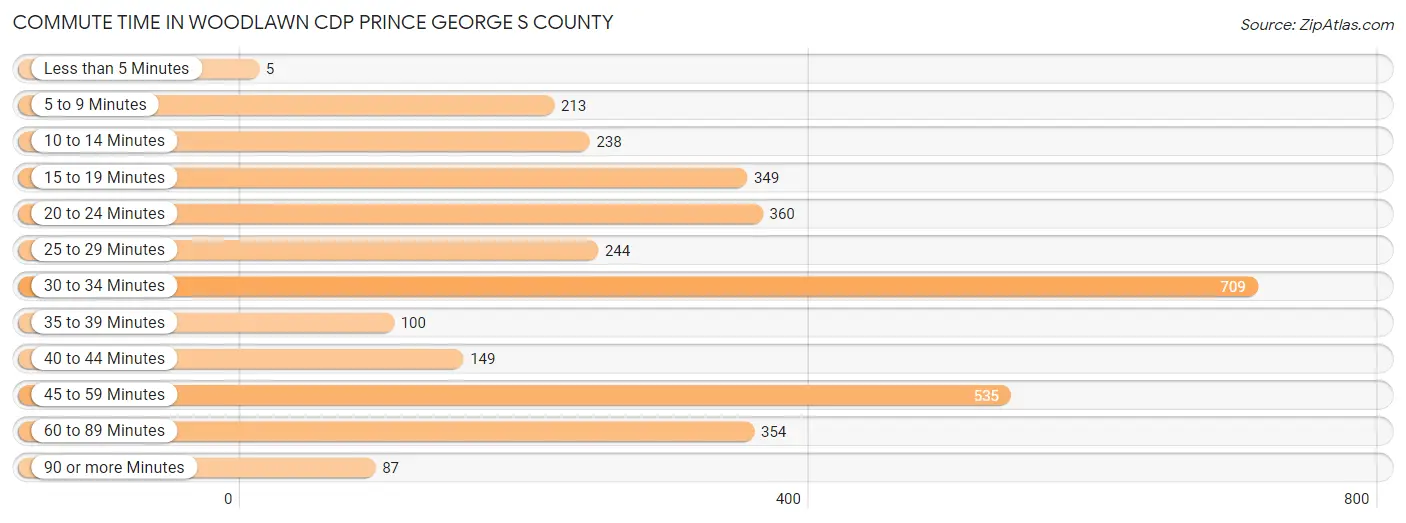
| Commute Time | # Commuters | % Commuters |
| Less than 5 Minutes | 5 | 0.2% |
| 5 to 9 Minutes | 213 | 6.4% |
| 10 to 14 Minutes | 238 | 7.1% |
| 15 to 19 Minutes | 349 | 10.4% |
| 20 to 24 Minutes | 360 | 10.8% |
| 25 to 29 Minutes | 244 | 7.3% |
| 30 to 34 Minutes | 709 | 21.2% |
| 35 to 39 Minutes | 100 | 3.0% |
| 40 to 44 Minutes | 149 | 4.5% |
| 45 to 59 Minutes | 535 | 16.0% |
| 60 to 89 Minutes | 354 | 10.6% |
| 90 or more Minutes | 87 | 2.6% |
Commute Time by Sex in Woodlawn CDP Prince George s County
The most common commute times in Woodlawn CDP Prince George s County are 45 to 59 minutes (347 commuters, 19.1%) for males and 30 to 34 minutes (493 commuters, 32.4%) for females.
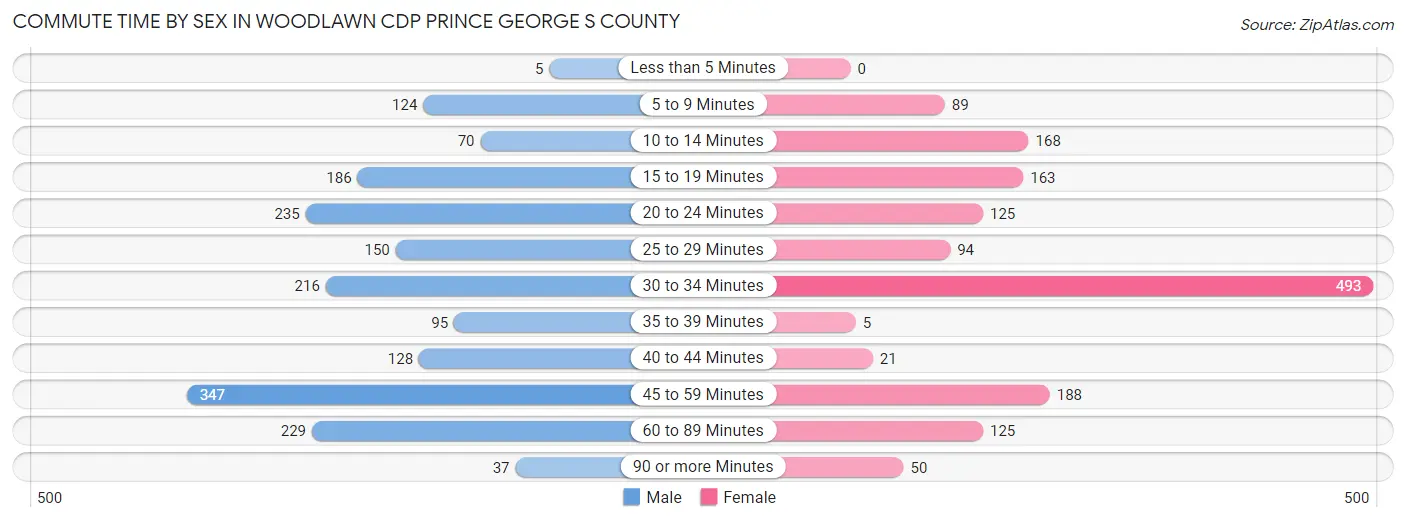
| Commute Time | Male | Female |
| Less than 5 Minutes | 5 (0.3%) | 0 (0.0%) |
| 5 to 9 Minutes | 124 (6.8%) | 89 (5.9%) |
| 10 to 14 Minutes | 70 (3.8%) | 168 (11.1%) |
| 15 to 19 Minutes | 186 (10.2%) | 163 (10.7%) |
| 20 to 24 Minutes | 235 (12.9%) | 125 (8.2%) |
| 25 to 29 Minutes | 150 (8.2%) | 94 (6.2%) |
| 30 to 34 Minutes | 216 (11.9%) | 493 (32.4%) |
| 35 to 39 Minutes | 95 (5.2%) | 5 (0.3%) |
| 40 to 44 Minutes | 128 (7.0%) | 21 (1.4%) |
| 45 to 59 Minutes | 347 (19.1%) | 188 (12.4%) |
| 60 to 89 Minutes | 229 (12.6%) | 125 (8.2%) |
| 90 or more Minutes | 37 (2.0%) | 50 (3.3%) |
Time of Departure to Work by Sex in Woodlawn CDP Prince George s County
The most frequent times of departure to work in Woodlawn CDP Prince George s County are 7:00 AM to 7:29 AM (342, 18.8%) for males and 9:00 AM to 9:59 AM (254, 16.7%) for females.
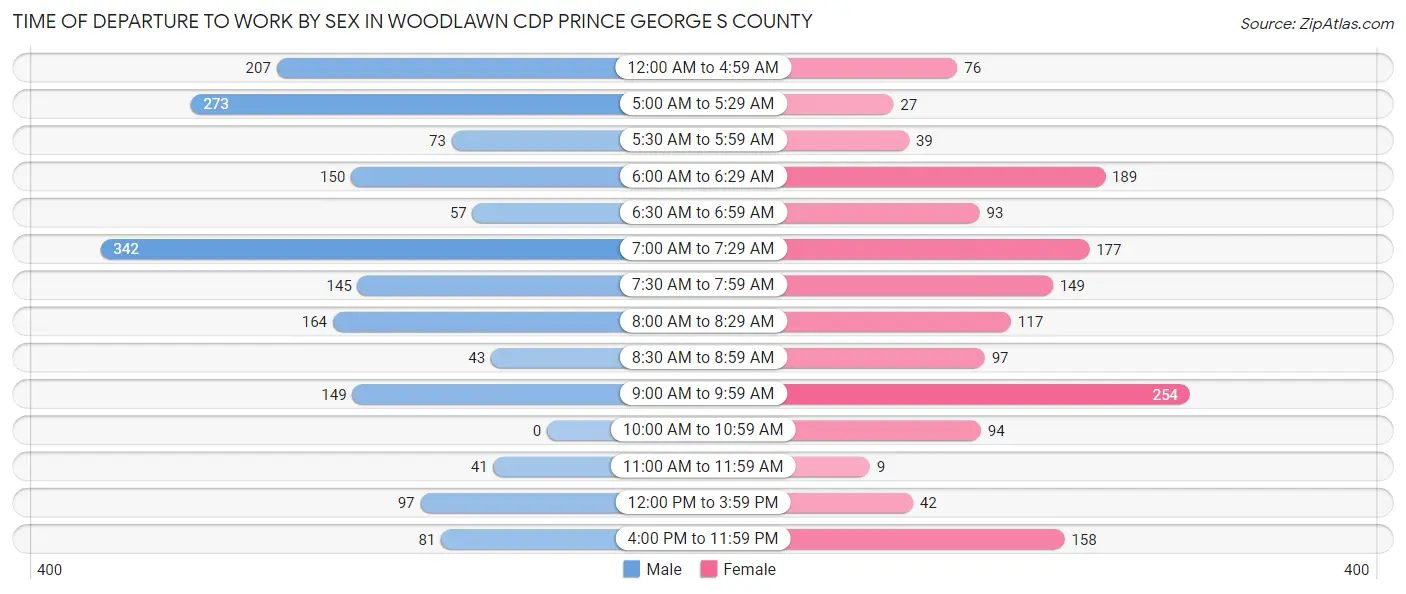
| Time of Departure | Male | Female |
| 12:00 AM to 4:59 AM | 207 (11.4%) | 76 (5.0%) |
| 5:00 AM to 5:29 AM | 273 (15.0%) | 27 (1.8%) |
| 5:30 AM to 5:59 AM | 73 (4.0%) | 39 (2.6%) |
| 6:00 AM to 6:29 AM | 150 (8.2%) | 189 (12.4%) |
| 6:30 AM to 6:59 AM | 57 (3.1%) | 93 (6.1%) |
| 7:00 AM to 7:29 AM | 342 (18.8%) | 177 (11.6%) |
| 7:30 AM to 7:59 AM | 145 (8.0%) | 149 (9.8%) |
| 8:00 AM to 8:29 AM | 164 (9.0%) | 117 (7.7%) |
| 8:30 AM to 8:59 AM | 43 (2.4%) | 97 (6.4%) |
| 9:00 AM to 9:59 AM | 149 (8.2%) | 254 (16.7%) |
| 10:00 AM to 10:59 AM | 0 (0.0%) | 94 (6.2%) |
| 11:00 AM to 11:59 AM | 41 (2.2%) | 9 (0.6%) |
| 12:00 PM to 3:59 PM | 97 (5.3%) | 42 (2.8%) |
| 4:00 PM to 11:59 PM | 81 (4.4%) | 158 (10.4%) |
| Total | 1,822 (100.0%) | 1,521 (100.0%) |
Housing Occupancy in Woodlawn CDP Prince George s County
Occupancy by Ownership in Woodlawn CDP Prince George s County
Of the total 2,038 dwellings in Woodlawn CDP Prince George s County, owner-occupied units account for 1,701 (83.5%), while renter-occupied units make up 337 (16.5%).
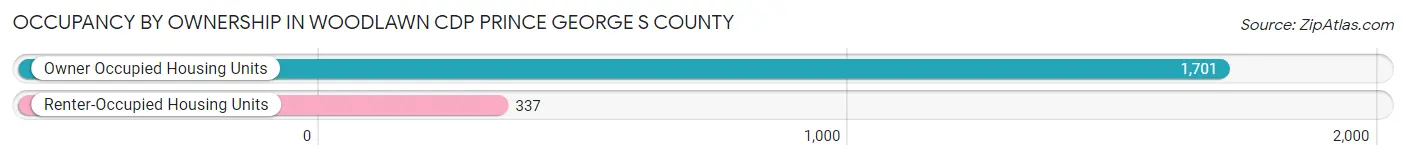
| Occupancy | # Housing Units | % Housing Units |
| Owner Occupied Housing Units | 1,701 | 83.5% |
| Renter-Occupied Housing Units | 337 | 16.5% |
| Total Occupied Housing Units | 2,038 | 100.0% |
Occupancy by Household Size in Woodlawn CDP Prince George s County
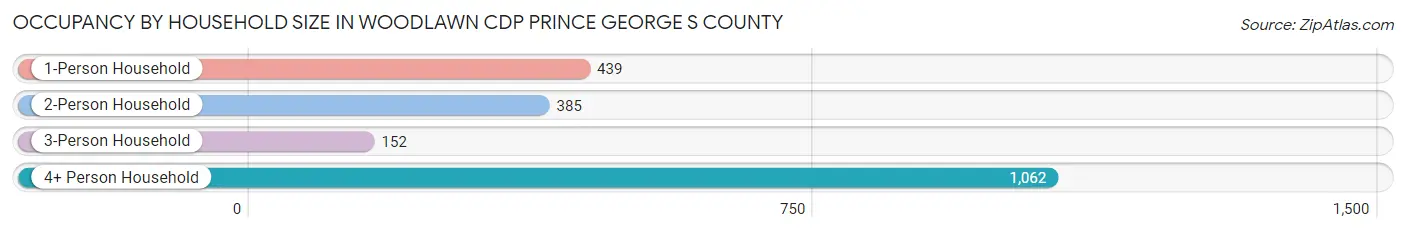
| Household Size | # Housing Units | % Housing Units |
| 1-Person Household | 439 | 21.5% |
| 2-Person Household | 385 | 18.9% |
| 3-Person Household | 152 | 7.5% |
| 4+ Person Household | 1,062 | 52.1% |
| Total Housing Units | 2,038 | 100.0% |
Occupancy by Ownership by Household Size in Woodlawn CDP Prince George s County
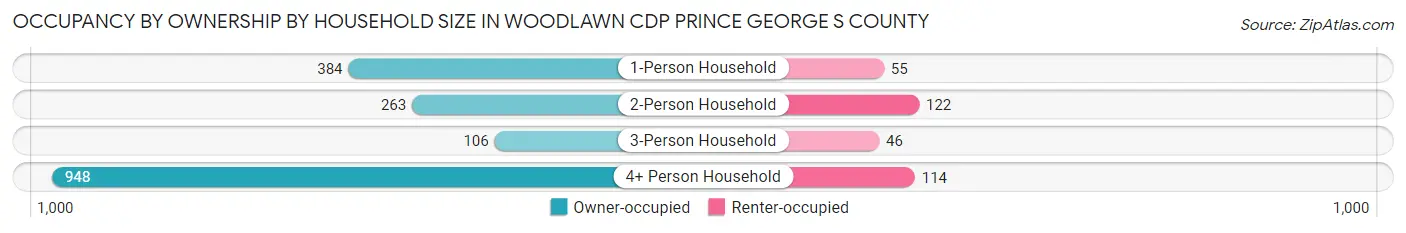
| Household Size | Owner-occupied | Renter-occupied |
| 1-Person Household | 384 (87.5%) | 55 (12.5%) |
| 2-Person Household | 263 (68.3%) | 122 (31.7%) |
| 3-Person Household | 106 (69.7%) | 46 (30.3%) |
| 4+ Person Household | 948 (89.3%) | 114 (10.7%) |
| Total Housing Units | 1,701 (83.5%) | 337 (16.5%) |
Occupancy by Educational Attainment in Woodlawn CDP Prince George s County
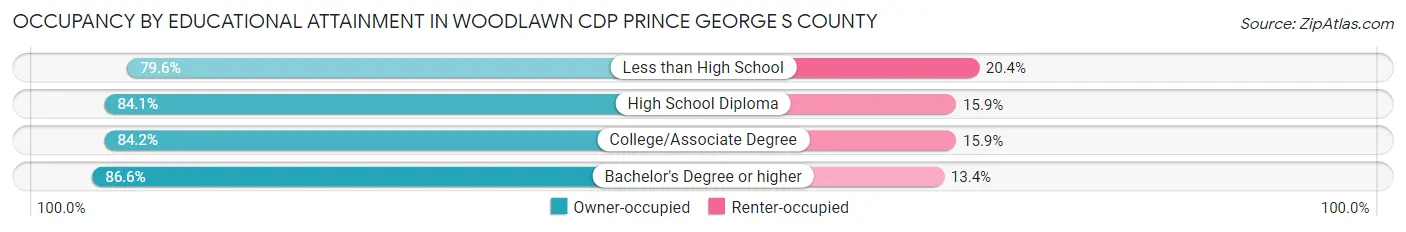
| Household Size | Owner-occupied | Renter-occupied |
| Less than High School | 446 (79.6%) | 114 (20.4%) |
| High School Diploma | 419 (84.1%) | 79 (15.9%) |
| College/Associate Degree | 430 (84.2%) | 81 (15.9%) |
| Bachelor's Degree or higher | 406 (86.6%) | 63 (13.4%) |
Occupancy by Age of Householder in Woodlawn CDP Prince George s County
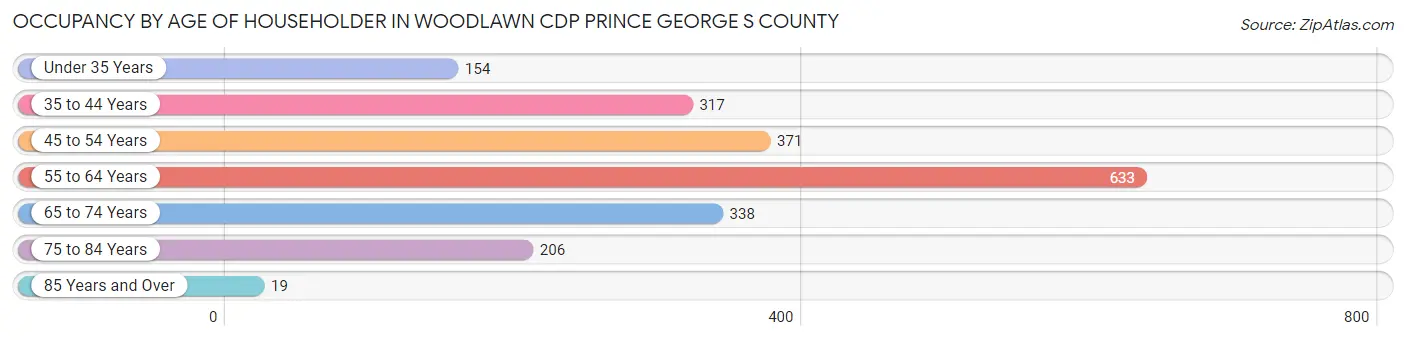
| Age Bracket | # Households | % Households |
| Under 35 Years | 154 | 7.6% |
| 35 to 44 Years | 317 | 15.5% |
| 45 to 54 Years | 371 | 18.2% |
| 55 to 64 Years | 633 | 31.1% |
| 65 to 74 Years | 338 | 16.6% |
| 75 to 84 Years | 206 | 10.1% |
| 85 Years and Over | 19 | 0.9% |
| Total | 2,038 | 100.0% |
Housing Finances in Woodlawn CDP Prince George s County
Median Income by Occupancy in Woodlawn CDP Prince George s County
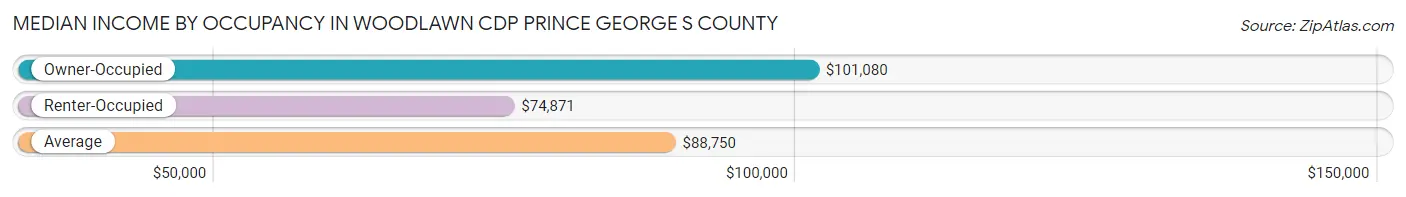
| Occupancy Type | # Households | Median Income |
| Owner-Occupied | 1,701 (83.5%) | $101,080 |
| Renter-Occupied | 337 (16.5%) | $74,871 |
| Average | 2,038 (100.0%) | $88,750 |
Occupancy by Householder Income Bracket in Woodlawn CDP Prince George s County
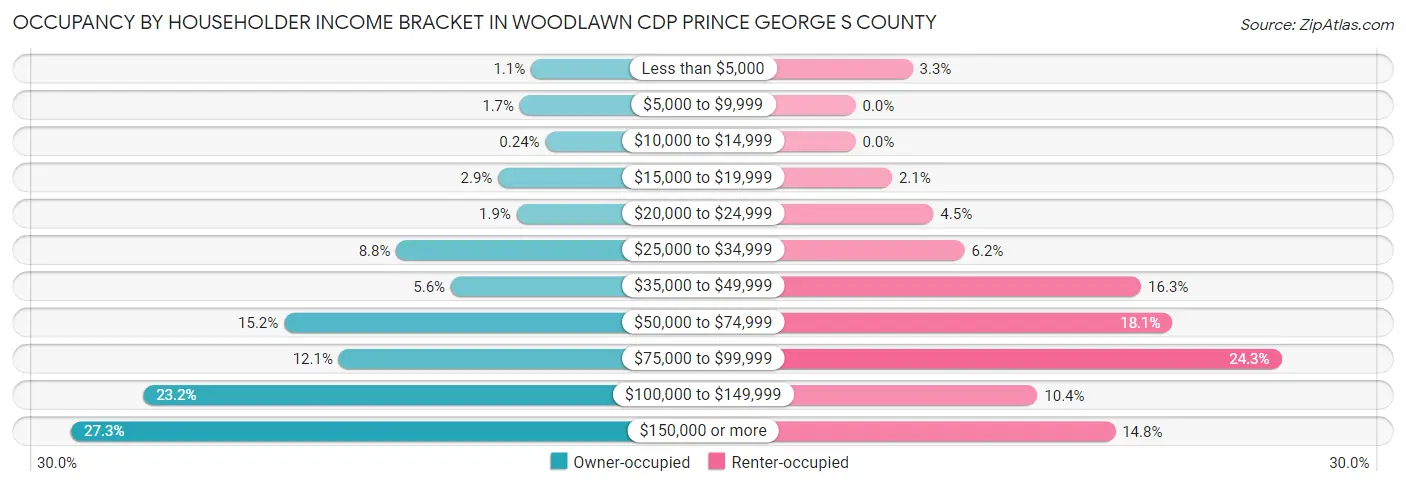
| Income Bracket | Owner-occupied | Renter-occupied |
| Less than $5,000 | 18 (1.1%) | 11 (3.3%) |
| $5,000 to $9,999 | 29 (1.7%) | 0 (0.0%) |
| $10,000 to $14,999 | 4 (0.2%) | 0 (0.0%) |
| $15,000 to $19,999 | 50 (2.9%) | 7 (2.1%) |
| $20,000 to $24,999 | 32 (1.9%) | 15 (4.4%) |
| $25,000 to $34,999 | 149 (8.8%) | 21 (6.2%) |
| $35,000 to $49,999 | 96 (5.6%) | 55 (16.3%) |
| $50,000 to $74,999 | 258 (15.2%) | 61 (18.1%) |
| $75,000 to $99,999 | 205 (12.0%) | 82 (24.3%) |
| $100,000 to $149,999 | 395 (23.2%) | 35 (10.4%) |
| $150,000 or more | 465 (27.3%) | 50 (14.8%) |
| Total | 1,701 (100.0%) | 337 (100.0%) |
Monthly Housing Cost Tiers in Woodlawn CDP Prince George s County
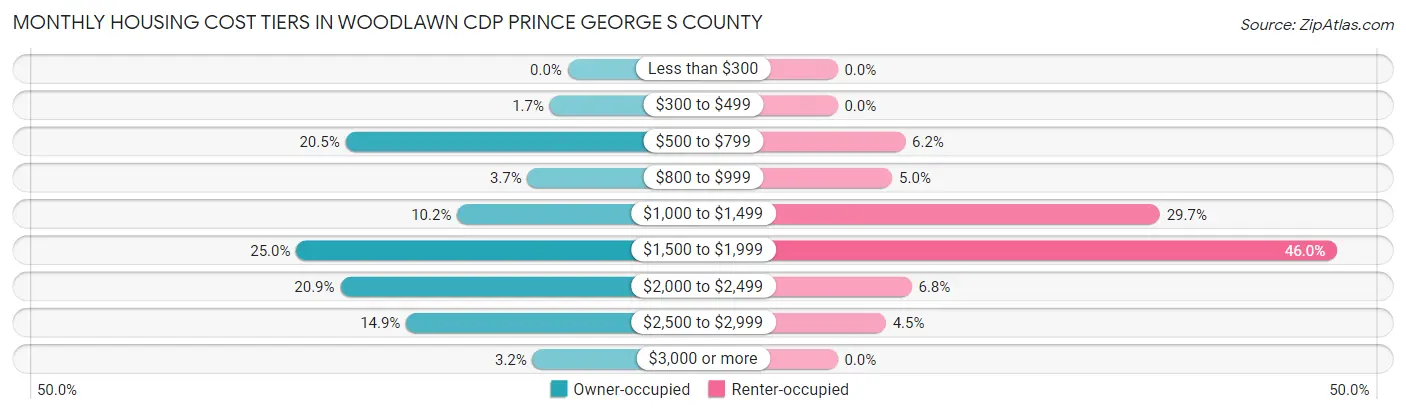
| Monthly Cost | Owner-occupied | Renter-occupied |
| Less than $300 | 0 (0.0%) | 0 (0.0%) |
| $300 to $499 | 28 (1.7%) | 0 (0.0%) |
| $500 to $799 | 348 (20.5%) | 21 (6.2%) |
| $800 to $999 | 63 (3.7%) | 17 (5.0%) |
| $1,000 to $1,499 | 173 (10.2%) | 100 (29.7%) |
| $1,500 to $1,999 | 425 (25.0%) | 155 (46.0%) |
| $2,000 to $2,499 | 356 (20.9%) | 23 (6.8%) |
| $2,500 to $2,999 | 253 (14.9%) | 15 (4.4%) |
| $3,000 or more | 55 (3.2%) | 0 (0.0%) |
| Total | 1,701 (100.0%) | 337 (100.0%) |
Physical Housing Characteristics in Woodlawn CDP Prince George s County
Housing Structures in Woodlawn CDP Prince George s County
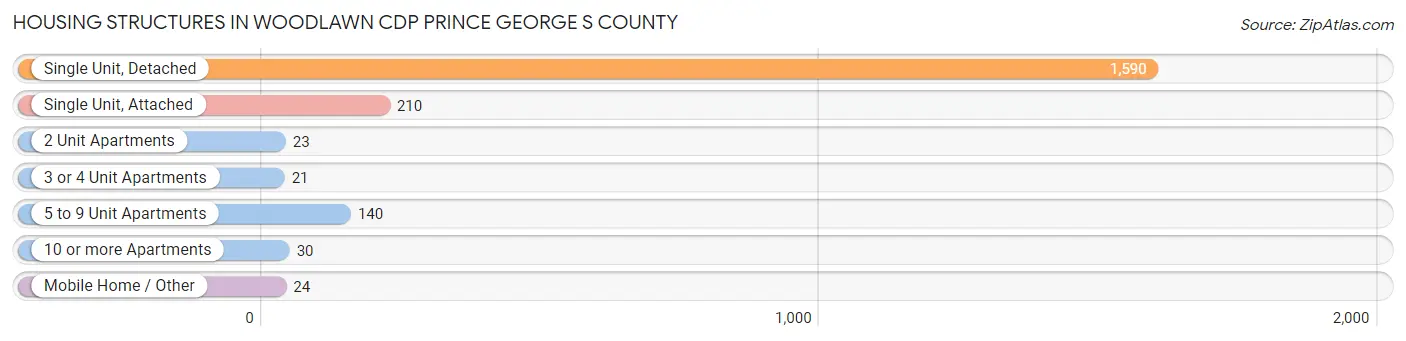
| Structure Type | # Housing Units | % Housing Units |
| Single Unit, Detached | 1,590 | 78.0% |
| Single Unit, Attached | 210 | 10.3% |
| 2 Unit Apartments | 23 | 1.1% |
| 3 or 4 Unit Apartments | 21 | 1.0% |
| 5 to 9 Unit Apartments | 140 | 6.9% |
| 10 or more Apartments | 30 | 1.5% |
| Mobile Home / Other | 24 | 1.2% |
| Total | 2,038 | 100.0% |
Housing Structures by Occupancy in Woodlawn CDP Prince George s County
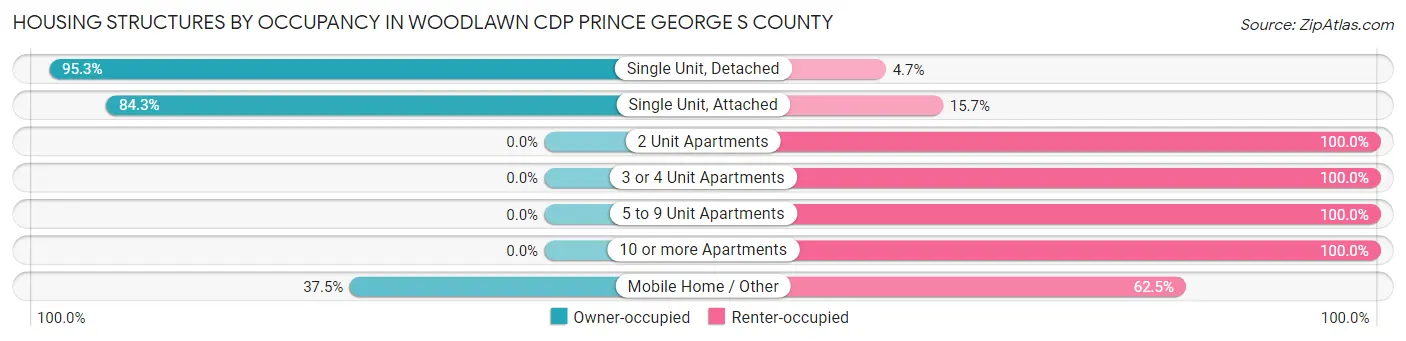
| Structure Type | Owner-occupied | Renter-occupied |
| Single Unit, Detached | 1,515 (95.3%) | 75 (4.7%) |
| Single Unit, Attached | 177 (84.3%) | 33 (15.7%) |
| 2 Unit Apartments | 0 (0.0%) | 23 (100.0%) |
| 3 or 4 Unit Apartments | 0 (0.0%) | 21 (100.0%) |
| 5 to 9 Unit Apartments | 0 (0.0%) | 140 (100.0%) |
| 10 or more Apartments | 0 (0.0%) | 30 (100.0%) |
| Mobile Home / Other | 9 (37.5%) | 15 (62.5%) |
| Total | 1,701 (83.5%) | 337 (16.5%) |
Housing Structures by Number of Rooms in Woodlawn CDP Prince George s County
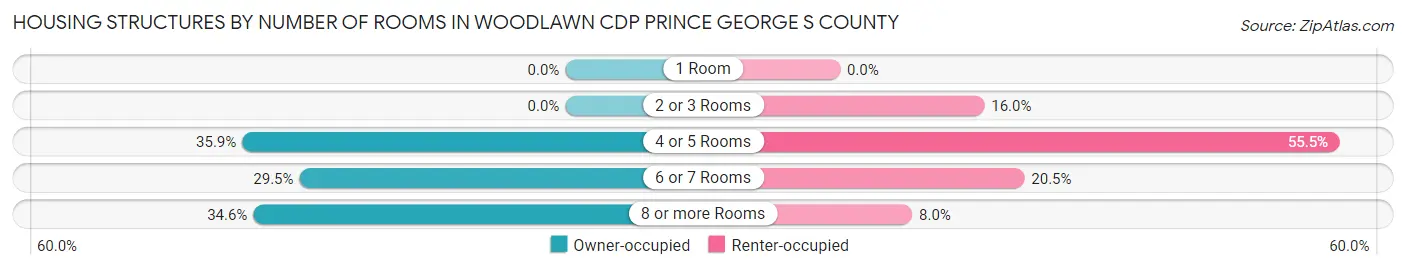
| Number of Rooms | Owner-occupied | Renter-occupied |
| 1 Room | 0 (0.0%) | 0 (0.0%) |
| 2 or 3 Rooms | 0 (0.0%) | 54 (16.0%) |
| 4 or 5 Rooms | 610 (35.9%) | 187 (55.5%) |
| 6 or 7 Rooms | 502 (29.5%) | 69 (20.5%) |
| 8 or more Rooms | 589 (34.6%) | 27 (8.0%) |
| Total | 1,701 (100.0%) | 337 (100.0%) |
Housing Structure by Heating Type in Woodlawn CDP Prince George s County
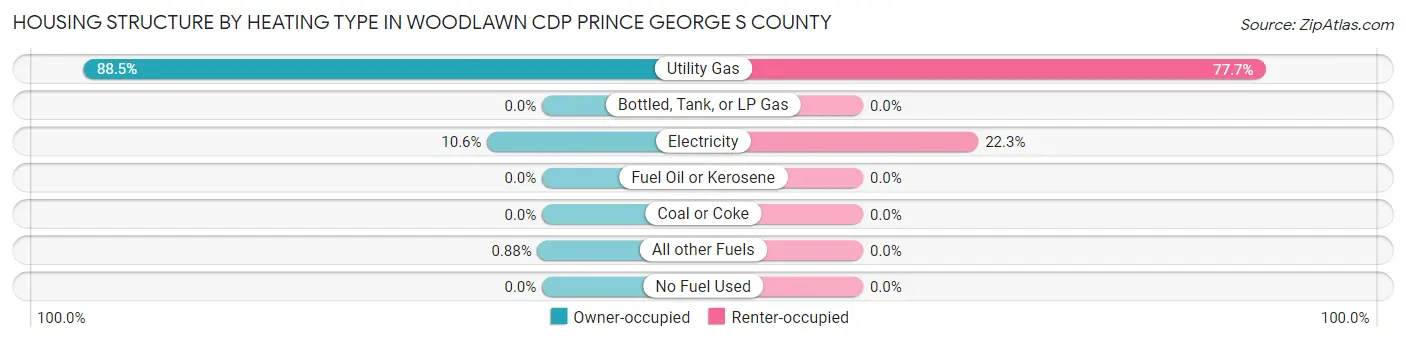
| Heating Type | Owner-occupied | Renter-occupied |
| Utility Gas | 1,506 (88.5%) | 262 (77.7%) |
| Bottled, Tank, or LP Gas | 0 (0.0%) | 0 (0.0%) |
| Electricity | 180 (10.6%) | 75 (22.3%) |
| Fuel Oil or Kerosene | 0 (0.0%) | 0 (0.0%) |
| Coal or Coke | 0 (0.0%) | 0 (0.0%) |
| All other Fuels | 15 (0.9%) | 0 (0.0%) |
| No Fuel Used | 0 (0.0%) | 0 (0.0%) |
| Total | 1,701 (100.0%) | 337 (100.0%) |
Household Vehicle Usage in Woodlawn CDP Prince George s County
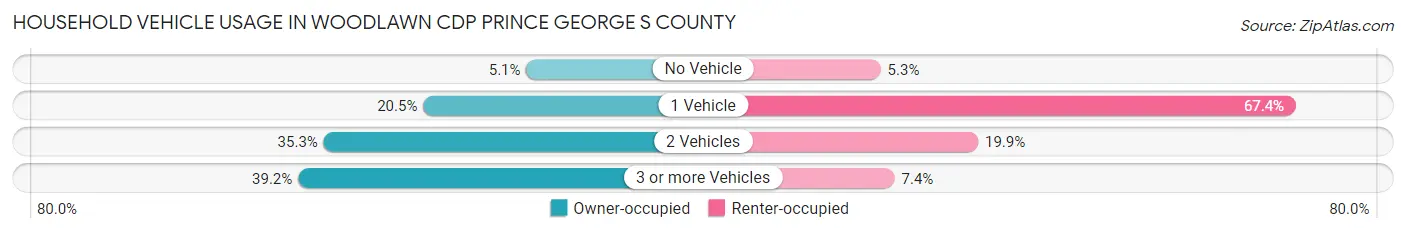
| Vehicles per Household | Owner-occupied | Renter-occupied |
| No Vehicle | 86 (5.1%) | 18 (5.3%) |
| 1 Vehicle | 348 (20.5%) | 227 (67.4%) |
| 2 Vehicles | 601 (35.3%) | 67 (19.9%) |
| 3 or more Vehicles | 666 (39.2%) | 25 (7.4%) |
| Total | 1,701 (100.0%) | 337 (100.0%) |
Real Estate & Mortgages in Woodlawn CDP Prince George s County
Real Estate and Mortgage Overview in Woodlawn CDP Prince George s County
| Characteristic | Without Mortgage | With Mortgage |
| Housing Units | 428 | 1,273 |
| Median Property Value | $296,200 | $325,200 |
| Median Household Income | $78,438 | $320 |
| Monthly Housing Costs | $639 | $55 |
| Real Estate Taxes | $3,545 | $51 |
Property Value by Mortgage Status in Woodlawn CDP Prince George s County
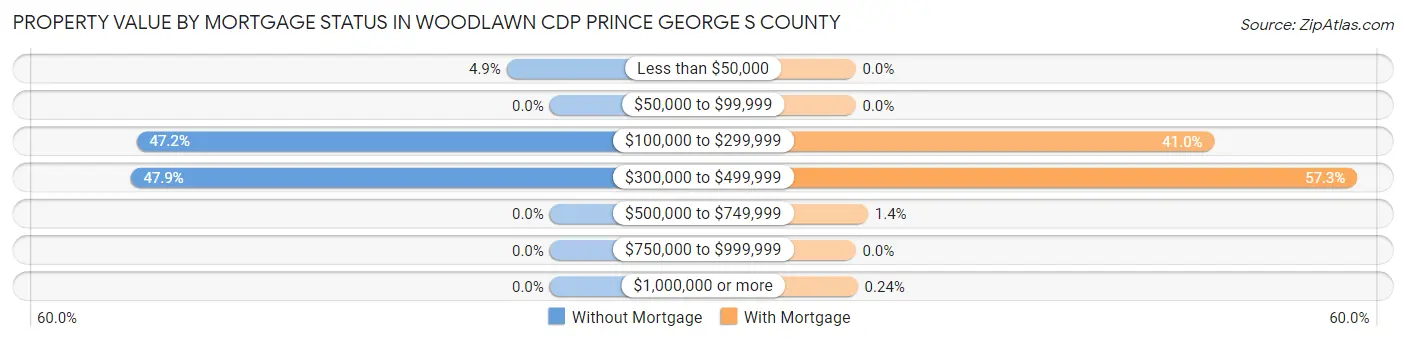
| Property Value | Without Mortgage | With Mortgage |
| Less than $50,000 | 21 (4.9%) | 0 (0.0%) |
| $50,000 to $99,999 | 0 (0.0%) | 0 (0.0%) |
| $100,000 to $299,999 | 202 (47.2%) | 522 (41.0%) |
| $300,000 to $499,999 | 205 (47.9%) | 730 (57.3%) |
| $500,000 to $749,999 | 0 (0.0%) | 18 (1.4%) |
| $750,000 to $999,999 | 0 (0.0%) | 0 (0.0%) |
| $1,000,000 or more | 0 (0.0%) | 3 (0.2%) |
| Total | 428 (100.0%) | 1,273 (100.0%) |
Household Income by Mortgage Status in Woodlawn CDP Prince George s County
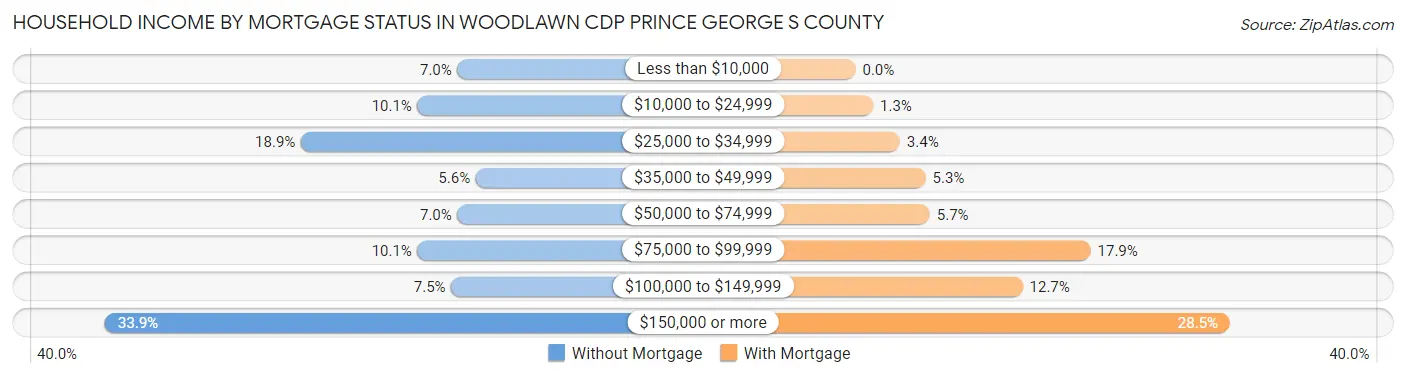
| Household Income | Without Mortgage | With Mortgage |
| Less than $10,000 | 30 (7.0%) | 0 (0.0%) |
| $10,000 to $24,999 | 43 (10.1%) | 17 (1.3%) |
| $25,000 to $34,999 | 81 (18.9%) | 43 (3.4%) |
| $35,000 to $49,999 | 24 (5.6%) | 68 (5.3%) |
| $50,000 to $74,999 | 30 (7.0%) | 72 (5.7%) |
| $75,000 to $99,999 | 43 (10.1%) | 228 (17.9%) |
| $100,000 to $149,999 | 32 (7.5%) | 162 (12.7%) |
| $150,000 or more | 145 (33.9%) | 363 (28.5%) |
| Total | 428 (100.0%) | 1,273 (100.0%) |
Property Value to Household Income Ratio in Woodlawn CDP Prince George s County
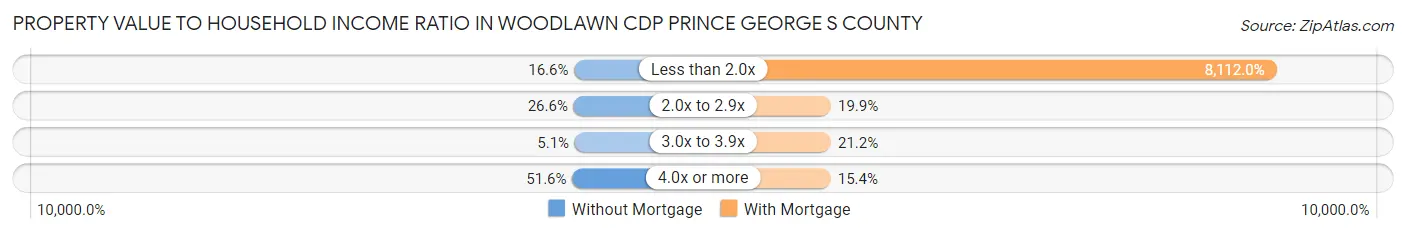
| Value-to-Income Ratio | Without Mortgage | With Mortgage |
| Less than 2.0x | 71 (16.6%) | 103,266 (8,112.0%) |
| 2.0x to 2.9x | 114 (26.6%) | 253 (19.9%) |
| 3.0x to 3.9x | 22 (5.1%) | 270 (21.2%) |
| 4.0x or more | 221 (51.6%) | 196 (15.4%) |
| Total | 428 (100.0%) | 1,273 (100.0%) |
Real Estate Taxes by Mortgage Status in Woodlawn CDP Prince George s County
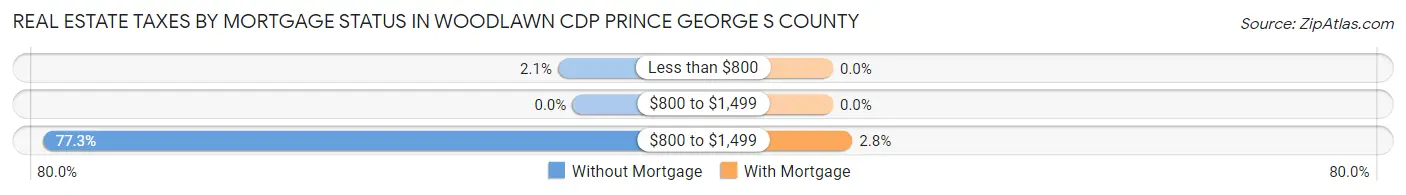
| Property Taxes | Without Mortgage | With Mortgage |
| Less than $800 | 9 (2.1%) | 0 (0.0%) |
| $800 to $1,499 | 0 (0.0%) | 0 (0.0%) |
| $800 to $1,499 | 331 (77.3%) | 36 (2.8%) |
| Total | 428 (100.0%) | 1,273 (100.0%) |
Health & Disability in Woodlawn CDP Prince George s County
Health Insurance Coverage by Age in Woodlawn CDP Prince George s County
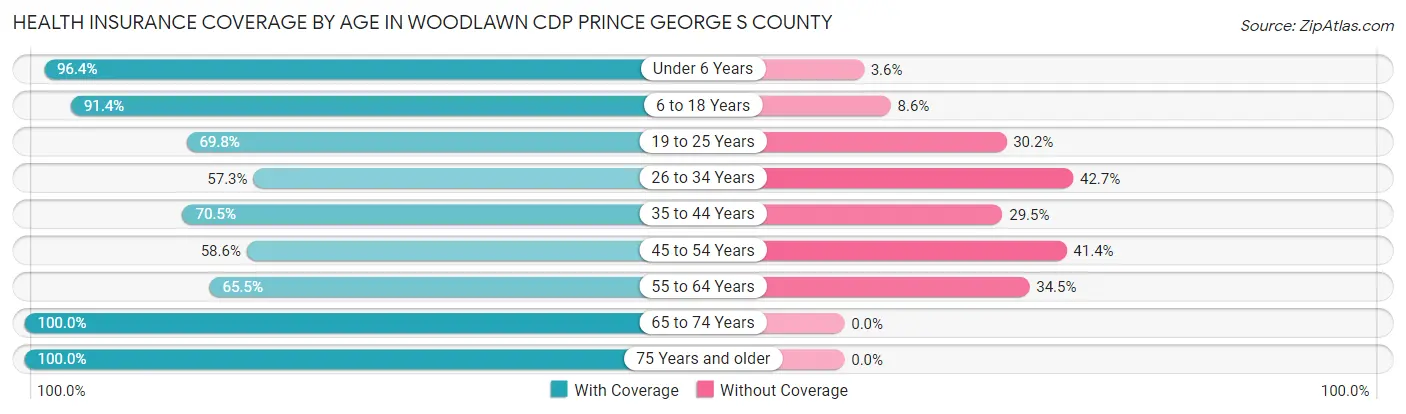
| Age Bracket | With Coverage | Without Coverage |
| Under 6 Years | 878 (96.4%) | 33 (3.6%) |
| 6 to 18 Years | 1,153 (91.4%) | 109 (8.6%) |
| 19 to 25 Years | 414 (69.8%) | 179 (30.2%) |
| 26 to 34 Years | 461 (57.3%) | 343 (42.7%) |
| 35 to 44 Years | 802 (70.5%) | 335 (29.5%) |
| 45 to 54 Years | 601 (58.6%) | 425 (41.4%) |
| 55 to 64 Years | 600 (65.5%) | 316 (34.5%) |
| 65 to 74 Years | 543 (100.0%) | 0 (0.0%) |
| 75 Years and older | 314 (100.0%) | 0 (0.0%) |
| Total | 5,766 (76.8%) | 1,740 (23.2%) |
Health Insurance Coverage by Citizenship Status in Woodlawn CDP Prince George s County
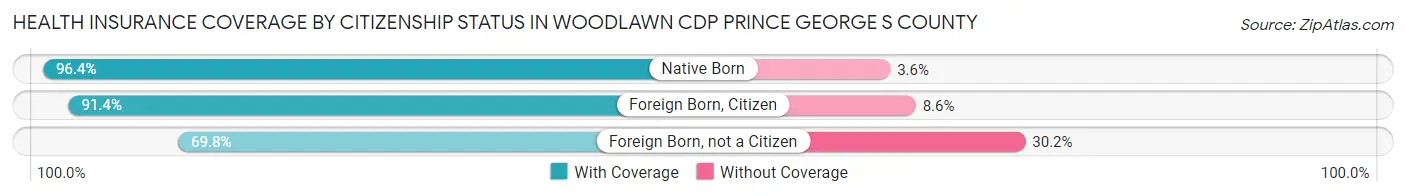
| Citizenship Status | With Coverage | Without Coverage |
| Native Born | 878 (96.4%) | 33 (3.6%) |
| Foreign Born, Citizen | 1,153 (91.4%) | 109 (8.6%) |
| Foreign Born, not a Citizen | 414 (69.8%) | 179 (30.2%) |
Health Insurance Coverage by Household Income in Woodlawn CDP Prince George s County
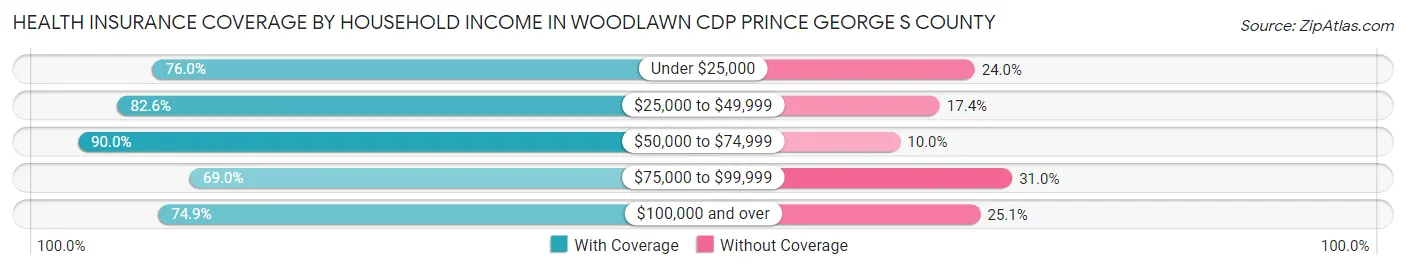
| Household Income | With Coverage | Without Coverage |
| Under $25,000 | 260 (76.0%) | 82 (24.0%) |
| $25,000 to $49,999 | 729 (82.6%) | 154 (17.4%) |
| $50,000 to $74,999 | 815 (90.0%) | 91 (10.0%) |
| $75,000 to $99,999 | 799 (69.0%) | 359 (31.0%) |
| $100,000 and over | 3,152 (74.9%) | 1,054 (25.1%) |
Public vs Private Health Insurance Coverage by Age in Woodlawn CDP Prince George s County
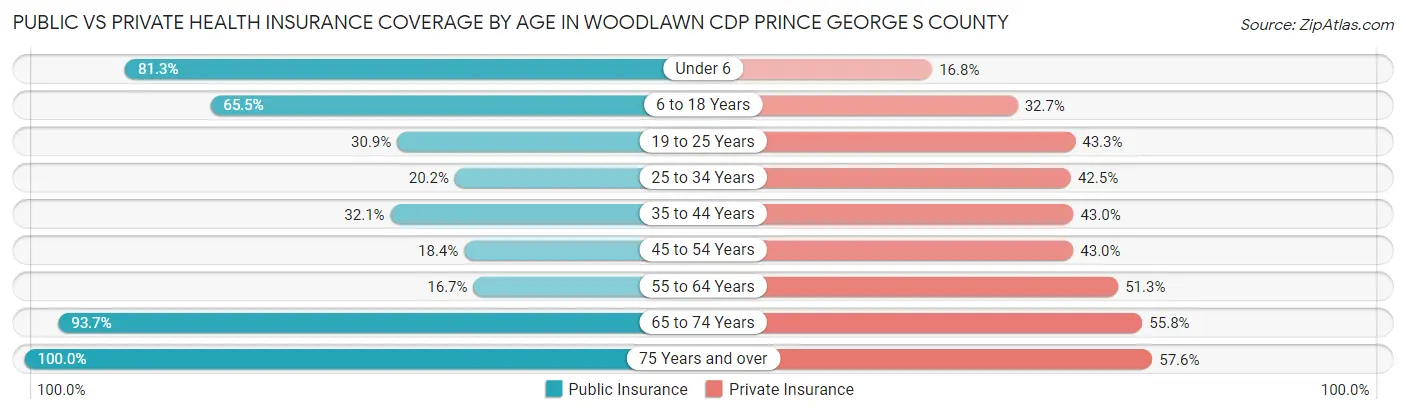
| Age Bracket | Public Insurance | Private Insurance |
| Under 6 | 741 (81.3%) | 153 (16.8%) |
| 6 to 18 Years | 827 (65.5%) | 412 (32.7%) |
| 19 to 25 Years | 183 (30.9%) | 257 (43.3%) |
| 25 to 34 Years | 162 (20.2%) | 342 (42.5%) |
| 35 to 44 Years | 365 (32.1%) | 489 (43.0%) |
| 45 to 54 Years | 189 (18.4%) | 441 (43.0%) |
| 55 to 64 Years | 153 (16.7%) | 470 (51.3%) |
| 65 to 74 Years | 509 (93.7%) | 303 (55.8%) |
| 75 Years and over | 314 (100.0%) | 181 (57.6%) |
| Total | 3,443 (45.9%) | 3,048 (40.6%) |
Disability Status by Sex by Age in Woodlawn CDP Prince George s County
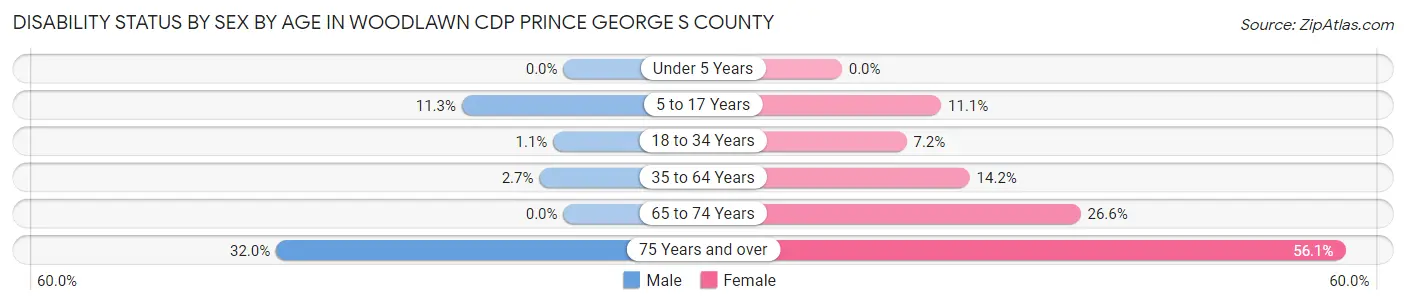
| Age Bracket | Male | Female |
| Under 5 Years | 0 (0.0%) | 0 (0.0%) |
| 5 to 17 Years | 76 (11.3%) | 68 (11.1%) |
| 18 to 34 Years | 8 (1.1%) | 55 (7.2%) |
| 35 to 64 Years | 40 (2.7%) | 226 (14.2%) |
| 65 to 74 Years | 0 (0.0%) | 71 (26.6%) |
| 75 Years and over | 24 (32.0%) | 134 (56.1%) |
Disability Class by Sex by Age in Woodlawn CDP Prince George s County
Disability Class: Hearing Difficulty
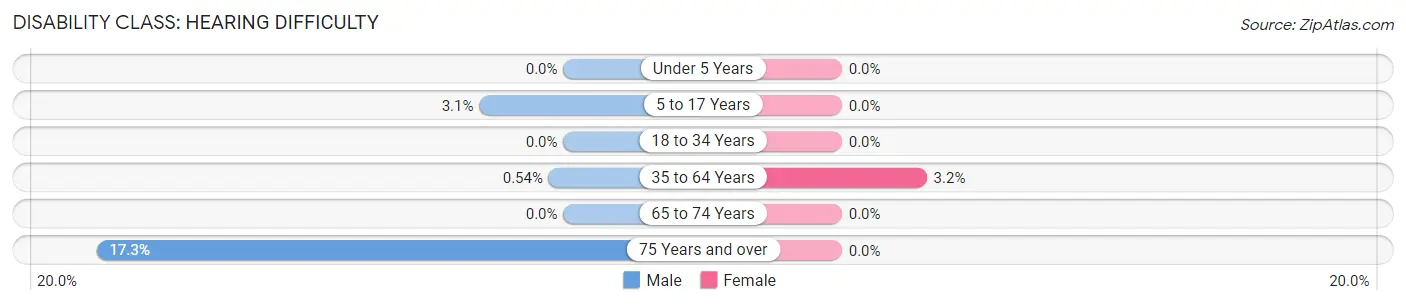
| Age Bracket | Male | Female |
| Under 5 Years | 0 (0.0%) | 0 (0.0%) |
| 5 to 17 Years | 21 (3.1%) | 0 (0.0%) |
| 18 to 34 Years | 0 (0.0%) | 0 (0.0%) |
| 35 to 64 Years | 8 (0.5%) | 50 (3.2%) |
| 65 to 74 Years | 0 (0.0%) | 0 (0.0%) |
| 75 Years and over | 13 (17.3%) | 0 (0.0%) |
Disability Class: Vision Difficulty
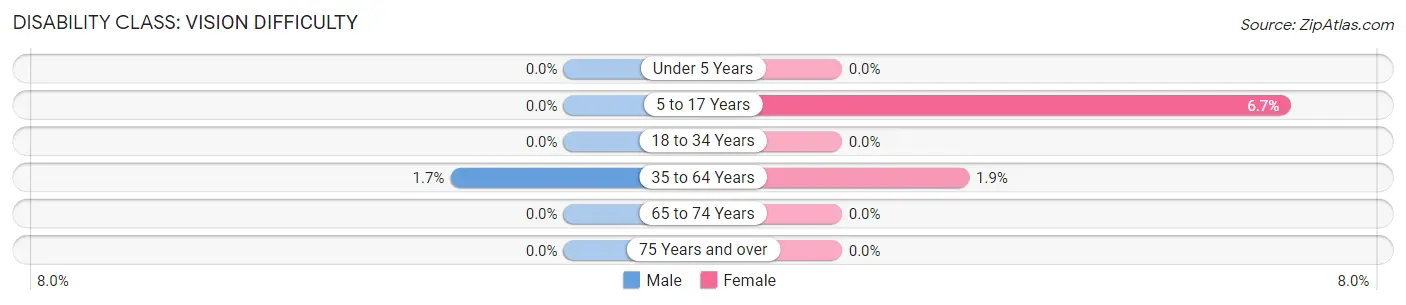
| Age Bracket | Male | Female |
| Under 5 Years | 0 (0.0%) | 0 (0.0%) |
| 5 to 17 Years | 0 (0.0%) | 41 (6.7%) |
| 18 to 34 Years | 0 (0.0%) | 0 (0.0%) |
| 35 to 64 Years | 25 (1.7%) | 30 (1.9%) |
| 65 to 74 Years | 0 (0.0%) | 0 (0.0%) |
| 75 Years and over | 0 (0.0%) | 0 (0.0%) |
Disability Class: Cognitive Difficulty
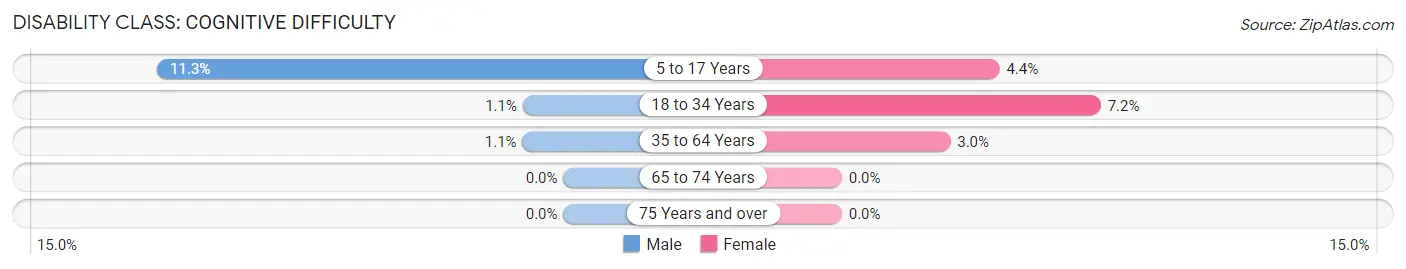
| Age Bracket | Male | Female |
| 5 to 17 Years | 76 (11.3%) | 27 (4.4%) |
| 18 to 34 Years | 8 (1.1%) | 55 (7.2%) |
| 35 to 64 Years | 17 (1.1%) | 48 (3.0%) |
| 65 to 74 Years | 0 (0.0%) | 0 (0.0%) |
| 75 Years and over | 0 (0.0%) | 0 (0.0%) |
Disability Class: Ambulatory Difficulty
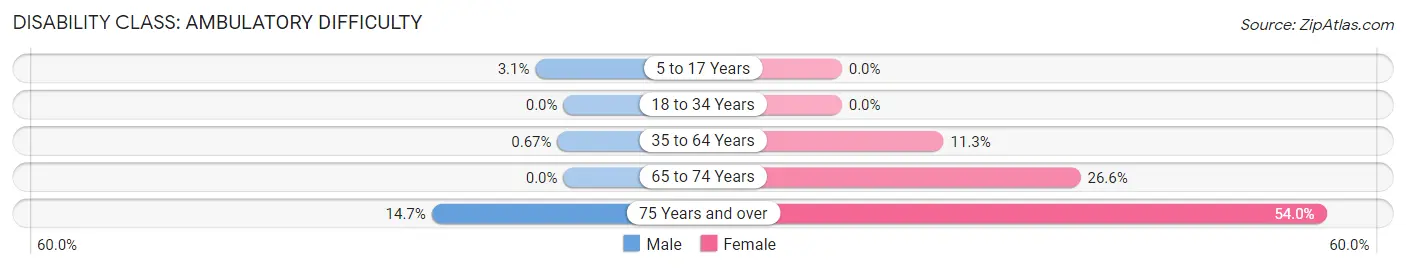
| Age Bracket | Male | Female |
| 5 to 17 Years | 21 (3.1%) | 0 (0.0%) |
| 18 to 34 Years | 0 (0.0%) | 0 (0.0%) |
| 35 to 64 Years | 10 (0.7%) | 180 (11.3%) |
| 65 to 74 Years | 0 (0.0%) | 71 (26.6%) |
| 75 Years and over | 11 (14.7%) | 129 (54.0%) |
Disability Class: Self-Care Difficulty
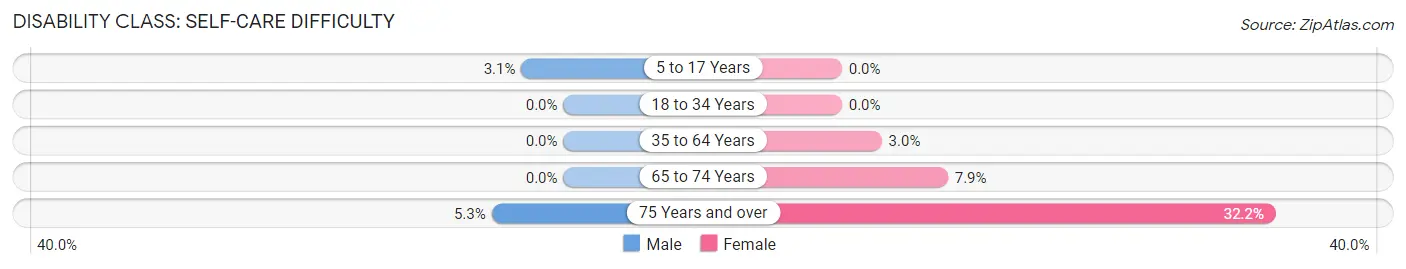
| Age Bracket | Male | Female |
| 5 to 17 Years | 21 (3.1%) | 0 (0.0%) |
| 18 to 34 Years | 0 (0.0%) | 0 (0.0%) |
| 35 to 64 Years | 0 (0.0%) | 47 (3.0%) |
| 65 to 74 Years | 0 (0.0%) | 21 (7.9%) |
| 75 Years and over | 4 (5.3%) | 77 (32.2%) |
Technology Access in Woodlawn CDP Prince George s County
Computing Device Access in Woodlawn CDP Prince George s County
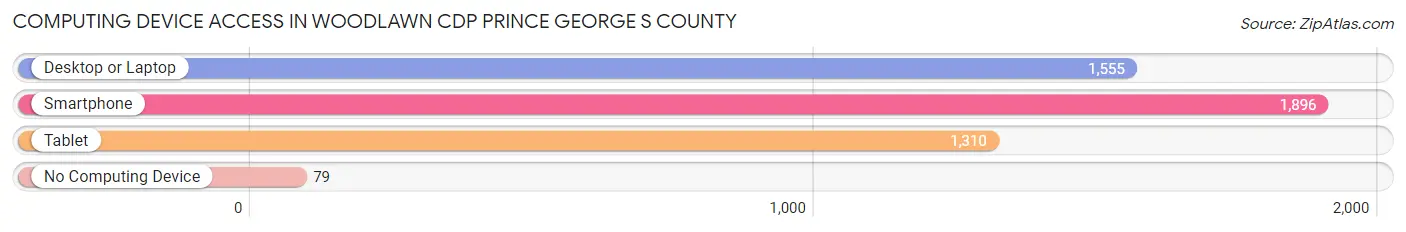
| Device Type | # Households | % Households |
| Desktop or Laptop | 1,555 | 76.3% |
| Smartphone | 1,896 | 93.0% |
| Tablet | 1,310 | 64.3% |
| No Computing Device | 79 | 3.9% |
| Total | 2,038 | 100.0% |
Internet Access in Woodlawn CDP Prince George s County
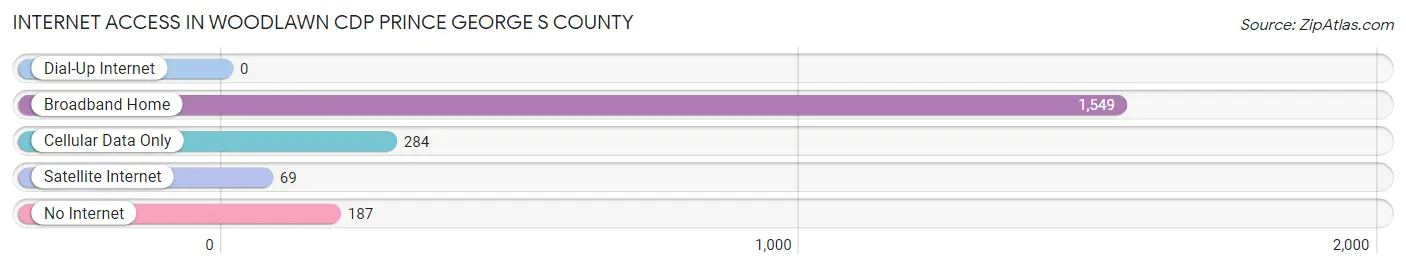
| Internet Type | # Households | % Households |
| Dial-Up Internet | 0 | 0.0% |
| Broadband Home | 1,549 | 76.0% |
| Cellular Data Only | 284 | 13.9% |
| Satellite Internet | 69 | 3.4% |
| No Internet | 187 | 9.2% |
| Total | 2,038 | 100.0% |
Woodlawn CDP Prince George s County Summary
Woodlawn Cdp is a census-designated place (CDP) located in Prince George’s County, Maryland. It is situated in the Washington-Arlington-Alexandria metropolitan area and is part of the larger Washington-Baltimore-Arlington metropolitan statistical area. As of the 2010 census, the population of Woodlawn Cdp was 8,845.
History
Woodlawn Cdp was first settled in the early 19th century by a group of German immigrants. The area was originally known as “Woodlawn” and was part of the larger Prince George’s County. In the late 19th century, the area was annexed by the City of Washington, D.C. and became part of the District of Columbia. In the early 20th century, the area was annexed back into Prince George’s County and became a census-designated place (CDP).
Geography
Woodlawn Cdp is located at 38°54'25" North, 76°54'45" West (38.906833, -76.912500). It is situated in the Washington-Arlington-Alexandria metropolitan area and is part of the larger Washington-Baltimore-Arlington metropolitan statistical area. The total area of Woodlawn Cdp is 2.2 square miles, all of which is land.
Economy
The economy of Woodlawn Cdp is largely based on the service industry. The area is home to a number of retail stores, restaurants, and other businesses. The area is also home to a number of government offices, including the Prince George’s County Police Department and the Prince George’s County Fire and Rescue Department.
Demographics
As of the 2010 census, the population of Woodlawn Cdp was 8,845. The racial makeup of the area was 57.3% African American, 33.2% White, 4.2% Asian, 0.7% Native American, 0.1% Pacific Islander, and 4.5% from other races. The median household income was $50,945 and the median family income was $60,945. The per capita income was $25,945. The unemployment rate was 8.2%.
Conclusion
Woodlawn Cdp is a census-designated place located in Prince George’s County, Maryland. It is situated in the Washington-Arlington-Alexandria metropolitan area and is part of the larger Washington-Baltimore-Arlington metropolitan statistical area. As of the 2010 census, the population of Woodlawn Cdp was 8,845. The economy of Woodlawn Cdp is largely based on the service industry and the area is home to a number of retail stores, restaurants, and other businesses. The racial makeup of the area was 57.3% African American, 33.2% White, 4.2% Asian, 0.7% Native American, 0.1% Pacific Islander, and 4.5% from other races. The median household income was $50,945 and the median family income was $60,945. The per capita income was $25,945. The unemployment rate was 8.2%.
Common Questions
What is Per Capita Income in Woodlawn CDP Prince George s County?
Per Capita income in Woodlawn CDP Prince George s County is $30,594.
What is the Median Family Income in Woodlawn CDP Prince George s County?
Median Family Income in Woodlawn CDP Prince George s County is $105,441.
What is the Median Household income in Woodlawn CDP Prince George s County?
Median Household Income in Woodlawn CDP Prince George s County is $88,750.
What is Income or Wage Gap in Woodlawn CDP Prince George s County?
Income or Wage Gap in Woodlawn CDP Prince George s County is 28.6%.
Women in Woodlawn CDP Prince George s County earn 71.4 cents for every dollar earned by a man.
What is Inequality or Gini Index in Woodlawn CDP Prince George s County?
Inequality or Gini Index in Woodlawn CDP Prince George s County is 0.38.
What is the Total Population of Woodlawn CDP Prince George s County?
Total Population of Woodlawn CDP Prince George s County is 7,515.
What is the Total Male Population of Woodlawn CDP Prince George s County?
Total Male Population of Woodlawn CDP Prince George s County is 3,782.
What is the Total Female Population of Woodlawn CDP Prince George s County?
Total Female Population of Woodlawn CDP Prince George s County is 3,733.
What is the Ratio of Males per 100 Females in Woodlawn CDP Prince George s County?
There are 101.31 Males per 100 Females in Woodlawn CDP Prince George s County.
What is the Ratio of Females per 100 Males in Woodlawn CDP Prince George s County?
There are 98.70 Females per 100 Males in Woodlawn CDP Prince George s County.
What is the Median Population Age in Woodlawn CDP Prince George s County?
Median Population Age in Woodlawn CDP Prince George s County is 36.4 Years.
What is the Average Family Size in Woodlawn CDP Prince George s County
Average Family Size in Woodlawn CDP Prince George s County is 4.4 People.
What is the Average Household Size in Woodlawn CDP Prince George s County
Average Household Size in Woodlawn CDP Prince George s County is 3.7 People.
How Large is the Labor Force in Woodlawn CDP Prince George s County?
There are 3,998 People in the Labor Forcein in Woodlawn CDP Prince George s County.
What is the Percentage of People in the Labor Force in Woodlawn CDP Prince George s County?
71.6% of People are in the Labor Force in Woodlawn CDP Prince George s County.
What is the Unemployment Rate in Woodlawn CDP Prince George s County?
Unemployment Rate in Woodlawn CDP Prince George s County is 12.4%.