Templeville, MD Map & Demographics
Templeville Map
Templeville Overview
$17,725
PER CAPITA INCOME
27.7%
WAGE / INCOME GAP [ % ]
72.3¢/ $1
WAGE / INCOME GAP [ $ ]
0.34
INEQUALITY / GINI INDEX
182
TOTAL POPULATION
80
MALE POPULATION
102
FEMALE POPULATION
78.43
MALES / 100 FEMALES
127.50
FEMALES / 100 MALES
30.1
MEDIAN AGE
5.1
AVG FAMILY SIZE
5.1
AVG HOUSEHOLD SIZE
86
LABOR FORCE [ PEOPLE ]
81.9%
PERCENT IN LABOR FORCE
16.3%
UNEMPLOYMENT RATE
Templeville Area Codes
Income in Templeville
Income Overview in Templeville
| Characteristic | Number | Measure |
| Per Capita Income | 182 | $17,725 |
| Median Family Income | 33 | $0 |
| Mean Family Income | 33 | $63,567 |
| Median Household Income | 36 | $0 |
| Mean Household Income | 36 | $62,458 |
| Income Deficit | 33 | $0 |
| Wage / Income Gap (%) | 182 | 27.71% |
| Wage / Income Gap ($) | 182 | 72.29¢ per $1 |
| Gini / Inequality Index | 182 | 0.34 |
Earnings by Sex in Templeville
Average Earnings in Templeville are $30,313, $33,889 for men and $24,500 for women, a difference of 27.7%.
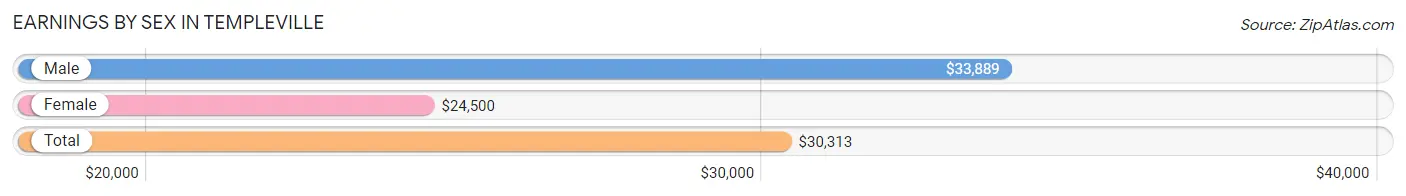
| Sex | Number | Average Earnings |
| Male | 46 (54.8%) | $33,889 |
| Female | 38 (45.2%) | $24,500 |
| Total | 84 (100.0%) | $30,313 |
Earnings by Sex by Income Bracket in Templeville
The most common earnings brackets in Templeville are $15,000 to $17,499 for men (10 | 21.7%) and $22,500 to $24,999 for women (10 | 26.3%).
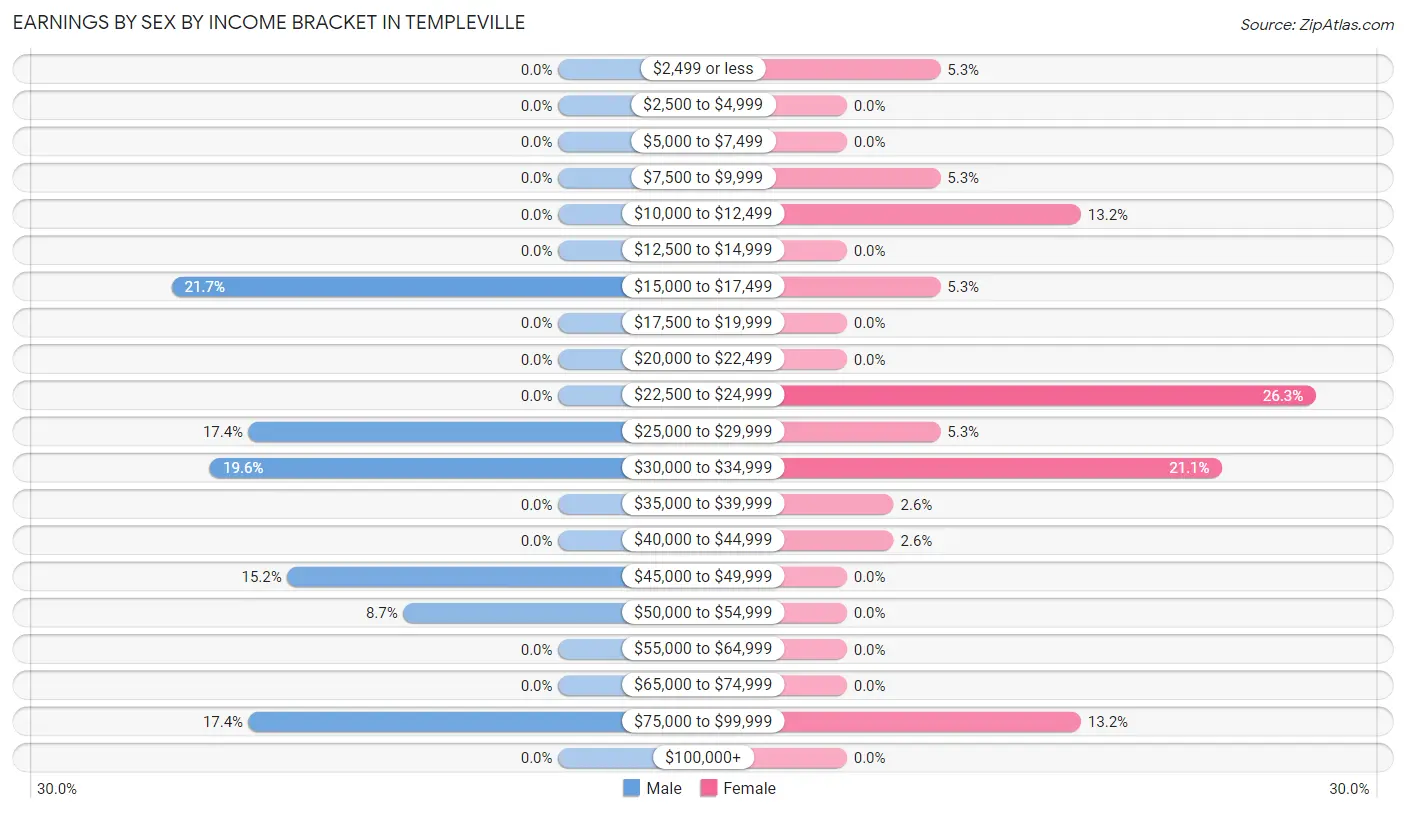
| Income | Male | Female |
| $2,499 or less | 0 (0.0%) | 2 (5.3%) |
| $2,500 to $4,999 | 0 (0.0%) | 0 (0.0%) |
| $5,000 to $7,499 | 0 (0.0%) | 0 (0.0%) |
| $7,500 to $9,999 | 0 (0.0%) | 2 (5.3%) |
| $10,000 to $12,499 | 0 (0.0%) | 5 (13.2%) |
| $12,500 to $14,999 | 0 (0.0%) | 0 (0.0%) |
| $15,000 to $17,499 | 10 (21.7%) | 2 (5.3%) |
| $17,500 to $19,999 | 0 (0.0%) | 0 (0.0%) |
| $20,000 to $22,499 | 0 (0.0%) | 0 (0.0%) |
| $22,500 to $24,999 | 0 (0.0%) | 10 (26.3%) |
| $25,000 to $29,999 | 8 (17.4%) | 2 (5.3%) |
| $30,000 to $34,999 | 9 (19.6%) | 8 (21.0%) |
| $35,000 to $39,999 | 0 (0.0%) | 1 (2.6%) |
| $40,000 to $44,999 | 0 (0.0%) | 1 (2.6%) |
| $45,000 to $49,999 | 7 (15.2%) | 0 (0.0%) |
| $50,000 to $54,999 | 4 (8.7%) | 0 (0.0%) |
| $55,000 to $64,999 | 0 (0.0%) | 0 (0.0%) |
| $65,000 to $74,999 | 0 (0.0%) | 0 (0.0%) |
| $75,000 to $99,999 | 8 (17.4%) | 5 (13.2%) |
| $100,000+ | 0 (0.0%) | 0 (0.0%) |
| Total | 46 (100.0%) | 38 (100.0%) |
Earnings by Sex by Educational Attainment in Templeville
Average earnings in Templeville are $33,889 for men and $24,750 for women, a difference of 27.0%. Men with an educational attainment of high school diploma enjoy the highest average annual earnings of $46,786, while those with high school diploma education earn the least with $46,786. Women with an educational attainment of less than high school earn the most with the average annual earnings of $24,125, while those with less than high school education have the smallest earnings of $24,125.
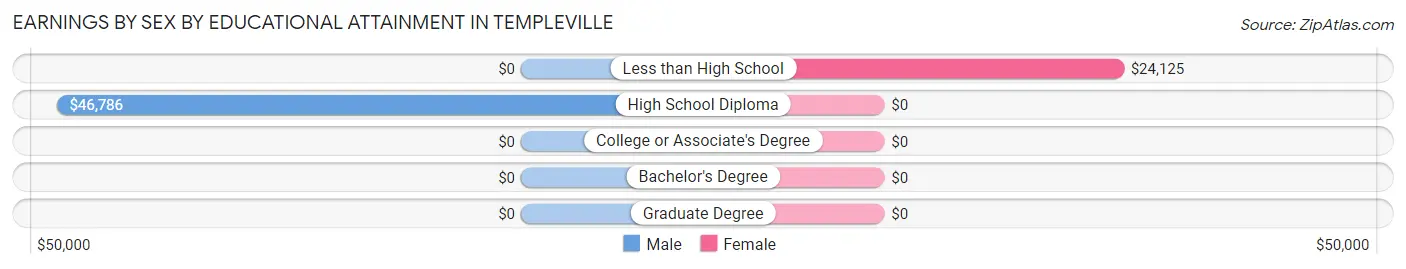
| Educational Attainment | Male Income | Female Income |
| Less than High School | - | - |
| High School Diploma | $46,786 | $0 |
| College or Associate's Degree | - | - |
| Bachelor's Degree | - | - |
| Graduate Degree | - | - |
| Total | $33,889 | $24,750 |
Family Income in Templeville
Family Income Brackets in Templeville
According to the Templeville family income data, there are 9 families falling into the $25,000 to $34,999 income range, which is the most common income bracket and makes up 27.3% of all families.
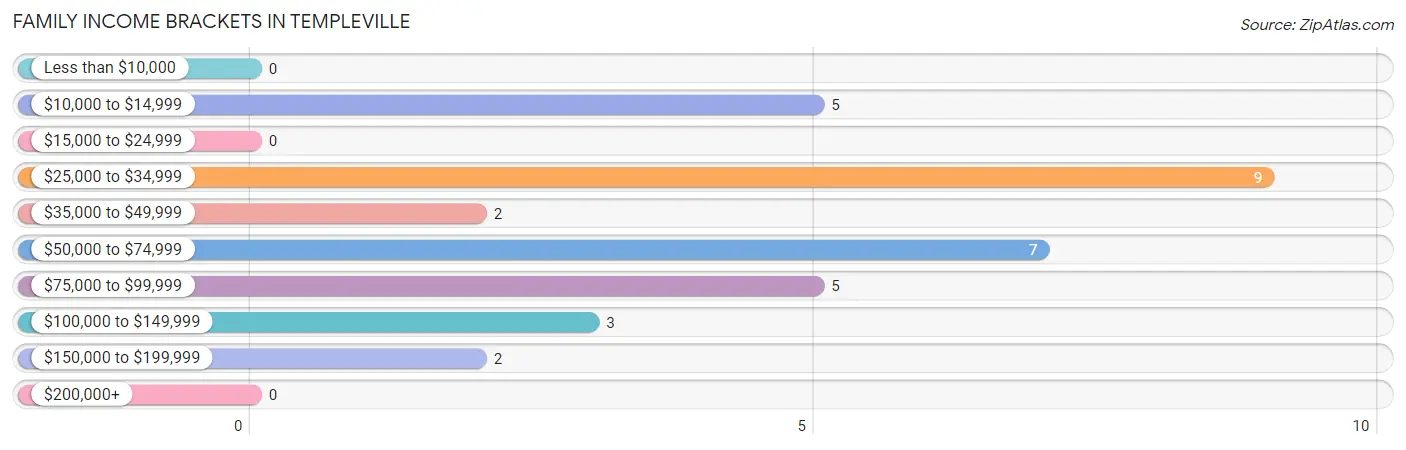
| Income Bracket | # Families | % Families |
| Less than $10,000 | 0 | 0.0% |
| $10,000 to $14,999 | 5 | 15.2% |
| $15,000 to $24,999 | 0 | 0.0% |
| $25,000 to $34,999 | 9 | 27.3% |
| $35,000 to $49,999 | 2 | 6.1% |
| $50,000 to $74,999 | 7 | 21.2% |
| $75,000 to $99,999 | 5 | 15.2% |
| $100,000 to $149,999 | 3 | 9.1% |
| $150,000 to $199,999 | 2 | 6.1% |
| $200,000+ | 0 | 0.0% |
Family Income by Famaliy Size in Templeville
5-person families (16 | 48.5%) account for the highest median family income in Templeville with $83,125 per family, while 5-person families (16 | 48.5%) have the highest median income of $16,625 per family member.
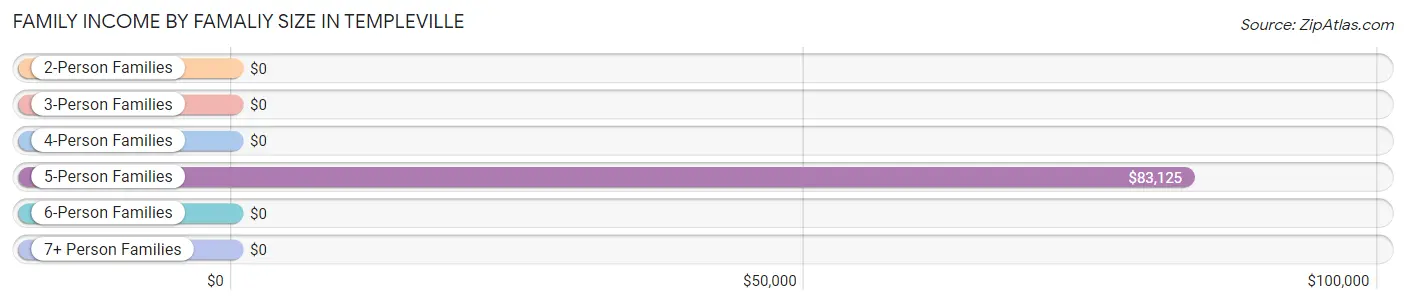
| Income Bracket | # Families | Median Income |
| 2-Person Families | 6 (18.2%) | $0 |
| 3-Person Families | 2 (6.1%) | $0 |
| 4-Person Families | 0 (0.0%) | $0 |
| 5-Person Families | 16 (48.5%) | $83,125 |
| 6-Person Families | 9 (27.3%) | $0 |
| 7+ Person Families | 0 (0.0%) | $0 |
| Total | 33 (100.0%) | $0 |
Family Income by Number of Earners in Templeville
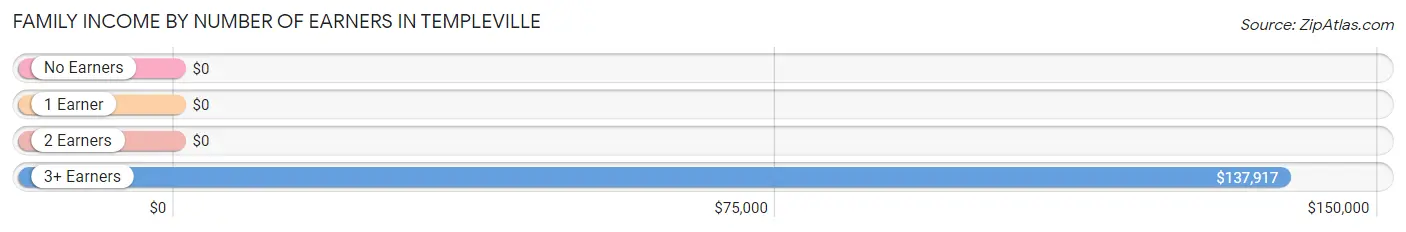
| Number of Earners | # Families | Median Income |
| No Earners | 0 (0.0%) | $0 |
| 1 Earner | 15 (45.5%) | $0 |
| 2 Earners | 9 (27.3%) | $0 |
| 3+ Earners | 9 (27.3%) | $137,917 |
| Total | 33 (100.0%) | $0 |
Household Income in Templeville
Household Income Brackets in Templeville
With 14 households falling in the category, the $25,000 to $34,999 income range is the most frequent in Templeville, accounting for 38.9% of all households.
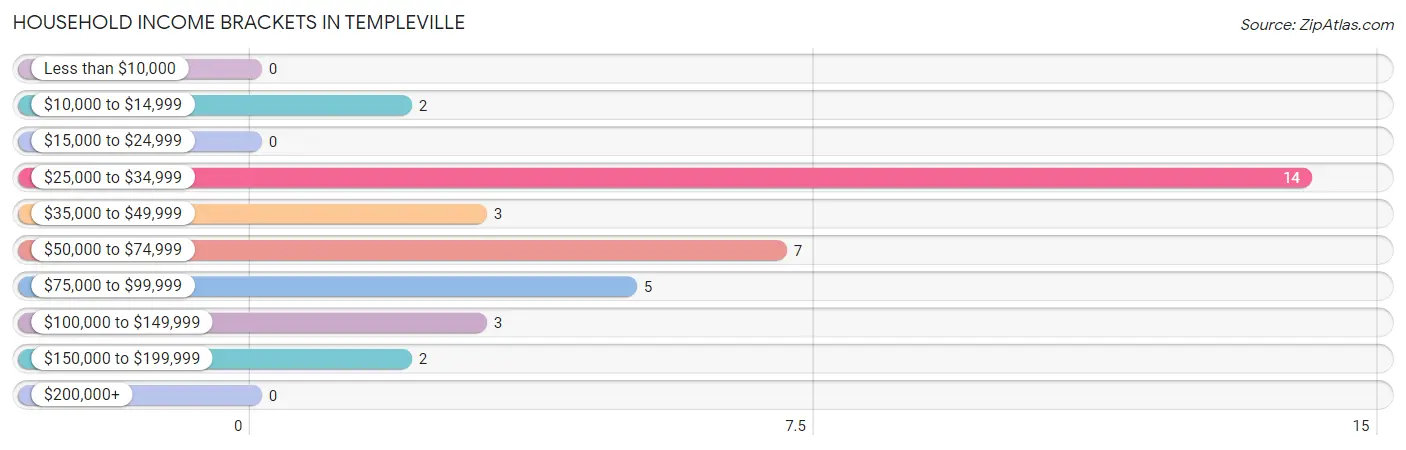
| Income Bracket | # Households | % Households |
| Less than $10,000 | 0 | 0.0% |
| $10,000 to $14,999 | 2 | 5.6% |
| $15,000 to $24,999 | 0 | 0.0% |
| $25,000 to $34,999 | 14 | 38.9% |
| $35,000 to $49,999 | 3 | 8.3% |
| $50,000 to $74,999 | 7 | 19.4% |
| $75,000 to $99,999 | 5 | 13.9% |
| $100,000 to $149,999 | 3 | 8.3% |
| $150,000 to $199,999 | 2 | 5.6% |
| $200,000+ | 0 | 0.0% |
Household Income by Householder Age in Templeville
| Income Bracket | # Households | Median Income |
| 15 to 24 Years | 0 (0.0%) | $0 |
| 25 to 44 Years | 5 (13.9%) | $0 |
| 45 to 64 Years | 27 (75.0%) | $0 |
| 65+ Years | 4 (11.1%) | $0 |
| Total | 36 (100.0%) | $0 |
Poverty in Templeville
Income Below Poverty by Sex and Age in Templeville
With 30.0% poverty level for males and 34.3% for females among the residents of Templeville, under 5 year old males and 12 to 14 year old females are the most vulnerable to poverty, with 15 males (71.4%) and 18 females (100.0%) in their respective age groups living below the poverty level.
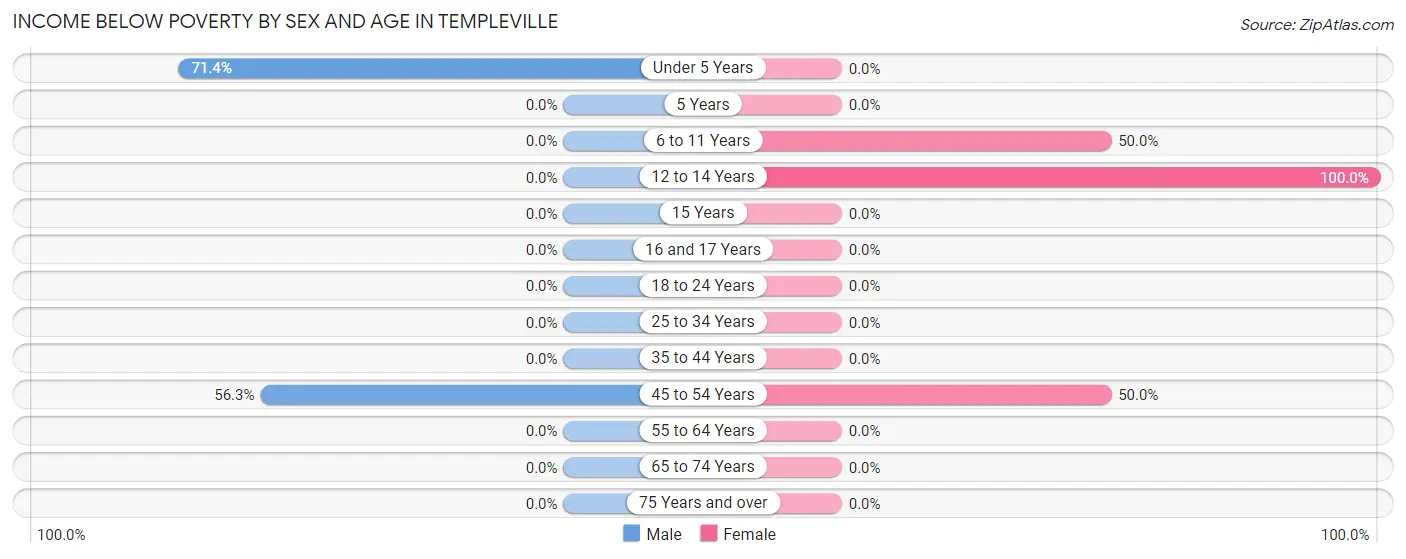
| Age Bracket | Male | Female |
| Under 5 Years | 15 (71.4%) | 0 (0.0%) |
| 5 Years | 0 (0.0%) | 0 (0.0%) |
| 6 to 11 Years | 0 (0.0%) | 6 (50.0%) |
| 12 to 14 Years | 0 (0.0%) | 18 (100.0%) |
| 15 Years | 0 (0.0%) | 0 (0.0%) |
| 16 and 17 Years | 0 (0.0%) | 0 (0.0%) |
| 18 to 24 Years | 0 (0.0%) | 0 (0.0%) |
| 25 to 34 Years | 0 (0.0%) | 0 (0.0%) |
| 35 to 44 Years | 0 (0.0%) | 0 (0.0%) |
| 45 to 54 Years | 9 (56.2%) | 11 (50.0%) |
| 55 to 64 Years | 0 (0.0%) | 0 (0.0%) |
| 65 to 74 Years | 0 (0.0%) | 0 (0.0%) |
| 75 Years and over | 0 (0.0%) | 0 (0.0%) |
| Total | 24 (30.0%) | 35 (34.3%) |
Income Above Poverty by Sex and Age in Templeville
According to the poverty statistics in Templeville, males aged 6 to 11 years and females aged under 5 years are the age groups that are most secure financially, with 100.0% of males and 100.0% of females in these age groups living above the poverty line.
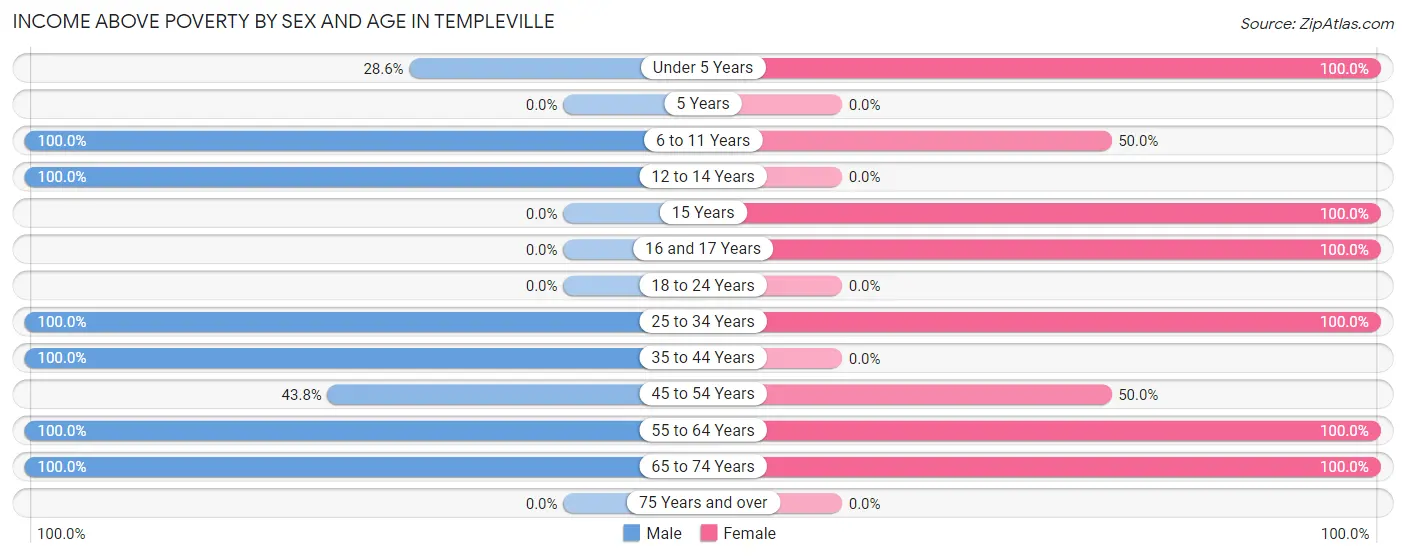
| Age Bracket | Male | Female |
| Under 5 Years | 6 (28.6%) | 11 (100.0%) |
| 5 Years | 0 (0.0%) | 0 (0.0%) |
| 6 to 11 Years | 7 (100.0%) | 6 (50.0%) |
| 12 to 14 Years | 5 (100.0%) | 0 (0.0%) |
| 15 Years | 0 (0.0%) | 3 (100.0%) |
| 16 and 17 Years | 0 (0.0%) | 2 (100.0%) |
| 18 to 24 Years | 0 (0.0%) | 0 (0.0%) |
| 25 to 34 Years | 8 (100.0%) | 26 (100.0%) |
| 35 to 44 Years | 10 (100.0%) | 0 (0.0%) |
| 45 to 54 Years | 7 (43.8%) | 11 (50.0%) |
| 55 to 64 Years | 12 (100.0%) | 4 (100.0%) |
| 65 to 74 Years | 1 (100.0%) | 4 (100.0%) |
| 75 Years and over | 0 (0.0%) | 0 (0.0%) |
| Total | 56 (70.0%) | 67 (65.7%) |
Income Below Poverty Among Married-Couple Families in Templeville
The poverty statistics for married-couple families in Templeville show that 37.5% or 9 of the total 24 families live below the poverty line. Families with 3 or 4 children have the highest poverty rate of 100.0%, comprising of 9 families. On the other hand, families with no children have the lowest poverty rate of 0.0%, which includes 0 families.
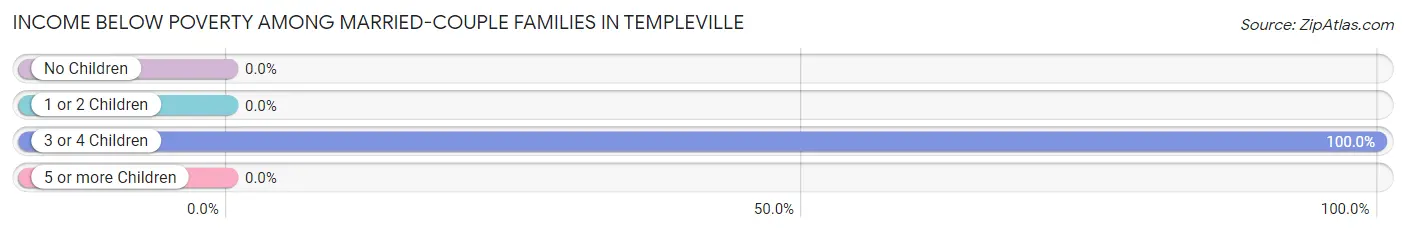
| Children | Above Poverty | Below Poverty |
| No Children | 1 (100.0%) | 0 (0.0%) |
| 1 or 2 Children | 14 (100.0%) | 0 (0.0%) |
| 3 or 4 Children | 0 (0.0%) | 9 (100.0%) |
| 5 or more Children | 0 (0.0%) | 0 (0.0%) |
| Total | 15 (62.5%) | 9 (37.5%) |
Income Below Poverty Among Single-Parent Households in Templeville
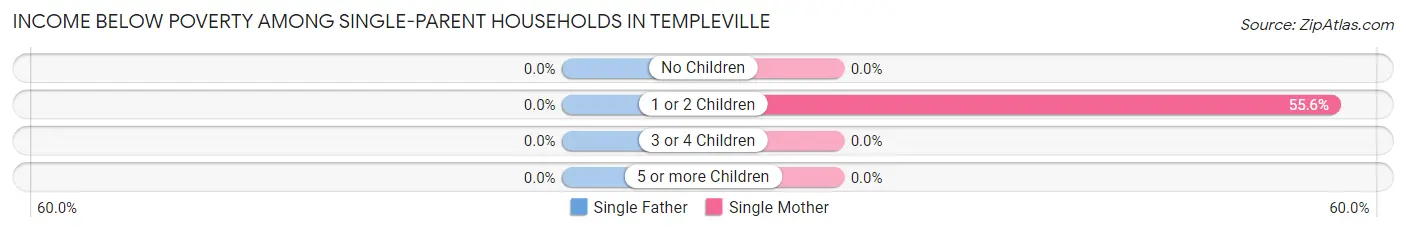
| Children | Single Father | Single Mother |
| No Children | 0 (0.0%) | 0 (0.0%) |
| 1 or 2 Children | 0 (0.0%) | 5 (55.6%) |
| 3 or 4 Children | 0 (0.0%) | 0 (0.0%) |
| 5 or more Children | 0 (0.0%) | 0 (0.0%) |
| Total | 0 (0.0%) | 5 (55.6%) |
Income Below Poverty Among Married-Couple vs Single-Parent Households in Templeville
The poverty data for Templeville shows that 9 of the married-couple family households (37.5%) and 5 of the single-parent households (55.6%) are living below the poverty level. Within the married-couple family households, those with 3 or 4 children have the highest poverty rate, with 9 households (100.0%) falling below the poverty line. Among the single-parent households, those with 1 or 2 children have the highest poverty rate, with 5 household (55.6%) living below poverty.
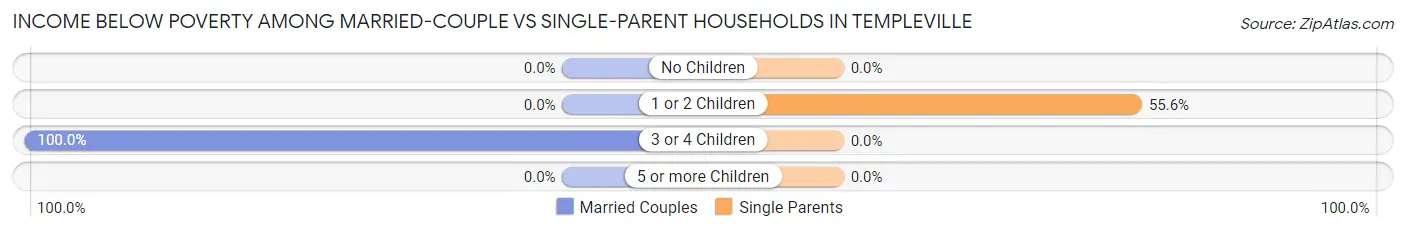
| Children | Married-Couple Families | Single-Parent Households |
| No Children | 0 (0.0%) | 0 (0.0%) |
| 1 or 2 Children | 0 (0.0%) | 5 (55.6%) |
| 3 or 4 Children | 9 (100.0%) | 0 (0.0%) |
| 5 or more Children | 0 (0.0%) | 0 (0.0%) |
| Total | 9 (37.5%) | 5 (55.6%) |
Race in Templeville
The most populous races in Templeville are Hispanic or Latino (159 | 87.4%), Some other Race (123 | 67.6%), and White / Caucasian (45 | 24.7%).
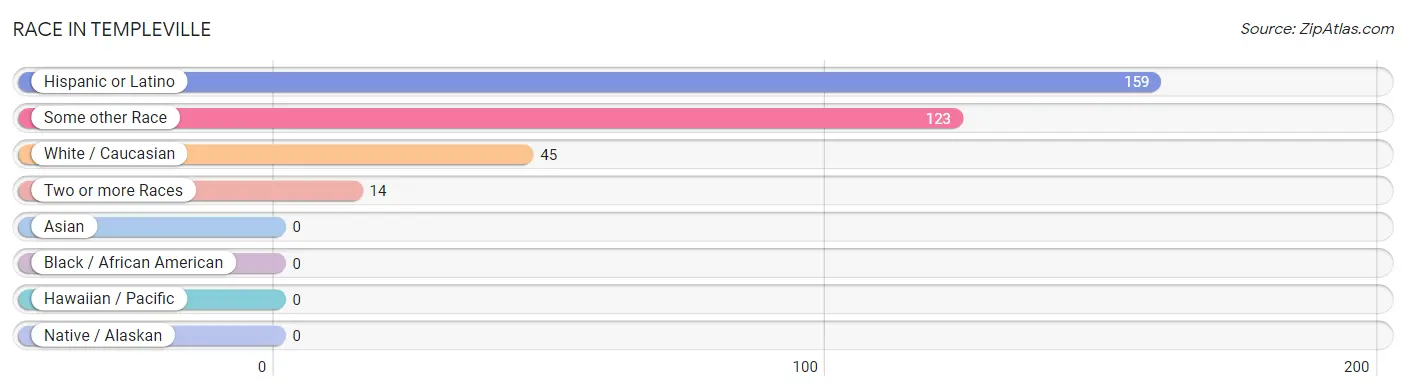
| Race | # Population | % Population |
| Asian | 0 | 0.0% |
| Black / African American | 0 | 0.0% |
| Hawaiian / Pacific | 0 | 0.0% |
| Hispanic or Latino | 159 | 87.4% |
| Native / Alaskan | 0 | 0.0% |
| White / Caucasian | 45 | 24.7% |
| Two or more Races | 14 | 7.7% |
| Some other Race | 123 | 67.6% |
| Total | 182 | 100.0% |
Ancestry in Templeville
The most populous ancestries reported in Templeville are Central American (105 | 57.7%), Guatemalan (84 | 46.2%), Mexican (54 | 29.7%), and Salvadoran (21 | 11.5%), together accounting for 145.0% of all Templeville residents.
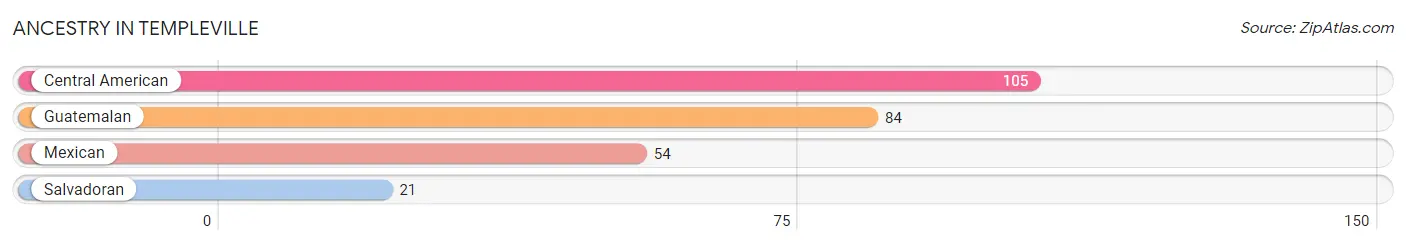
| Ancestry | # Population | % Population |
| Central American | 105 | 57.7% |
| Guatemalan | 84 | 46.2% |
| Mexican | 54 | 29.7% |
| Salvadoran | 21 | 11.5% | View All 4 Rows |
Immigrants in Templeville
The most numerous immigrant groups reported in Templeville came from Central America (106 | 58.2%), Latin America (106 | 58.2%), Guatemala (68 | 37.4%), and Mexico (38 | 20.9%), together accounting for 174.7% of all Templeville residents.
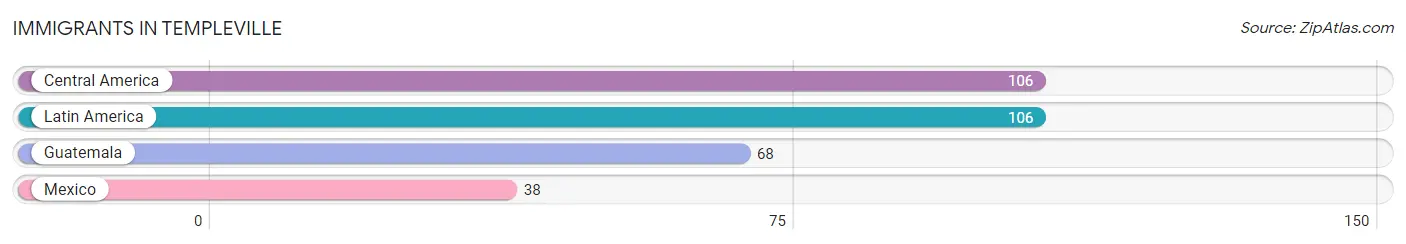
| Immigration Origin | # Population | % Population |
| Central America | 106 | 58.2% |
| Guatemala | 68 | 37.4% |
| Latin America | 106 | 58.2% |
| Mexico | 38 | 20.9% | View All 4 Rows |
Sex and Age in Templeville
Sex and Age in Templeville
The most populous age groups in Templeville are Under 5 Years (21 | 26.3%) for men and 10 to 14 Years (18 | 17.6%) for women.
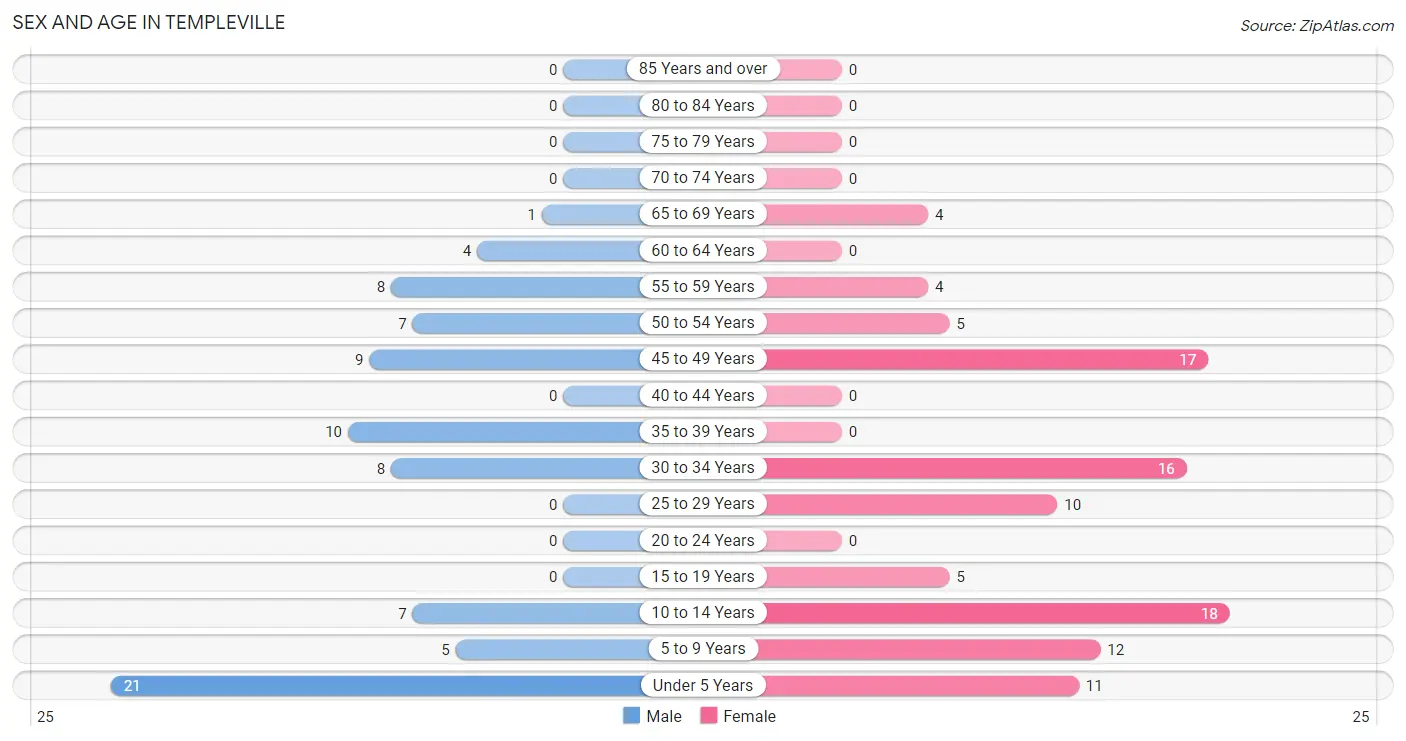
| Age Bracket | Male | Female |
| Under 5 Years | 21 (26.3%) | 11 (10.8%) |
| 5 to 9 Years | 5 (6.2%) | 12 (11.8%) |
| 10 to 14 Years | 7 (8.7%) | 18 (17.6%) |
| 15 to 19 Years | 0 (0.0%) | 5 (4.9%) |
| 20 to 24 Years | 0 (0.0%) | 0 (0.0%) |
| 25 to 29 Years | 0 (0.0%) | 10 (9.8%) |
| 30 to 34 Years | 8 (10.0%) | 16 (15.7%) |
| 35 to 39 Years | 10 (12.5%) | 0 (0.0%) |
| 40 to 44 Years | 0 (0.0%) | 0 (0.0%) |
| 45 to 49 Years | 9 (11.3%) | 17 (16.7%) |
| 50 to 54 Years | 7 (8.7%) | 5 (4.9%) |
| 55 to 59 Years | 8 (10.0%) | 4 (3.9%) |
| 60 to 64 Years | 4 (5.0%) | 0 (0.0%) |
| 65 to 69 Years | 1 (1.3%) | 4 (3.9%) |
| 70 to 74 Years | 0 (0.0%) | 0 (0.0%) |
| 75 to 79 Years | 0 (0.0%) | 0 (0.0%) |
| 80 to 84 Years | 0 (0.0%) | 0 (0.0%) |
| 85 Years and over | 0 (0.0%) | 0 (0.0%) |
| Total | 80 (100.0%) | 102 (100.0%) |
Families and Households in Templeville
Median Family Size in Templeville
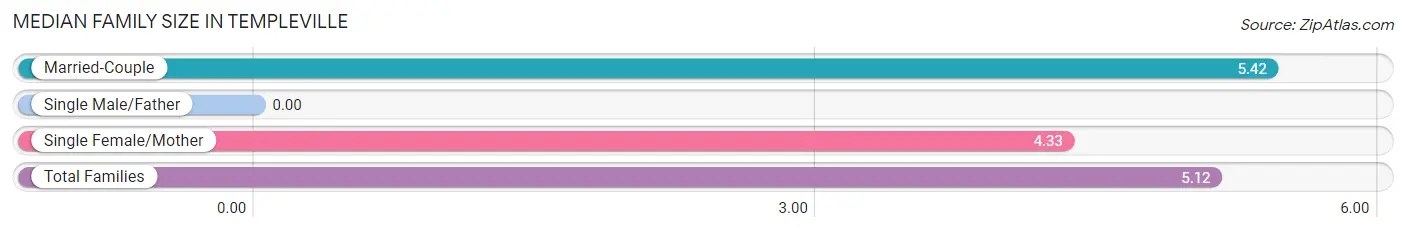
| Family Type | # Families | Family Size |
| Married-Couple | 24 (72.7%) | 5.42 |
| Single Male/Father | 0 (0.0%) | - |
| Single Female/Mother | 9 (27.3%) | 4.33 |
| Total Families | 33 (100.0%) | 5.12 |
Median Household Size in Templeville
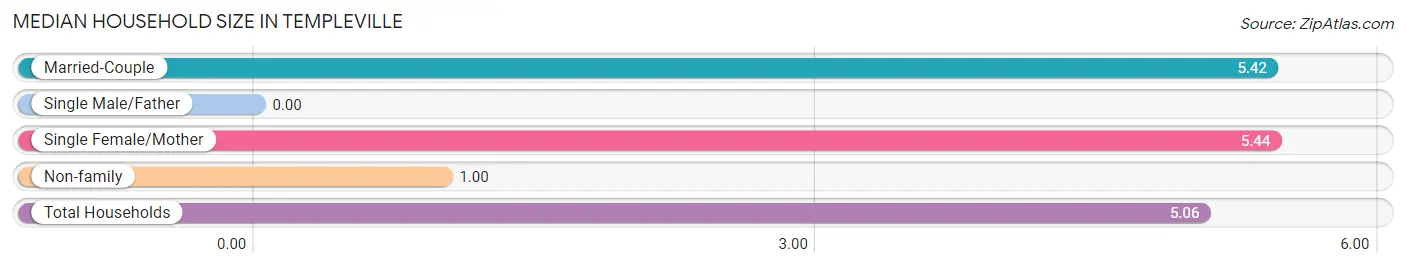
| Household Type | # Households | Household Size |
| Married-Couple | 24 (66.7%) | 5.42 |
| Single Male/Father | 0 (0.0%) | - |
| Single Female/Mother | 9 (25.0%) | 5.44 |
| Non-family | 3 (8.3%) | 1.00 |
| Total Households | 36 (100.0%) | 5.06 |
Household Size by Marriage Status in Templeville
Out of a total of 36 households in Templeville, 33 (91.7%) are family households, while 3 (8.3%) are nonfamily households. The most numerous type of family households are 5-person households, comprising 16, and the most common type of nonfamily households are 1-person households, comprising 3.
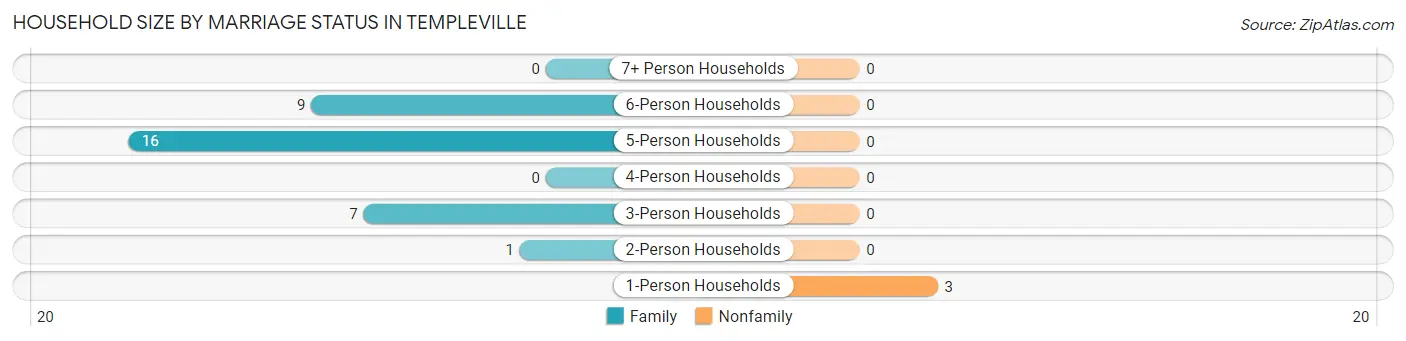
| Household Size | Family Households | Nonfamily Households |
| 1-Person Households | - | 3 (8.3%) |
| 2-Person Households | 1 (2.8%) | 0 (0.0%) |
| 3-Person Households | 7 (19.4%) | 0 (0.0%) |
| 4-Person Households | 0 (0.0%) | 0 (0.0%) |
| 5-Person Households | 16 (44.4%) | 0 (0.0%) |
| 6-Person Households | 9 (25.0%) | 0 (0.0%) |
| 7+ Person Households | 0 (0.0%) | 0 (0.0%) |
| Total | 33 (91.7%) | 3 (8.3%) |
Female Fertility in Templeville
Fertility by Age in Templeville
| Age Bracket | Women with Births | Births / 1,000 Women |
| 15 to 19 years | 0 (0.0%) | 0.0 |
| 20 to 34 years | 0 (0.0%) | 0.0 |
| 35 to 50 years | 0 (0.0%) | 0.0 |
| Total | 0 (0.0%) | 0.0 |
Fertility by Age by Marriage Status in Templeville
| Age Bracket | Married | Unmarried |
| 15 to 19 years | 0 (0.0%) | 0 (0.0%) |
| 20 to 34 years | 0 (0.0%) | 0 (0.0%) |
| 35 to 50 years | 0 (0.0%) | 0 (0.0%) |
| Total | 0 (0.0%) | 0 (0.0%) |
Fertility by Education in Templeville
| Educational Attainment | Women with Births | Births / 1,000 Women |
| Less than High School | 0 (0.0%) | 0.0 |
| High School Diploma | 0 (0.0%) | 0.0 |
| College or Associate's Degree | 0 (0.0%) | 0.0 |
| Bachelor's Degree | 0 (0.0%) | 0.0 |
| Graduate Degree | 0 (0.0%) | 0.0 |
| Total | 0 (0.0%) | 0.0 |
Fertility by Education by Marriage Status in Templeville
| Educational Attainment | Married | Unmarried |
| Less than High School | 0 (0.0%) | 0 (0.0%) |
| High School Diploma | 0 (0.0%) | 0 (0.0%) |
| College or Associate's Degree | 0 (0.0%) | 0 (0.0%) |
| Bachelor's Degree | 0 (0.0%) | 0 (0.0%) |
| Graduate Degree | 0 (0.0%) | 0 (0.0%) |
| Total | 0 (0.0%) | 0 (0.0%) |
Employment Characteristics in Templeville
Employment by Class of Employer in Templeville
Among the 72 employed individuals in Templeville, private company employees (62 | 86.1%), self-employed (not incorporated) (9 | 12.5%), and state government employees (1 | 1.4%) make up the most common classes of employment.
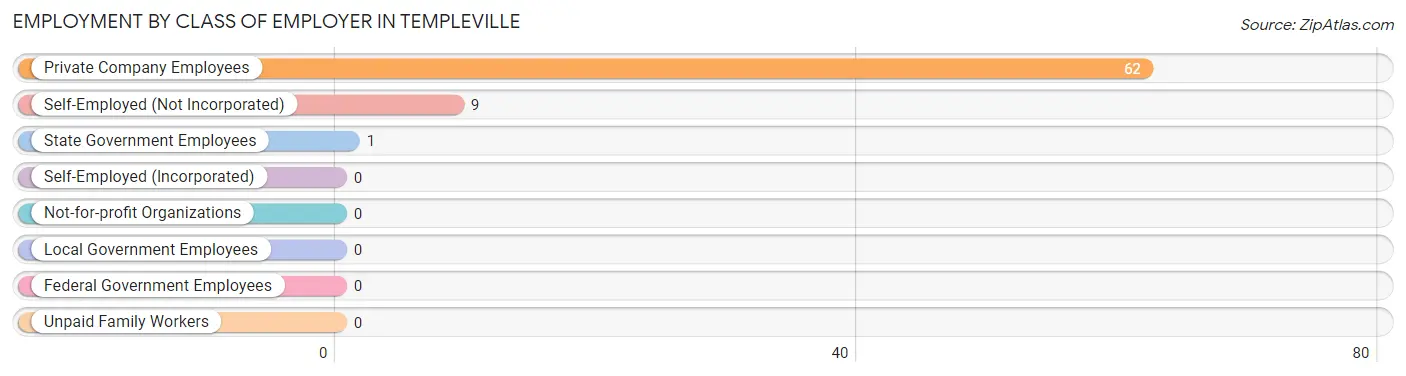
| Employer Class | # Employees | % Employees |
| Private Company Employees | 62 | 86.1% |
| Self-Employed (Incorporated) | 0 | 0.0% |
| Self-Employed (Not Incorporated) | 9 | 12.5% |
| Not-for-profit Organizations | 0 | 0.0% |
| Local Government Employees | 0 | 0.0% |
| State Government Employees | 1 | 1.4% |
| Federal Government Employees | 0 | 0.0% |
| Unpaid Family Workers | 0 | 0.0% |
| Total | 72 | 100.0% |
Employment Status by Age in Templeville
According to the labor force statistics for Templeville, out of the total population over 16 years of age (105), 81.9% or 86 individuals are in the labor force, with 16.3% or 14 of them unemployed. The age group with the highest labor force participation rate is 16 to 19 years, with 100.0% or 2 individuals in the labor force. Within the labor force, the 35 to 44 years age range has the highest percentage of unemployed individuals, with 100.0% or 10 of them being unemployed.
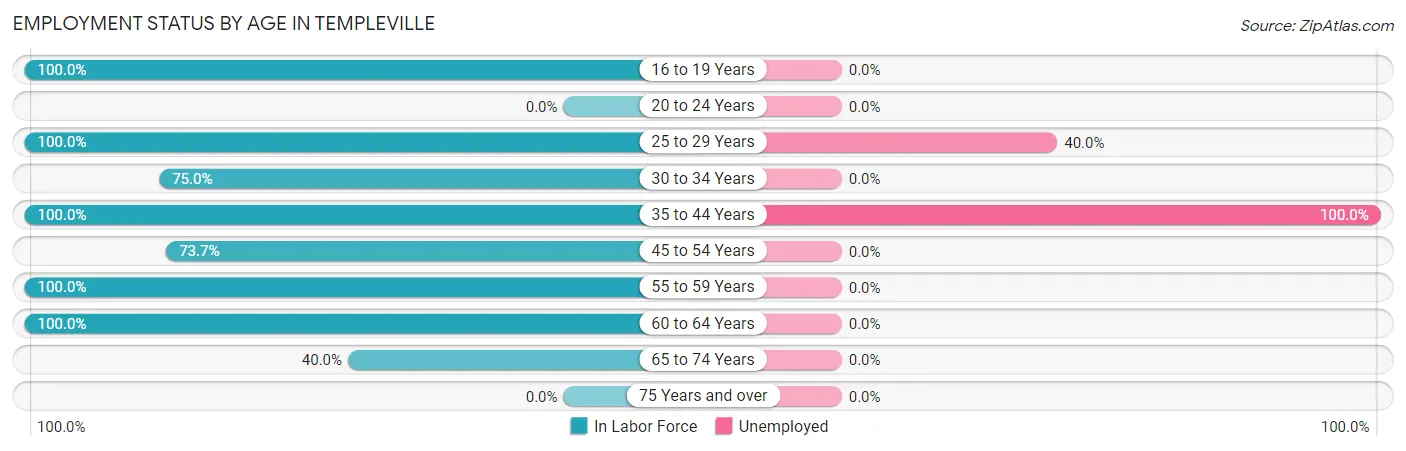
| Age Bracket | In Labor Force | Unemployed |
| 16 to 19 Years | 2 (100.0%) | 0 (0.0%) |
| 20 to 24 Years | 0 (0.0%) | 0 (0.0%) |
| 25 to 29 Years | 10 (100.0%) | 4 (40.0%) |
| 30 to 34 Years | 18 (75.0%) | 0 (0.0%) |
| 35 to 44 Years | 10 (100.0%) | 10 (100.0%) |
| 45 to 54 Years | 28 (73.7%) | 0 (0.0%) |
| 55 to 59 Years | 12 (100.0%) | 0 (0.0%) |
| 60 to 64 Years | 4 (100.0%) | 0 (0.0%) |
| 65 to 74 Years | 2 (40.0%) | 0 (0.0%) |
| 75 Years and over | 0 (0.0%) | 0 (0.0%) |
| Total | 86 (81.9%) | 14 (16.3%) |
Employment Status by Educational Attainment in Templeville
According to labor force statistics for Templeville, 83.7% of individuals (82) out of the total population between 25 and 64 years of age (98) are in the labor force, with 17.1% or 14 of them being unemployed. The group with the highest labor force participation rate are those with the educational attainment of college / associate degree, with 100.0% or 6 individuals in the labor force. Within the labor force, individuals with college / associate degree education have the highest percentage of unemployment, with 66.7% or 4 of them being unemployed.
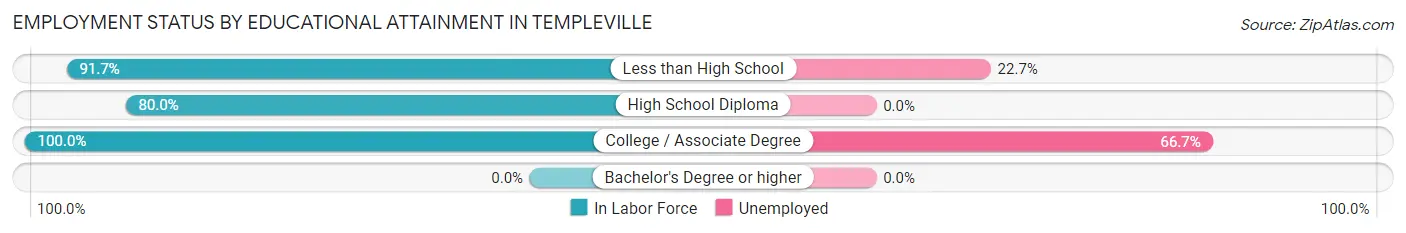
| Educational Attainment | In Labor Force | Unemployed |
| Less than High School | 44 (91.7%) | 11 (22.7%) |
| High School Diploma | 32 (80.0%) | 0 (0.0%) |
| College / Associate Degree | 6 (100.0%) | 4 (66.7%) |
| Bachelor's Degree or higher | 0 (0.0%) | 0 (0.0%) |
| Total | 82 (83.7%) | 17 (17.1%) |
Employment Occupations by Sex in Templeville
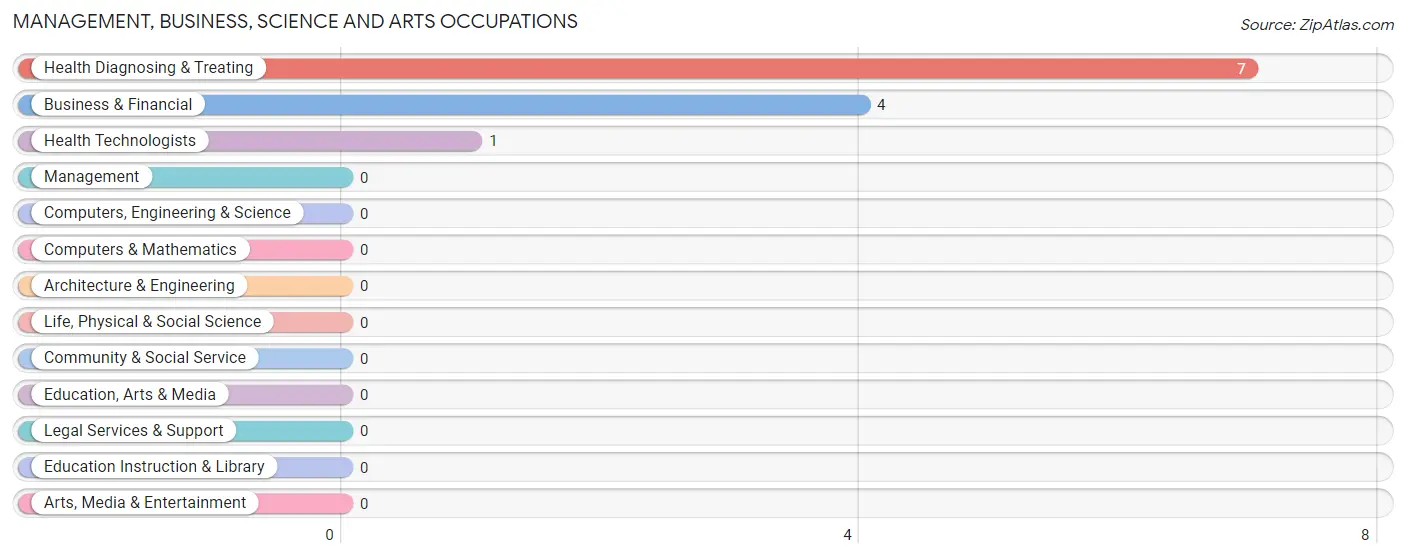
Management, Business, Science and Arts Occupations
The most common Management, Business, Science and Arts occupations in Templeville are Health Diagnosing & Treating (7 | 9.7%), Business & Financial (4 | 5.6%), and Health Technologists (1 | 1.4%).
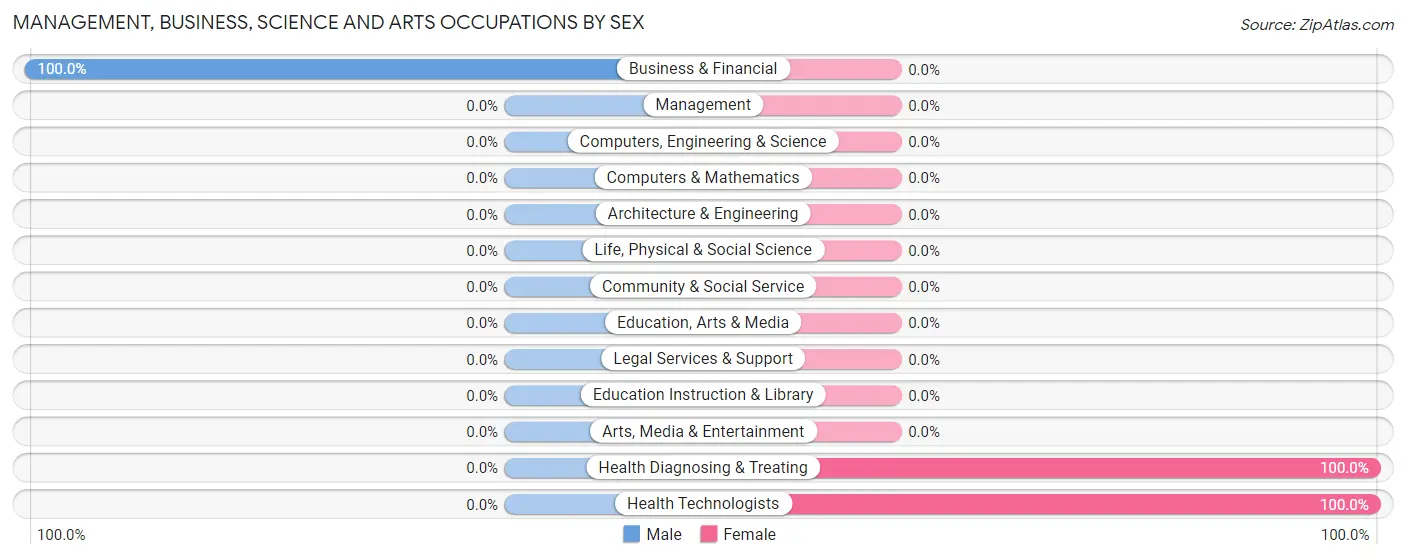
Management, Business, Science and Arts Occupations by Sex
| Occupation | Male | Female |
| Management | 0 (0.0%) | 0 (0.0%) |
| Business & Financial | 4 (100.0%) | 0 (0.0%) |
| Computers, Engineering & Science | 0 (0.0%) | 0 (0.0%) |
| Computers & Mathematics | 0 (0.0%) | 0 (0.0%) |
| Architecture & Engineering | 0 (0.0%) | 0 (0.0%) |
| Life, Physical & Social Science | 0 (0.0%) | 0 (0.0%) |
| Community & Social Service | 0 (0.0%) | 0 (0.0%) |
| Education, Arts & Media | 0 (0.0%) | 0 (0.0%) |
| Legal Services & Support | 0 (0.0%) | 0 (0.0%) |
| Education Instruction & Library | 0 (0.0%) | 0 (0.0%) |
| Arts, Media & Entertainment | 0 (0.0%) | 0 (0.0%) |
| Health Diagnosing & Treating | 0 (0.0%) | 7 (100.0%) |
| Health Technologists | 0 (0.0%) | 1 (100.0%) |
| Total (Category) | 4 (36.4%) | 7 (63.6%) |
| Total (Overall) | 36 (50.0%) | 36 (50.0%) |
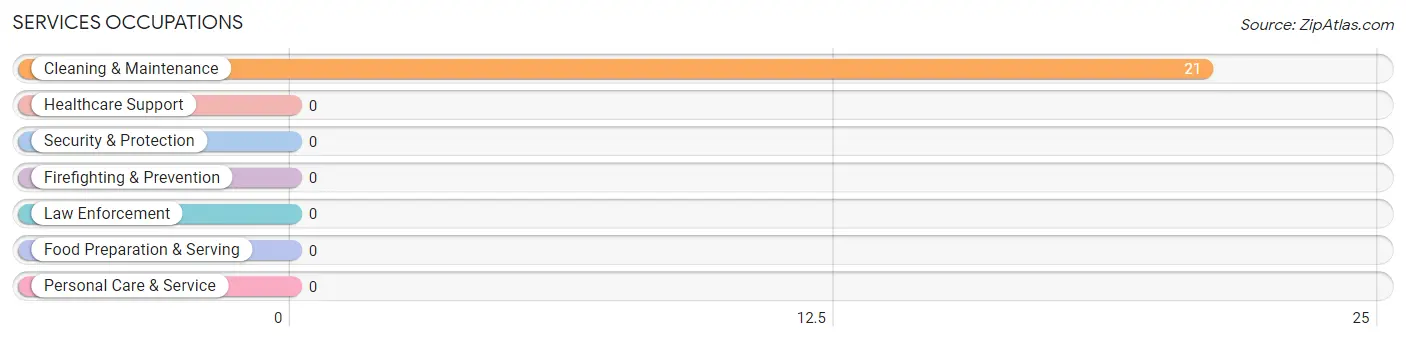
Services Occupations
The most common Services occupations in Templeville are , and Cleaning & Maintenance (21 | 29.2%).
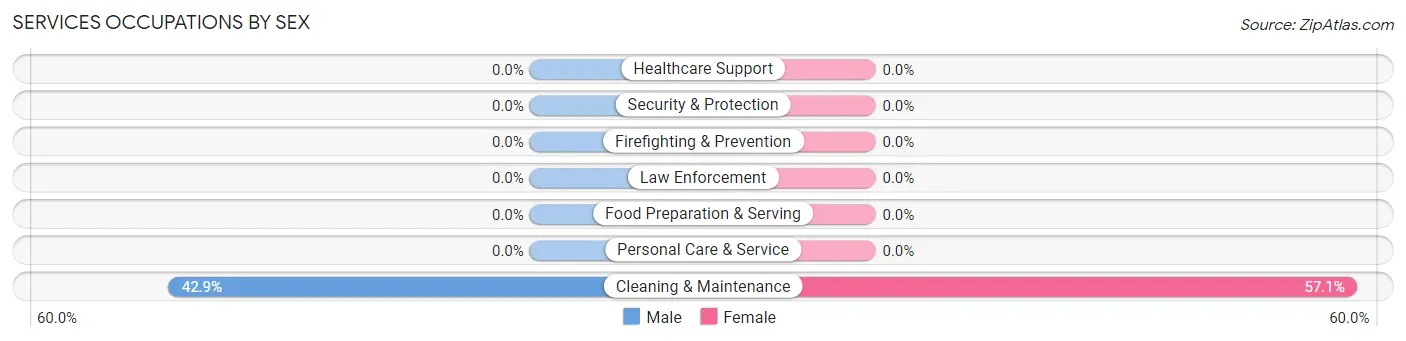
Services Occupations by Sex
| Occupation | Male | Female |
| Healthcare Support | 0 (0.0%) | 0 (0.0%) |
| Security & Protection | 0 (0.0%) | 0 (0.0%) |
| Firefighting & Prevention | 0 (0.0%) | 0 (0.0%) |
| Law Enforcement | 0 (0.0%) | 0 (0.0%) |
| Food Preparation & Serving | 0 (0.0%) | 0 (0.0%) |
| Cleaning & Maintenance | 9 (42.9%) | 12 (57.1%) |
| Personal Care & Service | 0 (0.0%) | 0 (0.0%) |
| Total (Category) | 9 (42.9%) | 12 (57.1%) |
| Total (Overall) | 36 (50.0%) | 36 (50.0%) |
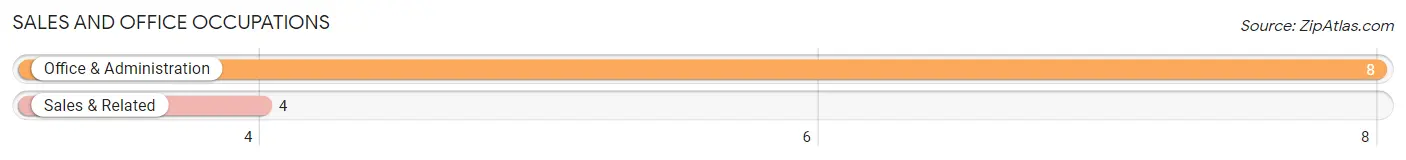
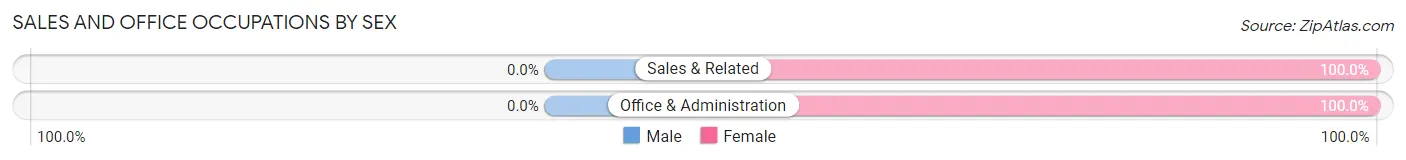
Sales and Office Occupations
The most common Sales and Office occupations in Templeville are Office & Administration (8 | 11.1%), and Sales & Related (4 | 5.6%).
Sales and Office Occupations by Sex
| Occupation | Male | Female |
| Sales & Related | 0 (0.0%) | 4 (100.0%) |
| Office & Administration | 0 (0.0%) | 8 (100.0%) |
| Total (Category) | 0 (0.0%) | 12 (100.0%) |
| Total (Overall) | 36 (50.0%) | 36 (50.0%) |
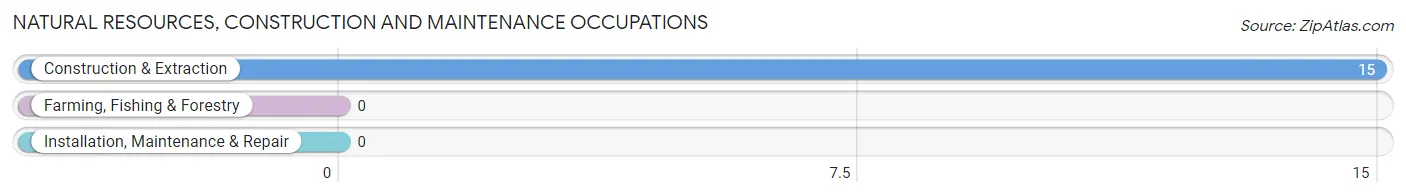
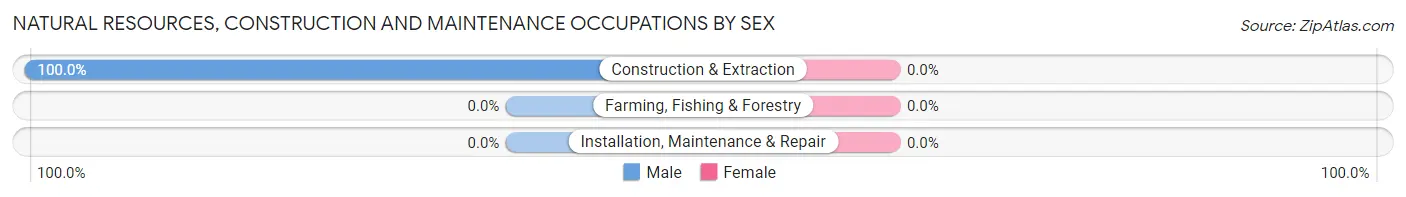
Natural Resources, Construction and Maintenance Occupations
The most common Natural Resources, Construction and Maintenance occupations in Templeville are , and Construction & Extraction (15 | 20.8%).
Natural Resources, Construction and Maintenance Occupations by Sex
| Occupation | Male | Female |
| Farming, Fishing & Forestry | 0 (0.0%) | 0 (0.0%) |
| Construction & Extraction | 15 (100.0%) | 0 (0.0%) |
| Installation, Maintenance & Repair | 0 (0.0%) | 0 (0.0%) |
| Total (Category) | 15 (100.0%) | 0 (0.0%) |
| Total (Overall) | 36 (50.0%) | 36 (50.0%) |
Production, Transportation and Moving Occupations
The most common Production, Transportation and Moving occupations in Templeville are Production (5 | 6.9%), Transportation (5 | 6.9%), and Material Moving (3 | 4.2%).
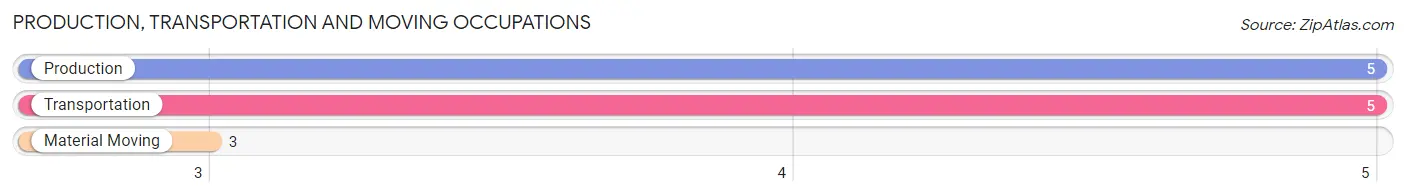
Production, Transportation and Moving Occupations by Sex
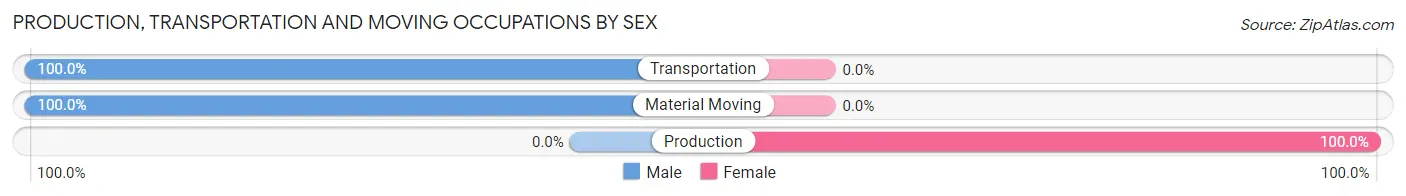
| Occupation | Male | Female |
| Production | 0 (0.0%) | 5 (100.0%) |
| Transportation | 5 (100.0%) | 0 (0.0%) |
| Material Moving | 3 (100.0%) | 0 (0.0%) |
| Total (Category) | 8 (61.5%) | 5 (38.5%) |
| Total (Overall) | 36 (50.0%) | 36 (50.0%) |
Employment Industries by Sex in Templeville
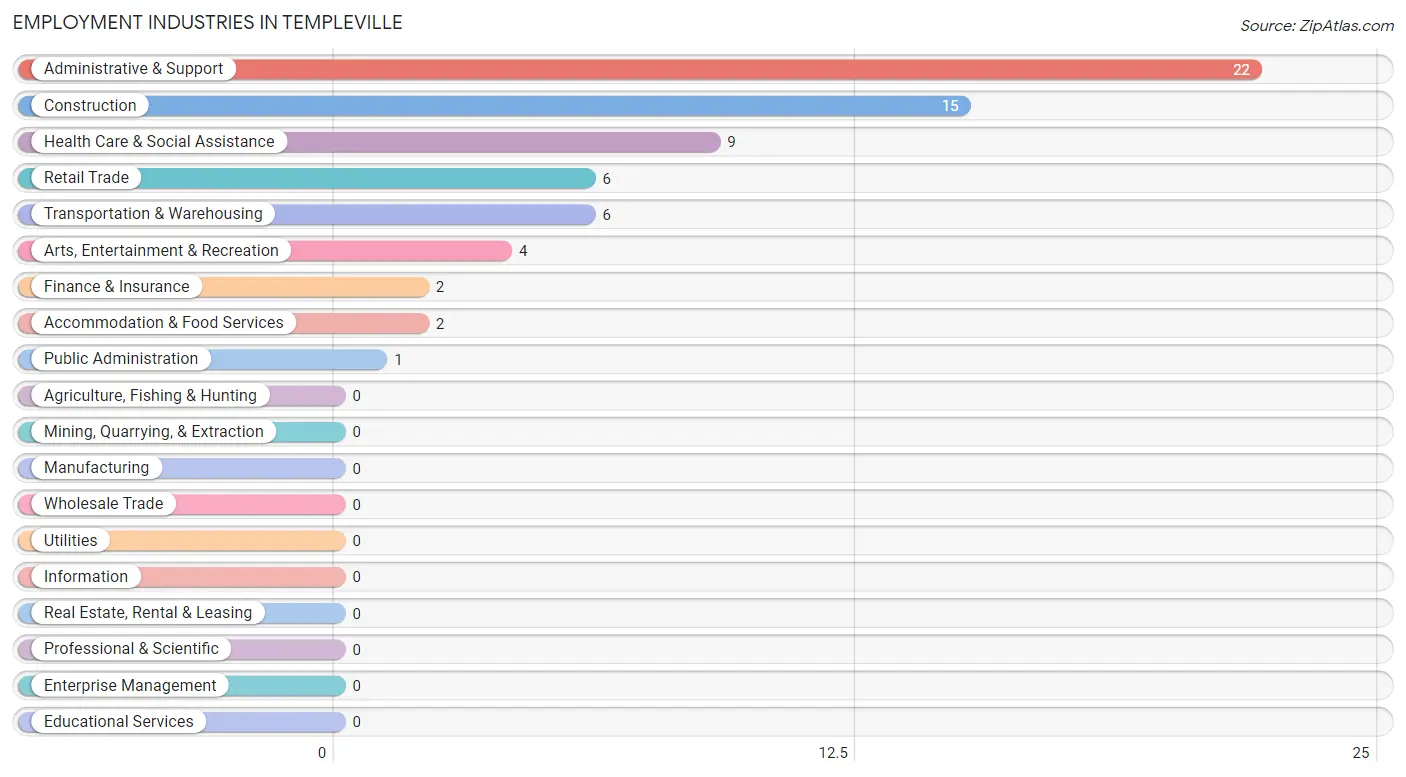
Employment Industries in Templeville
The major employment industries in Templeville include Administrative & Support (22 | 30.6%), Construction (15 | 20.8%), Health Care & Social Assistance (9 | 12.5%), Retail Trade (6 | 8.3%), and Transportation & Warehousing (6 | 8.3%).
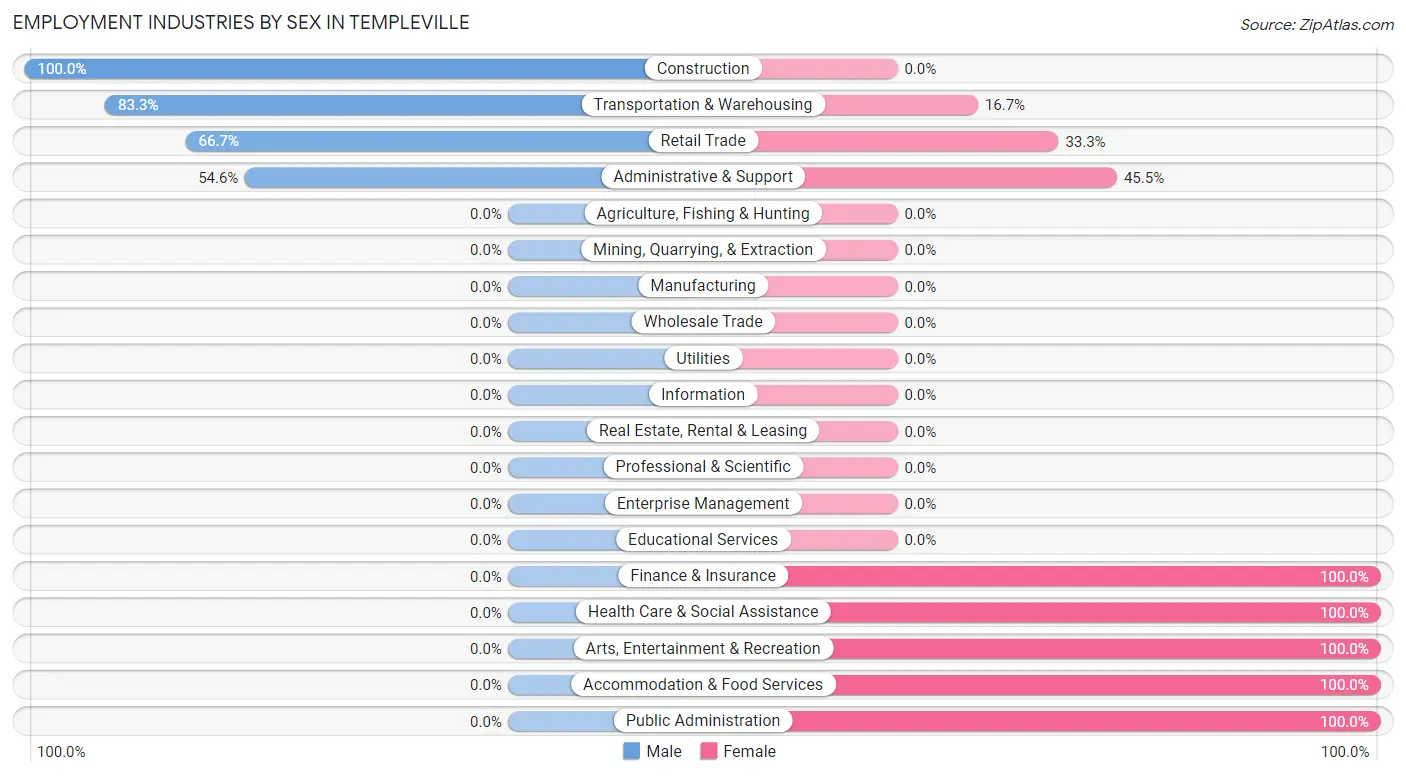
Employment Industries by Sex in Templeville
The Templeville industries that see more men than women are Construction (100.0%), Transportation & Warehousing (83.3%), and Retail Trade (66.7%), whereas the industries that tend to have a higher number of women are Finance & Insurance (100.0%), Health Care & Social Assistance (100.0%), and Arts, Entertainment & Recreation (100.0%).
| Industry | Male | Female |
| Agriculture, Fishing & Hunting | 0 (0.0%) | 0 (0.0%) |
| Mining, Quarrying, & Extraction | 0 (0.0%) | 0 (0.0%) |
| Construction | 15 (100.0%) | 0 (0.0%) |
| Manufacturing | 0 (0.0%) | 0 (0.0%) |
| Wholesale Trade | 0 (0.0%) | 0 (0.0%) |
| Retail Trade | 4 (66.7%) | 2 (33.3%) |
| Transportation & Warehousing | 5 (83.3%) | 1 (16.7%) |
| Utilities | 0 (0.0%) | 0 (0.0%) |
| Information | 0 (0.0%) | 0 (0.0%) |
| Finance & Insurance | 0 (0.0%) | 2 (100.0%) |
| Real Estate, Rental & Leasing | 0 (0.0%) | 0 (0.0%) |
| Professional & Scientific | 0 (0.0%) | 0 (0.0%) |
| Enterprise Management | 0 (0.0%) | 0 (0.0%) |
| Administrative & Support | 12 (54.5%) | 10 (45.5%) |
| Educational Services | 0 (0.0%) | 0 (0.0%) |
| Health Care & Social Assistance | 0 (0.0%) | 9 (100.0%) |
| Arts, Entertainment & Recreation | 0 (0.0%) | 4 (100.0%) |
| Accommodation & Food Services | 0 (0.0%) | 2 (100.0%) |
| Public Administration | 0 (0.0%) | 1 (100.0%) |
| Total | 36 (50.0%) | 36 (50.0%) |
Education in Templeville
School Enrollment in Templeville
The most common levels of schooling among the 63 students in Templeville are nursery / preschool (21 | 33.3%), high school (17 | 27.0%), and elementary school (12 | 19.1%).
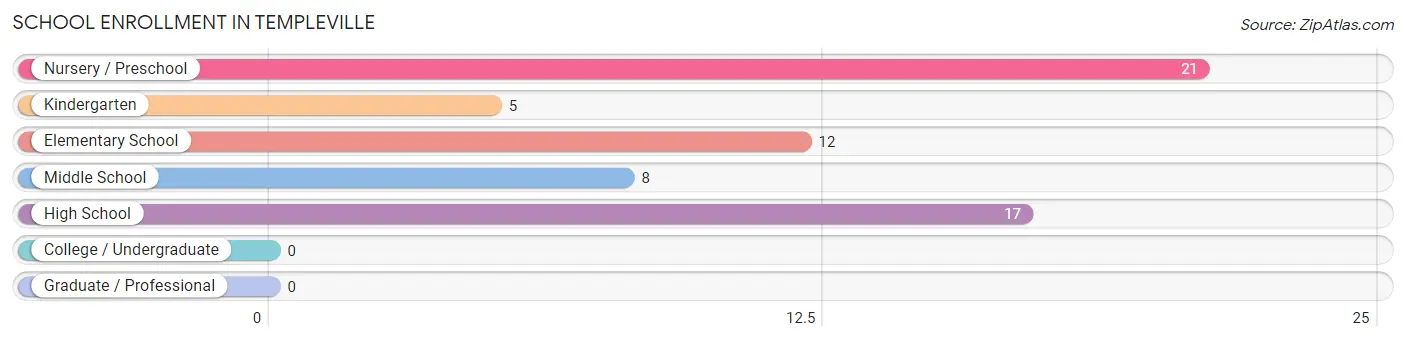
| School Level | # Students | % Students |
| Nursery / Preschool | 21 | 33.3% |
| Kindergarten | 5 | 7.9% |
| Elementary School | 12 | 19.1% |
| Middle School | 8 | 12.7% |
| High School | 17 | 27.0% |
| College / Undergraduate | 0 | 0.0% |
| Graduate / Professional | 0 | 0.0% |
| Total | 63 | 100.0% |
School Enrollment by Age by Funding Source in Templeville
Out of a total of 63 students who are enrolled in schools in Templeville, 6 (9.5%) attend a private institution, while the remaining 57 (90.5%) are enrolled in public schools. The age group of 3 to 4 year olds has the highest likelihood of being enrolled in private schools, with 6 (28.6% in the age bracket) enrolled. Conversely, the age group of 5 to 9 year old has the lowest likelihood of being enrolled in a private school, with 17 (100.0% in the age bracket) attending a public institution.
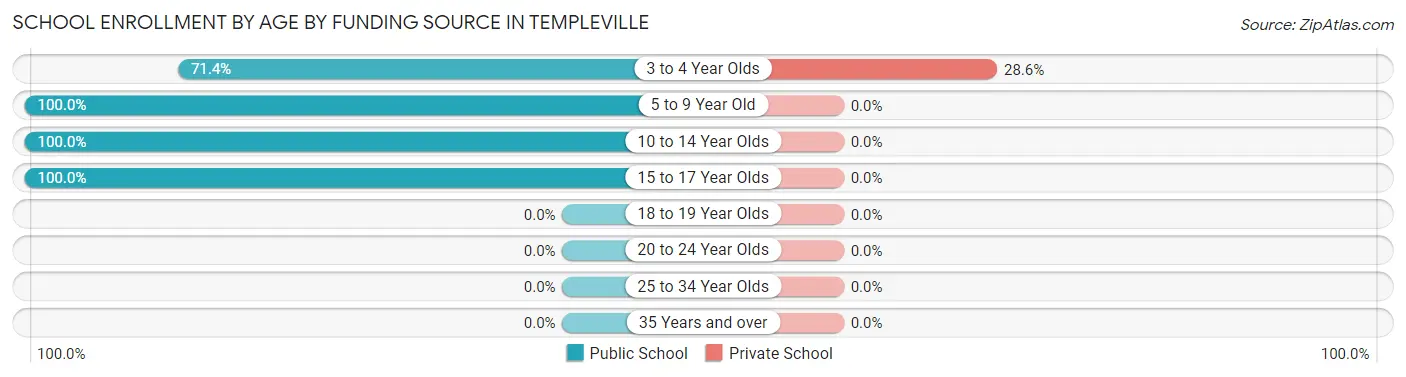
| Age Bracket | Public School | Private School |
| 3 to 4 Year Olds | 15 (71.4%) | 6 (28.6%) |
| 5 to 9 Year Old | 17 (100.0%) | 0 (0.0%) |
| 10 to 14 Year Olds | 20 (100.0%) | 0 (0.0%) |
| 15 to 17 Year Olds | 5 (100.0%) | 0 (0.0%) |
| 18 to 19 Year Olds | 0 (0.0%) | 0 (0.0%) |
| 20 to 24 Year Olds | 0 (0.0%) | 0 (0.0%) |
| 25 to 34 Year Olds | 0 (0.0%) | 0 (0.0%) |
| 35 Years and over | 0 (0.0%) | 0 (0.0%) |
| Total | 57 (90.5%) | 6 (9.5%) |
Educational Attainment by Field of Study in Templeville
, and business (4 | 100.0%) are the most common fields of study among 4 individuals in Templeville who have obtained a bachelor's degree or higher.
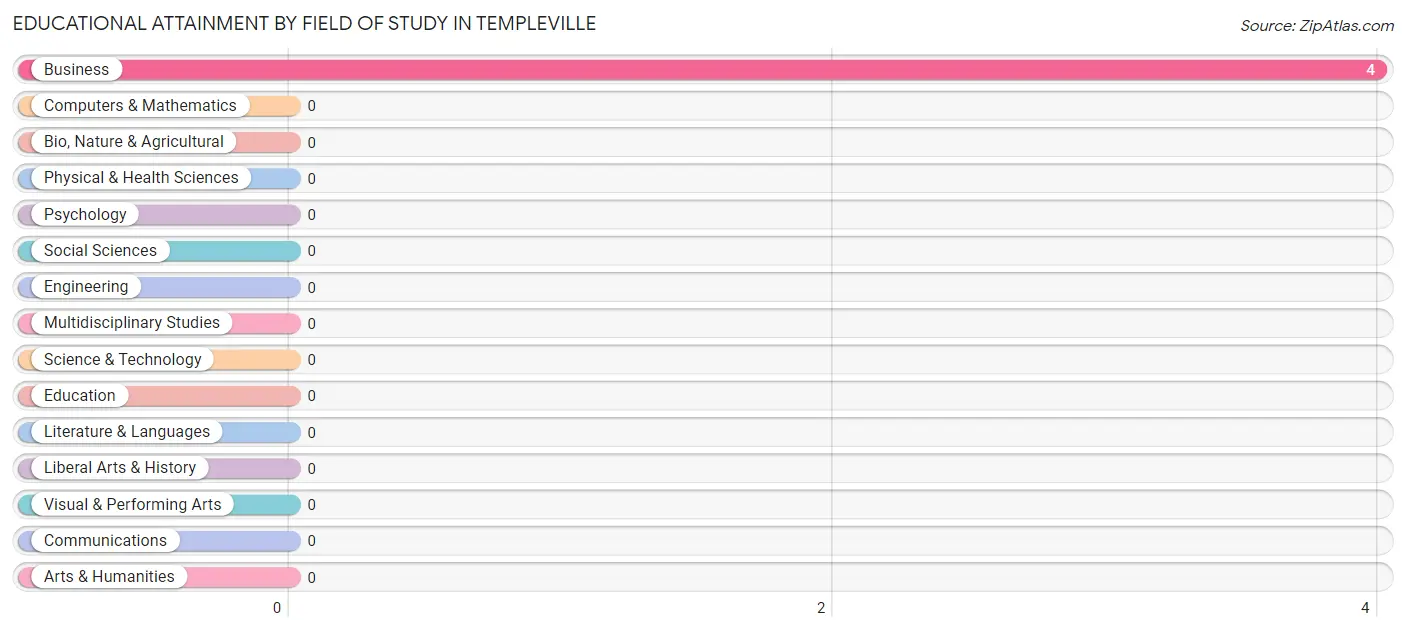
| Field of Study | # Graduates | % Graduates |
| Computers & Mathematics | 0 | 0.0% |
| Bio, Nature & Agricultural | 0 | 0.0% |
| Physical & Health Sciences | 0 | 0.0% |
| Psychology | 0 | 0.0% |
| Social Sciences | 0 | 0.0% |
| Engineering | 0 | 0.0% |
| Multidisciplinary Studies | 0 | 0.0% |
| Science & Technology | 0 | 0.0% |
| Business | 4 | 100.0% |
| Education | 0 | 0.0% |
| Literature & Languages | 0 | 0.0% |
| Liberal Arts & History | 0 | 0.0% |
| Visual & Performing Arts | 0 | 0.0% |
| Communications | 0 | 0.0% |
| Arts & Humanities | 0 | 0.0% |
| Total | 4 | 100.0% |
Transportation & Commute in Templeville
Vehicle Availability by Sex in Templeville
The most prevalent vehicle ownership categories in Templeville are males with 1 vehicle (16, accounting for 44.4%) and females with 1 vehicle (10, making up 44.4%).
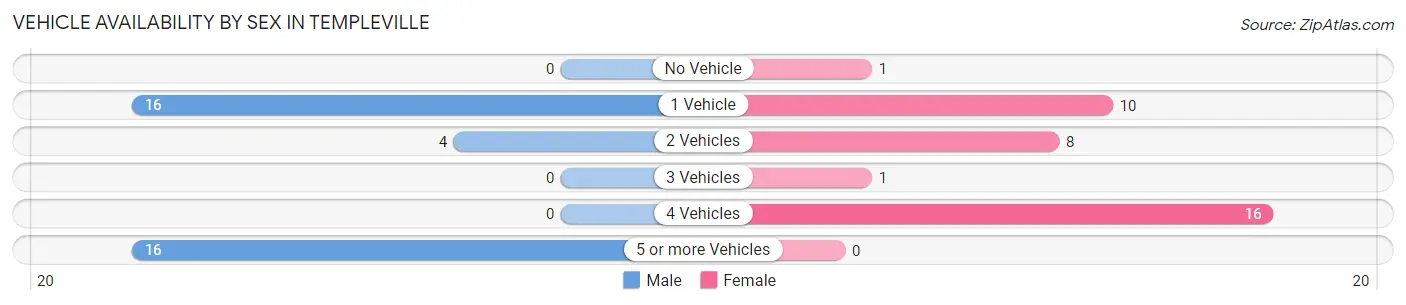
| Vehicles Available | Male | Female |
| No Vehicle | 0 (0.0%) | 1 (2.8%) |
| 1 Vehicle | 16 (44.4%) | 10 (27.8%) |
| 2 Vehicles | 4 (11.1%) | 8 (22.2%) |
| 3 Vehicles | 0 (0.0%) | 1 (2.8%) |
| 4 Vehicles | 0 (0.0%) | 16 (44.4%) |
| 5 or more Vehicles | 16 (44.4%) | 0 (0.0%) |
| Total | 36 (100.0%) | 36 (100.0%) |
Commute Time in Templeville
The most frequently occuring commute durations in Templeville are 25 to 29 minutes (22 commuters, 30.6%), 15 to 19 minutes (14 commuters, 19.4%), and 45 to 59 minutes (12 commuters, 16.7%).
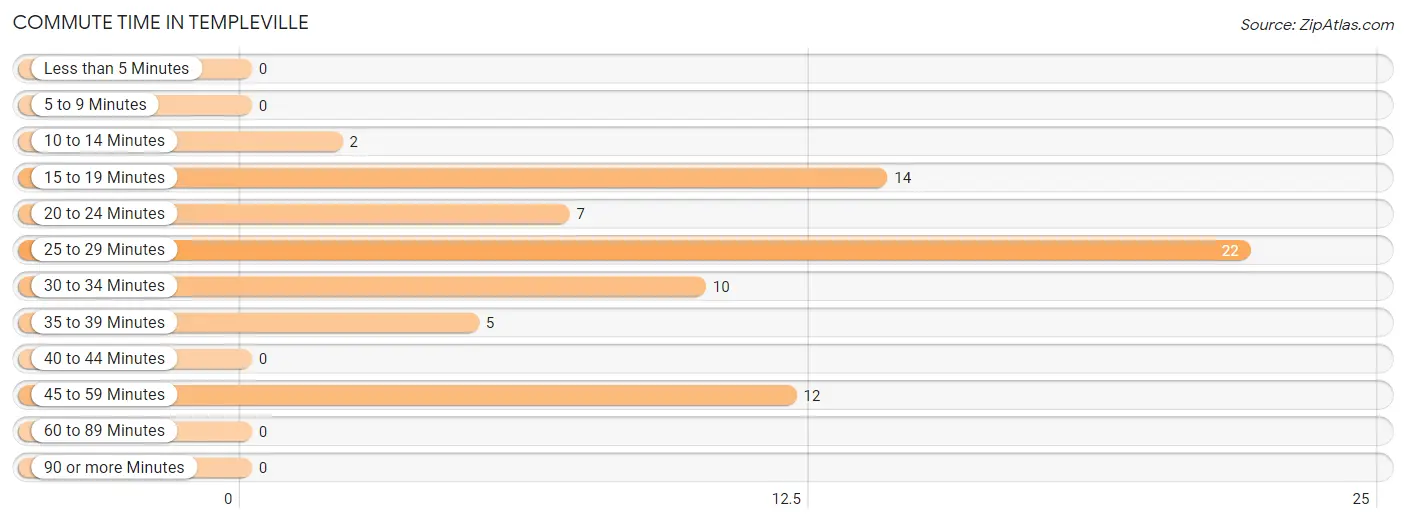
| Commute Time | # Commuters | % Commuters |
| Less than 5 Minutes | 0 | 0.0% |
| 5 to 9 Minutes | 0 | 0.0% |
| 10 to 14 Minutes | 2 | 2.8% |
| 15 to 19 Minutes | 14 | 19.4% |
| 20 to 24 Minutes | 7 | 9.7% |
| 25 to 29 Minutes | 22 | 30.6% |
| 30 to 34 Minutes | 10 | 13.9% |
| 35 to 39 Minutes | 5 | 6.9% |
| 40 to 44 Minutes | 0 | 0.0% |
| 45 to 59 Minutes | 12 | 16.7% |
| 60 to 89 Minutes | 0 | 0.0% |
| 90 or more Minutes | 0 | 0.0% |
Commute Time by Sex in Templeville
The most common commute times in Templeville are 45 to 59 minutes (10 commuters, 27.8%) for males and 25 to 29 minutes (14 commuters, 38.9%) for females.
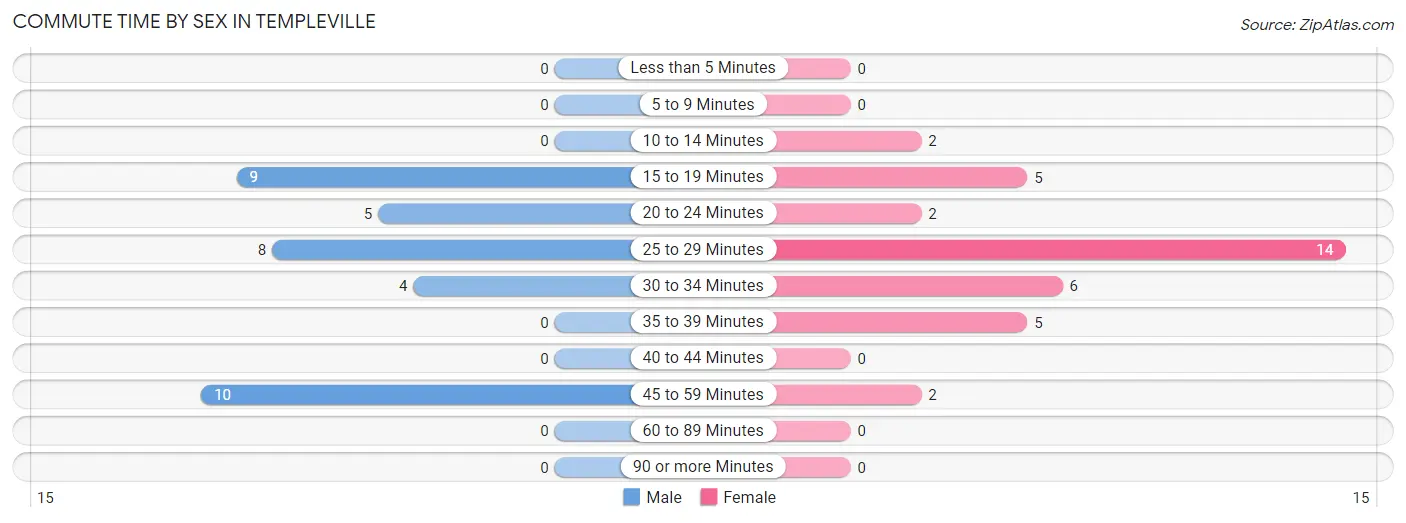
| Commute Time | Male | Female |
| Less than 5 Minutes | 0 (0.0%) | 0 (0.0%) |
| 5 to 9 Minutes | 0 (0.0%) | 0 (0.0%) |
| 10 to 14 Minutes | 0 (0.0%) | 2 (5.6%) |
| 15 to 19 Minutes | 9 (25.0%) | 5 (13.9%) |
| 20 to 24 Minutes | 5 (13.9%) | 2 (5.6%) |
| 25 to 29 Minutes | 8 (22.2%) | 14 (38.9%) |
| 30 to 34 Minutes | 4 (11.1%) | 6 (16.7%) |
| 35 to 39 Minutes | 0 (0.0%) | 5 (13.9%) |
| 40 to 44 Minutes | 0 (0.0%) | 0 (0.0%) |
| 45 to 59 Minutes | 10 (27.8%) | 2 (5.6%) |
| 60 to 89 Minutes | 0 (0.0%) | 0 (0.0%) |
| 90 or more Minutes | 0 (0.0%) | 0 (0.0%) |
Time of Departure to Work by Sex in Templeville
The most frequent times of departure to work in Templeville are 7:00 AM to 7:29 AM (15, 41.7%) for males and 6:30 AM to 6:59 AM (21, 58.3%) for females.
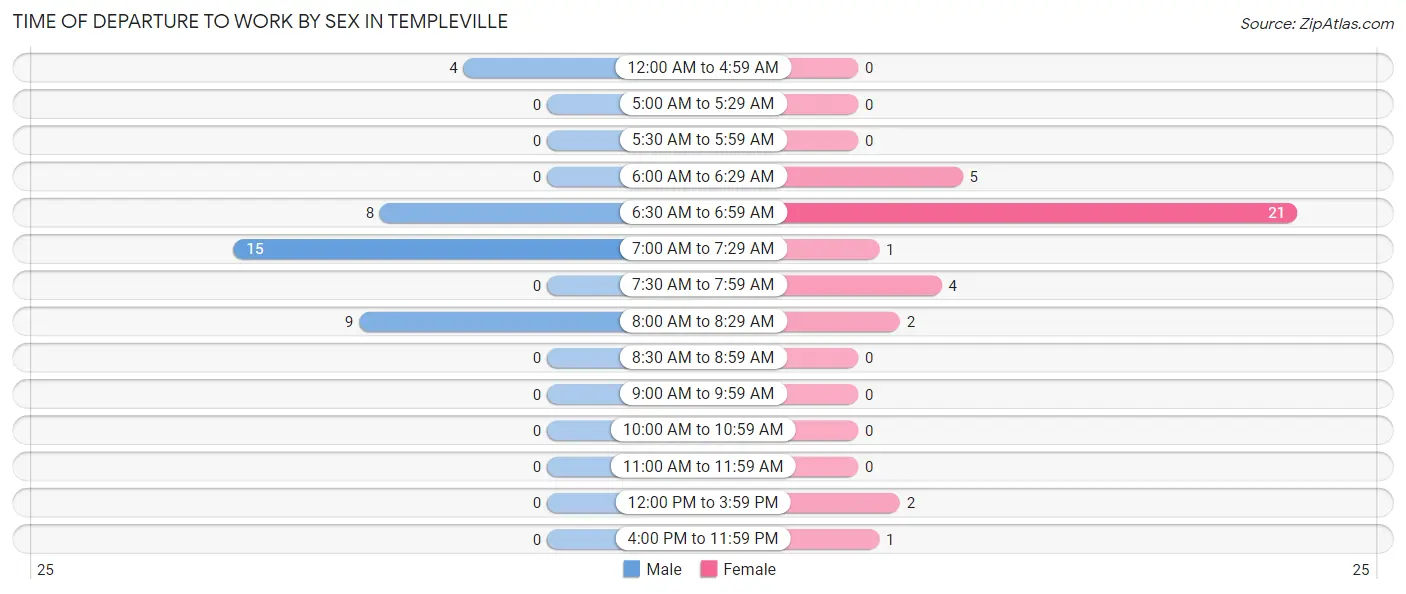
| Time of Departure | Male | Female |
| 12:00 AM to 4:59 AM | 4 (11.1%) | 0 (0.0%) |
| 5:00 AM to 5:29 AM | 0 (0.0%) | 0 (0.0%) |
| 5:30 AM to 5:59 AM | 0 (0.0%) | 0 (0.0%) |
| 6:00 AM to 6:29 AM | 0 (0.0%) | 5 (13.9%) |
| 6:30 AM to 6:59 AM | 8 (22.2%) | 21 (58.3%) |
| 7:00 AM to 7:29 AM | 15 (41.7%) | 1 (2.8%) |
| 7:30 AM to 7:59 AM | 0 (0.0%) | 4 (11.1%) |
| 8:00 AM to 8:29 AM | 9 (25.0%) | 2 (5.6%) |
| 8:30 AM to 8:59 AM | 0 (0.0%) | 0 (0.0%) |
| 9:00 AM to 9:59 AM | 0 (0.0%) | 0 (0.0%) |
| 10:00 AM to 10:59 AM | 0 (0.0%) | 0 (0.0%) |
| 11:00 AM to 11:59 AM | 0 (0.0%) | 0 (0.0%) |
| 12:00 PM to 3:59 PM | 0 (0.0%) | 2 (5.6%) |
| 4:00 PM to 11:59 PM | 0 (0.0%) | 1 (2.8%) |
| Total | 36 (100.0%) | 36 (100.0%) |
Housing Occupancy in Templeville
Occupancy by Ownership in Templeville
Of the total 36 dwellings in Templeville, owner-occupied units account for 14 (38.9%), while renter-occupied units make up 22 (61.1%).
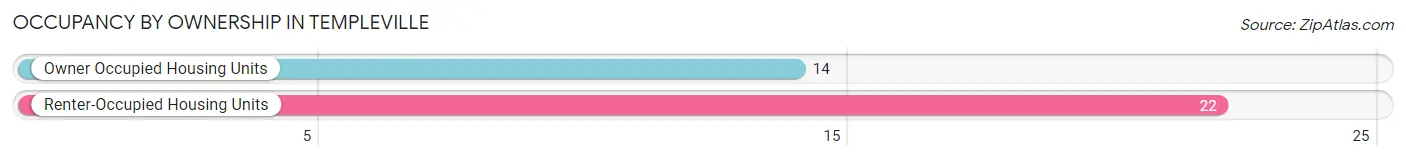
| Occupancy | # Housing Units | % Housing Units |
| Owner Occupied Housing Units | 14 | 38.9% |
| Renter-Occupied Housing Units | 22 | 61.1% |
| Total Occupied Housing Units | 36 | 100.0% |
Occupancy by Household Size in Templeville
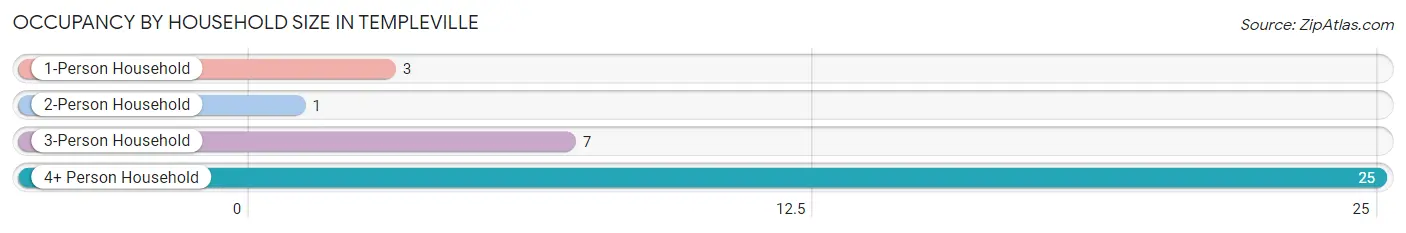
| Household Size | # Housing Units | % Housing Units |
| 1-Person Household | 3 | 8.3% |
| 2-Person Household | 1 | 2.8% |
| 3-Person Household | 7 | 19.4% |
| 4+ Person Household | 25 | 69.4% |
| Total Housing Units | 36 | 100.0% |
Occupancy by Ownership by Household Size in Templeville
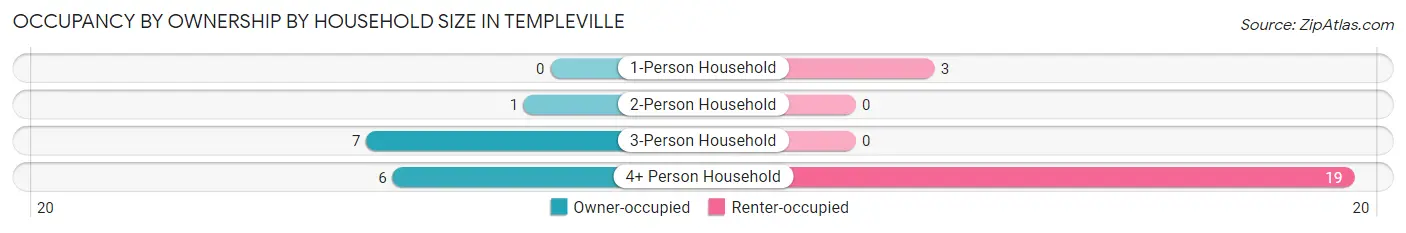
| Household Size | Owner-occupied | Renter-occupied |
| 1-Person Household | 0 (0.0%) | 3 (100.0%) |
| 2-Person Household | 1 (100.0%) | 0 (0.0%) |
| 3-Person Household | 7 (100.0%) | 0 (0.0%) |
| 4+ Person Household | 6 (24.0%) | 19 (76.0%) |
| Total Housing Units | 14 (38.9%) | 22 (61.1%) |
Occupancy by Educational Attainment in Templeville
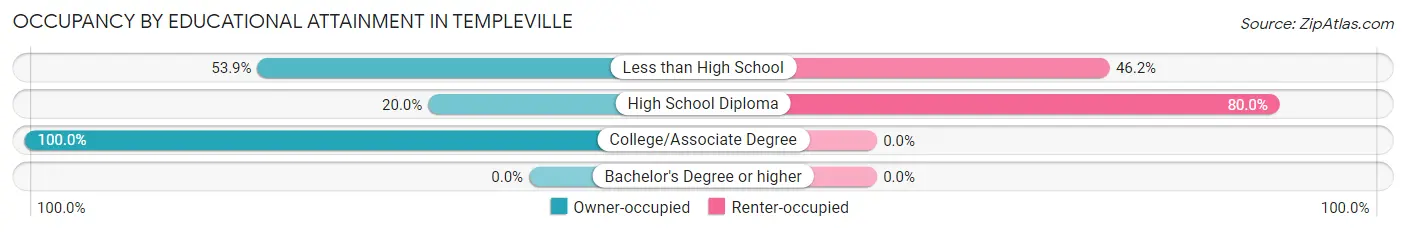
| Household Size | Owner-occupied | Renter-occupied |
| Less than High School | 7 (53.8%) | 6 (46.2%) |
| High School Diploma | 4 (20.0%) | 16 (80.0%) |
| College/Associate Degree | 3 (100.0%) | 0 (0.0%) |
| Bachelor's Degree or higher | 0 (0.0%) | 0 (0.0%) |
Occupancy by Age of Householder in Templeville
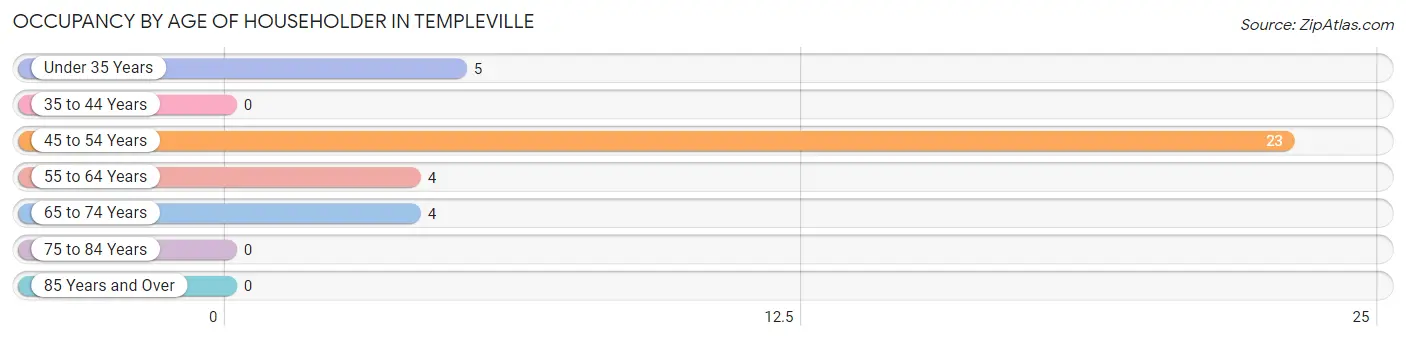
| Age Bracket | # Households | % Households |
| Under 35 Years | 5 | 13.9% |
| 35 to 44 Years | 0 | 0.0% |
| 45 to 54 Years | 23 | 63.9% |
| 55 to 64 Years | 4 | 11.1% |
| 65 to 74 Years | 4 | 11.1% |
| 75 to 84 Years | 0 | 0.0% |
| 85 Years and Over | 0 | 0.0% |
| Total | 36 | 100.0% |
Housing Finances in Templeville
Median Income by Occupancy in Templeville
| Occupancy Type | # Households | Median Income |
| Owner-Occupied | 14 (38.9%) | $0 |
| Renter-Occupied | 22 (61.1%) | $0 |
| Average | 36 (100.0%) | $0 |
Occupancy by Householder Income Bracket in Templeville
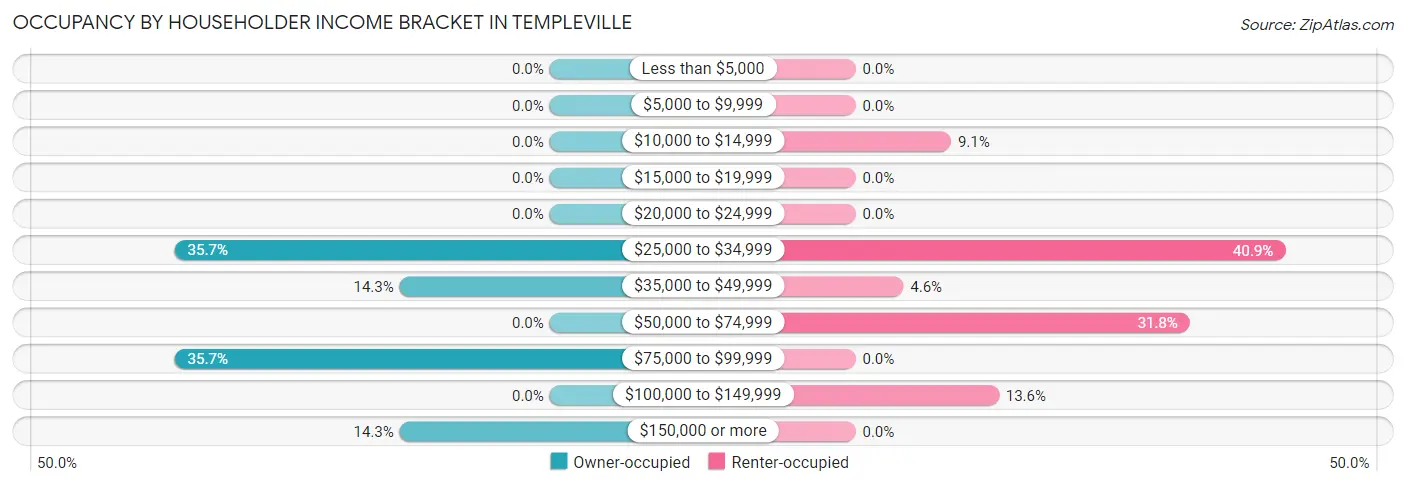
| Income Bracket | Owner-occupied | Renter-occupied |
| Less than $5,000 | 0 (0.0%) | 0 (0.0%) |
| $5,000 to $9,999 | 0 (0.0%) | 0 (0.0%) |
| $10,000 to $14,999 | 0 (0.0%) | 2 (9.1%) |
| $15,000 to $19,999 | 0 (0.0%) | 0 (0.0%) |
| $20,000 to $24,999 | 0 (0.0%) | 0 (0.0%) |
| $25,000 to $34,999 | 5 (35.7%) | 9 (40.9%) |
| $35,000 to $49,999 | 2 (14.3%) | 1 (4.5%) |
| $50,000 to $74,999 | 0 (0.0%) | 7 (31.8%) |
| $75,000 to $99,999 | 5 (35.7%) | 0 (0.0%) |
| $100,000 to $149,999 | 0 (0.0%) | 3 (13.6%) |
| $150,000 or more | 2 (14.3%) | 0 (0.0%) |
| Total | 14 (100.0%) | 22 (100.0%) |
Monthly Housing Cost Tiers in Templeville
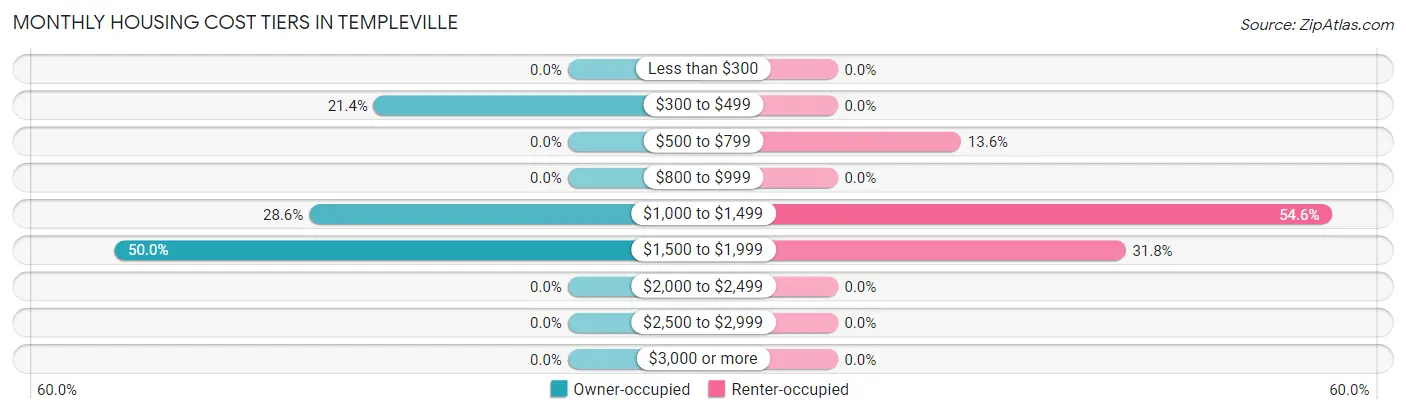
| Monthly Cost | Owner-occupied | Renter-occupied |
| Less than $300 | 0 (0.0%) | 0 (0.0%) |
| $300 to $499 | 3 (21.4%) | 0 (0.0%) |
| $500 to $799 | 0 (0.0%) | 3 (13.6%) |
| $800 to $999 | 0 (0.0%) | 0 (0.0%) |
| $1,000 to $1,499 | 4 (28.6%) | 12 (54.5%) |
| $1,500 to $1,999 | 7 (50.0%) | 7 (31.8%) |
| $2,000 to $2,499 | 0 (0.0%) | 0 (0.0%) |
| $2,500 to $2,999 | 0 (0.0%) | 0 (0.0%) |
| $3,000 or more | 0 (0.0%) | 0 (0.0%) |
| Total | 14 (100.0%) | 22 (100.0%) |
Physical Housing Characteristics in Templeville
Housing Structures in Templeville
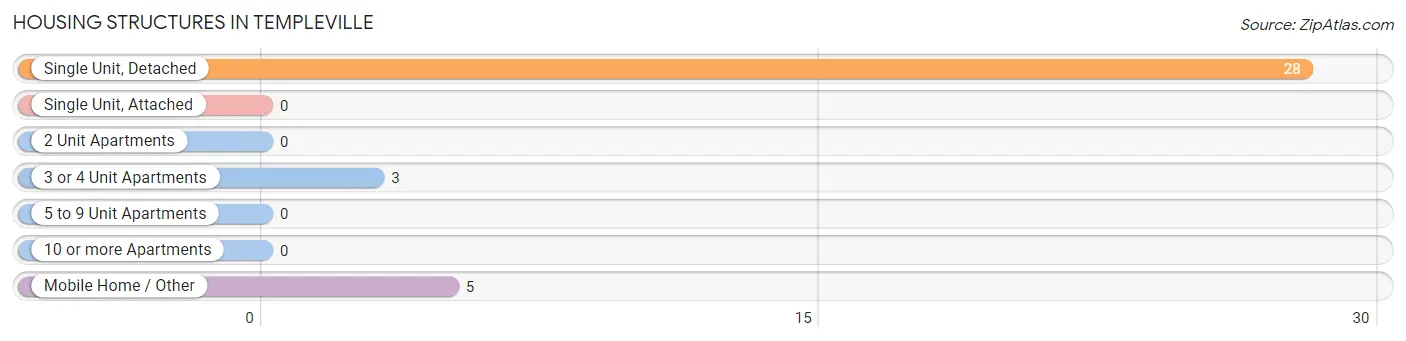
| Structure Type | # Housing Units | % Housing Units |
| Single Unit, Detached | 28 | 77.8% |
| Single Unit, Attached | 0 | 0.0% |
| 2 Unit Apartments | 0 | 0.0% |
| 3 or 4 Unit Apartments | 3 | 8.3% |
| 5 to 9 Unit Apartments | 0 | 0.0% |
| 10 or more Apartments | 0 | 0.0% |
| Mobile Home / Other | 5 | 13.9% |
| Total | 36 | 100.0% |
Housing Structures by Occupancy in Templeville
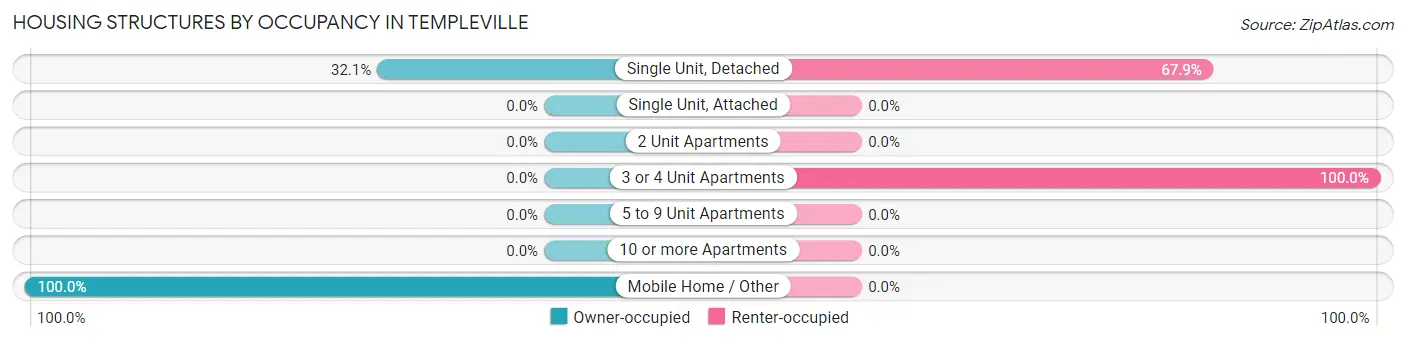
| Structure Type | Owner-occupied | Renter-occupied |
| Single Unit, Detached | 9 (32.1%) | 19 (67.9%) |
| Single Unit, Attached | 0 (0.0%) | 0 (0.0%) |
| 2 Unit Apartments | 0 (0.0%) | 0 (0.0%) |
| 3 or 4 Unit Apartments | 0 (0.0%) | 3 (100.0%) |
| 5 to 9 Unit Apartments | 0 (0.0%) | 0 (0.0%) |
| 10 or more Apartments | 0 (0.0%) | 0 (0.0%) |
| Mobile Home / Other | 5 (100.0%) | 0 (0.0%) |
| Total | 14 (38.9%) | 22 (61.1%) |
Housing Structures by Number of Rooms in Templeville
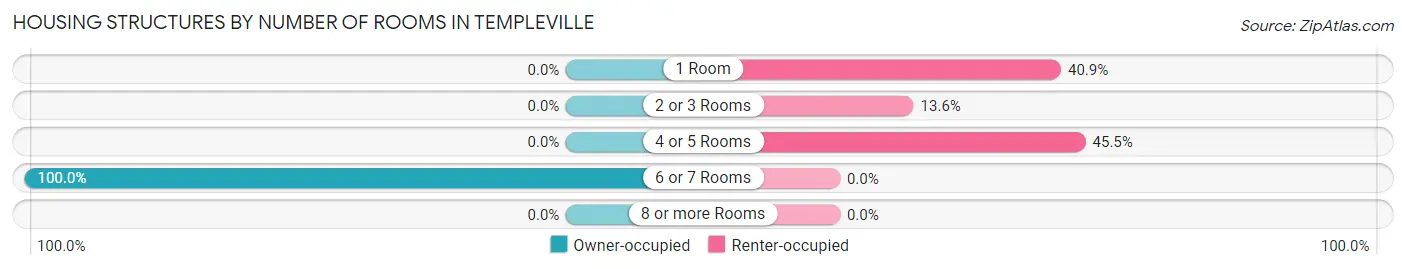
| Number of Rooms | Owner-occupied | Renter-occupied |
| 1 Room | 0 (0.0%) | 9 (40.9%) |
| 2 or 3 Rooms | 0 (0.0%) | 3 (13.6%) |
| 4 or 5 Rooms | 0 (0.0%) | 10 (45.5%) |
| 6 or 7 Rooms | 14 (100.0%) | 0 (0.0%) |
| 8 or more Rooms | 0 (0.0%) | 0 (0.0%) |
| Total | 14 (100.0%) | 22 (100.0%) |
Housing Structure by Heating Type in Templeville
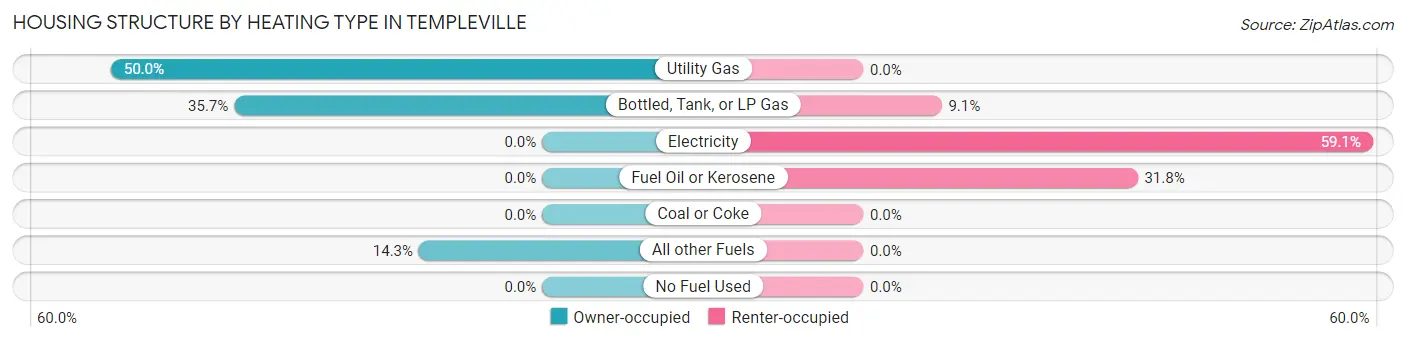
| Heating Type | Owner-occupied | Renter-occupied |
| Utility Gas | 7 (50.0%) | 0 (0.0%) |
| Bottled, Tank, or LP Gas | 5 (35.7%) | 2 (9.1%) |
| Electricity | 0 (0.0%) | 13 (59.1%) |
| Fuel Oil or Kerosene | 0 (0.0%) | 7 (31.8%) |
| Coal or Coke | 0 (0.0%) | 0 (0.0%) |
| All other Fuels | 2 (14.3%) | 0 (0.0%) |
| No Fuel Used | 0 (0.0%) | 0 (0.0%) |
| Total | 14 (100.0%) | 22 (100.0%) |
Household Vehicle Usage in Templeville
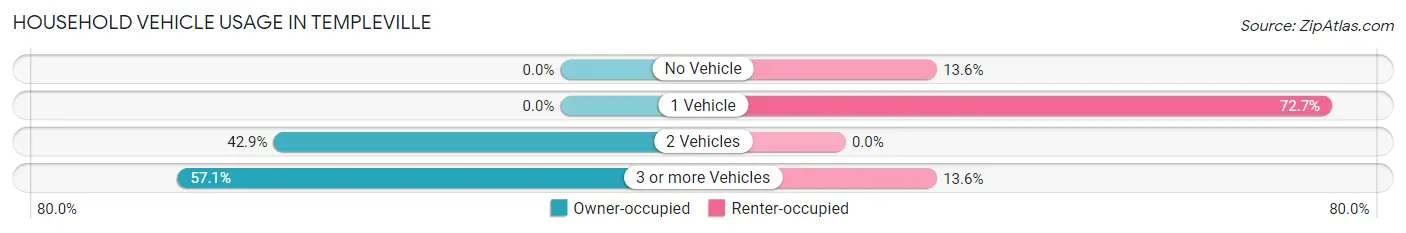
| Vehicles per Household | Owner-occupied | Renter-occupied |
| No Vehicle | 0 (0.0%) | 3 (13.6%) |
| 1 Vehicle | 0 (0.0%) | 16 (72.7%) |
| 2 Vehicles | 6 (42.9%) | 0 (0.0%) |
| 3 or more Vehicles | 8 (57.1%) | 3 (13.6%) |
| Total | 14 (100.0%) | 22 (100.0%) |
Real Estate & Mortgages in Templeville
Real Estate and Mortgage Overview in Templeville
| Characteristic | Without Mortgage | With Mortgage |
| Housing Units | 3 | 11 |
| Median Property Value | - | - |
| Median Household Income | - | - |
| Monthly Housing Costs | - | - |
| Real Estate Taxes | - | - |
Property Value by Mortgage Status in Templeville
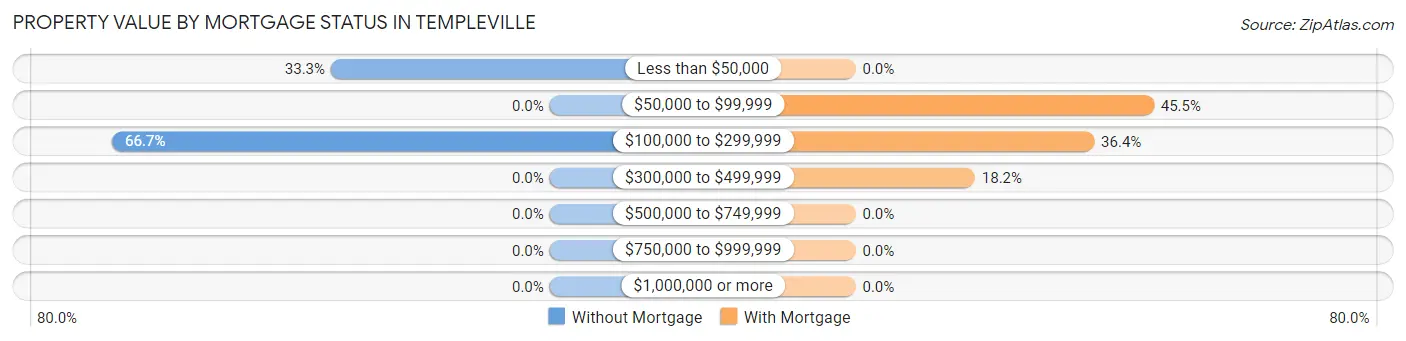
| Property Value | Without Mortgage | With Mortgage |
| Less than $50,000 | 1 (33.3%) | 0 (0.0%) |
| $50,000 to $99,999 | 0 (0.0%) | 5 (45.5%) |
| $100,000 to $299,999 | 2 (66.7%) | 4 (36.4%) |
| $300,000 to $499,999 | 0 (0.0%) | 2 (18.2%) |
| $500,000 to $749,999 | 0 (0.0%) | 0 (0.0%) |
| $750,000 to $999,999 | 0 (0.0%) | 0 (0.0%) |
| $1,000,000 or more | 0 (0.0%) | 0 (0.0%) |
| Total | 3 (100.0%) | 11 (100.0%) |
Household Income by Mortgage Status in Templeville
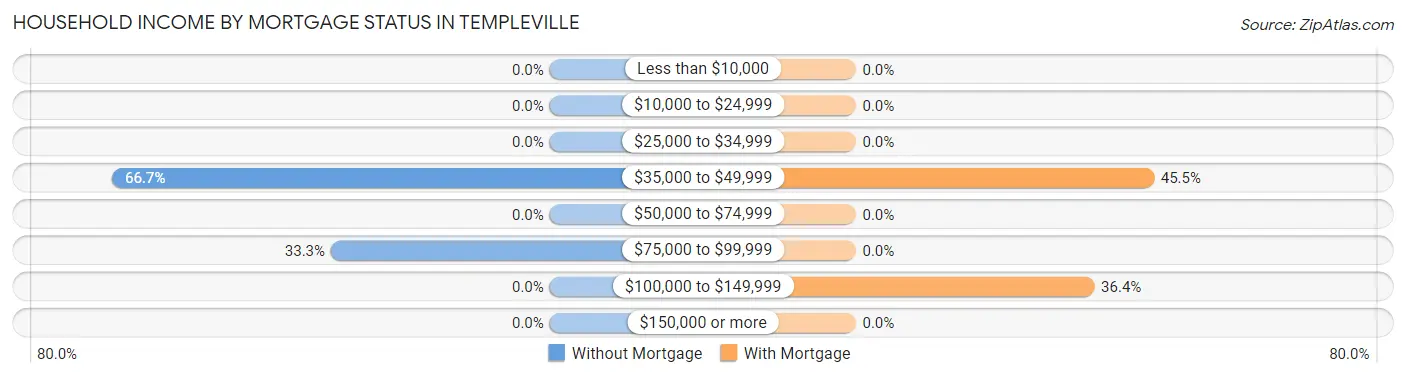
| Household Income | Without Mortgage | With Mortgage |
| Less than $10,000 | 0 (0.0%) | 0 (0.0%) |
| $10,000 to $24,999 | 0 (0.0%) | 0 (0.0%) |
| $25,000 to $34,999 | 0 (0.0%) | 0 (0.0%) |
| $35,000 to $49,999 | 2 (66.7%) | 5 (45.5%) |
| $50,000 to $74,999 | 0 (0.0%) | 0 (0.0%) |
| $75,000 to $99,999 | 1 (33.3%) | 0 (0.0%) |
| $100,000 to $149,999 | 0 (0.0%) | 4 (36.4%) |
| $150,000 or more | 0 (0.0%) | 0 (0.0%) |
| Total | 3 (100.0%) | 11 (100.0%) |
Property Value to Household Income Ratio in Templeville
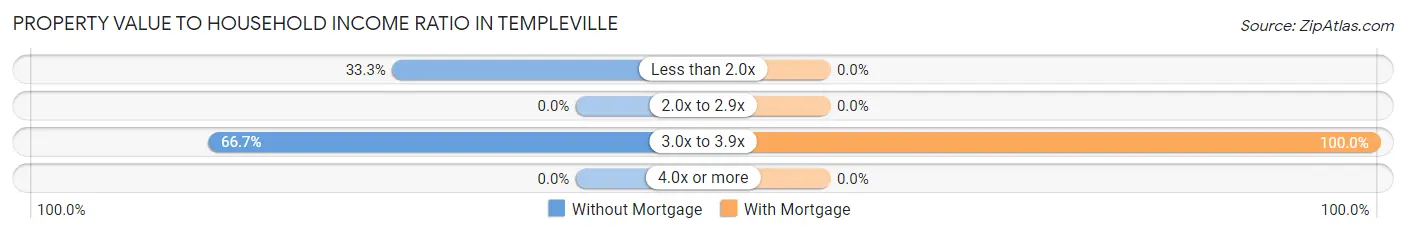
| Value-to-Income Ratio | Without Mortgage | With Mortgage |
| Less than 2.0x | 1 (33.3%) | 0 (0.0%) |
| 2.0x to 2.9x | 0 (0.0%) | 0 (0.0%) |
| 3.0x to 3.9x | 2 (66.7%) | 11 (100.0%) |
| 4.0x or more | 0 (0.0%) | 0 (0.0%) |
| Total | 3 (100.0%) | 11 (100.0%) |
Real Estate Taxes by Mortgage Status in Templeville
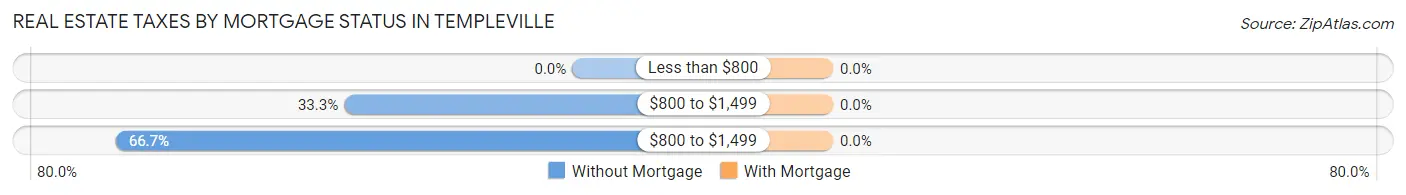
| Property Taxes | Without Mortgage | With Mortgage |
| Less than $800 | 0 (0.0%) | 0 (0.0%) |
| $800 to $1,499 | 1 (33.3%) | 0 (0.0%) |
| $800 to $1,499 | 2 (66.7%) | 0 (0.0%) |
| Total | 3 (100.0%) | 11 (100.0%) |
Health & Disability in Templeville
Health Insurance Coverage by Age in Templeville
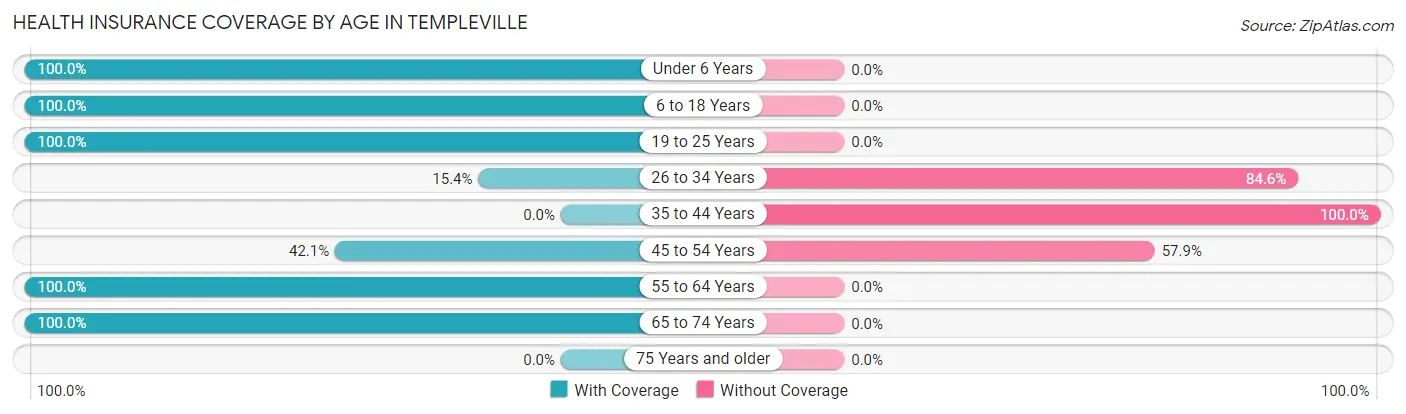
| Age Bracket | With Coverage | Without Coverage |
| Under 6 Years | 32 (100.0%) | 0 (0.0%) |
| 6 to 18 Years | 47 (100.0%) | 0 (0.0%) |
| 19 to 25 Years | 8 (100.0%) | 0 (0.0%) |
| 26 to 34 Years | 4 (15.4%) | 22 (84.6%) |
| 35 to 44 Years | 0 (0.0%) | 10 (100.0%) |
| 45 to 54 Years | 16 (42.1%) | 22 (57.9%) |
| 55 to 64 Years | 16 (100.0%) | 0 (0.0%) |
| 65 to 74 Years | 5 (100.0%) | 0 (0.0%) |
| 75 Years and older | 0 (0.0%) | 0 (0.0%) |
| Total | 128 (70.3%) | 54 (29.7%) |
Health Insurance Coverage by Citizenship Status in Templeville
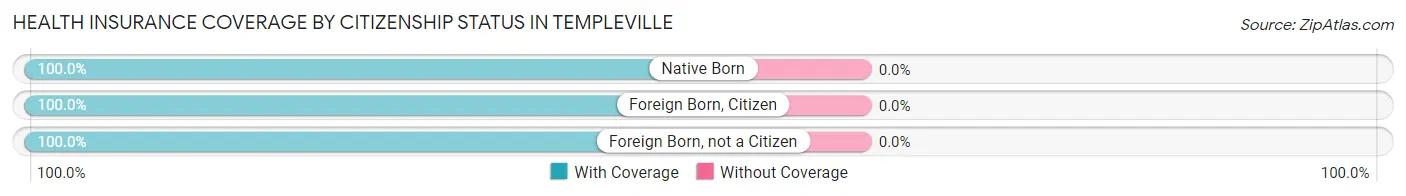
| Citizenship Status | With Coverage | Without Coverage |
| Native Born | 32 (100.0%) | 0 (0.0%) |
| Foreign Born, Citizen | 47 (100.0%) | 0 (0.0%) |
| Foreign Born, not a Citizen | 8 (100.0%) | 0 (0.0%) |
Health Insurance Coverage by Household Income in Templeville
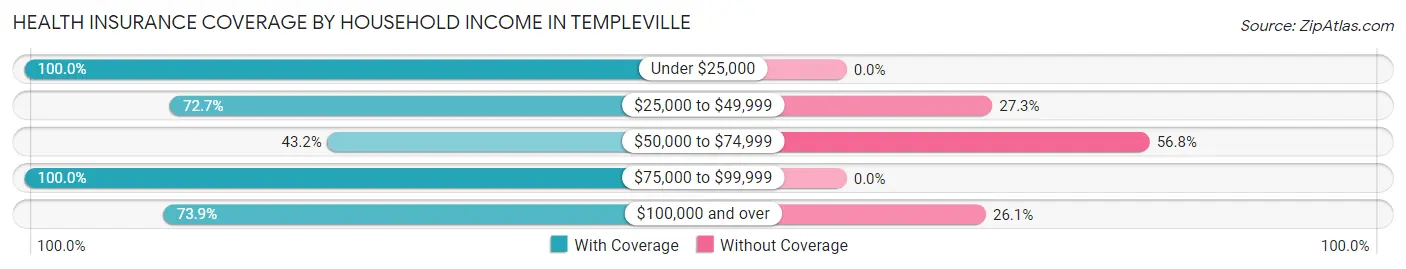
| Household Income | With Coverage | Without Coverage |
| Under $25,000 | 2 (100.0%) | 0 (0.0%) |
| $25,000 to $49,999 | 56 (72.7%) | 21 (27.3%) |
| $50,000 to $74,999 | 16 (43.2%) | 21 (56.8%) |
| $75,000 to $99,999 | 20 (100.0%) | 0 (0.0%) |
| $100,000 and over | 34 (73.9%) | 12 (26.1%) |
Public vs Private Health Insurance Coverage by Age in Templeville
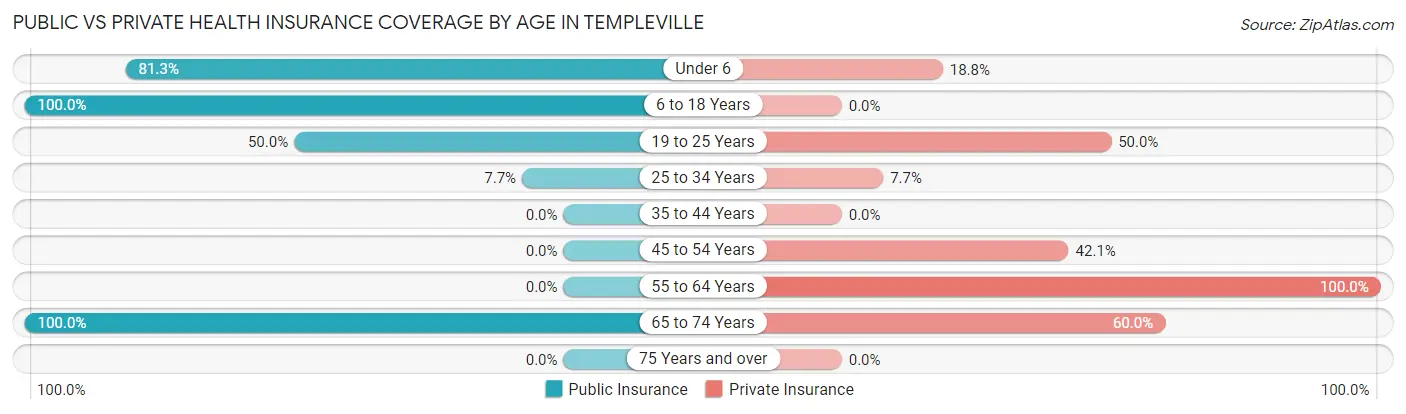
| Age Bracket | Public Insurance | Private Insurance |
| Under 6 | 26 (81.2%) | 6 (18.8%) |
| 6 to 18 Years | 47 (100.0%) | 0 (0.0%) |
| 19 to 25 Years | 4 (50.0%) | 4 (50.0%) |
| 25 to 34 Years | 2 (7.7%) | 2 (7.7%) |
| 35 to 44 Years | 0 (0.0%) | 0 (0.0%) |
| 45 to 54 Years | 0 (0.0%) | 16 (42.1%) |
| 55 to 64 Years | 0 (0.0%) | 16 (100.0%) |
| 65 to 74 Years | 5 (100.0%) | 3 (60.0%) |
| 75 Years and over | 0 (0.0%) | 0 (0.0%) |
| Total | 84 (46.2%) | 47 (25.8%) |
Disability Status by Sex by Age in Templeville
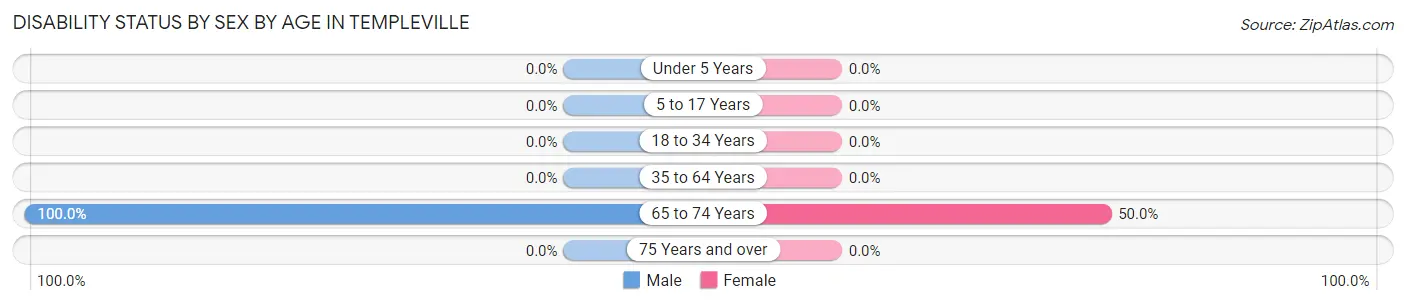
| Age Bracket | Male | Female |
| Under 5 Years | 0 (0.0%) | 0 (0.0%) |
| 5 to 17 Years | 0 (0.0%) | 0 (0.0%) |
| 18 to 34 Years | 0 (0.0%) | 0 (0.0%) |
| 35 to 64 Years | 0 (0.0%) | 0 (0.0%) |
| 65 to 74 Years | 1 (100.0%) | 2 (50.0%) |
| 75 Years and over | 0 (0.0%) | 0 (0.0%) |
Disability Class by Sex by Age in Templeville
Disability Class: Hearing Difficulty
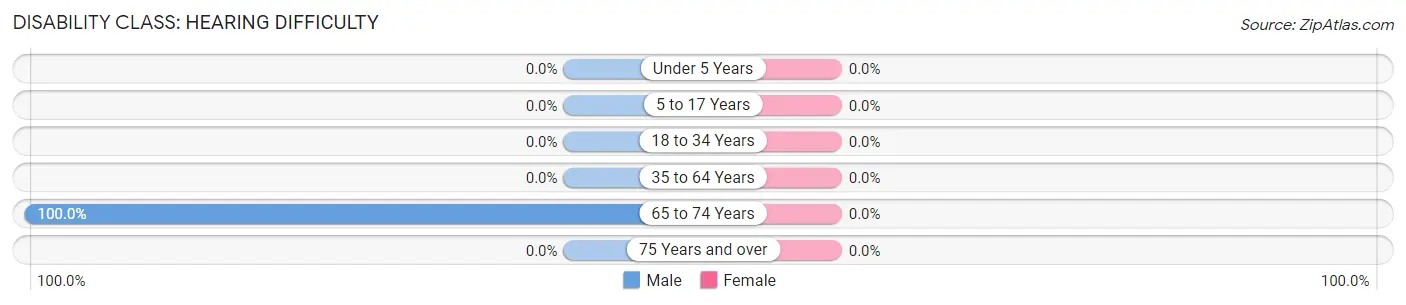
| Age Bracket | Male | Female |
| Under 5 Years | 0 (0.0%) | 0 (0.0%) |
| 5 to 17 Years | 0 (0.0%) | 0 (0.0%) |
| 18 to 34 Years | 0 (0.0%) | 0 (0.0%) |
| 35 to 64 Years | 0 (0.0%) | 0 (0.0%) |
| 65 to 74 Years | 1 (100.0%) | 0 (0.0%) |
| 75 Years and over | 0 (0.0%) | 0 (0.0%) |
Disability Class: Vision Difficulty
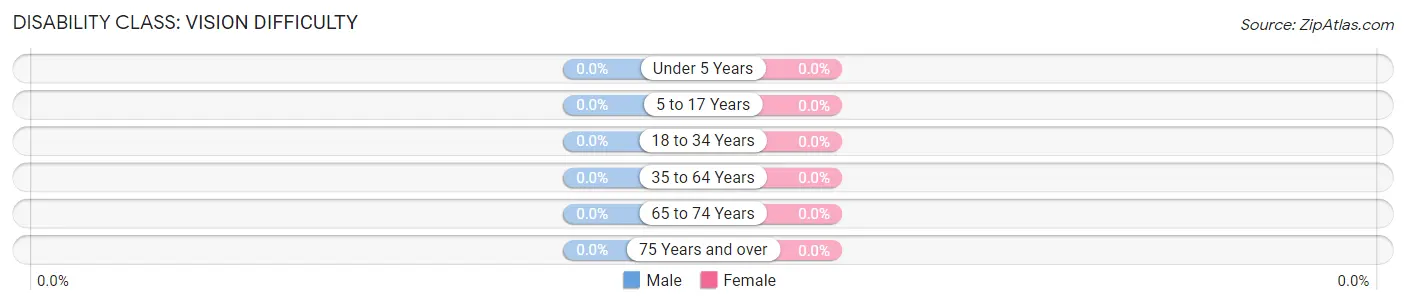
| Age Bracket | Male | Female |
| Under 5 Years | 0 (0.0%) | 0 (0.0%) |
| 5 to 17 Years | 0 (0.0%) | 0 (0.0%) |
| 18 to 34 Years | 0 (0.0%) | 0 (0.0%) |
| 35 to 64 Years | 0 (0.0%) | 0 (0.0%) |
| 65 to 74 Years | 0 (0.0%) | 0 (0.0%) |
| 75 Years and over | 0 (0.0%) | 0 (0.0%) |
Disability Class: Cognitive Difficulty
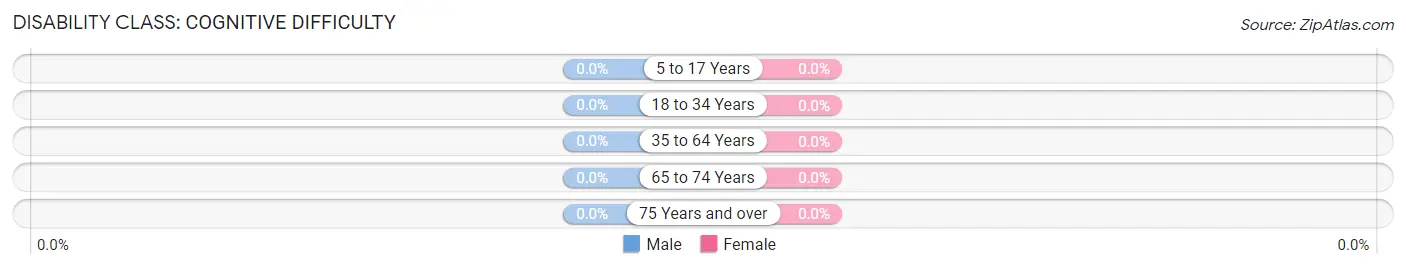
| Age Bracket | Male | Female |
| 5 to 17 Years | 0 (0.0%) | 0 (0.0%) |
| 18 to 34 Years | 0 (0.0%) | 0 (0.0%) |
| 35 to 64 Years | 0 (0.0%) | 0 (0.0%) |
| 65 to 74 Years | 0 (0.0%) | 0 (0.0%) |
| 75 Years and over | 0 (0.0%) | 0 (0.0%) |
Disability Class: Ambulatory Difficulty
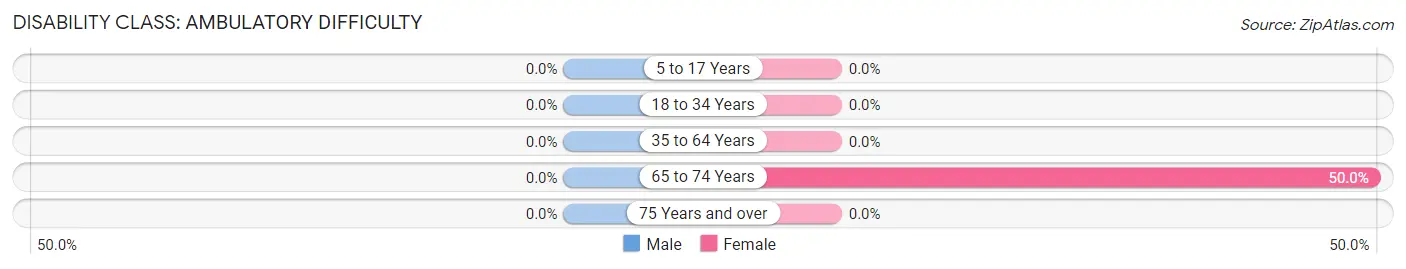
| Age Bracket | Male | Female |
| 5 to 17 Years | 0 (0.0%) | 0 (0.0%) |
| 18 to 34 Years | 0 (0.0%) | 0 (0.0%) |
| 35 to 64 Years | 0 (0.0%) | 0 (0.0%) |
| 65 to 74 Years | 0 (0.0%) | 2 (50.0%) |
| 75 Years and over | 0 (0.0%) | 0 (0.0%) |
Disability Class: Self-Care Difficulty
| Age Bracket | Male | Female |
| 5 to 17 Years | 0 (0.0%) | 0 (0.0%) |
| 18 to 34 Years | 0 (0.0%) | 0 (0.0%) |
| 35 to 64 Years | 0 (0.0%) | 0 (0.0%) |
| 65 to 74 Years | 0 (0.0%) | 0 (0.0%) |
| 75 Years and over | 0 (0.0%) | 0 (0.0%) |
Technology Access in Templeville
Computing Device Access in Templeville
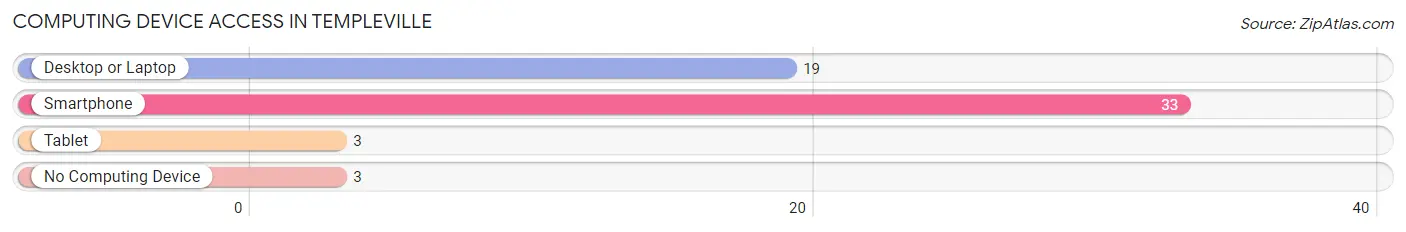
| Device Type | # Households | % Households |
| Desktop or Laptop | 19 | 52.8% |
| Smartphone | 33 | 91.7% |
| Tablet | 3 | 8.3% |
| No Computing Device | 3 | 8.3% |
| Total | 36 | 100.0% |
Internet Access in Templeville
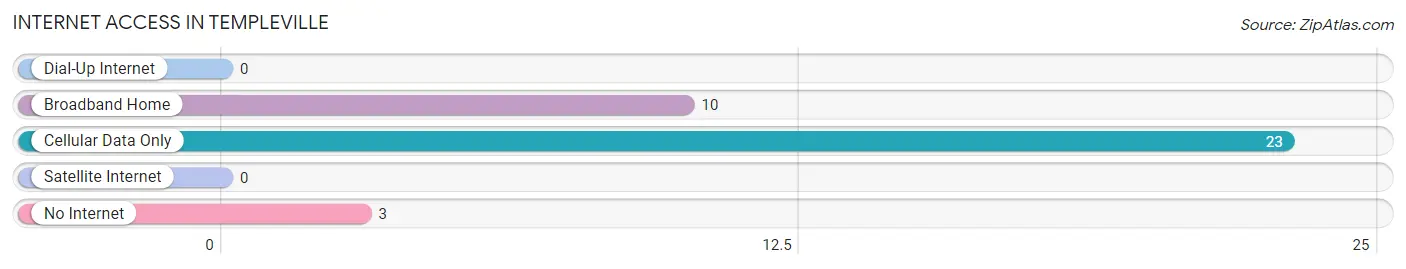
| Internet Type | # Households | % Households |
| Dial-Up Internet | 0 | 0.0% |
| Broadband Home | 10 | 27.8% |
| Cellular Data Only | 23 | 63.9% |
| Satellite Internet | 0 | 0.0% |
| No Internet | 3 | 8.3% |
| Total | 36 | 100.0% |
Templeville Summary
Templeville, Maryland is a small town located in Caroline County, Maryland. It is situated on the banks of the Choptank River, about 25 miles east of the state capital of Annapolis. The town was founded in 1790 and has a population of approximately 1,000 people.
History
Templeville was founded in 1790 by a group of Quakers from Pennsylvania. The town was named after the Quaker meeting house, which was built in 1790 and is still standing today. The town was originally a farming community, but in the late 19th century, it became a popular summer resort destination. The town was known for its beautiful scenery and its many recreational activities, such as fishing, boating, and swimming.
In the early 20th century, Templeville began to decline as a resort destination. The town was bypassed by the railroad and the automobile, and the population began to decline. In the 1950s, the town was revitalized by the construction of a new bridge over the Choptank River. This bridge allowed for easier access to the town and helped to attract new businesses and residents.
Geography
Templeville is located in Caroline County, Maryland, on the banks of the Choptank River. The town is situated on a peninsula, surrounded by the Choptank River to the north and east, and the Tuckahoe Creek to the south and west. The town is approximately 25 miles east of the state capital of Annapolis.
The town is mostly flat, with some rolling hills in the surrounding area. The climate is humid subtropical, with hot, humid summers and mild winters. The average annual temperature is around 60 degrees Fahrenheit.
Economy
The economy of Templeville is largely based on agriculture and tourism. The town is home to several farms, which produce a variety of crops, including corn, soybeans, and wheat. The town is also home to several wineries, which produce a variety of wines.
Tourism is an important part of the economy of Templeville. The town is home to several historic sites, including the Quaker meeting house, which was built in 1790. The town is also home to several recreational activities, such as fishing, boating, and swimming.
Demographics
As of the 2010 census, the population of Templeville was 1,000 people. The racial makeup of the town was 94.2% White, 2.2% African American, 0.2% Native American, 0.4% Asian, 0.1% Pacific Islander, and 2.9% from other races. The median household income was $45,000, and the median family income was $50,000.
The town is home to several churches, including the Quaker meeting house, which was built in 1790. The town is also home to several schools, including Templeville Elementary School and Templeville High School. The town is served by the Caroline County Public Schools system.
Common Questions
What is Per Capita Income in Templeville?
Per Capita income in Templeville is $17,725.
What is Income or Wage Gap in Templeville?
Income or Wage Gap in Templeville is 27.7%.
Women in Templeville earn 72.3 cents for every dollar earned by a man.
What is Inequality or Gini Index in Templeville?
Inequality or Gini Index in Templeville is 0.34.
What is the Total Population of Templeville?
Total Population of Templeville is 182.
What is the Total Male Population of Templeville?
Total Male Population of Templeville is 80.
What is the Total Female Population of Templeville?
Total Female Population of Templeville is 102.
What is the Ratio of Males per 100 Females in Templeville?
There are 78.43 Males per 100 Females in Templeville.
What is the Ratio of Females per 100 Males in Templeville?
There are 127.50 Females per 100 Males in Templeville.
What is the Median Population Age in Templeville?
Median Population Age in Templeville is 30.1 Years.
What is the Average Family Size in Templeville
Average Family Size in Templeville is 5.1 People.
What is the Average Household Size in Templeville
Average Household Size in Templeville is 5.1 People.
How Large is the Labor Force in Templeville?
There are 86 People in the Labor Forcein in Templeville.
What is the Percentage of People in the Labor Force in Templeville?
81.9% of People are in the Labor Force in Templeville.
What is the Unemployment Rate in Templeville?
Unemployment Rate in Templeville is 16.3%.