Seabrook, MD Map & Demographics
Seabrook Map
Seabrook Overview
$35,263
PER CAPITA INCOME
$94,320
AVG FAMILY INCOME
$96,078
AVG HOUSEHOLD INCOME
23.9%
WAGE / INCOME GAP [ % ]
76.1¢/ $1
WAGE / INCOME GAP [ $ ]
0.36
INEQUALITY / GINI INDEX
19,369
TOTAL POPULATION
9,035
MALE POPULATION
10,334
FEMALE POPULATION
87.43
MALES / 100 FEMALES
114.38
FEMALES / 100 MALES
36.4
MEDIAN AGE
3.6
AVG FAMILY SIZE
3.2
AVG HOUSEHOLD SIZE
11,001
LABOR FORCE [ PEOPLE ]
72.6%
PERCENT IN LABOR FORCE
7.1%
UNEMPLOYMENT RATE
Income in Seabrook
Income Overview in Seabrook
Per Capita Income in Seabrook is $35,263, while median incomes of families and households are $94,320 and $96,078 respectively.
| Characteristic | Number | Measure |
| Per Capita Income | 19,369 | $35,263 |
| Median Family Income | 4,463 | $94,320 |
| Mean Family Income | 4,463 | $111,764 |
| Median Household Income | 5,927 | $96,078 |
| Mean Household Income | 5,927 | $108,860 |
| Income Deficit | 4,463 | $0 |
| Wage / Income Gap (%) | 19,369 | 23.89% |
| Wage / Income Gap ($) | 19,369 | 76.11¢ per $1 |
| Gini / Inequality Index | 19,369 | 0.36 |
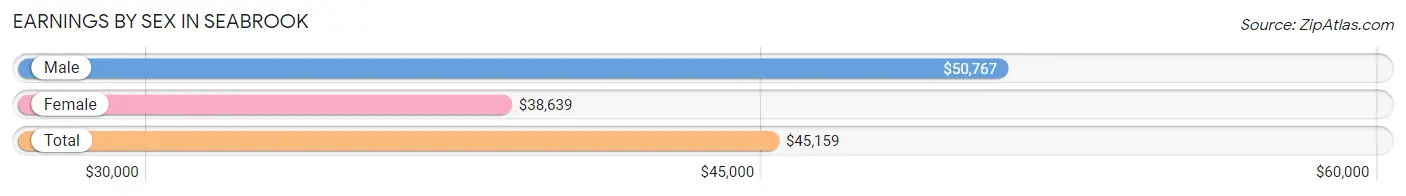
Earnings by Sex in Seabrook
Average Earnings in Seabrook are $45,159, $50,767 for men and $38,639 for women, a difference of 23.9%.
| Sex | Number | Average Earnings |
| Male | 5,553 (49.3%) | $50,767 |
| Female | 5,699 (50.6%) | $38,639 |
| Total | 11,252 (100.0%) | $45,159 |
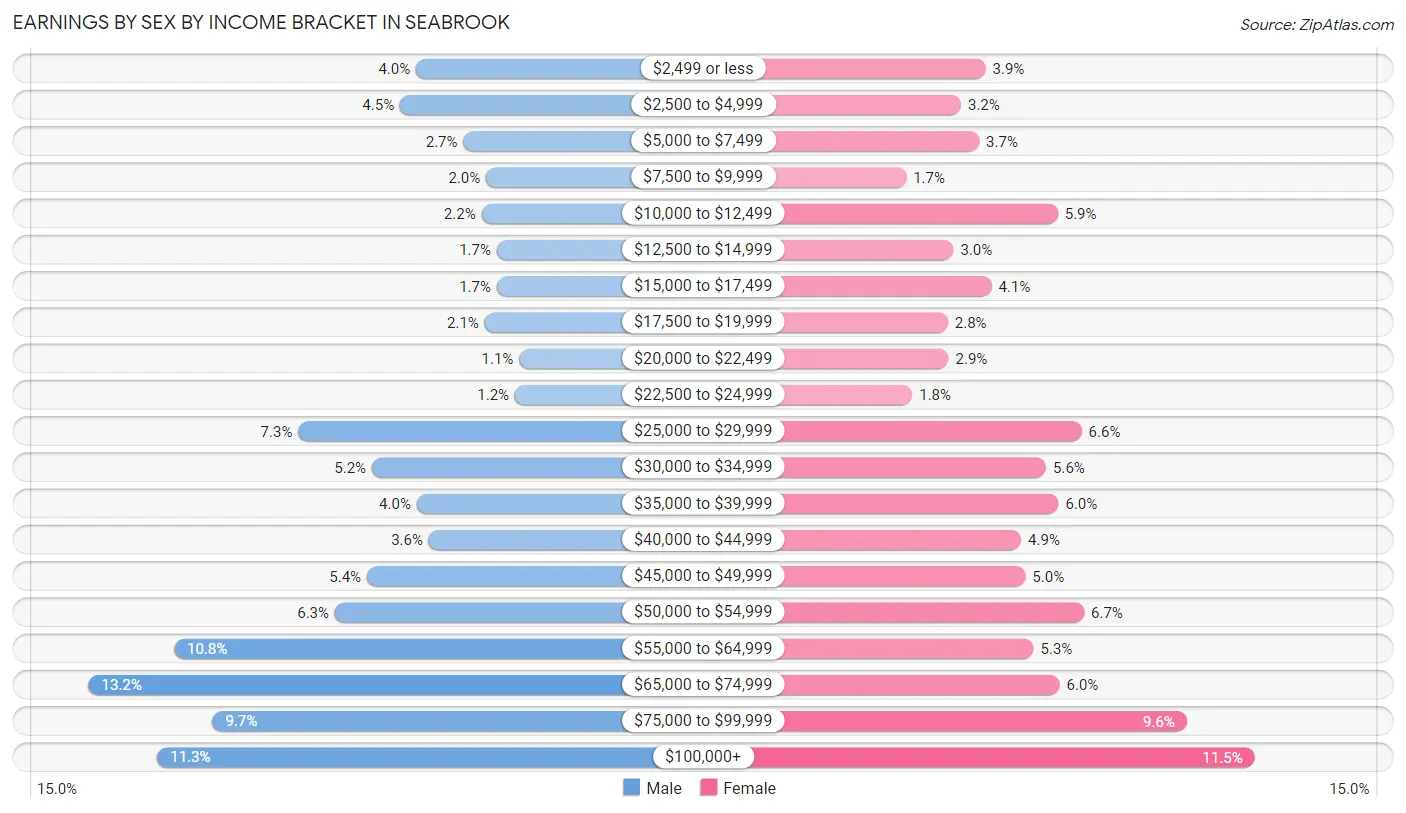
Earnings by Sex by Income Bracket in Seabrook
The most common earnings brackets in Seabrook are $65,000 to $74,999 for men (733 | 13.2%) and $100,000+ for women (653 | 11.5%).
| Income | Male | Female |
| $2,499 or less | 222 (4.0%) | 222 (3.9%) |
| $2,500 to $4,999 | 247 (4.4%) | 183 (3.2%) |
| $5,000 to $7,499 | 148 (2.7%) | 212 (3.7%) |
| $7,500 to $9,999 | 113 (2.0%) | 95 (1.7%) |
| $10,000 to $12,499 | 120 (2.2%) | 338 (5.9%) |
| $12,500 to $14,999 | 96 (1.7%) | 171 (3.0%) |
| $15,000 to $17,499 | 96 (1.7%) | 232 (4.1%) |
| $17,500 to $19,999 | 115 (2.1%) | 162 (2.8%) |
| $20,000 to $22,499 | 61 (1.1%) | 163 (2.9%) |
| $22,500 to $24,999 | 68 (1.2%) | 105 (1.8%) |
| $25,000 to $29,999 | 406 (7.3%) | 376 (6.6%) |
| $30,000 to $34,999 | 291 (5.2%) | 319 (5.6%) |
| $35,000 to $39,999 | 221 (4.0%) | 339 (5.9%) |
| $40,000 to $44,999 | 202 (3.6%) | 279 (4.9%) |
| $45,000 to $49,999 | 299 (5.4%) | 286 (5.0%) |
| $50,000 to $54,999 | 349 (6.3%) | 380 (6.7%) |
| $55,000 to $64,999 | 600 (10.8%) | 299 (5.2%) |
| $65,000 to $74,999 | 733 (13.2%) | 341 (6.0%) |
| $75,000 to $99,999 | 540 (9.7%) | 544 (9.6%) |
| $100,000+ | 626 (11.3%) | 653 (11.5%) |
| Total | 5,553 (100.0%) | 5,699 (100.0%) |
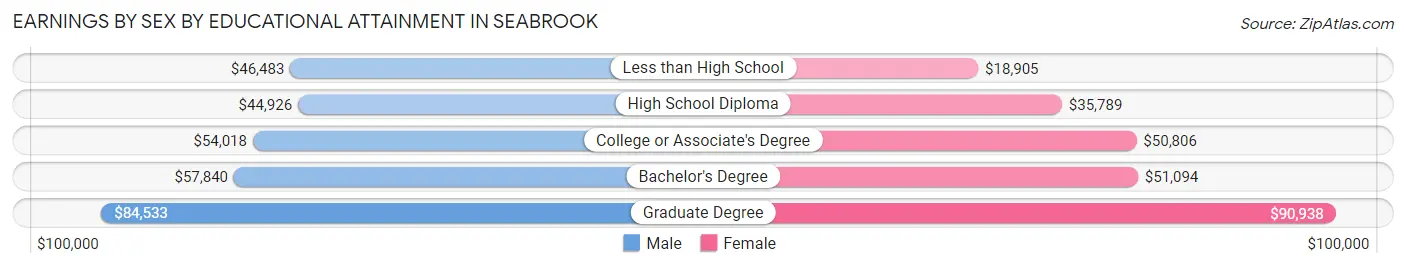
Earnings by Sex by Educational Attainment in Seabrook
Average earnings in Seabrook are $54,644 for men and $44,837 for women, a difference of 17.9%. Men with an educational attainment of graduate degree enjoy the highest average annual earnings of $84,533, while those with high school diploma education earn the least with $44,926. Women with an educational attainment of graduate degree earn the most with the average annual earnings of $90,938, while those with less than high school education have the smallest earnings of $18,905.
| Educational Attainment | Male Income | Female Income |
| Less than High School | $46,483 | $18,905 |
| High School Diploma | $44,926 | $35,789 |
| College or Associate's Degree | $54,018 | $50,806 |
| Bachelor's Degree | $57,840 | $51,094 |
| Graduate Degree | $84,533 | $90,938 |
| Total | $54,644 | $44,837 |
Family Income in Seabrook
Family Income Brackets in Seabrook
According to the Seabrook family income data, there are 1,187 families falling into the $100,000 to $149,999 income range, which is the most common income bracket and makes up 26.6% of all families. Conversely, the $10,000 to $14,999 income bracket is the least frequent group with only 71 families (1.6%) belonging to this category.
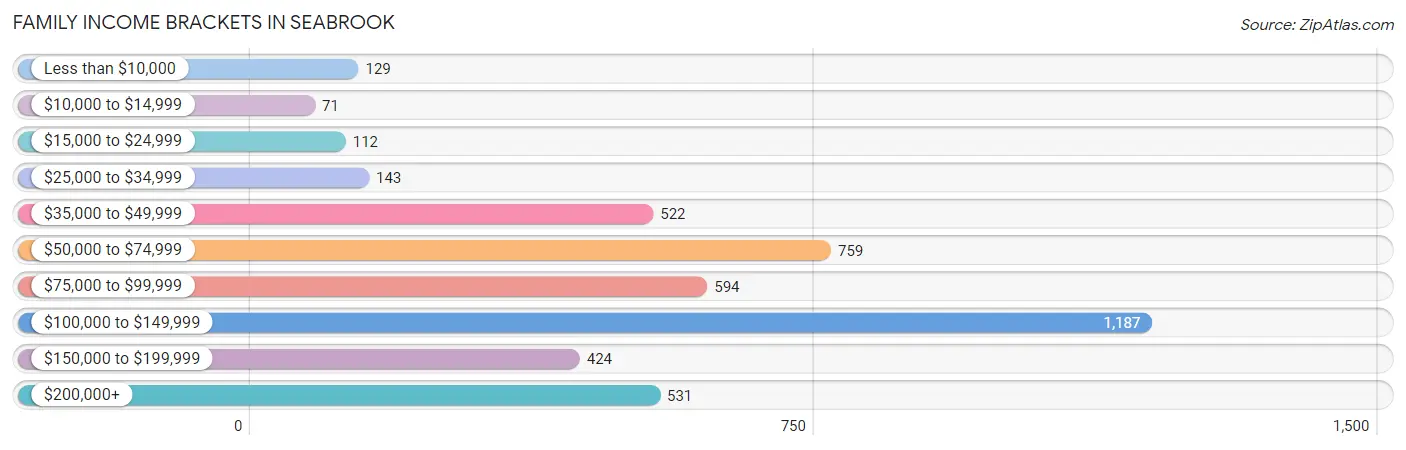
| Income Bracket | # Families | % Families |
| Less than $10,000 | 129 | 2.9% |
| $10,000 to $14,999 | 71 | 1.6% |
| $15,000 to $24,999 | 112 | 2.5% |
| $25,000 to $34,999 | 143 | 3.2% |
| $35,000 to $49,999 | 522 | 11.7% |
| $50,000 to $74,999 | 759 | 17.0% |
| $75,000 to $99,999 | 594 | 13.3% |
| $100,000 to $149,999 | 1,187 | 26.6% |
| $150,000 to $199,999 | 424 | 9.5% |
| $200,000+ | 531 | 11.9% |
Family Income by Famaliy Size in Seabrook
7+ person families (224 | 5.0%) account for the highest median family income in Seabrook with $146,667 per family, while 2-person families (1,745 | 39.1%) have the highest median income of $40,800 per family member.
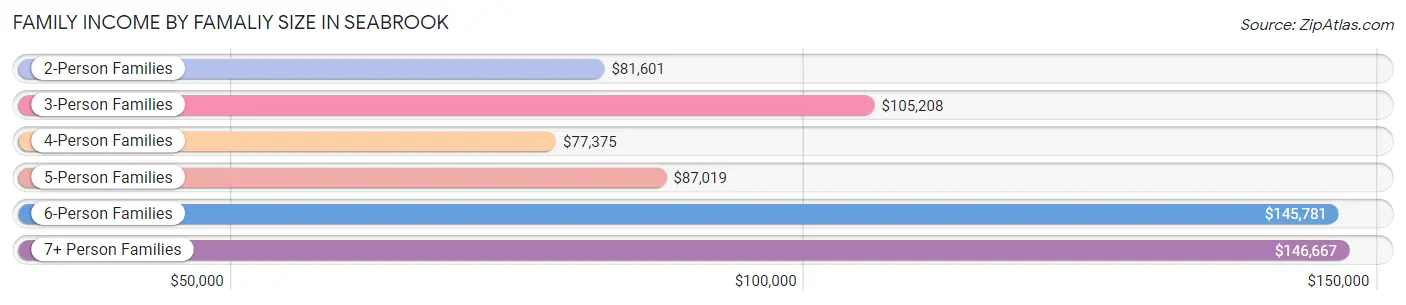
| Income Bracket | # Families | Median Income |
| 2-Person Families | 1,745 (39.1%) | $81,601 |
| 3-Person Families | 1,291 (28.9%) | $105,208 |
| 4-Person Families | 617 (13.8%) | $77,375 |
| 5-Person Families | 405 (9.1%) | $87,019 |
| 6-Person Families | 181 (4.1%) | $145,781 |
| 7+ Person Families | 224 (5.0%) | $146,667 |
| Total | 4,463 (100.0%) | $94,320 |
Family Income by Number of Earners in Seabrook
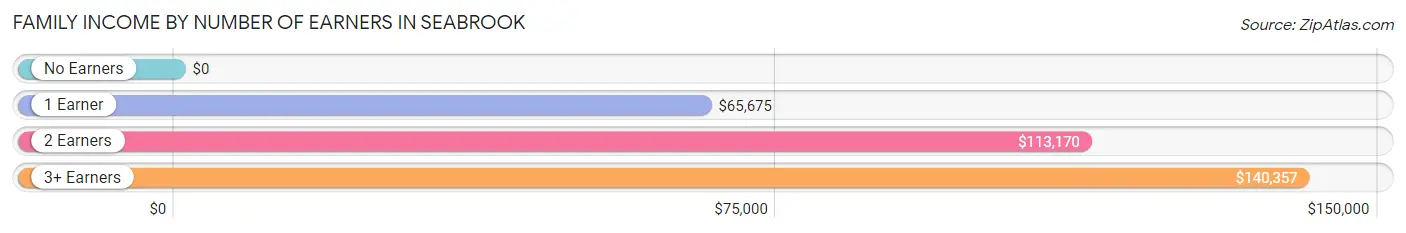
| Number of Earners | # Families | Median Income |
| No Earners | 276 (6.2%) | $0 |
| 1 Earner | 1,241 (27.8%) | $65,675 |
| 2 Earners | 2,018 (45.2%) | $113,170 |
| 3+ Earners | 928 (20.8%) | $140,357 |
| Total | 4,463 (100.0%) | $94,320 |
Household Income in Seabrook
Household Income Brackets in Seabrook
With 1,559 households falling in the category, the $100,000 to $149,999 income range is the most frequent in Seabrook, accounting for 26.3% of all households. In contrast, only 119 households (2.0%) fall into the $10,000 to $14,999 income bracket, making it the least populous group.
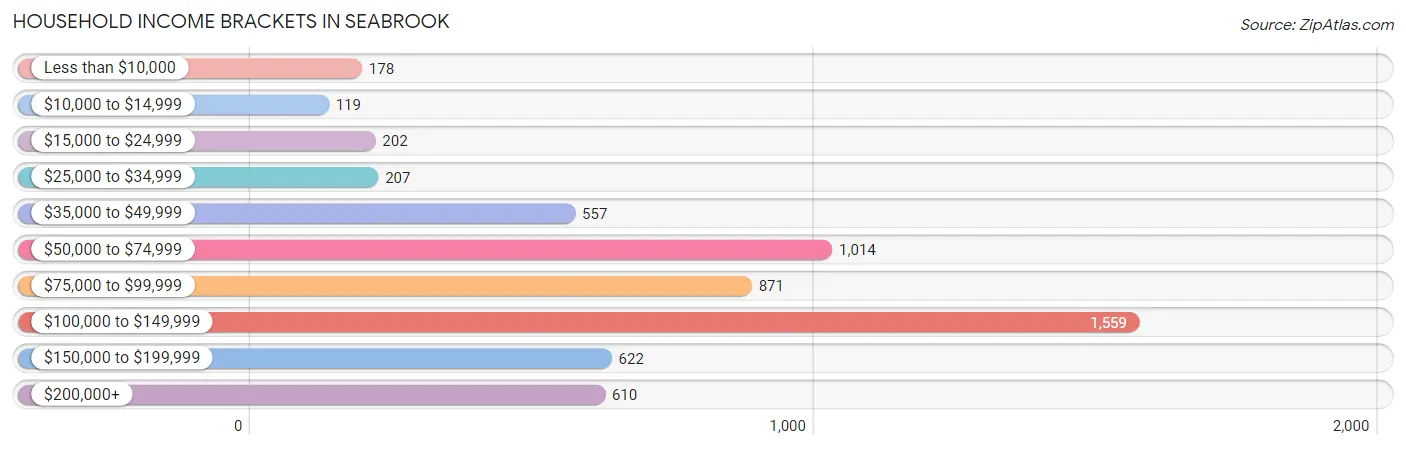
| Income Bracket | # Households | % Households |
| Less than $10,000 | 178 | 3.0% |
| $10,000 to $14,999 | 119 | 2.0% |
| $15,000 to $24,999 | 202 | 3.4% |
| $25,000 to $34,999 | 207 | 3.5% |
| $35,000 to $49,999 | 557 | 9.4% |
| $50,000 to $74,999 | 1,014 | 17.1% |
| $75,000 to $99,999 | 871 | 14.7% |
| $100,000 to $149,999 | 1,559 | 26.3% |
| $150,000 to $199,999 | 622 | 10.5% |
| $200,000+ | 610 | 10.3% |
Household Income by Householder Age in Seabrook
The median household income in Seabrook is $96,078, with the highest median household income of $102,880 found in the 45 to 64 years age bracket for the primary householder. A total of 2,447 households (41.3%) fall into this category. Meanwhile, the 15 to 24 years age bracket for the primary householder has the lowest median household income of $0, with 66 households (1.1%) in this group.
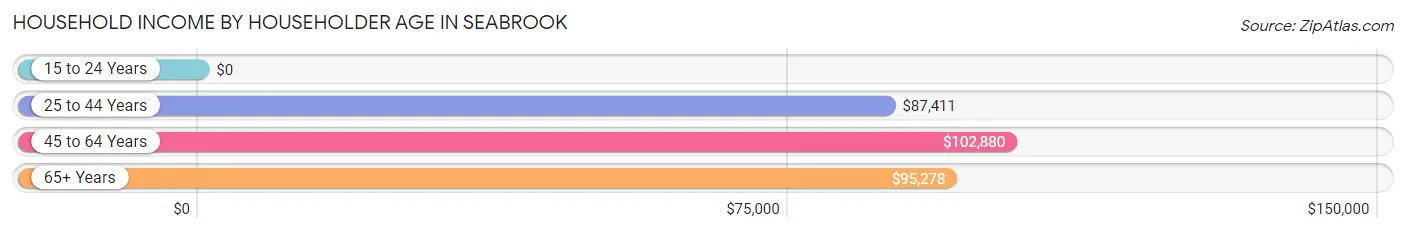
| Income Bracket | # Households | Median Income |
| 15 to 24 Years | 66 (1.1%) | $0 |
| 25 to 44 Years | 2,054 (34.6%) | $87,411 |
| 45 to 64 Years | 2,447 (41.3%) | $102,880 |
| 65+ Years | 1,360 (23.0%) | $95,278 |
| Total | 5,927 (100.0%) | $96,078 |
Poverty in Seabrook
Income Below Poverty by Sex and Age in Seabrook
With 8.4% poverty level for males and 12.5% for females among the residents of Seabrook, 12 to 14 year old males and 12 to 14 year old females are the most vulnerable to poverty, with 67 males (22.6%) and 60 females (19.9%) in their respective age groups living below the poverty level.
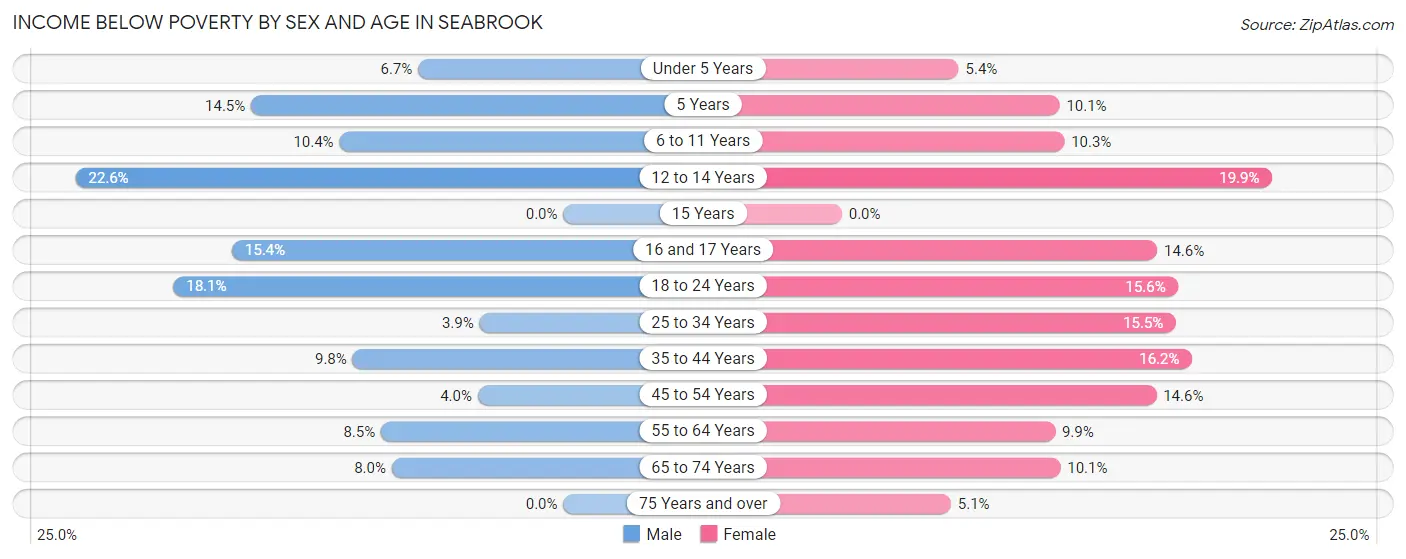
| Age Bracket | Male | Female |
| Under 5 Years | 65 (6.7%) | 41 (5.4%) |
| 5 Years | 10 (14.5%) | 10 (10.1%) |
| 6 to 11 Years | 77 (10.4%) | 86 (10.3%) |
| 12 to 14 Years | 67 (22.6%) | 60 (19.9%) |
| 15 Years | 0 (0.0%) | 0 (0.0%) |
| 16 and 17 Years | 18 (15.4%) | 48 (14.6%) |
| 18 to 24 Years | 126 (18.1%) | 115 (15.6%) |
| 25 to 34 Years | 55 (3.9%) | 275 (15.5%) |
| 35 to 44 Years | 142 (9.8%) | 210 (16.2%) |
| 45 to 54 Years | 41 (4.0%) | 176 (14.6%) |
| 55 to 64 Years | 100 (8.5%) | 138 (9.9%) |
| 65 to 74 Years | 52 (8.0%) | 99 (10.1%) |
| 75 Years and over | 0 (0.0%) | 26 (5.1%) |
| Total | 753 (8.4%) | 1,284 (12.5%) |
Income Above Poverty by Sex and Age in Seabrook
According to the poverty statistics in Seabrook, males aged 15 years and females aged 15 years are the age groups that are most secure financially, with 100.0% of males and 100.0% of females in these age groups living above the poverty line.
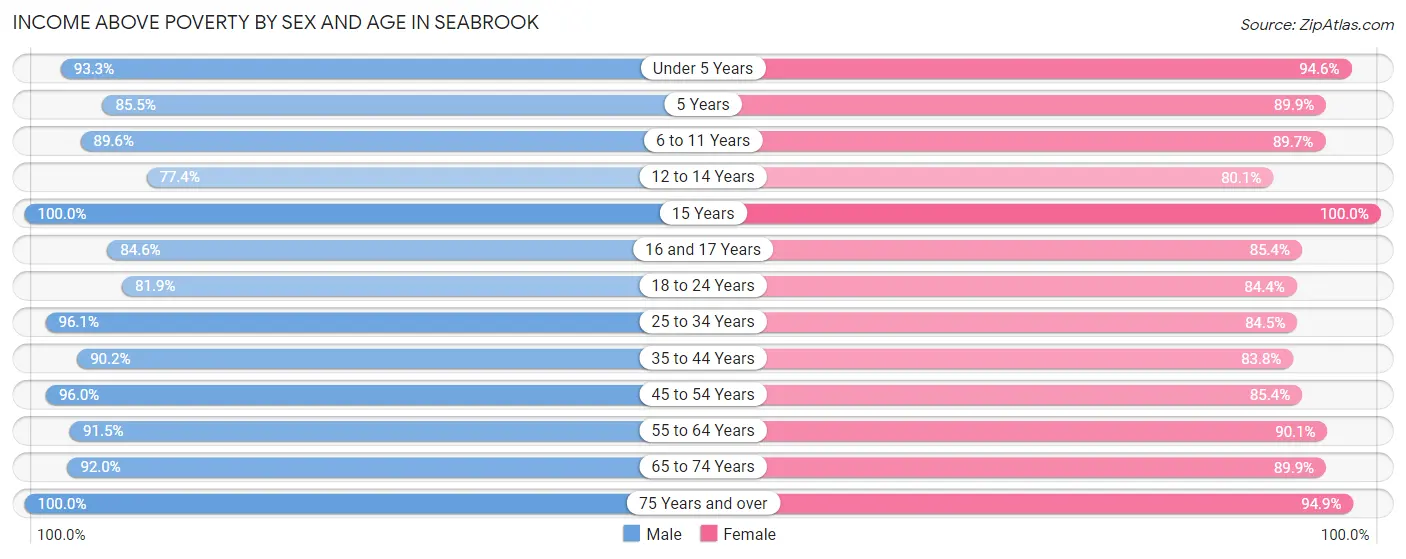
| Age Bracket | Male | Female |
| Under 5 Years | 900 (93.3%) | 715 (94.6%) |
| 5 Years | 59 (85.5%) | 89 (89.9%) |
| 6 to 11 Years | 664 (89.6%) | 747 (89.7%) |
| 12 to 14 Years | 229 (77.4%) | 241 (80.1%) |
| 15 Years | 90 (100.0%) | 18 (100.0%) |
| 16 and 17 Years | 99 (84.6%) | 280 (85.4%) |
| 18 to 24 Years | 570 (81.9%) | 623 (84.4%) |
| 25 to 34 Years | 1,359 (96.1%) | 1,503 (84.5%) |
| 35 to 44 Years | 1,310 (90.2%) | 1,085 (83.8%) |
| 45 to 54 Years | 992 (96.0%) | 1,030 (85.4%) |
| 55 to 64 Years | 1,082 (91.5%) | 1,258 (90.1%) |
| 65 to 74 Years | 601 (92.0%) | 877 (89.9%) |
| 75 Years and over | 214 (100.0%) | 488 (94.9%) |
| Total | 8,169 (91.6%) | 8,954 (87.5%) |
Income Below Poverty Among Married-Couple Families in Seabrook
The poverty statistics for married-couple families in Seabrook show that 3.2% or 79 of the total 2,482 families live below the poverty line. Families with 5 or more children have the highest poverty rate of 11.5%, comprising of 9 families. On the other hand, families with 1 or 2 children have the lowest poverty rate of 0.0%, which includes 0 families.
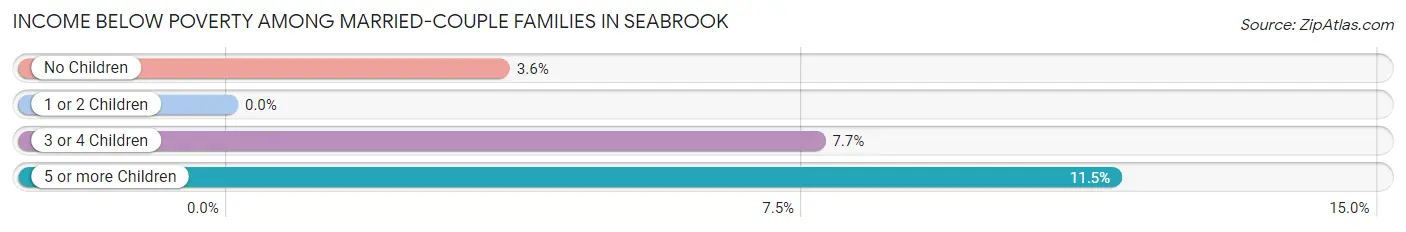
| Children | Above Poverty | Below Poverty |
| No Children | 1,251 (96.5%) | 46 (3.5%) |
| 1 or 2 Children | 794 (100.0%) | 0 (0.0%) |
| 3 or 4 Children | 289 (92.3%) | 24 (7.7%) |
| 5 or more Children | 69 (88.5%) | 9 (11.5%) |
| Total | 2,403 (96.8%) | 79 (3.2%) |
Income Below Poverty Among Single-Parent Households in Seabrook
According to the poverty data in Seabrook, 5.5% or 28 single-father households and 15.2% or 223 single-mother households are living below the poverty line. Among single-father households, those with no children have the highest poverty rate, with 28 households (12.0%) experiencing poverty. Likewise, among single-mother households, those with 5 or more children have the highest poverty rate, with 16 households (100.0%) falling below the poverty line.
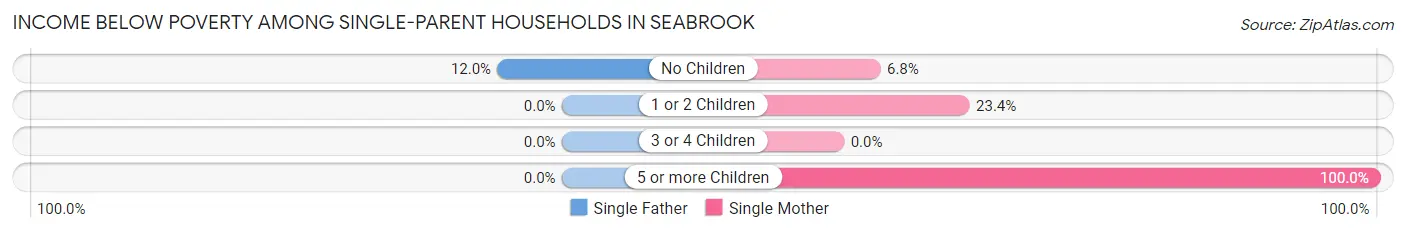
| Children | Single Father | Single Mother |
| No Children | 28 (12.0%) | 49 (6.8%) |
| 1 or 2 Children | 0 (0.0%) | 158 (23.4%) |
| 3 or 4 Children | 0 (0.0%) | 0 (0.0%) |
| 5 or more Children | 0 (0.0%) | 16 (100.0%) |
| Total | 28 (5.5%) | 223 (15.2%) |
Income Below Poverty Among Married-Couple vs Single-Parent Households in Seabrook
The poverty data for Seabrook shows that 79 of the married-couple family households (3.2%) and 251 of the single-parent households (12.7%) are living below the poverty level. Within the married-couple family households, those with 5 or more children have the highest poverty rate, with 9 households (11.5%) falling below the poverty line. Among the single-parent households, those with 5 or more children have the highest poverty rate, with 16 household (80.0%) living below poverty.
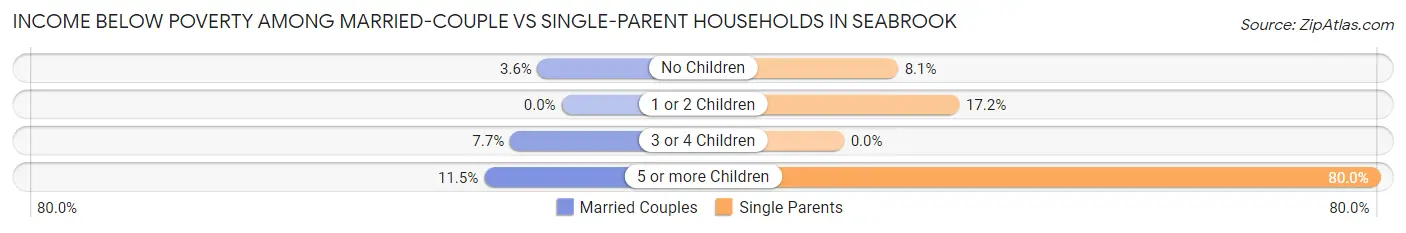
| Children | Married-Couple Families | Single-Parent Households |
| No Children | 46 (3.5%) | 77 (8.1%) |
| 1 or 2 Children | 0 (0.0%) | 158 (17.2%) |
| 3 or 4 Children | 24 (7.7%) | 0 (0.0%) |
| 5 or more Children | 9 (11.5%) | 16 (80.0%) |
| Total | 79 (3.2%) | 251 (12.7%) |
Race in Seabrook
The most populous races in Seabrook are Black / African American (11,567 | 59.7%), Hispanic or Latino (5,019 | 25.9%), and Some other Race (2,744 | 14.2%).
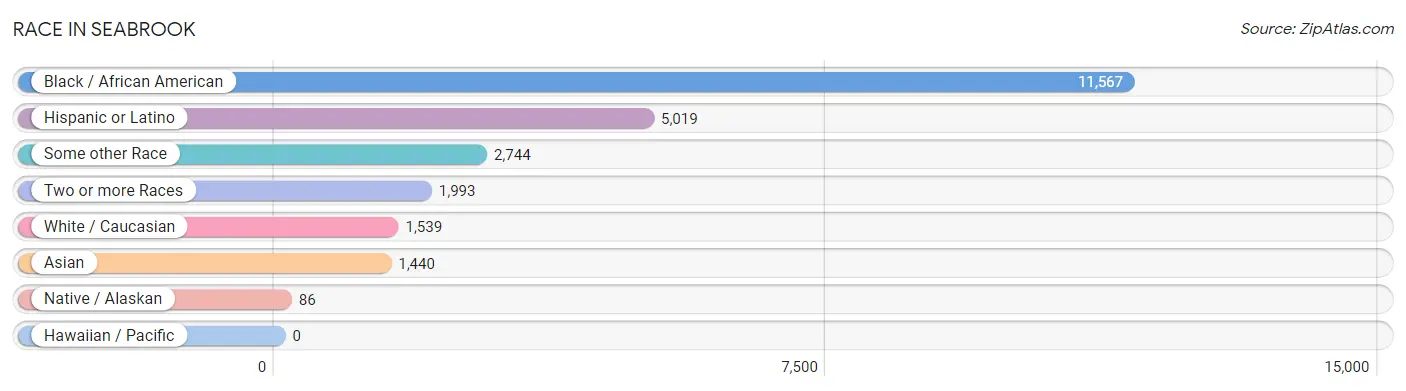
| Race | # Population | % Population |
| Asian | 1,440 | 7.4% |
| Black / African American | 11,567 | 59.7% |
| Hawaiian / Pacific | 0 | 0.0% |
| Hispanic or Latino | 5,019 | 25.9% |
| Native / Alaskan | 86 | 0.4% |
| White / Caucasian | 1,539 | 8.0% |
| Two or more Races | 1,993 | 10.3% |
| Some other Race | 2,744 | 14.2% |
| Total | 19,369 | 100.0% |
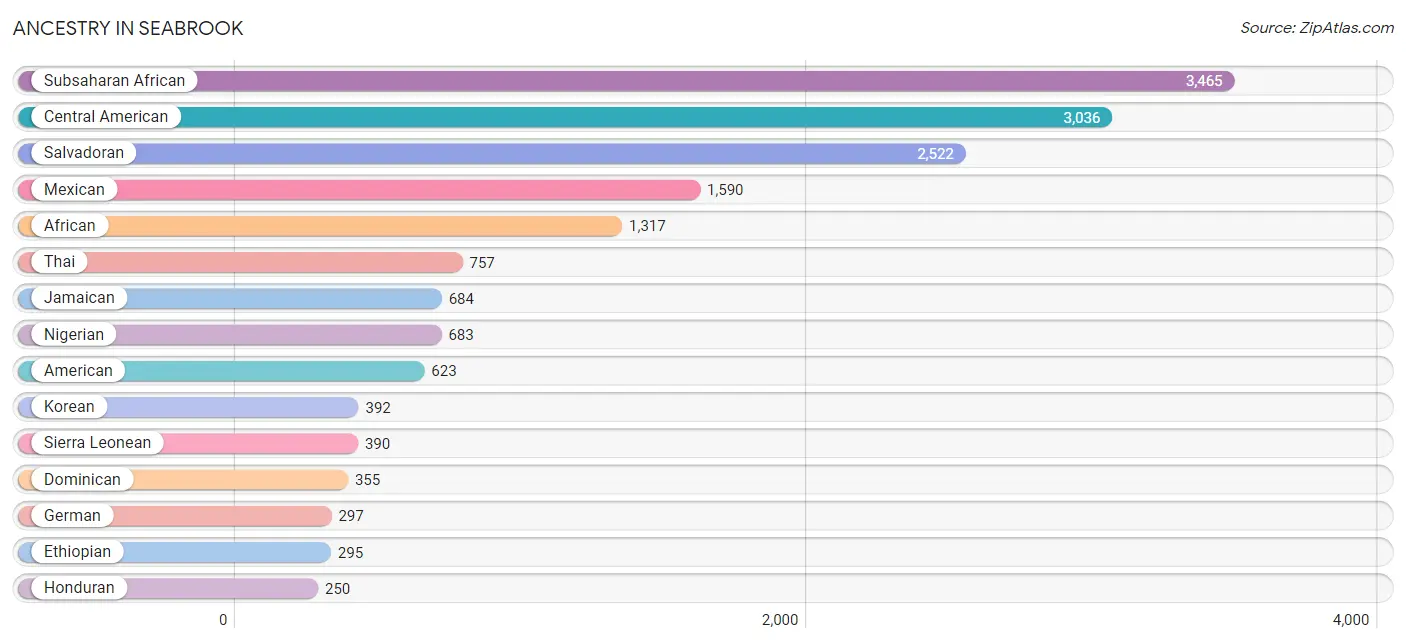
Ancestry in Seabrook
The most populous ancestries reported in Seabrook are Subsaharan African (3,465 | 17.9%), Central American (3,036 | 15.7%), Salvadoran (2,522 | 13.0%), Mexican (1,590 | 8.2%), and African (1,317 | 6.8%), together accounting for 61.6% of all Seabrook residents.
| Ancestry | # Population | % Population |
| Afghan | 43 | 0.2% |
| African | 1,317 | 6.8% |
| American | 623 | 3.2% |
| Arab | 44 | 0.2% |
| Argentinean | 1 | 0.0% |
| Bhutanese | 21 | 0.1% |
| Blackfeet | 30 | 0.2% |
| British | 10 | 0.1% |
| British West Indian | 73 | 0.4% |
| Burmese | 64 | 0.3% |
| Canadian | 11 | 0.1% |
| Carpatho Rusyn | 23 | 0.1% |
| Central American | 3,036 | 15.7% |
| Central American Indian | 130 | 0.7% |
| Cherokee | 26 | 0.1% |
| Colombian | 11 | 0.1% |
| Dominican | 355 | 1.8% |
| Eastern European | 15 | 0.1% |
| English | 170 | 0.9% |
| Ethiopian | 295 | 1.5% |
| European | 13 | 0.1% |
| Filipino | 1 | 0.0% |
| French | 21 | 0.1% |
| German | 297 | 1.5% |
| Ghanaian | 75 | 0.4% |
| Greek | 16 | 0.1% |
| Guatemalan | 208 | 1.1% |
| Guyanese | 22 | 0.1% |
| Haitian | 149 | 0.8% |
| Honduran | 250 | 1.3% |
| Indian (Asian) | 39 | 0.2% |
| Irish | 228 | 1.2% |
| Italian | 125 | 0.6% |
| Jamaican | 684 | 3.5% |
| Japanese | 17 | 0.1% |
| Kenyan | 7 | 0.0% |
| Korean | 392 | 2.0% |
| Lebanese | 12 | 0.1% |
| Liberian | 16 | 0.1% |
| Mexican | 1,590 | 8.2% |
| Mexican American Indian | 54 | 0.3% |
| Native Hawaiian | 9 | 0.1% |
| Nigerian | 683 | 3.5% |
| Norwegian | 8 | 0.0% |
| Panamanian | 56 | 0.3% |
| Peruvian | 10 | 0.1% |
| Polish | 41 | 0.2% |
| Russian | 39 | 0.2% |
| Salvadoran | 2,522 | 13.0% |
| Scotch-Irish | 20 | 0.1% |
| Scottish | 24 | 0.1% |
| Sierra Leonean | 390 | 2.0% |
| Slovak | 2 | 0.0% |
| South American | 22 | 0.1% |
| South American Indian | 25 | 0.1% |
| Spaniard | 16 | 0.1% |
| Sri Lankan | 129 | 0.7% |
| Subsaharan African | 3,465 | 17.9% |
| Sudanese | 23 | 0.1% |
| Swedish | 40 | 0.2% |
| Thai | 757 | 3.9% |
| Trinidadian and Tobagonian | 52 | 0.3% |
| Turkish | 38 | 0.2% |
| Welsh | 23 | 0.1% |
| West Indian | 56 | 0.3% | View All 65 Rows |
Immigrants in Seabrook
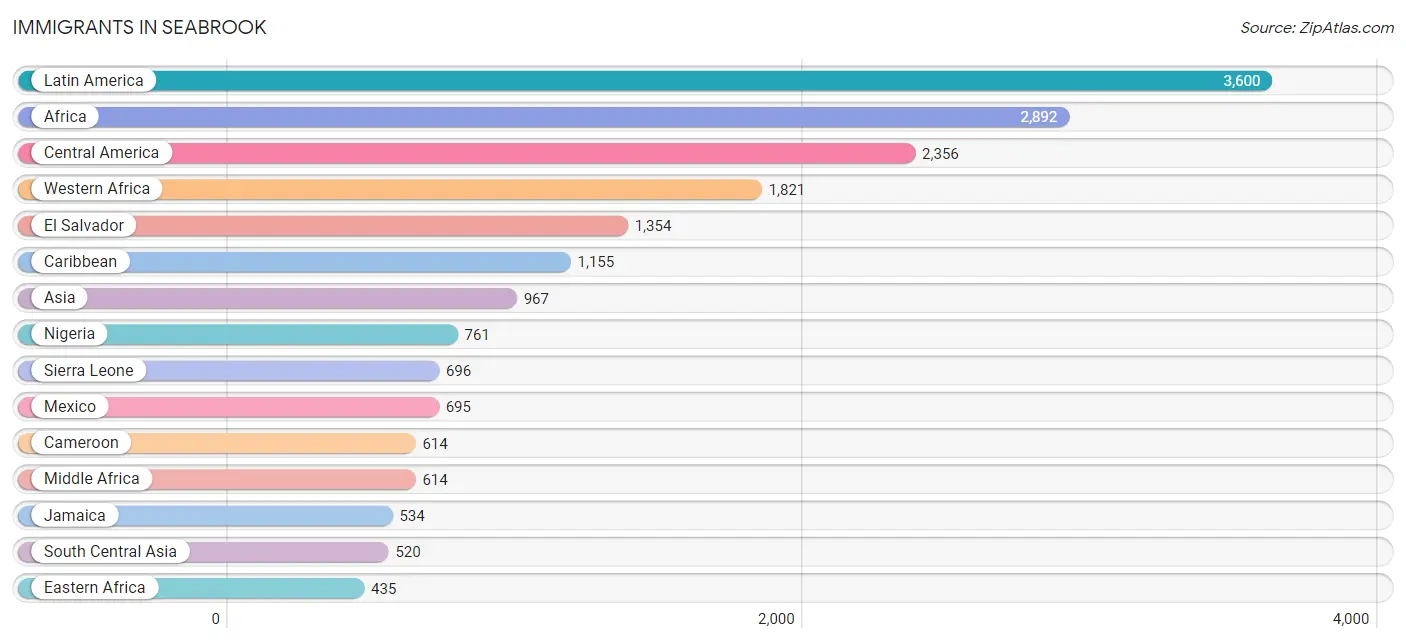
The most numerous immigrant groups reported in Seabrook came from Latin America (3,600 | 18.6%), Africa (2,892 | 14.9%), Central America (2,356 | 12.2%), Western Africa (1,821 | 9.4%), and El Salvador (1,354 | 7.0%), together accounting for 62.1% of all Seabrook residents.
| Immigration Origin | # Population | % Population |
| Afghanistan | 120 | 0.6% |
| Africa | 2,892 | 14.9% |
| Argentina | 1 | 0.0% |
| Asia | 967 | 5.0% |
| Brazil | 43 | 0.2% |
| Cameroon | 614 | 3.2% |
| Canada | 47 | 0.2% |
| Caribbean | 1,155 | 6.0% |
| Central America | 2,356 | 12.2% |
| China | 19 | 0.1% |
| Cuba | 33 | 0.2% |
| Dominica | 43 | 0.2% |
| Dominican Republic | 271 | 1.4% |
| Eastern Africa | 435 | 2.2% |
| Eastern Asia | 48 | 0.3% |
| Eastern Europe | 45 | 0.2% |
| Egypt | 11 | 0.1% |
| El Salvador | 1,354 | 7.0% |
| Ethiopia | 389 | 2.0% |
| Europe | 159 | 0.8% |
| France | 86 | 0.4% |
| Germany | 11 | 0.1% |
| Ghana | 176 | 0.9% |
| Grenada | 30 | 0.2% |
| Guatemala | 99 | 0.5% |
| Guyana | 22 | 0.1% |
| Haiti | 103 | 0.5% |
| Honduras | 174 | 0.9% |
| India | 314 | 1.6% |
| Iraq | 21 | 0.1% |
| Italy | 17 | 0.1% |
| Jamaica | 534 | 2.8% |
| Kenya | 7 | 0.0% |
| Korea | 29 | 0.2% |
| Latin America | 3,600 | 18.6% |
| Liberia | 68 | 0.4% |
| Mexico | 695 | 3.6% |
| Middle Africa | 614 | 3.2% |
| Nigeria | 761 | 3.9% |
| Northern Africa | 11 | 0.1% |
| Pakistan | 86 | 0.4% |
| Panama | 34 | 0.2% |
| Peru | 12 | 0.1% |
| Philippines | 238 | 1.2% |
| Romania | 36 | 0.2% |
| Russia | 9 | 0.1% |
| Sierra Leone | 696 | 3.6% |
| South America | 89 | 0.5% |
| South Central Asia | 520 | 2.7% |
| South Eastern Asia | 340 | 1.8% |
| Southern Europe | 17 | 0.1% |
| Taiwan | 19 | 0.1% |
| Trinidad and Tobago | 133 | 0.7% |
| Turkey | 38 | 0.2% |
| Uruguay | 11 | 0.1% |
| Vietnam | 102 | 0.5% |
| Western Africa | 1,821 | 9.4% |
| Western Asia | 59 | 0.3% |
| Western Europe | 97 | 0.5% | View All 59 Rows |
Sex and Age in Seabrook
Sex and Age in Seabrook
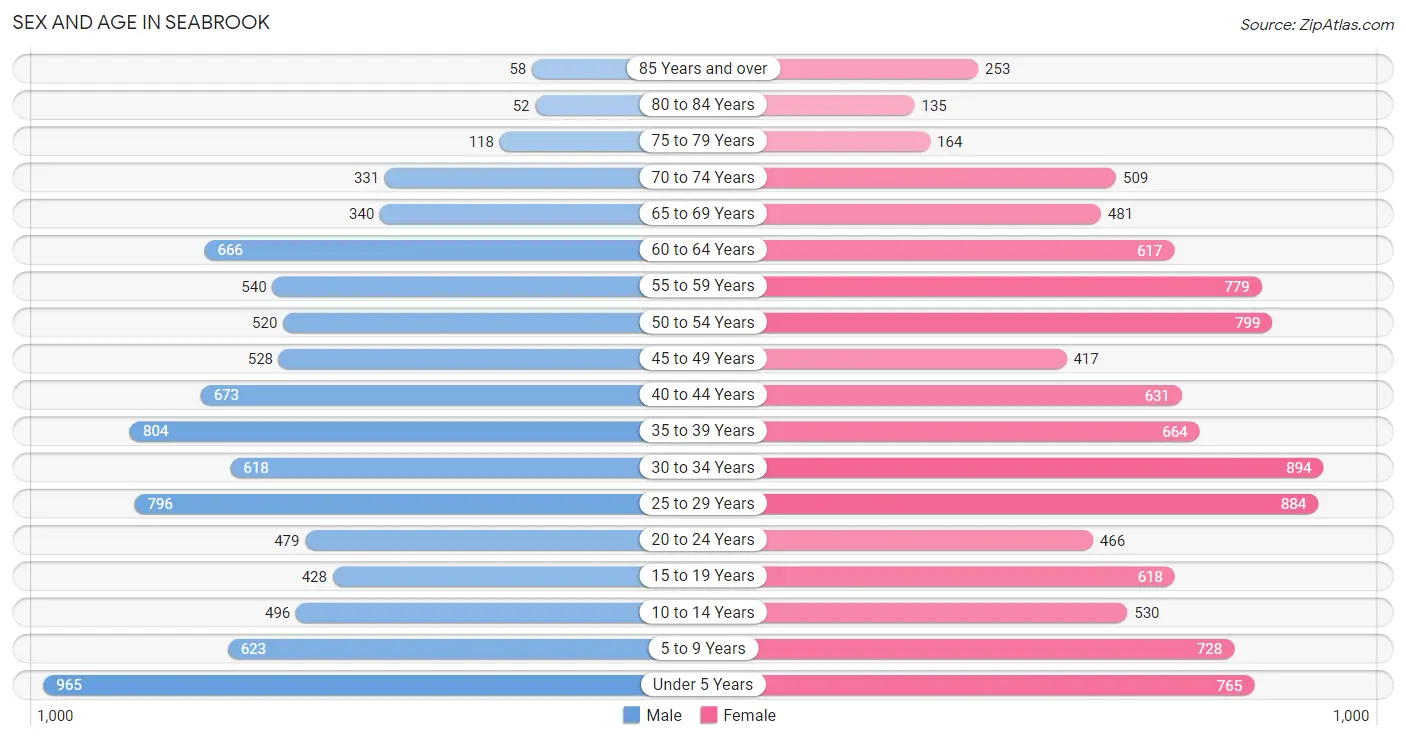
The most populous age groups in Seabrook are Under 5 Years (965 | 10.7%) for men and 30 to 34 Years (894 | 8.6%) for women.
| Age Bracket | Male | Female |
| Under 5 Years | 965 (10.7%) | 765 (7.4%) |
| 5 to 9 Years | 623 (6.9%) | 728 (7.0%) |
| 10 to 14 Years | 496 (5.5%) | 530 (5.1%) |
| 15 to 19 Years | 428 (4.7%) | 618 (6.0%) |
| 20 to 24 Years | 479 (5.3%) | 466 (4.5%) |
| 25 to 29 Years | 796 (8.8%) | 884 (8.6%) |
| 30 to 34 Years | 618 (6.8%) | 894 (8.6%) |
| 35 to 39 Years | 804 (8.9%) | 664 (6.4%) |
| 40 to 44 Years | 673 (7.4%) | 631 (6.1%) |
| 45 to 49 Years | 528 (5.8%) | 417 (4.0%) |
| 50 to 54 Years | 520 (5.8%) | 799 (7.7%) |
| 55 to 59 Years | 540 (6.0%) | 779 (7.5%) |
| 60 to 64 Years | 666 (7.4%) | 617 (6.0%) |
| 65 to 69 Years | 340 (3.8%) | 481 (4.6%) |
| 70 to 74 Years | 331 (3.7%) | 509 (4.9%) |
| 75 to 79 Years | 118 (1.3%) | 164 (1.6%) |
| 80 to 84 Years | 52 (0.6%) | 135 (1.3%) |
| 85 Years and over | 58 (0.6%) | 253 (2.5%) |
| Total | 9,035 (100.0%) | 10,334 (100.0%) |
Families and Households in Seabrook
Median Family Size in Seabrook
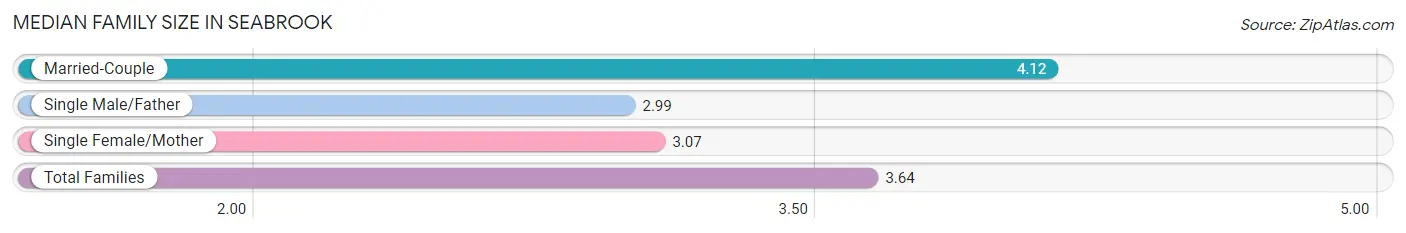
The median family size in Seabrook is 3.64 persons per family, with married-couple families (2,482 | 55.6%) accounting for the largest median family size of 4.12 persons per family. On the other hand, single male/father families (510 | 11.4%) represent the smallest median family size with 2.99 persons per family.
| Family Type | # Families | Family Size |
| Married-Couple | 2,482 (55.6%) | 4.12 |
| Single Male/Father | 510 (11.4%) | 2.99 |
| Single Female/Mother | 1,471 (33.0%) | 3.07 |
| Total Families | 4,463 (100.0%) | 3.64 |
Median Household Size in Seabrook
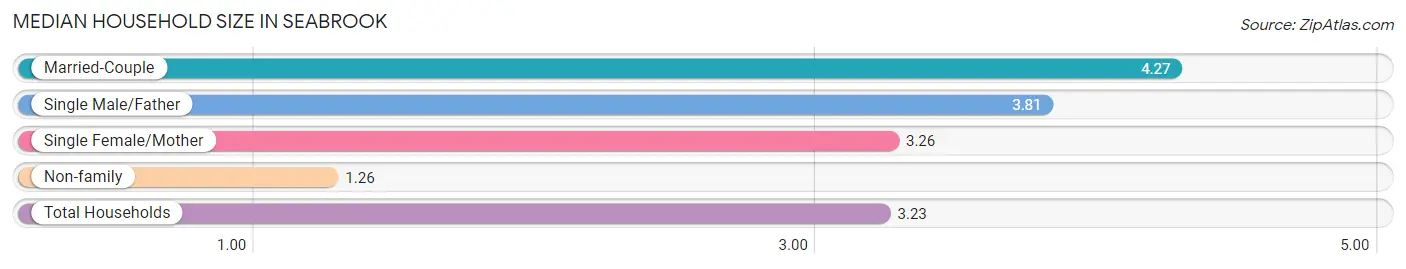
The median household size in Seabrook is 3.23 persons per household, with married-couple households (2,482 | 41.9%) accounting for the largest median household size of 4.27 persons per household. non-family households (1,464 | 24.7%) represent the smallest median household size with 1.26 persons per household.
| Household Type | # Households | Household Size |
| Married-Couple | 2,482 (41.9%) | 4.27 |
| Single Male/Father | 510 (8.6%) | 3.81 |
| Single Female/Mother | 1,471 (24.8%) | 3.26 |
| Non-family | 1,464 (24.7%) | 1.26 |
| Total Households | 5,927 (100.0%) | 3.23 |
Household Size by Marriage Status in Seabrook
Out of a total of 5,927 households in Seabrook, 4,463 (75.3%) are family households, while 1,464 (24.7%) are nonfamily households. The most numerous type of family households are 2-person households, comprising 1,432, and the most common type of nonfamily households are 1-person households, comprising 1,273.
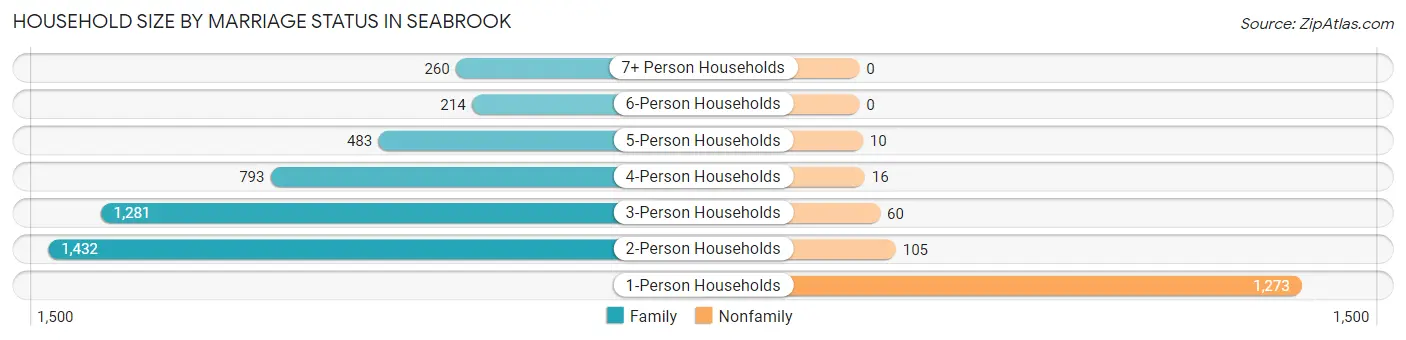
| Household Size | Family Households | Nonfamily Households |
| 1-Person Households | - | 1,273 (21.5%) |
| 2-Person Households | 1,432 (24.2%) | 105 (1.8%) |
| 3-Person Households | 1,281 (21.6%) | 60 (1.0%) |
| 4-Person Households | 793 (13.4%) | 16 (0.3%) |
| 5-Person Households | 483 (8.2%) | 10 (0.2%) |
| 6-Person Households | 214 (3.6%) | 0 (0.0%) |
| 7+ Person Households | 260 (4.4%) | 0 (0.0%) |
| Total | 4,463 (75.3%) | 1,464 (24.7%) |
Female Fertility in Seabrook
Fertility by Age in Seabrook
Average fertility rate in Seabrook is 95.0 births per 1,000 women. Women in the age bracket of 20 to 34 years have the highest fertility rate with 164.0 births per 1,000 women. Women in the age bracket of 20 to 34 years acount for 81.6% of all women with births.
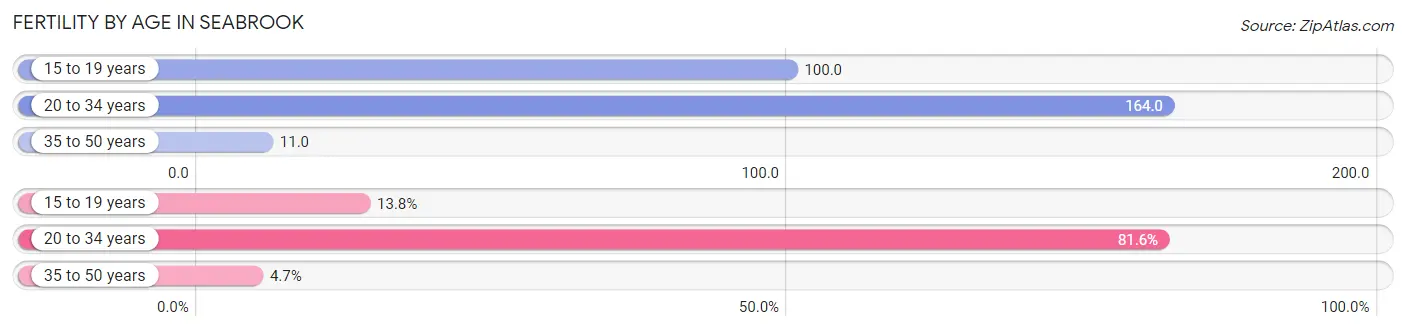
| Age Bracket | Women with Births | Births / 1,000 Women |
| 15 to 19 years | 62 (13.8%) | 100.0 |
| 20 to 34 years | 368 (81.6%) | 164.0 |
| 35 to 50 years | 21 (4.7%) | 11.0 |
| Total | 451 (100.0%) | 95.0 |
Fertility by Age by Marriage Status in Seabrook
46.1% of women with births (451) in Seabrook are married. The highest percentage of unmarried women with births falls into 15 to 19 years age bracket with 100.0% of them unmarried at the time of birth, while the lowest percentage of unmarried women with births belong to 35 to 50 years age bracket with 0.0% of them unmarried.
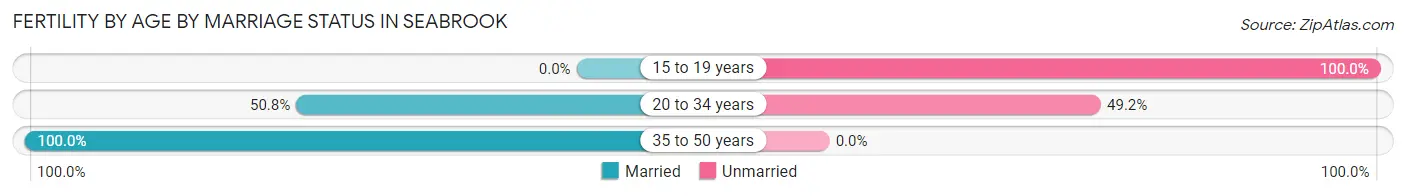
| Age Bracket | Married | Unmarried |
| 15 to 19 years | 0 (0.0%) | 62 (100.0%) |
| 20 to 34 years | 187 (50.8%) | 181 (49.2%) |
| 35 to 50 years | 21 (100.0%) | 0 (0.0%) |
| Total | 208 (46.1%) | 243 (53.9%) |
Fertility by Education in Seabrook
Average fertility rate in Seabrook is 95.0 births per 1,000 women. Women with the education attainment of bachelor's degree have the highest fertility rate of 263.0 births per 1,000 women, while women with the education attainment of college or associate's degree have the lowest fertility at 41.0 births per 1,000 women. Women with the education attainment of bachelor's degree represent 46.1% of all women with births.
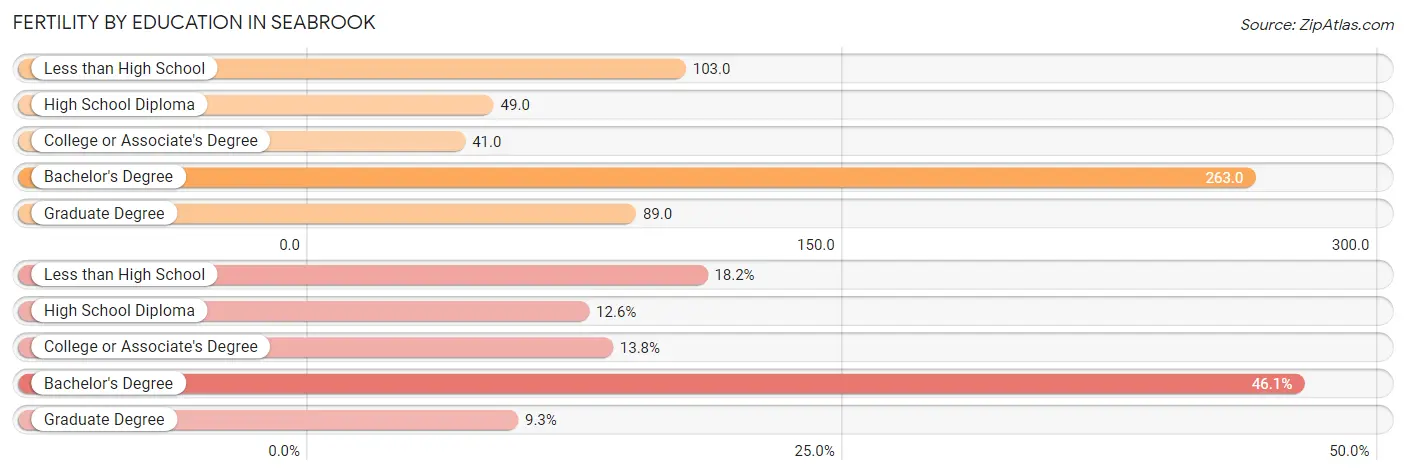
| Educational Attainment | Women with Births | Births / 1,000 Women |
| Less than High School | 82 (18.2%) | 103.0 |
| High School Diploma | 57 (12.6%) | 49.0 |
| College or Associate's Degree | 62 (13.8%) | 41.0 |
| Bachelor's Degree | 208 (46.1%) | 263.0 |
| Graduate Degree | 42 (9.3%) | 89.0 |
| Total | 451 (100.0%) | 95.0 |
Fertility by Education by Marriage Status in Seabrook
53.9% of women with births in Seabrook are unmarried. Women with the educational attainment of college or associate's degree are most likely to be married with 100.0% of them married at childbirth, while women with the educational attainment of less than high school are least likely to be married with 89.0% of them unmarried at childbirth.
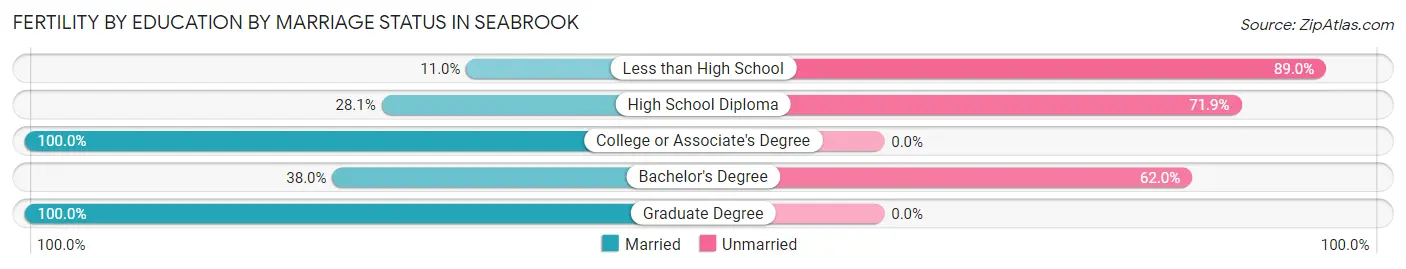
| Educational Attainment | Married | Unmarried |
| Less than High School | 9 (11.0%) | 73 (89.0%) |
| High School Diploma | 16 (28.1%) | 41 (71.9%) |
| College or Associate's Degree | 62 (100.0%) | 0 (0.0%) |
| Bachelor's Degree | 79 (38.0%) | 129 (62.0%) |
| Graduate Degree | 42 (100.0%) | 0 (0.0%) |
| Total | 208 (46.1%) | 243 (53.9%) |
Employment Characteristics in Seabrook
Employment by Class of Employer in Seabrook
Among the 9,894 employed individuals in Seabrook, private company employees (6,220 | 62.9%), not-for-profit organizations (999 | 10.1%), and federal government employees (914 | 9.2%) make up the most common classes of employment.
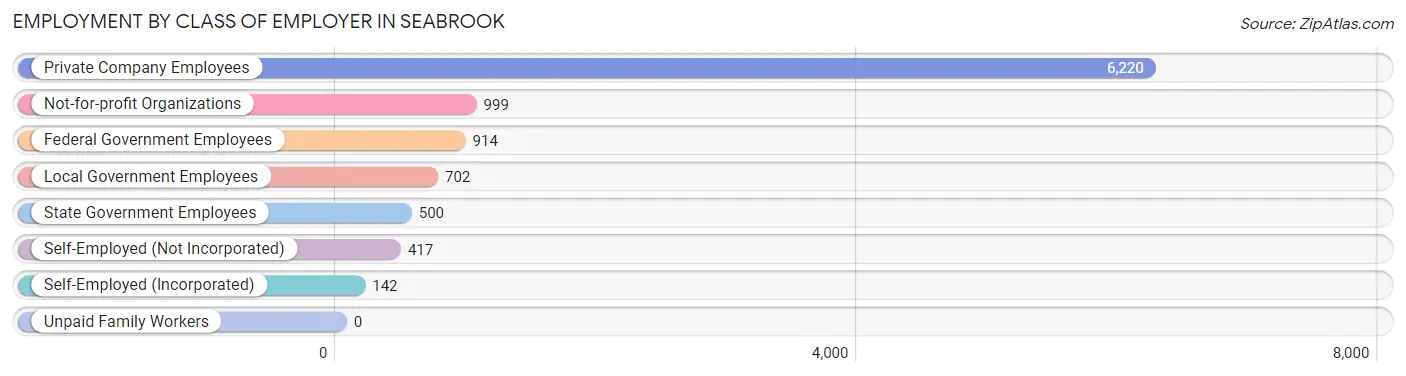
| Employer Class | # Employees | % Employees |
| Private Company Employees | 6,220 | 62.9% |
| Self-Employed (Incorporated) | 142 | 1.4% |
| Self-Employed (Not Incorporated) | 417 | 4.2% |
| Not-for-profit Organizations | 999 | 10.1% |
| Local Government Employees | 702 | 7.1% |
| State Government Employees | 500 | 5.1% |
| Federal Government Employees | 914 | 9.2% |
| Unpaid Family Workers | 0 | 0.0% |
| Total | 9,894 | 100.0% |
Employment Status by Age in Seabrook
According to the labor force statistics for Seabrook, out of the total population over 16 years of age (15,153), 72.6% or 11,001 individuals are in the labor force, with 7.1% or 781 of them unemployed. The age group with the highest labor force participation rate is 35 to 44 years, with 91.0% or 2,523 individuals in the labor force. Within the labor force, the 75 years and over age range has the highest percentage of unemployed individuals, with 40.0% or 6 of them being unemployed.
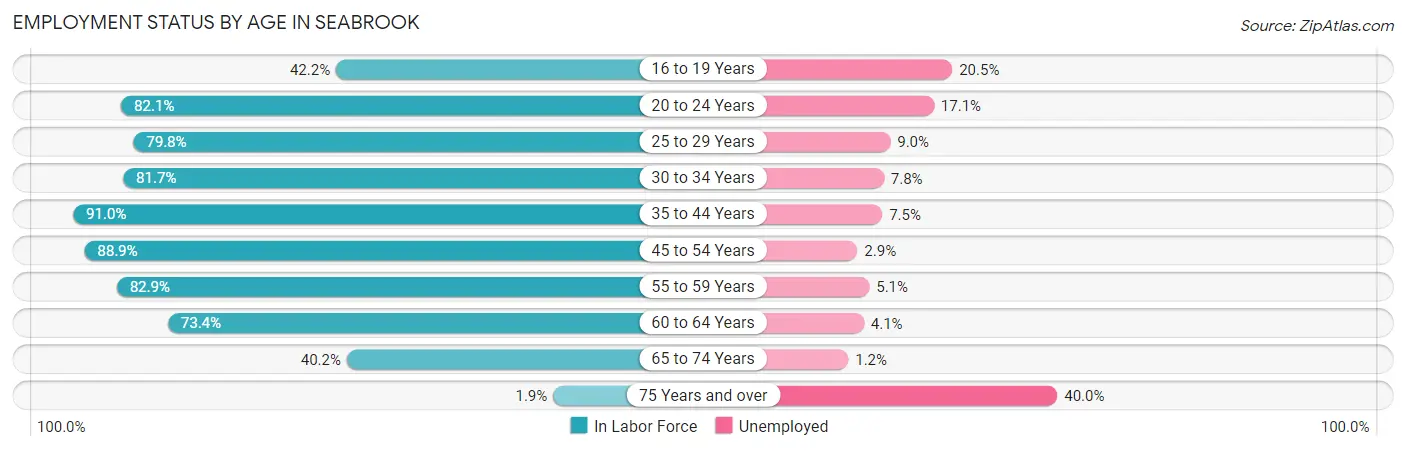
| Age Bracket | In Labor Force | Unemployed |
| 16 to 19 Years | 395 (42.2%) | 81 (20.5%) |
| 20 to 24 Years | 776 (82.1%) | 133 (17.1%) |
| 25 to 29 Years | 1,341 (79.8%) | 121 (9.0%) |
| 30 to 34 Years | 1,235 (81.7%) | 96 (7.8%) |
| 35 to 44 Years | 2,523 (91.0%) | 189 (7.5%) |
| 45 to 54 Years | 2,013 (88.9%) | 58 (2.9%) |
| 55 to 59 Years | 1,093 (82.9%) | 56 (5.1%) |
| 60 to 64 Years | 942 (73.4%) | 39 (4.1%) |
| 65 to 74 Years | 668 (40.2%) | 8 (1.2%) |
| 75 Years and over | 15 (1.9%) | 6 (40.0%) |
| Total | 11,001 (72.6%) | 781 (7.1%) |
Employment Status by Educational Attainment in Seabrook
According to labor force statistics for Seabrook, 84.5% of individuals (9,151) out of the total population between 25 and 64 years of age (10,830) are in the labor force, with 6.1% or 558 of them being unemployed. The group with the highest labor force participation rate are those with the educational attainment of college / associate degree, with 87.3% or 2,445 individuals in the labor force. Within the labor force, individuals with college / associate degree education have the highest percentage of unemployment, with 7.7% or 188 of them being unemployed.
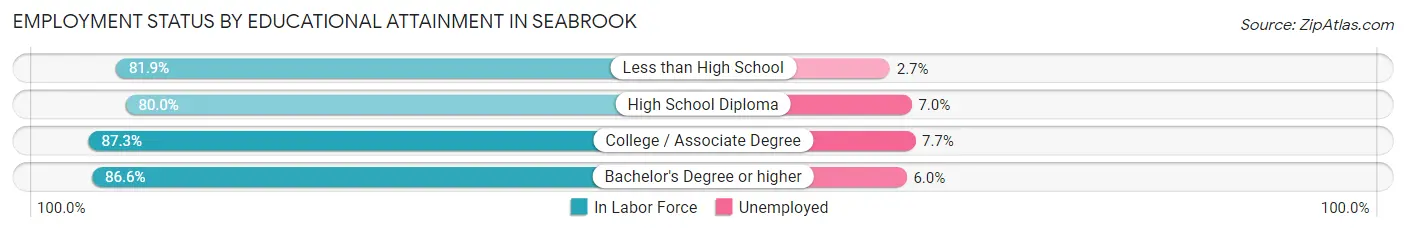
| Educational Attainment | In Labor Force | Unemployed |
| Less than High School | 1,505 (81.9%) | 50 (2.7%) |
| High School Diploma | 1,974 (80.0%) | 173 (7.0%) |
| College / Associate Degree | 2,445 (87.3%) | 216 (7.7%) |
| Bachelor's Degree or higher | 3,224 (86.6%) | 223 (6.0%) |
| Total | 9,151 (84.5%) | 661 (6.1%) |
Employment Occupations by Sex in Seabrook
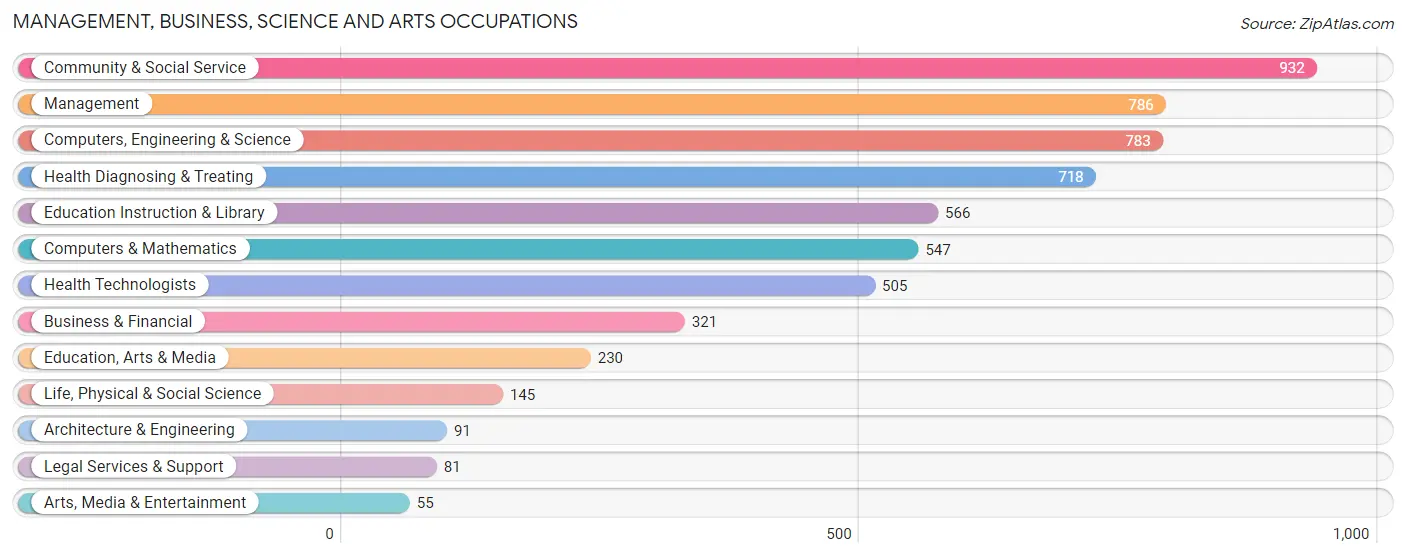
Management, Business, Science and Arts Occupations
The most common Management, Business, Science and Arts occupations in Seabrook are Community & Social Service (932 | 9.2%), Management (786 | 7.7%), Computers, Engineering & Science (783 | 7.7%), Health Diagnosing & Treating (718 | 7.1%), and Education Instruction & Library (566 | 5.6%).
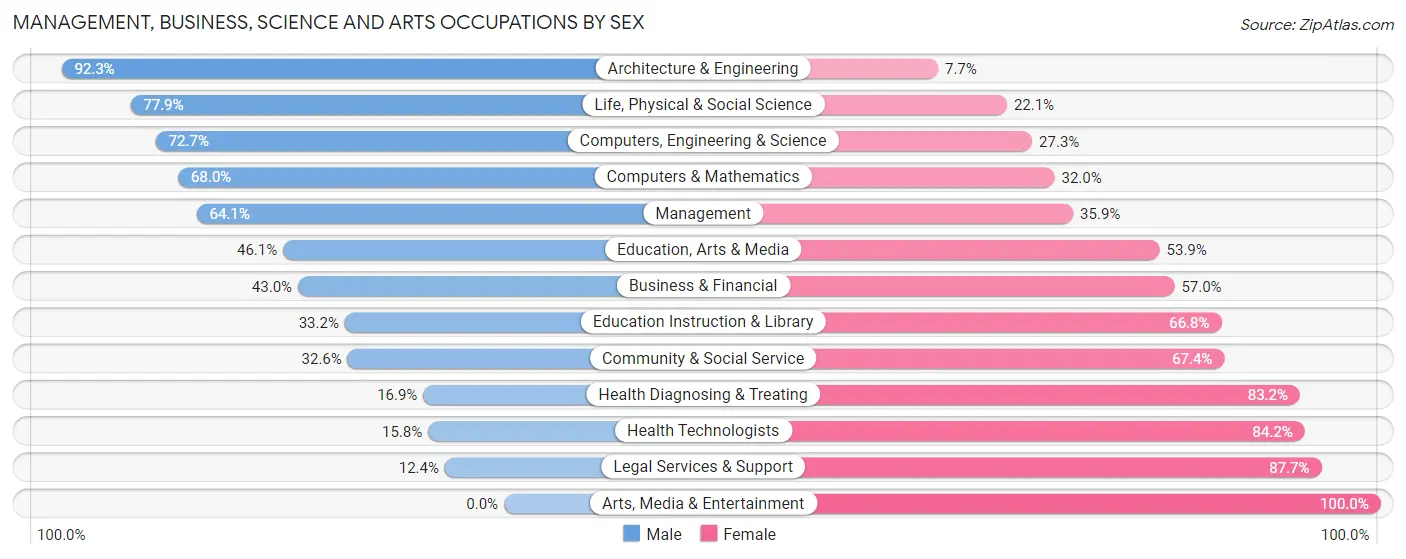
Management, Business, Science and Arts Occupations by Sex
Within the Management, Business, Science and Arts occupations in Seabrook, the most male-oriented occupations are Architecture & Engineering (92.3%), Life, Physical & Social Science (77.9%), and Computers, Engineering & Science (72.7%), while the most female-oriented occupations are Arts, Media & Entertainment (100.0%), Legal Services & Support (87.6%), and Health Technologists (84.2%).
| Occupation | Male | Female |
| Management | 504 (64.1%) | 282 (35.9%) |
| Business & Financial | 138 (43.0%) | 183 (57.0%) |
| Computers, Engineering & Science | 569 (72.7%) | 214 (27.3%) |
| Computers & Mathematics | 372 (68.0%) | 175 (32.0%) |
| Architecture & Engineering | 84 (92.3%) | 7 (7.7%) |
| Life, Physical & Social Science | 113 (77.9%) | 32 (22.1%) |
| Community & Social Service | 304 (32.6%) | 628 (67.4%) |
| Education, Arts & Media | 106 (46.1%) | 124 (53.9%) |
| Legal Services & Support | 10 (12.3%) | 71 (87.6%) |
| Education Instruction & Library | 188 (33.2%) | 378 (66.8%) |
| Arts, Media & Entertainment | 0 (0.0%) | 55 (100.0%) |
| Health Diagnosing & Treating | 121 (16.9%) | 597 (83.2%) |
| Health Technologists | 80 (15.8%) | 425 (84.2%) |
| Total (Category) | 1,636 (46.2%) | 1,904 (53.8%) |
| Total (Overall) | 5,045 (49.7%) | 5,098 (50.3%) |
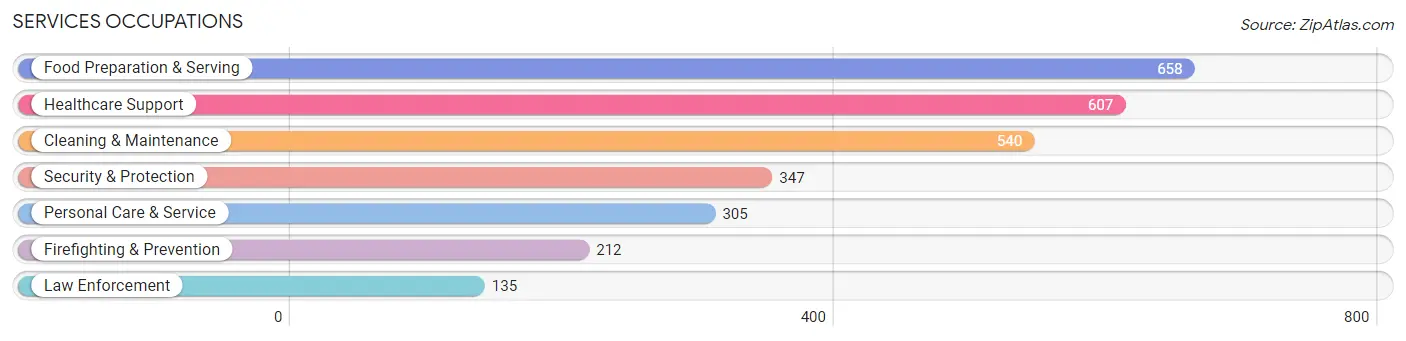
Services Occupations
The most common Services occupations in Seabrook are Food Preparation & Serving (658 | 6.5%), Healthcare Support (607 | 6.0%), Cleaning & Maintenance (540 | 5.3%), Security & Protection (347 | 3.4%), and Personal Care & Service (305 | 3.0%).
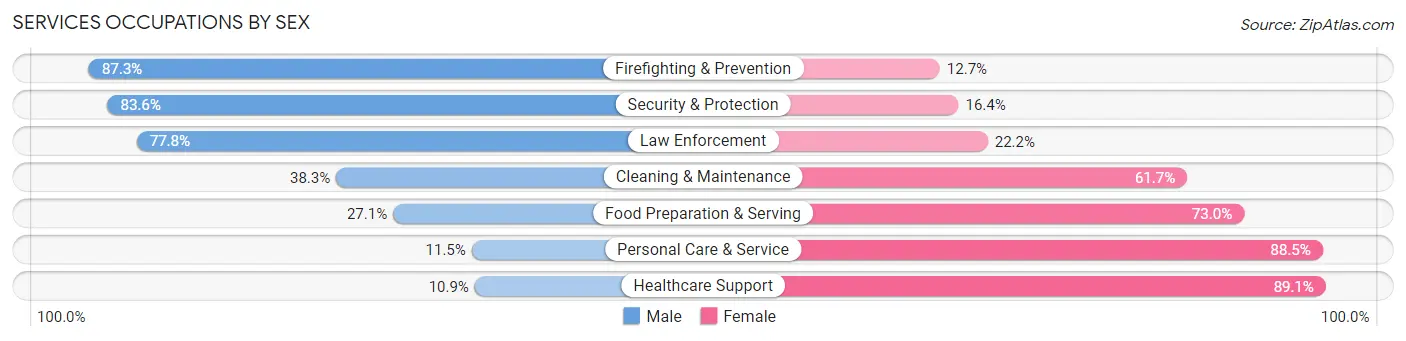
Services Occupations by Sex
Within the Services occupations in Seabrook, the most male-oriented occupations are Firefighting & Prevention (87.3%), Security & Protection (83.6%), and Law Enforcement (77.8%), while the most female-oriented occupations are Healthcare Support (89.1%), Personal Care & Service (88.5%), and Food Preparation & Serving (73.0%).
| Occupation | Male | Female |
| Healthcare Support | 66 (10.9%) | 541 (89.1%) |
| Security & Protection | 290 (83.6%) | 57 (16.4%) |
| Firefighting & Prevention | 185 (87.3%) | 27 (12.7%) |
| Law Enforcement | 105 (77.8%) | 30 (22.2%) |
| Food Preparation & Serving | 178 (27.1%) | 480 (73.0%) |
| Cleaning & Maintenance | 207 (38.3%) | 333 (61.7%) |
| Personal Care & Service | 35 (11.5%) | 270 (88.5%) |
| Total (Category) | 776 (31.6%) | 1,681 (68.4%) |
| Total (Overall) | 5,045 (49.7%) | 5,098 (50.3%) |
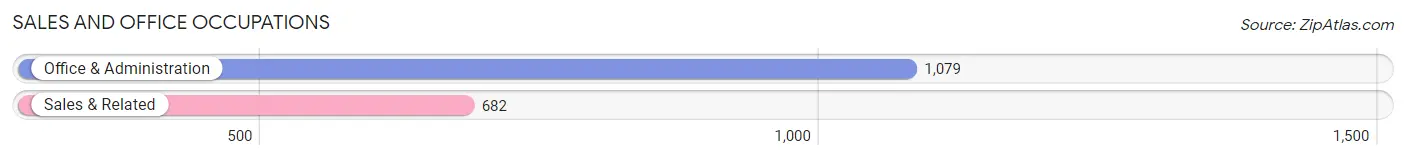
Sales and Office Occupations
The most common Sales and Office occupations in Seabrook are Office & Administration (1,079 | 10.6%), and Sales & Related (682 | 6.7%).
Sales and Office Occupations by Sex
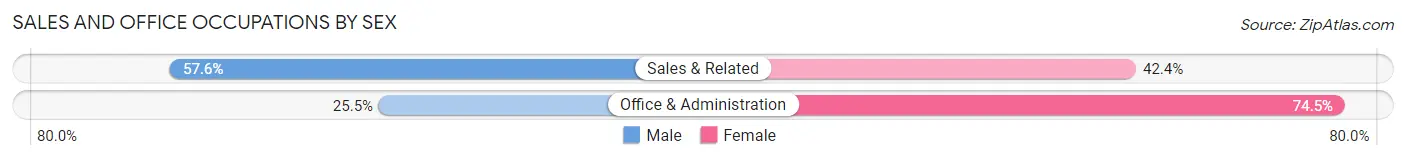
| Occupation | Male | Female |
| Sales & Related | 393 (57.6%) | 289 (42.4%) |
| Office & Administration | 275 (25.5%) | 804 (74.5%) |
| Total (Category) | 668 (37.9%) | 1,093 (62.1%) |
| Total (Overall) | 5,045 (49.7%) | 5,098 (50.3%) |
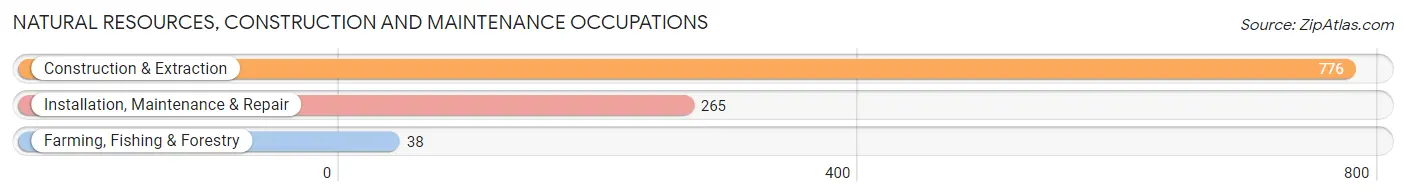
Natural Resources, Construction and Maintenance Occupations
The most common Natural Resources, Construction and Maintenance occupations in Seabrook are Construction & Extraction (776 | 7.6%), Installation, Maintenance & Repair (265 | 2.6%), and Farming, Fishing & Forestry (38 | 0.4%).
Natural Resources, Construction and Maintenance Occupations by Sex
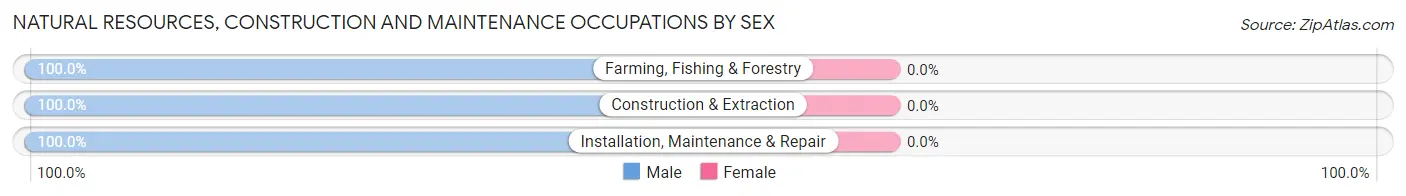
| Occupation | Male | Female |
| Farming, Fishing & Forestry | 38 (100.0%) | 0 (0.0%) |
| Construction & Extraction | 776 (100.0%) | 0 (0.0%) |
| Installation, Maintenance & Repair | 265 (100.0%) | 0 (0.0%) |
| Total (Category) | 1,079 (100.0%) | 0 (0.0%) |
| Total (Overall) | 5,045 (49.7%) | 5,098 (50.3%) |
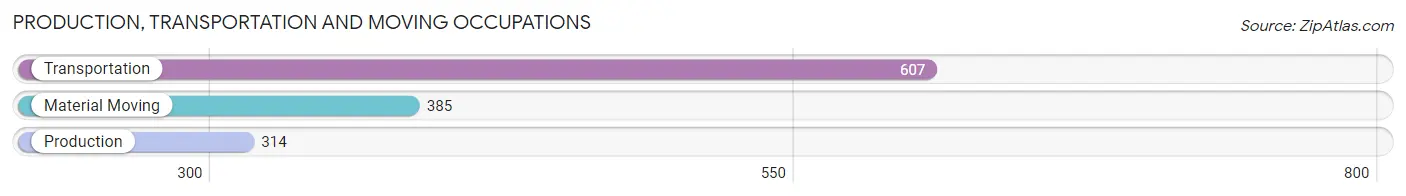
Production, Transportation and Moving Occupations
The most common Production, Transportation and Moving occupations in Seabrook are Transportation (607 | 6.0%), Material Moving (385 | 3.8%), and Production (314 | 3.1%).
Production, Transportation and Moving Occupations by Sex
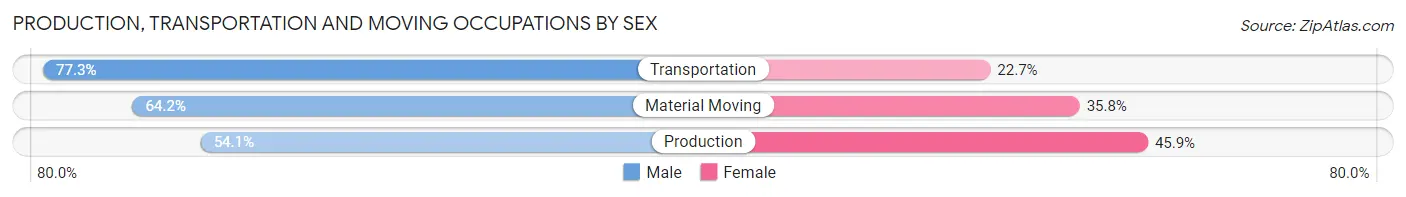
| Occupation | Male | Female |
| Production | 170 (54.1%) | 144 (45.9%) |
| Transportation | 469 (77.3%) | 138 (22.7%) |
| Material Moving | 247 (64.2%) | 138 (35.8%) |
| Total (Category) | 886 (67.8%) | 420 (32.2%) |
| Total (Overall) | 5,045 (49.7%) | 5,098 (50.3%) |
Employment Industries by Sex in Seabrook
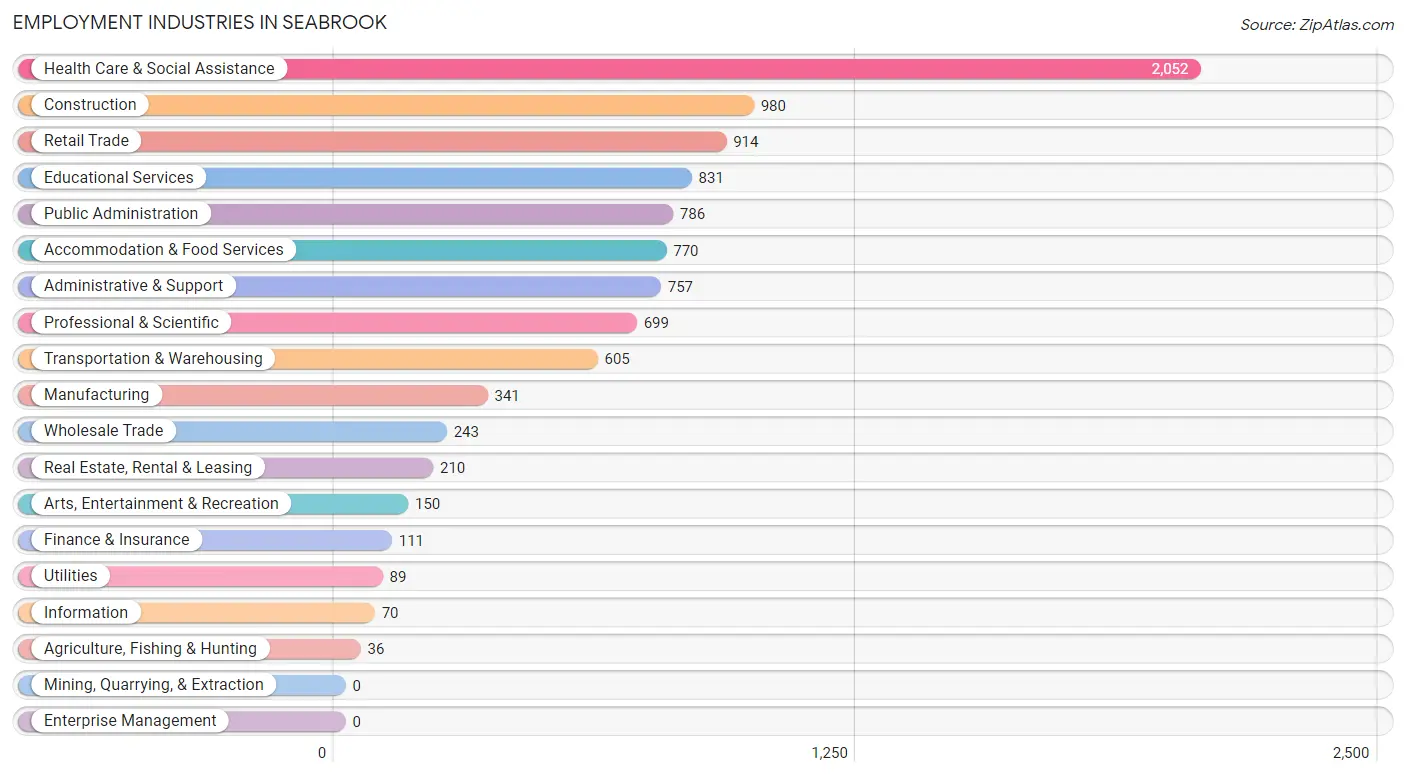
Employment Industries in Seabrook
The major employment industries in Seabrook include Health Care & Social Assistance (2,052 | 20.2%), Construction (980 | 9.7%), Retail Trade (914 | 9.0%), Educational Services (831 | 8.2%), and Public Administration (786 | 7.7%).
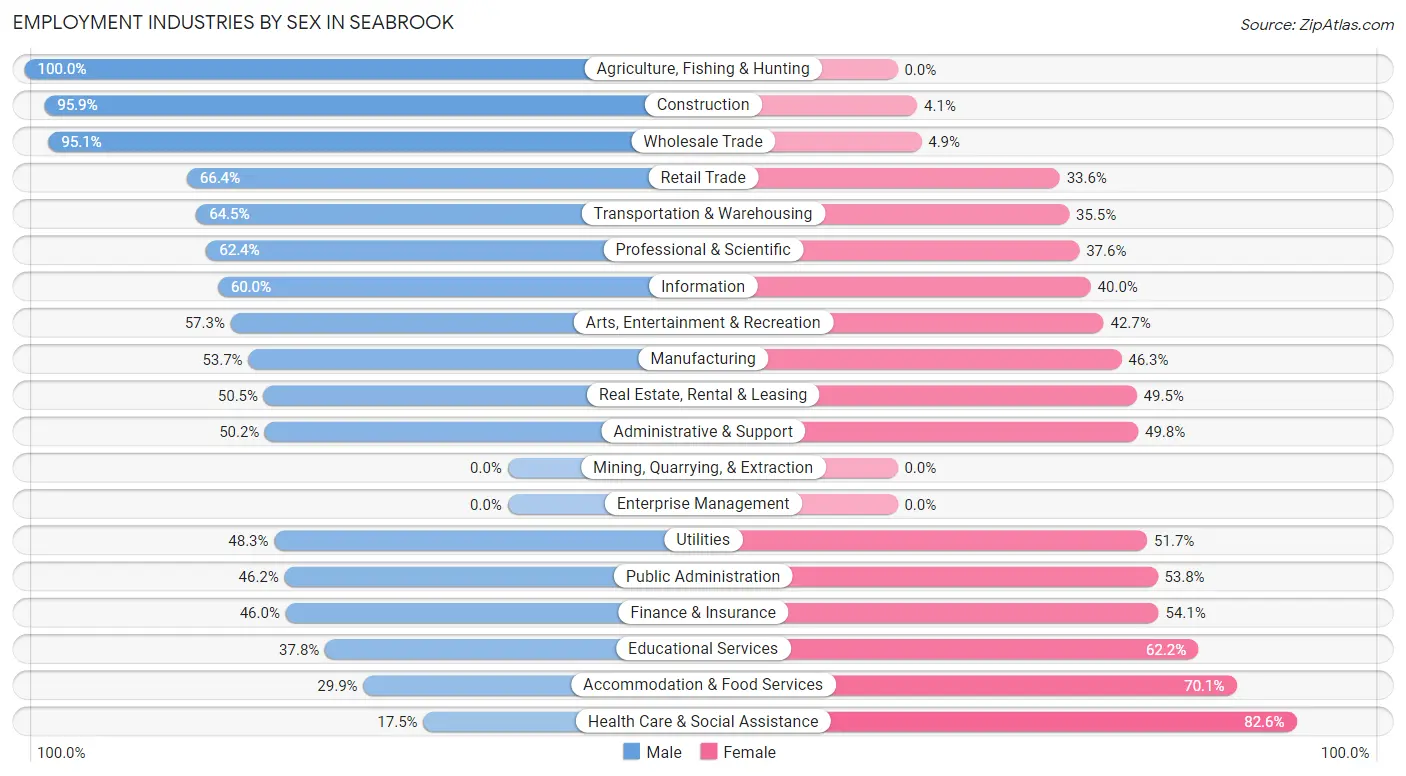
Employment Industries by Sex in Seabrook
The Seabrook industries that see more men than women are Agriculture, Fishing & Hunting (100.0%), Construction (95.9%), and Wholesale Trade (95.1%), whereas the industries that tend to have a higher number of women are Health Care & Social Assistance (82.6%), Accommodation & Food Services (70.1%), and Educational Services (62.2%).
| Industry | Male | Female |
| Agriculture, Fishing & Hunting | 36 (100.0%) | 0 (0.0%) |
| Mining, Quarrying, & Extraction | 0 (0.0%) | 0 (0.0%) |
| Construction | 940 (95.9%) | 40 (4.1%) |
| Manufacturing | 183 (53.7%) | 158 (46.3%) |
| Wholesale Trade | 231 (95.1%) | 12 (4.9%) |
| Retail Trade | 607 (66.4%) | 307 (33.6%) |
| Transportation & Warehousing | 390 (64.5%) | 215 (35.5%) |
| Utilities | 43 (48.3%) | 46 (51.7%) |
| Information | 42 (60.0%) | 28 (40.0%) |
| Finance & Insurance | 51 (46.0%) | 60 (54.0%) |
| Real Estate, Rental & Leasing | 106 (50.5%) | 104 (49.5%) |
| Professional & Scientific | 436 (62.4%) | 263 (37.6%) |
| Enterprise Management | 0 (0.0%) | 0 (0.0%) |
| Administrative & Support | 380 (50.2%) | 377 (49.8%) |
| Educational Services | 314 (37.8%) | 517 (62.2%) |
| Health Care & Social Assistance | 358 (17.4%) | 1,694 (82.6%) |
| Arts, Entertainment & Recreation | 86 (57.3%) | 64 (42.7%) |
| Accommodation & Food Services | 230 (29.9%) | 540 (70.1%) |
| Public Administration | 363 (46.2%) | 423 (53.8%) |
| Total | 5,045 (49.7%) | 5,098 (50.3%) |
Education in Seabrook
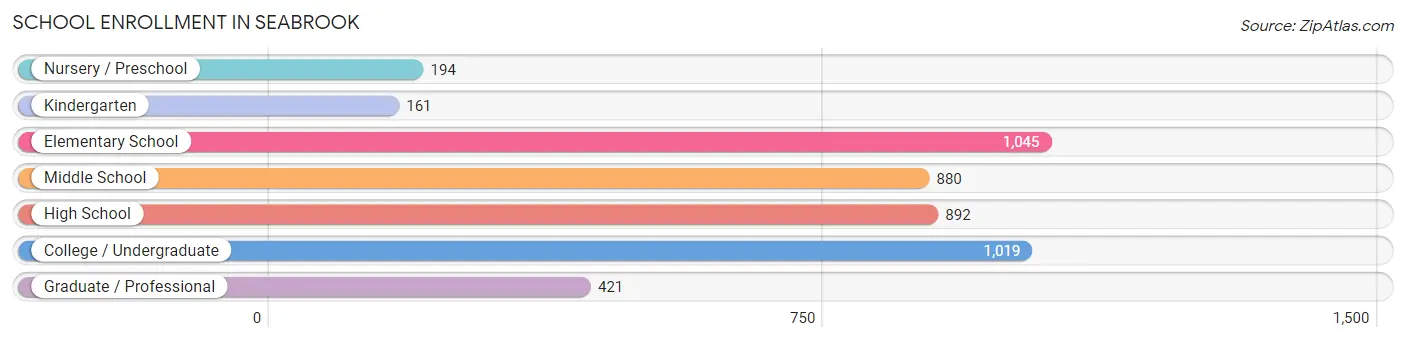
School Enrollment in Seabrook
The most common levels of schooling among the 4,612 students in Seabrook are elementary school (1,045 | 22.7%), college / undergraduate (1,019 | 22.1%), and high school (892 | 19.3%).
| School Level | # Students | % Students |
| Nursery / Preschool | 194 | 4.2% |
| Kindergarten | 161 | 3.5% |
| Elementary School | 1,045 | 22.7% |
| Middle School | 880 | 19.1% |
| High School | 892 | 19.3% |
| College / Undergraduate | 1,019 | 22.1% |
| Graduate / Professional | 421 | 9.1% |
| Total | 4,612 | 100.0% |
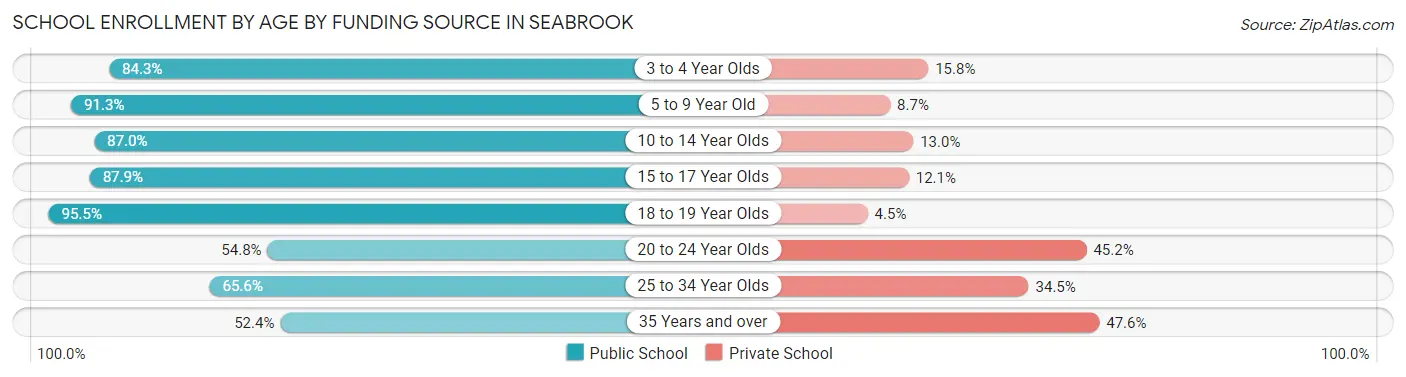
School Enrollment by Age by Funding Source in Seabrook
Out of a total of 4,612 students who are enrolled in schools in Seabrook, 876 (19.0%) attend a private institution, while the remaining 3,736 (81.0%) are enrolled in public schools. The age group of 35 years and over has the highest likelihood of being enrolled in private schools, with 189 (47.6% in the age bracket) enrolled. Conversely, the age group of 18 to 19 year olds has the lowest likelihood of being enrolled in a private school, with 385 (95.5% in the age bracket) attending a public institution.
| Age Bracket | Public School | Private School |
| 3 to 4 Year Olds | 107 (84.3%) | 20 (15.8%) |
| 5 to 9 Year Old | 1,108 (91.3%) | 105 (8.7%) |
| 10 to 14 Year Olds | 893 (87.0%) | 133 (13.0%) |
| 15 to 17 Year Olds | 471 (87.9%) | 65 (12.1%) |
| 18 to 19 Year Olds | 385 (95.5%) | 18 (4.5%) |
| 20 to 24 Year Olds | 155 (54.8%) | 128 (45.2%) |
| 25 to 34 Year Olds | 411 (65.5%) | 216 (34.4%) |
| 35 Years and over | 208 (52.4%) | 189 (47.6%) |
| Total | 3,736 (81.0%) | 876 (19.0%) |
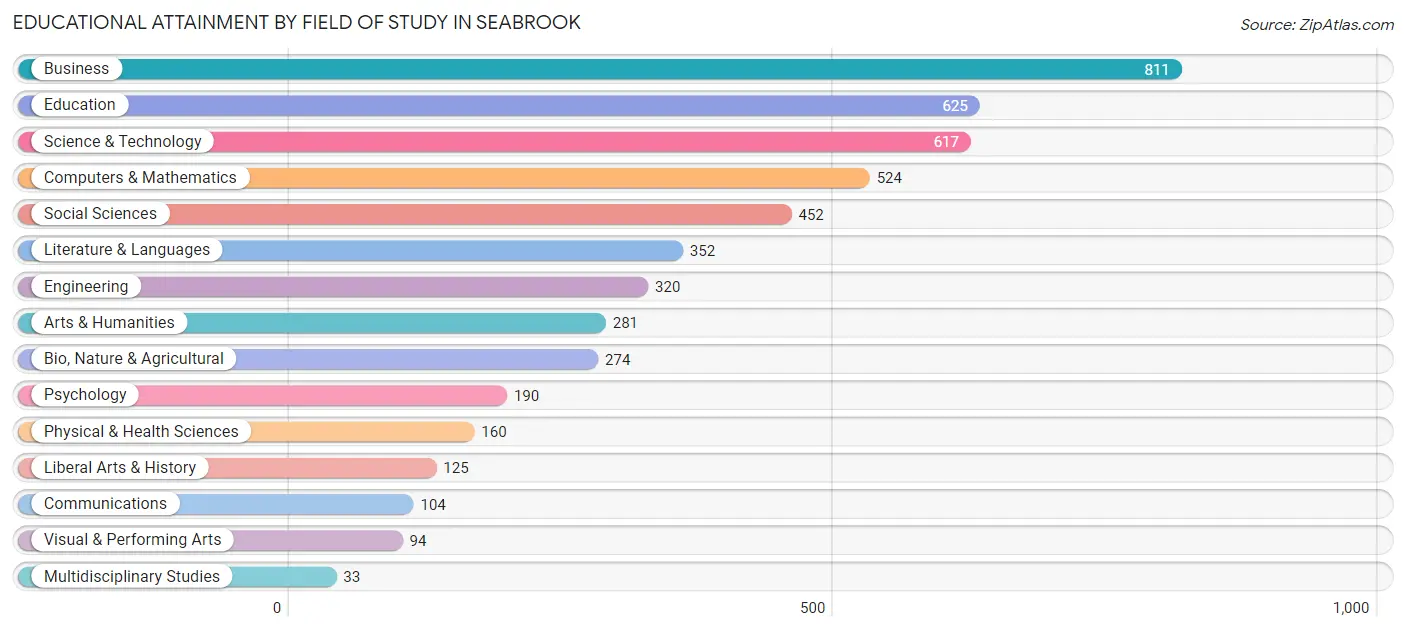
Educational Attainment by Field of Study in Seabrook
Business (811 | 16.3%), education (625 | 12.6%), science & technology (617 | 12.4%), computers & mathematics (524 | 10.6%), and social sciences (452 | 9.1%) are the most common fields of study among 4,962 individuals in Seabrook who have obtained a bachelor's degree or higher.
| Field of Study | # Graduates | % Graduates |
| Computers & Mathematics | 524 | 10.6% |
| Bio, Nature & Agricultural | 274 | 5.5% |
| Physical & Health Sciences | 160 | 3.2% |
| Psychology | 190 | 3.8% |
| Social Sciences | 452 | 9.1% |
| Engineering | 320 | 6.5% |
| Multidisciplinary Studies | 33 | 0.7% |
| Science & Technology | 617 | 12.4% |
| Business | 811 | 16.3% |
| Education | 625 | 12.6% |
| Literature & Languages | 352 | 7.1% |
| Liberal Arts & History | 125 | 2.5% |
| Visual & Performing Arts | 94 | 1.9% |
| Communications | 104 | 2.1% |
| Arts & Humanities | 281 | 5.7% |
| Total | 4,962 | 100.0% |
Transportation & Commute in Seabrook
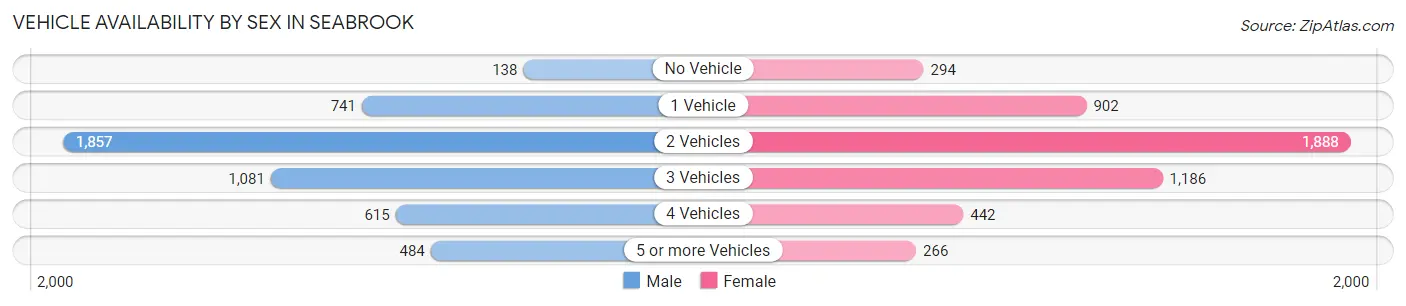
Vehicle Availability by Sex in Seabrook
The most prevalent vehicle ownership categories in Seabrook are males with 2 vehicles (1,857, accounting for 37.8%) and females with 2 vehicles (1,888, making up 37.3%).
| Vehicles Available | Male | Female |
| No Vehicle | 138 (2.8%) | 294 (5.9%) |
| 1 Vehicle | 741 (15.1%) | 902 (18.1%) |
| 2 Vehicles | 1,857 (37.8%) | 1,888 (37.9%) |
| 3 Vehicles | 1,081 (22.0%) | 1,186 (23.8%) |
| 4 Vehicles | 615 (12.5%) | 442 (8.9%) |
| 5 or more Vehicles | 484 (9.9%) | 266 (5.3%) |
| Total | 4,916 (100.0%) | 4,978 (100.0%) |
Commute Time in Seabrook
The most frequently occuring commute durations in Seabrook are 30 to 34 minutes (2,052 commuters, 23.4%), 20 to 24 minutes (1,408 commuters, 16.1%), and 45 to 59 minutes (1,210 commuters, 13.8%).
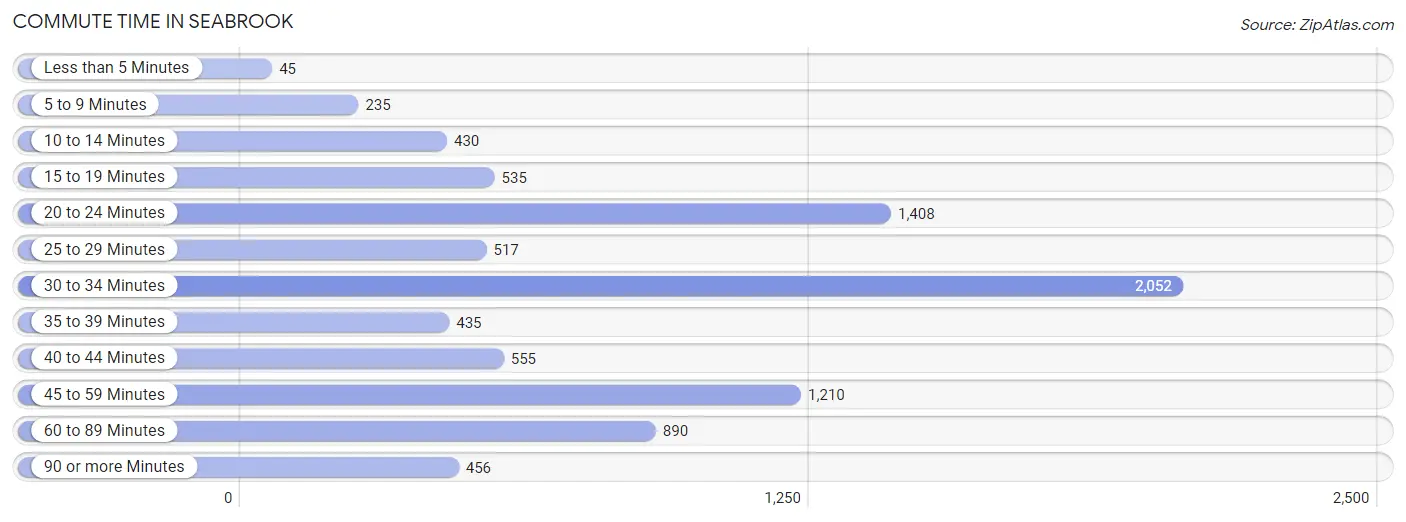
| Commute Time | # Commuters | % Commuters |
| Less than 5 Minutes | 45 | 0.5% |
| 5 to 9 Minutes | 235 | 2.7% |
| 10 to 14 Minutes | 430 | 4.9% |
| 15 to 19 Minutes | 535 | 6.1% |
| 20 to 24 Minutes | 1,408 | 16.1% |
| 25 to 29 Minutes | 517 | 5.9% |
| 30 to 34 Minutes | 2,052 | 23.4% |
| 35 to 39 Minutes | 435 | 5.0% |
| 40 to 44 Minutes | 555 | 6.3% |
| 45 to 59 Minutes | 1,210 | 13.8% |
| 60 to 89 Minutes | 890 | 10.2% |
| 90 or more Minutes | 456 | 5.2% |
Commute Time by Sex in Seabrook
The most common commute times in Seabrook are 30 to 34 minutes (1,294 commuters, 29.0%) for males and 20 to 24 minutes (827 commuters, 19.2%) for females.
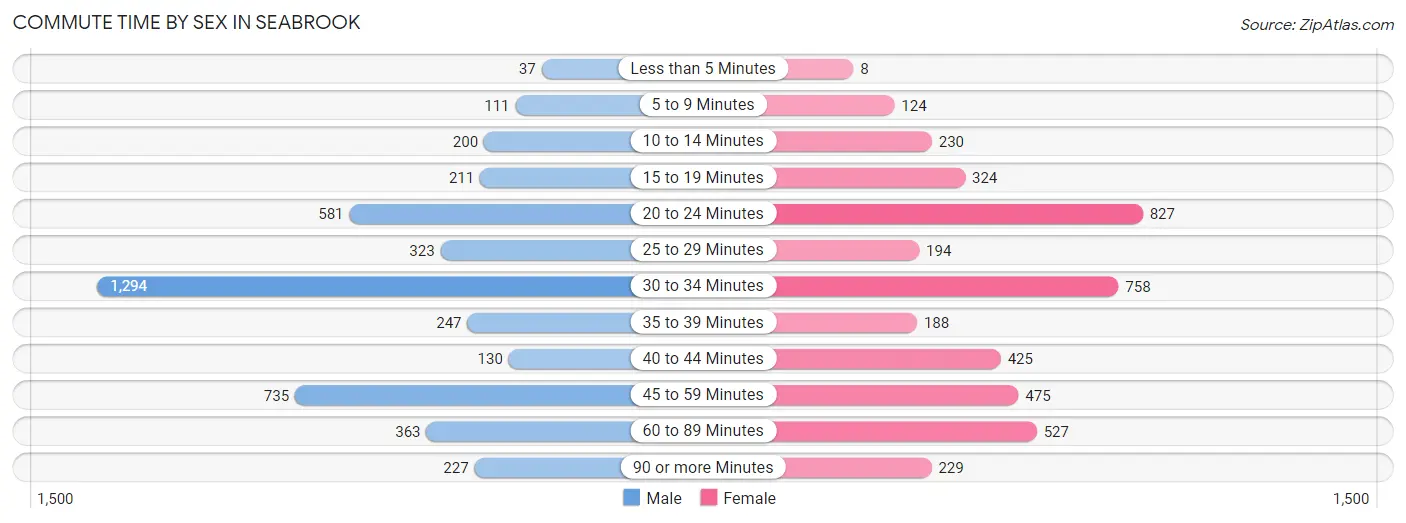
| Commute Time | Male | Female |
| Less than 5 Minutes | 37 (0.8%) | 8 (0.2%) |
| 5 to 9 Minutes | 111 (2.5%) | 124 (2.9%) |
| 10 to 14 Minutes | 200 (4.5%) | 230 (5.3%) |
| 15 to 19 Minutes | 211 (4.7%) | 324 (7.5%) |
| 20 to 24 Minutes | 581 (13.0%) | 827 (19.2%) |
| 25 to 29 Minutes | 323 (7.2%) | 194 (4.5%) |
| 30 to 34 Minutes | 1,294 (29.0%) | 758 (17.6%) |
| 35 to 39 Minutes | 247 (5.5%) | 188 (4.4%) |
| 40 to 44 Minutes | 130 (2.9%) | 425 (9.9%) |
| 45 to 59 Minutes | 735 (16.5%) | 475 (11.0%) |
| 60 to 89 Minutes | 363 (8.1%) | 527 (12.2%) |
| 90 or more Minutes | 227 (5.1%) | 229 (5.3%) |
Time of Departure to Work by Sex in Seabrook
The most frequent times of departure to work in Seabrook are 5:30 AM to 5:59 AM (520, 11.7%) for males and 7:00 AM to 7:29 AM (709, 16.5%) for females.
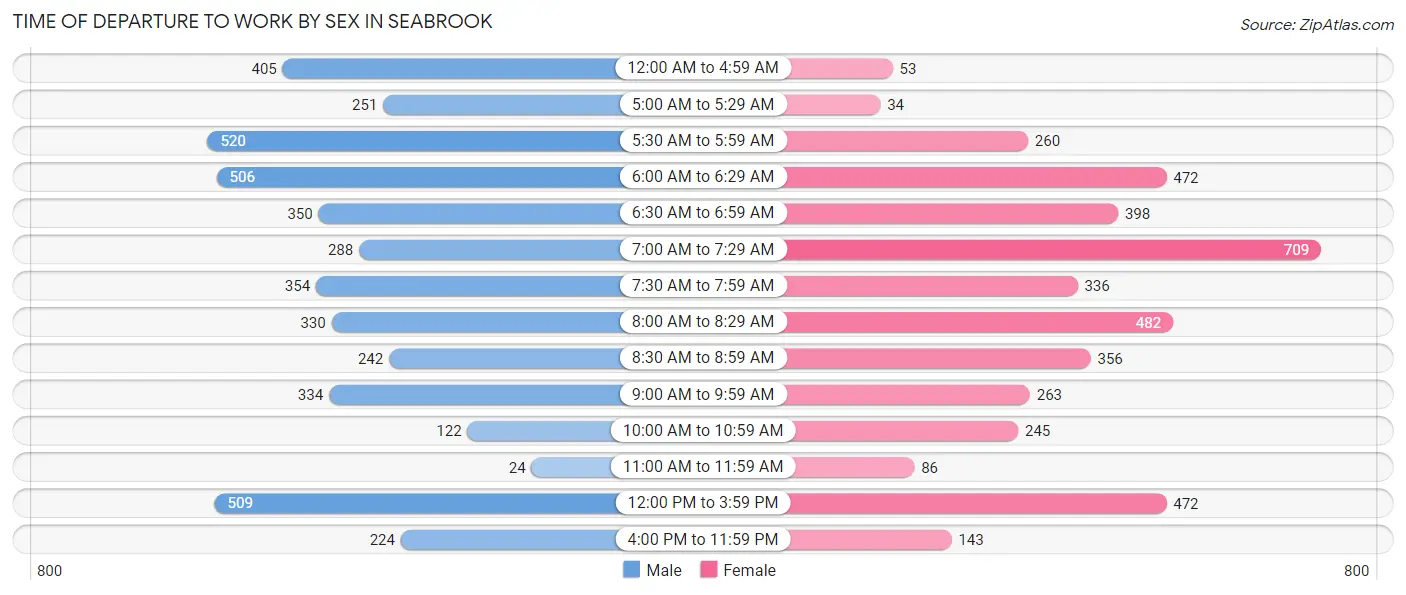
| Time of Departure | Male | Female |
| 12:00 AM to 4:59 AM | 405 (9.1%) | 53 (1.2%) |
| 5:00 AM to 5:29 AM | 251 (5.6%) | 34 (0.8%) |
| 5:30 AM to 5:59 AM | 520 (11.7%) | 260 (6.0%) |
| 6:00 AM to 6:29 AM | 506 (11.4%) | 472 (11.0%) |
| 6:30 AM to 6:59 AM | 350 (7.9%) | 398 (9.2%) |
| 7:00 AM to 7:29 AM | 288 (6.5%) | 709 (16.5%) |
| 7:30 AM to 7:59 AM | 354 (7.9%) | 336 (7.8%) |
| 8:00 AM to 8:29 AM | 330 (7.4%) | 482 (11.2%) |
| 8:30 AM to 8:59 AM | 242 (5.4%) | 356 (8.3%) |
| 9:00 AM to 9:59 AM | 334 (7.5%) | 263 (6.1%) |
| 10:00 AM to 10:59 AM | 122 (2.7%) | 245 (5.7%) |
| 11:00 AM to 11:59 AM | 24 (0.5%) | 86 (2.0%) |
| 12:00 PM to 3:59 PM | 509 (11.4%) | 472 (11.0%) |
| 4:00 PM to 11:59 PM | 224 (5.0%) | 143 (3.3%) |
| Total | 4,459 (100.0%) | 4,309 (100.0%) |
Housing Occupancy in Seabrook
Occupancy by Ownership in Seabrook
Of the total 5,927 dwellings in Seabrook, owner-occupied units account for 3,522 (59.4%), while renter-occupied units make up 2,405 (40.6%).
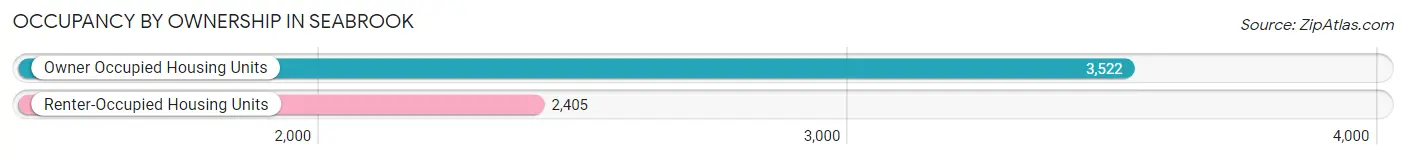
| Occupancy | # Housing Units | % Housing Units |
| Owner Occupied Housing Units | 3,522 | 59.4% |
| Renter-Occupied Housing Units | 2,405 | 40.6% |
| Total Occupied Housing Units | 5,927 | 100.0% |
Occupancy by Household Size in Seabrook
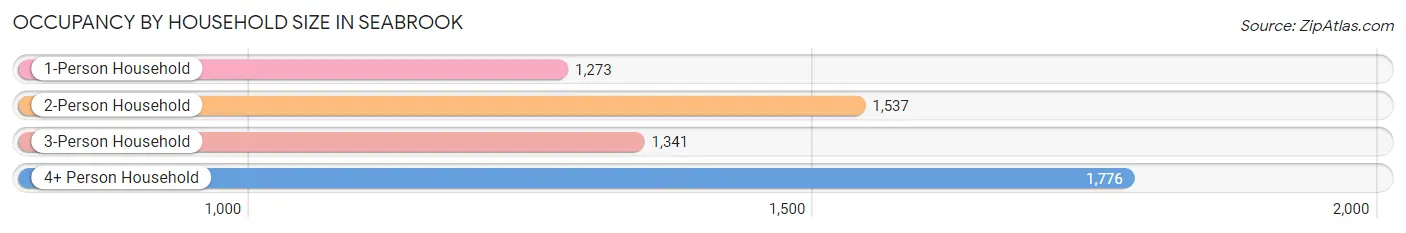
| Household Size | # Housing Units | % Housing Units |
| 1-Person Household | 1,273 | 21.5% |
| 2-Person Household | 1,537 | 25.9% |
| 3-Person Household | 1,341 | 22.6% |
| 4+ Person Household | 1,776 | 30.0% |
| Total Housing Units | 5,927 | 100.0% |
Occupancy by Ownership by Household Size in Seabrook
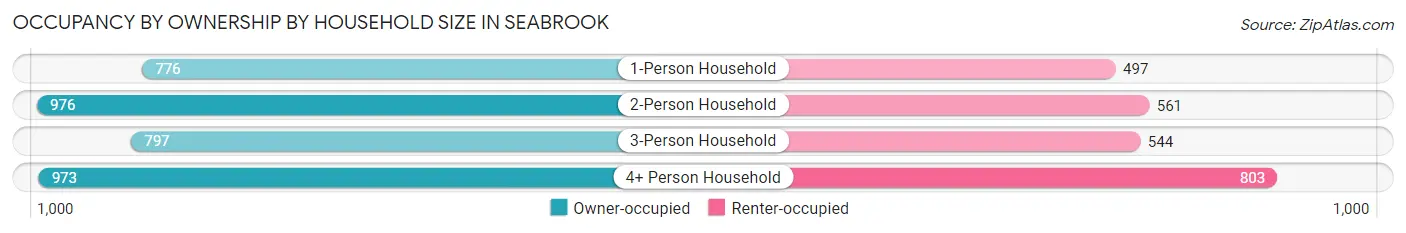
| Household Size | Owner-occupied | Renter-occupied |
| 1-Person Household | 776 (61.0%) | 497 (39.0%) |
| 2-Person Household | 976 (63.5%) | 561 (36.5%) |
| 3-Person Household | 797 (59.4%) | 544 (40.6%) |
| 4+ Person Household | 973 (54.8%) | 803 (45.2%) |
| Total Housing Units | 3,522 (59.4%) | 2,405 (40.6%) |
Occupancy by Educational Attainment in Seabrook
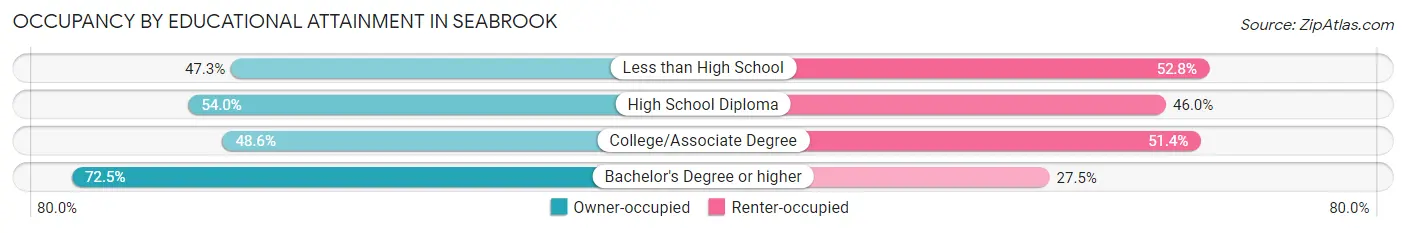
| Household Size | Owner-occupied | Renter-occupied |
| Less than High School | 223 (47.2%) | 249 (52.7%) |
| High School Diploma | 707 (54.0%) | 602 (46.0%) |
| College/Associate Degree | 841 (48.6%) | 889 (51.4%) |
| Bachelor's Degree or higher | 1,751 (72.5%) | 665 (27.5%) |
Occupancy by Age of Householder in Seabrook
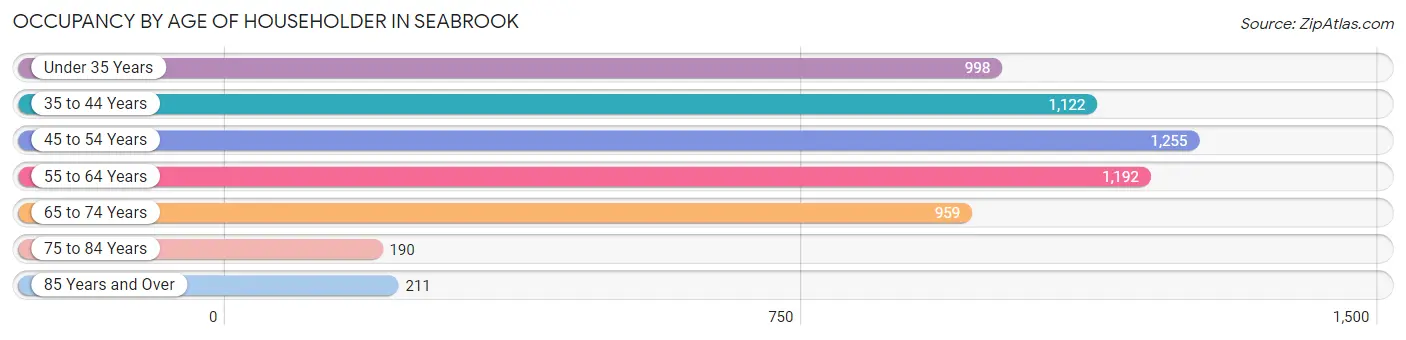
| Age Bracket | # Households | % Households |
| Under 35 Years | 998 | 16.8% |
| 35 to 44 Years | 1,122 | 18.9% |
| 45 to 54 Years | 1,255 | 21.2% |
| 55 to 64 Years | 1,192 | 20.1% |
| 65 to 74 Years | 959 | 16.2% |
| 75 to 84 Years | 190 | 3.2% |
| 85 Years and Over | 211 | 3.6% |
| Total | 5,927 | 100.0% |
Housing Finances in Seabrook
Median Income by Occupancy in Seabrook
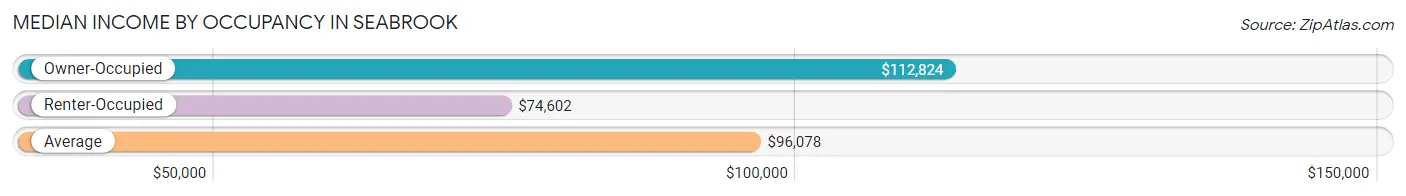
| Occupancy Type | # Households | Median Income |
| Owner-Occupied | 3,522 (59.4%) | $112,824 |
| Renter-Occupied | 2,405 (40.6%) | $74,602 |
| Average | 5,927 (100.0%) | $96,078 |
Occupancy by Householder Income Bracket in Seabrook
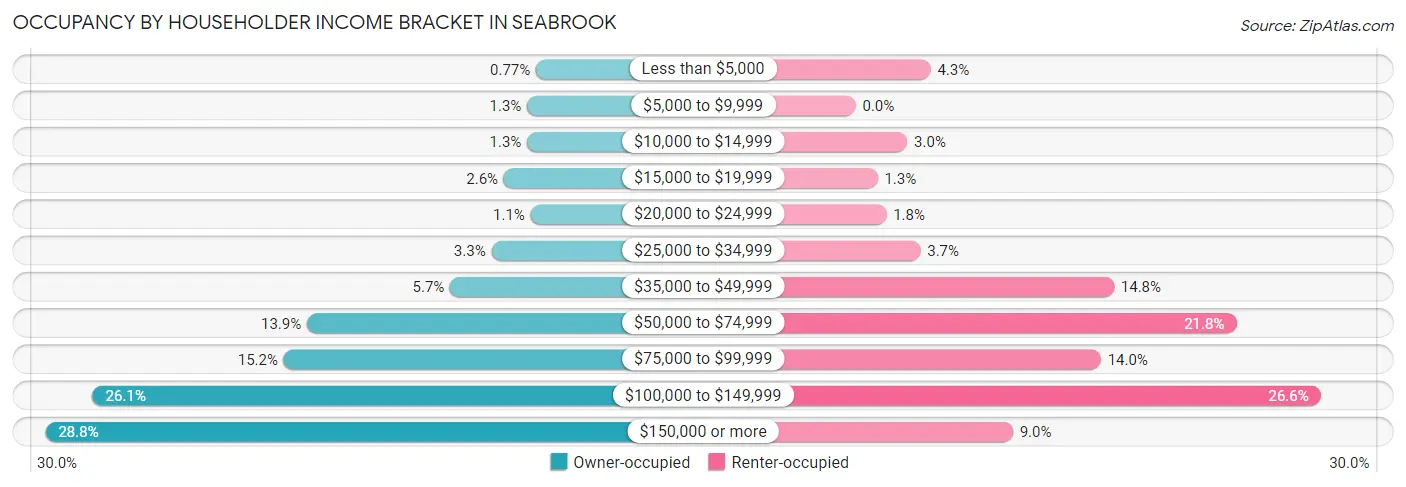
| Income Bracket | Owner-occupied | Renter-occupied |
| Less than $5,000 | 27 (0.8%) | 103 (4.3%) |
| $5,000 to $9,999 | 45 (1.3%) | 0 (0.0%) |
| $10,000 to $14,999 | 45 (1.3%) | 71 (2.9%) |
| $15,000 to $19,999 | 92 (2.6%) | 30 (1.3%) |
| $20,000 to $24,999 | 38 (1.1%) | 42 (1.8%) |
| $25,000 to $34,999 | 117 (3.3%) | 89 (3.7%) |
| $35,000 to $49,999 | 200 (5.7%) | 355 (14.8%) |
| $50,000 to $74,999 | 488 (13.9%) | 523 (21.7%) |
| $75,000 to $99,999 | 535 (15.2%) | 337 (14.0%) |
| $100,000 to $149,999 | 920 (26.1%) | 639 (26.6%) |
| $150,000 or more | 1,015 (28.8%) | 216 (9.0%) |
| Total | 3,522 (100.0%) | 2,405 (100.0%) |
Monthly Housing Cost Tiers in Seabrook
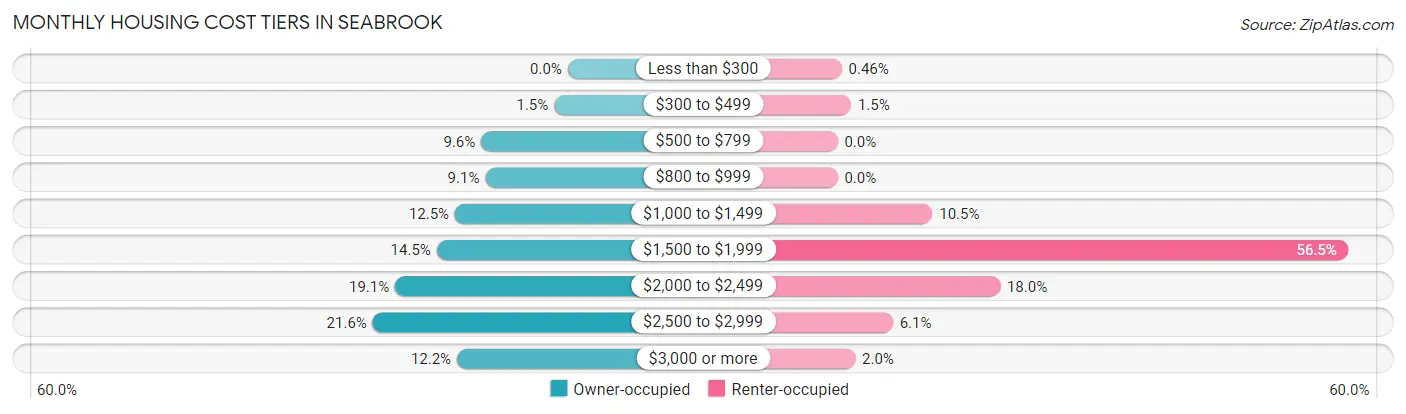
| Monthly Cost | Owner-occupied | Renter-occupied |
| Less than $300 | 0 (0.0%) | 11 (0.5%) |
| $300 to $499 | 53 (1.5%) | 36 (1.5%) |
| $500 to $799 | 337 (9.6%) | 0 (0.0%) |
| $800 to $999 | 321 (9.1%) | 0 (0.0%) |
| $1,000 to $1,499 | 439 (12.5%) | 252 (10.5%) |
| $1,500 to $1,999 | 510 (14.5%) | 1,358 (56.5%) |
| $2,000 to $2,499 | 672 (19.1%) | 432 (18.0%) |
| $2,500 to $2,999 | 759 (21.5%) | 147 (6.1%) |
| $3,000 or more | 431 (12.2%) | 47 (1.9%) |
| Total | 3,522 (100.0%) | 2,405 (100.0%) |
Physical Housing Characteristics in Seabrook
Housing Structures in Seabrook
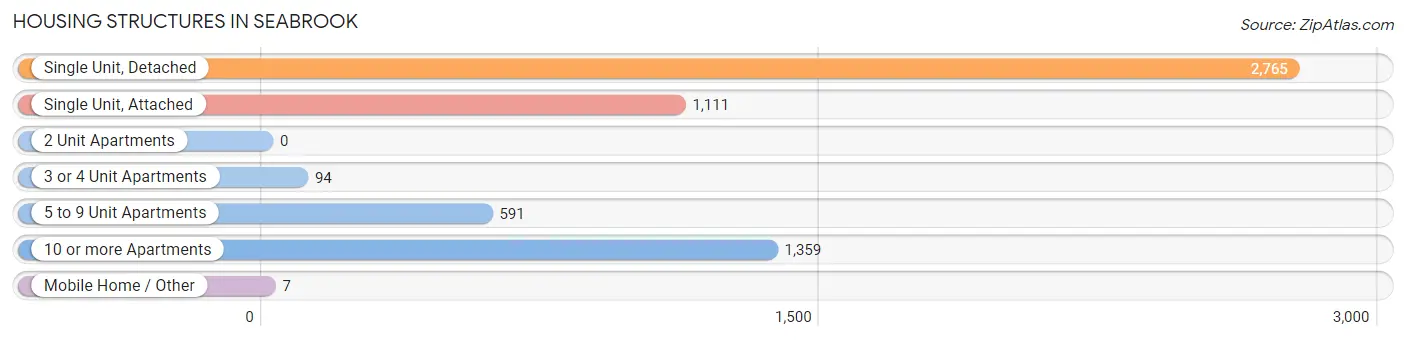
| Structure Type | # Housing Units | % Housing Units |
| Single Unit, Detached | 2,765 | 46.7% |
| Single Unit, Attached | 1,111 | 18.7% |
| 2 Unit Apartments | 0 | 0.0% |
| 3 or 4 Unit Apartments | 94 | 1.6% |
| 5 to 9 Unit Apartments | 591 | 10.0% |
| 10 or more Apartments | 1,359 | 22.9% |
| Mobile Home / Other | 7 | 0.1% |
| Total | 5,927 | 100.0% |
Housing Structures by Occupancy in Seabrook
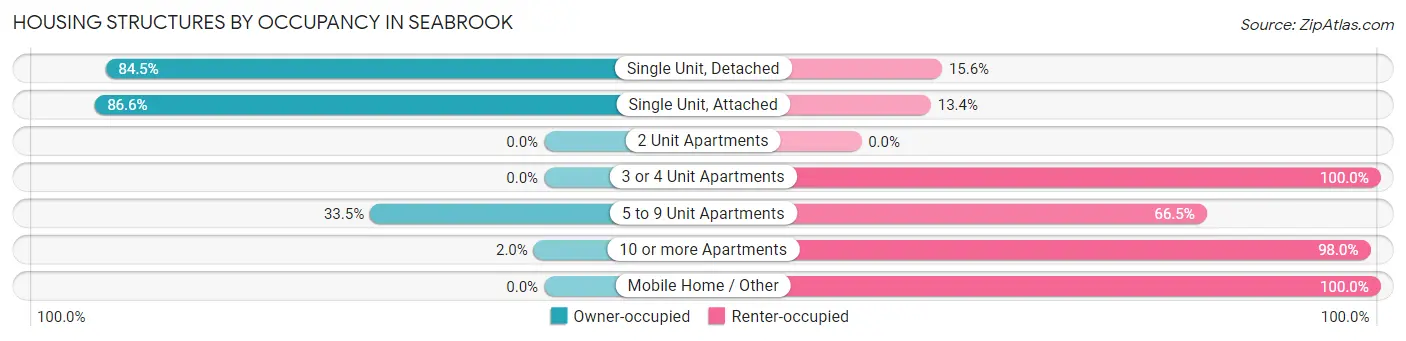
| Structure Type | Owner-occupied | Renter-occupied |
| Single Unit, Detached | 2,335 (84.5%) | 430 (15.5%) |
| Single Unit, Attached | 962 (86.6%) | 149 (13.4%) |
| 2 Unit Apartments | 0 (0.0%) | 0 (0.0%) |
| 3 or 4 Unit Apartments | 0 (0.0%) | 94 (100.0%) |
| 5 to 9 Unit Apartments | 198 (33.5%) | 393 (66.5%) |
| 10 or more Apartments | 27 (2.0%) | 1,332 (98.0%) |
| Mobile Home / Other | 0 (0.0%) | 7 (100.0%) |
| Total | 3,522 (59.4%) | 2,405 (40.6%) |
Housing Structures by Number of Rooms in Seabrook
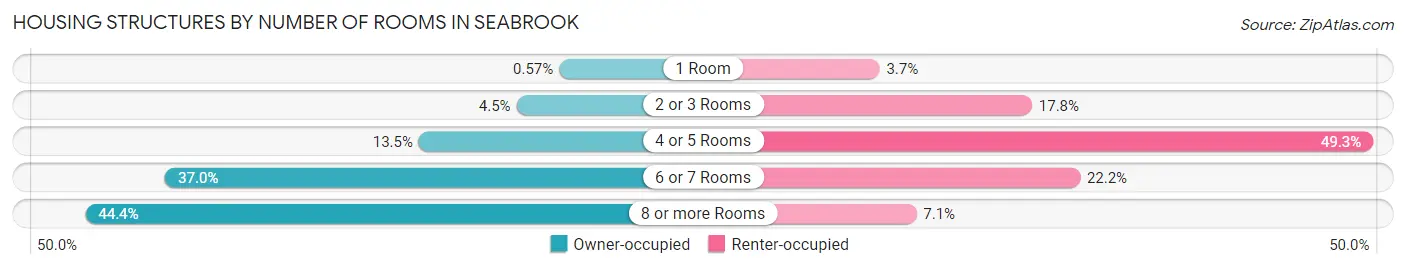
| Number of Rooms | Owner-occupied | Renter-occupied |
| 1 Room | 20 (0.6%) | 88 (3.7%) |
| 2 or 3 Rooms | 159 (4.5%) | 427 (17.7%) |
| 4 or 5 Rooms | 477 (13.5%) | 1,186 (49.3%) |
| 6 or 7 Rooms | 1,303 (37.0%) | 534 (22.2%) |
| 8 or more Rooms | 1,563 (44.4%) | 170 (7.1%) |
| Total | 3,522 (100.0%) | 2,405 (100.0%) |
Housing Structure by Heating Type in Seabrook
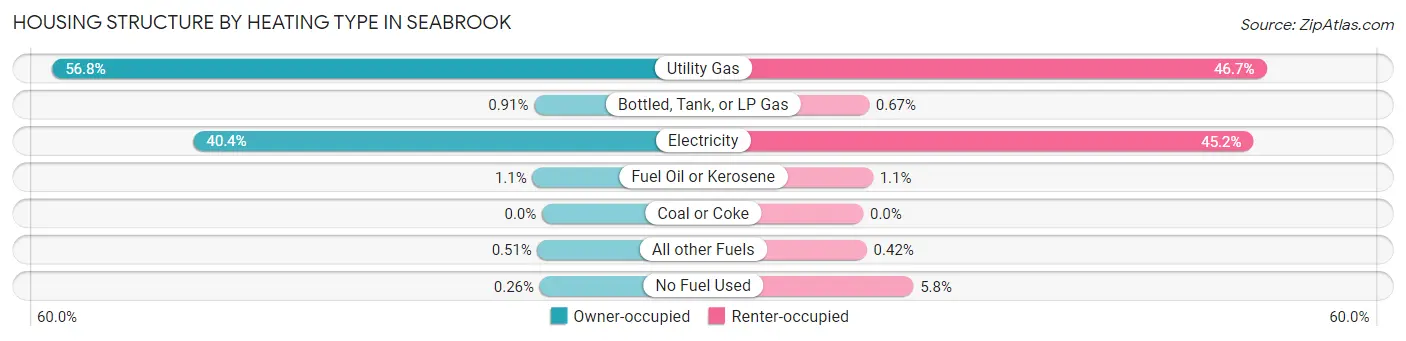
| Heating Type | Owner-occupied | Renter-occupied |
| Utility Gas | 2,000 (56.8%) | 1,124 (46.7%) |
| Bottled, Tank, or LP Gas | 32 (0.9%) | 16 (0.7%) |
| Electricity | 1,424 (40.4%) | 1,088 (45.2%) |
| Fuel Oil or Kerosene | 39 (1.1%) | 27 (1.1%) |
| Coal or Coke | 0 (0.0%) | 0 (0.0%) |
| All other Fuels | 18 (0.5%) | 10 (0.4%) |
| No Fuel Used | 9 (0.3%) | 140 (5.8%) |
| Total | 3,522 (100.0%) | 2,405 (100.0%) |
Household Vehicle Usage in Seabrook
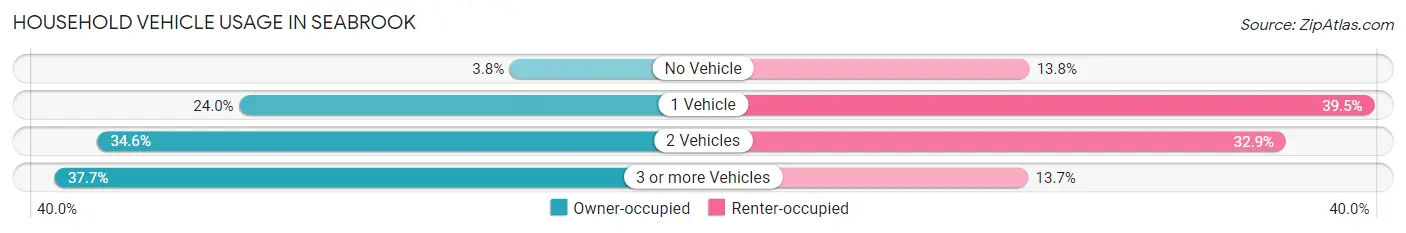
| Vehicles per Household | Owner-occupied | Renter-occupied |
| No Vehicle | 132 (3.7%) | 332 (13.8%) |
| 1 Vehicle | 844 (24.0%) | 951 (39.5%) |
| 2 Vehicles | 1,217 (34.5%) | 792 (32.9%) |
| 3 or more Vehicles | 1,329 (37.7%) | 330 (13.7%) |
| Total | 3,522 (100.0%) | 2,405 (100.0%) |
Real Estate & Mortgages in Seabrook
Real Estate and Mortgage Overview in Seabrook
| Characteristic | Without Mortgage | With Mortgage |
| Housing Units | 769 | 2,753 |
| Median Property Value | $338,700 | $367,100 |
| Median Household Income | $90,516 | $840 |
| Monthly Housing Costs | $910 | $431 |
| Real Estate Taxes | $4,155 | $57 |
Property Value by Mortgage Status in Seabrook
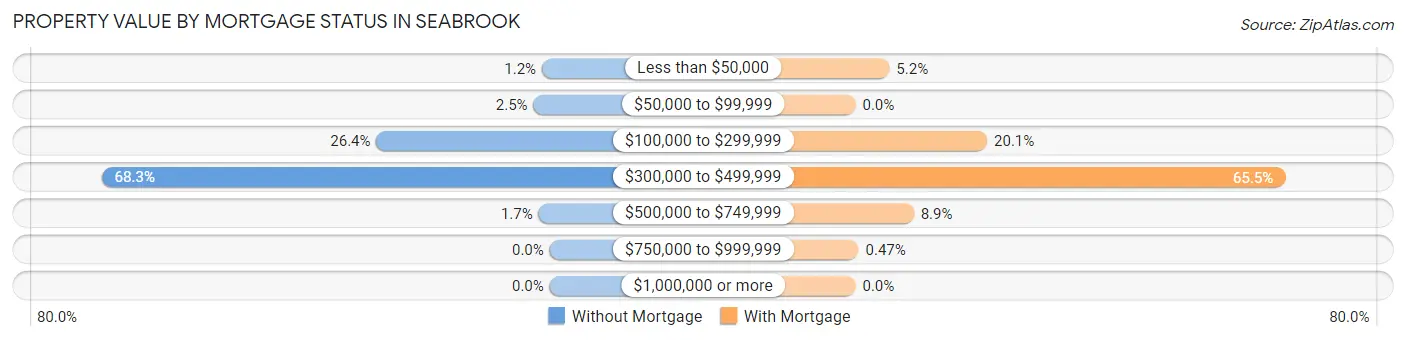
| Property Value | Without Mortgage | With Mortgage |
| Less than $50,000 | 9 (1.2%) | 142 (5.2%) |
| $50,000 to $99,999 | 19 (2.5%) | 0 (0.0%) |
| $100,000 to $299,999 | 203 (26.4%) | 552 (20.1%) |
| $300,000 to $499,999 | 525 (68.3%) | 1,802 (65.5%) |
| $500,000 to $749,999 | 13 (1.7%) | 244 (8.9%) |
| $750,000 to $999,999 | 0 (0.0%) | 13 (0.5%) |
| $1,000,000 or more | 0 (0.0%) | 0 (0.0%) |
| Total | 769 (100.0%) | 2,753 (100.0%) |
Household Income by Mortgage Status in Seabrook
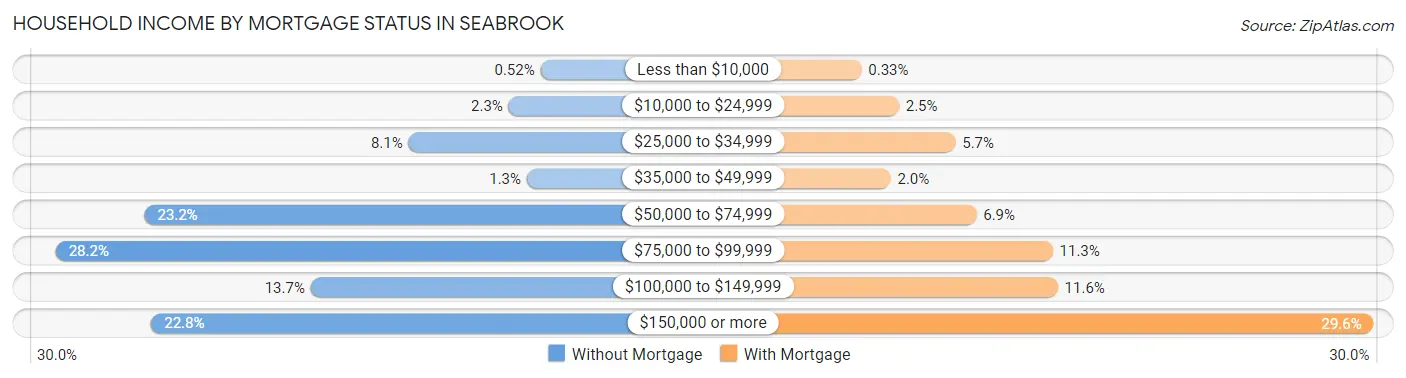
| Household Income | Without Mortgage | With Mortgage |
| Less than $10,000 | 4 (0.5%) | 9 (0.3%) |
| $10,000 to $24,999 | 18 (2.3%) | 68 (2.5%) |
| $25,000 to $34,999 | 62 (8.1%) | 157 (5.7%) |
| $35,000 to $49,999 | 10 (1.3%) | 55 (2.0%) |
| $50,000 to $74,999 | 178 (23.2%) | 190 (6.9%) |
| $75,000 to $99,999 | 217 (28.2%) | 310 (11.3%) |
| $100,000 to $149,999 | 105 (13.7%) | 318 (11.6%) |
| $150,000 or more | 175 (22.8%) | 815 (29.6%) |
| Total | 769 (100.0%) | 2,753 (100.0%) |
Property Value to Household Income Ratio in Seabrook
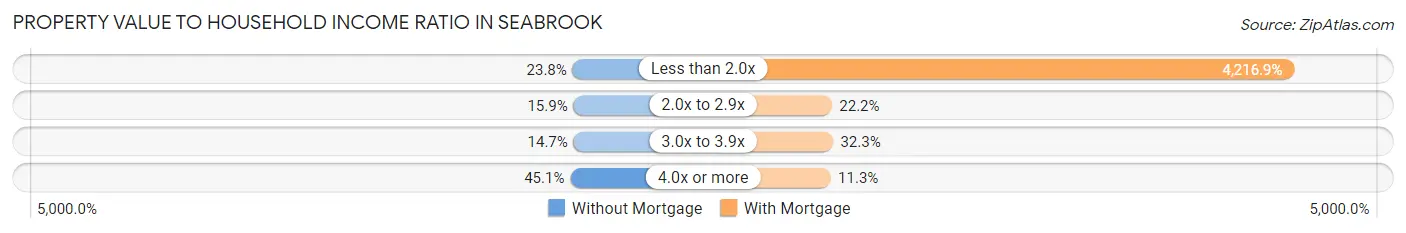
| Value-to-Income Ratio | Without Mortgage | With Mortgage |
| Less than 2.0x | 183 (23.8%) | 116,092 (4,216.9%) |
| 2.0x to 2.9x | 122 (15.9%) | 610 (22.2%) |
| 3.0x to 3.9x | 113 (14.7%) | 888 (32.3%) |
| 4.0x or more | 347 (45.1%) | 311 (11.3%) |
| Total | 769 (100.0%) | 2,753 (100.0%) |
Real Estate Taxes by Mortgage Status in Seabrook
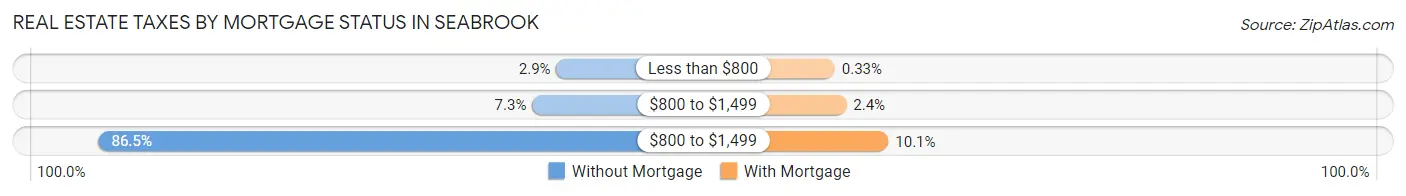
| Property Taxes | Without Mortgage | With Mortgage |
| Less than $800 | 22 (2.9%) | 9 (0.3%) |
| $800 to $1,499 | 56 (7.3%) | 67 (2.4%) |
| $800 to $1,499 | 665 (86.5%) | 278 (10.1%) |
| Total | 769 (100.0%) | 2,753 (100.0%) |
Health & Disability in Seabrook
Health Insurance Coverage by Age in Seabrook
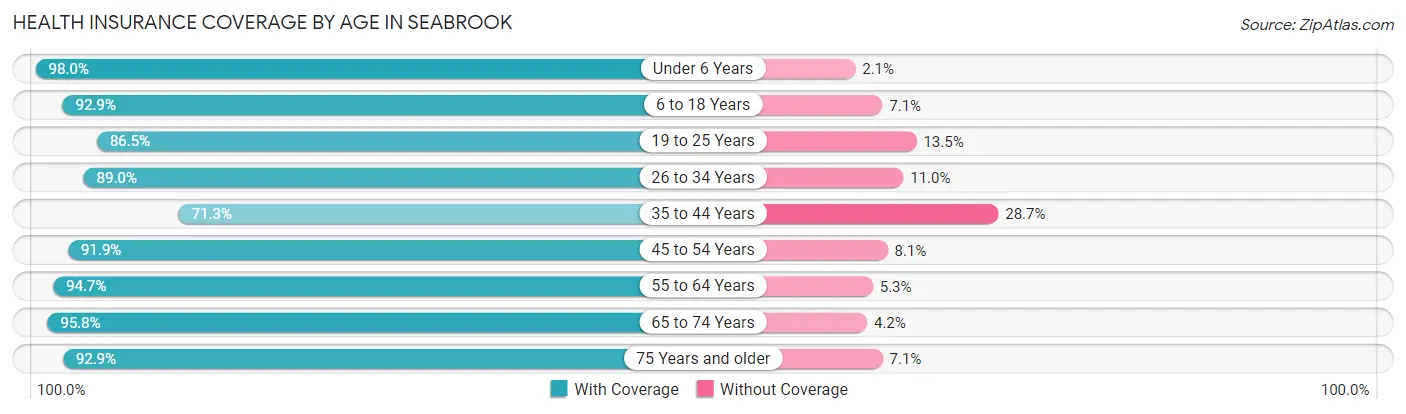
| Age Bracket | With Coverage | Without Coverage |
| Under 6 Years | 1,859 (98.0%) | 39 (2.1%) |
| 6 to 18 Years | 2,780 (92.9%) | 212 (7.1%) |
| 19 to 25 Years | 1,228 (86.5%) | 191 (13.5%) |
| 26 to 34 Years | 2,563 (89.0%) | 317 (11.0%) |
| 35 to 44 Years | 1,958 (71.3%) | 789 (28.7%) |
| 45 to 54 Years | 2,058 (91.9%) | 181 (8.1%) |
| 55 to 64 Years | 2,441 (94.7%) | 137 (5.3%) |
| 65 to 74 Years | 1,560 (95.8%) | 69 (4.2%) |
| 75 Years and older | 676 (92.9%) | 52 (7.1%) |
| Total | 17,123 (89.6%) | 1,987 (10.4%) |
Health Insurance Coverage by Citizenship Status in Seabrook
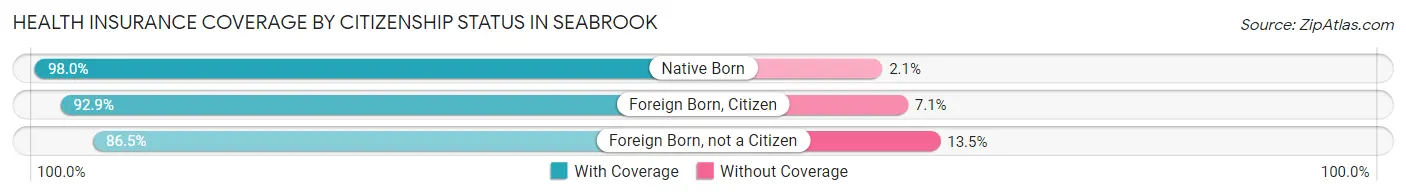
| Citizenship Status | With Coverage | Without Coverage |
| Native Born | 1,859 (98.0%) | 39 (2.1%) |
| Foreign Born, Citizen | 2,780 (92.9%) | 212 (7.1%) |
| Foreign Born, not a Citizen | 1,228 (86.5%) | 191 (13.5%) |
Health Insurance Coverage by Household Income in Seabrook
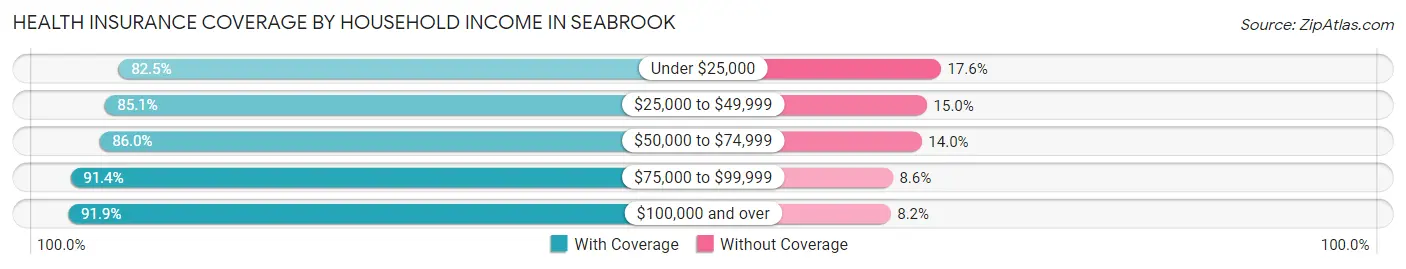
| Household Income | With Coverage | Without Coverage |
| Under $25,000 | 1,038 (82.5%) | 221 (17.5%) |
| $25,000 to $49,999 | 1,678 (85.1%) | 295 (14.9%) |
| $50,000 to $74,999 | 2,492 (86.0%) | 405 (14.0%) |
| $75,000 to $99,999 | 2,266 (91.4%) | 212 (8.6%) |
| $100,000 and over | 9,630 (91.8%) | 854 (8.2%) |
Public vs Private Health Insurance Coverage by Age in Seabrook
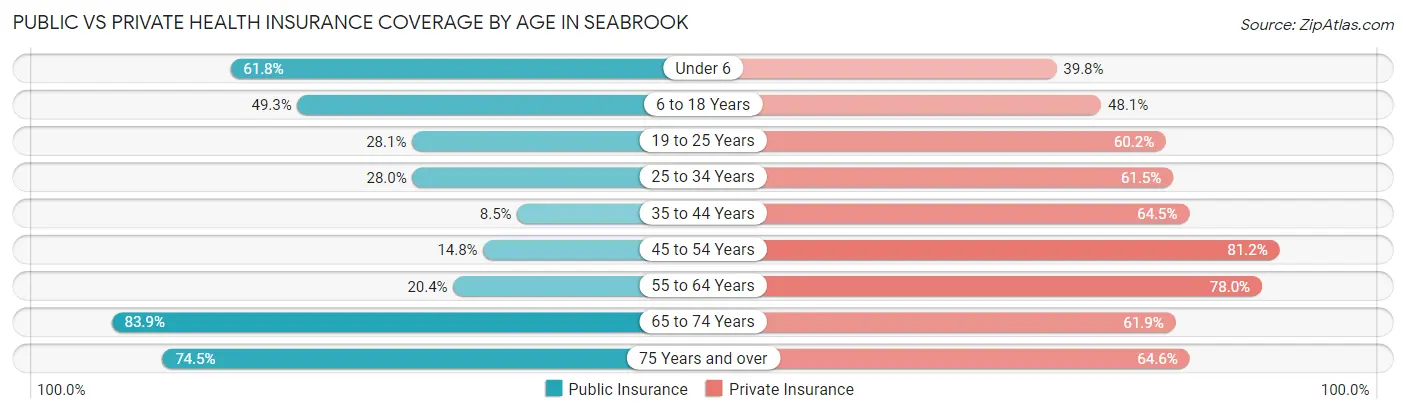
| Age Bracket | Public Insurance | Private Insurance |
| Under 6 | 1,173 (61.8%) | 756 (39.8%) |
| 6 to 18 Years | 1,476 (49.3%) | 1,440 (48.1%) |
| 19 to 25 Years | 398 (28.1%) | 854 (60.2%) |
| 25 to 34 Years | 806 (28.0%) | 1,771 (61.5%) |
| 35 to 44 Years | 234 (8.5%) | 1,772 (64.5%) |
| 45 to 54 Years | 332 (14.8%) | 1,819 (81.2%) |
| 55 to 64 Years | 526 (20.4%) | 2,010 (78.0%) |
| 65 to 74 Years | 1,366 (83.9%) | 1,009 (61.9%) |
| 75 Years and over | 542 (74.5%) | 470 (64.6%) |
| Total | 6,853 (35.9%) | 11,901 (62.3%) |
Disability Status by Sex by Age in Seabrook
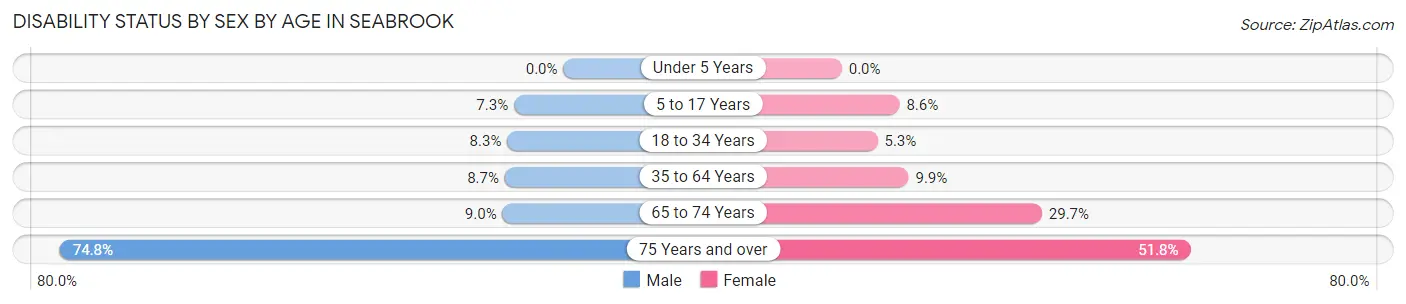
| Age Bracket | Male | Female |
| Under 5 Years | 0 (0.0%) | 0 (0.0%) |
| 5 to 17 Years | 97 (7.3%) | 136 (8.6%) |
| 18 to 34 Years | 175 (8.3%) | 130 (5.3%) |
| 35 to 64 Years | 319 (8.7%) | 386 (9.9%) |
| 65 to 74 Years | 59 (9.0%) | 290 (29.7%) |
| 75 Years and over | 160 (74.8%) | 266 (51.7%) |
Disability Class by Sex by Age in Seabrook
Disability Class: Hearing Difficulty
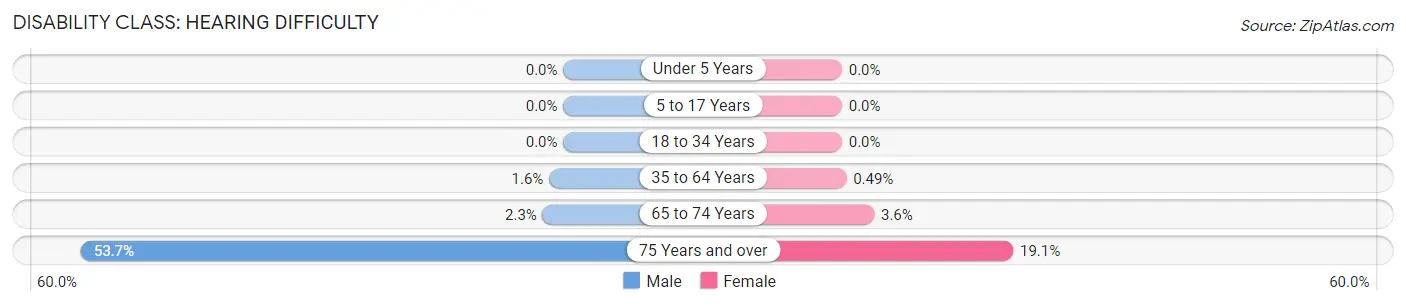
| Age Bracket | Male | Female |
| Under 5 Years | 0 (0.0%) | 0 (0.0%) |
| 5 to 17 Years | 0 (0.0%) | 0 (0.0%) |
| 18 to 34 Years | 0 (0.0%) | 0 (0.0%) |
| 35 to 64 Years | 58 (1.6%) | 19 (0.5%) |
| 65 to 74 Years | 15 (2.3%) | 35 (3.6%) |
| 75 Years and over | 115 (53.7%) | 98 (19.1%) |
Disability Class: Vision Difficulty
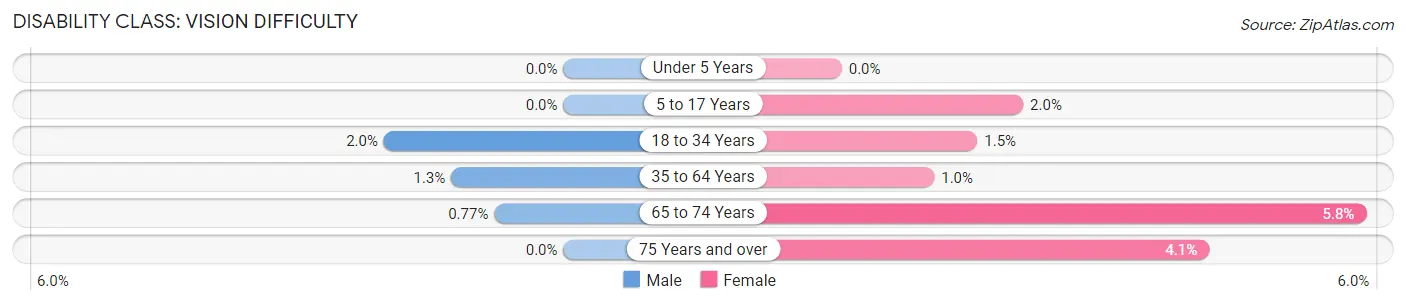
| Age Bracket | Male | Female |
| Under 5 Years | 0 (0.0%) | 0 (0.0%) |
| 5 to 17 Years | 0 (0.0%) | 32 (2.0%) |
| 18 to 34 Years | 42 (2.0%) | 37 (1.5%) |
| 35 to 64 Years | 46 (1.3%) | 40 (1.0%) |
| 65 to 74 Years | 5 (0.8%) | 57 (5.8%) |
| 75 Years and over | 0 (0.0%) | 21 (4.1%) |
Disability Class: Cognitive Difficulty
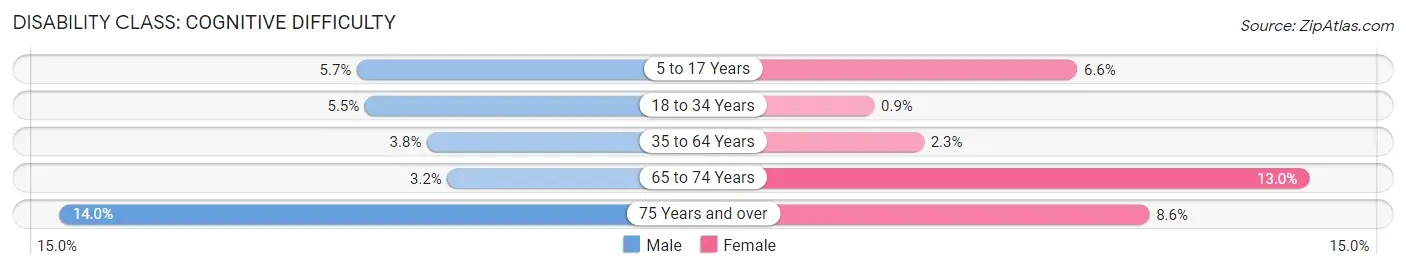
| Age Bracket | Male | Female |
| 5 to 17 Years | 76 (5.7%) | 104 (6.6%) |
| 18 to 34 Years | 116 (5.5%) | 22 (0.9%) |
| 35 to 64 Years | 139 (3.8%) | 89 (2.3%) |
| 65 to 74 Years | 21 (3.2%) | 127 (13.0%) |
| 75 Years and over | 30 (14.0%) | 44 (8.6%) |
Disability Class: Ambulatory Difficulty
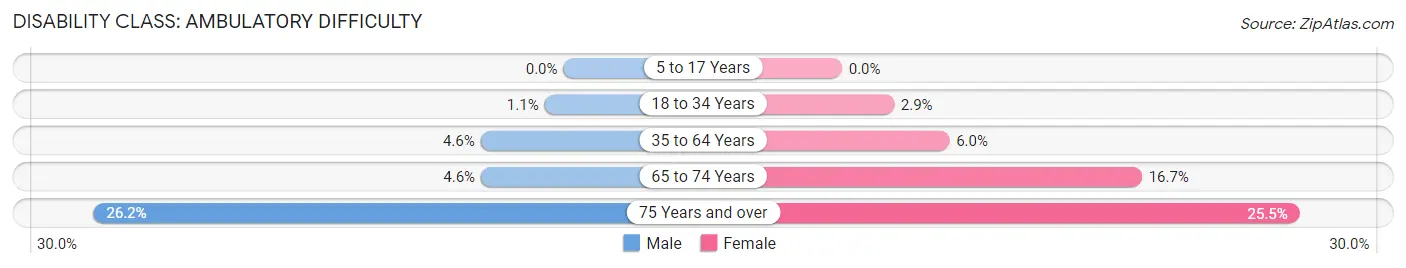
| Age Bracket | Male | Female |
| 5 to 17 Years | 0 (0.0%) | 0 (0.0%) |
| 18 to 34 Years | 22 (1.1%) | 71 (2.9%) |
| 35 to 64 Years | 169 (4.6%) | 233 (6.0%) |
| 65 to 74 Years | 30 (4.6%) | 163 (16.7%) |
| 75 Years and over | 56 (26.2%) | 131 (25.5%) |
Disability Class: Self-Care Difficulty
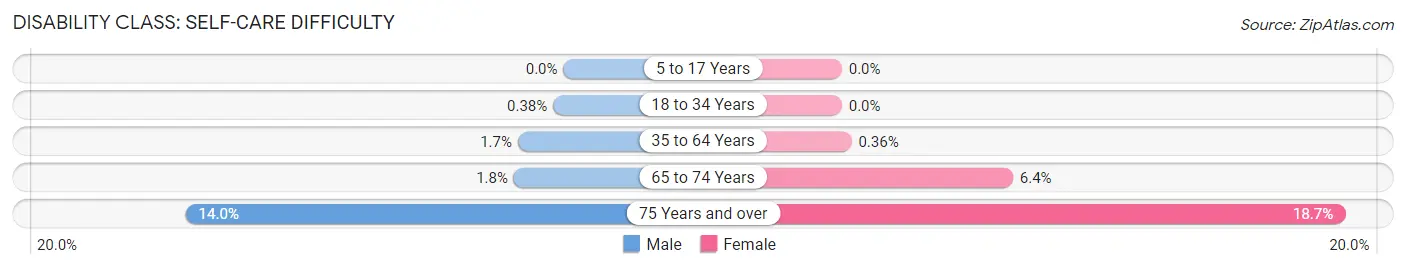
| Age Bracket | Male | Female |
| 5 to 17 Years | 0 (0.0%) | 0 (0.0%) |
| 18 to 34 Years | 8 (0.4%) | 0 (0.0%) |
| 35 to 64 Years | 62 (1.7%) | 14 (0.4%) |
| 65 to 74 Years | 12 (1.8%) | 62 (6.4%) |
| 75 Years and over | 30 (14.0%) | 96 (18.7%) |
Technology Access in Seabrook
Computing Device Access in Seabrook
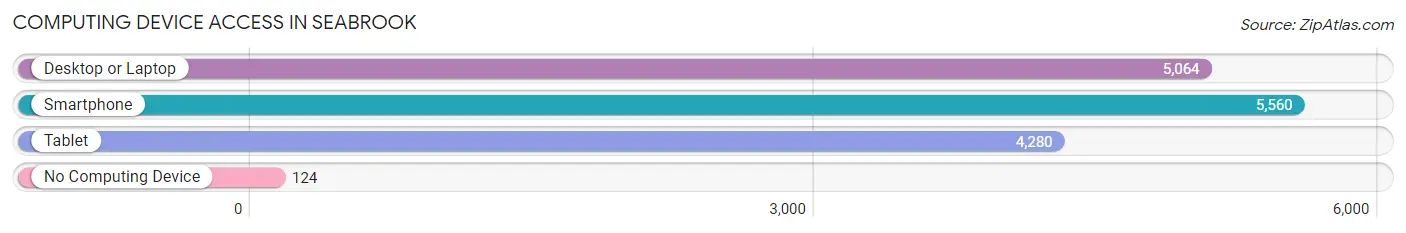
| Device Type | # Households | % Households |
| Desktop or Laptop | 5,064 | 85.4% |
| Smartphone | 5,560 | 93.8% |
| Tablet | 4,280 | 72.2% |
| No Computing Device | 124 | 2.1% |
| Total | 5,927 | 100.0% |
Internet Access in Seabrook
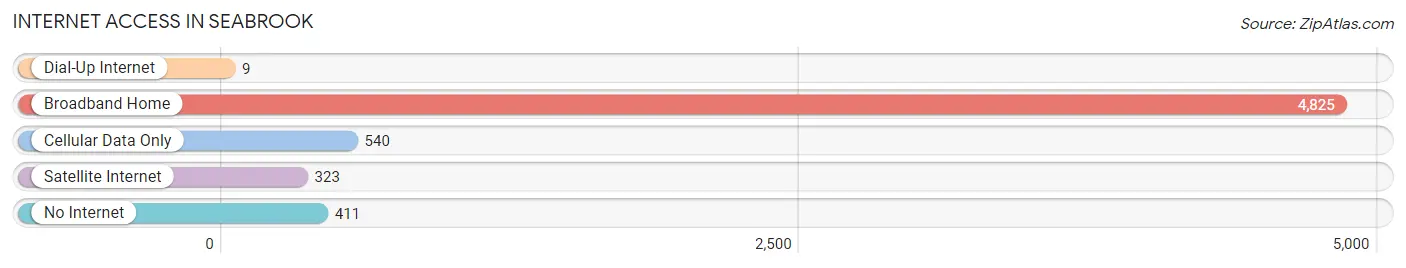
| Internet Type | # Households | % Households |
| Dial-Up Internet | 9 | 0.2% |
| Broadband Home | 4,825 | 81.4% |
| Cellular Data Only | 540 | 9.1% |
| Satellite Internet | 323 | 5.4% |
| No Internet | 411 | 6.9% |
| Total | 5,927 | 100.0% |
Seabrook Summary
Seabrook, Maryland is a small town located in Prince George’s County, Maryland. It is situated on the banks of the Patuxent River, about 25 miles south of Washington, D.C. Seabrook is a rural community with a population of about 1,500 people.
History
The area that is now Seabrook was first settled in the early 1700s by English colonists. The town was originally known as “Seabrook’s Landing” and was a major port for the tobacco trade. In the late 1700s, the town was renamed “Seabrook” after the Seabrook family, who owned much of the land in the area.
In the early 1800s, Seabrook was a thriving port town with a population of over 1,000 people. The town was home to several businesses, including a shipyard, a sawmill, and a gristmill. The town also had a post office, a school, and several churches.
In the late 1800s, the town began to decline as the tobacco trade moved elsewhere. By the early 1900s, the population had dropped to just over 500 people.
Geography
Seabrook is located in Prince George’s County, Maryland. It is situated on the banks of the Patuxent River, about 25 miles south of Washington, D.C. The town is surrounded by rural farmland and is bordered by the towns of Aquasco, Brandywine, and Cheltenham.
The town has a total area of 1.2 square miles, all of which is land. The terrain is mostly flat, with some rolling hills. The climate is humid subtropical, with hot, humid summers and mild winters.
Economy
The economy of Seabrook is largely based on agriculture. The town is home to several farms, which produce a variety of crops, including corn, soybeans, and wheat. The town also has a few small businesses, including a gas station, a convenience store, and a few restaurants.
Demographics
As of the 2010 census, Seabrook had a population of 1,500 people. The racial makeup of the town was 79.3% White, 15.3% African American, 0.7% Native American, 0.7% Asian, and 3.3% from other races. The median household income was $50,000, and the median family income was $54,000.
Seabrook is a small, rural town with a rich history and a strong agricultural economy. The town is home to a diverse population and offers a peaceful, rural lifestyle.
Common Questions
What is Per Capita Income in Seabrook?
Per Capita income in Seabrook is $35,263.
What is the Median Family Income in Seabrook?
Median Family Income in Seabrook is $94,320.
What is the Median Household income in Seabrook?
Median Household Income in Seabrook is $96,078.
What is Income or Wage Gap in Seabrook?
Income or Wage Gap in Seabrook is 23.9%.
Women in Seabrook earn 76.1 cents for every dollar earned by a man.
What is Inequality or Gini Index in Seabrook?
Inequality or Gini Index in Seabrook is 0.36.
What is the Total Population of Seabrook?
Total Population of Seabrook is 19,369.
What is the Total Male Population of Seabrook?
Total Male Population of Seabrook is 9,035.
What is the Total Female Population of Seabrook?
Total Female Population of Seabrook is 10,334.
What is the Ratio of Males per 100 Females in Seabrook?
There are 87.43 Males per 100 Females in Seabrook.
What is the Ratio of Females per 100 Males in Seabrook?
There are 114.38 Females per 100 Males in Seabrook.
What is the Median Population Age in Seabrook?
Median Population Age in Seabrook is 36.4 Years.
What is the Average Family Size in Seabrook
Average Family Size in Seabrook is 3.6 People.
What is the Average Household Size in Seabrook
Average Household Size in Seabrook is 3.2 People.
How Large is the Labor Force in Seabrook?
There are 11,001 People in the Labor Forcein in Seabrook.
What is the Percentage of People in the Labor Force in Seabrook?
72.6% of People are in the Labor Force in Seabrook.
What is the Unemployment Rate in Seabrook?
Unemployment Rate in Seabrook is 7.1%.