Downsville, MD Map & Demographics
Downsville Map
Downsville Overview
$41,057
PER CAPITA INCOME
$142,969
AVG FAMILY INCOME
0.32
INEQUALITY / GINI INDEX
918
TOTAL POPULATION
459
MALE POPULATION
459
FEMALE POPULATION
100.00
MALES / 100 FEMALES
100.00
FEMALES / 100 MALES
27.6
MEDIAN AGE
3.5
AVG FAMILY SIZE
2.8
AVG HOUSEHOLD SIZE
751
LABOR FORCE [ PEOPLE ]
81.8%
PERCENT IN LABOR FORCE
7.9%
UNEMPLOYMENT RATE
Income in Downsville
Income Overview in Downsville
| Characteristic | Number | Measure |
| Per Capita Income | 918 | $41,057 |
| Median Family Income | 195 | $142,969 |
| Mean Family Income | 195 | $132,650 |
| Median Household Income | 330 | $0 |
| Mean Household Income | 330 | $120,619 |
| Income Deficit | 195 | $0 |
| Wage / Income Gap (%) | 918 | 0.00% |
| Wage / Income Gap ($) | 918 | 100.00¢ per $1 |
| Gini / Inequality Index | 918 | 0.32 |
Earnings by Sex in Downsville
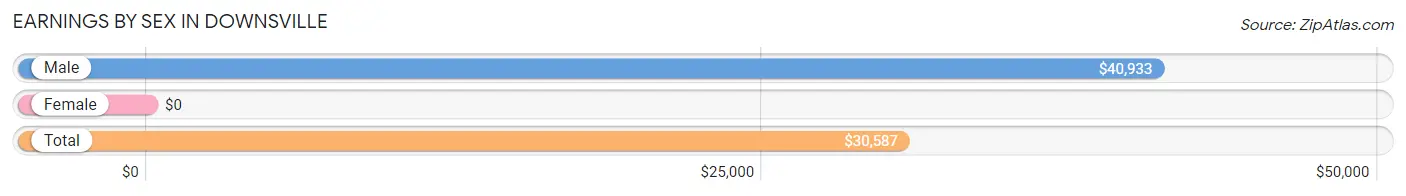
| Sex | Number | Average Earnings |
| Male | 459 (50.7%) | $40,933 |
| Female | 446 (49.3%) | $0 |
| Total | 905 (100.0%) | $30,587 |
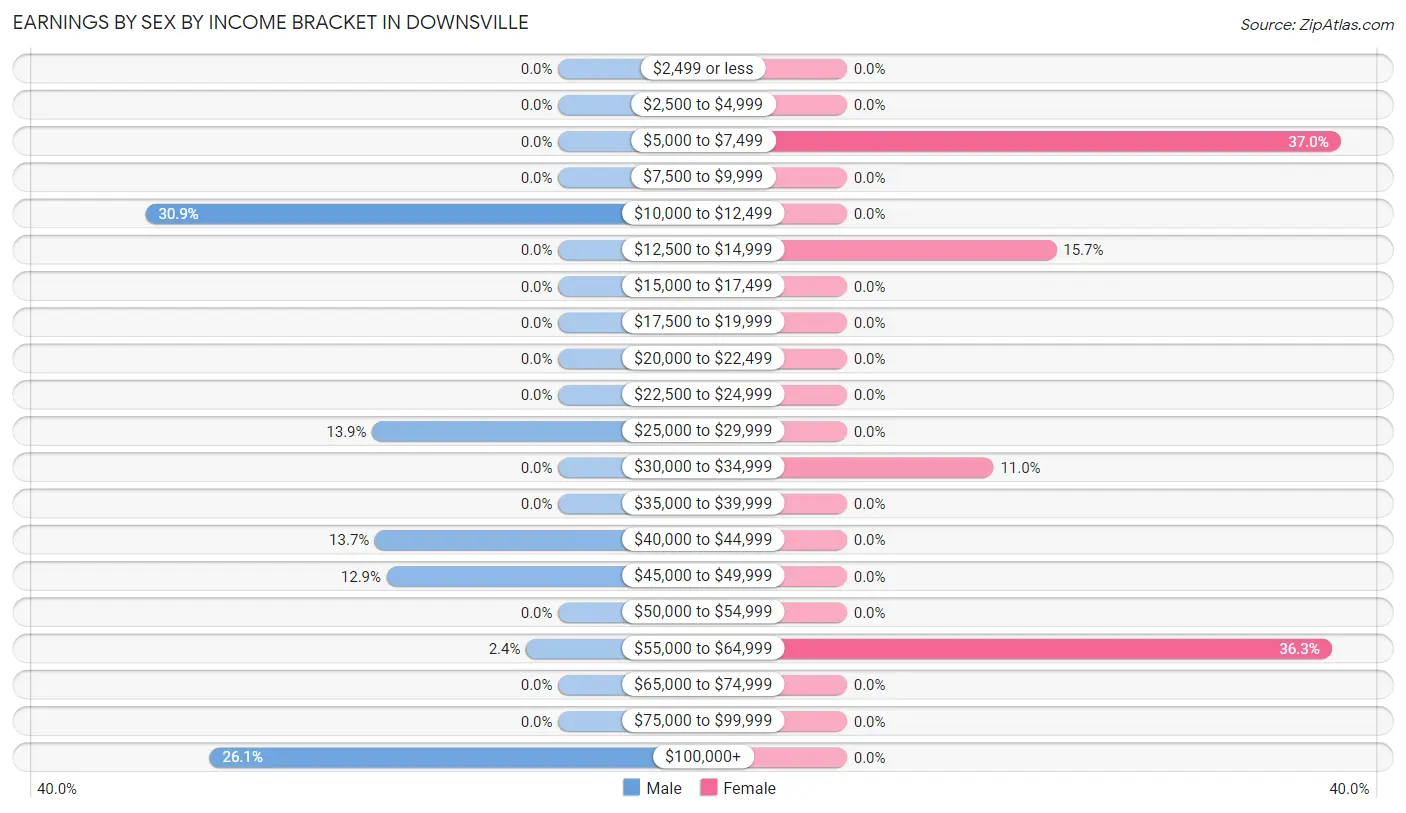
Earnings by Sex by Income Bracket in Downsville
The most common earnings brackets in Downsville are $10,000 to $12,499 for men (142 | 30.9%) and $5,000 to $7,499 for women (165 | 37.0%).
| Income | Male | Female |
| $2,499 or less | 0 (0.0%) | 0 (0.0%) |
| $2,500 to $4,999 | 0 (0.0%) | 0 (0.0%) |
| $5,000 to $7,499 | 0 (0.0%) | 165 (37.0%) |
| $7,500 to $9,999 | 0 (0.0%) | 0 (0.0%) |
| $10,000 to $12,499 | 142 (30.9%) | 0 (0.0%) |
| $12,500 to $14,999 | 0 (0.0%) | 70 (15.7%) |
| $15,000 to $17,499 | 0 (0.0%) | 0 (0.0%) |
| $17,500 to $19,999 | 0 (0.0%) | 0 (0.0%) |
| $20,000 to $22,499 | 0 (0.0%) | 0 (0.0%) |
| $22,500 to $24,999 | 0 (0.0%) | 0 (0.0%) |
| $25,000 to $29,999 | 64 (13.9%) | 0 (0.0%) |
| $30,000 to $34,999 | 0 (0.0%) | 49 (11.0%) |
| $35,000 to $39,999 | 0 (0.0%) | 0 (0.0%) |
| $40,000 to $44,999 | 63 (13.7%) | 0 (0.0%) |
| $45,000 to $49,999 | 59 (12.9%) | 0 (0.0%) |
| $50,000 to $54,999 | 0 (0.0%) | 0 (0.0%) |
| $55,000 to $64,999 | 11 (2.4%) | 162 (36.3%) |
| $65,000 to $74,999 | 0 (0.0%) | 0 (0.0%) |
| $75,000 to $99,999 | 0 (0.0%) | 0 (0.0%) |
| $100,000+ | 120 (26.1%) | 0 (0.0%) |
| Total | 459 (100.0%) | 446 (100.0%) |
Earnings by Sex by Educational Attainment in Downsville
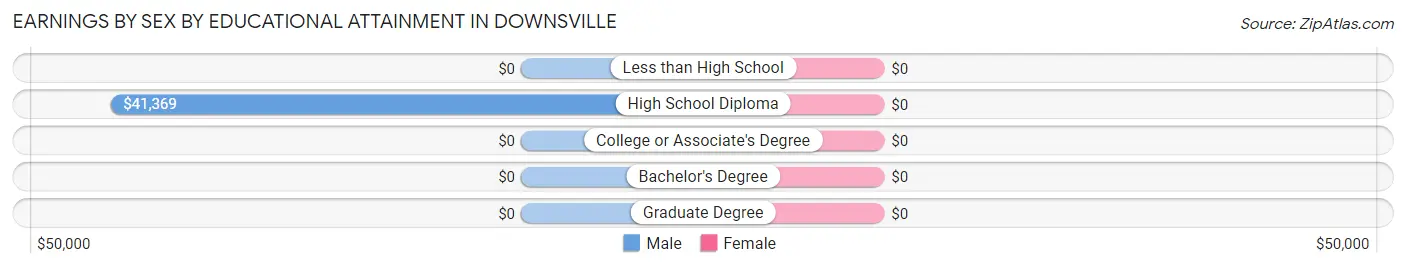
| Educational Attainment | Male Income | Female Income |
| Less than High School | - | - |
| High School Diploma | $41,369 | $0 |
| College or Associate's Degree | - | - |
| Bachelor's Degree | - | - |
| Graduate Degree | - | - |
| Total | - | - |
Family Income in Downsville
Family Income Brackets in Downsville
According to the Downsville family income data, there are 184 families falling into the $100,000 to $149,999 income range, which is the most common income bracket and makes up 94.4% of all families.
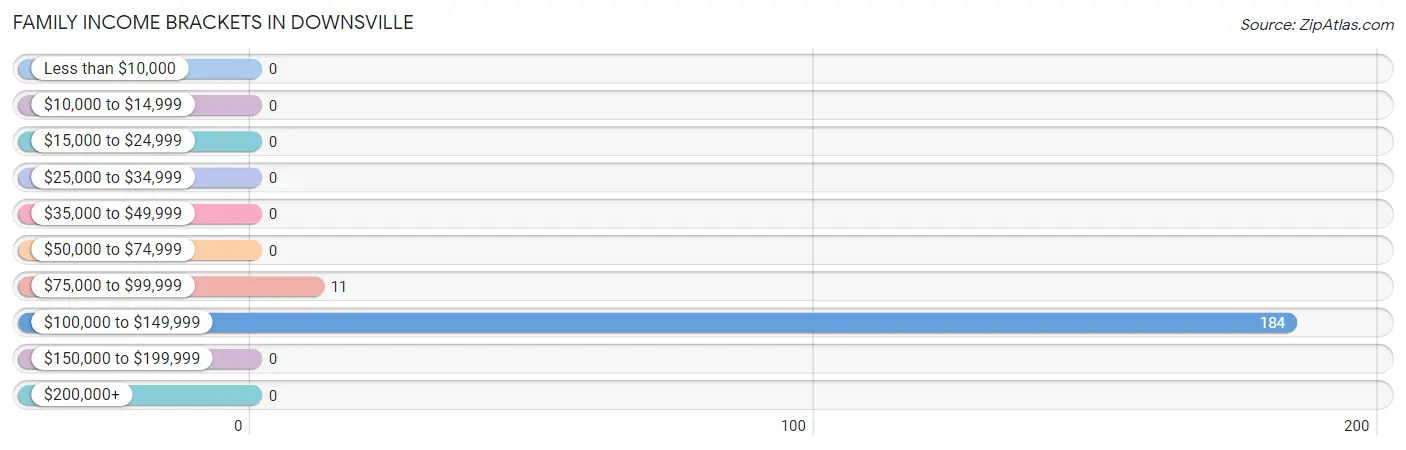
| Income Bracket | # Families | % Families |
| Less than $10,000 | 0 | 0.0% |
| $10,000 to $14,999 | 0 | 0.0% |
| $15,000 to $24,999 | 0 | 0.0% |
| $25,000 to $34,999 | 0 | 0.0% |
| $35,000 to $49,999 | 0 | 0.0% |
| $50,000 to $74,999 | 0 | 0.0% |
| $75,000 to $99,999 | 11 | 5.6% |
| $100,000 to $149,999 | 184 | 94.4% |
| $150,000 to $199,999 | 0 | 0.0% |
| $200,000+ | 0 | 0.0% |
Family Income by Famaliy Size in Downsville
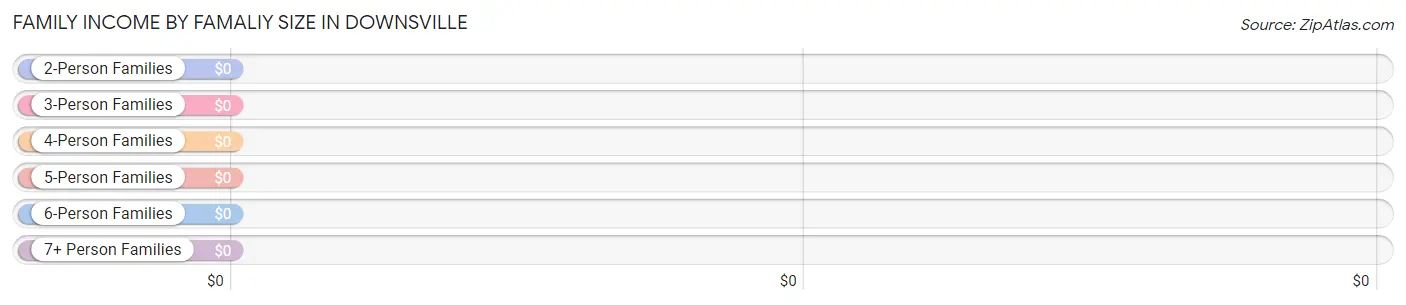
| Income Bracket | # Families | Median Income |
| 2-Person Families | 11 (5.6%) | $0 |
| 3-Person Families | 64 (32.8%) | $0 |
| 4-Person Families | 120 (61.5%) | $0 |
| 5-Person Families | 0 (0.0%) | $0 |
| 6-Person Families | 0 (0.0%) | $0 |
| 7+ Person Families | 0 (0.0%) | $0 |
| Total | 195 (100.0%) | $142,969 |
Family Income by Number of Earners in Downsville
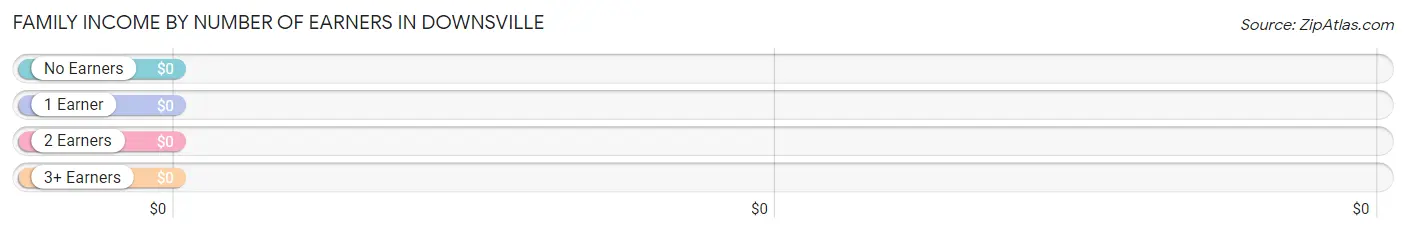
| Number of Earners | # Families | Median Income |
| No Earners | 0 (0.0%) | $0 |
| 1 Earner | 0 (0.0%) | $0 |
| 2 Earners | 11 (5.6%) | $0 |
| 3+ Earners | 184 (94.4%) | $0 |
| Total | 195 (100.0%) | $142,969 |
Household Income in Downsville
Household Income Brackets in Downsville
With 120 households falling in the category, the $200,000+ income range is the most frequent in Downsville, accounting for 36.4% of all households.
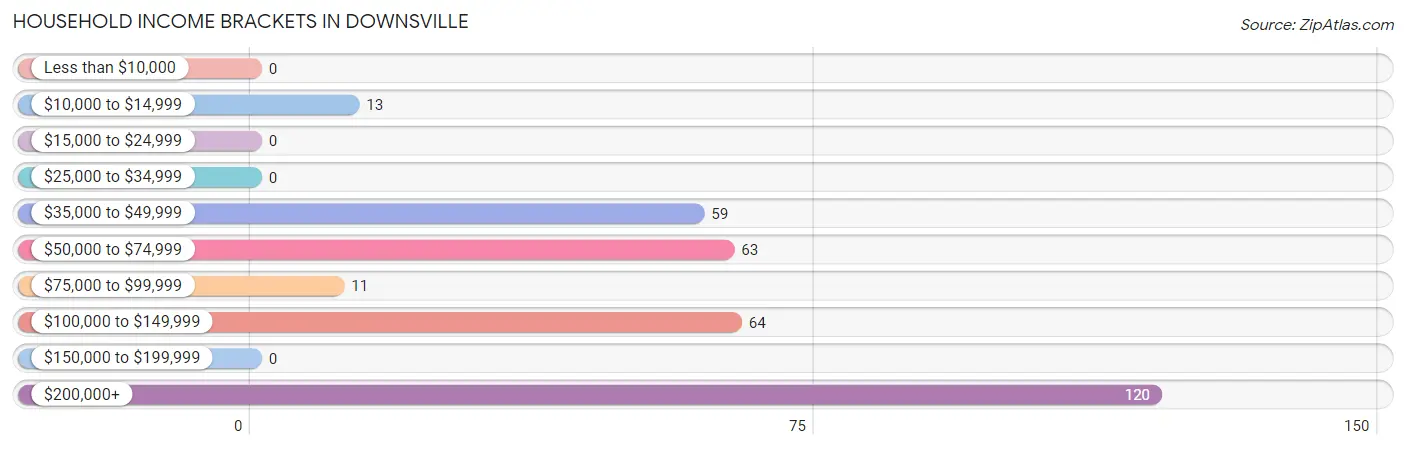
| Income Bracket | # Households | % Households |
| Less than $10,000 | 0 | 0.0% |
| $10,000 to $14,999 | 13 | 3.9% |
| $15,000 to $24,999 | 0 | 0.0% |
| $25,000 to $34,999 | 0 | 0.0% |
| $35,000 to $49,999 | 59 | 17.9% |
| $50,000 to $74,999 | 63 | 19.1% |
| $75,000 to $99,999 | 11 | 3.3% |
| $100,000 to $149,999 | 64 | 19.4% |
| $150,000 to $199,999 | 0 | 0.0% |
| $200,000+ | 120 | 36.4% |
Household Income by Householder Age in Downsville
| Income Bracket | # Households | Median Income |
| 15 to 24 Years | 0 (0.0%) | $0 |
| 25 to 44 Years | 179 (54.2%) | $0 |
| 45 to 64 Years | 138 (41.8%) | $0 |
| 65+ Years | 13 (3.9%) | $0 |
| Total | 330 (100.0%) | $0 |
Poverty in Downsville
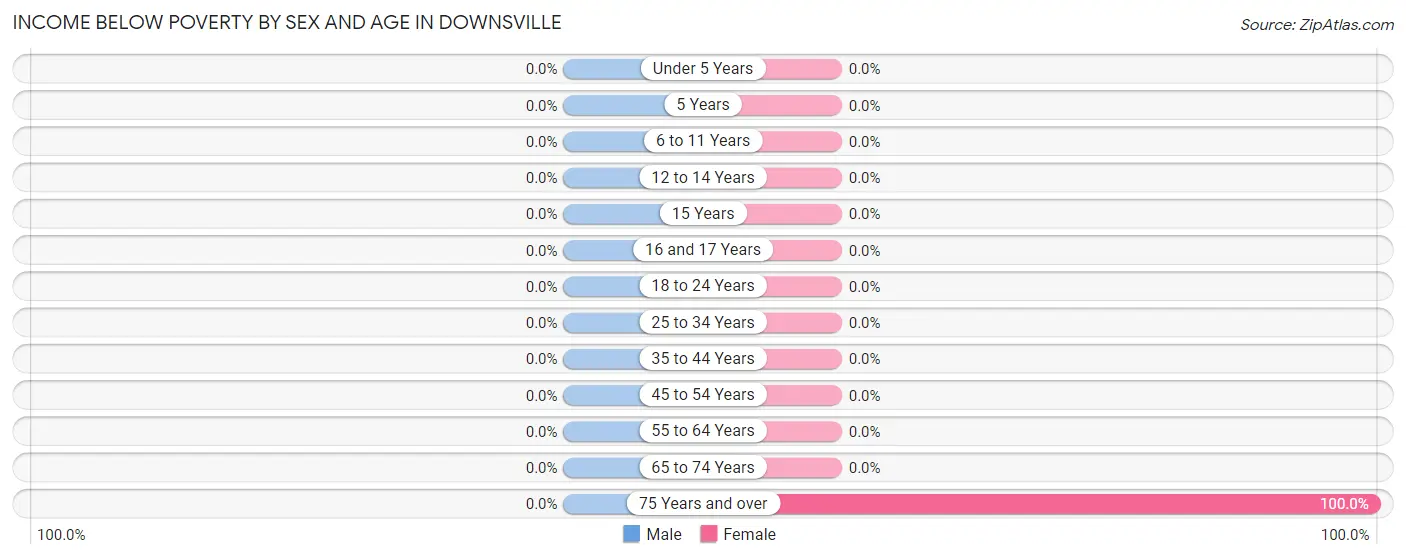
Income Below Poverty by Sex and Age in Downsville
| Age Bracket | Male | Female |
| Under 5 Years | 0 (0.0%) | 0 (0.0%) |
| 5 Years | 0 (0.0%) | 0 (0.0%) |
| 6 to 11 Years | 0 (0.0%) | 0 (0.0%) |
| 12 to 14 Years | 0 (0.0%) | 0 (0.0%) |
| 15 Years | 0 (0.0%) | 0 (0.0%) |
| 16 and 17 Years | 0 (0.0%) | 0 (0.0%) |
| 18 to 24 Years | 0 (0.0%) | 0 (0.0%) |
| 25 to 34 Years | 0 (0.0%) | 0 (0.0%) |
| 35 to 44 Years | 0 (0.0%) | 0 (0.0%) |
| 45 to 54 Years | 0 (0.0%) | 0 (0.0%) |
| 55 to 64 Years | 0 (0.0%) | 0 (0.0%) |
| 65 to 74 Years | 0 (0.0%) | 0 (0.0%) |
| 75 Years and over | 0 (0.0%) | 13 (100.0%) |
| Total | 0 (0.0%) | 13 (2.8%) |
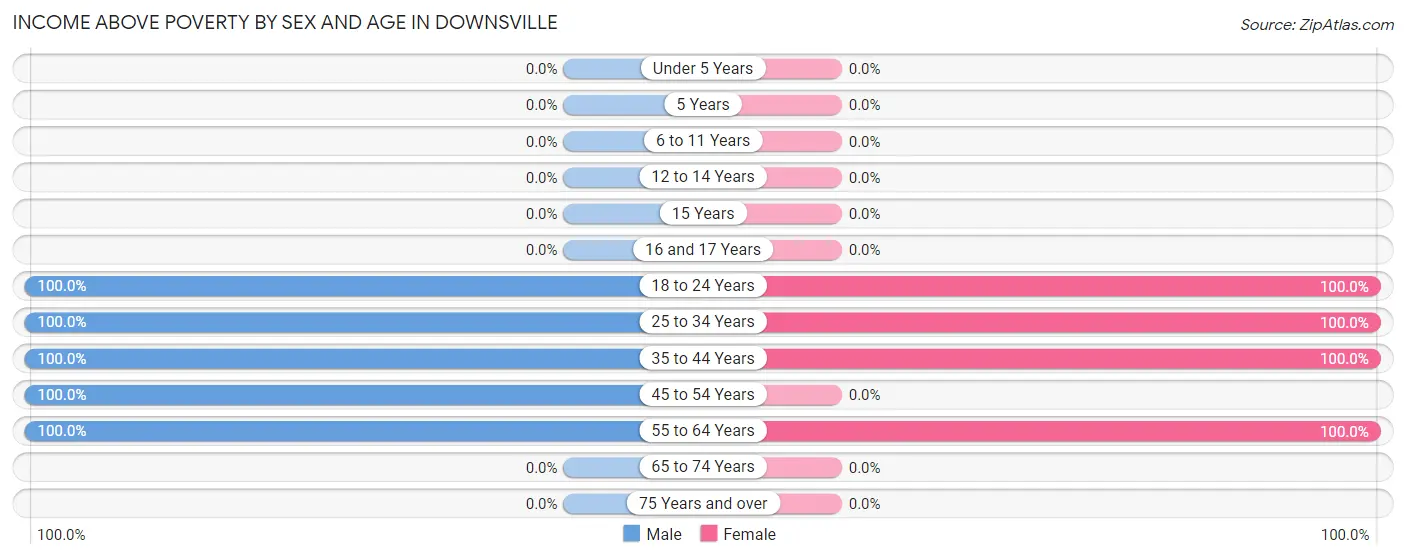
Income Above Poverty by Sex and Age in Downsville
According to the poverty statistics in Downsville, males aged 18 to 24 years and females aged 18 to 24 years are the age groups that are most secure financially, with 100.0% of males and 100.0% of females in these age groups living above the poverty line.
| Age Bracket | Male | Female |
| Under 5 Years | 0 (0.0%) | 0 (0.0%) |
| 5 Years | 0 (0.0%) | 0 (0.0%) |
| 6 to 11 Years | 0 (0.0%) | 0 (0.0%) |
| 12 to 14 Years | 0 (0.0%) | 0 (0.0%) |
| 15 Years | 0 (0.0%) | 0 (0.0%) |
| 16 and 17 Years | 0 (0.0%) | 0 (0.0%) |
| 18 to 24 Years | 142 (100.0%) | 224 (100.0%) |
| 25 to 34 Years | 59 (100.0%) | 58 (100.0%) |
| 35 to 44 Years | 120 (100.0%) | 104 (100.0%) |
| 45 to 54 Years | 127 (100.0%) | 0 (0.0%) |
| 55 to 64 Years | 11 (100.0%) | 60 (100.0%) |
| 65 to 74 Years | 0 (0.0%) | 0 (0.0%) |
| 75 Years and over | 0 (0.0%) | 0 (0.0%) |
| Total | 459 (100.0%) | 446 (97.2%) |
Income Below Poverty Among Married-Couple Families in Downsville
| Children | Above Poverty | Below Poverty |
| No Children | 75 (100.0%) | 0 (0.0%) |
| 1 or 2 Children | 0 (0.0%) | 0 (0.0%) |
| 3 or 4 Children | 0 (0.0%) | 0 (0.0%) |
| 5 or more Children | 0 (0.0%) | 0 (0.0%) |
| Total | 75 (100.0%) | 0 (0.0%) |
Income Below Poverty Among Single-Parent Households in Downsville
| Children | Single Father | Single Mother |
| No Children | 0 (0.0%) | 0 (0.0%) |
| 1 or 2 Children | 0 (0.0%) | 0 (0.0%) |
| 3 or 4 Children | 0 (0.0%) | 0 (0.0%) |
| 5 or more Children | 0 (0.0%) | 0 (0.0%) |
| Total | 0 (0.0%) | 0 (0.0%) |
Income Below Poverty Among Married-Couple vs Single-Parent Households in Downsville
| Children | Married-Couple Families | Single-Parent Households |
| No Children | 0 (0.0%) | 0 (0.0%) |
| 1 or 2 Children | 0 (0.0%) | 0 (0.0%) |
| 3 or 4 Children | 0 (0.0%) | 0 (0.0%) |
| 5 or more Children | 0 (0.0%) | 0 (0.0%) |
| Total | 0 (0.0%) | 0 (0.0%) |
Race in Downsville
The most populous races in Downsville are , and White / Caucasian (918 | 100.0%).
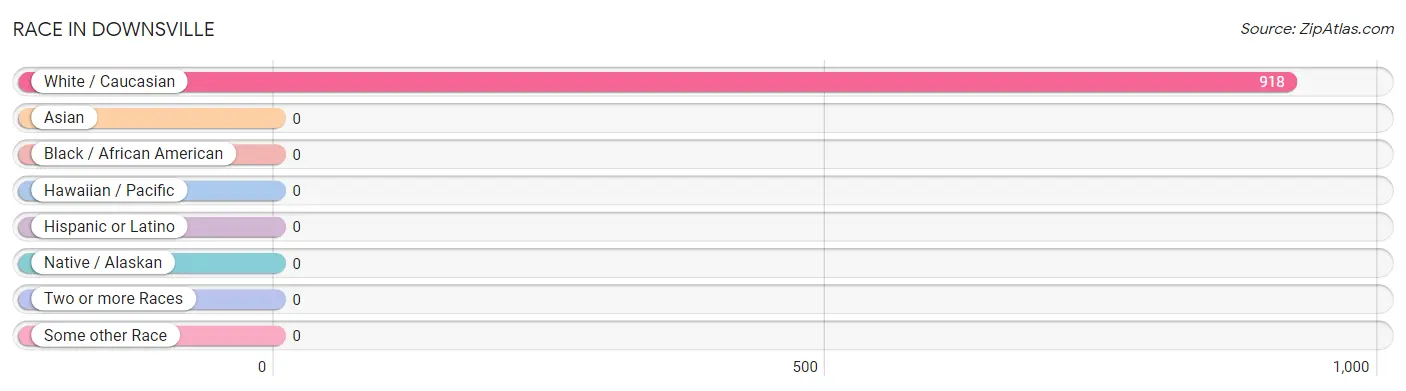
| Race | # Population | % Population |
| Asian | 0 | 0.0% |
| Black / African American | 0 | 0.0% |
| Hawaiian / Pacific | 0 | 0.0% |
| Hispanic or Latino | 0 | 0.0% |
| Native / Alaskan | 0 | 0.0% |
| White / Caucasian | 918 | 100.0% |
| Two or more Races | 0 | 0.0% |
| Some other Race | 0 | 0.0% |
| Total | 918 | 100.0% |
Ancestry in Downsville
The most populous ancestries reported in Downsville are Irish (328 | 35.7%), German (321 | 35.0%), Italian (262 | 28.5%), English (154 | 16.8%), and American (22 | 2.4%), together accounting for 118.4% of all Downsville residents.
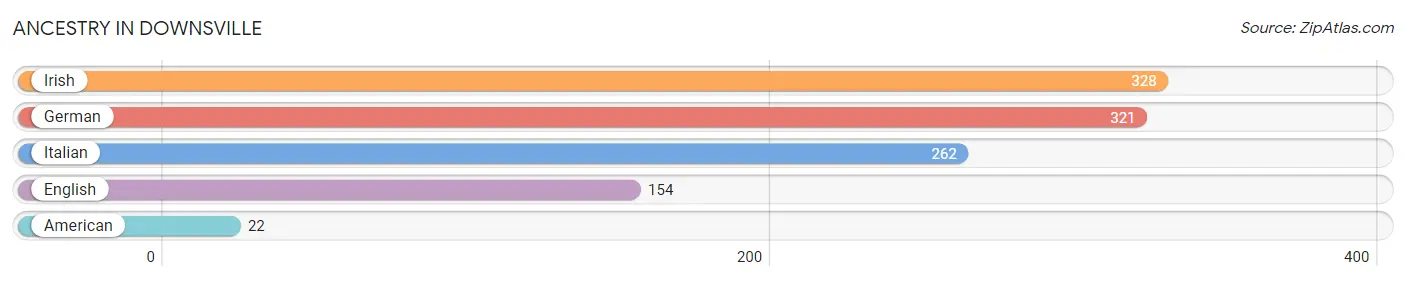
| Ancestry | # Population | % Population |
| American | 22 | 2.4% |
| English | 154 | 16.8% |
| German | 321 | 35.0% |
| Irish | 328 | 35.7% |
| Italian | 262 | 28.5% | View All 5 Rows |
Immigrants in Downsville

| Immigration Origin | # Population | % Population | View All 0 Rows |
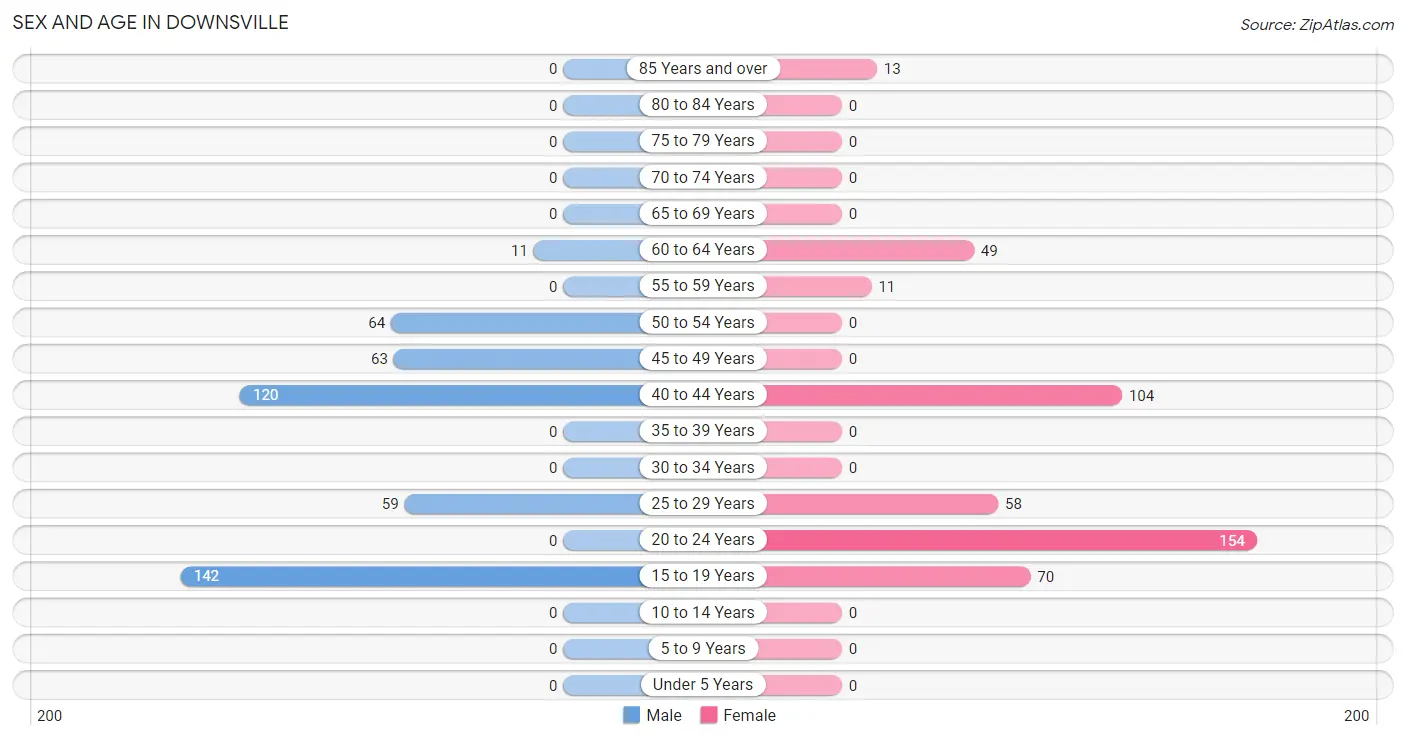
Sex and Age in Downsville
Sex and Age in Downsville
The most populous age groups in Downsville are 15 to 19 Years (142 | 30.9%) for men and 20 to 24 Years (154 | 33.6%) for women.
| Age Bracket | Male | Female |
| Under 5 Years | 0 (0.0%) | 0 (0.0%) |
| 5 to 9 Years | 0 (0.0%) | 0 (0.0%) |
| 10 to 14 Years | 0 (0.0%) | 0 (0.0%) |
| 15 to 19 Years | 142 (30.9%) | 70 (15.2%) |
| 20 to 24 Years | 0 (0.0%) | 154 (33.6%) |
| 25 to 29 Years | 59 (12.9%) | 58 (12.6%) |
| 30 to 34 Years | 0 (0.0%) | 0 (0.0%) |
| 35 to 39 Years | 0 (0.0%) | 0 (0.0%) |
| 40 to 44 Years | 120 (26.1%) | 104 (22.7%) |
| 45 to 49 Years | 63 (13.7%) | 0 (0.0%) |
| 50 to 54 Years | 64 (13.9%) | 0 (0.0%) |
| 55 to 59 Years | 0 (0.0%) | 11 (2.4%) |
| 60 to 64 Years | 11 (2.4%) | 49 (10.7%) |
| 65 to 69 Years | 0 (0.0%) | 0 (0.0%) |
| 70 to 74 Years | 0 (0.0%) | 0 (0.0%) |
| 75 to 79 Years | 0 (0.0%) | 0 (0.0%) |
| 80 to 84 Years | 0 (0.0%) | 0 (0.0%) |
| 85 Years and over | 0 (0.0%) | 13 (2.8%) |
| Total | 459 (100.0%) | 459 (100.0%) |
Families and Households in Downsville
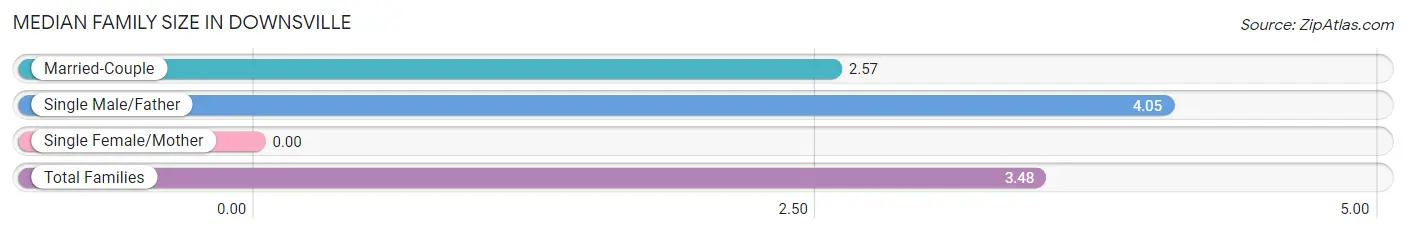
Median Family Size in Downsville
| Family Type | # Families | Family Size |
| Married-Couple | 75 (38.5%) | 2.57 |
| Single Male/Father | 120 (61.5%) | 4.05 |
| Single Female/Mother | 0 (0.0%) | - |
| Total Families | 195 (100.0%) | 3.48 |
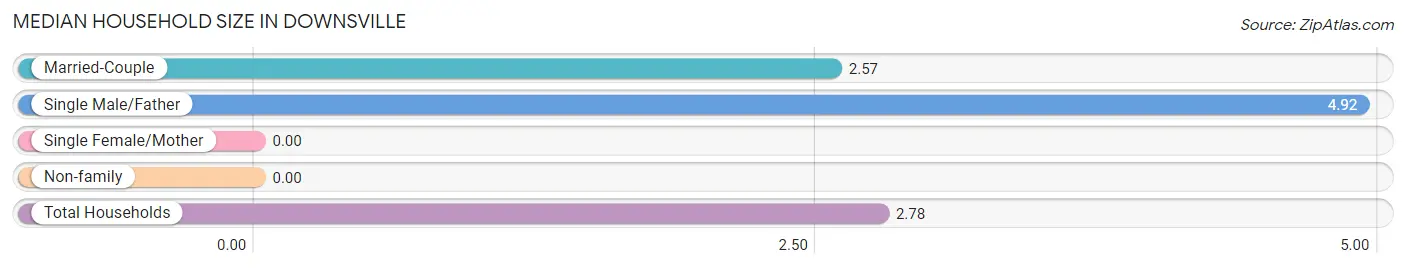
Median Household Size in Downsville
| Household Type | # Households | Household Size |
| Married-Couple | 75 (22.7%) | 2.57 |
| Single Male/Father | 120 (36.4%) | 4.92 |
| Single Female/Mother | 0 (0.0%) | - |
| Non-family | 135 (40.9%) | - |
| Total Households | 330 (100.0%) | 2.78 |
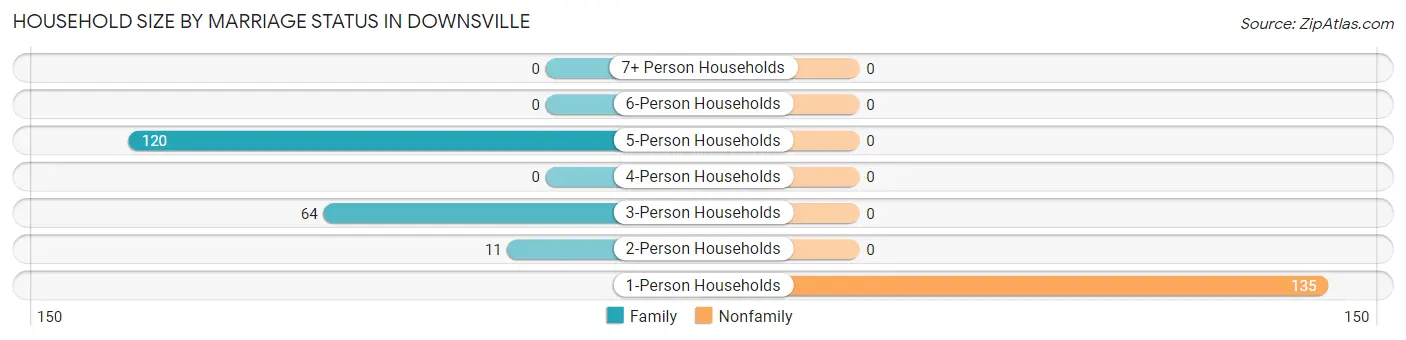
Household Size by Marriage Status in Downsville
Out of a total of 330 households in Downsville, 195 (59.1%) are family households, while 135 (40.9%) are nonfamily households. The most numerous type of family households are 5-person households, comprising 120, and the most common type of nonfamily households are 1-person households, comprising 135.
| Household Size | Family Households | Nonfamily Households |
| 1-Person Households | - | 135 (40.9%) |
| 2-Person Households | 11 (3.3%) | 0 (0.0%) |
| 3-Person Households | 64 (19.4%) | 0 (0.0%) |
| 4-Person Households | 0 (0.0%) | 0 (0.0%) |
| 5-Person Households | 120 (36.4%) | 0 (0.0%) |
| 6-Person Households | 0 (0.0%) | 0 (0.0%) |
| 7+ Person Households | 0 (0.0%) | 0 (0.0%) |
| Total | 195 (59.1%) | 135 (40.9%) |
Female Fertility in Downsville
Fertility by Age in Downsville
| Age Bracket | Women with Births | Births / 1,000 Women |
| 15 to 19 years | 0 (0.0%) | 0.0 |
| 20 to 34 years | 0 (0.0%) | 0.0 |
| 35 to 50 years | 0 (0.0%) | 0.0 |
| Total | 0 (0.0%) | 0.0 |
Fertility by Age by Marriage Status in Downsville
| Age Bracket | Married | Unmarried |
| 15 to 19 years | 0 (0.0%) | 0 (0.0%) |
| 20 to 34 years | 0 (0.0%) | 0 (0.0%) |
| 35 to 50 years | 0 (0.0%) | 0 (0.0%) |
| Total | 0 (0.0%) | 0 (0.0%) |
Fertility by Education in Downsville
| Educational Attainment | Women with Births | Births / 1,000 Women |
| Less than High School | 0 (0.0%) | 0.0 |
| High School Diploma | 0 (0.0%) | 0.0 |
| College or Associate's Degree | 0 (0.0%) | 0.0 |
| Bachelor's Degree | 0 (0.0%) | 0.0 |
| Graduate Degree | 0 (0.0%) | 0.0 |
| Total | 0 (0.0%) | 0.0 |
Fertility by Education by Marriage Status in Downsville
| Educational Attainment | Married | Unmarried |
| Less than High School | 0 (0.0%) | 0 (0.0%) |
| High School Diploma | 0 (0.0%) | 0 (0.0%) |
| College or Associate's Degree | 0 (0.0%) | 0 (0.0%) |
| Bachelor's Degree | 0 (0.0%) | 0 (0.0%) |
| Graduate Degree | 0 (0.0%) | 0 (0.0%) |
| Total | 0 (0.0%) | 0 (0.0%) |
Employment Characteristics in Downsville
Employment by Class of Employer in Downsville
Among the 692 employed individuals in Downsville, private company employees (634 | 91.6%), and local government employees (58 | 8.4%) make up the most common classes of employment.
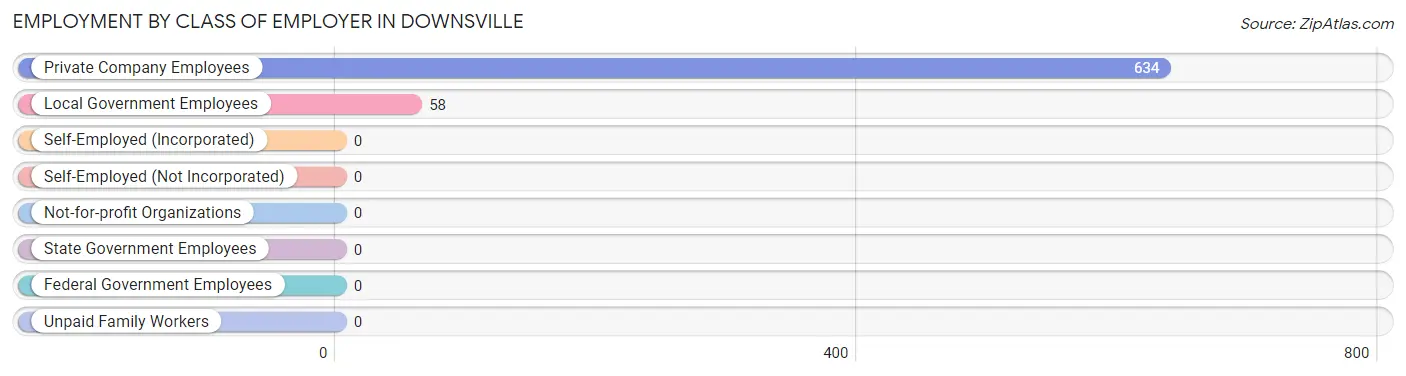
| Employer Class | # Employees | % Employees |
| Private Company Employees | 634 | 91.6% |
| Self-Employed (Incorporated) | 0 | 0.0% |
| Self-Employed (Not Incorporated) | 0 | 0.0% |
| Not-for-profit Organizations | 0 | 0.0% |
| Local Government Employees | 58 | 8.4% |
| State Government Employees | 0 | 0.0% |
| Federal Government Employees | 0 | 0.0% |
| Unpaid Family Workers | 0 | 0.0% |
| Total | 692 | 100.0% |
Employment Status by Age in Downsville
According to the labor force statistics for Downsville, out of the total population over 16 years of age (918), 81.8% or 751 individuals are in the labor force, with 7.9% or 59 of them unemployed. The age group with the highest labor force participation rate is 16 to 19 years, with 100.0% or 212 individuals in the labor force. Within the labor force, the 25 to 29 years age range has the highest percentage of unemployed individuals, with 50.4% or 59 of them being unemployed.
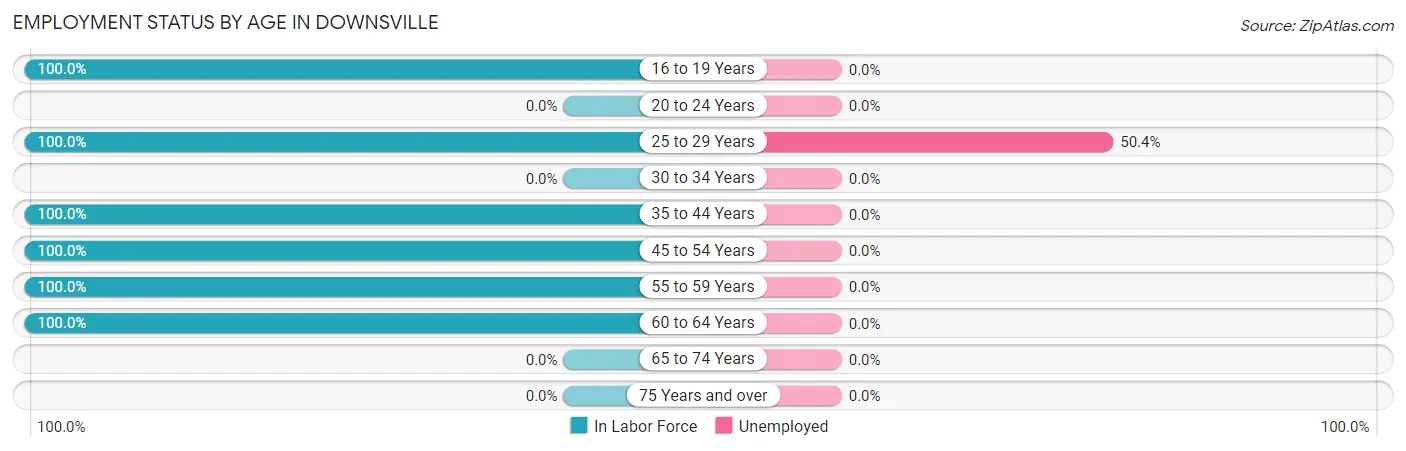
| Age Bracket | In Labor Force | Unemployed |
| 16 to 19 Years | 212 (100.0%) | 0 (0.0%) |
| 20 to 24 Years | 0 (0.0%) | 0 (0.0%) |
| 25 to 29 Years | 117 (100.0%) | 59 (50.4%) |
| 30 to 34 Years | 0 (0.0%) | 0 (0.0%) |
| 35 to 44 Years | 224 (100.0%) | 0 (0.0%) |
| 45 to 54 Years | 127 (100.0%) | 0 (0.0%) |
| 55 to 59 Years | 11 (100.0%) | 0 (0.0%) |
| 60 to 64 Years | 60 (100.0%) | 0 (0.0%) |
| 65 to 74 Years | 0 (0.0%) | 0 (0.0%) |
| 75 Years and over | 0 (0.0%) | 0 (0.0%) |
| Total | 751 (81.8%) | 59 (7.9%) |
Employment Status by Educational Attainment in Downsville
According to labor force statistics for Downsville, 100.0% of individuals (539) out of the total population between 25 and 64 years of age (539) are in the labor force, with 10.9% or 59 of them being unemployed. The group with the highest labor force participation rate are those with the educational attainment of high school diploma, with 100.0% or 301 individuals in the labor force. Within the labor force, individuals with high school diploma education have the highest percentage of unemployment, with 19.6% or 59 of them being unemployed.
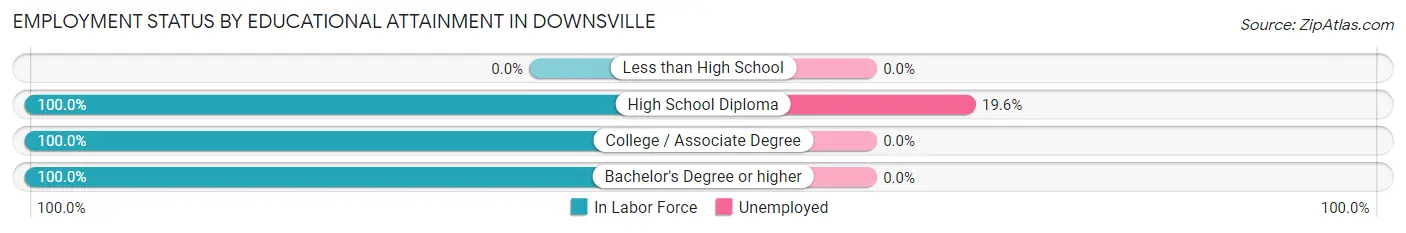
| Educational Attainment | In Labor Force | Unemployed |
| Less than High School | 0 (0.0%) | 0 (0.0%) |
| High School Diploma | 301 (100.0%) | 59 (19.6%) |
| College / Associate Degree | 180 (100.0%) | 0 (0.0%) |
| Bachelor's Degree or higher | 58 (100.0%) | 0 (0.0%) |
| Total | 539 (100.0%) | 59 (10.9%) |
Employment Occupations by Sex in Downsville
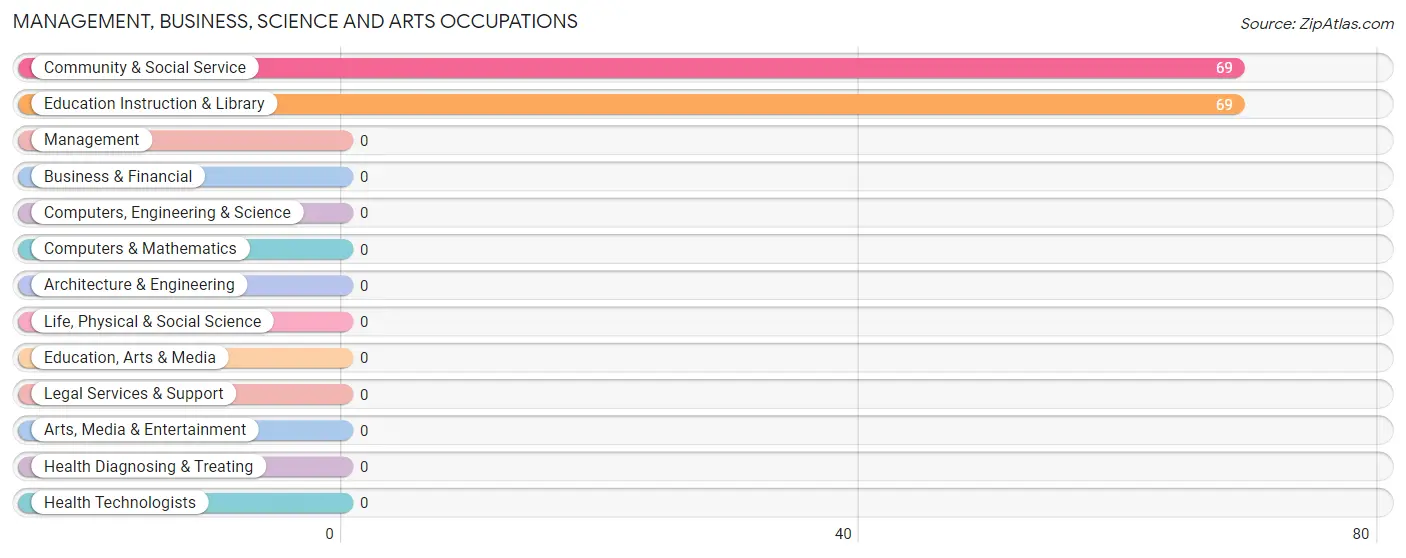
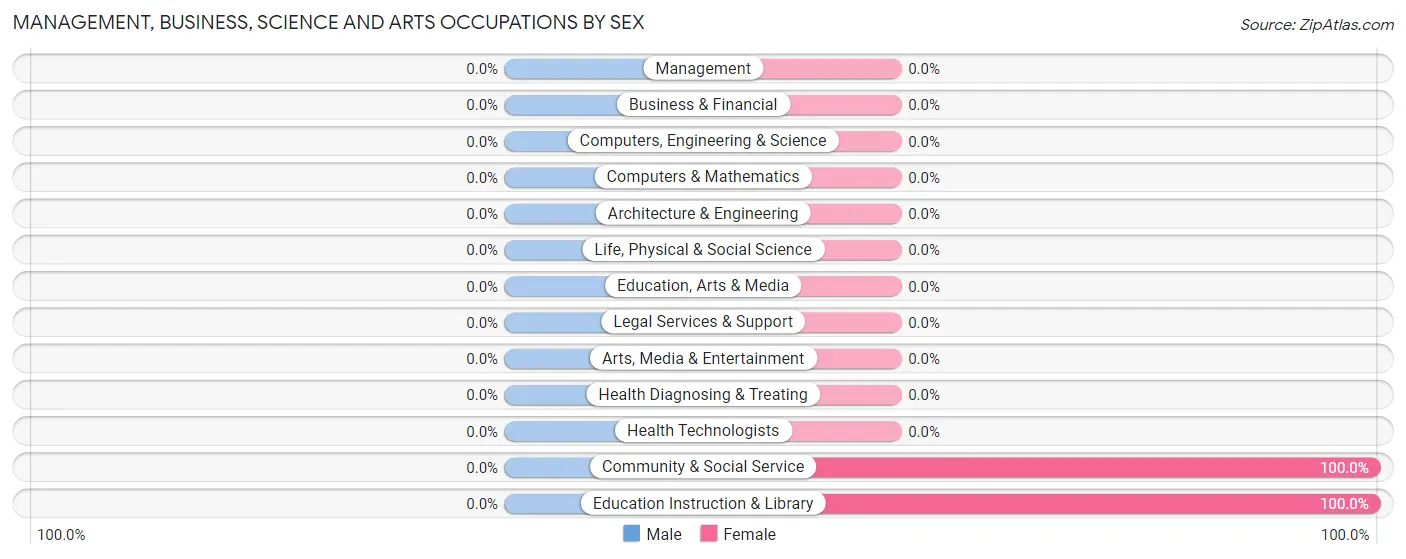
Management, Business, Science and Arts Occupations
The most common Management, Business, Science and Arts occupations in Downsville are Community & Social Service (69 | 10.0%), and Education Instruction & Library (69 | 10.0%).
Management, Business, Science and Arts Occupations by Sex
| Occupation | Male | Female |
| Management | 0 (0.0%) | 0 (0.0%) |
| Business & Financial | 0 (0.0%) | 0 (0.0%) |
| Computers, Engineering & Science | 0 (0.0%) | 0 (0.0%) |
| Computers & Mathematics | 0 (0.0%) | 0 (0.0%) |
| Architecture & Engineering | 0 (0.0%) | 0 (0.0%) |
| Life, Physical & Social Science | 0 (0.0%) | 0 (0.0%) |
| Community & Social Service | 0 (0.0%) | 69 (100.0%) |
| Education, Arts & Media | 0 (0.0%) | 0 (0.0%) |
| Legal Services & Support | 0 (0.0%) | 0 (0.0%) |
| Education Instruction & Library | 0 (0.0%) | 69 (100.0%) |
| Arts, Media & Entertainment | 0 (0.0%) | 0 (0.0%) |
| Health Diagnosing & Treating | 0 (0.0%) | 0 (0.0%) |
| Health Technologists | 0 (0.0%) | 0 (0.0%) |
| Total (Category) | 0 (0.0%) | 69 (100.0%) |
| Total (Overall) | 400 (57.8%) | 292 (42.2%) |
Services Occupations
The most common Services occupations in Downsville are Food Preparation & Serving (142 | 20.5%), and Personal Care & Service (70 | 10.1%).
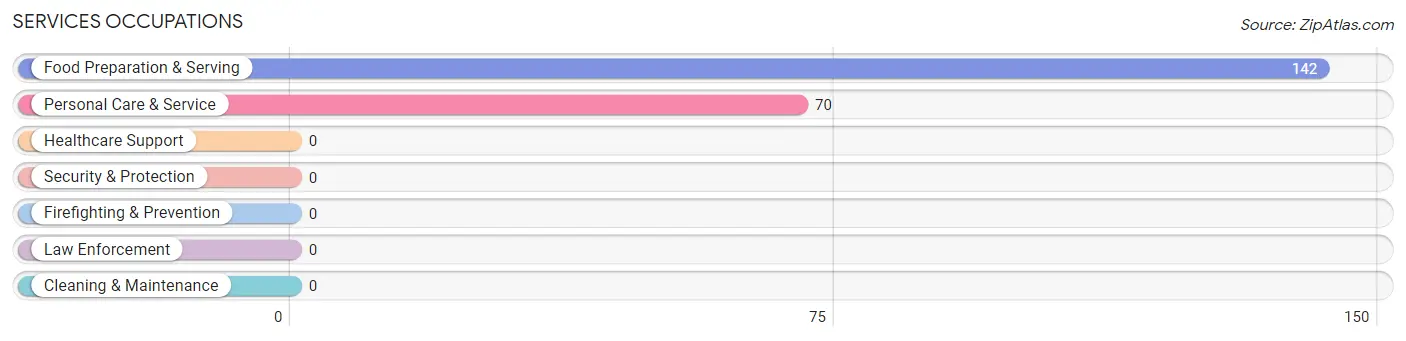
Services Occupations by Sex
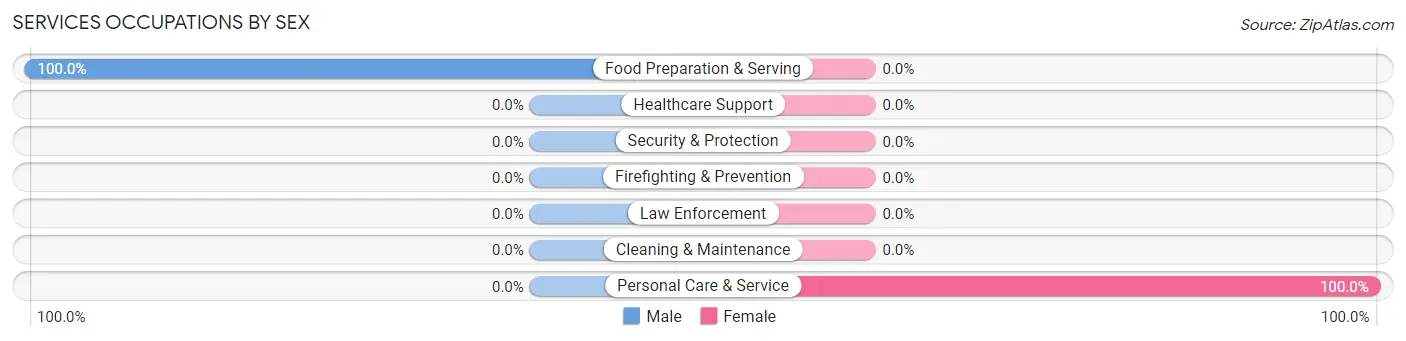
| Occupation | Male | Female |
| Healthcare Support | 0 (0.0%) | 0 (0.0%) |
| Security & Protection | 0 (0.0%) | 0 (0.0%) |
| Firefighting & Prevention | 0 (0.0%) | 0 (0.0%) |
| Law Enforcement | 0 (0.0%) | 0 (0.0%) |
| Food Preparation & Serving | 142 (100.0%) | 0 (0.0%) |
| Cleaning & Maintenance | 0 (0.0%) | 0 (0.0%) |
| Personal Care & Service | 0 (0.0%) | 70 (100.0%) |
| Total (Category) | 142 (67.0%) | 70 (33.0%) |
| Total (Overall) | 400 (57.8%) | 292 (42.2%) |
Sales and Office Occupations
The most common Sales and Office occupations in Downsville are Sales & Related (168 | 24.3%), and Office & Administration (49 | 7.1%).
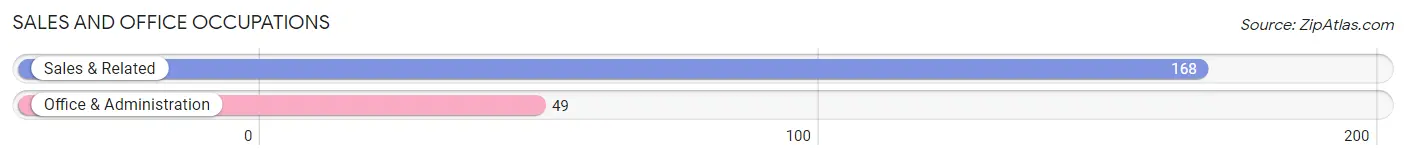
Sales and Office Occupations by Sex
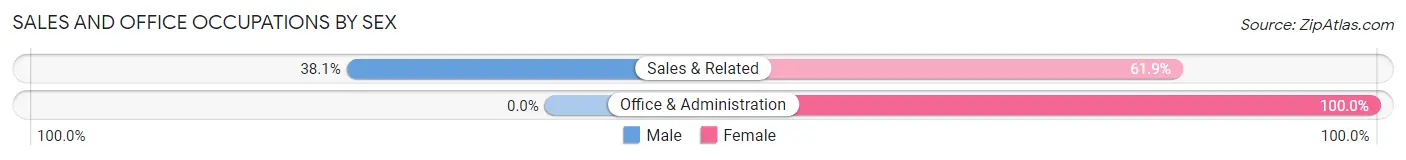
| Occupation | Male | Female |
| Sales & Related | 64 (38.1%) | 104 (61.9%) |
| Office & Administration | 0 (0.0%) | 49 (100.0%) |
| Total (Category) | 64 (29.5%) | 153 (70.5%) |
| Total (Overall) | 400 (57.8%) | 292 (42.2%) |
Natural Resources, Construction and Maintenance Occupations
The most common Natural Resources, Construction and Maintenance occupations in Downsville are , and Construction & Extraction (131 | 18.9%).
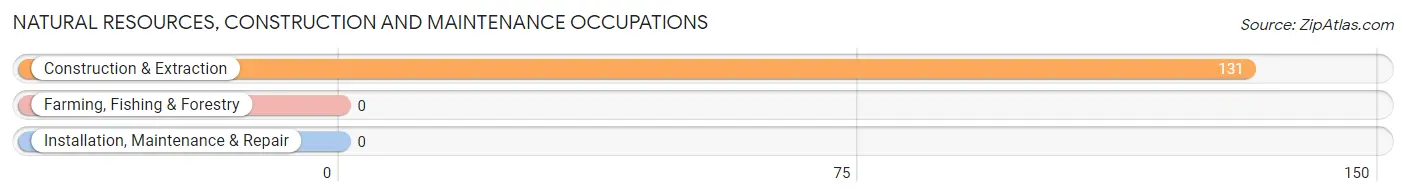
Natural Resources, Construction and Maintenance Occupations by Sex
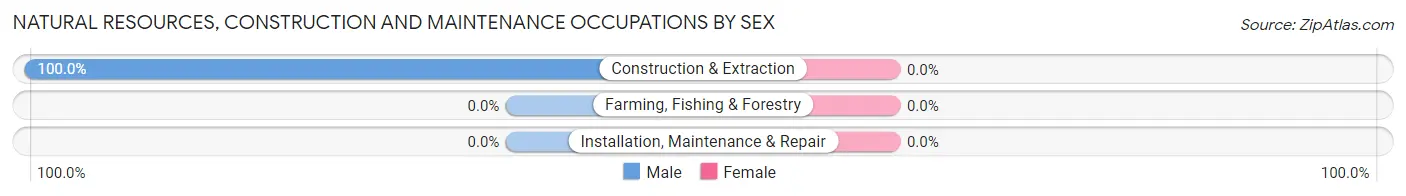
| Occupation | Male | Female |
| Farming, Fishing & Forestry | 0 (0.0%) | 0 (0.0%) |
| Construction & Extraction | 131 (100.0%) | 0 (0.0%) |
| Installation, Maintenance & Repair | 0 (0.0%) | 0 (0.0%) |
| Total (Category) | 131 (100.0%) | 0 (0.0%) |
| Total (Overall) | 400 (57.8%) | 292 (42.2%) |
Production, Transportation and Moving Occupations
The most common Production, Transportation and Moving occupations in Downsville are , and Material Moving (63 | 9.1%).
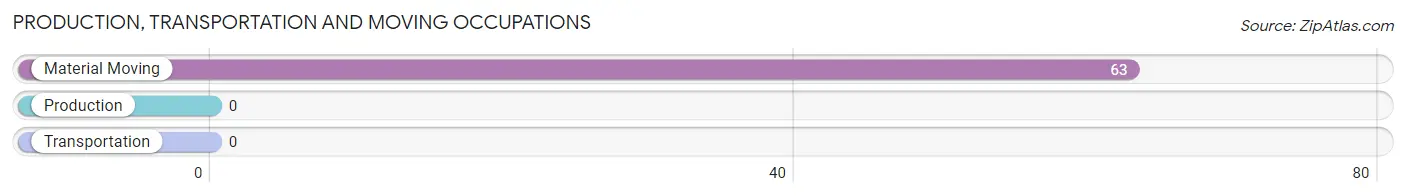
Production, Transportation and Moving Occupations by Sex
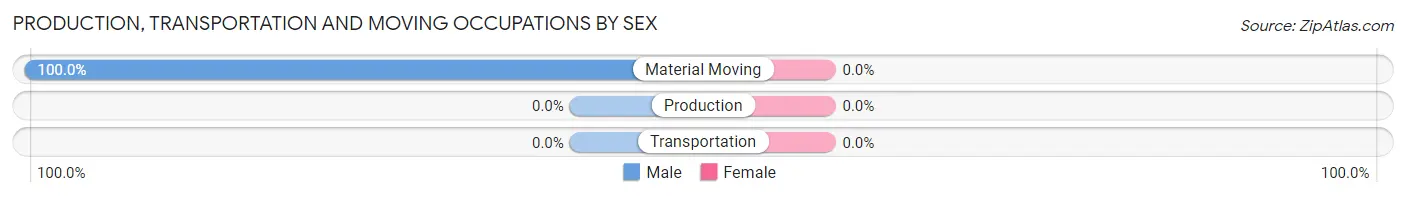
| Occupation | Male | Female |
| Production | 0 (0.0%) | 0 (0.0%) |
| Transportation | 0 (0.0%) | 0 (0.0%) |
| Material Moving | 63 (100.0%) | 0 (0.0%) |
| Total (Category) | 63 (100.0%) | 0 (0.0%) |
| Total (Overall) | 400 (57.8%) | 292 (42.2%) |
Employment Industries by Sex in Downsville
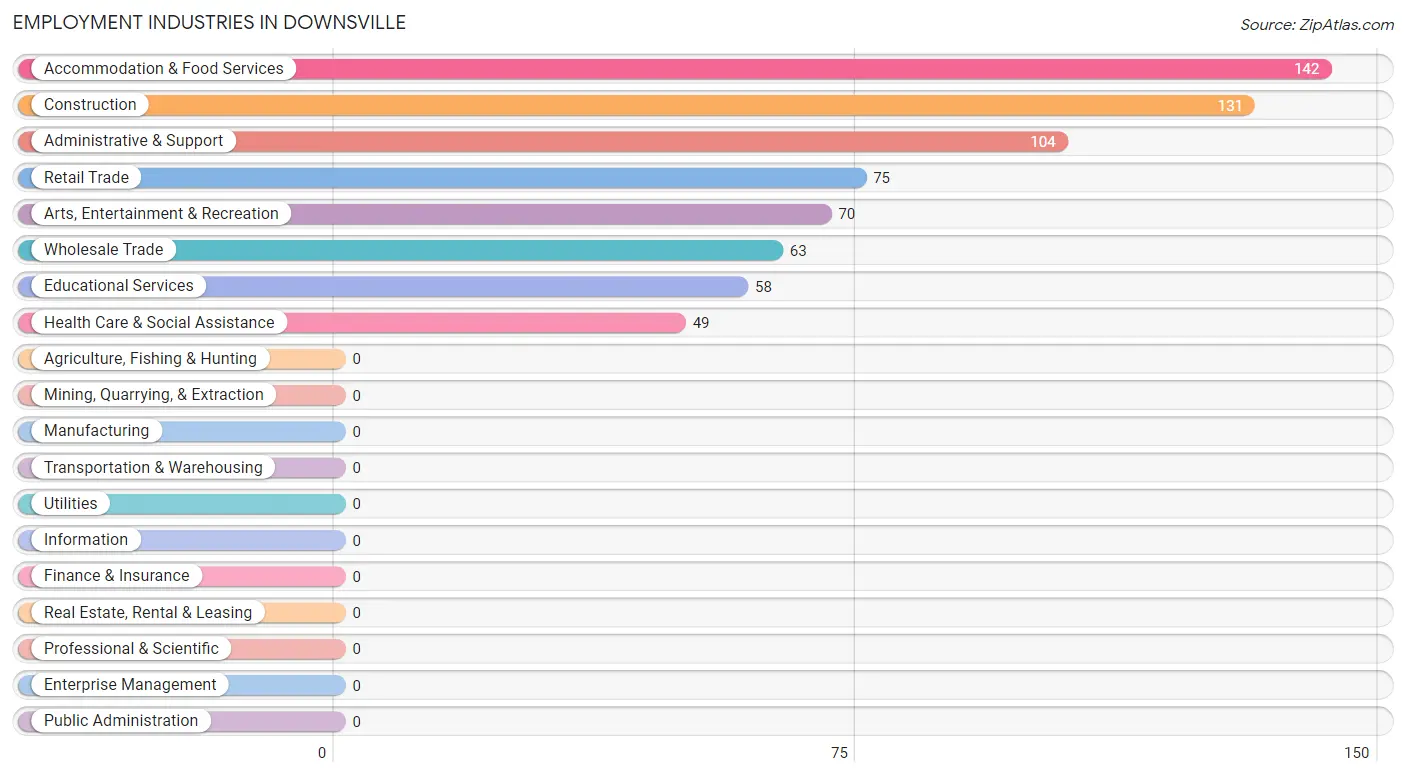
Employment Industries in Downsville
The major employment industries in Downsville include Accommodation & Food Services (142 | 20.5%), Construction (131 | 18.9%), Administrative & Support (104 | 15.0%), Retail Trade (75 | 10.8%), and Arts, Entertainment & Recreation (70 | 10.1%).
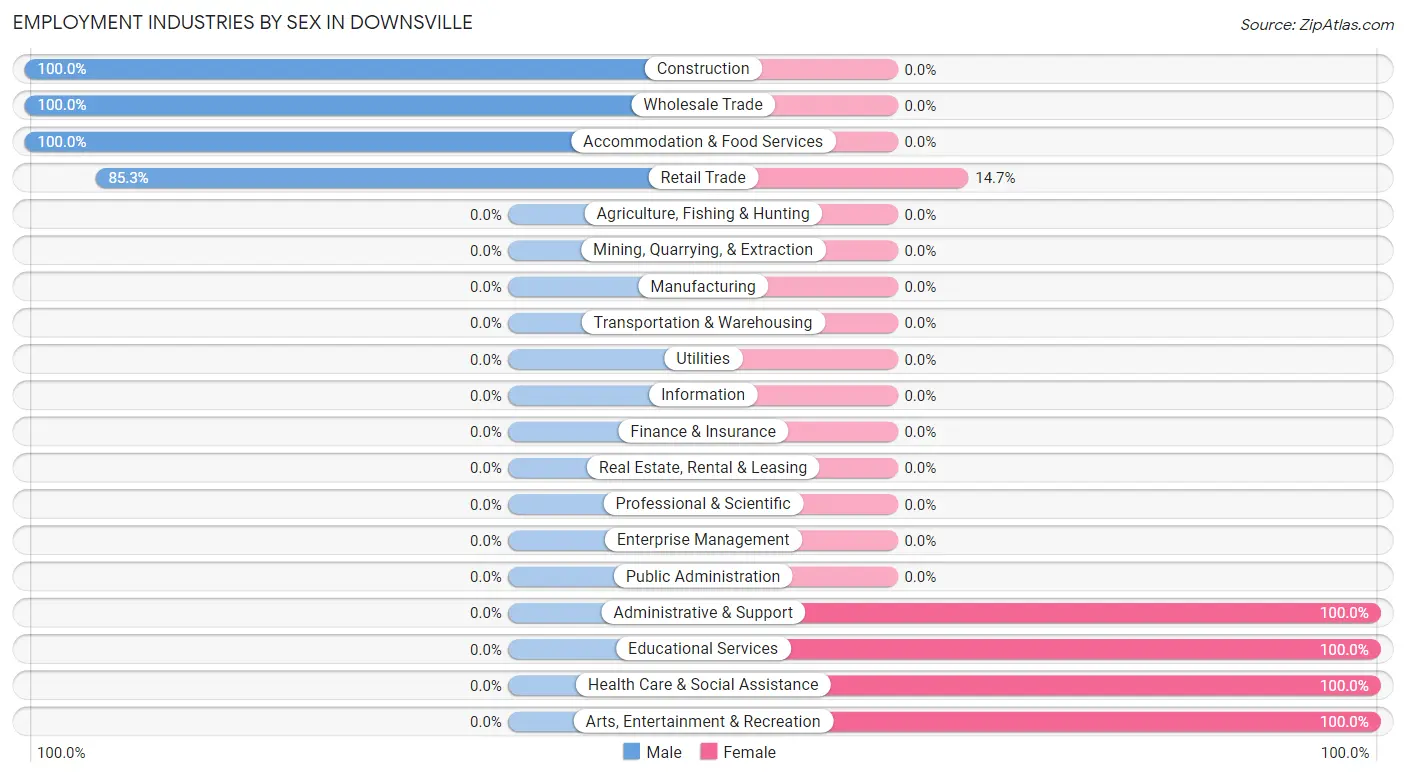
Employment Industries by Sex in Downsville
The Downsville industries that see more men than women are Construction (100.0%), Wholesale Trade (100.0%), and Accommodation & Food Services (100.0%), whereas the industries that tend to have a higher number of women are Administrative & Support (100.0%), Educational Services (100.0%), and Health Care & Social Assistance (100.0%).
| Industry | Male | Female |
| Agriculture, Fishing & Hunting | 0 (0.0%) | 0 (0.0%) |
| Mining, Quarrying, & Extraction | 0 (0.0%) | 0 (0.0%) |
| Construction | 131 (100.0%) | 0 (0.0%) |
| Manufacturing | 0 (0.0%) | 0 (0.0%) |
| Wholesale Trade | 63 (100.0%) | 0 (0.0%) |
| Retail Trade | 64 (85.3%) | 11 (14.7%) |
| Transportation & Warehousing | 0 (0.0%) | 0 (0.0%) |
| Utilities | 0 (0.0%) | 0 (0.0%) |
| Information | 0 (0.0%) | 0 (0.0%) |
| Finance & Insurance | 0 (0.0%) | 0 (0.0%) |
| Real Estate, Rental & Leasing | 0 (0.0%) | 0 (0.0%) |
| Professional & Scientific | 0 (0.0%) | 0 (0.0%) |
| Enterprise Management | 0 (0.0%) | 0 (0.0%) |
| Administrative & Support | 0 (0.0%) | 104 (100.0%) |
| Educational Services | 0 (0.0%) | 58 (100.0%) |
| Health Care & Social Assistance | 0 (0.0%) | 49 (100.0%) |
| Arts, Entertainment & Recreation | 0 (0.0%) | 70 (100.0%) |
| Accommodation & Food Services | 142 (100.0%) | 0 (0.0%) |
| Public Administration | 0 (0.0%) | 0 (0.0%) |
| Total | 400 (57.8%) | 292 (42.2%) |
Education in Downsville
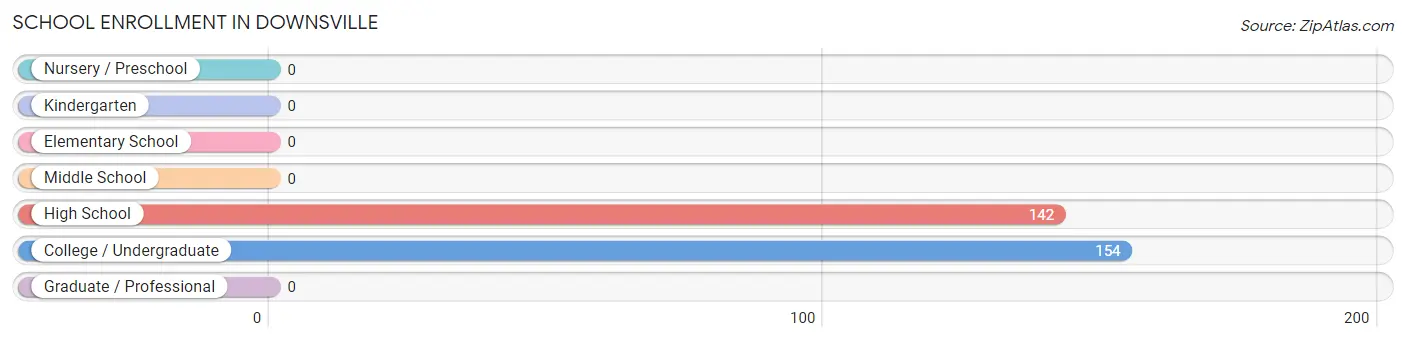
School Enrollment in Downsville
The most common levels of schooling among the 296 students in Downsville are college / undergraduate (154 | 52.0%), and high school (142 | 48.0%).
| School Level | # Students | % Students |
| Nursery / Preschool | 0 | 0.0% |
| Kindergarten | 0 | 0.0% |
| Elementary School | 0 | 0.0% |
| Middle School | 0 | 0.0% |
| High School | 142 | 48.0% |
| College / Undergraduate | 154 | 52.0% |
| Graduate / Professional | 0 | 0.0% |
| Total | 296 | 100.0% |
School Enrollment by Age by Funding Source in Downsville
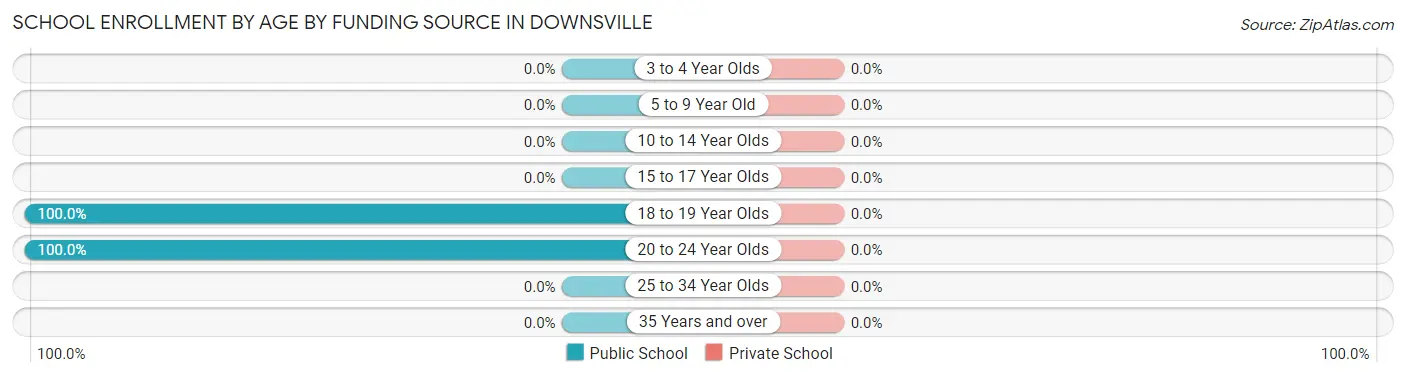
| Age Bracket | Public School | Private School |
| 3 to 4 Year Olds | 0 (0.0%) | 0 (0.0%) |
| 5 to 9 Year Old | 0 (0.0%) | 0 (0.0%) |
| 10 to 14 Year Olds | 0 (0.0%) | 0 (0.0%) |
| 15 to 17 Year Olds | 0 (0.0%) | 0 (0.0%) |
| 18 to 19 Year Olds | 142 (100.0%) | 0 (0.0%) |
| 20 to 24 Year Olds | 154 (100.0%) | 0 (0.0%) |
| 25 to 34 Year Olds | 0 (0.0%) | 0 (0.0%) |
| 35 Years and over | 0 (0.0%) | 0 (0.0%) |
| Total | 296 (100.0%) | 0 (0.0%) |
Educational Attainment by Field of Study in Downsville
, and education (58 | 100.0%) are the most common fields of study among 58 individuals in Downsville who have obtained a bachelor's degree or higher.
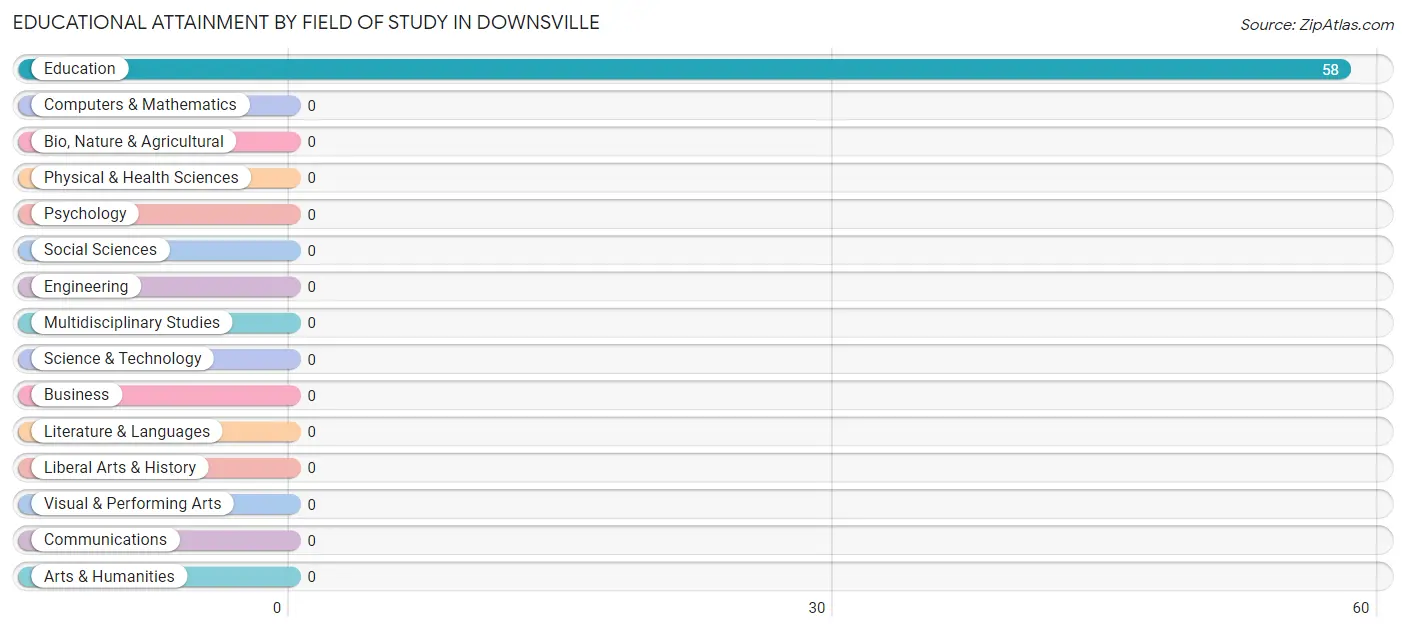
| Field of Study | # Graduates | % Graduates |
| Computers & Mathematics | 0 | 0.0% |
| Bio, Nature & Agricultural | 0 | 0.0% |
| Physical & Health Sciences | 0 | 0.0% |
| Psychology | 0 | 0.0% |
| Social Sciences | 0 | 0.0% |
| Engineering | 0 | 0.0% |
| Multidisciplinary Studies | 0 | 0.0% |
| Science & Technology | 0 | 0.0% |
| Business | 0 | 0.0% |
| Education | 58 | 100.0% |
| Literature & Languages | 0 | 0.0% |
| Liberal Arts & History | 0 | 0.0% |
| Visual & Performing Arts | 0 | 0.0% |
| Communications | 0 | 0.0% |
| Arts & Humanities | 0 | 0.0% |
| Total | 58 | 100.0% |
Transportation & Commute in Downsville
Vehicle Availability by Sex in Downsville
The most prevalent vehicle ownership categories in Downsville are males with 5 or more vehicles (262, accounting for 65.5%) and females with 5 or more vehicles (174, making up 89.7%).
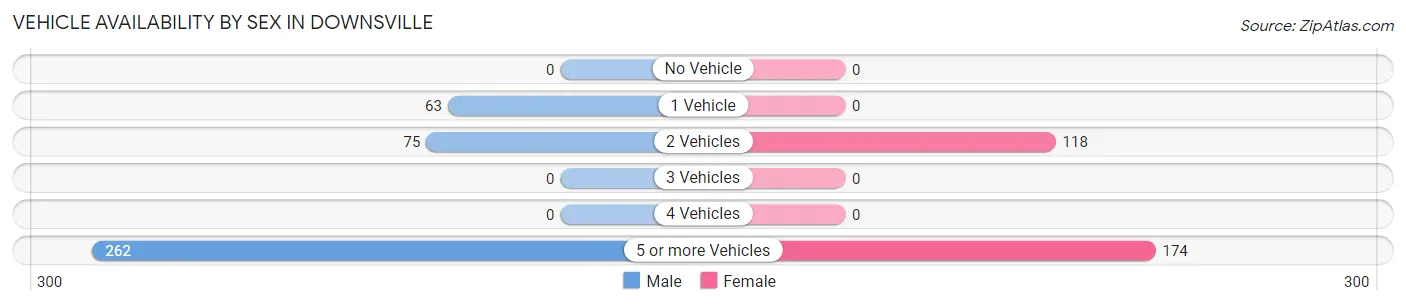
| Vehicles Available | Male | Female |
| No Vehicle | 0 (0.0%) | 0 (0.0%) |
| 1 Vehicle | 63 (15.8%) | 0 (0.0%) |
| 2 Vehicles | 75 (18.8%) | 118 (40.4%) |
| 3 Vehicles | 0 (0.0%) | 0 (0.0%) |
| 4 Vehicles | 0 (0.0%) | 0 (0.0%) |
| 5 or more Vehicles | 262 (65.5%) | 174 (59.6%) |
| Total | 400 (100.0%) | 292 (100.0%) |
Commute Time in Downsville
The most frequently occuring commute durations in Downsville are 10 to 14 minutes (325 commuters, 47.0%), 30 to 34 minutes (183 commuters, 26.5%), and 45 to 59 minutes (104 commuters, 15.0%).
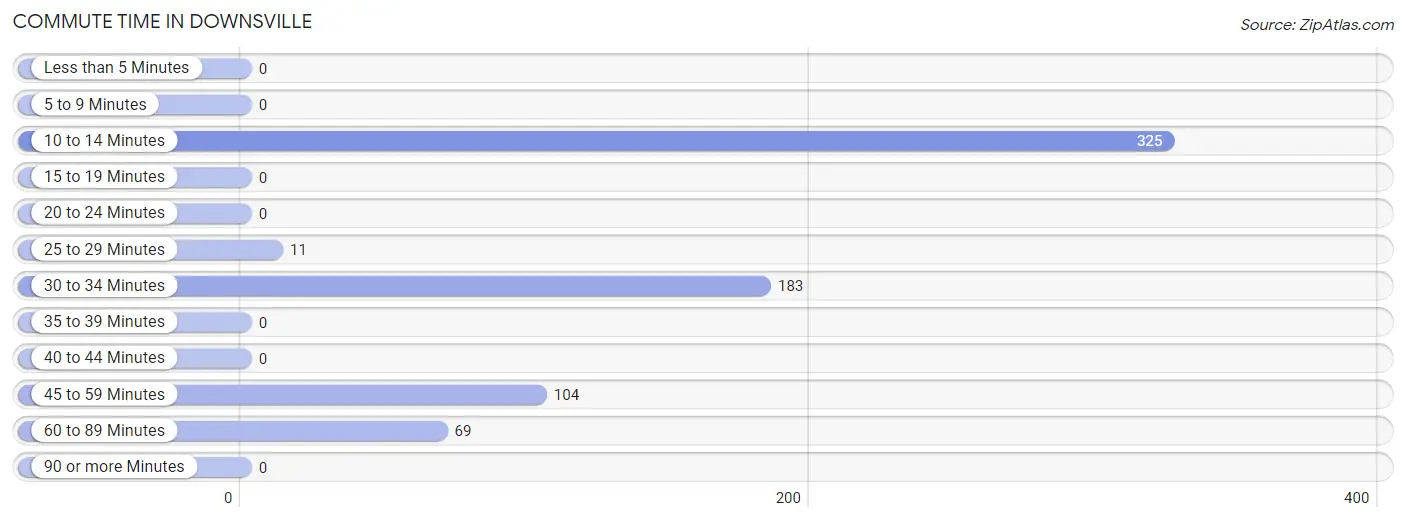
| Commute Time | # Commuters | % Commuters |
| Less than 5 Minutes | 0 | 0.0% |
| 5 to 9 Minutes | 0 | 0.0% |
| 10 to 14 Minutes | 325 | 47.0% |
| 15 to 19 Minutes | 0 | 0.0% |
| 20 to 24 Minutes | 0 | 0.0% |
| 25 to 29 Minutes | 11 | 1.6% |
| 30 to 34 Minutes | 183 | 26.5% |
| 35 to 39 Minutes | 0 | 0.0% |
| 40 to 44 Minutes | 0 | 0.0% |
| 45 to 59 Minutes | 104 | 15.0% |
| 60 to 89 Minutes | 69 | 10.0% |
| 90 or more Minutes | 0 | 0.0% |
Commute Time by Sex in Downsville
The most common commute times in Downsville are 10 to 14 minutes (325 commuters, 81.2%) for males and 30 to 34 minutes (119 commuters, 40.7%) for females.
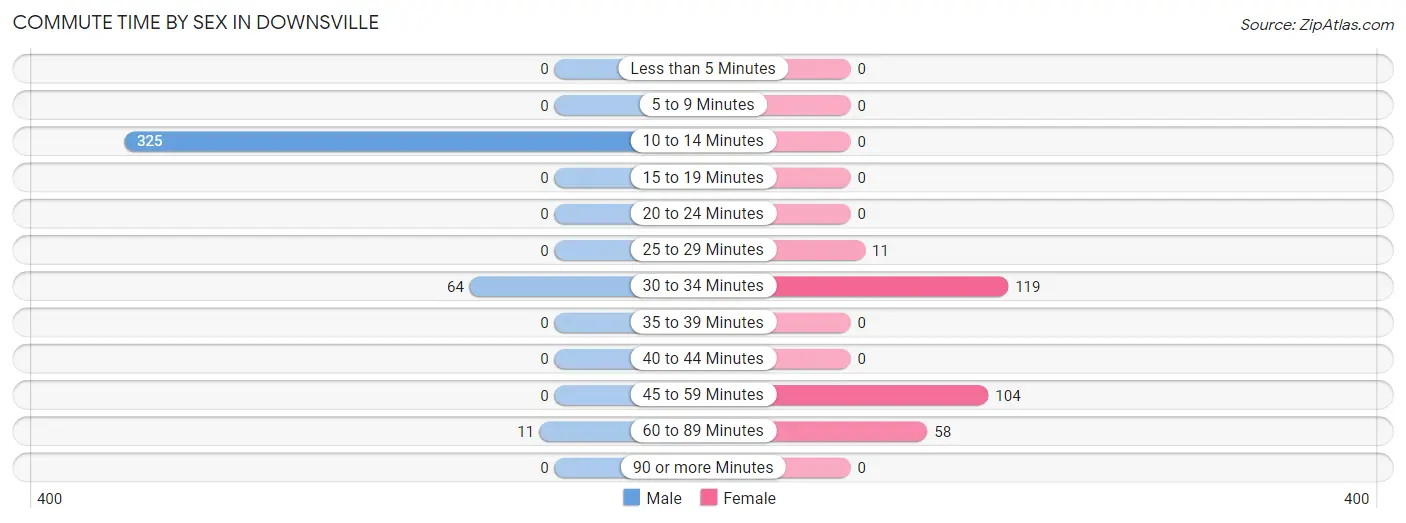
| Commute Time | Male | Female |
| Less than 5 Minutes | 0 (0.0%) | 0 (0.0%) |
| 5 to 9 Minutes | 0 (0.0%) | 0 (0.0%) |
| 10 to 14 Minutes | 325 (81.2%) | 0 (0.0%) |
| 15 to 19 Minutes | 0 (0.0%) | 0 (0.0%) |
| 20 to 24 Minutes | 0 (0.0%) | 0 (0.0%) |
| 25 to 29 Minutes | 0 (0.0%) | 11 (3.8%) |
| 30 to 34 Minutes | 64 (16.0%) | 119 (40.7%) |
| 35 to 39 Minutes | 0 (0.0%) | 0 (0.0%) |
| 40 to 44 Minutes | 0 (0.0%) | 0 (0.0%) |
| 45 to 59 Minutes | 0 (0.0%) | 104 (35.6%) |
| 60 to 89 Minutes | 11 (2.8%) | 58 (19.9%) |
| 90 or more Minutes | 0 (0.0%) | 0 (0.0%) |
Time of Departure to Work by Sex in Downsville
The most frequent times of departure to work in Downsville are 4:00 PM to 11:59 PM (269, 67.2%) for males and 7:00 AM to 7:29 AM (185, 63.4%) for females.
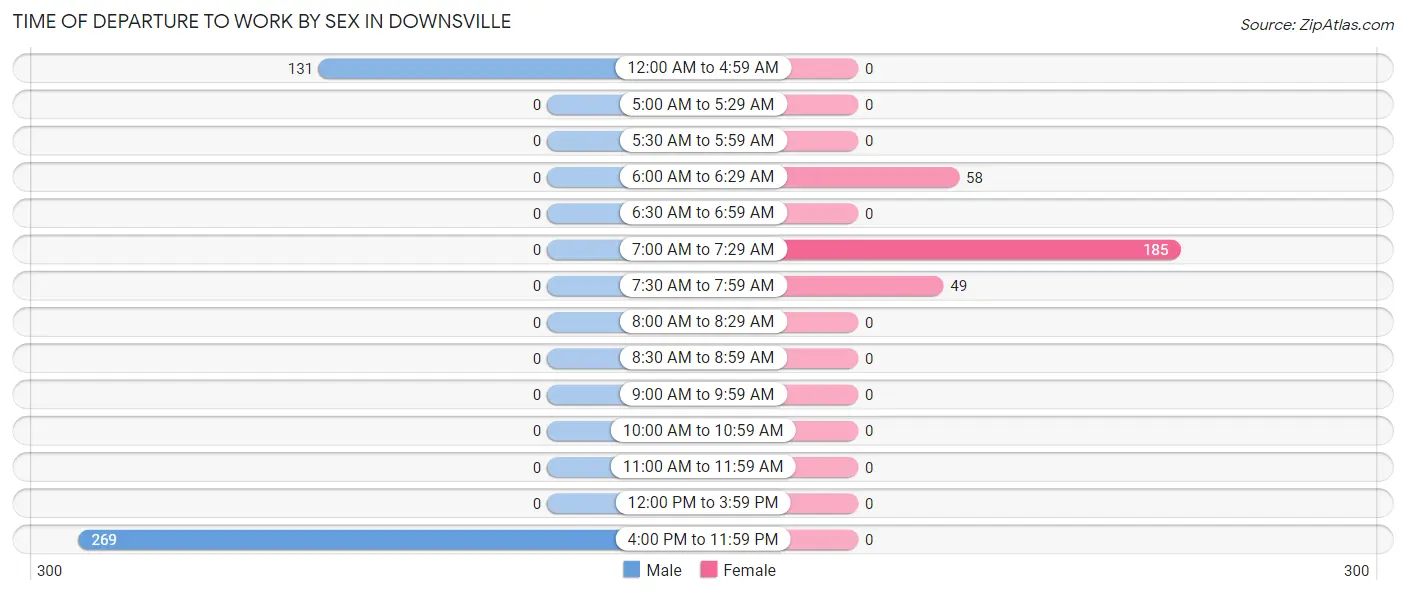
| Time of Departure | Male | Female |
| 12:00 AM to 4:59 AM | 131 (32.8%) | 0 (0.0%) |
| 5:00 AM to 5:29 AM | 0 (0.0%) | 0 (0.0%) |
| 5:30 AM to 5:59 AM | 0 (0.0%) | 0 (0.0%) |
| 6:00 AM to 6:29 AM | 0 (0.0%) | 58 (19.9%) |
| 6:30 AM to 6:59 AM | 0 (0.0%) | 0 (0.0%) |
| 7:00 AM to 7:29 AM | 0 (0.0%) | 185 (63.4%) |
| 7:30 AM to 7:59 AM | 0 (0.0%) | 49 (16.8%) |
| 8:00 AM to 8:29 AM | 0 (0.0%) | 0 (0.0%) |
| 8:30 AM to 8:59 AM | 0 (0.0%) | 0 (0.0%) |
| 9:00 AM to 9:59 AM | 0 (0.0%) | 0 (0.0%) |
| 10:00 AM to 10:59 AM | 0 (0.0%) | 0 (0.0%) |
| 11:00 AM to 11:59 AM | 0 (0.0%) | 0 (0.0%) |
| 12:00 PM to 3:59 PM | 0 (0.0%) | 0 (0.0%) |
| 4:00 PM to 11:59 PM | 269 (67.2%) | 0 (0.0%) |
| Total | 400 (100.0%) | 292 (100.0%) |
Housing Occupancy in Downsville
Occupancy by Ownership in Downsville
Of the total 330 dwellings in Downsville, owner-occupied units account for 144 (43.6%), while renter-occupied units make up 186 (56.4%).
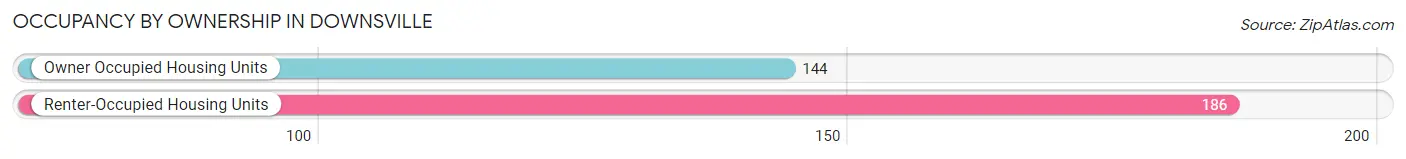
| Occupancy | # Housing Units | % Housing Units |
| Owner Occupied Housing Units | 144 | 43.6% |
| Renter-Occupied Housing Units | 186 | 56.4% |
| Total Occupied Housing Units | 330 | 100.0% |
Occupancy by Household Size in Downsville
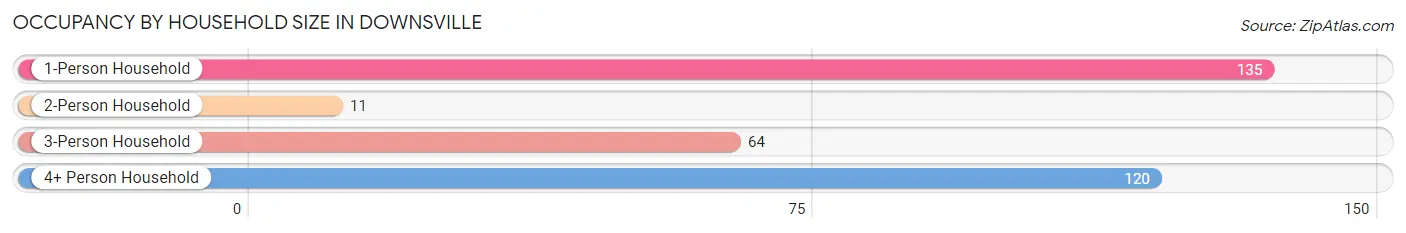
| Household Size | # Housing Units | % Housing Units |
| 1-Person Household | 135 | 40.9% |
| 2-Person Household | 11 | 3.3% |
| 3-Person Household | 64 | 19.4% |
| 4+ Person Household | 120 | 36.4% |
| Total Housing Units | 330 | 100.0% |
Occupancy by Ownership by Household Size in Downsville
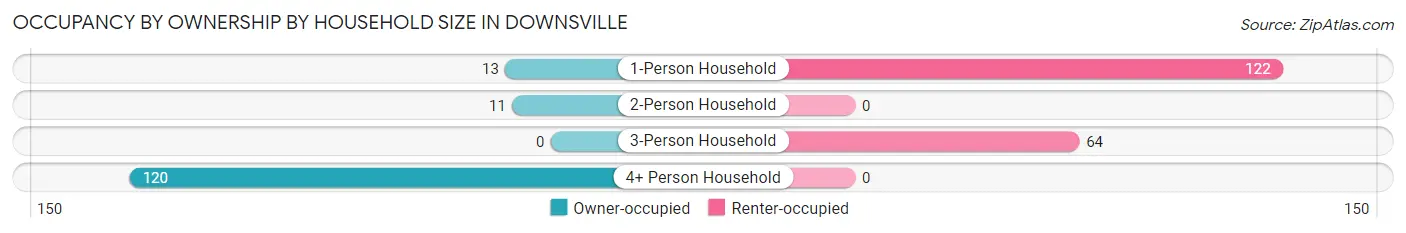
| Household Size | Owner-occupied | Renter-occupied |
| 1-Person Household | 13 (9.6%) | 122 (90.4%) |
| 2-Person Household | 11 (100.0%) | 0 (0.0%) |
| 3-Person Household | 0 (0.0%) | 64 (100.0%) |
| 4+ Person Household | 120 (100.0%) | 0 (0.0%) |
| Total Housing Units | 144 (43.6%) | 186 (56.4%) |
Occupancy by Educational Attainment in Downsville
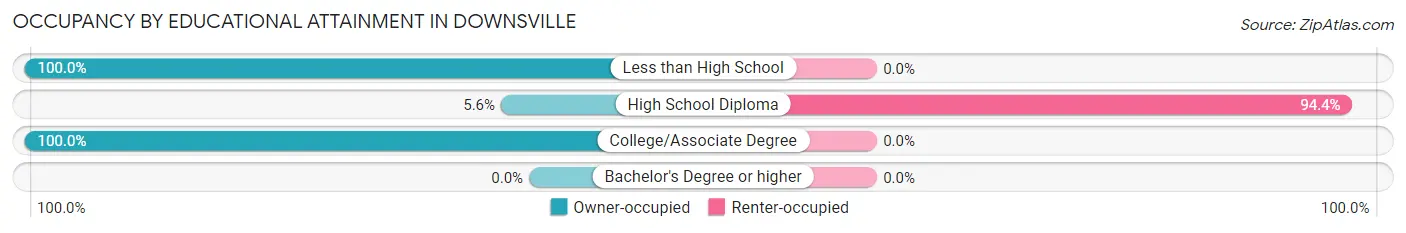
| Household Size | Owner-occupied | Renter-occupied |
| Less than High School | 13 (100.0%) | 0 (0.0%) |
| High School Diploma | 11 (5.6%) | 186 (94.4%) |
| College/Associate Degree | 120 (100.0%) | 0 (0.0%) |
| Bachelor's Degree or higher | 0 (0.0%) | 0 (0.0%) |
Occupancy by Age of Householder in Downsville
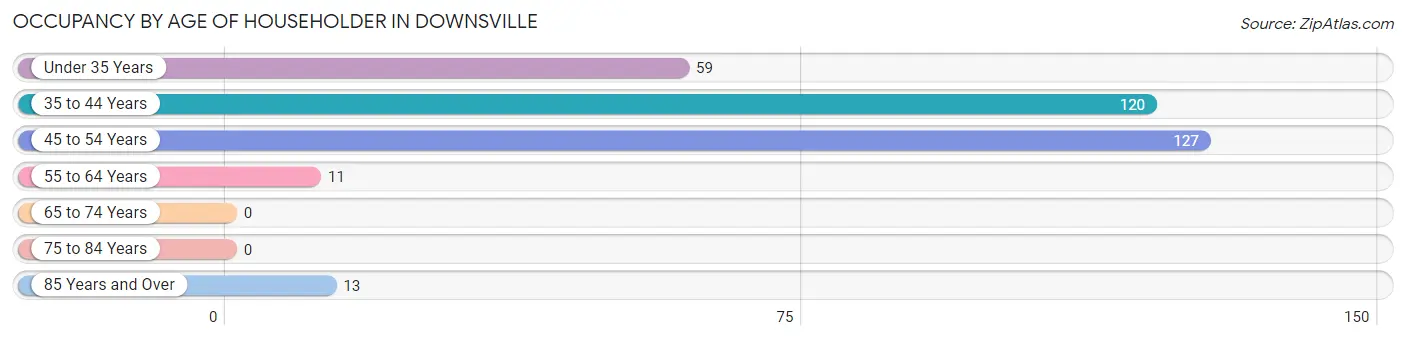
| Age Bracket | # Households | % Households |
| Under 35 Years | 59 | 17.9% |
| 35 to 44 Years | 120 | 36.4% |
| 45 to 54 Years | 127 | 38.5% |
| 55 to 64 Years | 11 | 3.3% |
| 65 to 74 Years | 0 | 0.0% |
| 75 to 84 Years | 0 | 0.0% |
| 85 Years and Over | 13 | 3.9% |
| Total | 330 | 100.0% |
Housing Finances in Downsville
Median Income by Occupancy in Downsville
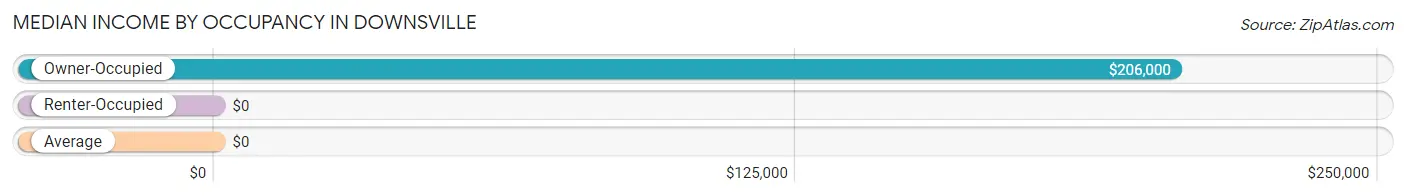
| Occupancy Type | # Households | Median Income |
| Owner-Occupied | 144 (43.6%) | $206,000 |
| Renter-Occupied | 186 (56.4%) | $0 |
| Average | 330 (100.0%) | $0 |
Occupancy by Householder Income Bracket in Downsville
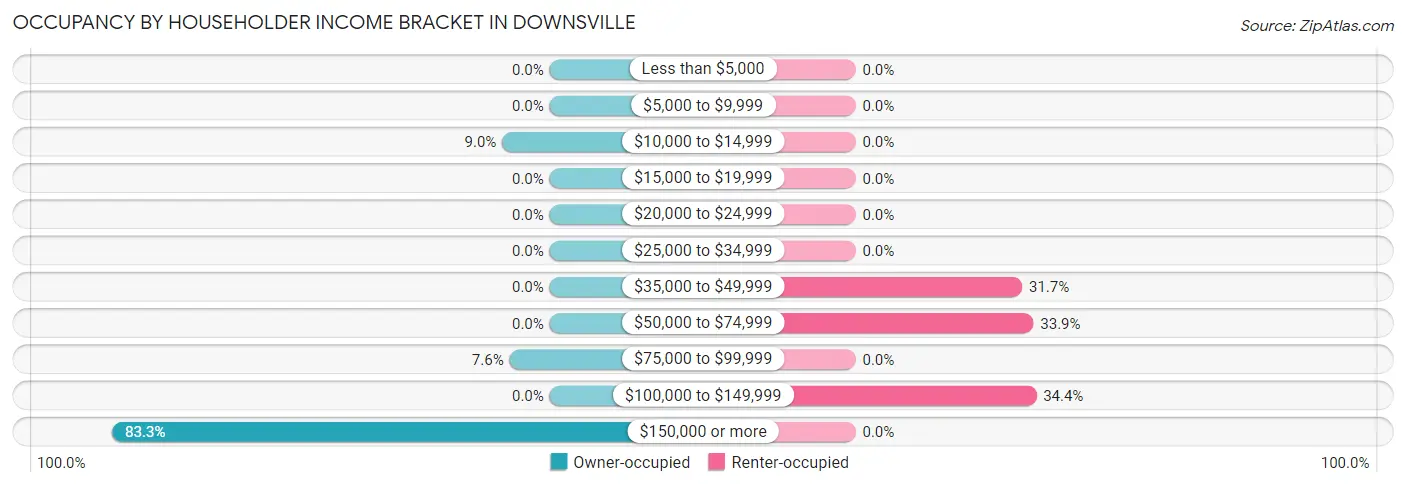
| Income Bracket | Owner-occupied | Renter-occupied |
| Less than $5,000 | 0 (0.0%) | 0 (0.0%) |
| $5,000 to $9,999 | 0 (0.0%) | 0 (0.0%) |
| $10,000 to $14,999 | 13 (9.0%) | 0 (0.0%) |
| $15,000 to $19,999 | 0 (0.0%) | 0 (0.0%) |
| $20,000 to $24,999 | 0 (0.0%) | 0 (0.0%) |
| $25,000 to $34,999 | 0 (0.0%) | 0 (0.0%) |
| $35,000 to $49,999 | 0 (0.0%) | 59 (31.7%) |
| $50,000 to $74,999 | 0 (0.0%) | 63 (33.9%) |
| $75,000 to $99,999 | 11 (7.6%) | 0 (0.0%) |
| $100,000 to $149,999 | 0 (0.0%) | 64 (34.4%) |
| $150,000 or more | 120 (83.3%) | 0 (0.0%) |
| Total | 144 (100.0%) | 186 (100.0%) |
Monthly Housing Cost Tiers in Downsville
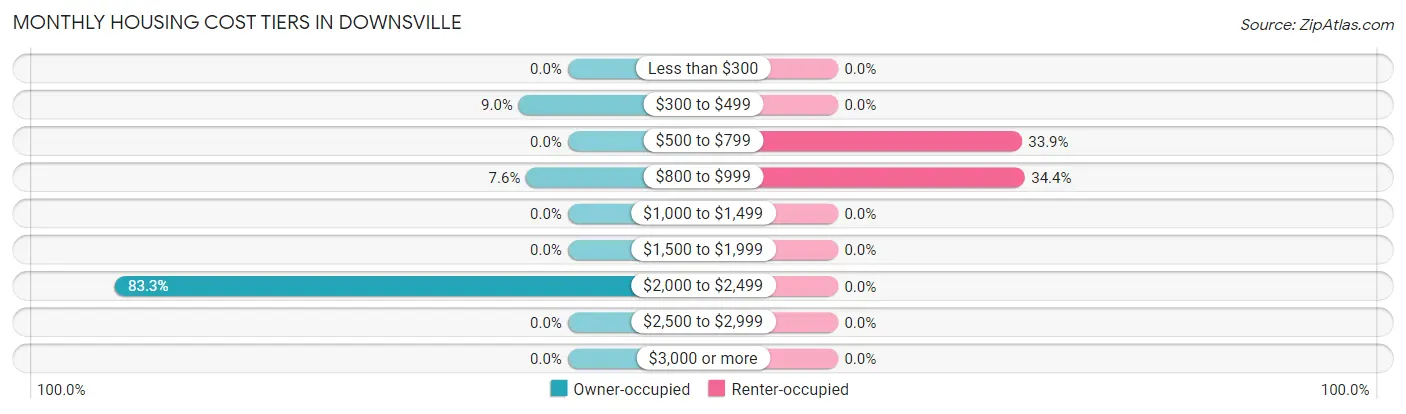
| Monthly Cost | Owner-occupied | Renter-occupied |
| Less than $300 | 0 (0.0%) | 0 (0.0%) |
| $300 to $499 | 13 (9.0%) | 0 (0.0%) |
| $500 to $799 | 0 (0.0%) | 63 (33.9%) |
| $800 to $999 | 11 (7.6%) | 64 (34.4%) |
| $1,000 to $1,499 | 0 (0.0%) | 0 (0.0%) |
| $1,500 to $1,999 | 0 (0.0%) | 0 (0.0%) |
| $2,000 to $2,499 | 120 (83.3%) | 0 (0.0%) |
| $2,500 to $2,999 | 0 (0.0%) | 0 (0.0%) |
| $3,000 or more | 0 (0.0%) | 0 (0.0%) |
| Total | 144 (100.0%) | 186 (100.0%) |
Physical Housing Characteristics in Downsville
Housing Structures in Downsville
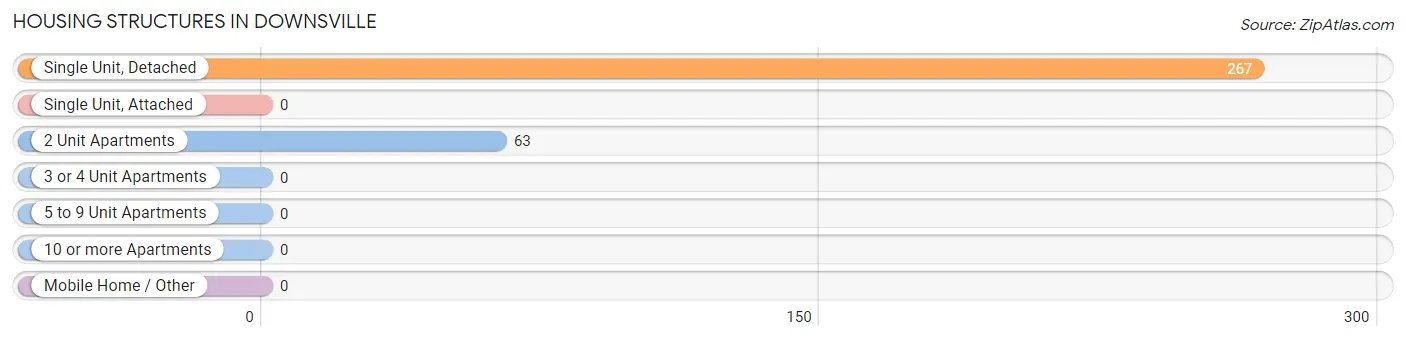
| Structure Type | # Housing Units | % Housing Units |
| Single Unit, Detached | 267 | 80.9% |
| Single Unit, Attached | 0 | 0.0% |
| 2 Unit Apartments | 63 | 19.1% |
| 3 or 4 Unit Apartments | 0 | 0.0% |
| 5 to 9 Unit Apartments | 0 | 0.0% |
| 10 or more Apartments | 0 | 0.0% |
| Mobile Home / Other | 0 | 0.0% |
| Total | 330 | 100.0% |
Housing Structures by Occupancy in Downsville
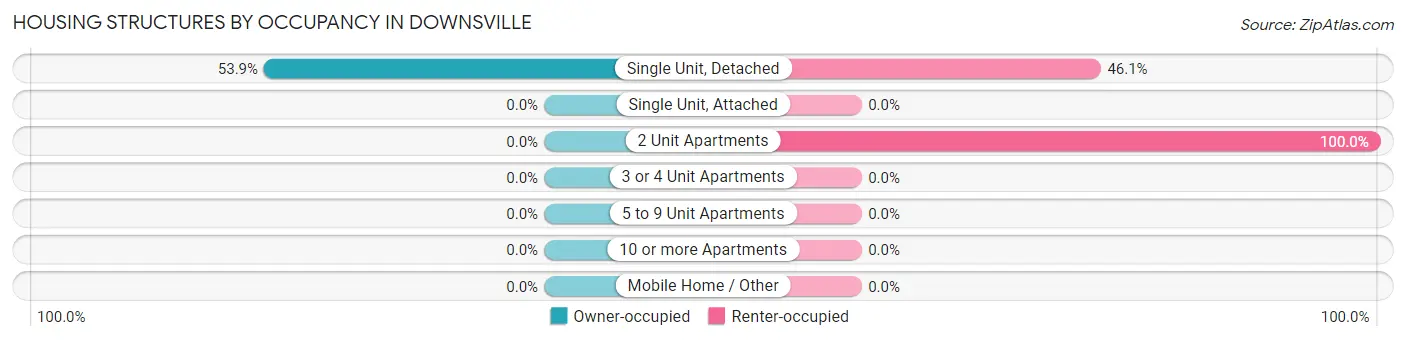
| Structure Type | Owner-occupied | Renter-occupied |
| Single Unit, Detached | 144 (53.9%) | 123 (46.1%) |
| Single Unit, Attached | 0 (0.0%) | 0 (0.0%) |
| 2 Unit Apartments | 0 (0.0%) | 63 (100.0%) |
| 3 or 4 Unit Apartments | 0 (0.0%) | 0 (0.0%) |
| 5 to 9 Unit Apartments | 0 (0.0%) | 0 (0.0%) |
| 10 or more Apartments | 0 (0.0%) | 0 (0.0%) |
| Mobile Home / Other | 0 (0.0%) | 0 (0.0%) |
| Total | 144 (43.6%) | 186 (56.4%) |
Housing Structures by Number of Rooms in Downsville
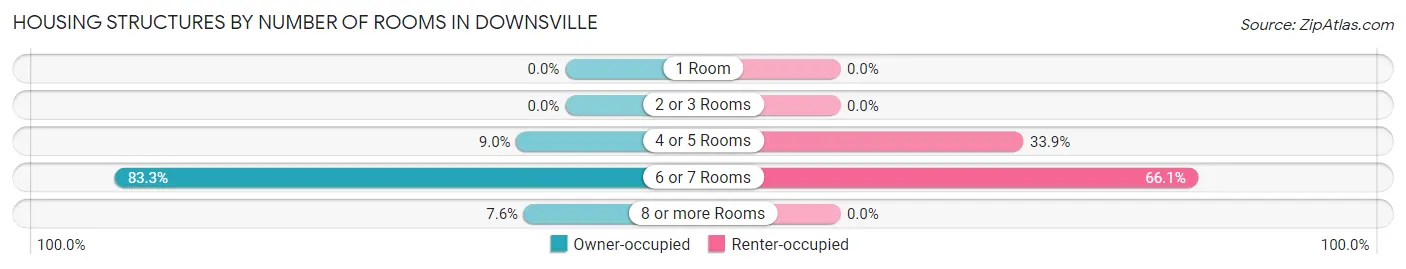
| Number of Rooms | Owner-occupied | Renter-occupied |
| 1 Room | 0 (0.0%) | 0 (0.0%) |
| 2 or 3 Rooms | 0 (0.0%) | 0 (0.0%) |
| 4 or 5 Rooms | 13 (9.0%) | 63 (33.9%) |
| 6 or 7 Rooms | 120 (83.3%) | 123 (66.1%) |
| 8 or more Rooms | 11 (7.6%) | 0 (0.0%) |
| Total | 144 (100.0%) | 186 (100.0%) |
Housing Structure by Heating Type in Downsville
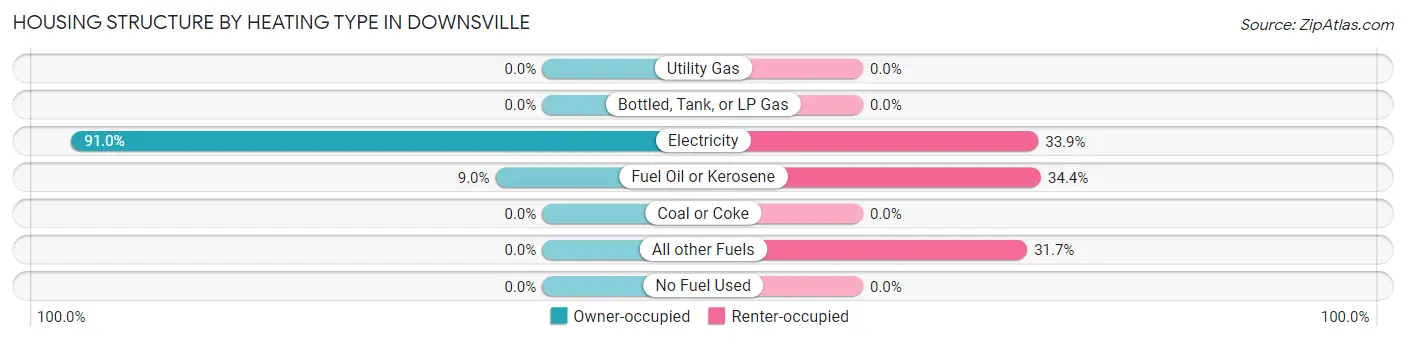
| Heating Type | Owner-occupied | Renter-occupied |
| Utility Gas | 0 (0.0%) | 0 (0.0%) |
| Bottled, Tank, or LP Gas | 0 (0.0%) | 0 (0.0%) |
| Electricity | 131 (91.0%) | 63 (33.9%) |
| Fuel Oil or Kerosene | 13 (9.0%) | 64 (34.4%) |
| Coal or Coke | 0 (0.0%) | 0 (0.0%) |
| All other Fuels | 0 (0.0%) | 59 (31.7%) |
| No Fuel Used | 0 (0.0%) | 0 (0.0%) |
| Total | 144 (100.0%) | 186 (100.0%) |
Household Vehicle Usage in Downsville
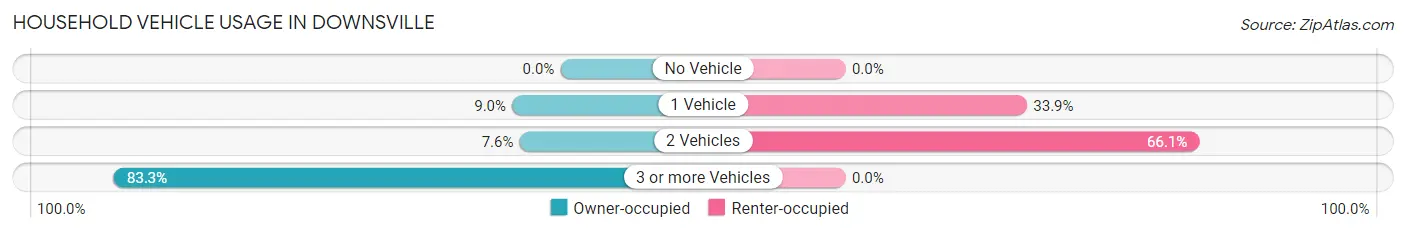
| Vehicles per Household | Owner-occupied | Renter-occupied |
| No Vehicle | 0 (0.0%) | 0 (0.0%) |
| 1 Vehicle | 13 (9.0%) | 63 (33.9%) |
| 2 Vehicles | 11 (7.6%) | 123 (66.1%) |
| 3 or more Vehicles | 120 (83.3%) | 0 (0.0%) |
| Total | 144 (100.0%) | 186 (100.0%) |
Real Estate & Mortgages in Downsville
Real Estate and Mortgage Overview in Downsville
| Characteristic | Without Mortgage | With Mortgage |
| Housing Units | 13 | 131 |
| Median Property Value | - | - |
| Median Household Income | - | - |
| Monthly Housing Costs | - | - |
| Real Estate Taxes | - | - |
Property Value by Mortgage Status in Downsville
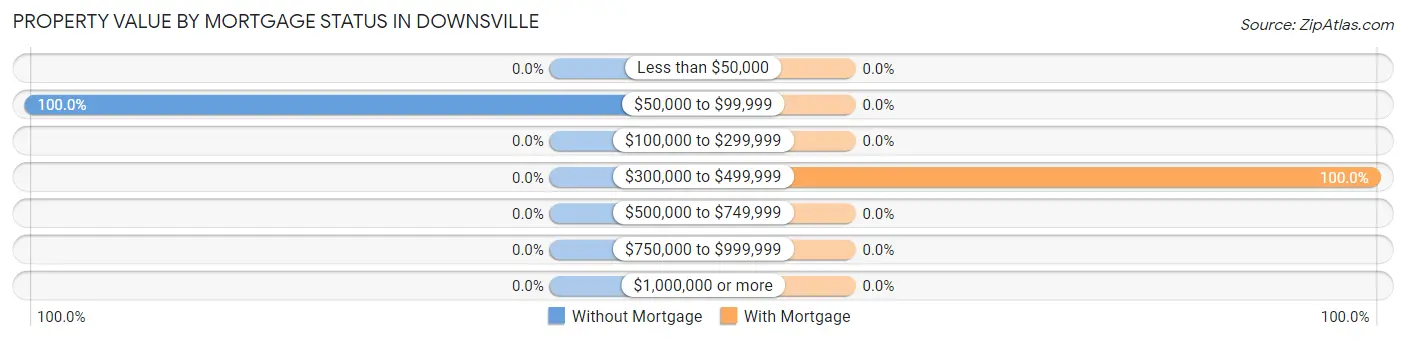
| Property Value | Without Mortgage | With Mortgage |
| Less than $50,000 | 0 (0.0%) | 0 (0.0%) |
| $50,000 to $99,999 | 13 (100.0%) | 0 (0.0%) |
| $100,000 to $299,999 | 0 (0.0%) | 0 (0.0%) |
| $300,000 to $499,999 | 0 (0.0%) | 131 (100.0%) |
| $500,000 to $749,999 | 0 (0.0%) | 0 (0.0%) |
| $750,000 to $999,999 | 0 (0.0%) | 0 (0.0%) |
| $1,000,000 or more | 0 (0.0%) | 0 (0.0%) |
| Total | 13 (100.0%) | 131 (100.0%) |
Household Income by Mortgage Status in Downsville
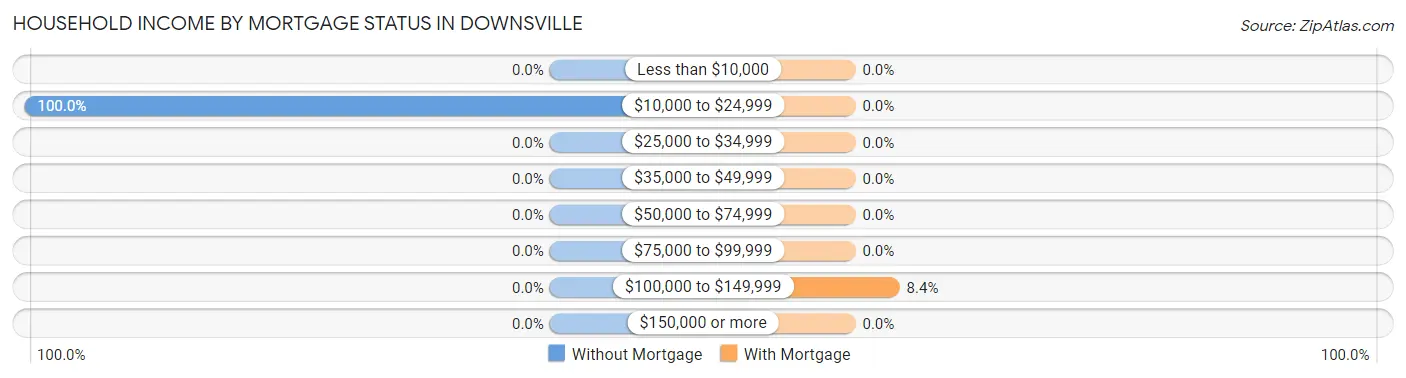
| Household Income | Without Mortgage | With Mortgage |
| Less than $10,000 | 0 (0.0%) | 0 (0.0%) |
| $10,000 to $24,999 | 13 (100.0%) | 0 (0.0%) |
| $25,000 to $34,999 | 0 (0.0%) | 0 (0.0%) |
| $35,000 to $49,999 | 0 (0.0%) | 0 (0.0%) |
| $50,000 to $74,999 | 0 (0.0%) | 0 (0.0%) |
| $75,000 to $99,999 | 0 (0.0%) | 0 (0.0%) |
| $100,000 to $149,999 | 0 (0.0%) | 11 (8.4%) |
| $150,000 or more | 0 (0.0%) | 0 (0.0%) |
| Total | 13 (100.0%) | 131 (100.0%) |
Property Value to Household Income Ratio in Downsville
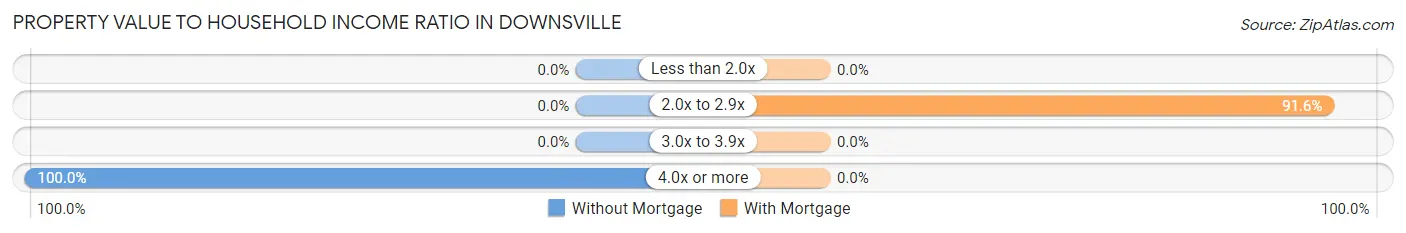
| Value-to-Income Ratio | Without Mortgage | With Mortgage |
| Less than 2.0x | 0 (0.0%) | 0 (0.0%) |
| 2.0x to 2.9x | 0 (0.0%) | 120 (91.6%) |
| 3.0x to 3.9x | 0 (0.0%) | 0 (0.0%) |
| 4.0x or more | 13 (100.0%) | 0 (0.0%) |
| Total | 13 (100.0%) | 131 (100.0%) |
Real Estate Taxes by Mortgage Status in Downsville
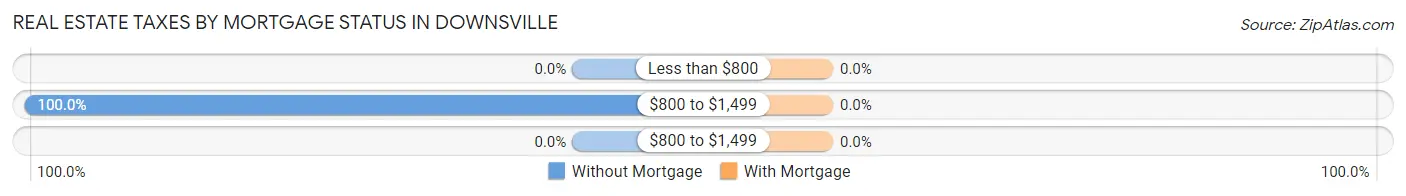
| Property Taxes | Without Mortgage | With Mortgage |
| Less than $800 | 0 (0.0%) | 0 (0.0%) |
| $800 to $1,499 | 13 (100.0%) | 0 (0.0%) |
| $800 to $1,499 | 0 (0.0%) | 0 (0.0%) |
| Total | 13 (100.0%) | 131 (100.0%) |
Health & Disability in Downsville
Health Insurance Coverage by Age in Downsville
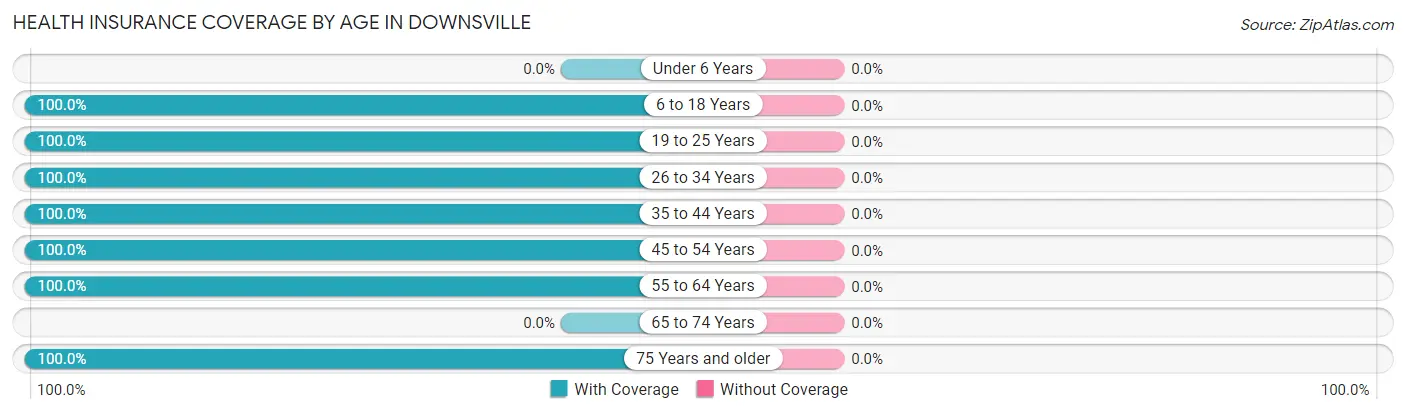
| Age Bracket | With Coverage | Without Coverage |
| Under 6 Years | 0 (0.0%) | 0 (0.0%) |
| 6 to 18 Years | 142 (100.0%) | 0 (0.0%) |
| 19 to 25 Years | 224 (100.0%) | 0 (0.0%) |
| 26 to 34 Years | 117 (100.0%) | 0 (0.0%) |
| 35 to 44 Years | 224 (100.0%) | 0 (0.0%) |
| 45 to 54 Years | 127 (100.0%) | 0 (0.0%) |
| 55 to 64 Years | 71 (100.0%) | 0 (0.0%) |
| 65 to 74 Years | 0 (0.0%) | 0 (0.0%) |
| 75 Years and older | 13 (100.0%) | 0 (0.0%) |
| Total | 918 (100.0%) | 0 (0.0%) |
Health Insurance Coverage by Citizenship Status in Downsville
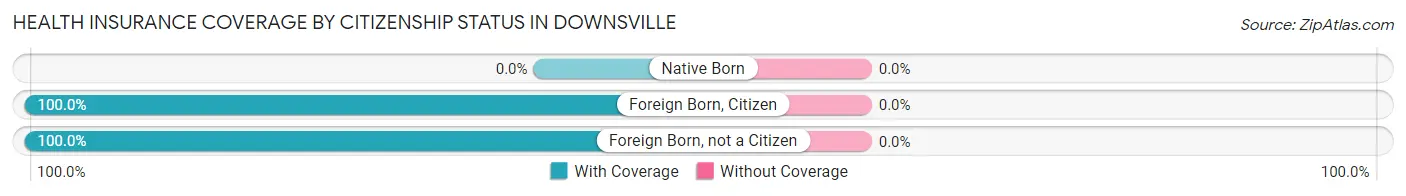
| Citizenship Status | With Coverage | Without Coverage |
| Native Born | 0 (0.0%) | 0 (0.0%) |
| Foreign Born, Citizen | 142 (100.0%) | 0 (0.0%) |
| Foreign Born, not a Citizen | 224 (100.0%) | 0 (0.0%) |
Health Insurance Coverage by Household Income in Downsville
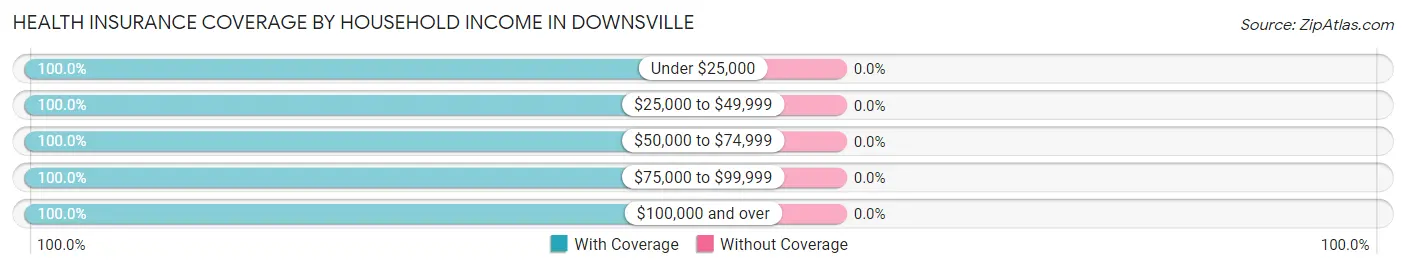
| Household Income | With Coverage | Without Coverage |
| Under $25,000 | 13 (100.0%) | 0 (0.0%) |
| $25,000 to $49,999 | 59 (100.0%) | 0 (0.0%) |
| $50,000 to $74,999 | 63 (100.0%) | 0 (0.0%) |
| $75,000 to $99,999 | 22 (100.0%) | 0 (0.0%) |
| $100,000 and over | 761 (100.0%) | 0 (0.0%) |
Public vs Private Health Insurance Coverage by Age in Downsville
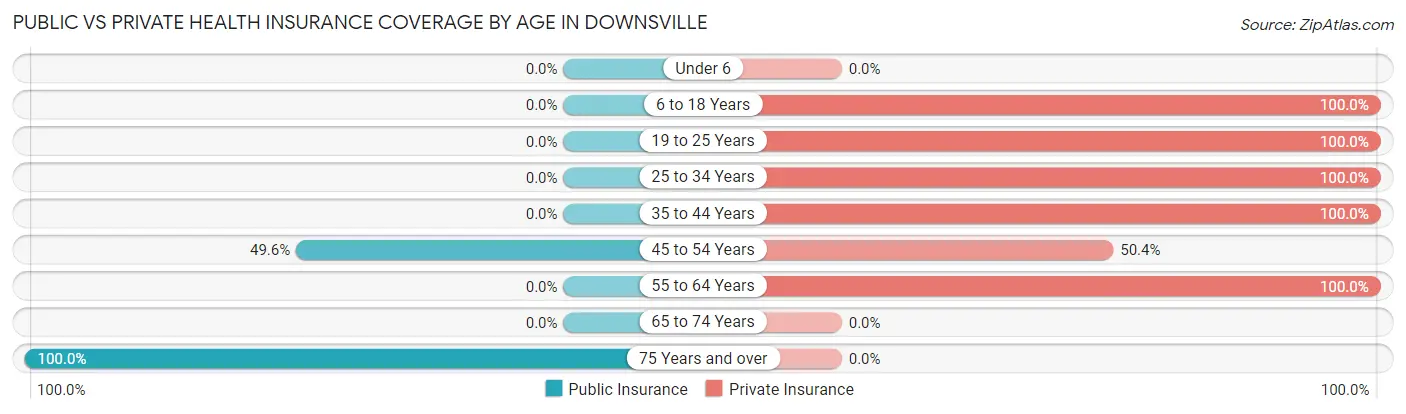
| Age Bracket | Public Insurance | Private Insurance |
| Under 6 | 0 (0.0%) | 0 (0.0%) |
| 6 to 18 Years | 0 (0.0%) | 142 (100.0%) |
| 19 to 25 Years | 0 (0.0%) | 224 (100.0%) |
| 25 to 34 Years | 0 (0.0%) | 117 (100.0%) |
| 35 to 44 Years | 0 (0.0%) | 224 (100.0%) |
| 45 to 54 Years | 63 (49.6%) | 64 (50.4%) |
| 55 to 64 Years | 0 (0.0%) | 71 (100.0%) |
| 65 to 74 Years | 0 (0.0%) | 0 (0.0%) |
| 75 Years and over | 13 (100.0%) | 0 (0.0%) |
| Total | 76 (8.3%) | 842 (91.7%) |
Disability Status by Sex by Age in Downsville
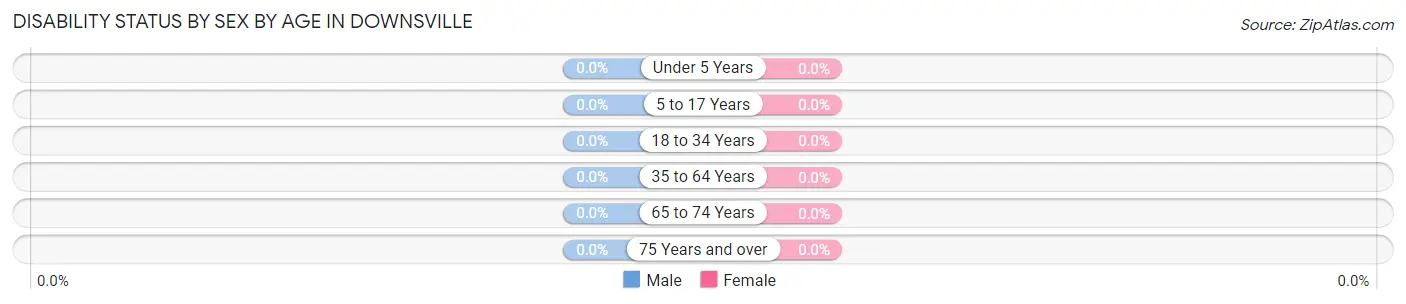
| Age Bracket | Male | Female |
| Under 5 Years | 0 (0.0%) | 0 (0.0%) |
| 5 to 17 Years | 0 (0.0%) | 0 (0.0%) |
| 18 to 34 Years | 0 (0.0%) | 0 (0.0%) |
| 35 to 64 Years | 0 (0.0%) | 0 (0.0%) |
| 65 to 74 Years | 0 (0.0%) | 0 (0.0%) |
| 75 Years and over | 0 (0.0%) | 0 (0.0%) |
Disability Class by Sex by Age in Downsville
Disability Class: Hearing Difficulty
| Age Bracket | Male | Female |
| Under 5 Years | 0 (0.0%) | 0 (0.0%) |
| 5 to 17 Years | 0 (0.0%) | 0 (0.0%) |
| 18 to 34 Years | 0 (0.0%) | 0 (0.0%) |
| 35 to 64 Years | 0 (0.0%) | 0 (0.0%) |
| 65 to 74 Years | 0 (0.0%) | 0 (0.0%) |
| 75 Years and over | 0 (0.0%) | 0 (0.0%) |
Disability Class: Vision Difficulty
| Age Bracket | Male | Female |
| Under 5 Years | 0 (0.0%) | 0 (0.0%) |
| 5 to 17 Years | 0 (0.0%) | 0 (0.0%) |
| 18 to 34 Years | 0 (0.0%) | 0 (0.0%) |
| 35 to 64 Years | 0 (0.0%) | 0 (0.0%) |
| 65 to 74 Years | 0 (0.0%) | 0 (0.0%) |
| 75 Years and over | 0 (0.0%) | 0 (0.0%) |
Disability Class: Cognitive Difficulty
| Age Bracket | Male | Female |
| 5 to 17 Years | 0 (0.0%) | 0 (0.0%) |
| 18 to 34 Years | 0 (0.0%) | 0 (0.0%) |
| 35 to 64 Years | 0 (0.0%) | 0 (0.0%) |
| 65 to 74 Years | 0 (0.0%) | 0 (0.0%) |
| 75 Years and over | 0 (0.0%) | 0 (0.0%) |
Disability Class: Ambulatory Difficulty
| Age Bracket | Male | Female |
| 5 to 17 Years | 0 (0.0%) | 0 (0.0%) |
| 18 to 34 Years | 0 (0.0%) | 0 (0.0%) |
| 35 to 64 Years | 0 (0.0%) | 0 (0.0%) |
| 65 to 74 Years | 0 (0.0%) | 0 (0.0%) |
| 75 Years and over | 0 (0.0%) | 0 (0.0%) |
Disability Class: Self-Care Difficulty
| Age Bracket | Male | Female |
| 5 to 17 Years | 0 (0.0%) | 0 (0.0%) |
| 18 to 34 Years | 0 (0.0%) | 0 (0.0%) |
| 35 to 64 Years | 0 (0.0%) | 0 (0.0%) |
| 65 to 74 Years | 0 (0.0%) | 0 (0.0%) |
| 75 Years and over | 0 (0.0%) | 0 (0.0%) |
Technology Access in Downsville
Computing Device Access in Downsville
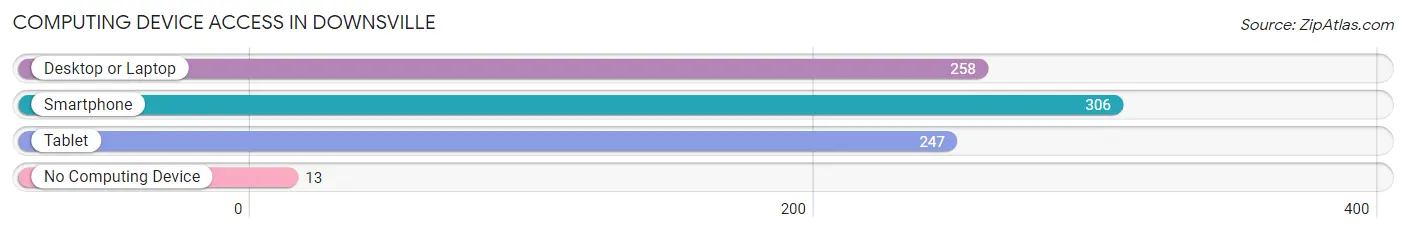
| Device Type | # Households | % Households |
| Desktop or Laptop | 258 | 78.2% |
| Smartphone | 306 | 92.7% |
| Tablet | 247 | 74.9% |
| No Computing Device | 13 | 3.9% |
| Total | 330 | 100.0% |
Internet Access in Downsville
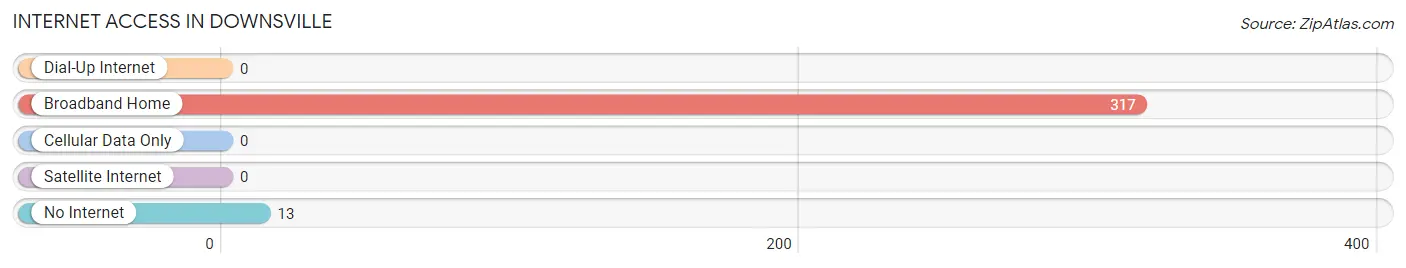
| Internet Type | # Households | % Households |
| Dial-Up Internet | 0 | 0.0% |
| Broadband Home | 317 | 96.1% |
| Cellular Data Only | 0 | 0.0% |
| Satellite Internet | 0 | 0.0% |
| No Internet | 13 | 3.9% |
| Total | 330 | 100.0% |
Downsville Summary
Downsville, Maryland is a small town located in Washington County, Maryland. It is situated on the Potomac River, approximately 25 miles northwest of Hagerstown. The town has a population of approximately 1,000 people and is part of the Hagerstown-Martinsburg Metropolitan Statistical Area.
History
Downsville was founded in 1790 by William Downs, a Revolutionary War veteran. The town was originally known as Downsville Crossroads, and was a small farming community. In 1820, the town was incorporated as Downsville. The town was named after William Downs, who was a prominent local landowner and businessman.
In the late 19th century, the town was a major stop on the Baltimore and Ohio Railroad. The railroad brought new economic opportunities to the town, and it became a popular destination for tourists. The town also became a popular summer resort for wealthy Washingtonians.
Geography
Downsville is located in Washington County, Maryland. It is situated on the Potomac River, approximately 25 miles northwest of Hagerstown. The town is surrounded by rolling hills and farmland. The town is located in the Appalachian Mountains, and is part of the Appalachian Plateau.
The climate in Downsville is humid subtropical, with hot summers and cold winters. The average annual temperature is around 54 degrees Fahrenheit. The average annual precipitation is around 40 inches.
Economy
Downsville’s economy is largely based on agriculture and tourism. The town is home to several farms, which produce a variety of crops, including corn, soybeans, wheat, and hay. The town is also home to several wineries, which produce a variety of wines.
The town is also a popular tourist destination. The town is home to several historic sites, including the Downsville Historic District, which is listed on the National Register of Historic Places. The town is also home to several parks, including the Potomac River State Park.
Demographics
As of the 2010 census, the population of Downsville was 1,000. The racial makeup of the town was 97.2% White, 0.7% African American, 0.3% Native American, 0.2% Asian, 0.1% Pacific Islander, 0.2% from other races, and 1.3% from two or more races. Hispanic or Latino of any race were 1.3% of the population.
The median income for a household in the town was $41,250, and the median income for a family was $50,000. The per capita income for the town was $20,945. About 11.2% of families and 14.2% of the population were below the poverty line, including 18.2% of those under age 18 and 8.3% of those age 65 or over.
Common Questions
What is Per Capita Income in Downsville?
Per Capita income in Downsville is $41,057.
What is the Median Family Income in Downsville?
Median Family Income in Downsville is $142,969.
What is Inequality or Gini Index in Downsville?
Inequality or Gini Index in Downsville is 0.32.
What is the Total Population of Downsville?
Total Population of Downsville is 918.
What is the Total Male Population of Downsville?
Total Male Population of Downsville is 459.
What is the Total Female Population of Downsville?
Total Female Population of Downsville is 459.
What is the Ratio of Males per 100 Females in Downsville?
There are 100.00 Males per 100 Females in Downsville.
What is the Ratio of Females per 100 Males in Downsville?
There are 100.00 Females per 100 Males in Downsville.
What is the Median Population Age in Downsville?
Median Population Age in Downsville is 27.6 Years.
What is the Average Family Size in Downsville
Average Family Size in Downsville is 3.5 People.
What is the Average Household Size in Downsville
Average Household Size in Downsville is 2.8 People.
How Large is the Labor Force in Downsville?
There are 751 People in the Labor Forcein in Downsville.
What is the Percentage of People in the Labor Force in Downsville?
81.8% of People are in the Labor Force in Downsville.
What is the Unemployment Rate in Downsville?
Unemployment Rate in Downsville is 7.9%.