Hughesville, MD Map & Demographics
Hughesville Map
Hughesville Overview
$70,186
PER CAPITA INCOME
$137,692
AVG FAMILY INCOME
$128,846
AVG HOUSEHOLD INCOME
18.5%
WAGE / INCOME GAP [ % ]
81.5¢/ $1
WAGE / INCOME GAP [ $ ]
0.40
INEQUALITY / GINI INDEX
2,299
TOTAL POPULATION
1,161
MALE POPULATION
1,138
FEMALE POPULATION
102.02
MALES / 100 FEMALES
98.02
FEMALES / 100 MALES
50.4
MEDIAN AGE
2.7
AVG FAMILY SIZE
2.5
AVG HOUSEHOLD SIZE
1,278
LABOR FORCE [ PEOPLE ]
64.2%
PERCENT IN LABOR FORCE
1.3%
UNEMPLOYMENT RATE
Hughesville Zip Codes
Income in Hughesville
Income Overview in Hughesville
Per Capita Income in Hughesville is $70,186, while median incomes of families and households are $137,692 and $128,846 respectively.
| Characteristic | Number | Measure |
| Per Capita Income | 2,299 | $70,186 |
| Median Family Income | 744 | $137,692 |
| Mean Family Income | 744 | $171,378 |
| Median Household Income | 892 | $128,846 |
| Mean Household Income | 892 | $176,556 |
| Income Deficit | 744 | $0 |
| Wage / Income Gap (%) | 2,299 | 18.52% |
| Wage / Income Gap ($) | 2,299 | 81.48¢ per $1 |
| Gini / Inequality Index | 2,299 | 0.40 |
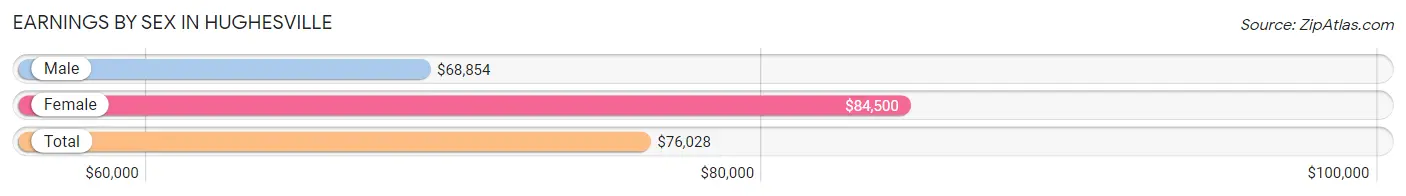
Earnings by Sex in Hughesville
Average Earnings in Hughesville are $76,028, $68,854 for men and $84,500 for women, a difference of 18.5%.
| Sex | Number | Average Earnings |
| Male | 729 (57.8%) | $68,854 |
| Female | 532 (42.2%) | $84,500 |
| Total | 1,261 (100.0%) | $76,028 |
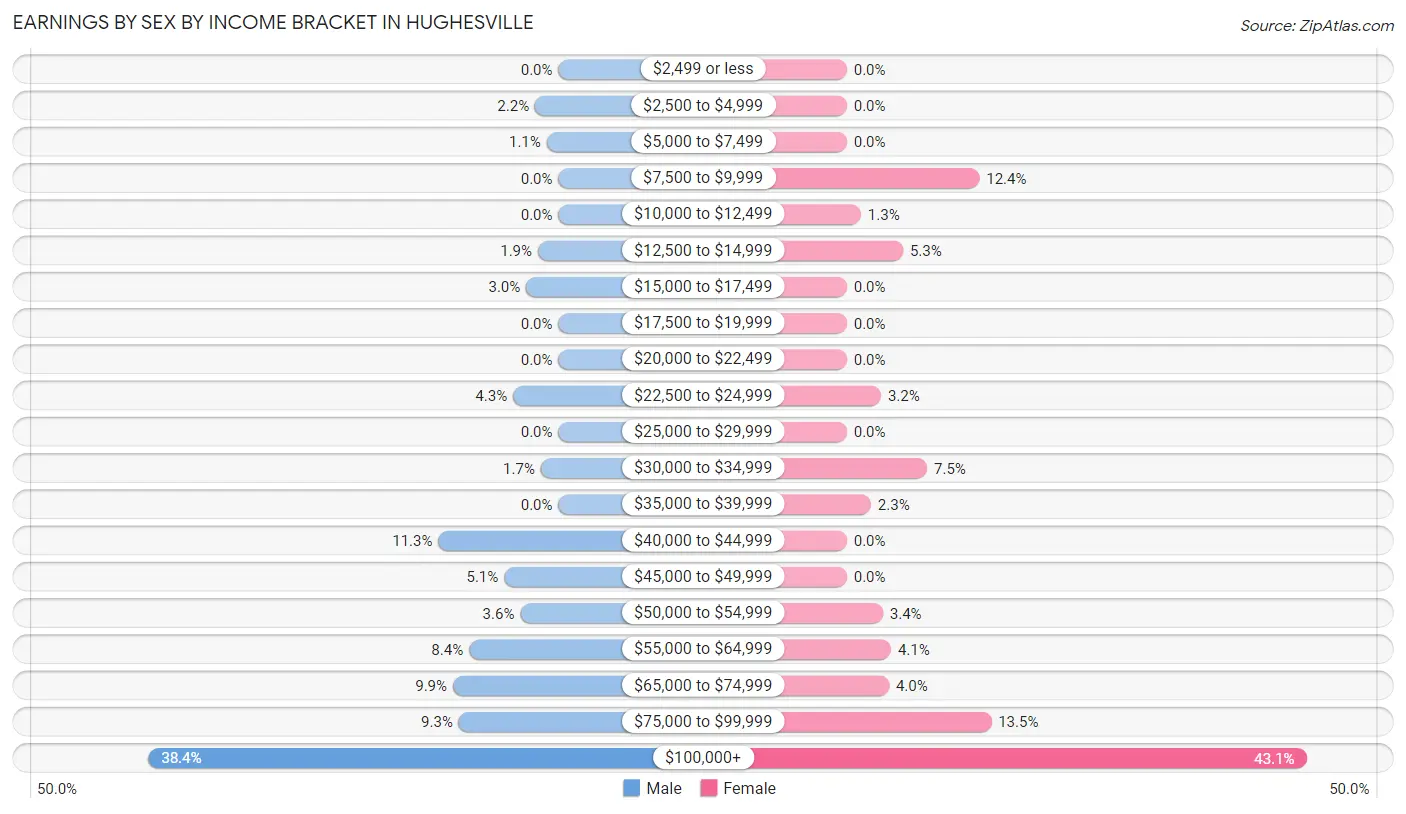
Earnings by Sex by Income Bracket in Hughesville
The most common earnings brackets in Hughesville are $100,000+ for men (280 | 38.4%) and $100,000+ for women (229 | 43.0%).
| Income | Male | Female |
| $2,499 or less | 0 (0.0%) | 0 (0.0%) |
| $2,500 to $4,999 | 16 (2.2%) | 0 (0.0%) |
| $5,000 to $7,499 | 8 (1.1%) | 0 (0.0%) |
| $7,500 to $9,999 | 0 (0.0%) | 66 (12.4%) |
| $10,000 to $12,499 | 0 (0.0%) | 7 (1.3%) |
| $12,500 to $14,999 | 14 (1.9%) | 28 (5.3%) |
| $15,000 to $17,499 | 22 (3.0%) | 0 (0.0%) |
| $17,500 to $19,999 | 0 (0.0%) | 0 (0.0%) |
| $20,000 to $22,499 | 0 (0.0%) | 0 (0.0%) |
| $22,500 to $24,999 | 31 (4.3%) | 17 (3.2%) |
| $25,000 to $29,999 | 0 (0.0%) | 0 (0.0%) |
| $30,000 to $34,999 | 12 (1.7%) | 40 (7.5%) |
| $35,000 to $39,999 | 0 (0.0%) | 12 (2.3%) |
| $40,000 to $44,999 | 82 (11.3%) | 0 (0.0%) |
| $45,000 to $49,999 | 37 (5.1%) | 0 (0.0%) |
| $50,000 to $54,999 | 26 (3.6%) | 18 (3.4%) |
| $55,000 to $64,999 | 61 (8.4%) | 22 (4.1%) |
| $65,000 to $74,999 | 72 (9.9%) | 21 (4.0%) |
| $75,000 to $99,999 | 68 (9.3%) | 72 (13.5%) |
| $100,000+ | 280 (38.4%) | 229 (43.0%) |
| Total | 729 (100.0%) | 532 (100.0%) |
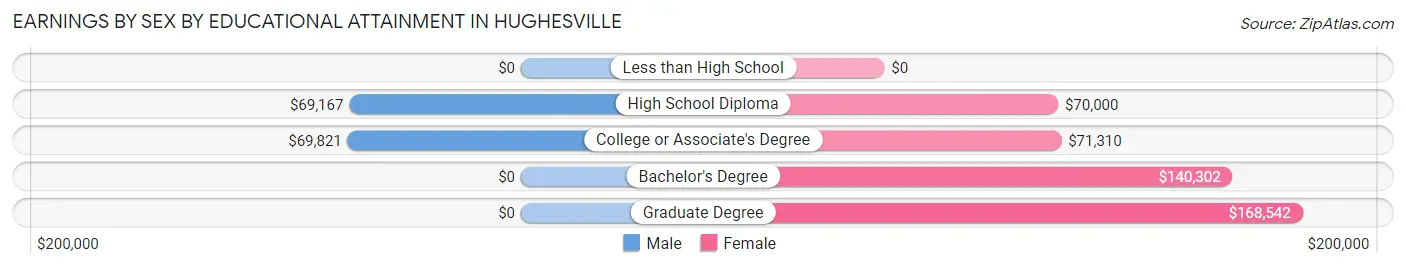
Earnings by Sex by Educational Attainment in Hughesville
Average earnings in Hughesville are $69,410 for men and $98,750 for women, a difference of 29.7%. Men with an educational attainment of college or associate's degree enjoy the highest average annual earnings of $69,821, while those with high school diploma education earn the least with $69,167. Women with an educational attainment of graduate degree earn the most with the average annual earnings of $168,542, while those with high school diploma education have the smallest earnings of $70,000.
| Educational Attainment | Male Income | Female Income |
| Less than High School | - | - |
| High School Diploma | $69,167 | $70,000 |
| College or Associate's Degree | $69,821 | $71,310 |
| Bachelor's Degree | - | - |
| Graduate Degree | - | - |
| Total | $69,410 | $98,750 |
Family Income in Hughesville
Family Income Brackets in Hughesville
According to the Hughesville family income data, there are 257 families falling into the $200,000+ income range, which is the most common income bracket and makes up 34.5% of all families.
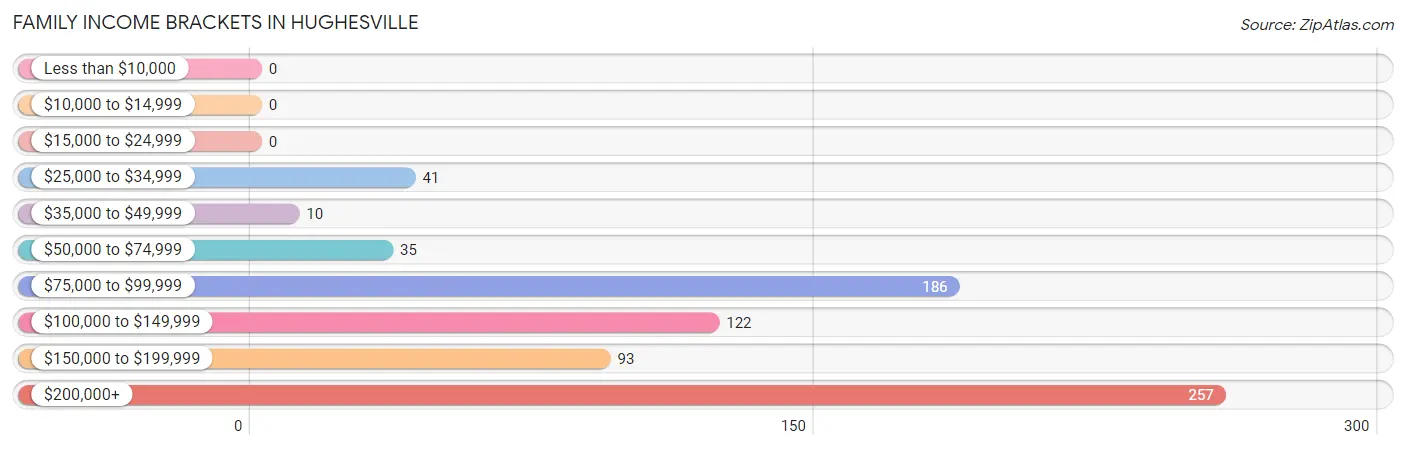
| Income Bracket | # Families | % Families |
| Less than $10,000 | 0 | 0.0% |
| $10,000 to $14,999 | 0 | 0.0% |
| $15,000 to $24,999 | 0 | 0.0% |
| $25,000 to $34,999 | 41 | 5.5% |
| $35,000 to $49,999 | 10 | 1.3% |
| $50,000 to $74,999 | 35 | 4.7% |
| $75,000 to $99,999 | 186 | 25.0% |
| $100,000 to $149,999 | 122 | 16.4% |
| $150,000 to $199,999 | 93 | 12.5% |
| $200,000+ | 257 | 34.5% |
Family Income by Famaliy Size in Hughesville
4-person families (132 | 17.7%) account for the highest median family income in Hughesville with $210,298 per family, while 3-person families (242 | 32.5%) have the highest median income of $55,948 per family member.
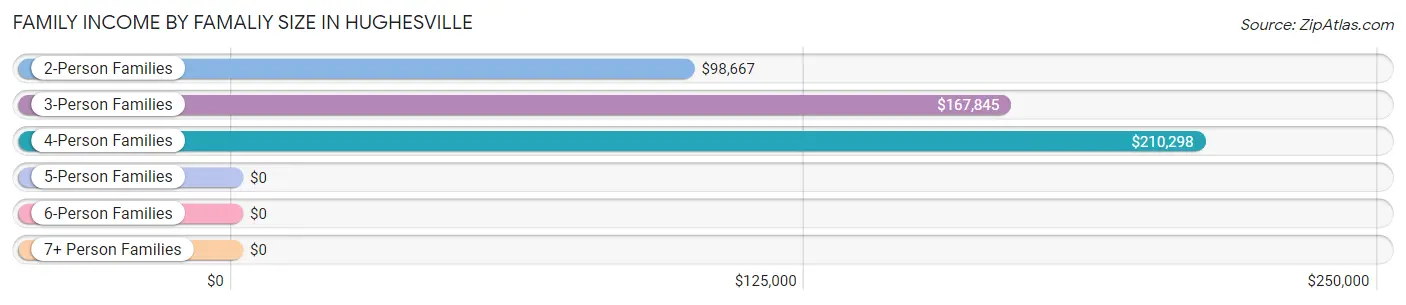
| Income Bracket | # Families | Median Income |
| 2-Person Families | 370 (49.7%) | $98,667 |
| 3-Person Families | 242 (32.5%) | $167,845 |
| 4-Person Families | 132 (17.7%) | $210,298 |
| 5-Person Families | 0 (0.0%) | $0 |
| 6-Person Families | 0 (0.0%) | $0 |
| 7+ Person Families | 0 (0.0%) | $0 |
| Total | 744 (100.0%) | $137,692 |
Family Income by Number of Earners in Hughesville
The median family income in Hughesville is $137,692, with families comprising 3+ earners (72) having the highest median family income of $241,750, while families with no earners (166) have the lowest median family income of $78,846, accounting for 9.7% and 22.3% of families, respectively.
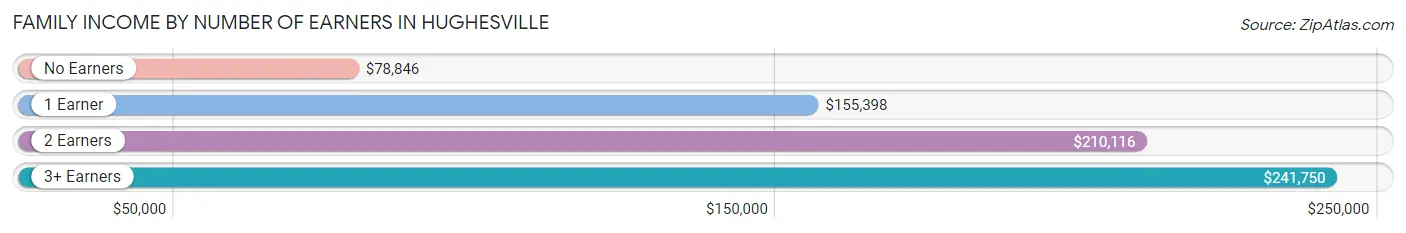
| Number of Earners | # Families | Median Income |
| No Earners | 166 (22.3%) | $78,846 |
| 1 Earner | 195 (26.2%) | $155,398 |
| 2 Earners | 311 (41.8%) | $210,116 |
| 3+ Earners | 72 (9.7%) | $241,750 |
| Total | 744 (100.0%) | $137,692 |
Household Income in Hughesville
Household Income Brackets in Hughesville
With 301 households falling in the category, the $200,000+ income range is the most frequent in Hughesville, accounting for 33.7% of all households.
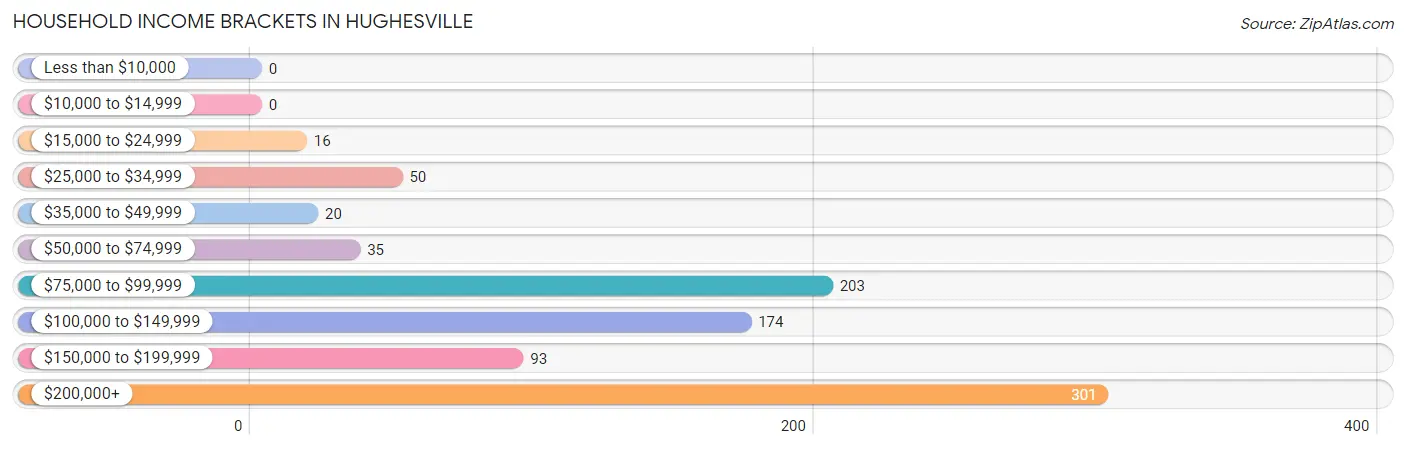
| Income Bracket | # Households | % Households |
| Less than $10,000 | 0 | 0.0% |
| $10,000 to $14,999 | 0 | 0.0% |
| $15,000 to $24,999 | 16 | 1.8% |
| $25,000 to $34,999 | 50 | 5.6% |
| $35,000 to $49,999 | 20 | 2.2% |
| $50,000 to $74,999 | 35 | 3.9% |
| $75,000 to $99,999 | 203 | 22.8% |
| $100,000 to $149,999 | 174 | 19.5% |
| $150,000 to $199,999 | 93 | 10.4% |
| $200,000+ | 301 | 33.7% |
Household Income by Householder Age in Hughesville
The median household income in Hughesville is $128,846, with the highest median household income of $210,089 found in the 25 to 44 years age bracket for the primary householder. A total of 193 households (21.6%) fall into this category.
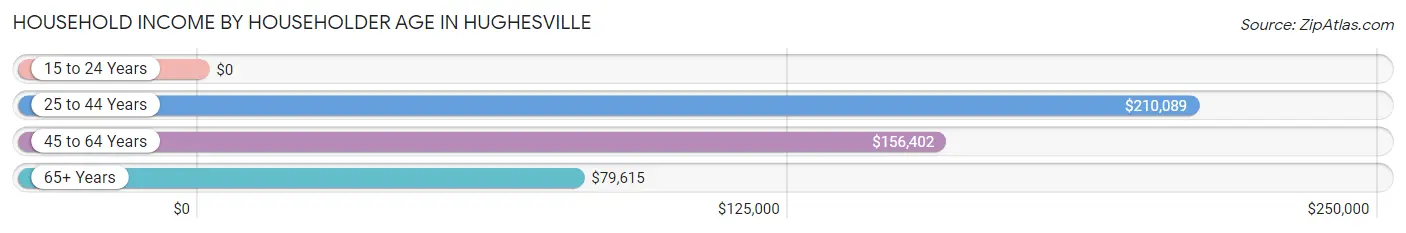
| Income Bracket | # Households | Median Income |
| 15 to 24 Years | 0 (0.0%) | $0 |
| 25 to 44 Years | 193 (21.6%) | $210,089 |
| 45 to 64 Years | 409 (45.9%) | $156,402 |
| 65+ Years | 290 (32.5%) | $79,615 |
| Total | 892 (100.0%) | $128,846 |
Poverty in Hughesville
Income Below Poverty by Sex and Age in Hughesville
With 1.2% poverty level for males and 1.3% for females among the residents of Hughesville, 55 to 64 year old males and 35 to 44 year old females are the most vulnerable to poverty, with 7 males (3.1%) and 7 females (4.5%) in their respective age groups living below the poverty level.
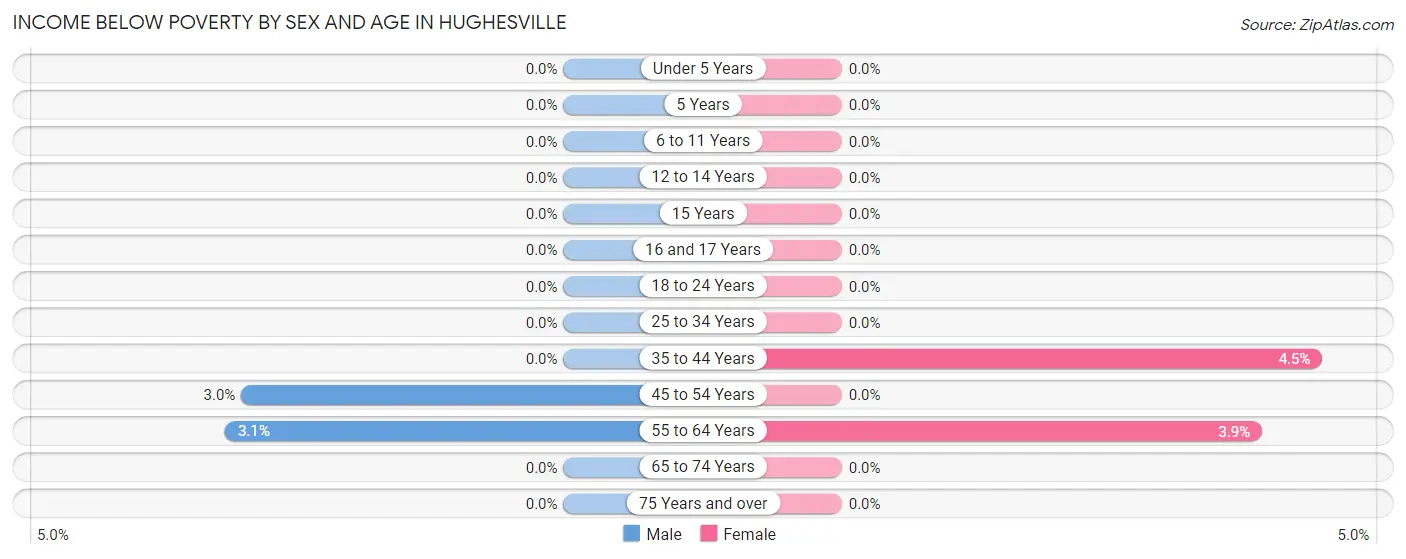
| Age Bracket | Male | Female |
| Under 5 Years | 0 (0.0%) | 0 (0.0%) |
| 5 Years | 0 (0.0%) | 0 (0.0%) |
| 6 to 11 Years | 0 (0.0%) | 0 (0.0%) |
| 12 to 14 Years | 0 (0.0%) | 0 (0.0%) |
| 15 Years | 0 (0.0%) | 0 (0.0%) |
| 16 and 17 Years | 0 (0.0%) | 0 (0.0%) |
| 18 to 24 Years | 0 (0.0%) | 0 (0.0%) |
| 25 to 34 Years | 0 (0.0%) | 0 (0.0%) |
| 35 to 44 Years | 0 (0.0%) | 7 (4.5%) |
| 45 to 54 Years | 7 (3.0%) | 0 (0.0%) |
| 55 to 64 Years | 7 (3.1%) | 8 (3.9%) |
| 65 to 74 Years | 0 (0.0%) | 0 (0.0%) |
| 75 Years and over | 0 (0.0%) | 0 (0.0%) |
| Total | 14 (1.2%) | 15 (1.3%) |
Income Above Poverty by Sex and Age in Hughesville
According to the poverty statistics in Hughesville, males aged 6 to 11 years and females aged under 5 years are the age groups that are most secure financially, with 100.0% of males and 100.0% of females in these age groups living above the poverty line.
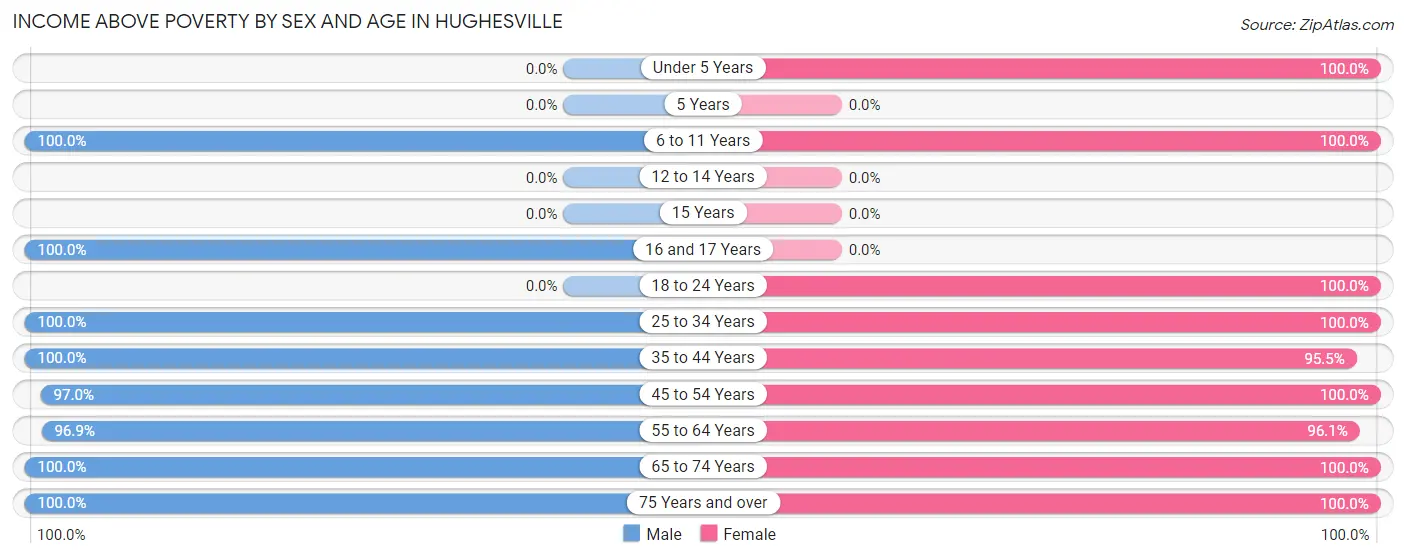
| Age Bracket | Male | Female |
| Under 5 Years | 0 (0.0%) | 158 (100.0%) |
| 5 Years | 0 (0.0%) | 0 (0.0%) |
| 6 to 11 Years | 86 (100.0%) | 43 (100.0%) |
| 12 to 14 Years | 0 (0.0%) | 0 (0.0%) |
| 15 Years | 0 (0.0%) | 0 (0.0%) |
| 16 and 17 Years | 69 (100.0%) | 0 (0.0%) |
| 18 to 24 Years | 0 (0.0%) | 129 (100.0%) |
| 25 to 34 Years | 98 (100.0%) | 47 (100.0%) |
| 35 to 44 Years | 130 (100.0%) | 150 (95.5%) |
| 45 to 54 Years | 227 (97.0%) | 177 (100.0%) |
| 55 to 64 Years | 216 (96.9%) | 197 (96.1%) |
| 65 to 74 Years | 106 (100.0%) | 187 (100.0%) |
| 75 Years and over | 193 (100.0%) | 35 (100.0%) |
| Total | 1,125 (98.8%) | 1,123 (98.7%) |
Income Below Poverty Among Married-Couple Families in Hughesville
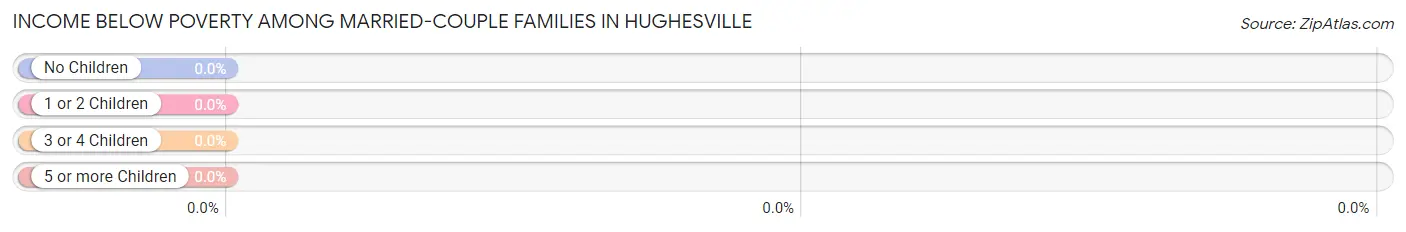
| Children | Above Poverty | Below Poverty |
| No Children | 465 (100.0%) | 0 (0.0%) |
| 1 or 2 Children | 190 (100.0%) | 0 (0.0%) |
| 3 or 4 Children | 0 (0.0%) | 0 (0.0%) |
| 5 or more Children | 0 (0.0%) | 0 (0.0%) |
| Total | 655 (100.0%) | 0 (0.0%) |
Income Below Poverty Among Single-Parent Households in Hughesville
| Children | Single Father | Single Mother |
| No Children | 0 (0.0%) | 0 (0.0%) |
| 1 or 2 Children | 0 (0.0%) | 0 (0.0%) |
| 3 or 4 Children | 0 (0.0%) | 0 (0.0%) |
| 5 or more Children | 0 (0.0%) | 0 (0.0%) |
| Total | 0 (0.0%) | 0 (0.0%) |
Income Below Poverty Among Married-Couple vs Single-Parent Households in Hughesville
| Children | Married-Couple Families | Single-Parent Households |
| No Children | 0 (0.0%) | 0 (0.0%) |
| 1 or 2 Children | 0 (0.0%) | 0 (0.0%) |
| 3 or 4 Children | 0 (0.0%) | 0 (0.0%) |
| 5 or more Children | 0 (0.0%) | 0 (0.0%) |
| Total | 0 (0.0%) | 0 (0.0%) |
Race in Hughesville
The most populous races in Hughesville are White / Caucasian (1,430 | 62.2%), Black / African American (742 | 32.3%), and Two or more Races (96 | 4.2%).
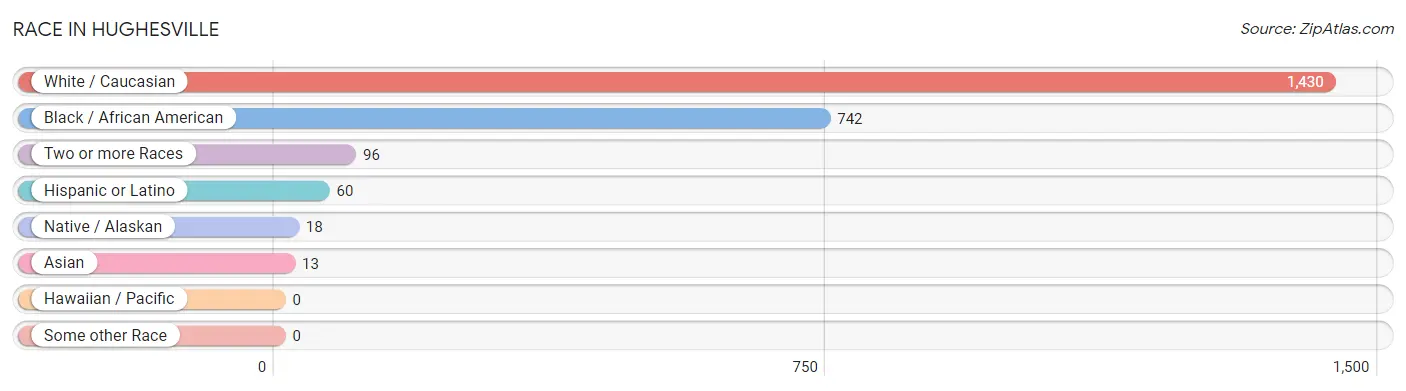
| Race | # Population | % Population |
| Asian | 13 | 0.6% |
| Black / African American | 742 | 32.3% |
| Hawaiian / Pacific | 0 | 0.0% |
| Hispanic or Latino | 60 | 2.6% |
| Native / Alaskan | 18 | 0.8% |
| White / Caucasian | 1,430 | 62.2% |
| Two or more Races | 96 | 4.2% |
| Some other Race | 0 | 0.0% |
| Total | 2,299 | 100.0% |
Ancestry in Hughesville
The most populous ancestries reported in Hughesville are German (295 | 12.8%), Irish (257 | 11.2%), Nigerian (226 | 9.8%), Subsaharan African (226 | 9.8%), and Scottish (175 | 7.6%), together accounting for 51.3% of all Hughesville residents.
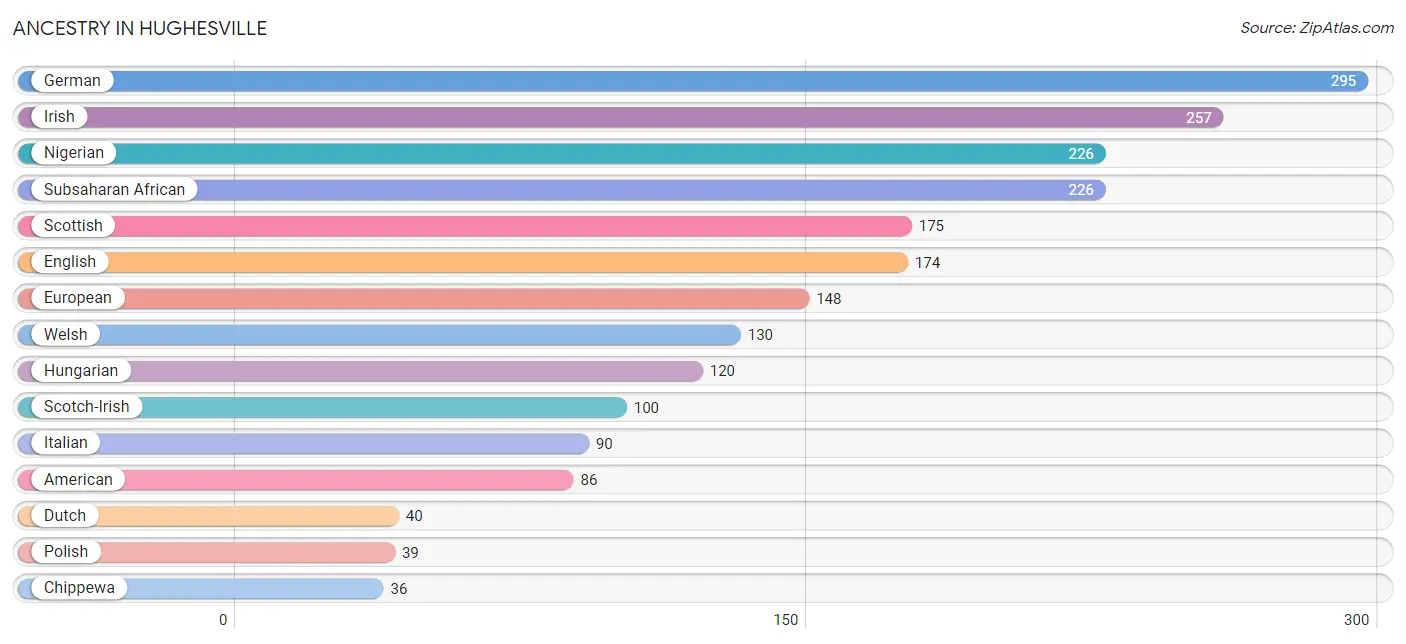
| Ancestry | # Population | % Population |
| American | 86 | 3.7% |
| Chippewa | 36 | 1.6% |
| Dutch | 40 | 1.7% |
| English | 174 | 7.6% |
| European | 148 | 6.4% |
| French | 25 | 1.1% |
| German | 295 | 12.8% |
| Hungarian | 120 | 5.2% |
| Irish | 257 | 11.2% |
| Italian | 90 | 3.9% |
| Korean | 13 | 0.6% |
| Nigerian | 226 | 9.8% |
| Norwegian | 11 | 0.5% |
| Polish | 39 | 1.7% |
| Puerto Rican | 32 | 1.4% |
| Scandinavian | 26 | 1.1% |
| Scotch-Irish | 100 | 4.3% |
| Scottish | 175 | 7.6% |
| Spanish | 28 | 1.2% |
| Subsaharan African | 226 | 9.8% |
| Welsh | 130 | 5.7% | View All 21 Rows |
Immigrants in Hughesville
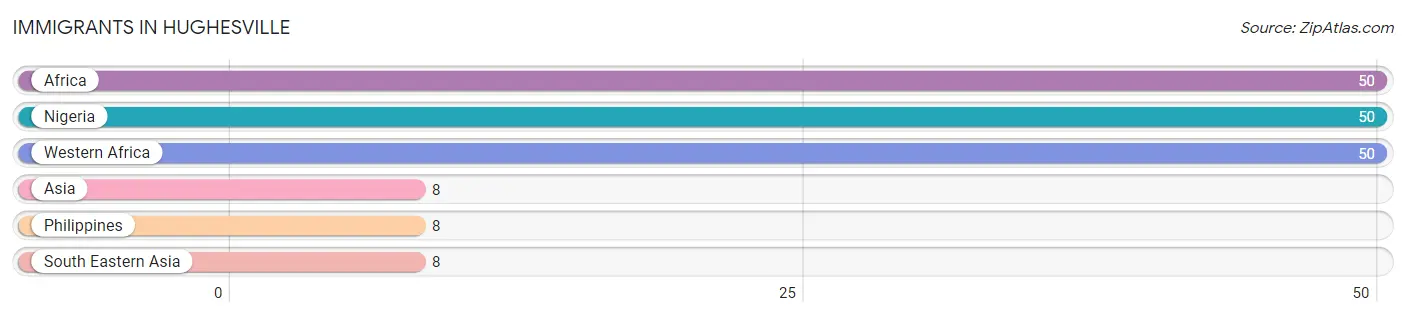
The most numerous immigrant groups reported in Hughesville came from Africa (50 | 2.2%), Nigeria (50 | 2.2%), Western Africa (50 | 2.2%), Asia (8 | 0.4%), and Philippines (8 | 0.4%), together accounting for 7.2% of all Hughesville residents.
| Immigration Origin | # Population | % Population |
| Africa | 50 | 2.2% |
| Asia | 8 | 0.4% |
| Nigeria | 50 | 2.2% |
| Philippines | 8 | 0.4% |
| South Eastern Asia | 8 | 0.4% |
| Western Africa | 50 | 2.2% | View All 6 Rows |
Sex and Age in Hughesville
Sex and Age in Hughesville
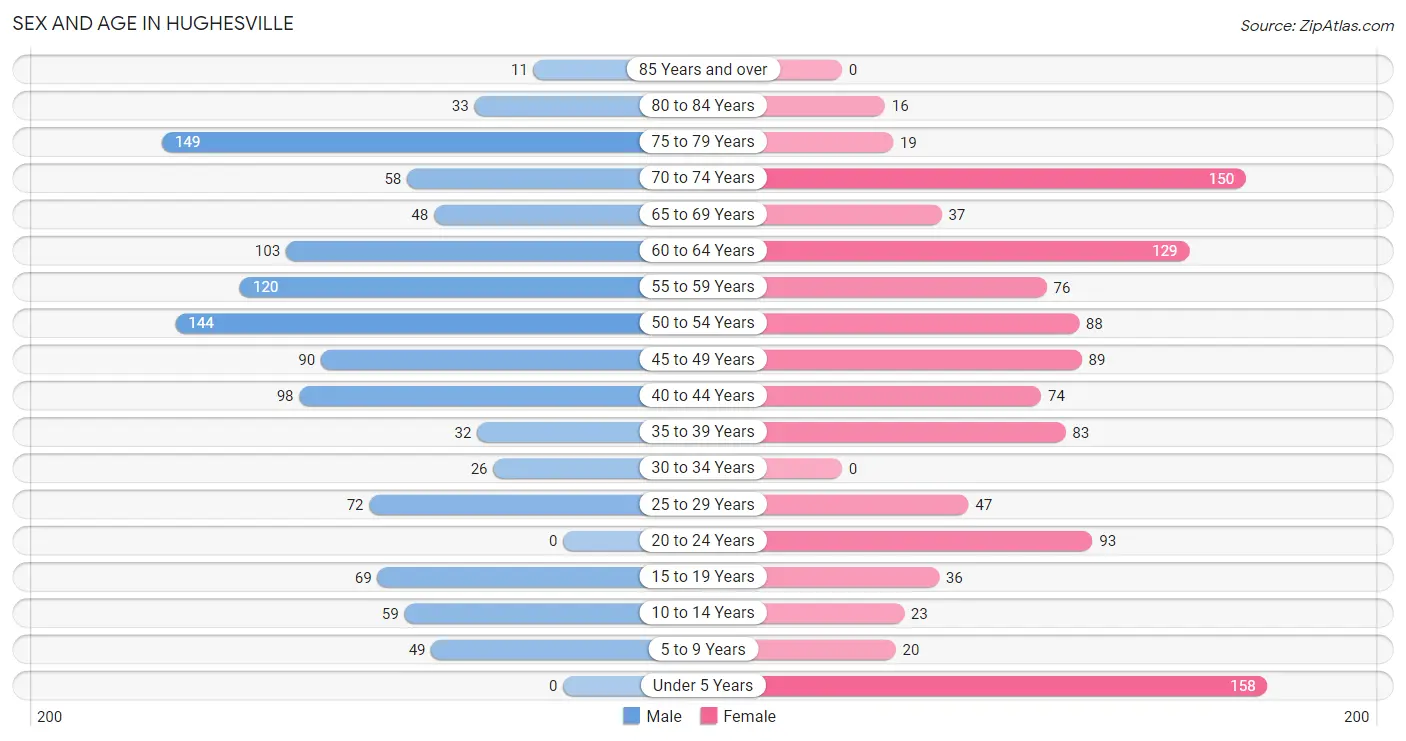
The most populous age groups in Hughesville are 75 to 79 Years (149 | 12.8%) for men and Under 5 Years (158 | 13.9%) for women.
| Age Bracket | Male | Female |
| Under 5 Years | 0 (0.0%) | 158 (13.9%) |
| 5 to 9 Years | 49 (4.2%) | 20 (1.8%) |
| 10 to 14 Years | 59 (5.1%) | 23 (2.0%) |
| 15 to 19 Years | 69 (5.9%) | 36 (3.2%) |
| 20 to 24 Years | 0 (0.0%) | 93 (8.2%) |
| 25 to 29 Years | 72 (6.2%) | 47 (4.1%) |
| 30 to 34 Years | 26 (2.2%) | 0 (0.0%) |
| 35 to 39 Years | 32 (2.8%) | 83 (7.3%) |
| 40 to 44 Years | 98 (8.4%) | 74 (6.5%) |
| 45 to 49 Years | 90 (7.7%) | 89 (7.8%) |
| 50 to 54 Years | 144 (12.4%) | 88 (7.7%) |
| 55 to 59 Years | 120 (10.3%) | 76 (6.7%) |
| 60 to 64 Years | 103 (8.9%) | 129 (11.3%) |
| 65 to 69 Years | 48 (4.1%) | 37 (3.3%) |
| 70 to 74 Years | 58 (5.0%) | 150 (13.2%) |
| 75 to 79 Years | 149 (12.8%) | 19 (1.7%) |
| 80 to 84 Years | 33 (2.8%) | 16 (1.4%) |
| 85 Years and over | 11 (0.9%) | 0 (0.0%) |
| Total | 1,161 (100.0%) | 1,138 (100.0%) |
Families and Households in Hughesville
Median Family Size in Hughesville
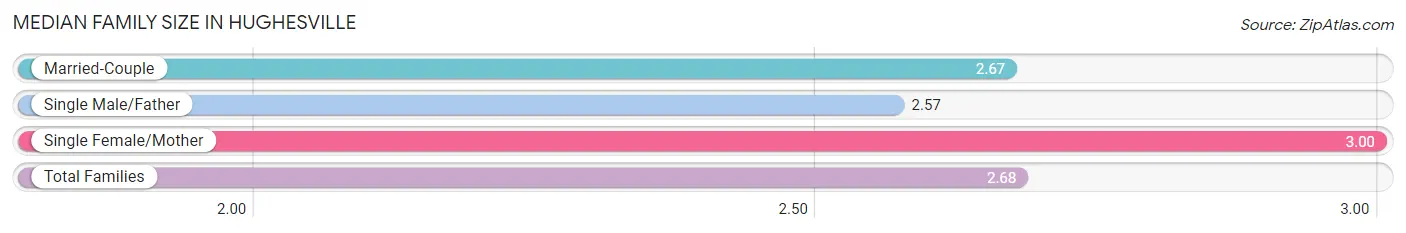
The median family size in Hughesville is 2.68 persons per family, with single female/mother families (29 | 3.9%) accounting for the largest median family size of 3 persons per family. On the other hand, single male/father families (60 | 8.1%) represent the smallest median family size with 2.57 persons per family.
| Family Type | # Families | Family Size |
| Married-Couple | 655 (88.0%) | 2.67 |
| Single Male/Father | 60 (8.1%) | 2.57 |
| Single Female/Mother | 29 (3.9%) | 3.00 |
| Total Families | 744 (100.0%) | 2.68 |
Median Household Size in Hughesville
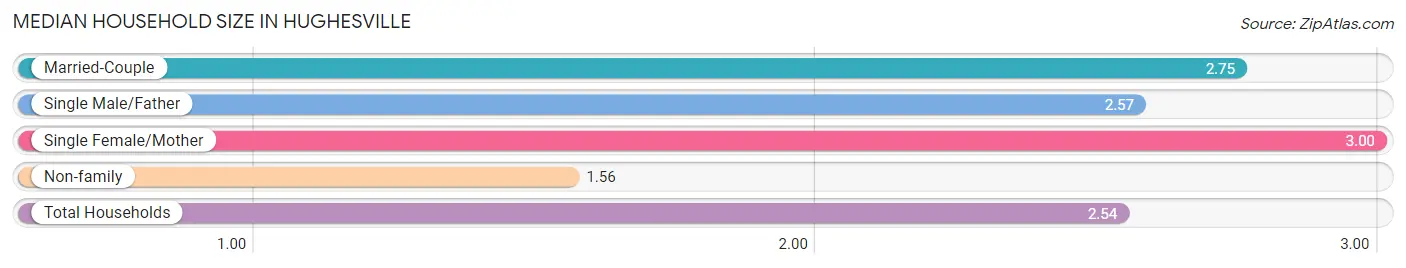
The median household size in Hughesville is 2.54 persons per household, with single female/mother households (29 | 3.3%) accounting for the largest median household size of 3 persons per household. non-family households (148 | 16.6%) represent the smallest median household size with 1.56 persons per household.
| Household Type | # Households | Household Size |
| Married-Couple | 655 (73.4%) | 2.75 |
| Single Male/Father | 60 (6.7%) | 2.57 |
| Single Female/Mother | 29 (3.3%) | 3.00 |
| Non-family | 148 (16.6%) | 1.56 |
| Total Households | 892 (100.0%) | 2.54 |
Household Size by Marriage Status in Hughesville
Out of a total of 892 households in Hughesville, 744 (83.4%) are family households, while 148 (16.6%) are nonfamily households. The most numerous type of family households are 2-person households, comprising 343, and the most common type of nonfamily households are 2-person households, comprising 81.
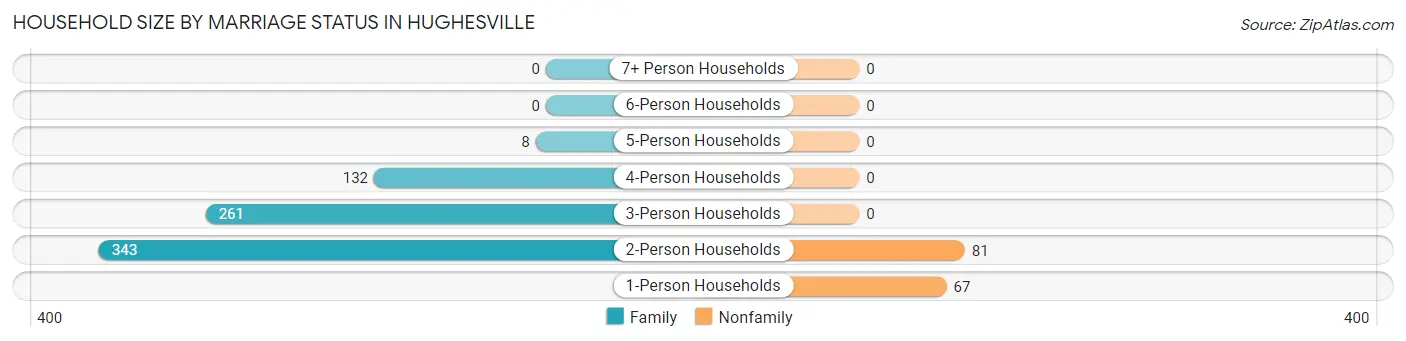
| Household Size | Family Households | Nonfamily Households |
| 1-Person Households | - | 67 (7.5%) |
| 2-Person Households | 343 (38.5%) | 81 (9.1%) |
| 3-Person Households | 261 (29.3%) | 0 (0.0%) |
| 4-Person Households | 132 (14.8%) | 0 (0.0%) |
| 5-Person Households | 8 (0.9%) | 0 (0.0%) |
| 6-Person Households | 0 (0.0%) | 0 (0.0%) |
| 7+ Person Households | 0 (0.0%) | 0 (0.0%) |
| Total | 744 (83.4%) | 148 (16.6%) |
Female Fertility in Hughesville
Fertility by Age in Hughesville
Average fertility rate in Hughesville is 128.0 births per 1,000 women. Women in the age bracket of 35 to 50 years have the highest fertility rate with 143.0 births per 1,000 women. Women in the age bracket of 35 to 50 years acount for 70.0% of all women with births.
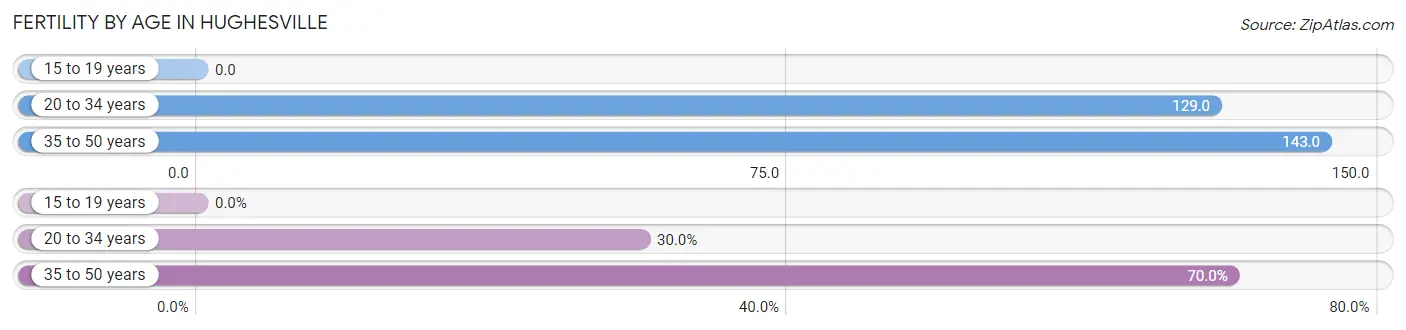
| Age Bracket | Women with Births | Births / 1,000 Women |
| 15 to 19 years | 0 (0.0%) | 0.0 |
| 20 to 34 years | 18 (30.0%) | 129.0 |
| 35 to 50 years | 42 (70.0%) | 143.0 |
| Total | 60 (100.0%) | 128.0 |
Fertility by Age by Marriage Status in Hughesville
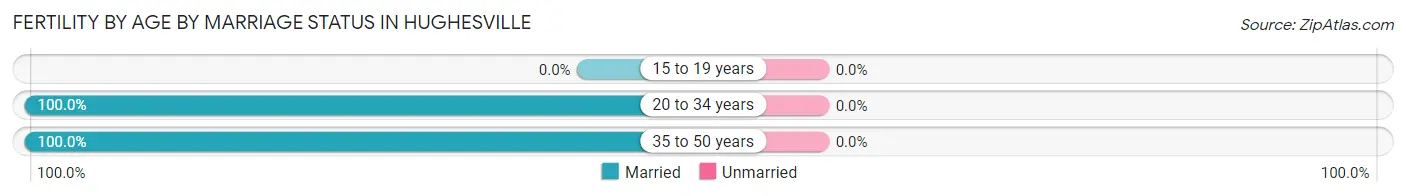
| Age Bracket | Married | Unmarried |
| 15 to 19 years | 0 (0.0%) | 0 (0.0%) |
| 20 to 34 years | 18 (100.0%) | 0 (0.0%) |
| 35 to 50 years | 42 (100.0%) | 0 (0.0%) |
| Total | 60 (100.0%) | 0 (0.0%) |
Fertility by Education in Hughesville
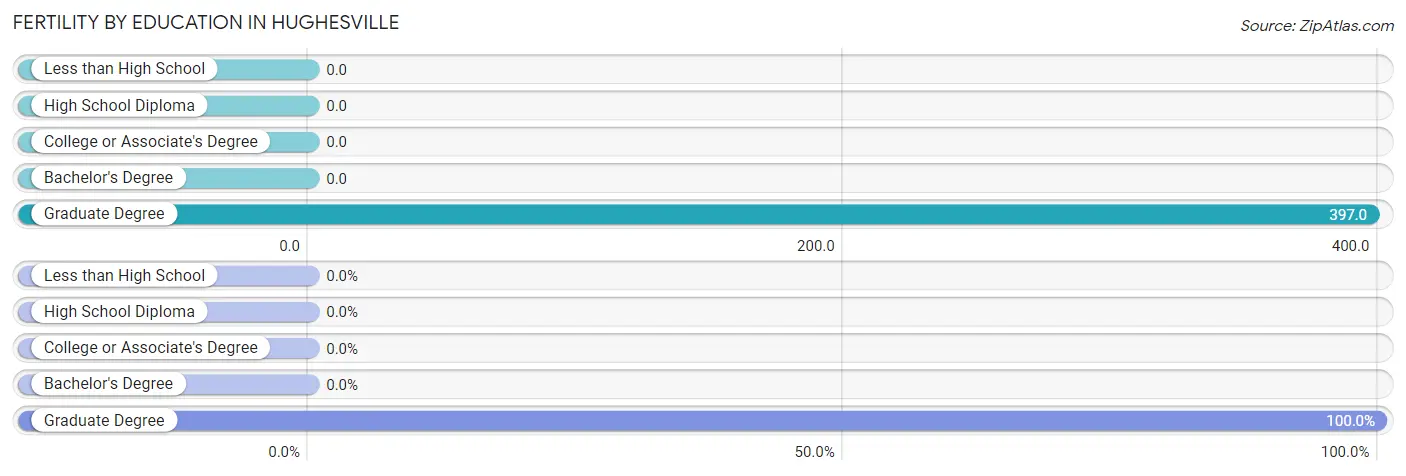
| Educational Attainment | Women with Births | Births / 1,000 Women |
| Less than High School | 0 (0.0%) | 0.0 |
| High School Diploma | 0 (0.0%) | 0.0 |
| College or Associate's Degree | 0 (0.0%) | 0.0 |
| Bachelor's Degree | 0 (0.0%) | 0.0 |
| Graduate Degree | 60 (100.0%) | 397.0 |
| Total | 60 (100.0%) | 128.0 |
Fertility by Education by Marriage Status in Hughesville
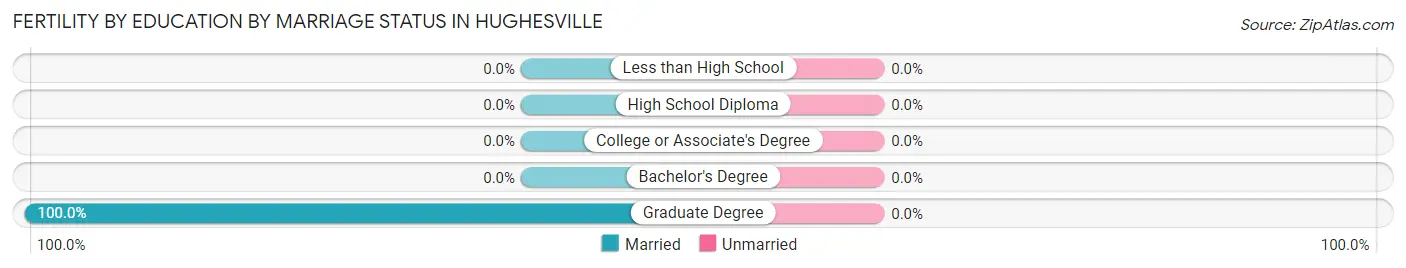
| Educational Attainment | Married | Unmarried |
| Less than High School | 0 (0.0%) | 0 (0.0%) |
| High School Diploma | 0 (0.0%) | 0 (0.0%) |
| College or Associate's Degree | 0 (0.0%) | 0 (0.0%) |
| Bachelor's Degree | 0 (0.0%) | 0 (0.0%) |
| Graduate Degree | 60 (100.0%) | 0 (0.0%) |
| Total | 60 (100.0%) | 0 (0.0%) |
Employment Characteristics in Hughesville
Employment by Class of Employer in Hughesville
Among the 1,207 employed individuals in Hughesville, private company employees (592 | 49.0%), federal government employees (327 | 27.1%), and self-employed (not incorporated) (110 | 9.1%) make up the most common classes of employment.
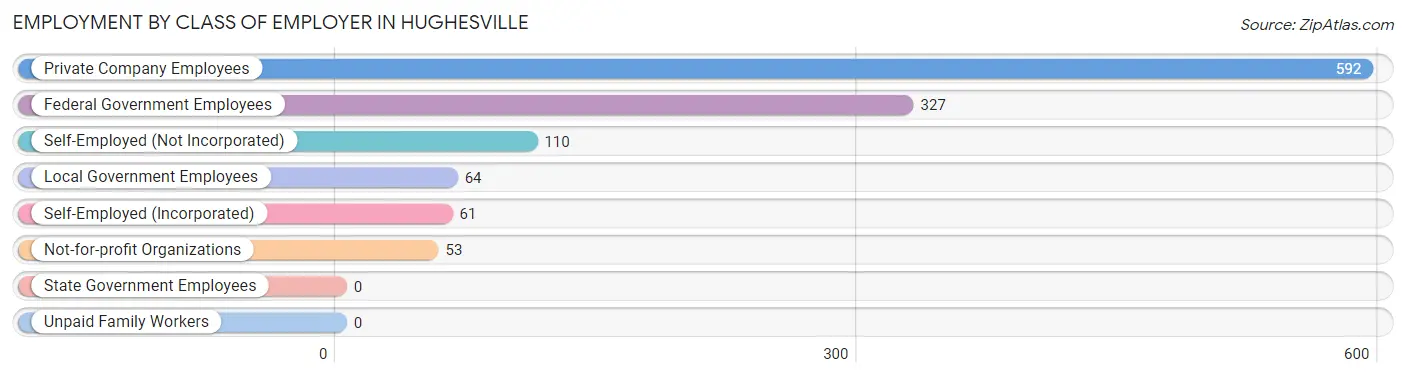
| Employer Class | # Employees | % Employees |
| Private Company Employees | 592 | 49.0% |
| Self-Employed (Incorporated) | 61 | 5.1% |
| Self-Employed (Not Incorporated) | 110 | 9.1% |
| Not-for-profit Organizations | 53 | 4.4% |
| Local Government Employees | 64 | 5.3% |
| State Government Employees | 0 | 0.0% |
| Federal Government Employees | 327 | 27.1% |
| Unpaid Family Workers | 0 | 0.0% |
| Total | 1,207 | 100.0% |
Employment Status by Age in Hughesville
According to the labor force statistics for Hughesville, out of the total population over 16 years of age (1,990), 64.2% or 1,278 individuals are in the labor force, with 1.3% or 17 of them unemployed. The age group with the highest labor force participation rate is 25 to 29 years, with 100.0% or 119 individuals in the labor force. Within the labor force, the 16 to 19 years age range has the highest percentage of unemployed individuals, with 33.3% or 8 of them being unemployed.
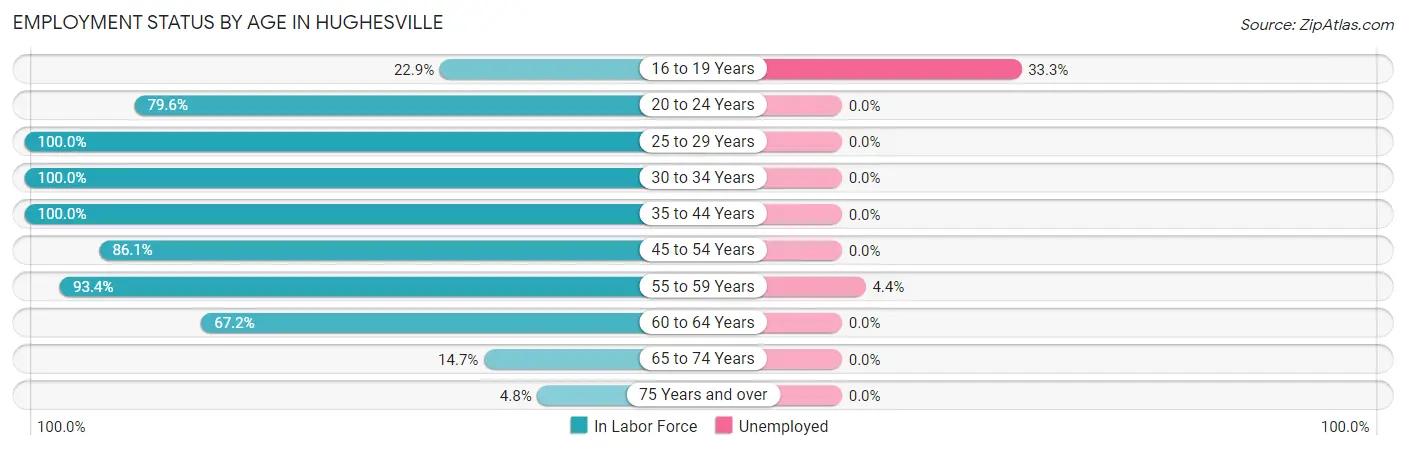
| Age Bracket | In Labor Force | Unemployed |
| 16 to 19 Years | 24 (22.9%) | 8 (33.3%) |
| 20 to 24 Years | 74 (79.6%) | 0 (0.0%) |
| 25 to 29 Years | 119 (100.0%) | 0 (0.0%) |
| 30 to 34 Years | 26 (100.0%) | 0 (0.0%) |
| 35 to 44 Years | 287 (100.0%) | 0 (0.0%) |
| 45 to 54 Years | 354 (86.1%) | 0 (0.0%) |
| 55 to 59 Years | 183 (93.4%) | 8 (4.4%) |
| 60 to 64 Years | 156 (67.2%) | 0 (0.0%) |
| 65 to 74 Years | 43 (14.7%) | 0 (0.0%) |
| 75 Years and over | 11 (4.8%) | 0 (0.0%) |
| Total | 1,278 (64.2%) | 17 (1.3%) |
Employment Status by Educational Attainment in Hughesville
According to labor force statistics for Hughesville, 88.5% of individuals (1,125) out of the total population between 25 and 64 years of age (1,271) are in the labor force, with 0.7% or 8 of them being unemployed. The group with the highest labor force participation rate are those with the educational attainment of college / associate degree, with 93.0% or 454 individuals in the labor force. Within the labor force, individuals with college / associate degree education have the highest percentage of unemployment, with 1.8% or 8 of them being unemployed.
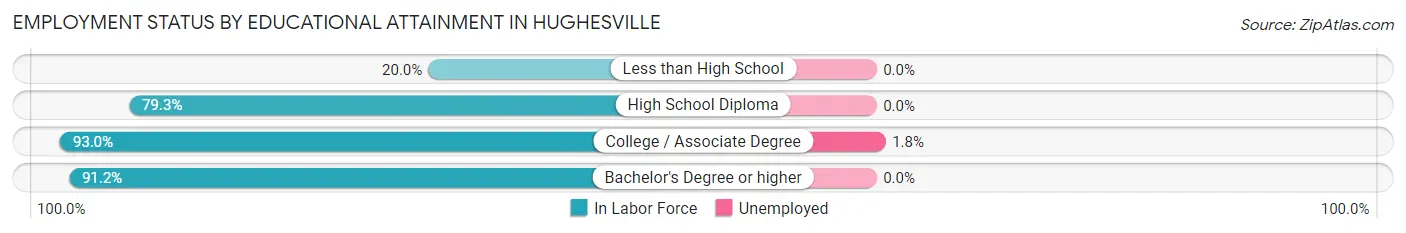
| Educational Attainment | In Labor Force | Unemployed |
| Less than High School | 3 (20.0%) | 0 (0.0%) |
| High School Diploma | 214 (79.3%) | 0 (0.0%) |
| College / Associate Degree | 454 (93.0%) | 9 (1.8%) |
| Bachelor's Degree or higher | 454 (91.2%) | 0 (0.0%) |
| Total | 1,125 (88.5%) | 9 (0.7%) |
Employment Occupations by Sex in Hughesville
Management, Business, Science and Arts Occupations
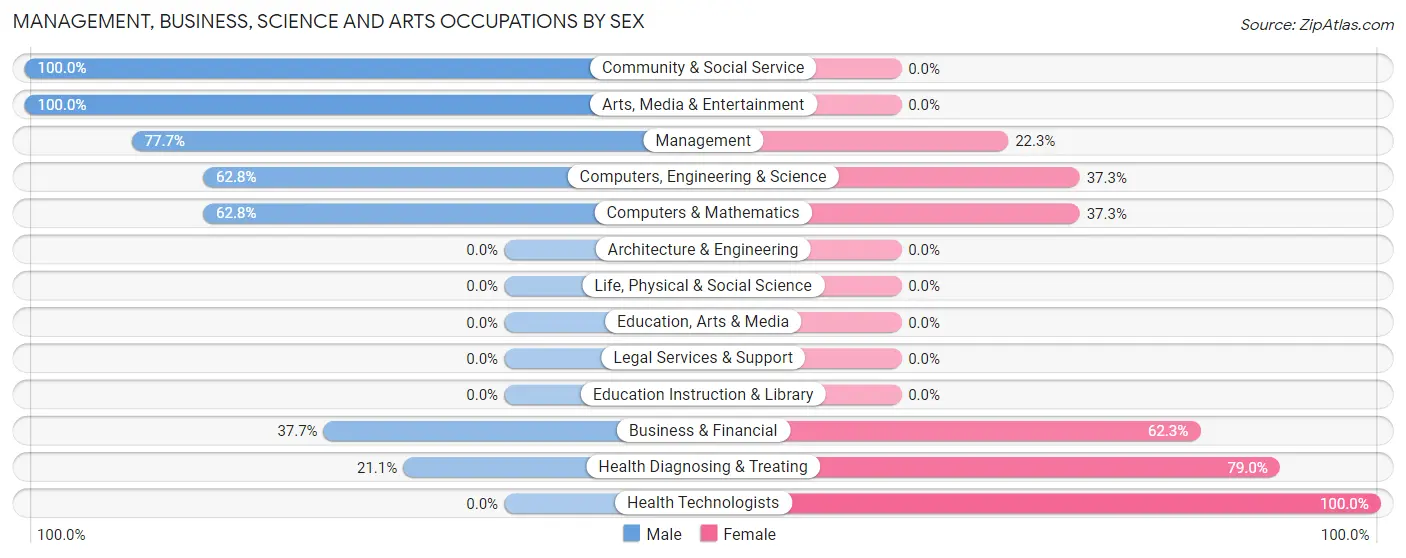
The most common Management, Business, Science and Arts occupations in Hughesville are Business & Financial (231 | 18.6%), Management (215 | 17.3%), Computers, Engineering & Science (51 | 4.1%), Computers & Mathematics (51 | 4.1%), and Health Diagnosing & Treating (38 | 3.1%).

Management, Business, Science and Arts Occupations by Sex
Within the Management, Business, Science and Arts occupations in Hughesville, the most male-oriented occupations are Community & Social Service (100.0%), Arts, Media & Entertainment (100.0%), and Management (77.7%), while the most female-oriented occupations are Health Technologists (100.0%), Health Diagnosing & Treating (78.9%), and Business & Financial (62.3%).
| Occupation | Male | Female |
| Management | 167 (77.7%) | 48 (22.3%) |
| Business & Financial | 87 (37.7%) | 144 (62.3%) |
| Computers, Engineering & Science | 32 (62.7%) | 19 (37.2%) |
| Computers & Mathematics | 32 (62.7%) | 19 (37.2%) |
| Architecture & Engineering | 0 (0.0%) | 0 (0.0%) |
| Life, Physical & Social Science | 0 (0.0%) | 0 (0.0%) |
| Community & Social Service | 5 (100.0%) | 0 (0.0%) |
| Education, Arts & Media | 0 (0.0%) | 0 (0.0%) |
| Legal Services & Support | 0 (0.0%) | 0 (0.0%) |
| Education Instruction & Library | 0 (0.0%) | 0 (0.0%) |
| Arts, Media & Entertainment | 5 (100.0%) | 0 (0.0%) |
| Health Diagnosing & Treating | 8 (21.0%) | 30 (78.9%) |
| Health Technologists | 0 (0.0%) | 21 (100.0%) |
| Total (Category) | 299 (55.4%) | 241 (44.6%) |
| Total (Overall) | 710 (57.2%) | 532 (42.8%) |
Services Occupations
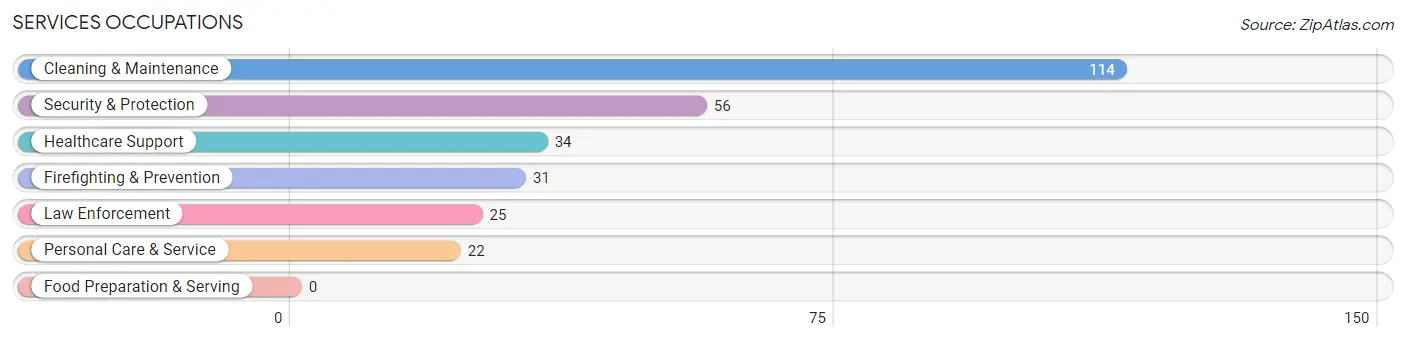
The most common Services occupations in Hughesville are Cleaning & Maintenance (114 | 9.2%), Security & Protection (56 | 4.5%), Healthcare Support (34 | 2.7%), Firefighting & Prevention (31 | 2.5%), and Law Enforcement (25 | 2.0%).
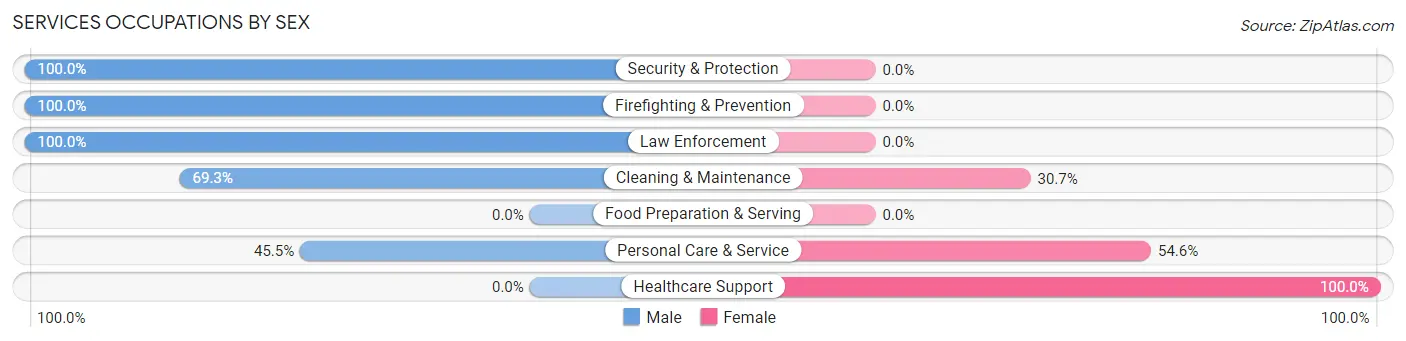
Services Occupations by Sex
Within the Services occupations in Hughesville, the most male-oriented occupations are Security & Protection (100.0%), Firefighting & Prevention (100.0%), and Law Enforcement (100.0%), while the most female-oriented occupations are Healthcare Support (100.0%), Personal Care & Service (54.5%), and Cleaning & Maintenance (30.7%).
| Occupation | Male | Female |
| Healthcare Support | 0 (0.0%) | 34 (100.0%) |
| Security & Protection | 56 (100.0%) | 0 (0.0%) |
| Firefighting & Prevention | 31 (100.0%) | 0 (0.0%) |
| Law Enforcement | 25 (100.0%) | 0 (0.0%) |
| Food Preparation & Serving | 0 (0.0%) | 0 (0.0%) |
| Cleaning & Maintenance | 79 (69.3%) | 35 (30.7%) |
| Personal Care & Service | 10 (45.5%) | 12 (54.5%) |
| Total (Category) | 145 (64.2%) | 81 (35.8%) |
| Total (Overall) | 710 (57.2%) | 532 (42.8%) |
Sales and Office Occupations
The most common Sales and Office occupations in Hughesville are Office & Administration (271 | 21.8%), and Sales & Related (12 | 1.0%).

Sales and Office Occupations by Sex

| Occupation | Male | Female |
| Sales & Related | 12 (100.0%) | 0 (0.0%) |
| Office & Administration | 61 (22.5%) | 210 (77.5%) |
| Total (Category) | 73 (25.8%) | 210 (74.2%) |
| Total (Overall) | 710 (57.2%) | 532 (42.8%) |
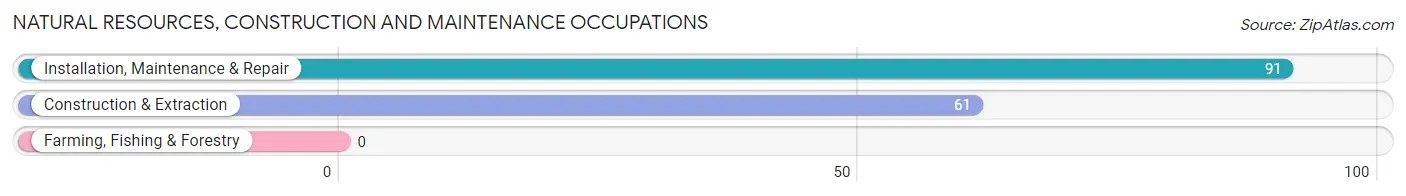
Natural Resources, Construction and Maintenance Occupations
The most common Natural Resources, Construction and Maintenance occupations in Hughesville are Installation, Maintenance & Repair (91 | 7.3%), and Construction & Extraction (61 | 4.9%).
Natural Resources, Construction and Maintenance Occupations by Sex

| Occupation | Male | Female |
| Farming, Fishing & Forestry | 0 (0.0%) | 0 (0.0%) |
| Construction & Extraction | 61 (100.0%) | 0 (0.0%) |
| Installation, Maintenance & Repair | 91 (100.0%) | 0 (0.0%) |
| Total (Category) | 152 (100.0%) | 0 (0.0%) |
| Total (Overall) | 710 (57.2%) | 532 (42.8%) |
Production, Transportation and Moving Occupations
The most common Production, Transportation and Moving occupations in Hughesville are Transportation (30 | 2.4%), and Material Moving (11 | 0.9%).
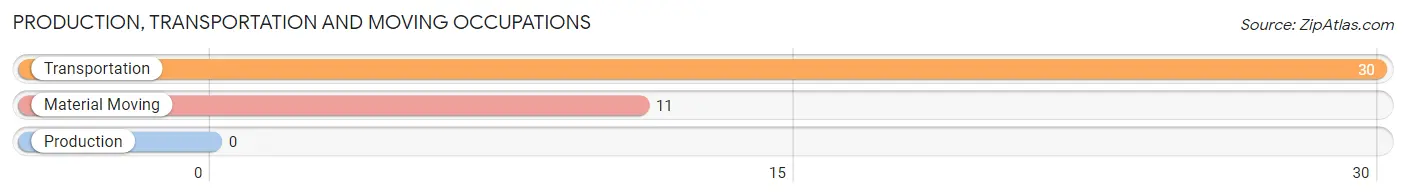
Production, Transportation and Moving Occupations by Sex
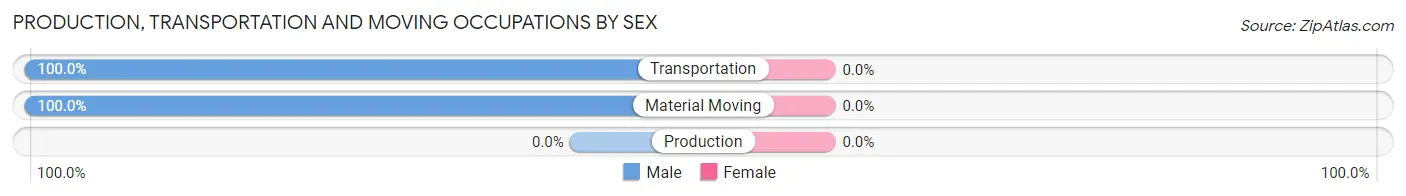
| Occupation | Male | Female |
| Production | 0 (0.0%) | 0 (0.0%) |
| Transportation | 30 (100.0%) | 0 (0.0%) |
| Material Moving | 11 (100.0%) | 0 (0.0%) |
| Total (Category) | 41 (100.0%) | 0 (0.0%) |
| Total (Overall) | 710 (57.2%) | 532 (42.8%) |
Employment Industries by Sex in Hughesville
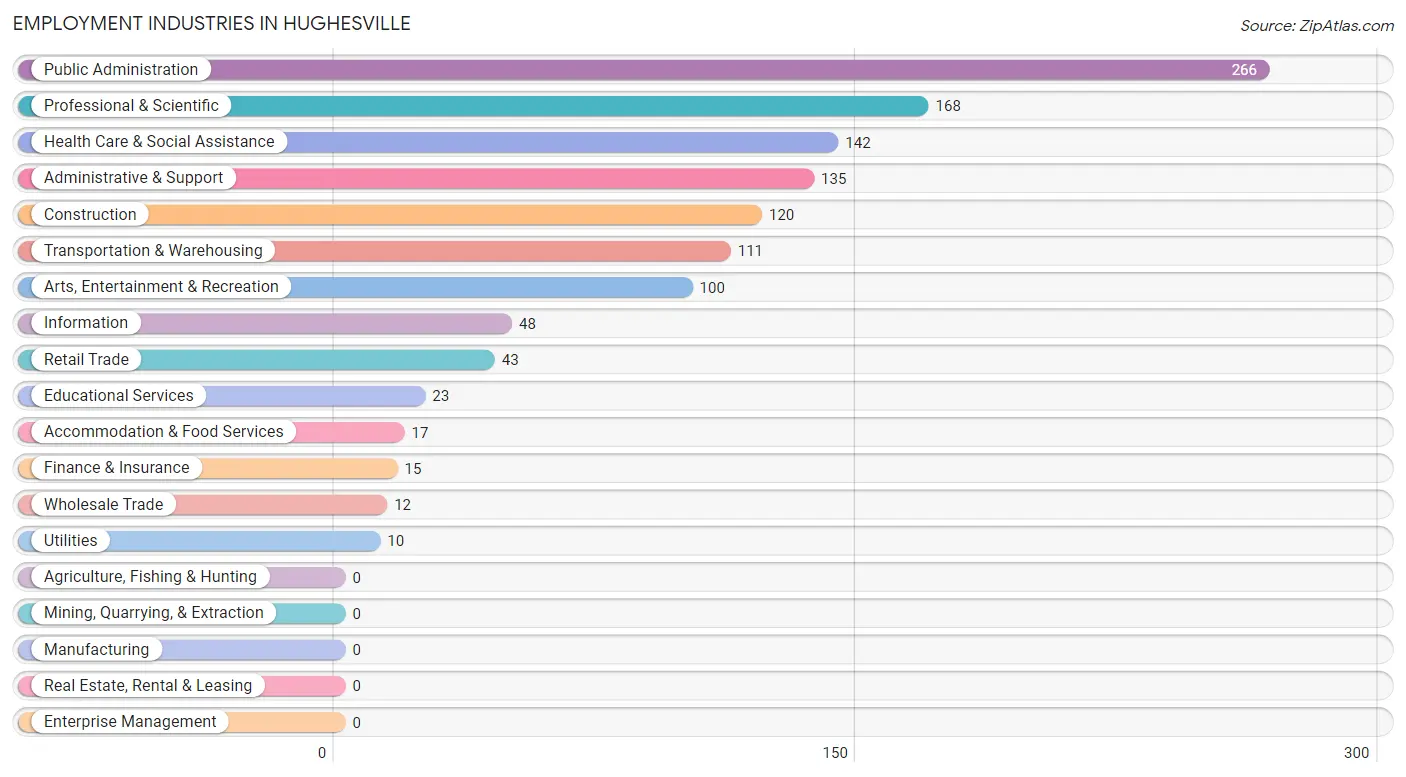
Employment Industries in Hughesville
The major employment industries in Hughesville include Public Administration (266 | 21.4%), Professional & Scientific (168 | 13.5%), Health Care & Social Assistance (142 | 11.4%), Administrative & Support (135 | 10.9%), and Construction (120 | 9.7%).
Employment Industries by Sex in Hughesville
The Hughesville industries that see more men than women are Wholesale Trade (100.0%), Utilities (100.0%), and Information (100.0%), whereas the industries that tend to have a higher number of women are Finance & Insurance (100.0%), Health Care & Social Assistance (88.0%), and Arts, Entertainment & Recreation (87.0%).
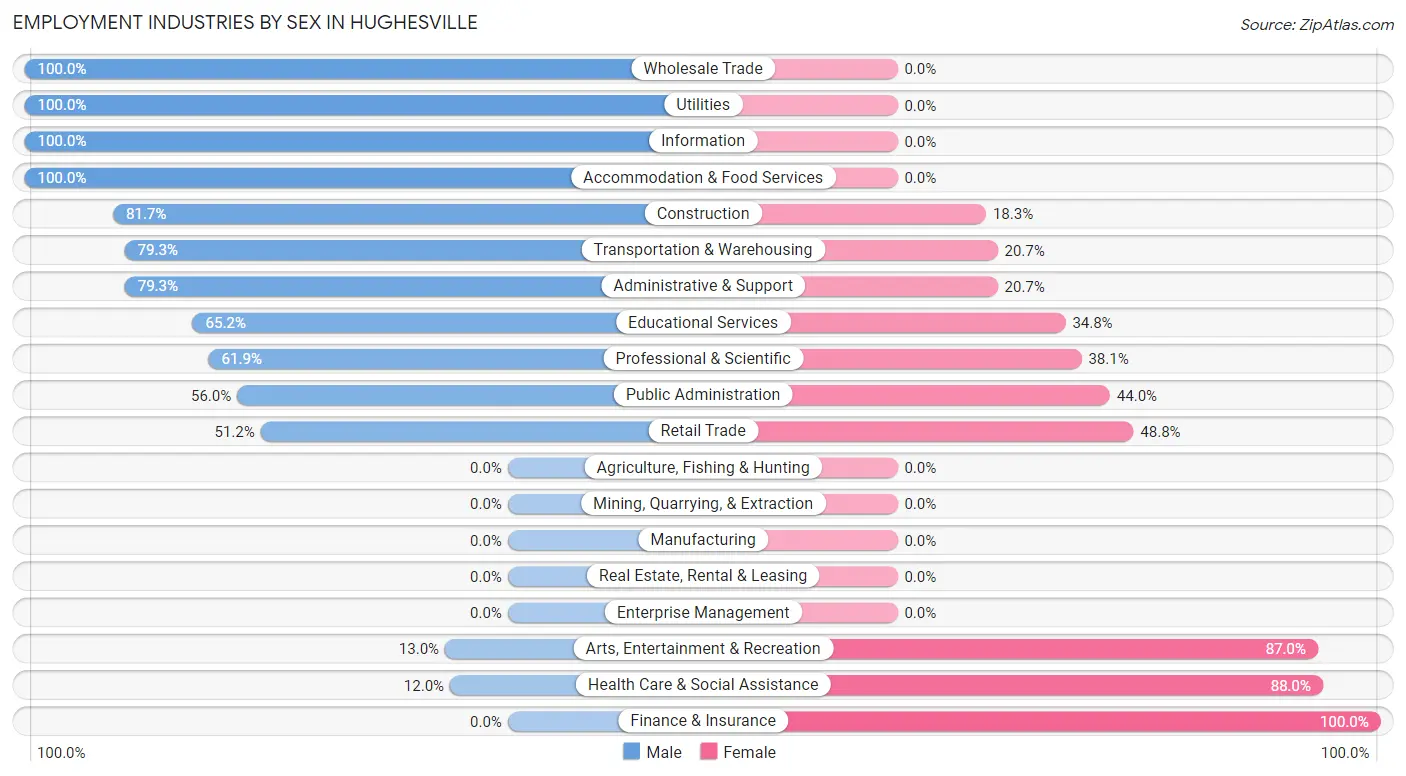
| Industry | Male | Female |
| Agriculture, Fishing & Hunting | 0 (0.0%) | 0 (0.0%) |
| Mining, Quarrying, & Extraction | 0 (0.0%) | 0 (0.0%) |
| Construction | 98 (81.7%) | 22 (18.3%) |
| Manufacturing | 0 (0.0%) | 0 (0.0%) |
| Wholesale Trade | 12 (100.0%) | 0 (0.0%) |
| Retail Trade | 22 (51.2%) | 21 (48.8%) |
| Transportation & Warehousing | 88 (79.3%) | 23 (20.7%) |
| Utilities | 10 (100.0%) | 0 (0.0%) |
| Information | 48 (100.0%) | 0 (0.0%) |
| Finance & Insurance | 0 (0.0%) | 15 (100.0%) |
| Real Estate, Rental & Leasing | 0 (0.0%) | 0 (0.0%) |
| Professional & Scientific | 104 (61.9%) | 64 (38.1%) |
| Enterprise Management | 0 (0.0%) | 0 (0.0%) |
| Administrative & Support | 107 (79.3%) | 28 (20.7%) |
| Educational Services | 15 (65.2%) | 8 (34.8%) |
| Health Care & Social Assistance | 17 (12.0%) | 125 (88.0%) |
| Arts, Entertainment & Recreation | 13 (13.0%) | 87 (87.0%) |
| Accommodation & Food Services | 17 (100.0%) | 0 (0.0%) |
| Public Administration | 149 (56.0%) | 117 (44.0%) |
| Total | 710 (57.2%) | 532 (42.8%) |
Education in Hughesville
School Enrollment in Hughesville
The most common levels of schooling among the 370 students in Hughesville are elementary school (122 | 33.0%), college / undergraduate (97 | 26.2%), and high school (69 | 18.6%).
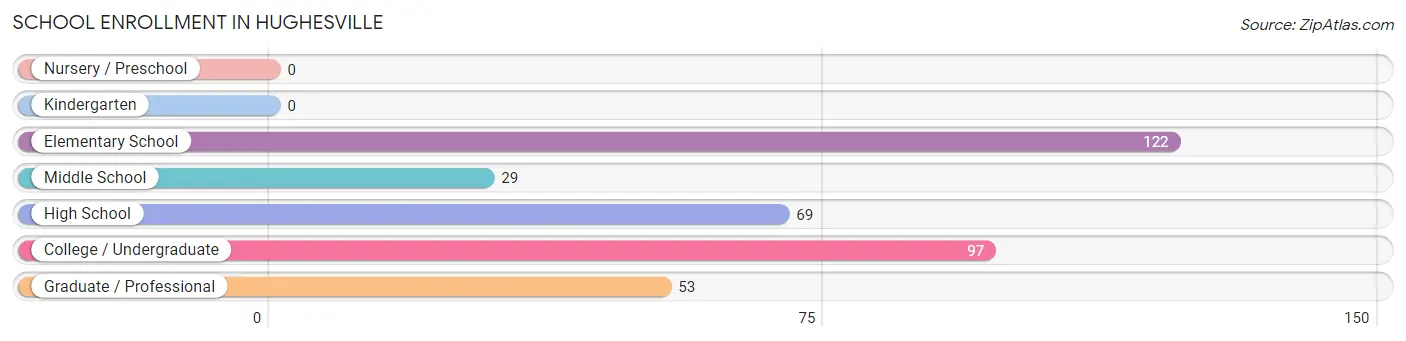
| School Level | # Students | % Students |
| Nursery / Preschool | 0 | 0.0% |
| Kindergarten | 0 | 0.0% |
| Elementary School | 122 | 33.0% |
| Middle School | 29 | 7.8% |
| High School | 69 | 18.6% |
| College / Undergraduate | 97 | 26.2% |
| Graduate / Professional | 53 | 14.3% |
| Total | 370 | 100.0% |
School Enrollment by Age by Funding Source in Hughesville
Out of a total of 370 students who are enrolled in schools in Hughesville, 71 (19.2%) attend a private institution, while the remaining 299 (80.8%) are enrolled in public schools. The age group of 18 to 19 year olds has the highest likelihood of being enrolled in private schools, with 8 (42.1% in the age bracket) enrolled. Conversely, the age group of 5 to 9 year old has the lowest likelihood of being enrolled in a private school, with 69 (100.0% in the age bracket) attending a public institution.
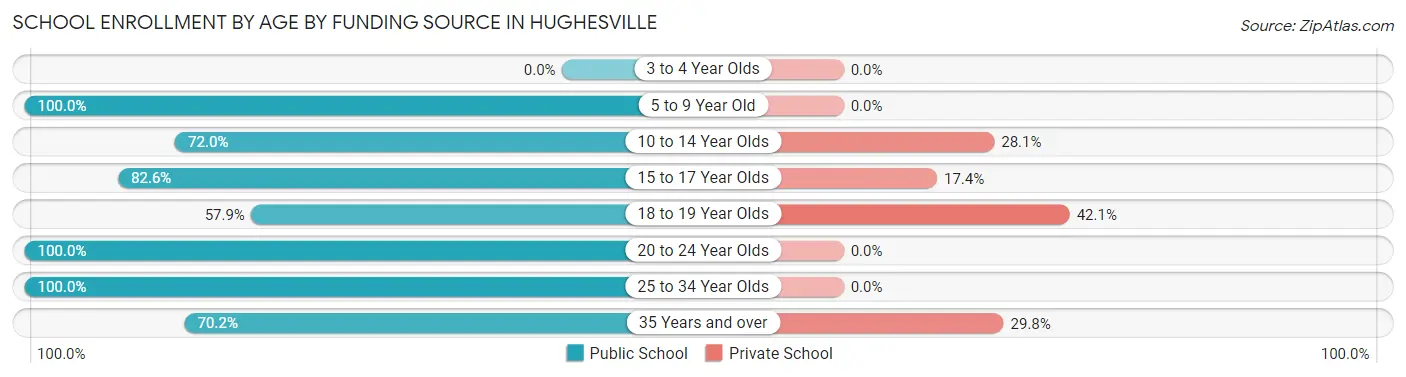
| Age Bracket | Public School | Private School |
| 3 to 4 Year Olds | 0 (0.0%) | 0 (0.0%) |
| 5 to 9 Year Old | 69 (100.0%) | 0 (0.0%) |
| 10 to 14 Year Olds | 59 (72.0%) | 23 (28.1%) |
| 15 to 17 Year Olds | 57 (82.6%) | 12 (17.4%) |
| 18 to 19 Year Olds | 11 (57.9%) | 8 (42.1%) |
| 20 to 24 Year Olds | 19 (100.0%) | 0 (0.0%) |
| 25 to 34 Year Olds | 18 (100.0%) | 0 (0.0%) |
| 35 Years and over | 66 (70.2%) | 28 (29.8%) |
| Total | 299 (80.8%) | 71 (19.2%) |
Educational Attainment by Field of Study in Hughesville
Business (152 | 24.3%), science & technology (94 | 15.0%), computers & mathematics (64 | 10.2%), bio, nature & agricultural (61 | 9.7%), and engineering (47 | 7.5%) are the most common fields of study among 626 individuals in Hughesville who have obtained a bachelor's degree or higher.
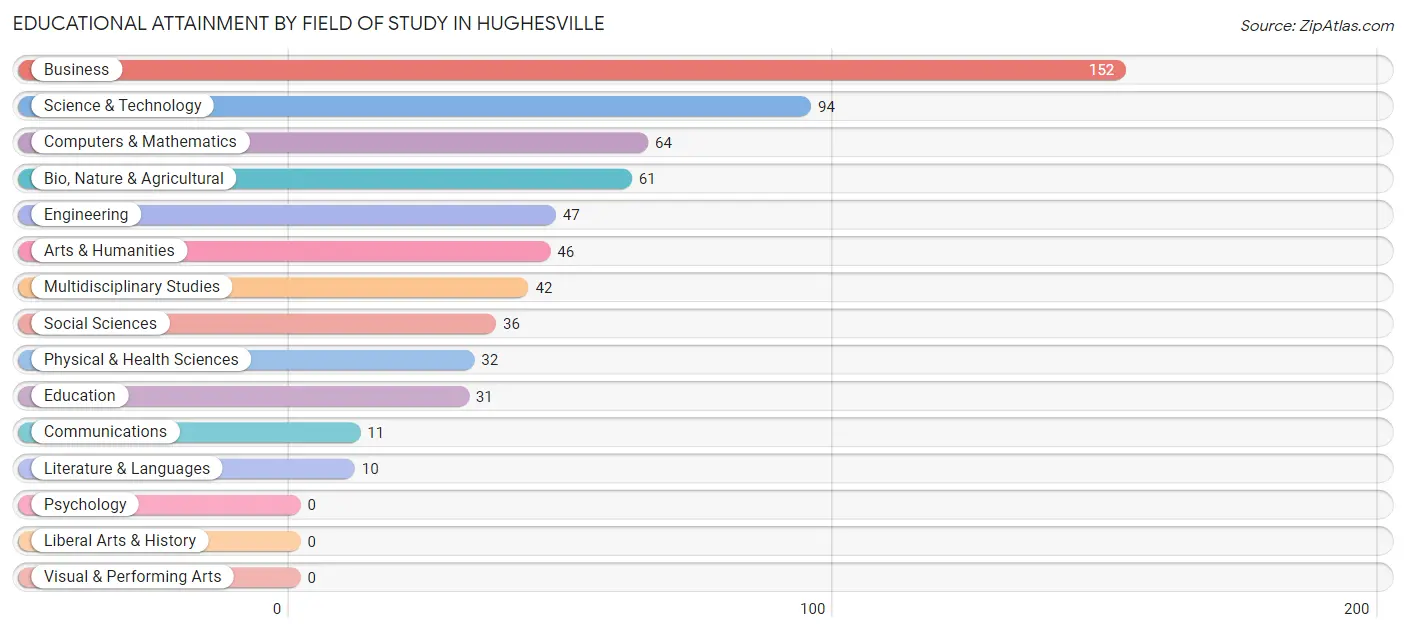
| Field of Study | # Graduates | % Graduates |
| Computers & Mathematics | 64 | 10.2% |
| Bio, Nature & Agricultural | 61 | 9.7% |
| Physical & Health Sciences | 32 | 5.1% |
| Psychology | 0 | 0.0% |
| Social Sciences | 36 | 5.8% |
| Engineering | 47 | 7.5% |
| Multidisciplinary Studies | 42 | 6.7% |
| Science & Technology | 94 | 15.0% |
| Business | 152 | 24.3% |
| Education | 31 | 5.0% |
| Literature & Languages | 10 | 1.6% |
| Liberal Arts & History | 0 | 0.0% |
| Visual & Performing Arts | 0 | 0.0% |
| Communications | 11 | 1.8% |
| Arts & Humanities | 46 | 7.3% |
| Total | 626 | 100.0% |
Transportation & Commute in Hughesville
Vehicle Availability by Sex in Hughesville
The most prevalent vehicle ownership categories in Hughesville are males with 3 vehicles (224, accounting for 32.3%) and females with 3 vehicles (159, making up 44.3%).
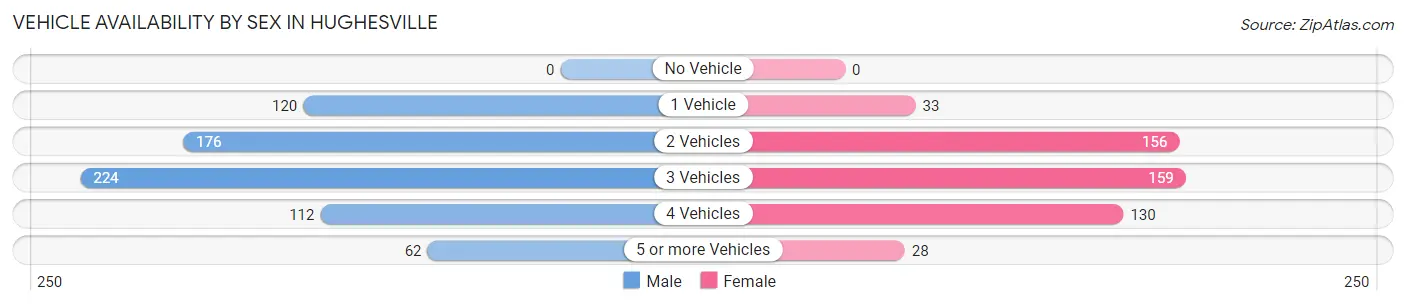
| Vehicles Available | Male | Female |
| No Vehicle | 0 (0.0%) | 0 (0.0%) |
| 1 Vehicle | 120 (17.3%) | 33 (6.5%) |
| 2 Vehicles | 176 (25.4%) | 156 (30.8%) |
| 3 Vehicles | 224 (32.3%) | 159 (31.4%) |
| 4 Vehicles | 112 (16.1%) | 130 (25.7%) |
| 5 or more Vehicles | 62 (8.9%) | 28 (5.5%) |
| Total | 694 (100.0%) | 506 (100.0%) |
Commute Time in Hughesville
The most frequently occuring commute durations in Hughesville are 60 to 89 minutes (247 commuters, 23.6%), 45 to 59 minutes (151 commuters, 14.4%), and 90 or more minutes (126 commuters, 12.0%).
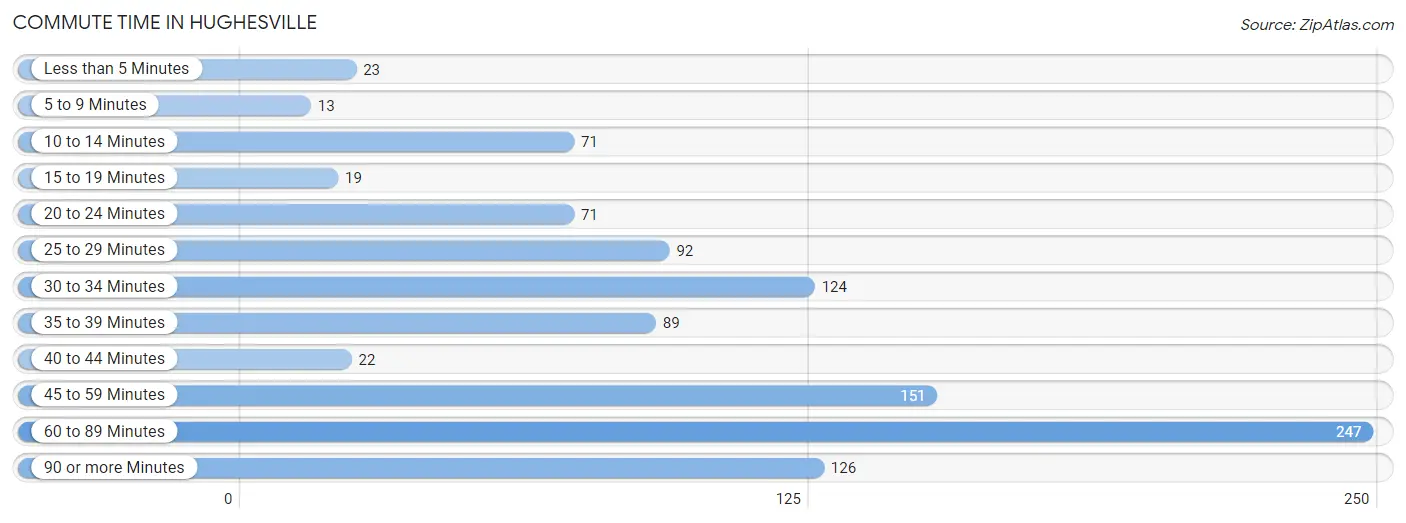
| Commute Time | # Commuters | % Commuters |
| Less than 5 Minutes | 23 | 2.2% |
| 5 to 9 Minutes | 13 | 1.2% |
| 10 to 14 Minutes | 71 | 6.8% |
| 15 to 19 Minutes | 19 | 1.8% |
| 20 to 24 Minutes | 71 | 6.8% |
| 25 to 29 Minutes | 92 | 8.8% |
| 30 to 34 Minutes | 124 | 11.8% |
| 35 to 39 Minutes | 89 | 8.5% |
| 40 to 44 Minutes | 22 | 2.1% |
| 45 to 59 Minutes | 151 | 14.4% |
| 60 to 89 Minutes | 247 | 23.6% |
| 90 or more Minutes | 126 | 12.0% |
Commute Time by Sex in Hughesville
The most common commute times in Hughesville are 60 to 89 minutes (214 commuters, 33.2%) for males and 90 or more minutes (71 commuters, 17.6%) for females.
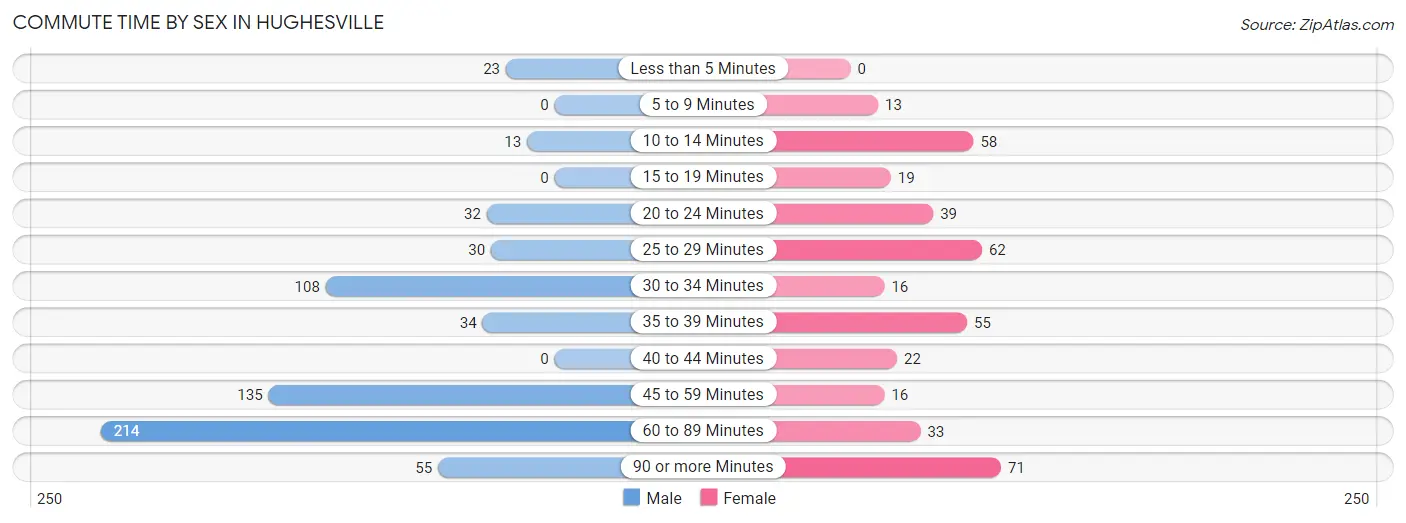
| Commute Time | Male | Female |
| Less than 5 Minutes | 23 (3.6%) | 0 (0.0%) |
| 5 to 9 Minutes | 0 (0.0%) | 13 (3.2%) |
| 10 to 14 Minutes | 13 (2.0%) | 58 (14.4%) |
| 15 to 19 Minutes | 0 (0.0%) | 19 (4.7%) |
| 20 to 24 Minutes | 32 (5.0%) | 39 (9.7%) |
| 25 to 29 Minutes | 30 (4.7%) | 62 (15.3%) |
| 30 to 34 Minutes | 108 (16.8%) | 16 (4.0%) |
| 35 to 39 Minutes | 34 (5.3%) | 55 (13.6%) |
| 40 to 44 Minutes | 0 (0.0%) | 22 (5.4%) |
| 45 to 59 Minutes | 135 (21.0%) | 16 (4.0%) |
| 60 to 89 Minutes | 214 (33.2%) | 33 (8.2%) |
| 90 or more Minutes | 55 (8.5%) | 71 (17.6%) |
Time of Departure to Work by Sex in Hughesville
The most frequent times of departure to work in Hughesville are 12:00 AM to 4:59 AM (131, 20.3%) for males and 8:00 AM to 8:29 AM (71, 17.6%) for females.
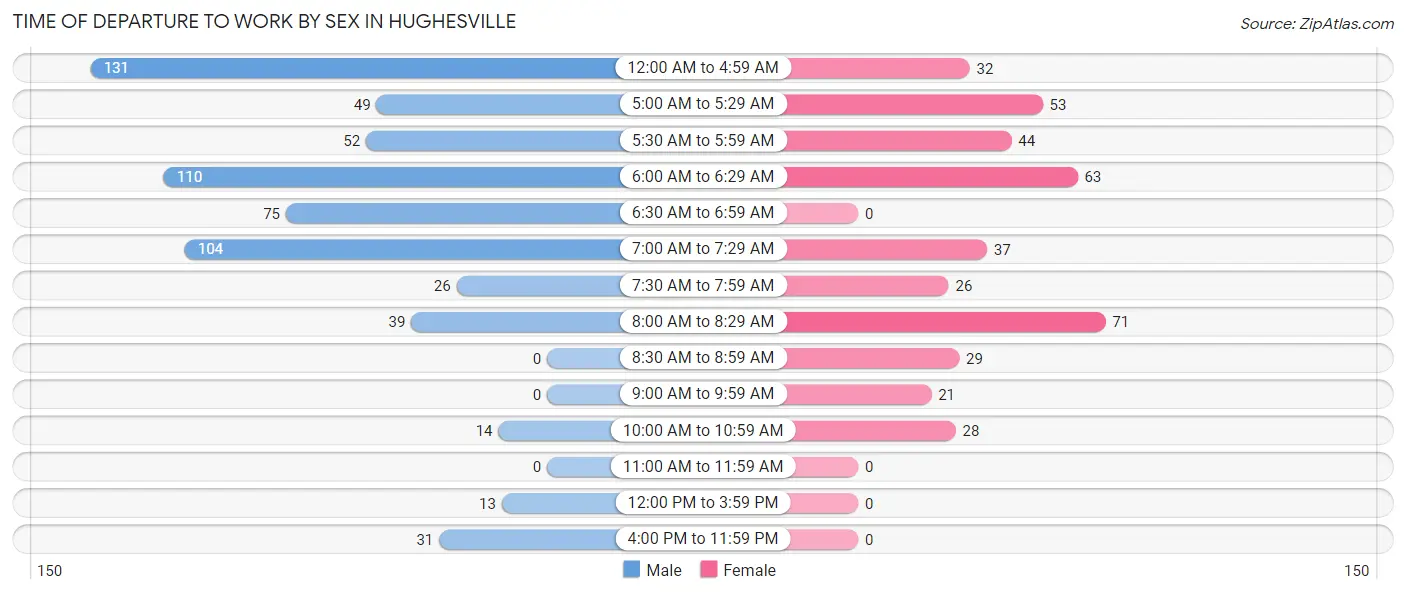
| Time of Departure | Male | Female |
| 12:00 AM to 4:59 AM | 131 (20.3%) | 32 (7.9%) |
| 5:00 AM to 5:29 AM | 49 (7.6%) | 53 (13.1%) |
| 5:30 AM to 5:59 AM | 52 (8.1%) | 44 (10.9%) |
| 6:00 AM to 6:29 AM | 110 (17.1%) | 63 (15.6%) |
| 6:30 AM to 6:59 AM | 75 (11.7%) | 0 (0.0%) |
| 7:00 AM to 7:29 AM | 104 (16.2%) | 37 (9.2%) |
| 7:30 AM to 7:59 AM | 26 (4.0%) | 26 (6.4%) |
| 8:00 AM to 8:29 AM | 39 (6.1%) | 71 (17.6%) |
| 8:30 AM to 8:59 AM | 0 (0.0%) | 29 (7.2%) |
| 9:00 AM to 9:59 AM | 0 (0.0%) | 21 (5.2%) |
| 10:00 AM to 10:59 AM | 14 (2.2%) | 28 (6.9%) |
| 11:00 AM to 11:59 AM | 0 (0.0%) | 0 (0.0%) |
| 12:00 PM to 3:59 PM | 13 (2.0%) | 0 (0.0%) |
| 4:00 PM to 11:59 PM | 31 (4.8%) | 0 (0.0%) |
| Total | 644 (100.0%) | 404 (100.0%) |
Housing Occupancy in Hughesville
Occupancy by Ownership in Hughesville
Of the total 892 dwellings in Hughesville, owner-occupied units account for 856 (96.0%), while renter-occupied units make up 36 (4.0%).
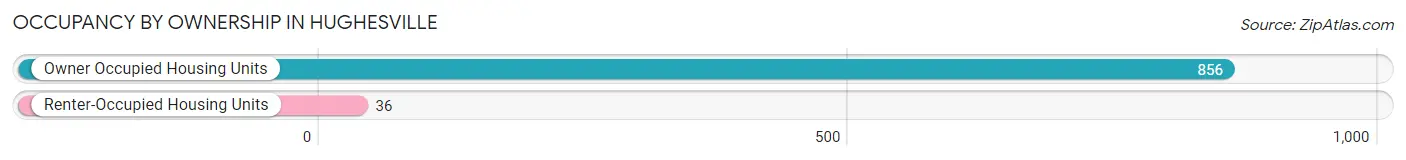
| Occupancy | # Housing Units | % Housing Units |
| Owner Occupied Housing Units | 856 | 96.0% |
| Renter-Occupied Housing Units | 36 | 4.0% |
| Total Occupied Housing Units | 892 | 100.0% |
Occupancy by Household Size in Hughesville
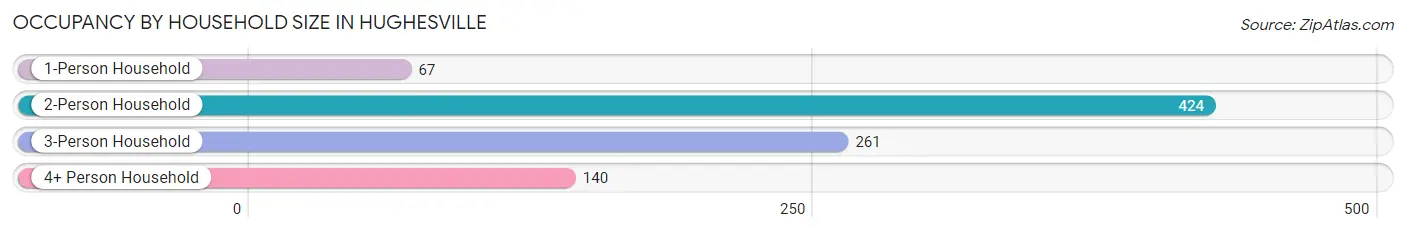
| Household Size | # Housing Units | % Housing Units |
| 1-Person Household | 67 | 7.5% |
| 2-Person Household | 424 | 47.5% |
| 3-Person Household | 261 | 29.3% |
| 4+ Person Household | 140 | 15.7% |
| Total Housing Units | 892 | 100.0% |
Occupancy by Ownership by Household Size in Hughesville
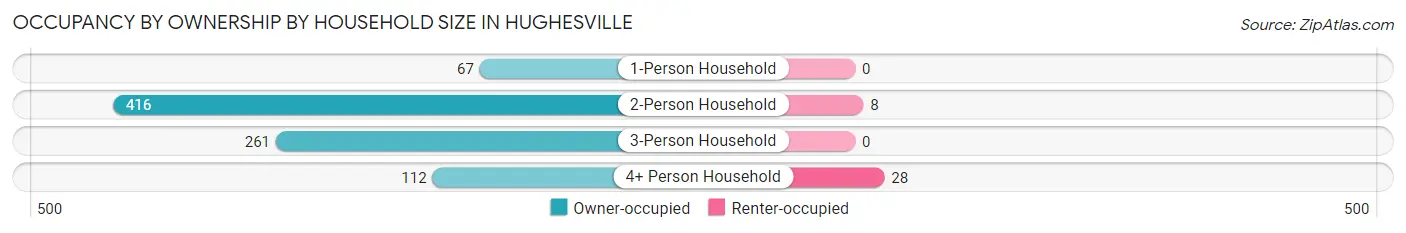
| Household Size | Owner-occupied | Renter-occupied |
| 1-Person Household | 67 (100.0%) | 0 (0.0%) |
| 2-Person Household | 416 (98.1%) | 8 (1.9%) |
| 3-Person Household | 261 (100.0%) | 0 (0.0%) |
| 4+ Person Household | 112 (80.0%) | 28 (20.0%) |
| Total Housing Units | 856 (96.0%) | 36 (4.0%) |
Occupancy by Educational Attainment in Hughesville
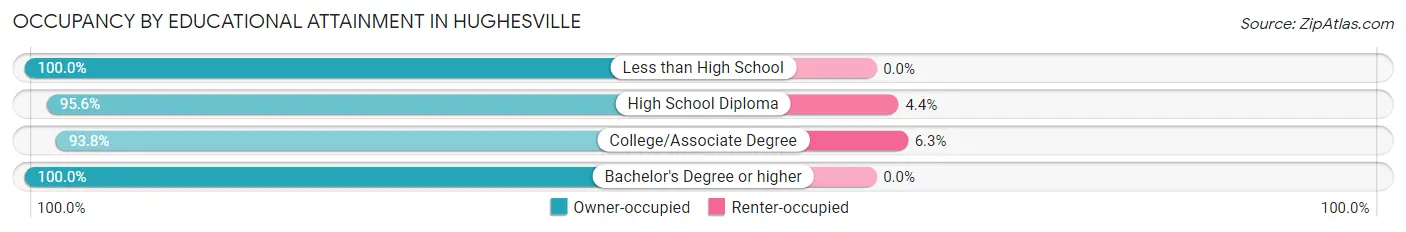
| Household Size | Owner-occupied | Renter-occupied |
| Less than High School | 9 (100.0%) | 0 (0.0%) |
| High School Diploma | 173 (95.6%) | 8 (4.4%) |
| College/Associate Degree | 420 (93.8%) | 28 (6.2%) |
| Bachelor's Degree or higher | 254 (100.0%) | 0 (0.0%) |
Occupancy by Age of Householder in Hughesville
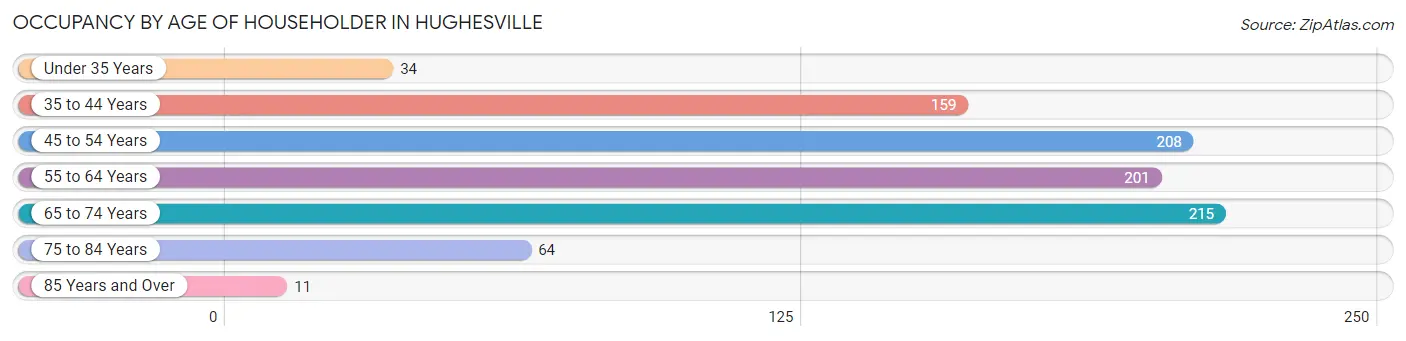
| Age Bracket | # Households | % Households |
| Under 35 Years | 34 | 3.8% |
| 35 to 44 Years | 159 | 17.8% |
| 45 to 54 Years | 208 | 23.3% |
| 55 to 64 Years | 201 | 22.5% |
| 65 to 74 Years | 215 | 24.1% |
| 75 to 84 Years | 64 | 7.2% |
| 85 Years and Over | 11 | 1.2% |
| Total | 892 | 100.0% |
Housing Finances in Hughesville
Median Income by Occupancy in Hughesville
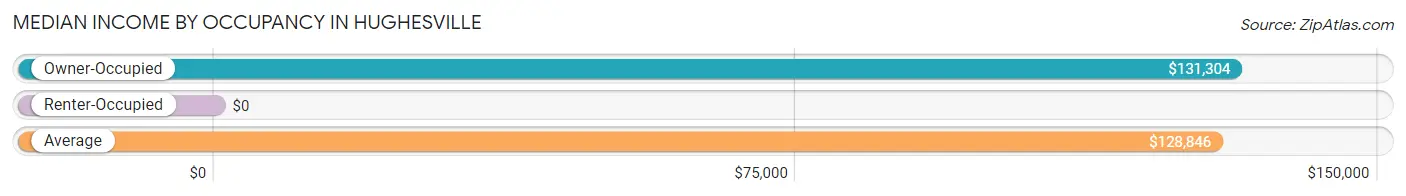
| Occupancy Type | # Households | Median Income |
| Owner-Occupied | 856 (96.0%) | $131,304 |
| Renter-Occupied | 36 (4.0%) | $0 |
| Average | 892 (100.0%) | $128,846 |
Occupancy by Householder Income Bracket in Hughesville
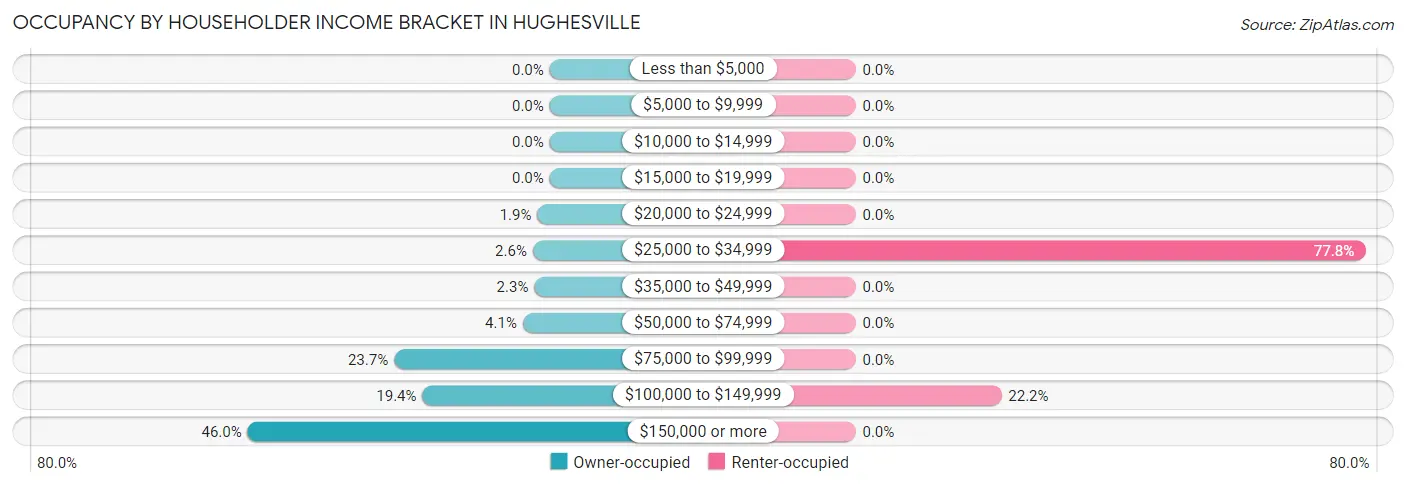
| Income Bracket | Owner-occupied | Renter-occupied |
| Less than $5,000 | 0 (0.0%) | 0 (0.0%) |
| $5,000 to $9,999 | 0 (0.0%) | 0 (0.0%) |
| $10,000 to $14,999 | 0 (0.0%) | 0 (0.0%) |
| $15,000 to $19,999 | 0 (0.0%) | 0 (0.0%) |
| $20,000 to $24,999 | 16 (1.9%) | 0 (0.0%) |
| $25,000 to $34,999 | 22 (2.6%) | 28 (77.8%) |
| $35,000 to $49,999 | 20 (2.3%) | 0 (0.0%) |
| $50,000 to $74,999 | 35 (4.1%) | 0 (0.0%) |
| $75,000 to $99,999 | 203 (23.7%) | 0 (0.0%) |
| $100,000 to $149,999 | 166 (19.4%) | 8 (22.2%) |
| $150,000 or more | 394 (46.0%) | 0 (0.0%) |
| Total | 856 (100.0%) | 36 (100.0%) |
Monthly Housing Cost Tiers in Hughesville
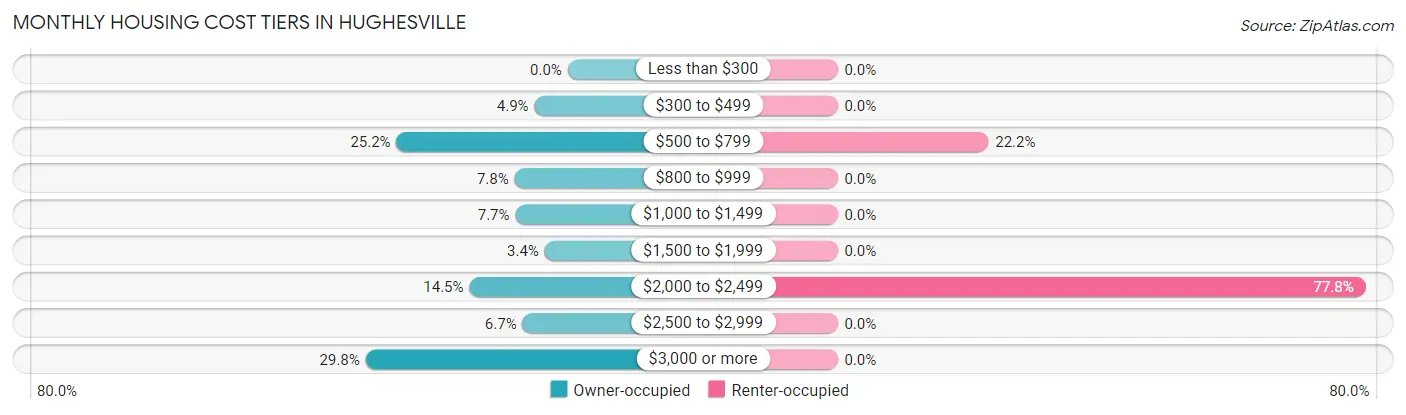
| Monthly Cost | Owner-occupied | Renter-occupied |
| Less than $300 | 0 (0.0%) | 0 (0.0%) |
| $300 to $499 | 42 (4.9%) | 0 (0.0%) |
| $500 to $799 | 216 (25.2%) | 8 (22.2%) |
| $800 to $999 | 67 (7.8%) | 0 (0.0%) |
| $1,000 to $1,499 | 66 (7.7%) | 0 (0.0%) |
| $1,500 to $1,999 | 29 (3.4%) | 0 (0.0%) |
| $2,000 to $2,499 | 124 (14.5%) | 28 (77.8%) |
| $2,500 to $2,999 | 57 (6.7%) | 0 (0.0%) |
| $3,000 or more | 255 (29.8%) | 0 (0.0%) |
| Total | 856 (100.0%) | 36 (100.0%) |
Physical Housing Characteristics in Hughesville
Housing Structures in Hughesville
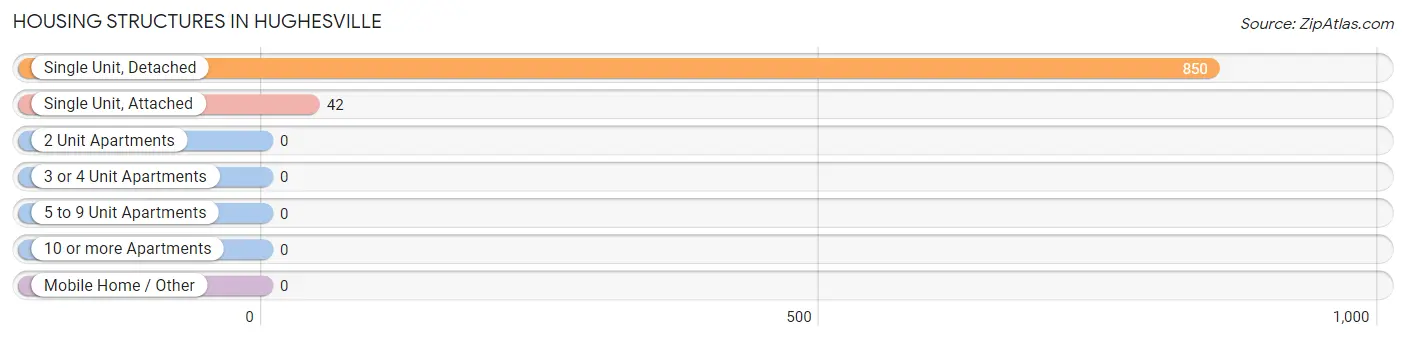
| Structure Type | # Housing Units | % Housing Units |
| Single Unit, Detached | 850 | 95.3% |
| Single Unit, Attached | 42 | 4.7% |
| 2 Unit Apartments | 0 | 0.0% |
| 3 or 4 Unit Apartments | 0 | 0.0% |
| 5 to 9 Unit Apartments | 0 | 0.0% |
| 10 or more Apartments | 0 | 0.0% |
| Mobile Home / Other | 0 | 0.0% |
| Total | 892 | 100.0% |
Housing Structures by Occupancy in Hughesville
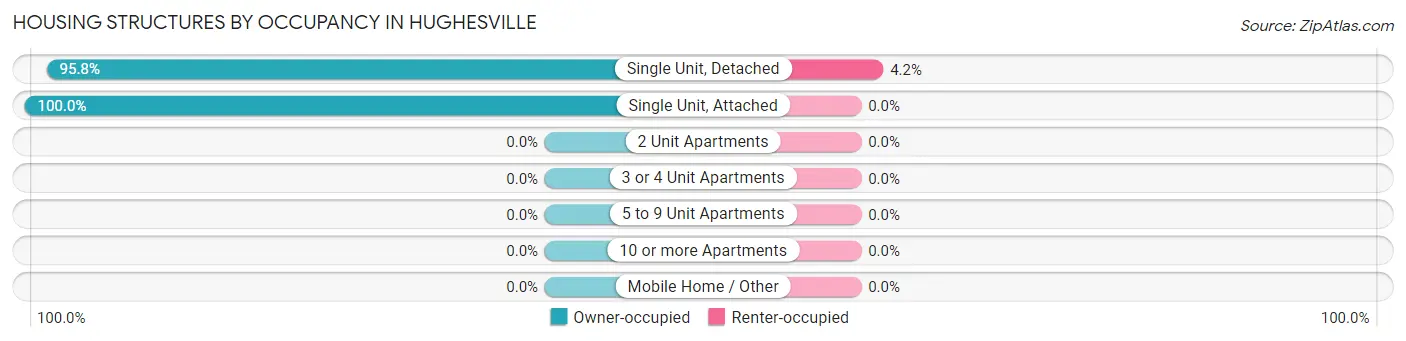
| Structure Type | Owner-occupied | Renter-occupied |
| Single Unit, Detached | 814 (95.8%) | 36 (4.2%) |
| Single Unit, Attached | 42 (100.0%) | 0 (0.0%) |
| 2 Unit Apartments | 0 (0.0%) | 0 (0.0%) |
| 3 or 4 Unit Apartments | 0 (0.0%) | 0 (0.0%) |
| 5 to 9 Unit Apartments | 0 (0.0%) | 0 (0.0%) |
| 10 or more Apartments | 0 (0.0%) | 0 (0.0%) |
| Mobile Home / Other | 0 (0.0%) | 0 (0.0%) |
| Total | 856 (96.0%) | 36 (4.0%) |
Housing Structures by Number of Rooms in Hughesville
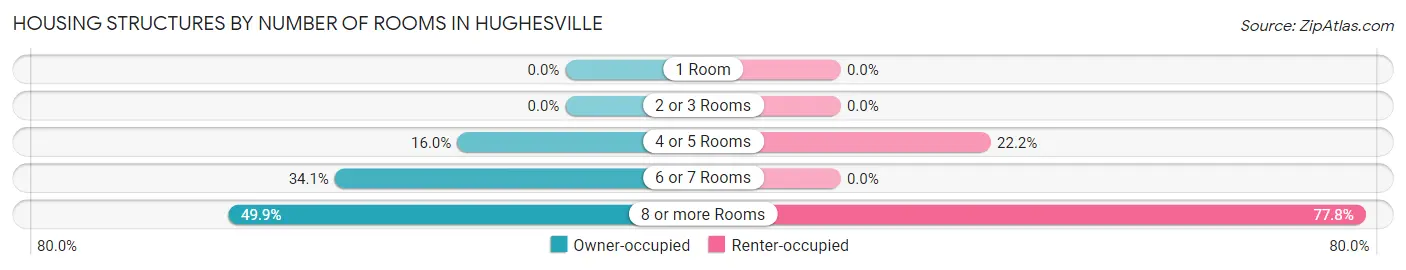
| Number of Rooms | Owner-occupied | Renter-occupied |
| 1 Room | 0 (0.0%) | 0 (0.0%) |
| 2 or 3 Rooms | 0 (0.0%) | 0 (0.0%) |
| 4 or 5 Rooms | 137 (16.0%) | 8 (22.2%) |
| 6 or 7 Rooms | 292 (34.1%) | 0 (0.0%) |
| 8 or more Rooms | 427 (49.9%) | 28 (77.8%) |
| Total | 856 (100.0%) | 36 (100.0%) |
Housing Structure by Heating Type in Hughesville
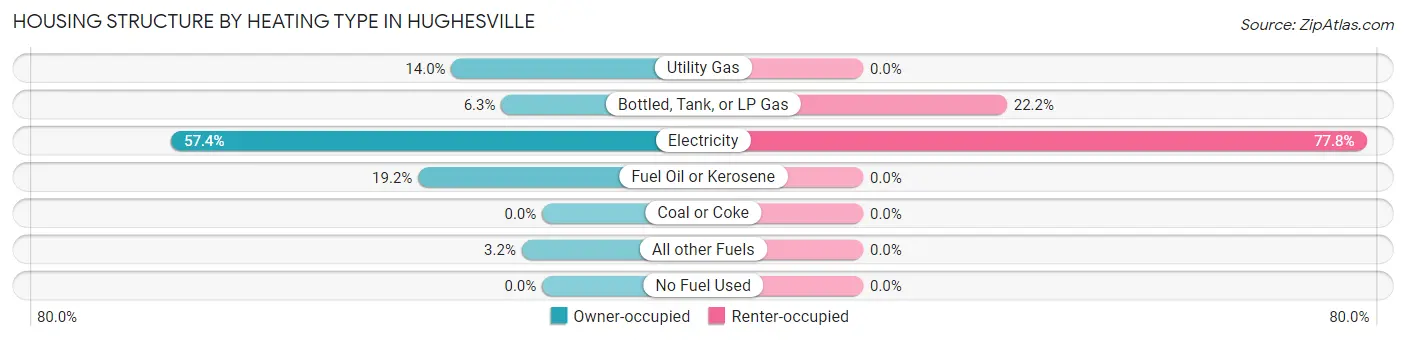
| Heating Type | Owner-occupied | Renter-occupied |
| Utility Gas | 120 (14.0%) | 0 (0.0%) |
| Bottled, Tank, or LP Gas | 54 (6.3%) | 8 (22.2%) |
| Electricity | 491 (57.4%) | 28 (77.8%) |
| Fuel Oil or Kerosene | 164 (19.2%) | 0 (0.0%) |
| Coal or Coke | 0 (0.0%) | 0 (0.0%) |
| All other Fuels | 27 (3.2%) | 0 (0.0%) |
| No Fuel Used | 0 (0.0%) | 0 (0.0%) |
| Total | 856 (100.0%) | 36 (100.0%) |
Household Vehicle Usage in Hughesville
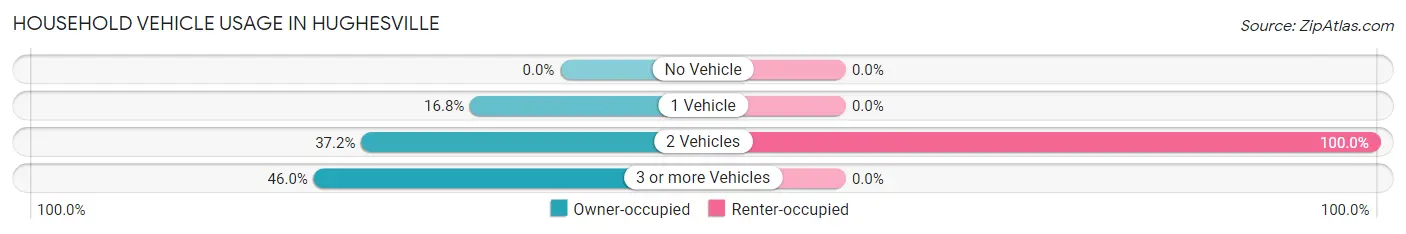
| Vehicles per Household | Owner-occupied | Renter-occupied |
| No Vehicle | 0 (0.0%) | 0 (0.0%) |
| 1 Vehicle | 144 (16.8%) | 0 (0.0%) |
| 2 Vehicles | 318 (37.1%) | 36 (100.0%) |
| 3 or more Vehicles | 394 (46.0%) | 0 (0.0%) |
| Total | 856 (100.0%) | 36 (100.0%) |
Real Estate & Mortgages in Hughesville
Real Estate and Mortgage Overview in Hughesville
| Characteristic | Without Mortgage | With Mortgage |
| Housing Units | 366 | 490 |
| Median Property Value | $522,000 | $552,600 |
| Median Household Income | $93,000 | $294 |
| Monthly Housing Costs | $757 | $255 |
| Real Estate Taxes | $4,657 | $24 |
Property Value by Mortgage Status in Hughesville
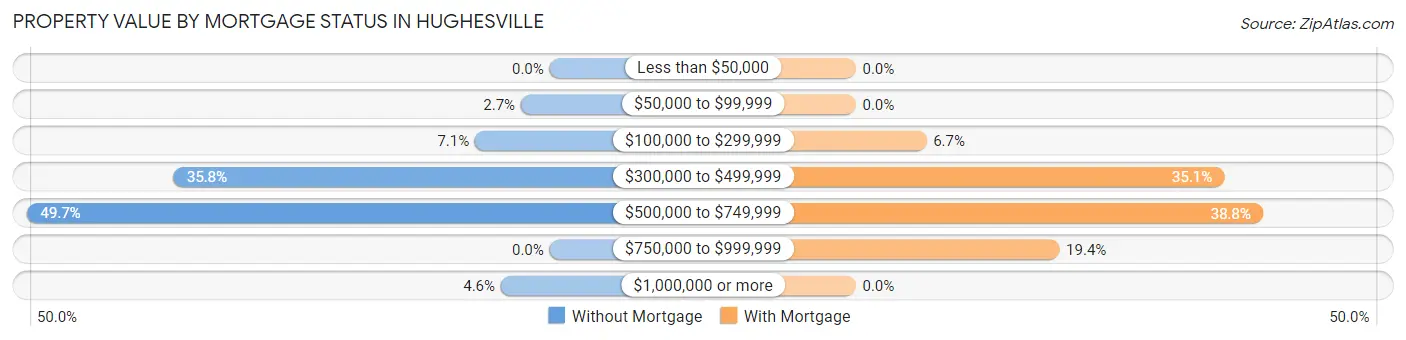
| Property Value | Without Mortgage | With Mortgage |
| Less than $50,000 | 0 (0.0%) | 0 (0.0%) |
| $50,000 to $99,999 | 10 (2.7%) | 0 (0.0%) |
| $100,000 to $299,999 | 26 (7.1%) | 33 (6.7%) |
| $300,000 to $499,999 | 131 (35.8%) | 172 (35.1%) |
| $500,000 to $749,999 | 182 (49.7%) | 190 (38.8%) |
| $750,000 to $999,999 | 0 (0.0%) | 95 (19.4%) |
| $1,000,000 or more | 17 (4.6%) | 0 (0.0%) |
| Total | 366 (100.0%) | 490 (100.0%) |
Household Income by Mortgage Status in Hughesville
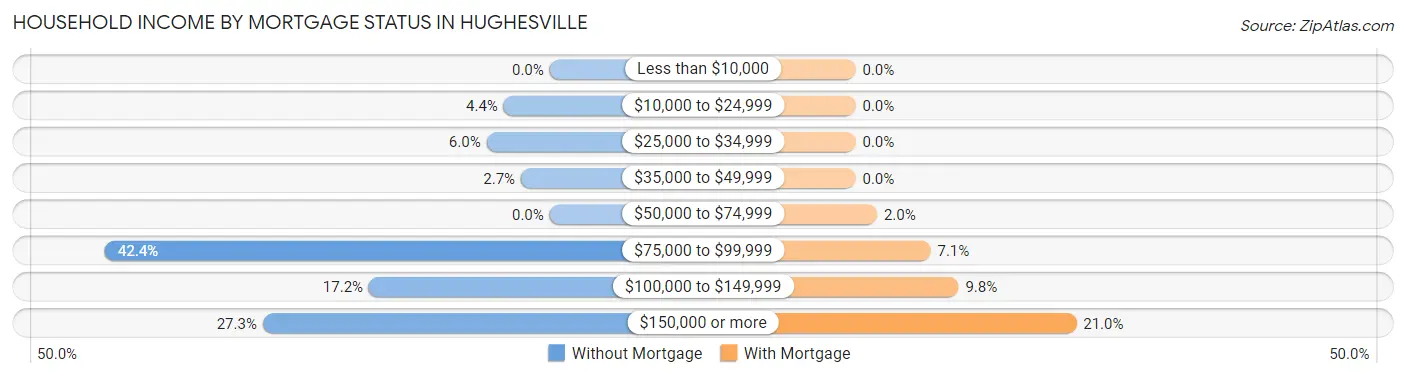
| Household Income | Without Mortgage | With Mortgage |
| Less than $10,000 | 0 (0.0%) | 0 (0.0%) |
| $10,000 to $24,999 | 16 (4.4%) | 0 (0.0%) |
| $25,000 to $34,999 | 22 (6.0%) | 0 (0.0%) |
| $35,000 to $49,999 | 10 (2.7%) | 0 (0.0%) |
| $50,000 to $74,999 | 0 (0.0%) | 10 (2.0%) |
| $75,000 to $99,999 | 155 (42.3%) | 35 (7.1%) |
| $100,000 to $149,999 | 63 (17.2%) | 48 (9.8%) |
| $150,000 or more | 100 (27.3%) | 103 (21.0%) |
| Total | 366 (100.0%) | 490 (100.0%) |
Property Value to Household Income Ratio in Hughesville
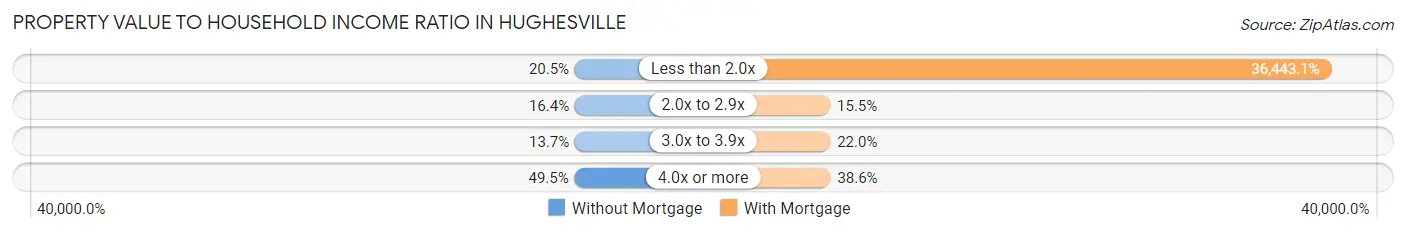
| Value-to-Income Ratio | Without Mortgage | With Mortgage |
| Less than 2.0x | 75 (20.5%) | 178,571 (36,443.1%) |
| 2.0x to 2.9x | 60 (16.4%) | 76 (15.5%) |
| 3.0x to 3.9x | 50 (13.7%) | 108 (22.0%) |
| 4.0x or more | 181 (49.4%) | 189 (38.6%) |
| Total | 366 (100.0%) | 490 (100.0%) |
Real Estate Taxes by Mortgage Status in Hughesville
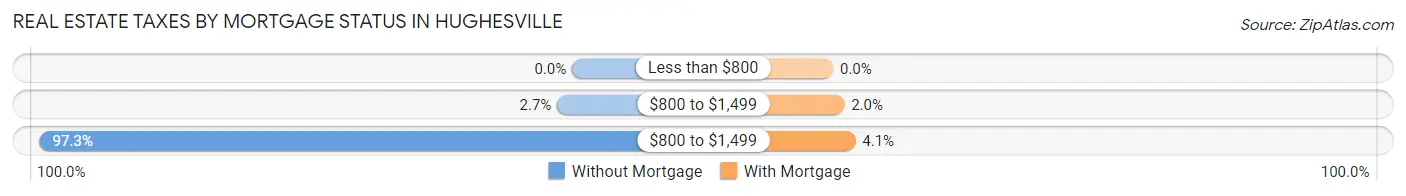
| Property Taxes | Without Mortgage | With Mortgage |
| Less than $800 | 0 (0.0%) | 0 (0.0%) |
| $800 to $1,499 | 10 (2.7%) | 10 (2.0%) |
| $800 to $1,499 | 356 (97.3%) | 20 (4.1%) |
| Total | 366 (100.0%) | 490 (100.0%) |
Health & Disability in Hughesville
Health Insurance Coverage by Age in Hughesville
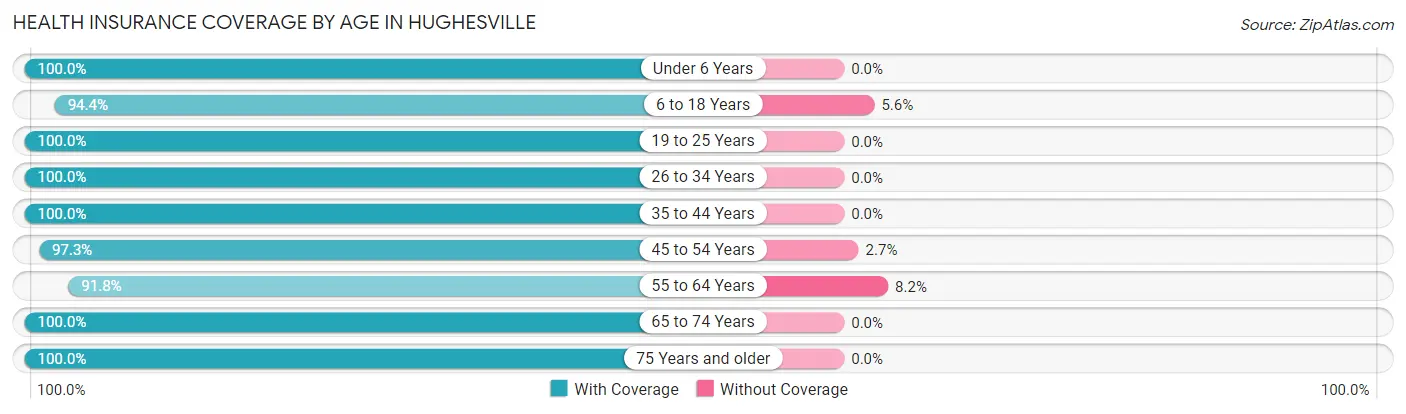
| Age Bracket | With Coverage | Without Coverage |
| Under 6 Years | 158 (100.0%) | 0 (0.0%) |
| 6 to 18 Years | 218 (94.4%) | 13 (5.6%) |
| 19 to 25 Years | 181 (100.0%) | 0 (0.0%) |
| 26 to 34 Years | 82 (100.0%) | 0 (0.0%) |
| 35 to 44 Years | 268 (100.0%) | 0 (0.0%) |
| 45 to 54 Years | 400 (97.3%) | 11 (2.7%) |
| 55 to 64 Years | 393 (91.8%) | 35 (8.2%) |
| 65 to 74 Years | 293 (100.0%) | 0 (0.0%) |
| 75 Years and older | 228 (100.0%) | 0 (0.0%) |
| Total | 2,221 (97.4%) | 59 (2.6%) |
Health Insurance Coverage by Citizenship Status in Hughesville
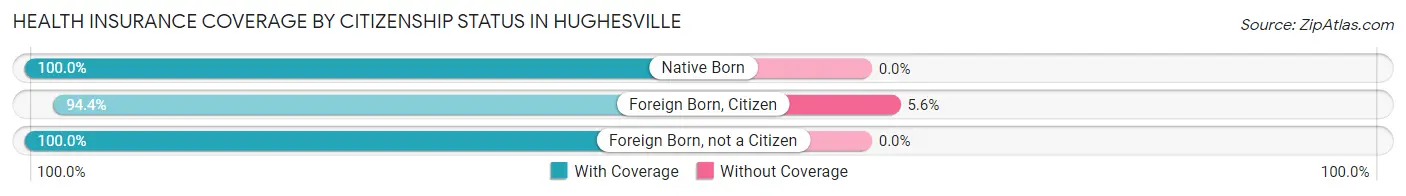
| Citizenship Status | With Coverage | Without Coverage |
| Native Born | 158 (100.0%) | 0 (0.0%) |
| Foreign Born, Citizen | 218 (94.4%) | 13 (5.6%) |
| Foreign Born, not a Citizen | 181 (100.0%) | 0 (0.0%) |
Health Insurance Coverage by Household Income in Hughesville
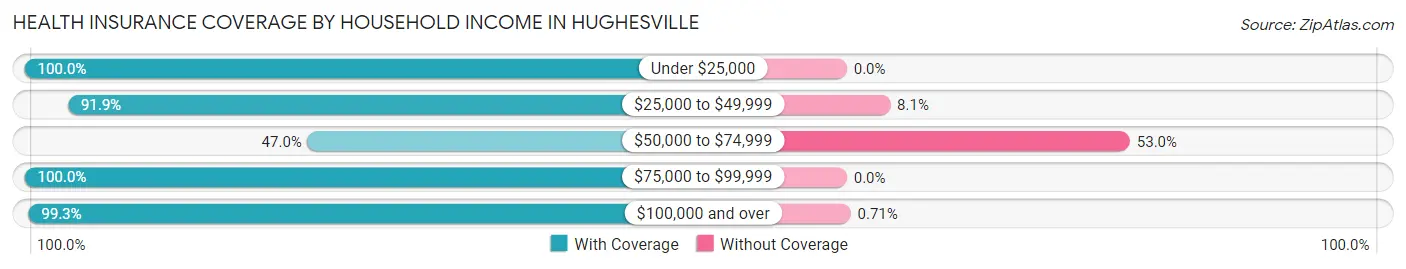
| Household Income | With Coverage | Without Coverage |
| Under $25,000 | 16 (100.0%) | 0 (0.0%) |
| $25,000 to $49,999 | 147 (91.9%) | 13 (8.1%) |
| $50,000 to $74,999 | 31 (47.0%) | 35 (53.0%) |
| $75,000 to $99,999 | 458 (100.0%) | 0 (0.0%) |
| $100,000 and over | 1,540 (99.3%) | 11 (0.7%) |
Public vs Private Health Insurance Coverage by Age in Hughesville
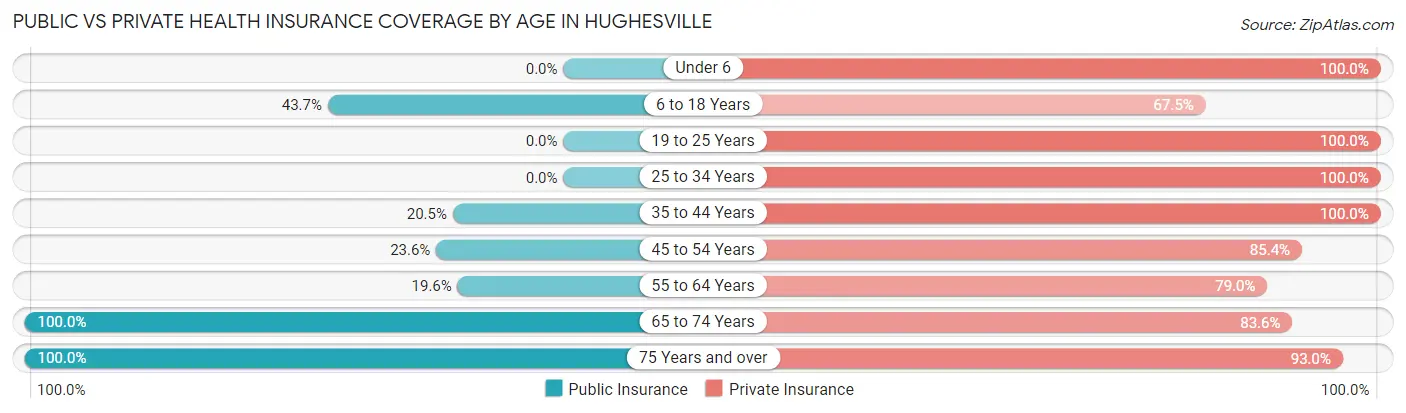
| Age Bracket | Public Insurance | Private Insurance |
| Under 6 | 0 (0.0%) | 158 (100.0%) |
| 6 to 18 Years | 101 (43.7%) | 156 (67.5%) |
| 19 to 25 Years | 0 (0.0%) | 181 (100.0%) |
| 25 to 34 Years | 0 (0.0%) | 82 (100.0%) |
| 35 to 44 Years | 55 (20.5%) | 268 (100.0%) |
| 45 to 54 Years | 97 (23.6%) | 351 (85.4%) |
| 55 to 64 Years | 84 (19.6%) | 338 (79.0%) |
| 65 to 74 Years | 293 (100.0%) | 245 (83.6%) |
| 75 Years and over | 228 (100.0%) | 212 (93.0%) |
| Total | 858 (37.6%) | 1,991 (87.3%) |
Disability Status by Sex by Age in Hughesville
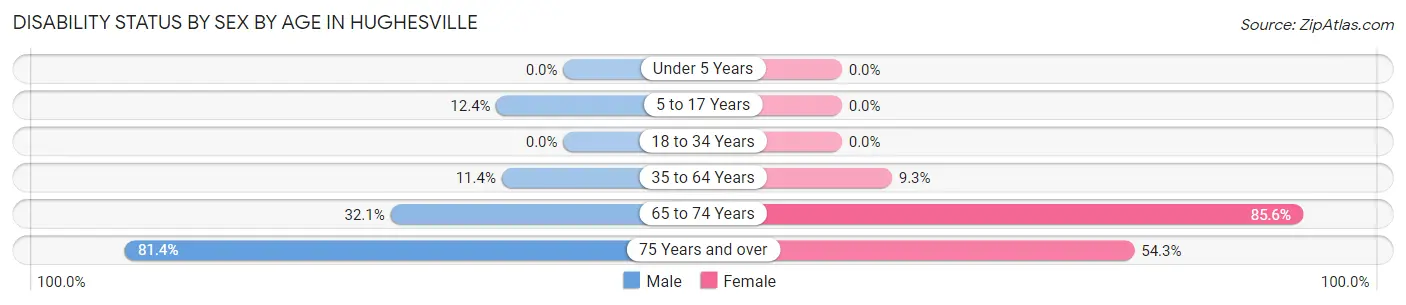
| Age Bracket | Male | Female |
| Under 5 Years | 0 (0.0%) | 0 (0.0%) |
| 5 to 17 Years | 22 (12.4%) | 0 (0.0%) |
| 18 to 34 Years | 0 (0.0%) | 0 (0.0%) |
| 35 to 64 Years | 65 (11.4%) | 50 (9.3%) |
| 65 to 74 Years | 34 (32.1%) | 160 (85.6%) |
| 75 Years and over | 157 (81.4%) | 19 (54.3%) |
Disability Class by Sex by Age in Hughesville
Disability Class: Hearing Difficulty
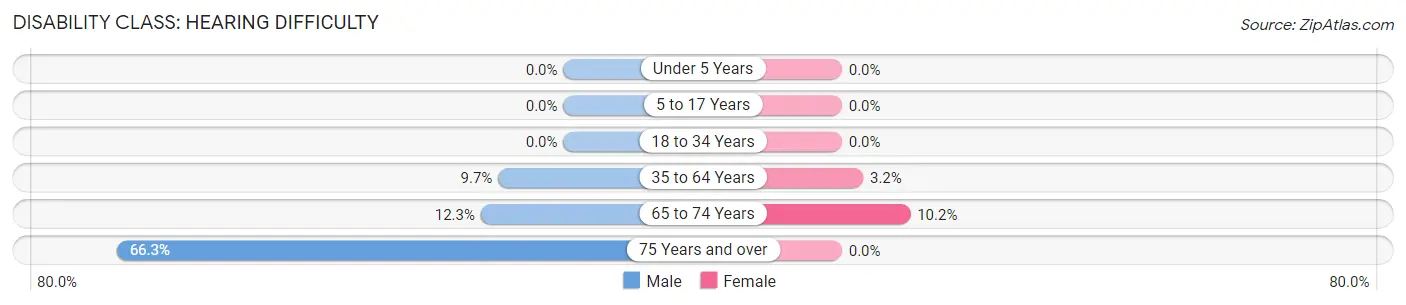
| Age Bracket | Male | Female |
| Under 5 Years | 0 (0.0%) | 0 (0.0%) |
| 5 to 17 Years | 0 (0.0%) | 0 (0.0%) |
| 18 to 34 Years | 0 (0.0%) | 0 (0.0%) |
| 35 to 64 Years | 55 (9.7%) | 17 (3.2%) |
| 65 to 74 Years | 13 (12.3%) | 19 (10.2%) |
| 75 Years and over | 128 (66.3%) | 0 (0.0%) |
Disability Class: Vision Difficulty
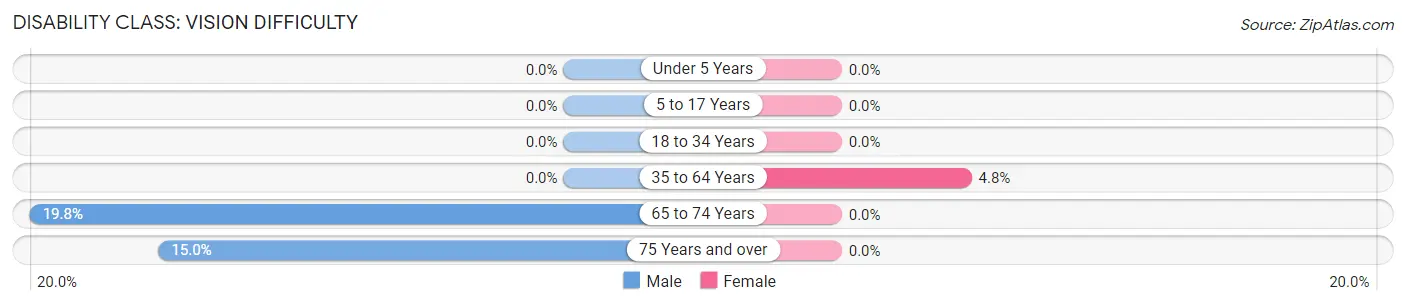
| Age Bracket | Male | Female |
| Under 5 Years | 0 (0.0%) | 0 (0.0%) |
| 5 to 17 Years | 0 (0.0%) | 0 (0.0%) |
| 18 to 34 Years | 0 (0.0%) | 0 (0.0%) |
| 35 to 64 Years | 0 (0.0%) | 26 (4.8%) |
| 65 to 74 Years | 21 (19.8%) | 0 (0.0%) |
| 75 Years and over | 29 (15.0%) | 0 (0.0%) |
Disability Class: Cognitive Difficulty

| Age Bracket | Male | Female |
| 5 to 17 Years | 22 (12.4%) | 0 (0.0%) |
| 18 to 34 Years | 0 (0.0%) | 0 (0.0%) |
| 35 to 64 Years | 0 (0.0%) | 7 (1.3%) |
| 65 to 74 Years | 0 (0.0%) | 0 (0.0%) |
| 75 Years and over | 15 (7.8%) | 0 (0.0%) |
Disability Class: Ambulatory Difficulty
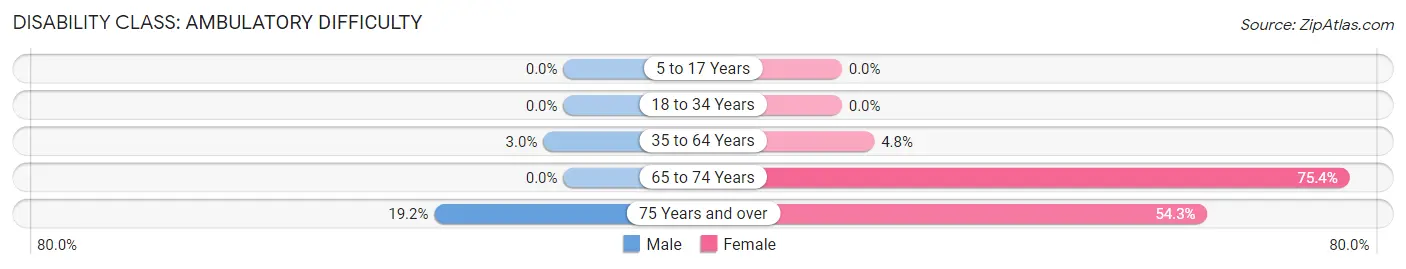
| Age Bracket | Male | Female |
| 5 to 17 Years | 0 (0.0%) | 0 (0.0%) |
| 18 to 34 Years | 0 (0.0%) | 0 (0.0%) |
| 35 to 64 Years | 17 (3.0%) | 26 (4.8%) |
| 65 to 74 Years | 0 (0.0%) | 141 (75.4%) |
| 75 Years and over | 37 (19.2%) | 19 (54.3%) |
Disability Class: Self-Care Difficulty
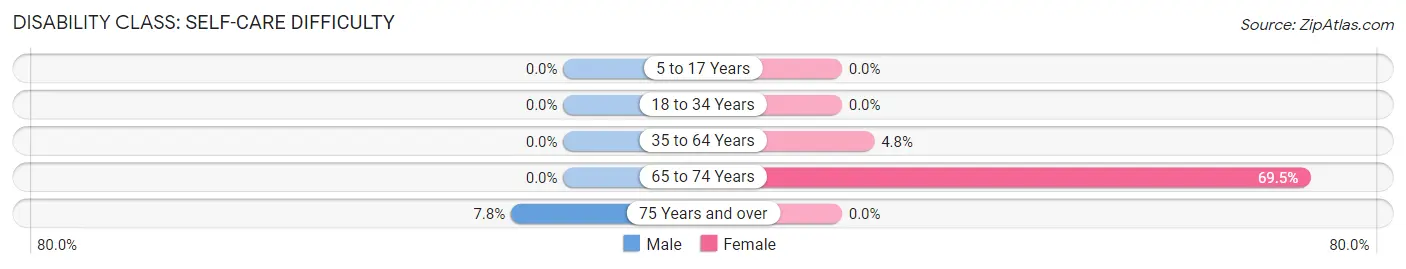
| Age Bracket | Male | Female |
| 5 to 17 Years | 0 (0.0%) | 0 (0.0%) |
| 18 to 34 Years | 0 (0.0%) | 0 (0.0%) |
| 35 to 64 Years | 0 (0.0%) | 26 (4.8%) |
| 65 to 74 Years | 0 (0.0%) | 130 (69.5%) |
| 75 Years and over | 15 (7.8%) | 0 (0.0%) |
Technology Access in Hughesville
Computing Device Access in Hughesville
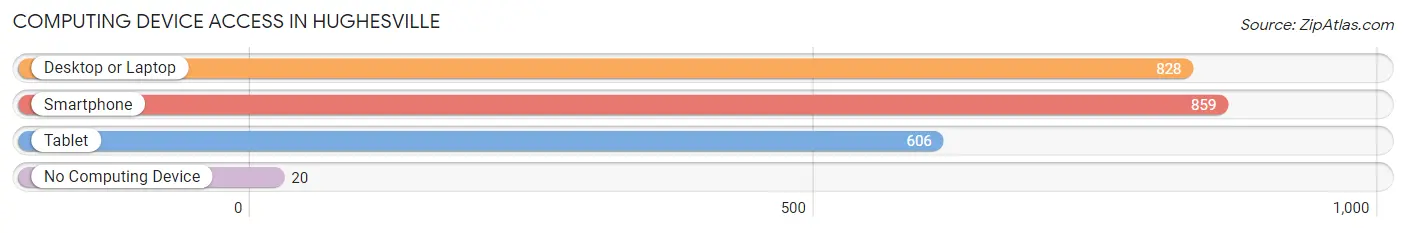
| Device Type | # Households | % Households |
| Desktop or Laptop | 828 | 92.8% |
| Smartphone | 859 | 96.3% |
| Tablet | 606 | 67.9% |
| No Computing Device | 20 | 2.2% |
| Total | 892 | 100.0% |
Internet Access in Hughesville
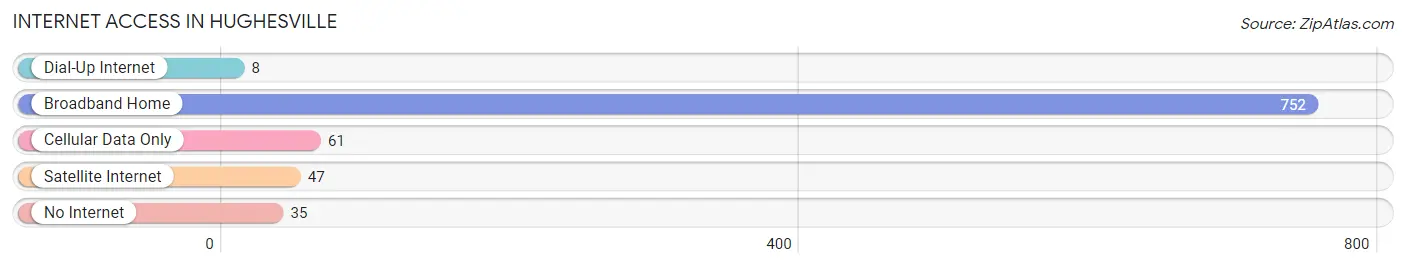
| Internet Type | # Households | % Households |
| Dial-Up Internet | 8 | 0.9% |
| Broadband Home | 752 | 84.3% |
| Cellular Data Only | 61 | 6.8% |
| Satellite Internet | 47 | 5.3% |
| No Internet | 35 | 3.9% |
| Total | 892 | 100.0% |
Hughesville Summary
Hughesville is a small town located in Charles County, Maryland. It is situated on the banks of the Potomac River, approximately 25 miles south of Washington, D.C. The town has a population of approximately 1,500 people and is part of the larger Washington metropolitan area.
History
Hughesville was founded in 1790 by Thomas Hughes, a Quaker from Pennsylvania. Hughes purchased the land from the local Native Americans and named the town after himself. The town was originally a farming community, but it soon developed into a small trading center. In 1820, the town was incorporated and the first post office was established.
In the late 19th century, Hughesville began to grow and develop. The town was connected to the Baltimore and Ohio Railroad in 1873, and the first bank was established in 1876. The town also had a number of stores, churches, and other businesses.
In the early 20th century, Hughesville continued to grow and develop. The town was connected to the electric grid in 1912, and the first telephone service was established in 1915. The town also had a number of schools, including a high school, which opened in 1921.
Geography
Hughesville is located in Charles County, Maryland. It is situated on the banks of the Potomac River, approximately 25 miles south of Washington, D.C. The town is located in a rural area, and is surrounded by farmland and forests. The town is located at an elevation of approximately 100 feet above sea level.
The climate in Hughesville is humid subtropical, with hot, humid summers and mild winters. The average annual temperature is around 60 degrees Fahrenheit, and the average annual precipitation is around 40 inches.
Economy
The economy of Hughesville is largely based on agriculture and tourism. The town is home to a number of farms, which produce a variety of crops, including corn, soybeans, wheat, and hay. The town is also home to a number of tourist attractions, including the Hughesville Historic District, which is listed on the National Register of Historic Places.
The town is also home to a number of businesses, including restaurants, retail stores, and professional services. The town is also home to a number of manufacturing companies, which produce a variety of products, including furniture, clothing, and electronics.
Demographics
As of the 2010 census, the population of Hughesville was 1,500 people. The racial makeup of the town was 94.7% White, 2.7% African American, 0.3% Native American, 0.7% Asian, and 1.6% from other races. The median household income was $50,000, and the median family income was $60,000.
The town is home to a number of churches, including the Hughesville United Methodist Church, the Hughesville Baptist Church, and the Hughesville Presbyterian Church. The town is also home to a number of schools, including the Hughesville High School, the Hughesville Middle School, and the Hughesville Elementary School.
Common Questions
What is Per Capita Income in Hughesville?
Per Capita income in Hughesville is $70,186.
What is the Median Family Income in Hughesville?
Median Family Income in Hughesville is $137,692.
What is the Median Household income in Hughesville?
Median Household Income in Hughesville is $128,846.
What is Income or Wage Gap in Hughesville?
Income or Wage Gap in Hughesville is 18.5%.
Women in Hughesville earn 81.5 cents for every dollar earned by a man.
What is Inequality or Gini Index in Hughesville?
Inequality or Gini Index in Hughesville is 0.40.
What is the Total Population of Hughesville?
Total Population of Hughesville is 2,299.
What is the Total Male Population of Hughesville?
Total Male Population of Hughesville is 1,161.
What is the Total Female Population of Hughesville?
Total Female Population of Hughesville is 1,138.
What is the Ratio of Males per 100 Females in Hughesville?
There are 102.02 Males per 100 Females in Hughesville.
What is the Ratio of Females per 100 Males in Hughesville?
There are 98.02 Females per 100 Males in Hughesville.
What is the Median Population Age in Hughesville?
Median Population Age in Hughesville is 50.4 Years.
What is the Average Family Size in Hughesville
Average Family Size in Hughesville is 2.7 People.
What is the Average Household Size in Hughesville
Average Household Size in Hughesville is 2.5 People.
How Large is the Labor Force in Hughesville?
There are 1,278 People in the Labor Forcein in Hughesville.
What is the Percentage of People in the Labor Force in Hughesville?
64.2% of People are in the Labor Force in Hughesville.
What is the Unemployment Rate in Hughesville?
Unemployment Rate in Hughesville is 1.3%.