Klondike, MD Map & Demographics
Klondike Map
Klondike Overview
$21,063
PER CAPITA INCOME
$59,861
AVG HOUSEHOLD INCOME
0.12
INEQUALITY / GINI INDEX
228
TOTAL POPULATION
144
MALE POPULATION
84
FEMALE POPULATION
171.43
MALES / 100 FEMALES
58.33
FEMALES / 100 MALES
18.9
MEDIAN AGE
4.4
AVG FAMILY SIZE
3.2
AVG HOUSEHOLD SIZE
67
LABOR FORCE [ PEOPLE ]
46.9%
PERCENT IN LABOR FORCE
Income in Klondike
Income Overview in Klondike
| Characteristic | Number | Measure |
| Per Capita Income | 228 | $21,063 |
| Median Family Income | 34 | $0 |
| Mean Family Income | 34 | $0 |
| Median Household Income | 71 | $59,861 |
| Mean Household Income | 71 | $67,670 |
| Income Deficit | 34 | $0 |
| Wage / Income Gap (%) | 228 | 0.00% |
| Wage / Income Gap ($) | 228 | 100.00¢ per $1 |
| Gini / Inequality Index | 228 | 0.12 |
Earnings by Sex in Klondike
| Sex | Number | Average Earnings |
| Male | 33 (49.2%) | $0 |
| Female | 34 (50.7%) | $0 |
| Total | 67 (100.0%) | $0 |
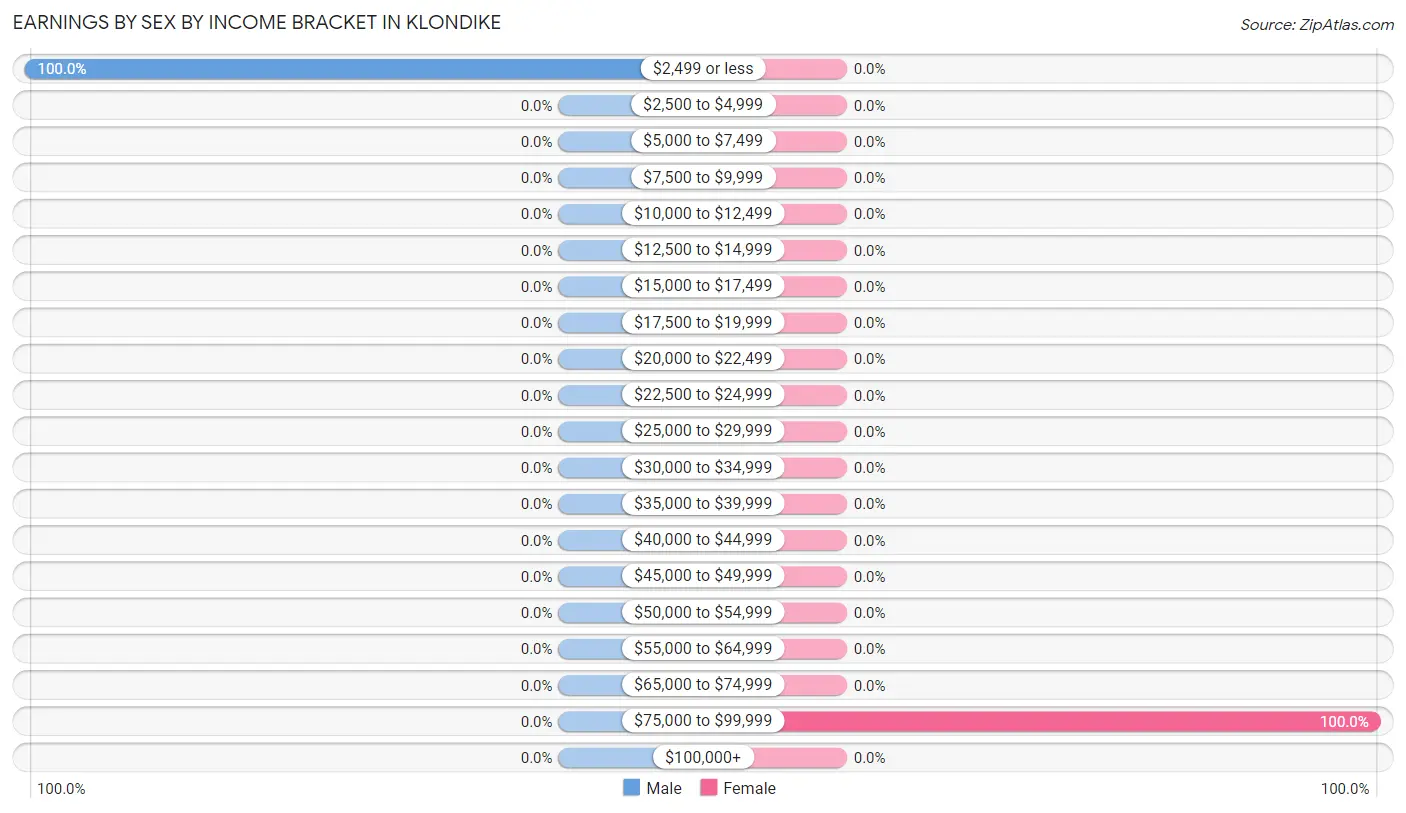
Earnings by Sex by Income Bracket in Klondike
The most common earnings brackets in Klondike are $2,499 or less for men (33 | 100.0%) and $75,000 to $99,999 for women (34 | 100.0%).
| Income | Male | Female |
| $2,499 or less | 33 (100.0%) | 0 (0.0%) |
| $2,500 to $4,999 | 0 (0.0%) | 0 (0.0%) |
| $5,000 to $7,499 | 0 (0.0%) | 0 (0.0%) |
| $7,500 to $9,999 | 0 (0.0%) | 0 (0.0%) |
| $10,000 to $12,499 | 0 (0.0%) | 0 (0.0%) |
| $12,500 to $14,999 | 0 (0.0%) | 0 (0.0%) |
| $15,000 to $17,499 | 0 (0.0%) | 0 (0.0%) |
| $17,500 to $19,999 | 0 (0.0%) | 0 (0.0%) |
| $20,000 to $22,499 | 0 (0.0%) | 0 (0.0%) |
| $22,500 to $24,999 | 0 (0.0%) | 0 (0.0%) |
| $25,000 to $29,999 | 0 (0.0%) | 0 (0.0%) |
| $30,000 to $34,999 | 0 (0.0%) | 0 (0.0%) |
| $35,000 to $39,999 | 0 (0.0%) | 0 (0.0%) |
| $40,000 to $44,999 | 0 (0.0%) | 0 (0.0%) |
| $45,000 to $49,999 | 0 (0.0%) | 0 (0.0%) |
| $50,000 to $54,999 | 0 (0.0%) | 0 (0.0%) |
| $55,000 to $64,999 | 0 (0.0%) | 0 (0.0%) |
| $65,000 to $74,999 | 0 (0.0%) | 0 (0.0%) |
| $75,000 to $99,999 | 0 (0.0%) | 34 (100.0%) |
| $100,000+ | 0 (0.0%) | 0 (0.0%) |
| Total | 33 (100.0%) | 34 (100.0%) |
Earnings by Sex by Educational Attainment in Klondike
| Educational Attainment | Male Income | Female Income |
| Less than High School | - | - |
| High School Diploma | - | - |
| College or Associate's Degree | - | - |
| Bachelor's Degree | - | - |
| Graduate Degree | - | - |
| Total | - | - |
Family Income in Klondike
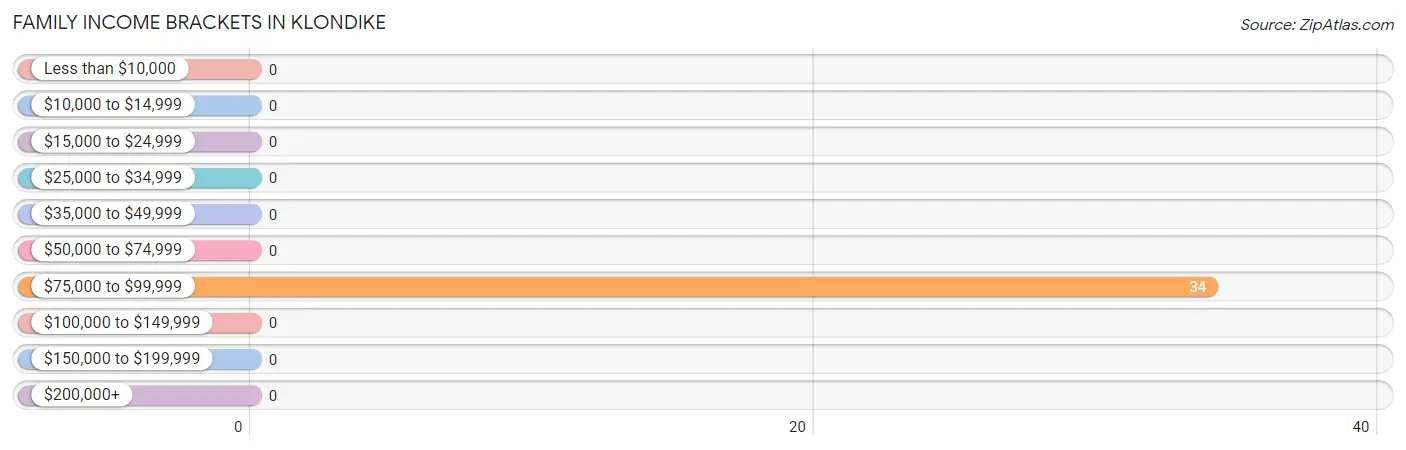
Family Income Brackets in Klondike
According to the Klondike family income data, there are 34 families falling into the $75,000 to $99,999 income range, which is the most common income bracket and makes up 100.0% of all families.
| Income Bracket | # Families | % Families |
| Less than $10,000 | 0 | 0.0% |
| $10,000 to $14,999 | 0 | 0.0% |
| $15,000 to $24,999 | 0 | 0.0% |
| $25,000 to $34,999 | 0 | 0.0% |
| $35,000 to $49,999 | 0 | 0.0% |
| $50,000 to $74,999 | 0 | 0.0% |
| $75,000 to $99,999 | 34 | 100.0% |
| $100,000 to $149,999 | 0 | 0.0% |
| $150,000 to $199,999 | 0 | 0.0% |
| $200,000+ | 0 | 0.0% |
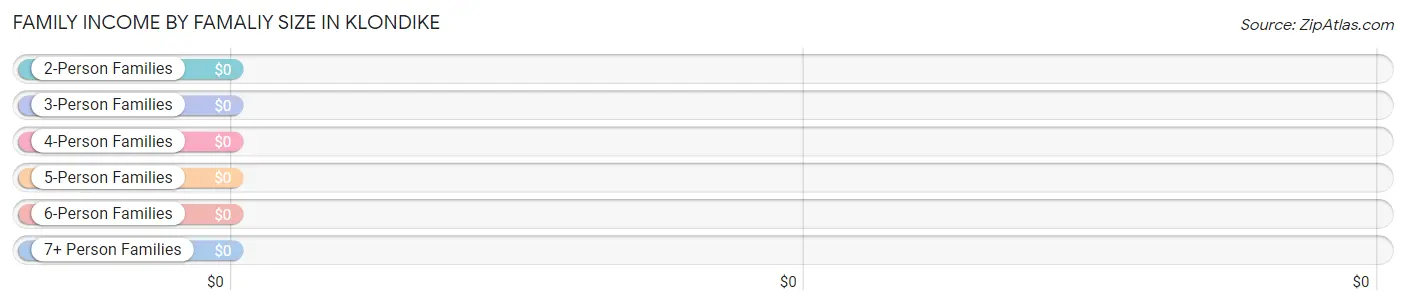
Family Income by Famaliy Size in Klondike
| Income Bracket | # Families | Median Income |
| 2-Person Families | 0 (0.0%) | $0 |
| 3-Person Families | 0 (0.0%) | $0 |
| 4-Person Families | 34 (100.0%) | $0 |
| 5-Person Families | 0 (0.0%) | $0 |
| 6-Person Families | 0 (0.0%) | $0 |
| 7+ Person Families | 0 (0.0%) | $0 |
| Total | 34 (100.0%) | $0 |
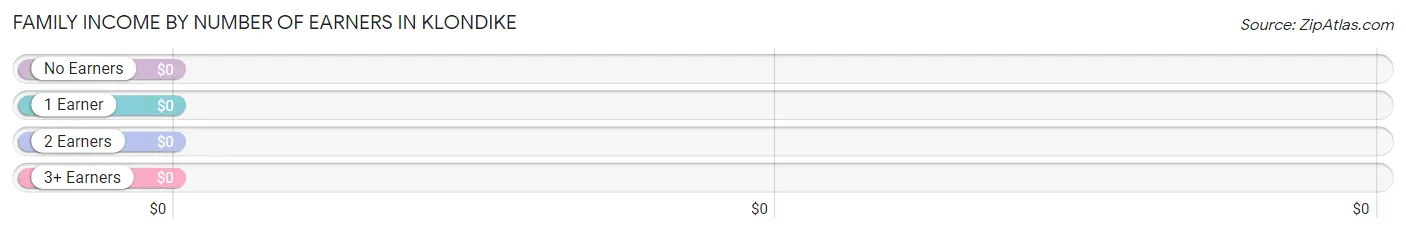
Family Income by Number of Earners in Klondike
| Number of Earners | # Families | Median Income |
| No Earners | 0 (0.0%) | $0 |
| 1 Earner | 0 (0.0%) | $0 |
| 2 Earners | 34 (100.0%) | $0 |
| 3+ Earners | 0 (0.0%) | $0 |
| Total | 34 (100.0%) | $0 |
Household Income in Klondike
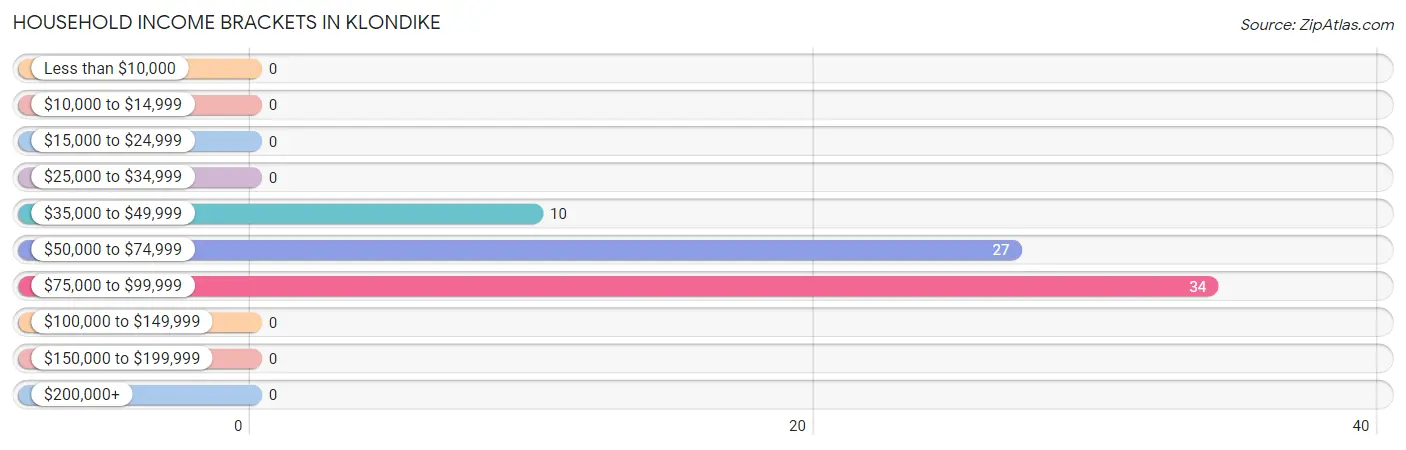
Household Income Brackets in Klondike
With 34 households falling in the category, the $75,000 to $99,999 income range is the most frequent in Klondike, accounting for 47.9% of all households.
| Income Bracket | # Households | % Households |
| Less than $10,000 | 0 | 0.0% |
| $10,000 to $14,999 | 0 | 0.0% |
| $15,000 to $24,999 | 0 | 0.0% |
| $25,000 to $34,999 | 0 | 0.0% |
| $35,000 to $49,999 | 10 | 14.1% |
| $50,000 to $74,999 | 27 | 38.0% |
| $75,000 to $99,999 | 34 | 47.9% |
| $100,000 to $149,999 | 0 | 0.0% |
| $150,000 to $199,999 | 0 | 0.0% |
| $200,000+ | 0 | 0.0% |
Household Income by Householder Age in Klondike
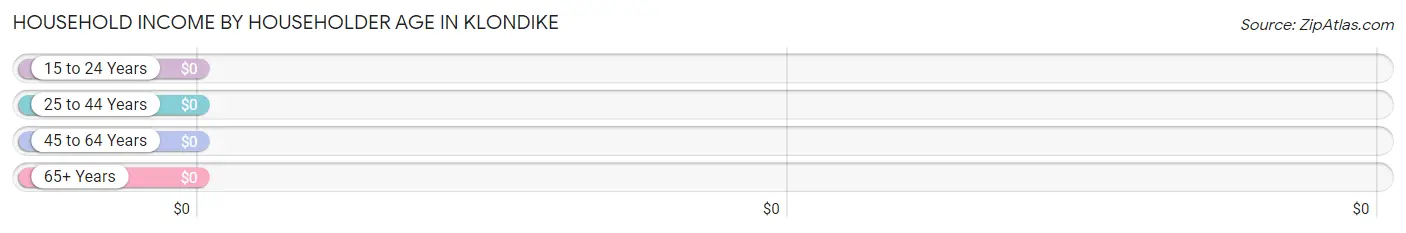
| Income Bracket | # Households | Median Income |
| 15 to 24 Years | 0 (0.0%) | $0 |
| 25 to 44 Years | 34 (47.9%) | $0 |
| 45 to 64 Years | 0 (0.0%) | $0 |
| 65+ Years | 37 (52.1%) | $0 |
| Total | 71 (100.0%) | $59,861 |
Poverty in Klondike
Income Below Poverty by Sex and Age in Klondike
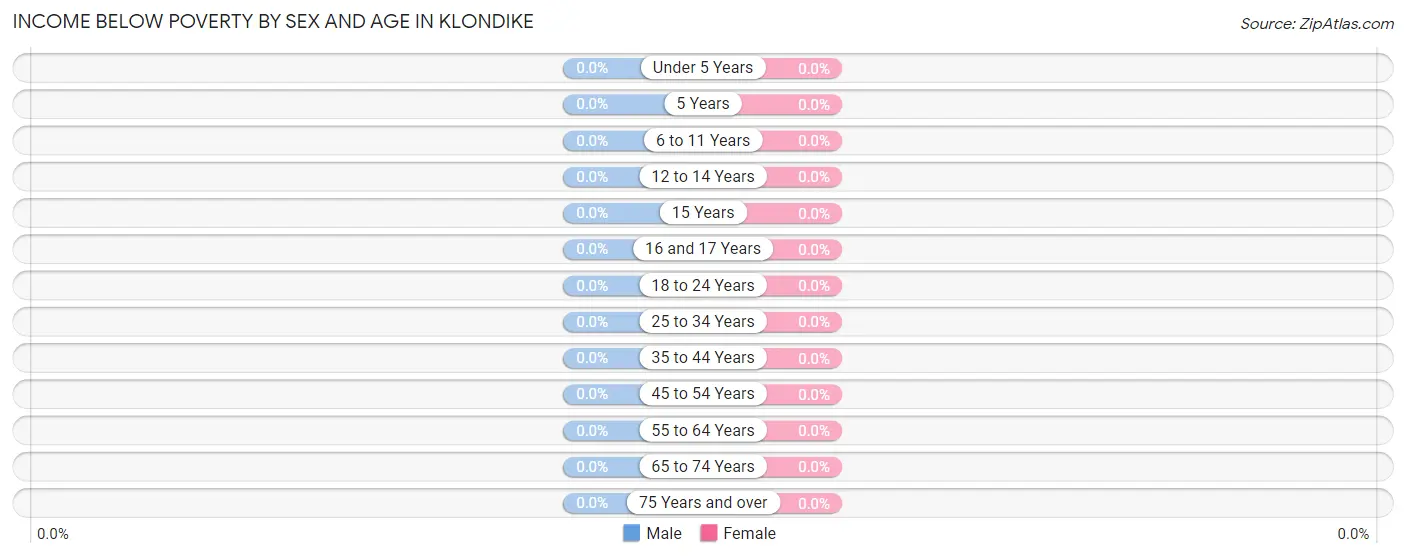
| Age Bracket | Male | Female |
| Under 5 Years | 0 (0.0%) | 0 (0.0%) |
| 5 Years | 0 (0.0%) | 0 (0.0%) |
| 6 to 11 Years | 0 (0.0%) | 0 (0.0%) |
| 12 to 14 Years | 0 (0.0%) | 0 (0.0%) |
| 15 Years | 0 (0.0%) | 0 (0.0%) |
| 16 and 17 Years | 0 (0.0%) | 0 (0.0%) |
| 18 to 24 Years | 0 (0.0%) | 0 (0.0%) |
| 25 to 34 Years | 0 (0.0%) | 0 (0.0%) |
| 35 to 44 Years | 0 (0.0%) | 0 (0.0%) |
| 45 to 54 Years | 0 (0.0%) | 0 (0.0%) |
| 55 to 64 Years | 0 (0.0%) | 0 (0.0%) |
| 65 to 74 Years | 0 (0.0%) | 0 (0.0%) |
| 75 Years and over | 0 (0.0%) | 0 (0.0%) |
| Total | 0 (0.0%) | 0 (0.0%) |
Income Above Poverty by Sex and Age in Klondike
According to the poverty statistics in Klondike, males aged 6 to 11 years and females aged 35 to 44 years are the age groups that are most secure financially, with 100.0% of males and 100.0% of females in these age groups living above the poverty line.
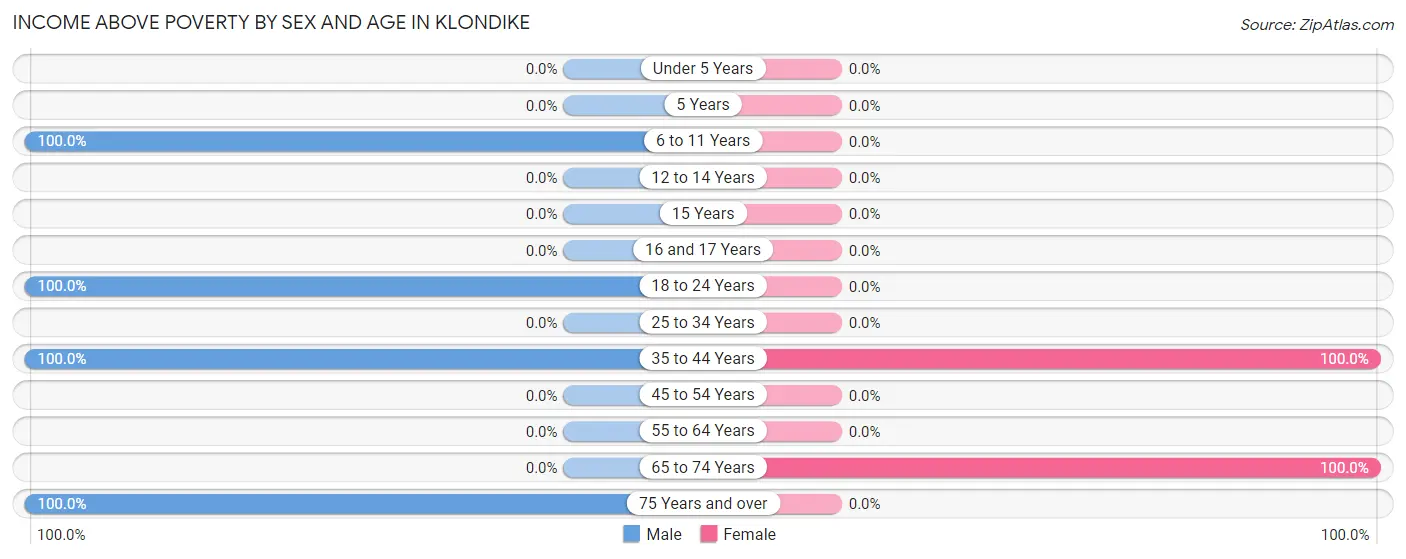
| Age Bracket | Male | Female |
| Under 5 Years | 0 (0.0%) | 0 (0.0%) |
| 5 Years | 0 (0.0%) | 0 (0.0%) |
| 6 to 11 Years | 45 (100.0%) | 0 (0.0%) |
| 12 to 14 Years | 0 (0.0%) | 0 (0.0%) |
| 15 Years | 0 (0.0%) | 0 (0.0%) |
| 16 and 17 Years | 0 (0.0%) | 0 (0.0%) |
| 18 to 24 Years | 33 (100.0%) | 0 (0.0%) |
| 25 to 34 Years | 0 (0.0%) | 0 (0.0%) |
| 35 to 44 Years | 39 (100.0%) | 34 (100.0%) |
| 45 to 54 Years | 0 (0.0%) | 0 (0.0%) |
| 55 to 64 Years | 0 (0.0%) | 0 (0.0%) |
| 65 to 74 Years | 0 (0.0%) | 10 (100.0%) |
| 75 Years and over | 27 (100.0%) | 0 (0.0%) |
| Total | 144 (100.0%) | 44 (100.0%) |
Income Below Poverty Among Married-Couple Families in Klondike
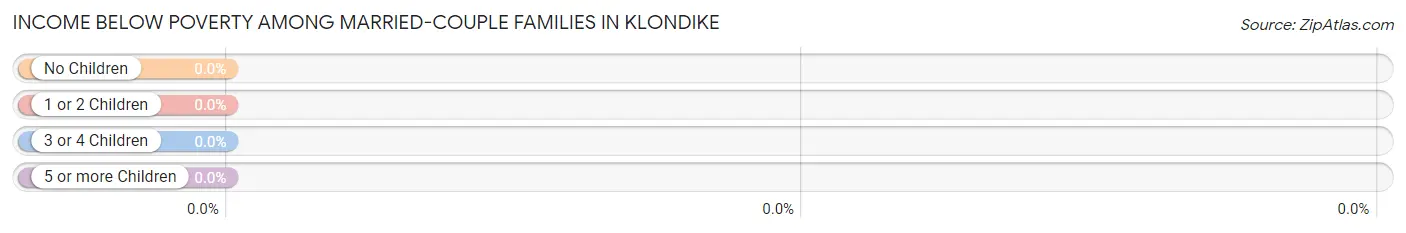
| Children | Above Poverty | Below Poverty |
| No Children | 0 (0.0%) | 0 (0.0%) |
| 1 or 2 Children | 34 (100.0%) | 0 (0.0%) |
| 3 or 4 Children | 0 (0.0%) | 0 (0.0%) |
| 5 or more Children | 0 (0.0%) | 0 (0.0%) |
| Total | 34 (100.0%) | 0 (0.0%) |
Income Below Poverty Among Single-Parent Households in Klondike
| Children | Single Father | Single Mother |
| No Children | 0 (0.0%) | 0 (0.0%) |
| 1 or 2 Children | 0 (0.0%) | 0 (0.0%) |
| 3 or 4 Children | 0 (0.0%) | 0 (0.0%) |
| 5 or more Children | 0 (0.0%) | 0 (0.0%) |
| Total | 0 (0.0%) | 0 (0.0%) |
Income Below Poverty Among Married-Couple vs Single-Parent Households in Klondike
| Children | Married-Couple Families | Single-Parent Households |
| No Children | 0 (0.0%) | 0 (0.0%) |
| 1 or 2 Children | 0 (0.0%) | 0 (0.0%) |
| 3 or 4 Children | 0 (0.0%) | 0 (0.0%) |
| 5 or more Children | 0 (0.0%) | 0 (0.0%) |
| Total | 0 (0.0%) | 0 (0.0%) |
Race in Klondike
The most populous races in Klondike are White / Caucasian (201 | 88.2%), Hispanic or Latino (27 | 11.8%), and Two or more Races (27 | 11.8%).
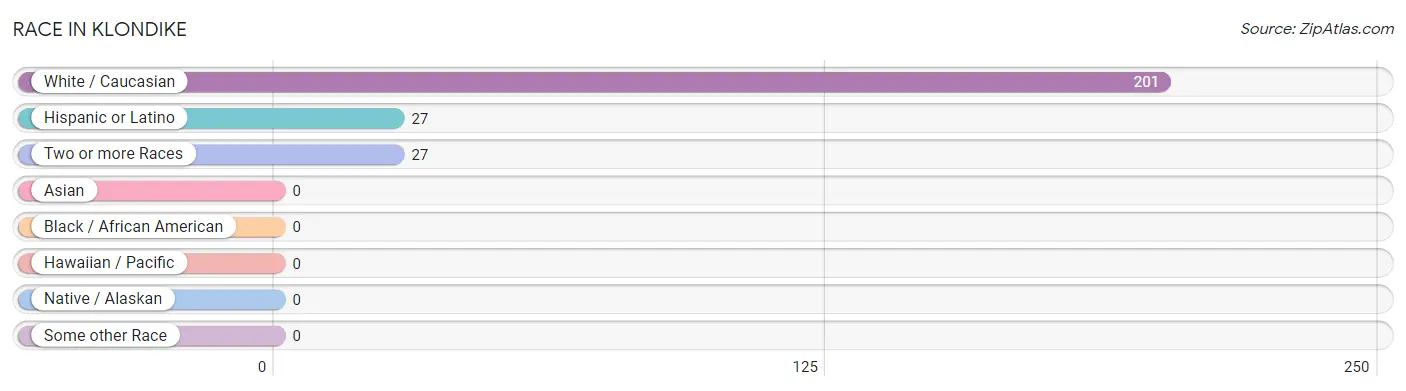
| Race | # Population | % Population |
| Asian | 0 | 0.0% |
| Black / African American | 0 | 0.0% |
| Hawaiian / Pacific | 0 | 0.0% |
| Hispanic or Latino | 27 | 11.8% |
| Native / Alaskan | 0 | 0.0% |
| White / Caucasian | 201 | 88.2% |
| Two or more Races | 27 | 11.8% |
| Some other Race | 0 | 0.0% |
| Total | 228 | 100.0% |
Ancestry in Klondike
The most populous ancestries reported in Klondike are Scottish (112 | 49.1%), Polish (84 | 36.8%), Scandinavian (34 | 14.9%), and German (33 | 14.5%), together accounting for 115.3% of all Klondike residents.
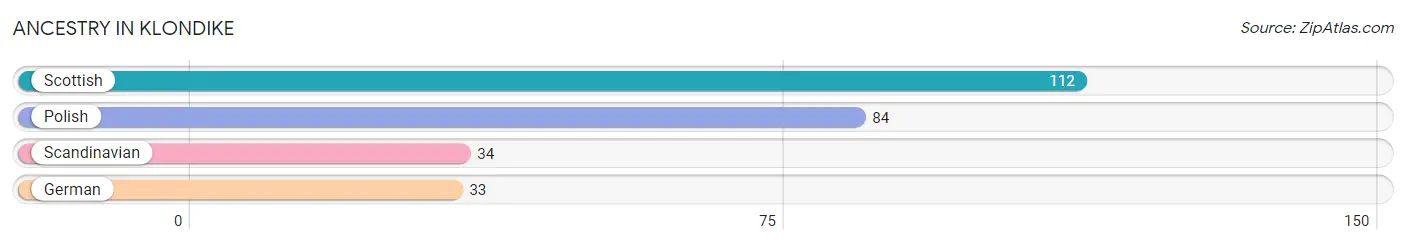
| Ancestry | # Population | % Population |
| German | 33 | 14.5% |
| Polish | 84 | 36.8% |
| Scandinavian | 34 | 14.9% |
| Scottish | 112 | 49.1% | View All 4 Rows |
Immigrants in Klondike
The most numerous immigrant groups reported in Klondike came from Central America (27 | 11.8%), Honduras (27 | 11.8%), and Latin America (27 | 11.8%), together accounting for 35.5% of all Klondike residents.
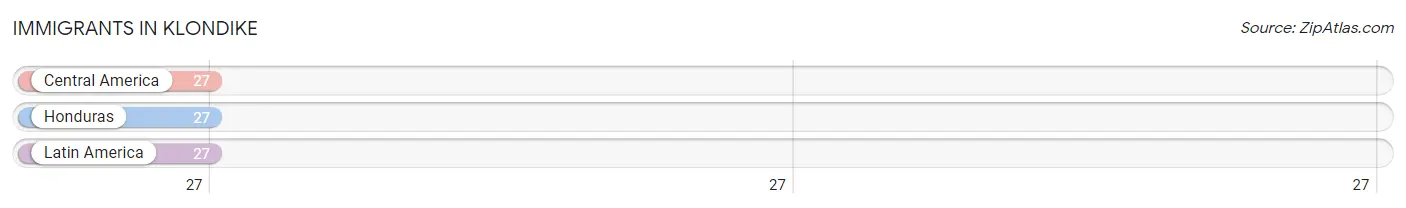
| Immigration Origin | # Population | % Population |
| Central America | 27 | 11.8% |
| Honduras | 27 | 11.8% |
| Latin America | 27 | 11.8% | View All 3 Rows |
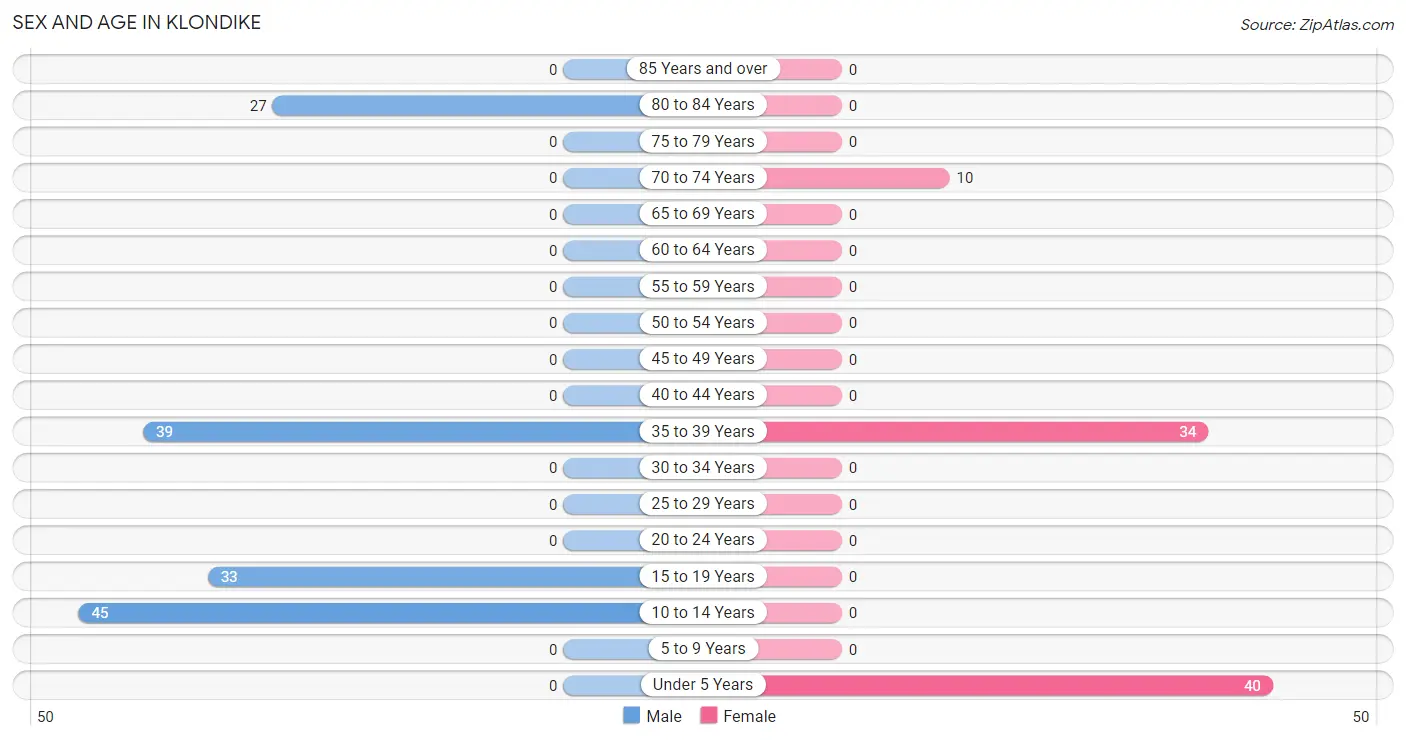
Sex and Age in Klondike
Sex and Age in Klondike
The most populous age groups in Klondike are 10 to 14 Years (45 | 31.2%) for men and Under 5 Years (40 | 47.6%) for women.
| Age Bracket | Male | Female |
| Under 5 Years | 0 (0.0%) | 40 (47.6%) |
| 5 to 9 Years | 0 (0.0%) | 0 (0.0%) |
| 10 to 14 Years | 45 (31.2%) | 0 (0.0%) |
| 15 to 19 Years | 33 (22.9%) | 0 (0.0%) |
| 20 to 24 Years | 0 (0.0%) | 0 (0.0%) |
| 25 to 29 Years | 0 (0.0%) | 0 (0.0%) |
| 30 to 34 Years | 0 (0.0%) | 0 (0.0%) |
| 35 to 39 Years | 39 (27.1%) | 34 (40.5%) |
| 40 to 44 Years | 0 (0.0%) | 0 (0.0%) |
| 45 to 49 Years | 0 (0.0%) | 0 (0.0%) |
| 50 to 54 Years | 0 (0.0%) | 0 (0.0%) |
| 55 to 59 Years | 0 (0.0%) | 0 (0.0%) |
| 60 to 64 Years | 0 (0.0%) | 0 (0.0%) |
| 65 to 69 Years | 0 (0.0%) | 0 (0.0%) |
| 70 to 74 Years | 0 (0.0%) | 10 (11.9%) |
| 75 to 79 Years | 0 (0.0%) | 0 (0.0%) |
| 80 to 84 Years | 27 (18.8%) | 0 (0.0%) |
| 85 Years and over | 0 (0.0%) | 0 (0.0%) |
| Total | 144 (100.0%) | 84 (100.0%) |
Families and Households in Klondike
Median Family Size in Klondike
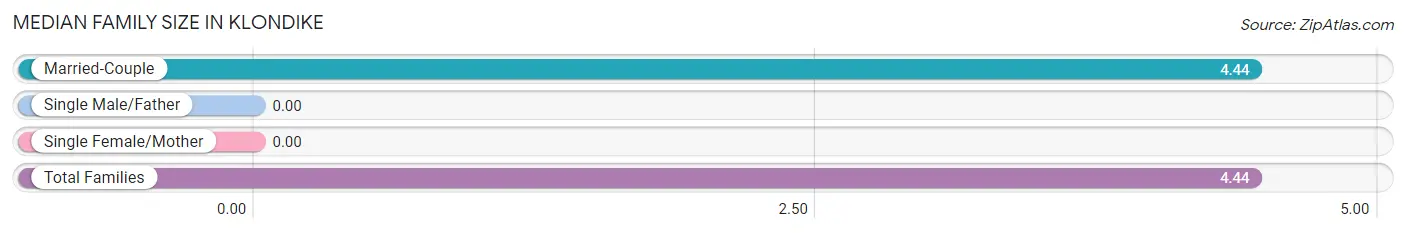
| Family Type | # Families | Family Size |
| Married-Couple | 34 (100.0%) | 4.44 |
| Single Male/Father | 0 (0.0%) | - |
| Single Female/Mother | 0 (0.0%) | - |
| Total Families | 34 (100.0%) | 4.44 |
Median Household Size in Klondike
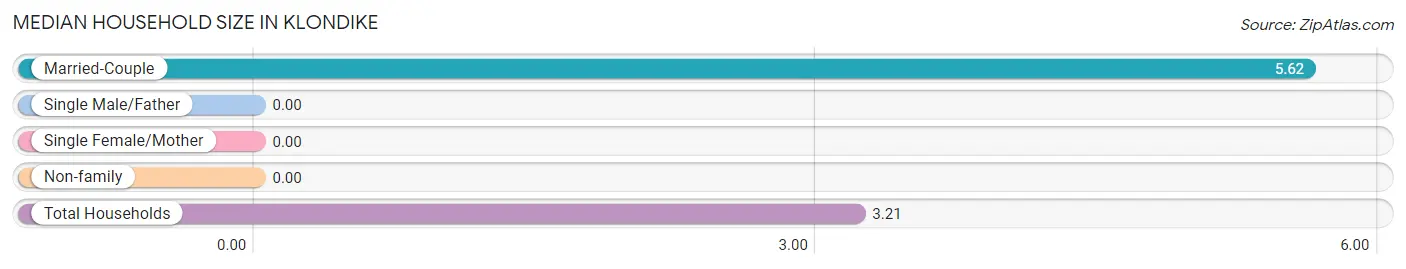
| Household Type | # Households | Household Size |
| Married-Couple | 34 (47.9%) | 5.62 |
| Single Male/Father | 0 (0.0%) | - |
| Single Female/Mother | 0 (0.0%) | - |
| Non-family | 37 (52.1%) | - |
| Total Households | 71 (100.0%) | 3.21 |
Household Size by Marriage Status in Klondike
Out of a total of 71 households in Klondike, 34 (47.9%) are family households, while 37 (52.1%) are nonfamily households. The most numerous type of family households are 5-person households, comprising 34, and the most common type of nonfamily households are 1-person households, comprising 37.
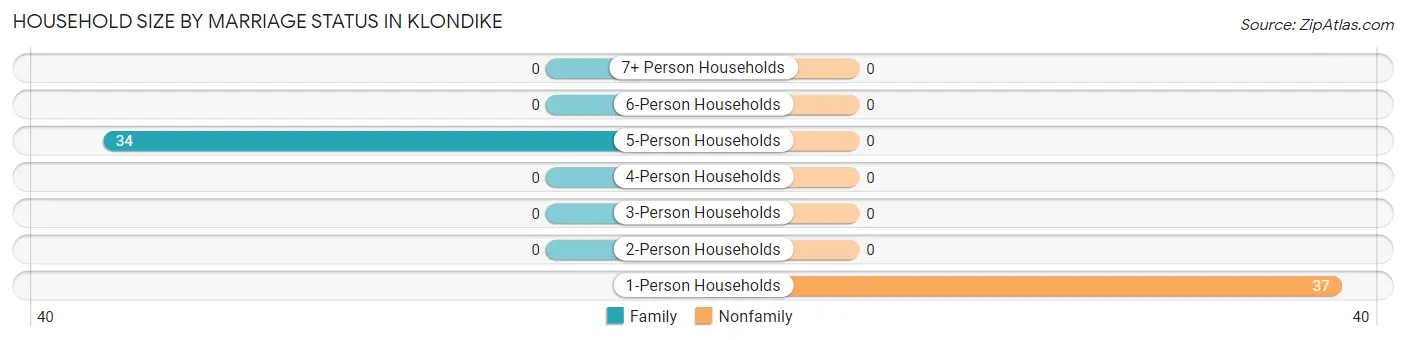
| Household Size | Family Households | Nonfamily Households |
| 1-Person Households | - | 37 (52.1%) |
| 2-Person Households | 0 (0.0%) | 0 (0.0%) |
| 3-Person Households | 0 (0.0%) | 0 (0.0%) |
| 4-Person Households | 0 (0.0%) | 0 (0.0%) |
| 5-Person Households | 34 (47.9%) | 0 (0.0%) |
| 6-Person Households | 0 (0.0%) | 0 (0.0%) |
| 7+ Person Households | 0 (0.0%) | 0 (0.0%) |
| Total | 34 (47.9%) | 37 (52.1%) |
Female Fertility in Klondike
Fertility by Age in Klondike
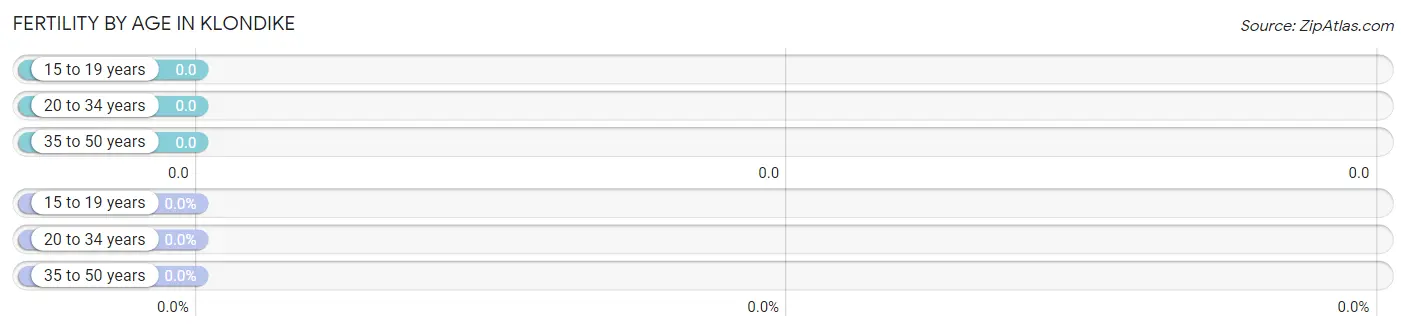
| Age Bracket | Women with Births | Births / 1,000 Women |
| 15 to 19 years | 0 (0.0%) | 0.0 |
| 20 to 34 years | 0 (0.0%) | 0.0 |
| 35 to 50 years | 0 (0.0%) | 0.0 |
| Total | 0 (0.0%) | 0.0 |
Fertility by Age by Marriage Status in Klondike
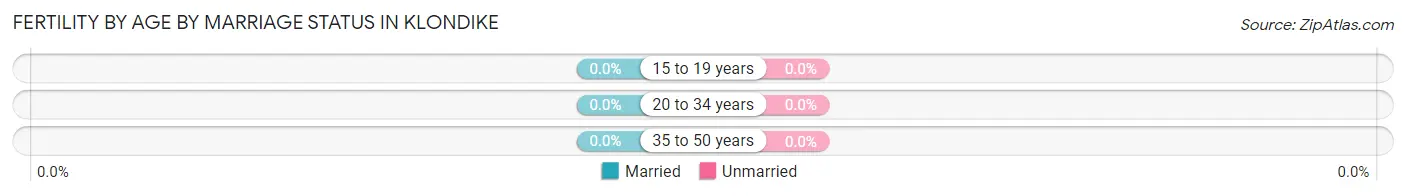
| Age Bracket | Married | Unmarried |
| 15 to 19 years | 0 (0.0%) | 0 (0.0%) |
| 20 to 34 years | 0 (0.0%) | 0 (0.0%) |
| 35 to 50 years | 0 (0.0%) | 0 (0.0%) |
| Total | 0 (0.0%) | 0 (0.0%) |
Fertility by Education in Klondike
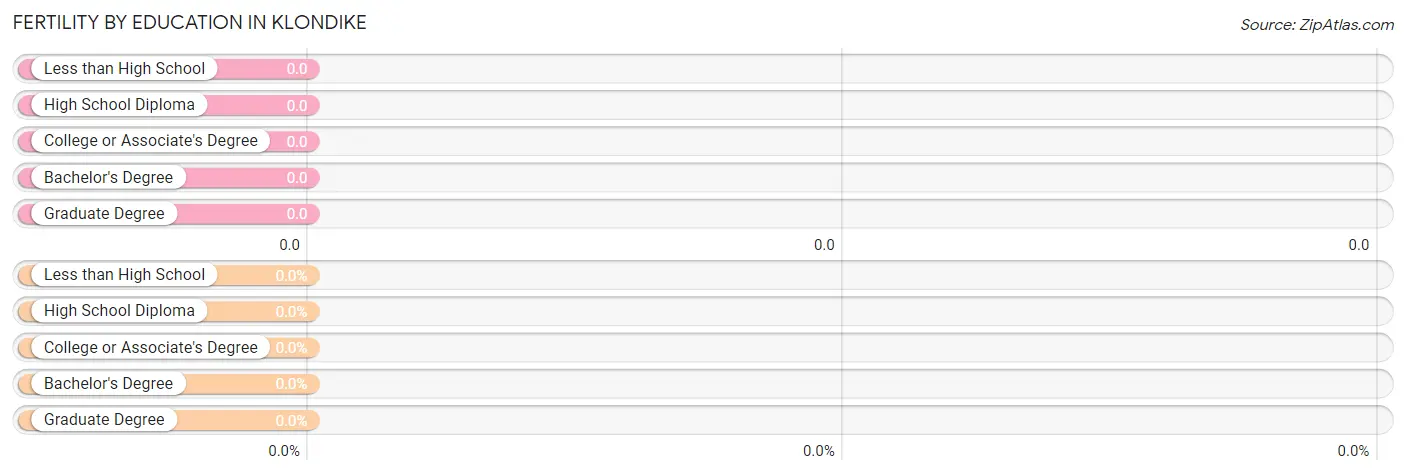
| Educational Attainment | Women with Births | Births / 1,000 Women |
| Less than High School | 0 (0.0%) | 0.0 |
| High School Diploma | 0 (0.0%) | 0.0 |
| College or Associate's Degree | 0 (0.0%) | 0.0 |
| Bachelor's Degree | 0 (0.0%) | 0.0 |
| Graduate Degree | 0 (0.0%) | 0.0 |
| Total | 0 (0.0%) | 0.0 |
Fertility by Education by Marriage Status in Klondike
| Educational Attainment | Married | Unmarried |
| Less than High School | 0 (0.0%) | 0 (0.0%) |
| High School Diploma | 0 (0.0%) | 0 (0.0%) |
| College or Associate's Degree | 0 (0.0%) | 0 (0.0%) |
| Bachelor's Degree | 0 (0.0%) | 0 (0.0%) |
| Graduate Degree | 0 (0.0%) | 0 (0.0%) |
| Total | 0 (0.0%) | 0 (0.0%) |
Employment Characteristics in Klondike
Employment by Class of Employer in Klondike
Among the 67 employed individuals in Klondike, local government employees (34 | 50.7%), and private company employees (33 | 49.2%) make up the most common classes of employment.
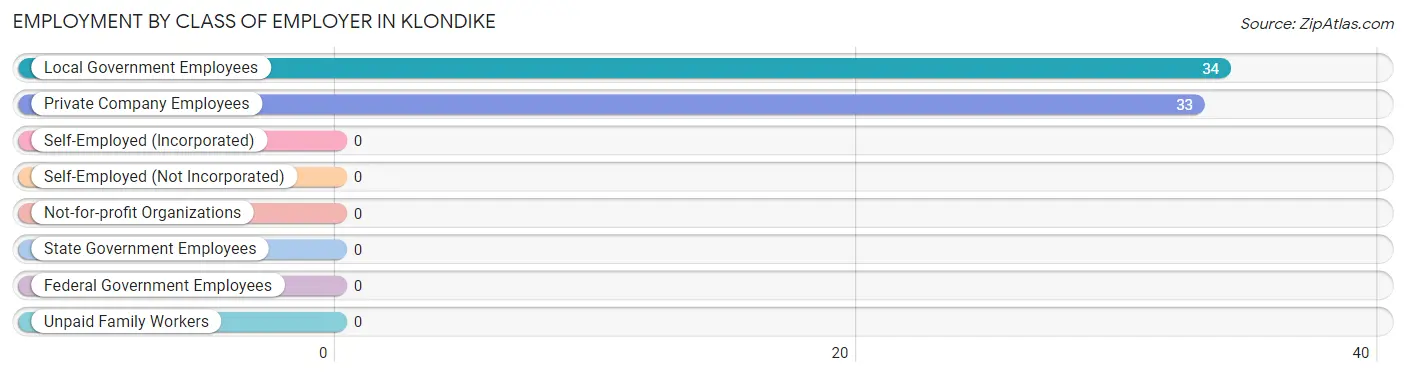
| Employer Class | # Employees | % Employees |
| Private Company Employees | 33 | 49.2% |
| Self-Employed (Incorporated) | 0 | 0.0% |
| Self-Employed (Not Incorporated) | 0 | 0.0% |
| Not-for-profit Organizations | 0 | 0.0% |
| Local Government Employees | 34 | 50.7% |
| State Government Employees | 0 | 0.0% |
| Federal Government Employees | 0 | 0.0% |
| Unpaid Family Workers | 0 | 0.0% |
| Total | 67 | 100.0% |
Employment Status by Age in Klondike
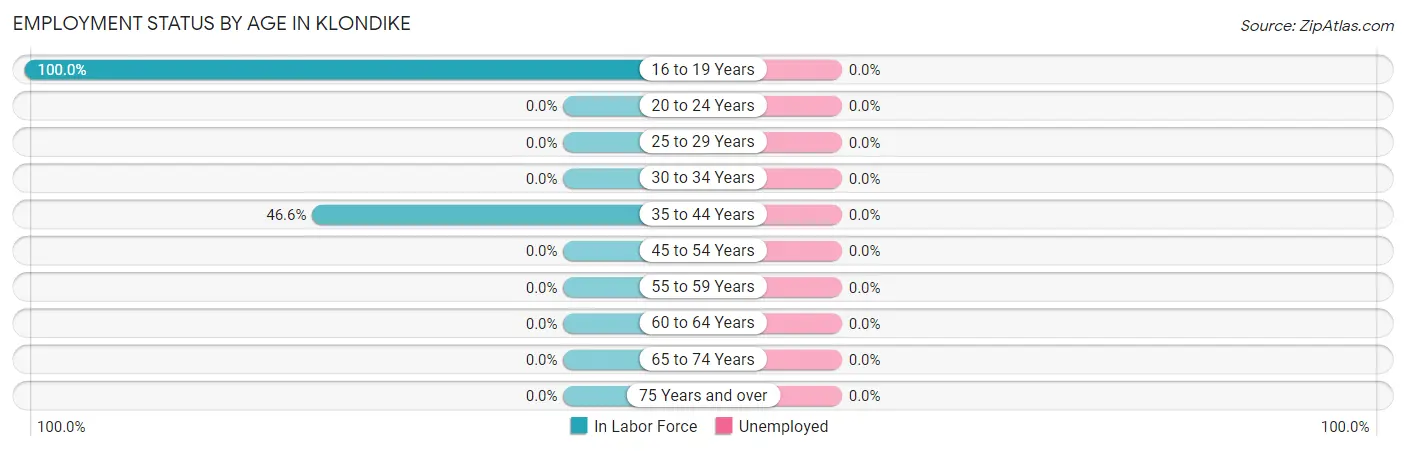
| Age Bracket | In Labor Force | Unemployed |
| 16 to 19 Years | 33 (100.0%) | 0 (0.0%) |
| 20 to 24 Years | 0 (0.0%) | 0 (0.0%) |
| 25 to 29 Years | 0 (0.0%) | 0 (0.0%) |
| 30 to 34 Years | 0 (0.0%) | 0 (0.0%) |
| 35 to 44 Years | 34 (46.6%) | 0 (0.0%) |
| 45 to 54 Years | 0 (0.0%) | 0 (0.0%) |
| 55 to 59 Years | 0 (0.0%) | 0 (0.0%) |
| 60 to 64 Years | 0 (0.0%) | 0 (0.0%) |
| 65 to 74 Years | 0 (0.0%) | 0 (0.0%) |
| 75 Years and over | 0 (0.0%) | 0 (0.0%) |
| Total | 67 (46.9%) | 0 (0.0%) |
Employment Status by Educational Attainment in Klondike
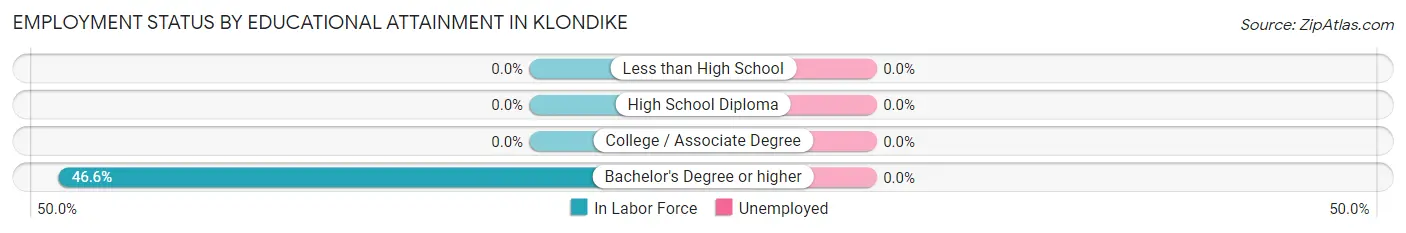
| Educational Attainment | In Labor Force | Unemployed |
| Less than High School | 0 (0.0%) | 0 (0.0%) |
| High School Diploma | 0 (0.0%) | 0 (0.0%) |
| College / Associate Degree | 0 (0.0%) | 0 (0.0%) |
| Bachelor's Degree or higher | 34 (46.6%) | 0 (0.0%) |
| Total | 34 (46.6%) | 0 (0.0%) |
Employment Occupations by Sex in Klondike
Management, Business, Science and Arts Occupations
The most common Management, Business, Science and Arts occupations in Klondike are Community & Social Service (34 | 50.7%), and Education Instruction & Library (34 | 50.7%).
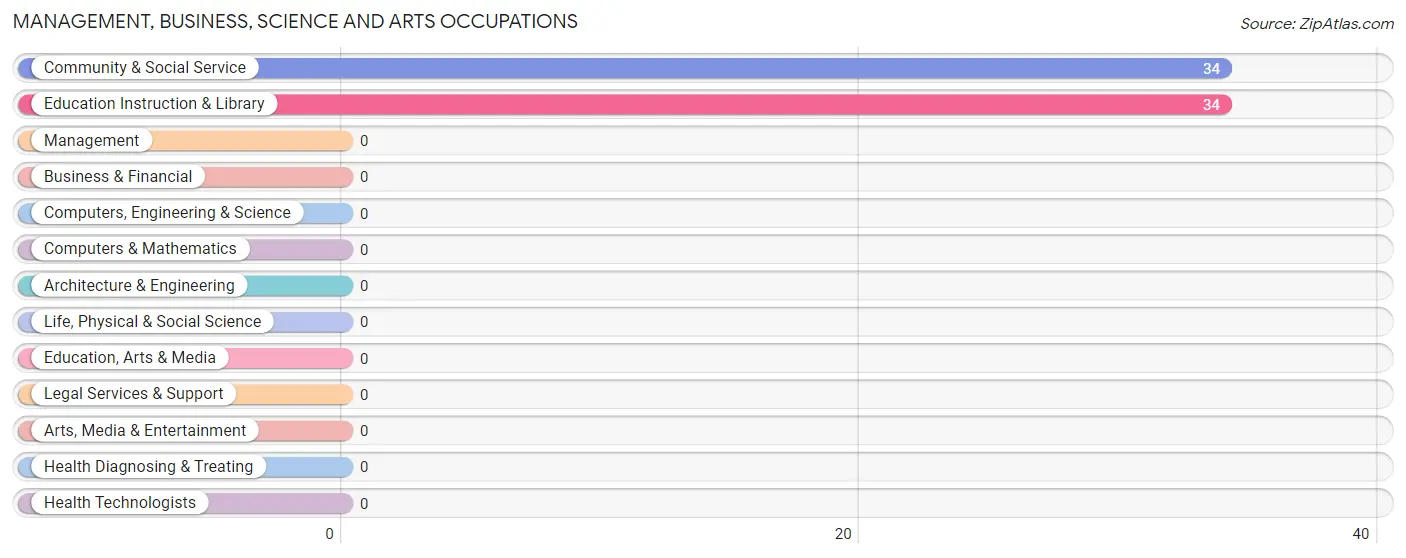
Management, Business, Science and Arts Occupations by Sex
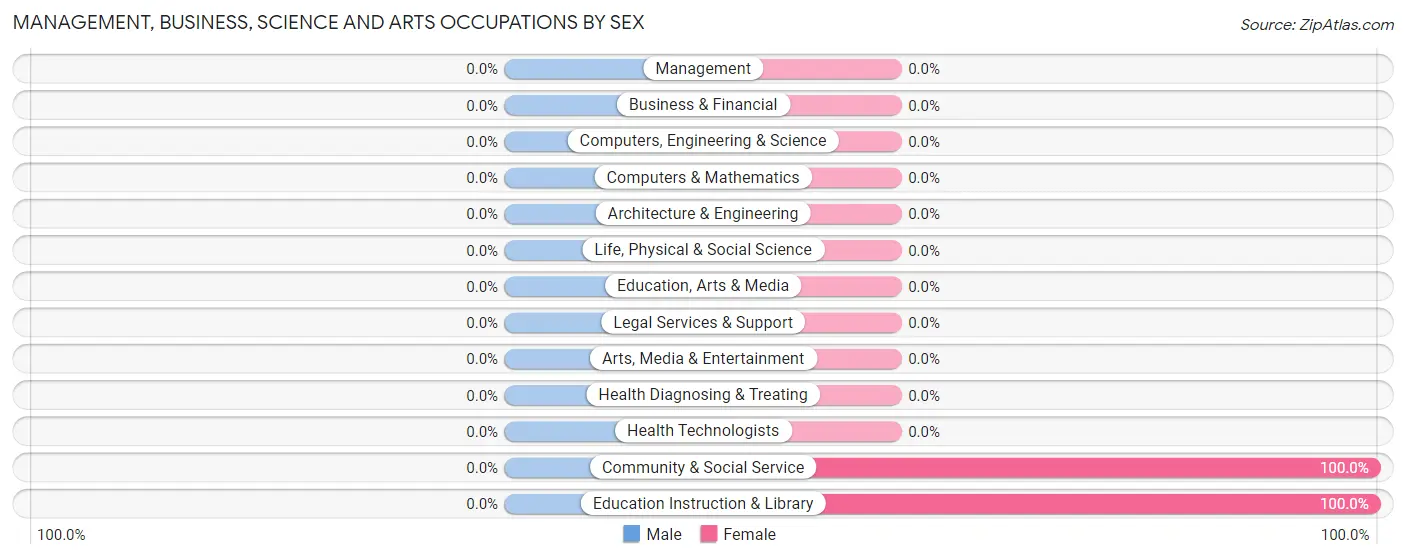
| Occupation | Male | Female |
| Management | 0 (0.0%) | 0 (0.0%) |
| Business & Financial | 0 (0.0%) | 0 (0.0%) |
| Computers, Engineering & Science | 0 (0.0%) | 0 (0.0%) |
| Computers & Mathematics | 0 (0.0%) | 0 (0.0%) |
| Architecture & Engineering | 0 (0.0%) | 0 (0.0%) |
| Life, Physical & Social Science | 0 (0.0%) | 0 (0.0%) |
| Community & Social Service | 0 (0.0%) | 34 (100.0%) |
| Education, Arts & Media | 0 (0.0%) | 0 (0.0%) |
| Legal Services & Support | 0 (0.0%) | 0 (0.0%) |
| Education Instruction & Library | 0 (0.0%) | 34 (100.0%) |
| Arts, Media & Entertainment | 0 (0.0%) | 0 (0.0%) |
| Health Diagnosing & Treating | 0 (0.0%) | 0 (0.0%) |
| Health Technologists | 0 (0.0%) | 0 (0.0%) |
| Total (Category) | 0 (0.0%) | 34 (100.0%) |
| Total (Overall) | 33 (49.2%) | 34 (50.7%) |
Services Occupations
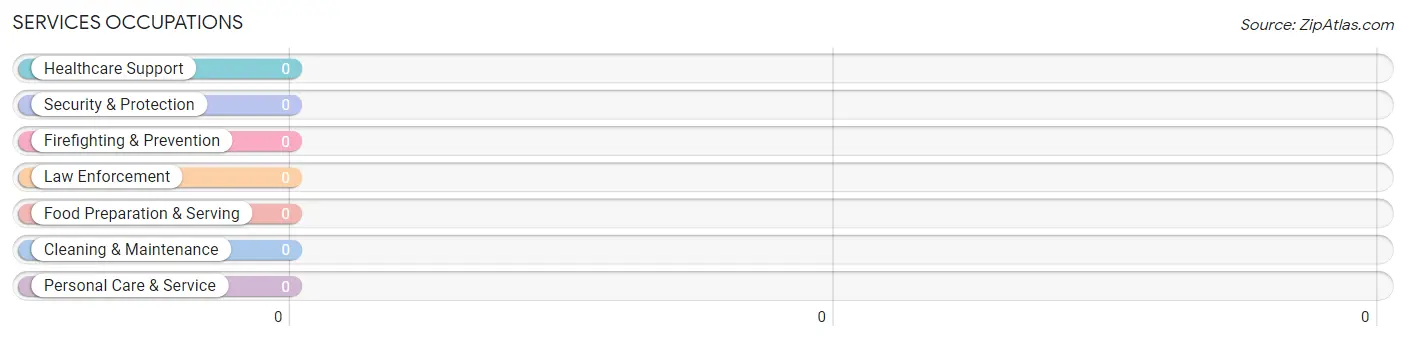
Services Occupations by Sex
| Occupation | Male | Female |
| Healthcare Support | 0 (0.0%) | 0 (0.0%) |
| Security & Protection | 0 (0.0%) | 0 (0.0%) |
| Firefighting & Prevention | 0 (0.0%) | 0 (0.0%) |
| Law Enforcement | 0 (0.0%) | 0 (0.0%) |
| Food Preparation & Serving | 0 (0.0%) | 0 (0.0%) |
| Cleaning & Maintenance | 0 (0.0%) | 0 (0.0%) |
| Personal Care & Service | 0 (0.0%) | 0 (0.0%) |
| Total (Category) | 0 (0.0%) | 0 (0.0%) |
| Total (Overall) | 33 (49.2%) | 34 (50.7%) |
Sales and Office Occupations
Sales and Office Occupations by Sex
| Occupation | Male | Female |
| Sales & Related | 0 (0.0%) | 0 (0.0%) |
| Office & Administration | 0 (0.0%) | 0 (0.0%) |
| Total (Category) | 0 (0.0%) | 0 (0.0%) |
| Total (Overall) | 33 (49.2%) | 34 (50.7%) |
Natural Resources, Construction and Maintenance Occupations
Natural Resources, Construction and Maintenance Occupations by Sex
| Occupation | Male | Female |
| Farming, Fishing & Forestry | 0 (0.0%) | 0 (0.0%) |
| Construction & Extraction | 0 (0.0%) | 0 (0.0%) |
| Installation, Maintenance & Repair | 0 (0.0%) | 0 (0.0%) |
| Total (Category) | 0 (0.0%) | 0 (0.0%) |
| Total (Overall) | 33 (49.2%) | 34 (50.7%) |
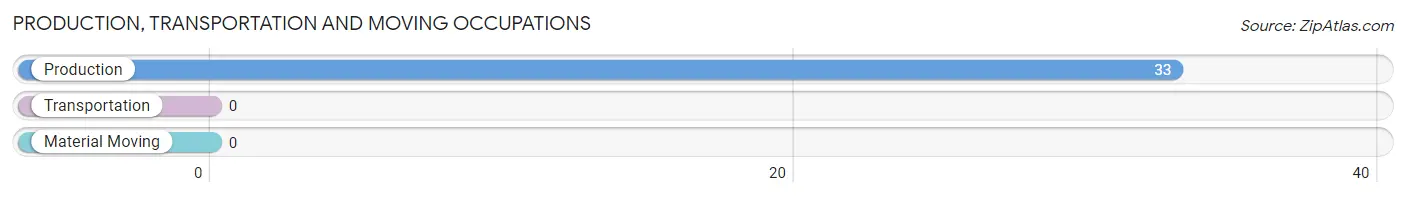
Production, Transportation and Moving Occupations
The most common Production, Transportation and Moving occupations in Klondike are , and Production (33 | 49.2%).
Production, Transportation and Moving Occupations by Sex
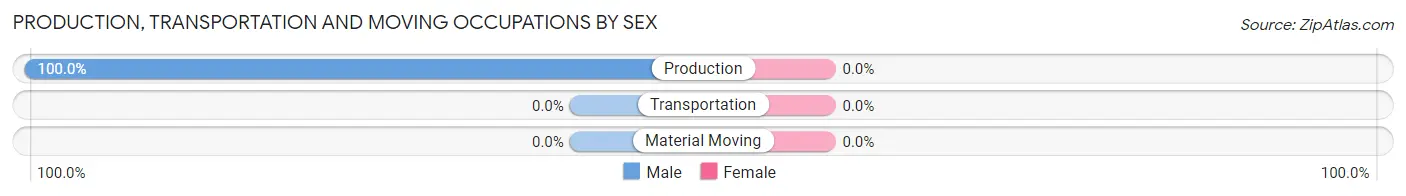
| Occupation | Male | Female |
| Production | 33 (100.0%) | 0 (0.0%) |
| Transportation | 0 (0.0%) | 0 (0.0%) |
| Material Moving | 0 (0.0%) | 0 (0.0%) |
| Total (Category) | 33 (100.0%) | 0 (0.0%) |
| Total (Overall) | 33 (49.2%) | 34 (50.7%) |
Employment Industries by Sex in Klondike
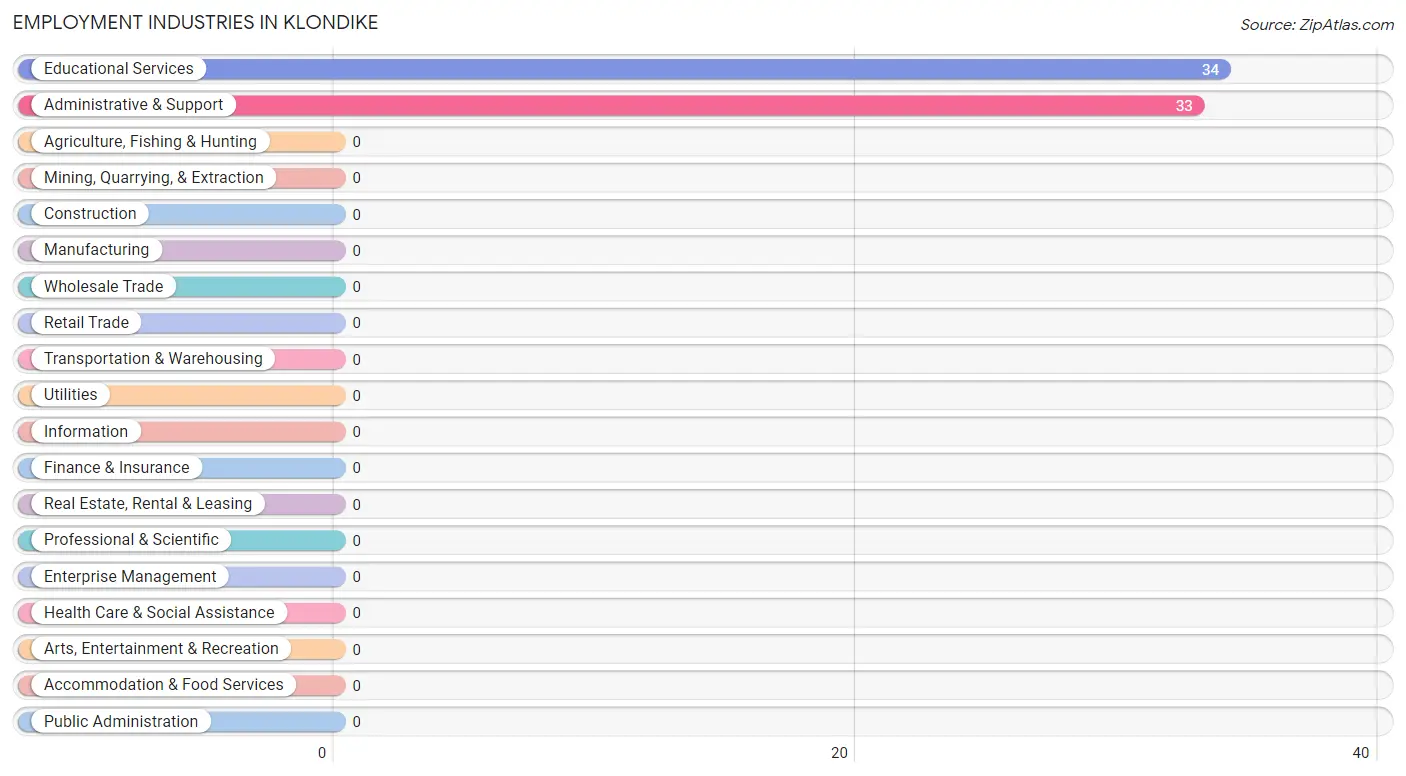
Employment Industries in Klondike
The major employment industries in Klondike include Educational Services (34 | 50.7%), and Administrative & Support (33 | 49.2%).
Employment Industries by Sex in Klondike
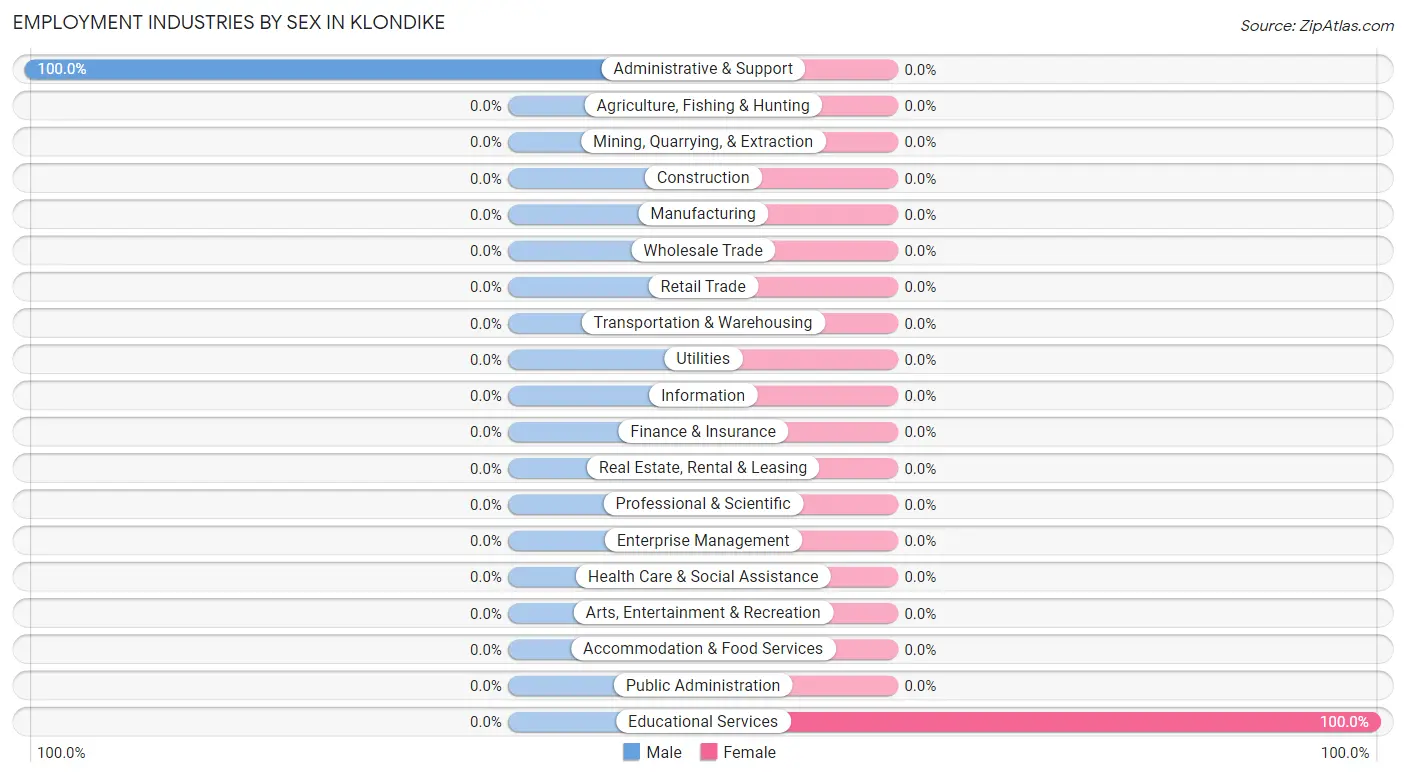
| Industry | Male | Female |
| Agriculture, Fishing & Hunting | 0 (0.0%) | 0 (0.0%) |
| Mining, Quarrying, & Extraction | 0 (0.0%) | 0 (0.0%) |
| Construction | 0 (0.0%) | 0 (0.0%) |
| Manufacturing | 0 (0.0%) | 0 (0.0%) |
| Wholesale Trade | 0 (0.0%) | 0 (0.0%) |
| Retail Trade | 0 (0.0%) | 0 (0.0%) |
| Transportation & Warehousing | 0 (0.0%) | 0 (0.0%) |
| Utilities | 0 (0.0%) | 0 (0.0%) |
| Information | 0 (0.0%) | 0 (0.0%) |
| Finance & Insurance | 0 (0.0%) | 0 (0.0%) |
| Real Estate, Rental & Leasing | 0 (0.0%) | 0 (0.0%) |
| Professional & Scientific | 0 (0.0%) | 0 (0.0%) |
| Enterprise Management | 0 (0.0%) | 0 (0.0%) |
| Administrative & Support | 33 (100.0%) | 0 (0.0%) |
| Educational Services | 0 (0.0%) | 34 (100.0%) |
| Health Care & Social Assistance | 0 (0.0%) | 0 (0.0%) |
| Arts, Entertainment & Recreation | 0 (0.0%) | 0 (0.0%) |
| Accommodation & Food Services | 0 (0.0%) | 0 (0.0%) |
| Public Administration | 0 (0.0%) | 0 (0.0%) |
| Total | 33 (49.2%) | 34 (50.7%) |
Education in Klondike
School Enrollment in Klondike
The most common levels of schooling among the 118 students in Klondike are elementary school (45 | 38.1%), nursery / preschool (40 | 33.9%), and high school (33 | 28.0%).
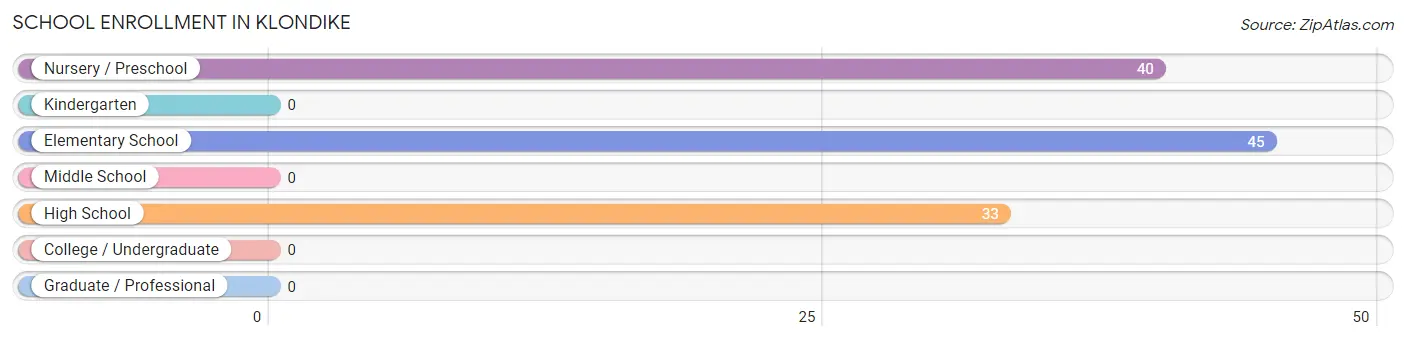
| School Level | # Students | % Students |
| Nursery / Preschool | 40 | 33.9% |
| Kindergarten | 0 | 0.0% |
| Elementary School | 45 | 38.1% |
| Middle School | 0 | 0.0% |
| High School | 33 | 28.0% |
| College / Undergraduate | 0 | 0.0% |
| Graduate / Professional | 0 | 0.0% |
| Total | 118 | 100.0% |
School Enrollment by Age by Funding Source in Klondike
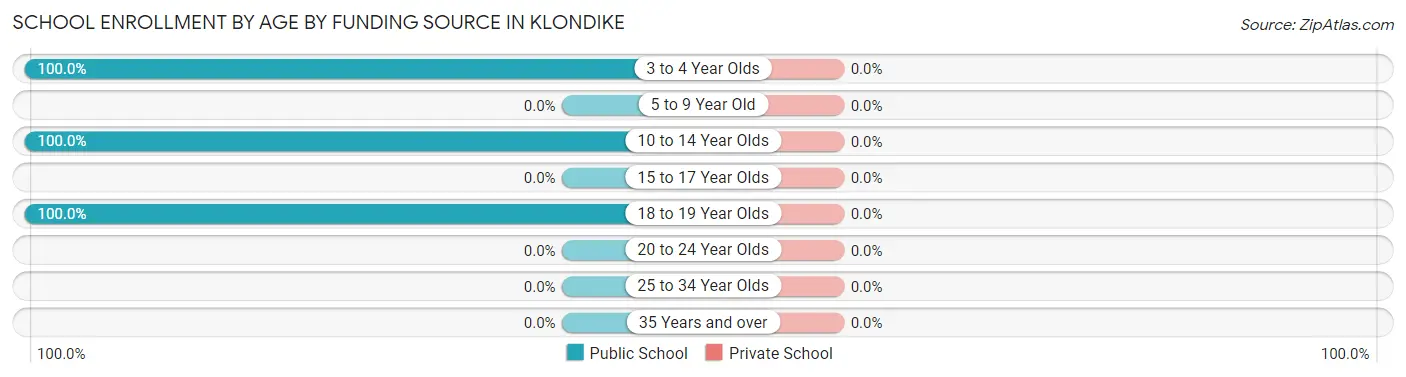
| Age Bracket | Public School | Private School |
| 3 to 4 Year Olds | 40 (100.0%) | 0 (0.0%) |
| 5 to 9 Year Old | 0 (0.0%) | 0 (0.0%) |
| 10 to 14 Year Olds | 45 (100.0%) | 0 (0.0%) |
| 15 to 17 Year Olds | 0 (0.0%) | 0 (0.0%) |
| 18 to 19 Year Olds | 33 (100.0%) | 0 (0.0%) |
| 20 to 24 Year Olds | 0 (0.0%) | 0 (0.0%) |
| 25 to 34 Year Olds | 0 (0.0%) | 0 (0.0%) |
| 35 Years and over | 0 (0.0%) | 0 (0.0%) |
| Total | 118 (100.0%) | 0 (0.0%) |
Educational Attainment by Field of Study in Klondike
Computers & mathematics (39 | 39.0%), psychology (34 | 34.0%), and social sciences (27 | 27.0%) are the most common fields of study among 100 individuals in Klondike who have obtained a bachelor's degree or higher.
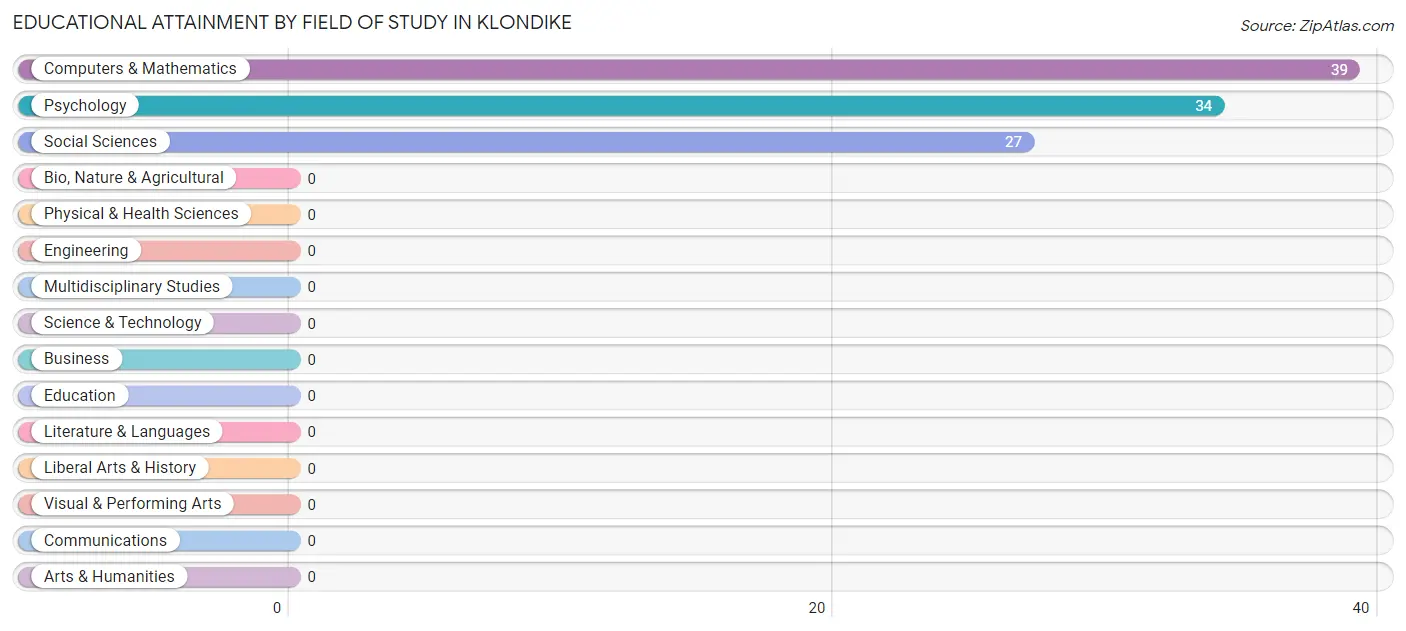
| Field of Study | # Graduates | % Graduates |
| Computers & Mathematics | 39 | 39.0% |
| Bio, Nature & Agricultural | 0 | 0.0% |
| Physical & Health Sciences | 0 | 0.0% |
| Psychology | 34 | 34.0% |
| Social Sciences | 27 | 27.0% |
| Engineering | 0 | 0.0% |
| Multidisciplinary Studies | 0 | 0.0% |
| Science & Technology | 0 | 0.0% |
| Business | 0 | 0.0% |
| Education | 0 | 0.0% |
| Literature & Languages | 0 | 0.0% |
| Liberal Arts & History | 0 | 0.0% |
| Visual & Performing Arts | 0 | 0.0% |
| Communications | 0 | 0.0% |
| Arts & Humanities | 0 | 0.0% |
| Total | 100 | 100.0% |
Transportation & Commute in Klondike
Vehicle Availability by Sex in Klondike
The most prevalent vehicle ownership categories in Klondike are males with 2 vehicles (33, accounting for 100.0%) and females with 2 vehicles (34, making up 97.1%).
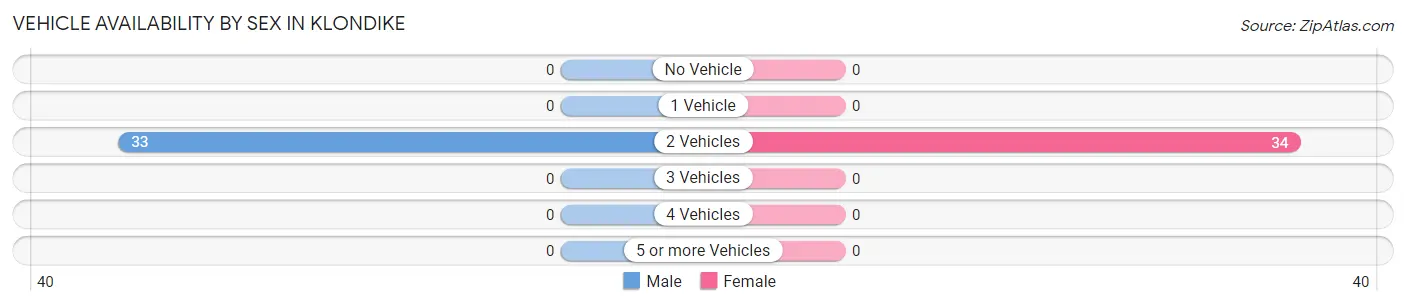
| Vehicles Available | Male | Female |
| No Vehicle | 0 (0.0%) | 0 (0.0%) |
| 1 Vehicle | 0 (0.0%) | 0 (0.0%) |
| 2 Vehicles | 33 (100.0%) | 34 (100.0%) |
| 3 Vehicles | 0 (0.0%) | 0 (0.0%) |
| 4 Vehicles | 0 (0.0%) | 0 (0.0%) |
| 5 or more Vehicles | 0 (0.0%) | 0 (0.0%) |
| Total | 33 (100.0%) | 34 (100.0%) |
Commute Time in Klondike
The most frequently occuring commute durations in Klondike are 10 to 14 minutes (34 commuters, 50.7%), 30 to 34 minutes (33 commuters, 49.2%), and less than 5 minutes (0 commuters, 0.0%).
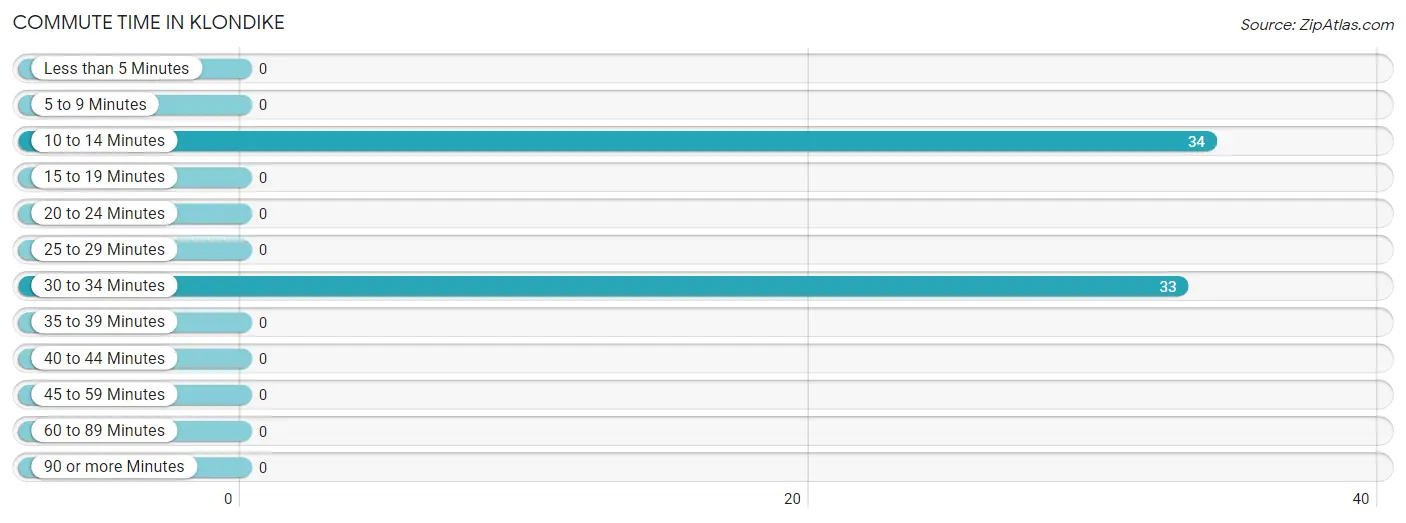
| Commute Time | # Commuters | % Commuters |
| Less than 5 Minutes | 0 | 0.0% |
| 5 to 9 Minutes | 0 | 0.0% |
| 10 to 14 Minutes | 34 | 50.7% |
| 15 to 19 Minutes | 0 | 0.0% |
| 20 to 24 Minutes | 0 | 0.0% |
| 25 to 29 Minutes | 0 | 0.0% |
| 30 to 34 Minutes | 33 | 49.2% |
| 35 to 39 Minutes | 0 | 0.0% |
| 40 to 44 Minutes | 0 | 0.0% |
| 45 to 59 Minutes | 0 | 0.0% |
| 60 to 89 Minutes | 0 | 0.0% |
| 90 or more Minutes | 0 | 0.0% |
Commute Time by Sex in Klondike
The most common commute times in Klondike are 30 to 34 minutes (33 commuters, 100.0%) for males and 10 to 14 minutes (34 commuters, 100.0%) for females.
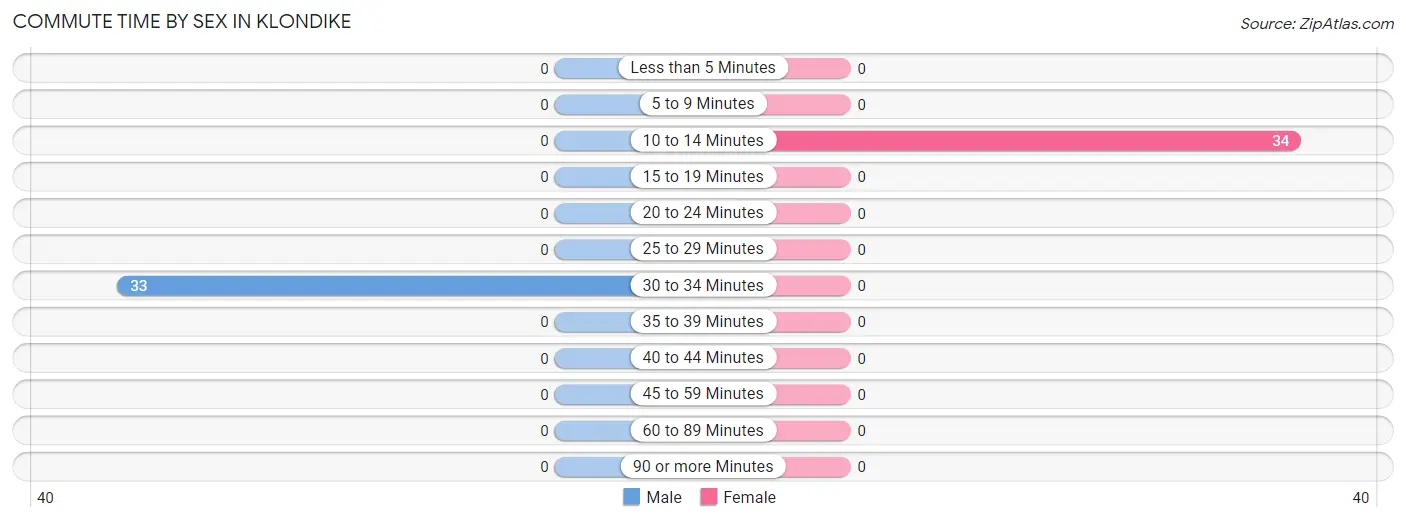
| Commute Time | Male | Female |
| Less than 5 Minutes | 0 (0.0%) | 0 (0.0%) |
| 5 to 9 Minutes | 0 (0.0%) | 0 (0.0%) |
| 10 to 14 Minutes | 0 (0.0%) | 34 (100.0%) |
| 15 to 19 Minutes | 0 (0.0%) | 0 (0.0%) |
| 20 to 24 Minutes | 0 (0.0%) | 0 (0.0%) |
| 25 to 29 Minutes | 0 (0.0%) | 0 (0.0%) |
| 30 to 34 Minutes | 33 (100.0%) | 0 (0.0%) |
| 35 to 39 Minutes | 0 (0.0%) | 0 (0.0%) |
| 40 to 44 Minutes | 0 (0.0%) | 0 (0.0%) |
| 45 to 59 Minutes | 0 (0.0%) | 0 (0.0%) |
| 60 to 89 Minutes | 0 (0.0%) | 0 (0.0%) |
| 90 or more Minutes | 0 (0.0%) | 0 (0.0%) |
Time of Departure to Work by Sex in Klondike
The most frequent times of departure to work in Klondike are 11:00 AM to 11:59 AM (33, 100.0%) for males and 12:00 PM to 3:59 PM (34, 100.0%) for females.
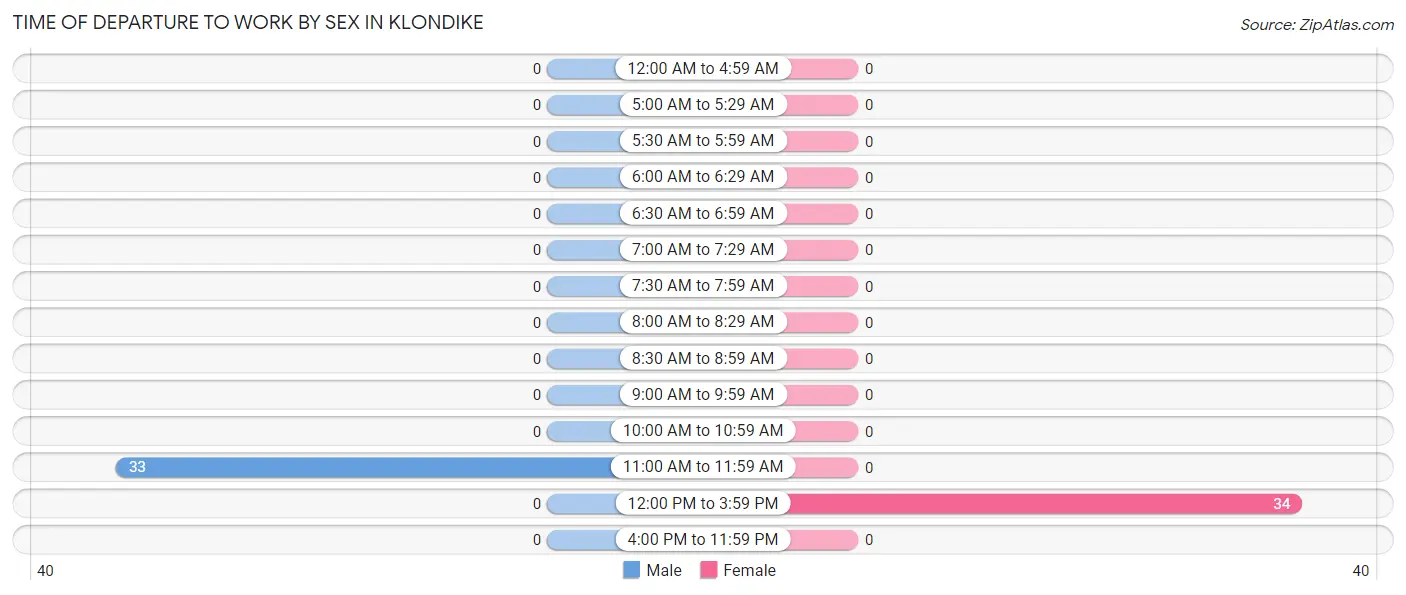
| Time of Departure | Male | Female |
| 12:00 AM to 4:59 AM | 0 (0.0%) | 0 (0.0%) |
| 5:00 AM to 5:29 AM | 0 (0.0%) | 0 (0.0%) |
| 5:30 AM to 5:59 AM | 0 (0.0%) | 0 (0.0%) |
| 6:00 AM to 6:29 AM | 0 (0.0%) | 0 (0.0%) |
| 6:30 AM to 6:59 AM | 0 (0.0%) | 0 (0.0%) |
| 7:00 AM to 7:29 AM | 0 (0.0%) | 0 (0.0%) |
| 7:30 AM to 7:59 AM | 0 (0.0%) | 0 (0.0%) |
| 8:00 AM to 8:29 AM | 0 (0.0%) | 0 (0.0%) |
| 8:30 AM to 8:59 AM | 0 (0.0%) | 0 (0.0%) |
| 9:00 AM to 9:59 AM | 0 (0.0%) | 0 (0.0%) |
| 10:00 AM to 10:59 AM | 0 (0.0%) | 0 (0.0%) |
| 11:00 AM to 11:59 AM | 33 (100.0%) | 0 (0.0%) |
| 12:00 PM to 3:59 PM | 0 (0.0%) | 34 (100.0%) |
| 4:00 PM to 11:59 PM | 0 (0.0%) | 0 (0.0%) |
| Total | 33 (100.0%) | 34 (100.0%) |
Housing Occupancy in Klondike
Occupancy by Ownership in Klondike
Of the total 71 dwellings in Klondike, owner-occupied units account for 71 (100.0%), while renter-occupied units make up 0 (0.0%).
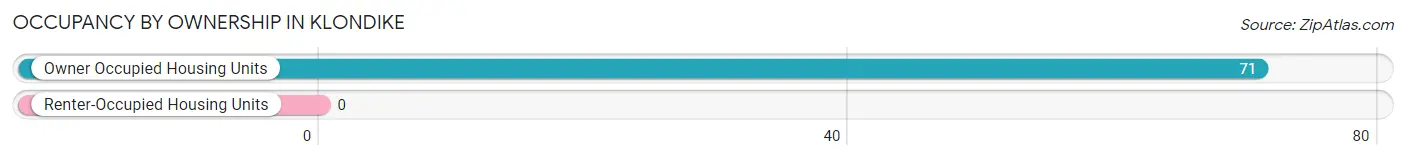
| Occupancy | # Housing Units | % Housing Units |
| Owner Occupied Housing Units | 71 | 100.0% |
| Renter-Occupied Housing Units | 0 | 0.0% |
| Total Occupied Housing Units | 71 | 100.0% |
Occupancy by Household Size in Klondike
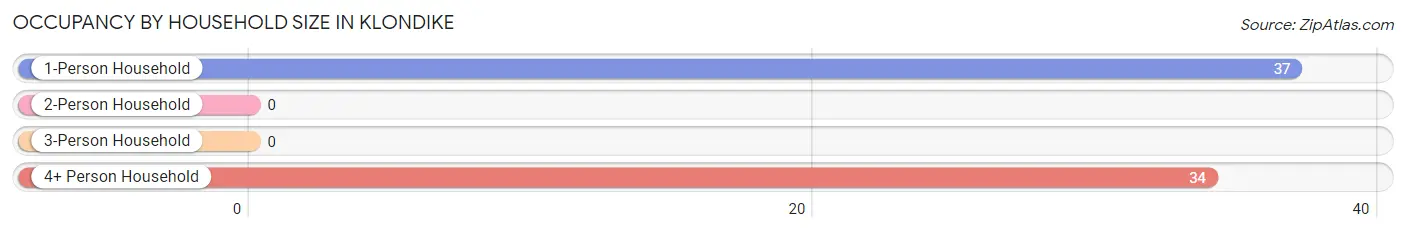
| Household Size | # Housing Units | % Housing Units |
| 1-Person Household | 37 | 52.1% |
| 2-Person Household | 0 | 0.0% |
| 3-Person Household | 0 | 0.0% |
| 4+ Person Household | 34 | 47.9% |
| Total Housing Units | 71 | 100.0% |
Occupancy by Ownership by Household Size in Klondike
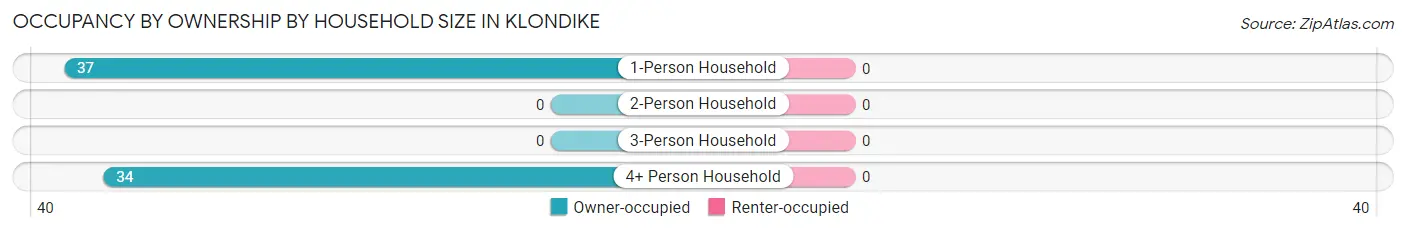
| Household Size | Owner-occupied | Renter-occupied |
| 1-Person Household | 37 (100.0%) | 0 (0.0%) |
| 2-Person Household | 0 (0.0%) | 0 (0.0%) |
| 3-Person Household | 0 (0.0%) | 0 (0.0%) |
| 4+ Person Household | 34 (100.0%) | 0 (0.0%) |
| Total Housing Units | 71 (100.0%) | 0 (0.0%) |
Occupancy by Educational Attainment in Klondike
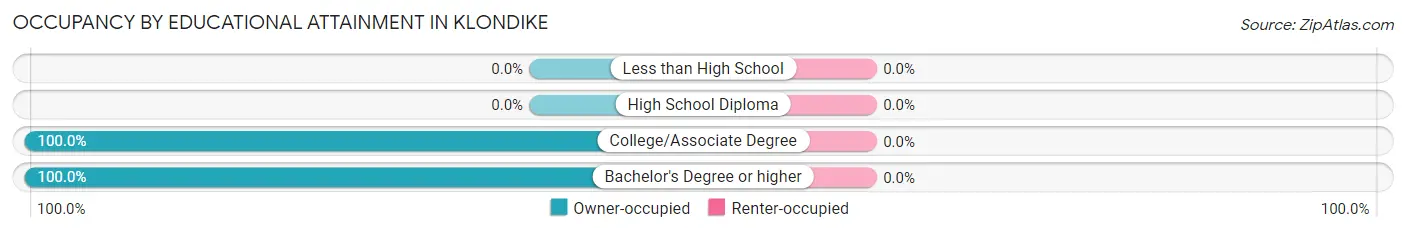
| Household Size | Owner-occupied | Renter-occupied |
| Less than High School | 0 (0.0%) | 0 (0.0%) |
| High School Diploma | 0 (0.0%) | 0 (0.0%) |
| College/Associate Degree | 10 (100.0%) | 0 (0.0%) |
| Bachelor's Degree or higher | 61 (100.0%) | 0 (0.0%) |
Occupancy by Age of Householder in Klondike
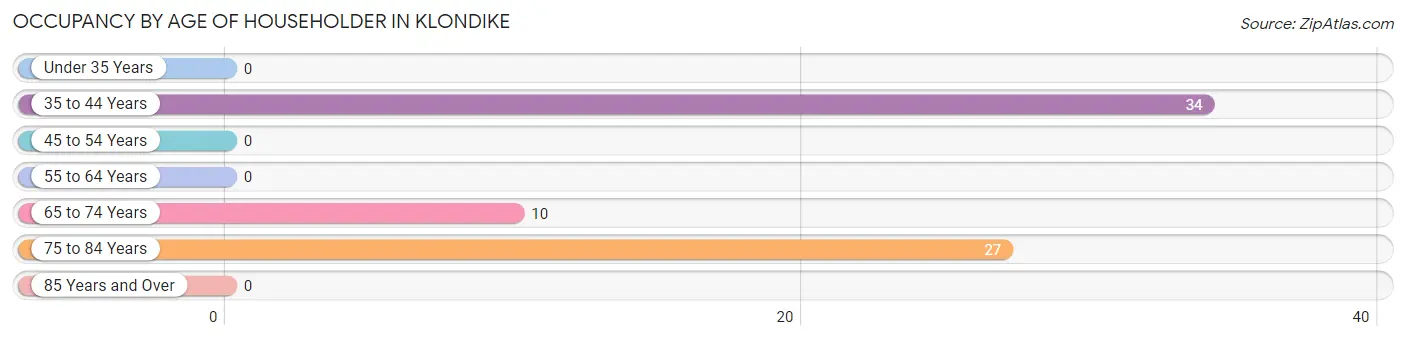
| Age Bracket | # Households | % Households |
| Under 35 Years | 0 | 0.0% |
| 35 to 44 Years | 34 | 47.9% |
| 45 to 54 Years | 0 | 0.0% |
| 55 to 64 Years | 0 | 0.0% |
| 65 to 74 Years | 10 | 14.1% |
| 75 to 84 Years | 27 | 38.0% |
| 85 Years and Over | 0 | 0.0% |
| Total | 71 | 100.0% |
Housing Finances in Klondike
Median Income by Occupancy in Klondike
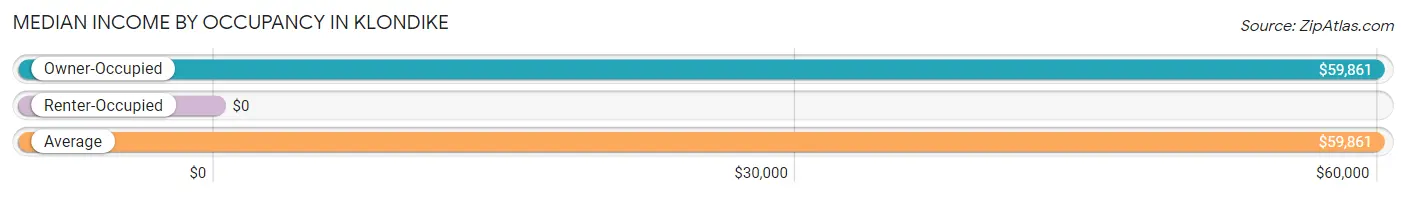
| Occupancy Type | # Households | Median Income |
| Owner-Occupied | 71 (100.0%) | $59,861 |
| Renter-Occupied | 0 (0.0%) | $0 |
| Average | 71 (100.0%) | $59,861 |
Occupancy by Householder Income Bracket in Klondike
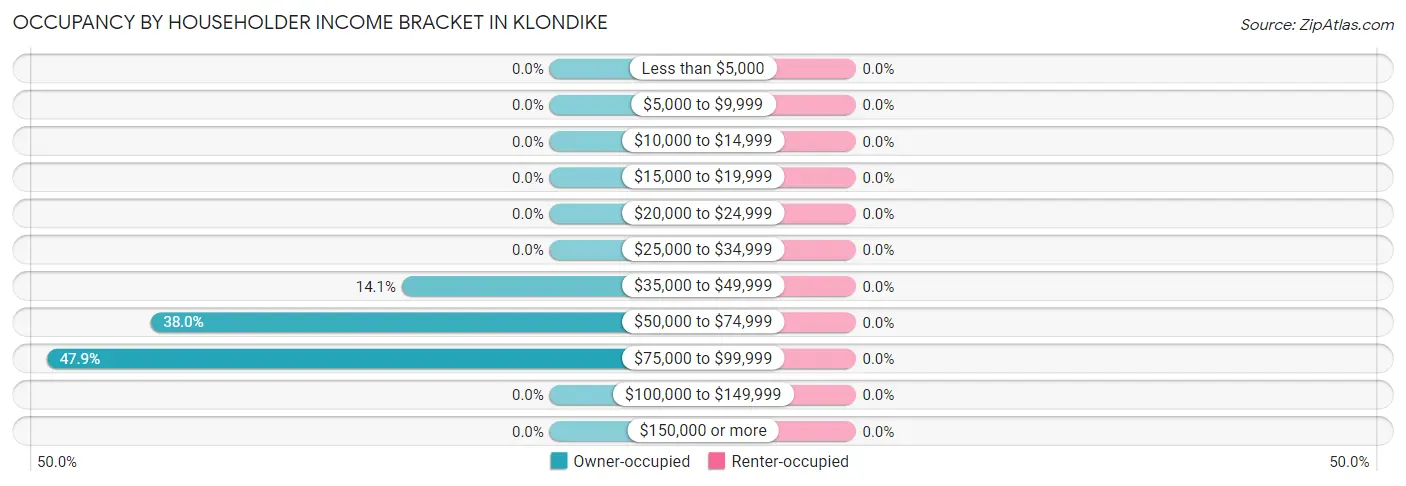
| Income Bracket | Owner-occupied | Renter-occupied |
| Less than $5,000 | 0 (0.0%) | 0 (0.0%) |
| $5,000 to $9,999 | 0 (0.0%) | 0 (0.0%) |
| $10,000 to $14,999 | 0 (0.0%) | 0 (0.0%) |
| $15,000 to $19,999 | 0 (0.0%) | 0 (0.0%) |
| $20,000 to $24,999 | 0 (0.0%) | 0 (0.0%) |
| $25,000 to $34,999 | 0 (0.0%) | 0 (0.0%) |
| $35,000 to $49,999 | 10 (14.1%) | 0 (0.0%) |
| $50,000 to $74,999 | 27 (38.0%) | 0 (0.0%) |
| $75,000 to $99,999 | 34 (47.9%) | 0 (0.0%) |
| $100,000 to $149,999 | 0 (0.0%) | 0 (0.0%) |
| $150,000 or more | 0 (0.0%) | 0 (0.0%) |
| Total | 71 (100.0%) | 0 (0.0%) |
Monthly Housing Cost Tiers in Klondike
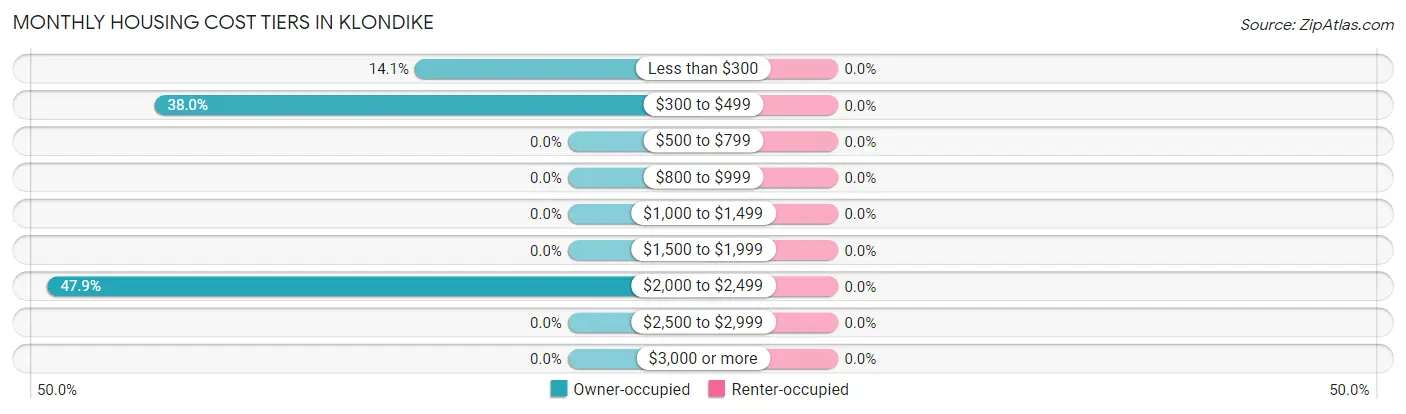
| Monthly Cost | Owner-occupied | Renter-occupied |
| Less than $300 | 10 (14.1%) | 0 (0.0%) |
| $300 to $499 | 27 (38.0%) | 0 (0.0%) |
| $500 to $799 | 0 (0.0%) | 0 (0.0%) |
| $800 to $999 | 0 (0.0%) | 0 (0.0%) |
| $1,000 to $1,499 | 0 (0.0%) | 0 (0.0%) |
| $1,500 to $1,999 | 0 (0.0%) | 0 (0.0%) |
| $2,000 to $2,499 | 34 (47.9%) | 0 (0.0%) |
| $2,500 to $2,999 | 0 (0.0%) | 0 (0.0%) |
| $3,000 or more | 0 (0.0%) | 0 (0.0%) |
| Total | 71 (100.0%) | 0 (0.0%) |
Physical Housing Characteristics in Klondike
Housing Structures in Klondike
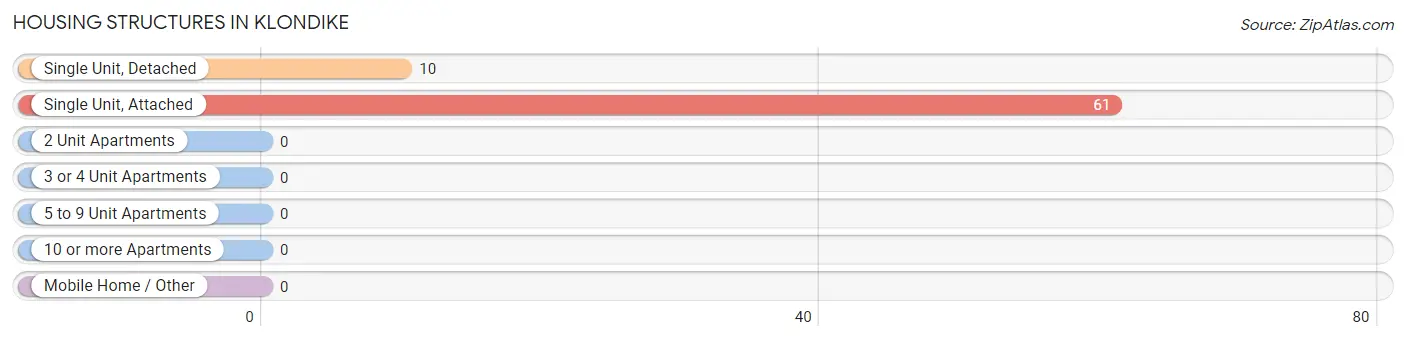
| Structure Type | # Housing Units | % Housing Units |
| Single Unit, Detached | 10 | 14.1% |
| Single Unit, Attached | 61 | 85.9% |
| 2 Unit Apartments | 0 | 0.0% |
| 3 or 4 Unit Apartments | 0 | 0.0% |
| 5 to 9 Unit Apartments | 0 | 0.0% |
| 10 or more Apartments | 0 | 0.0% |
| Mobile Home / Other | 0 | 0.0% |
| Total | 71 | 100.0% |
Housing Structures by Occupancy in Klondike
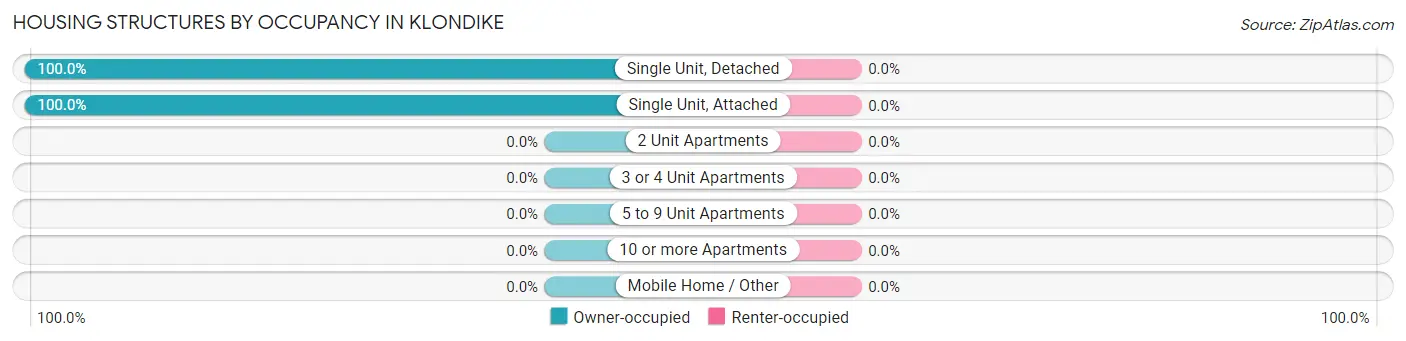
| Structure Type | Owner-occupied | Renter-occupied |
| Single Unit, Detached | 10 (100.0%) | 0 (0.0%) |
| Single Unit, Attached | 61 (100.0%) | 0 (0.0%) |
| 2 Unit Apartments | 0 (0.0%) | 0 (0.0%) |
| 3 or 4 Unit Apartments | 0 (0.0%) | 0 (0.0%) |
| 5 to 9 Unit Apartments | 0 (0.0%) | 0 (0.0%) |
| 10 or more Apartments | 0 (0.0%) | 0 (0.0%) |
| Mobile Home / Other | 0 (0.0%) | 0 (0.0%) |
| Total | 71 (100.0%) | 0 (0.0%) |
Housing Structures by Number of Rooms in Klondike
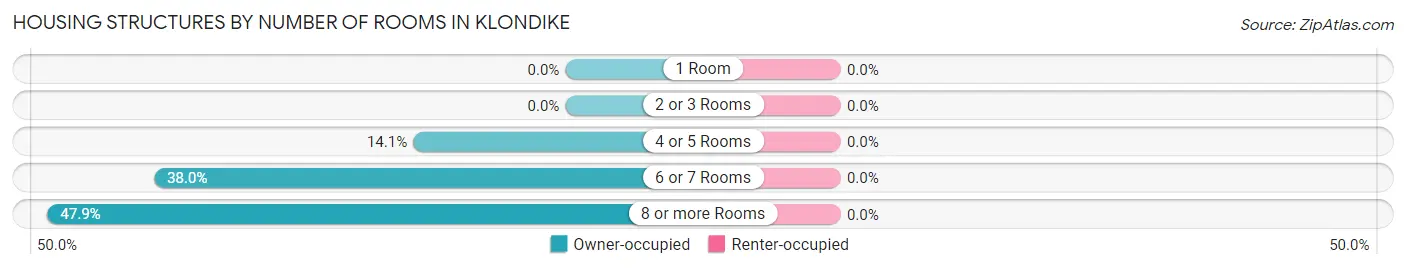
| Number of Rooms | Owner-occupied | Renter-occupied |
| 1 Room | 0 (0.0%) | 0 (0.0%) |
| 2 or 3 Rooms | 0 (0.0%) | 0 (0.0%) |
| 4 or 5 Rooms | 10 (14.1%) | 0 (0.0%) |
| 6 or 7 Rooms | 27 (38.0%) | 0 (0.0%) |
| 8 or more Rooms | 34 (47.9%) | 0 (0.0%) |
| Total | 71 (100.0%) | 0 (0.0%) |
Housing Structure by Heating Type in Klondike
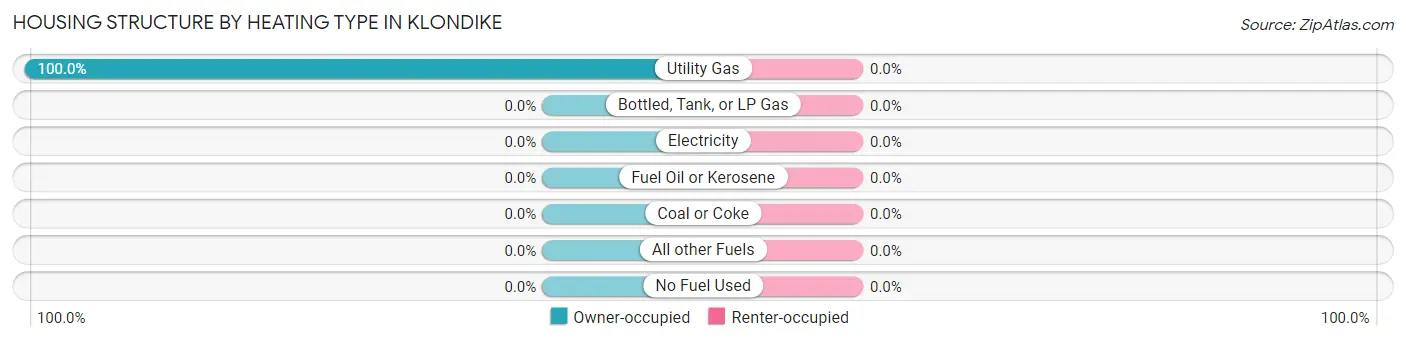
| Heating Type | Owner-occupied | Renter-occupied |
| Utility Gas | 71 (100.0%) | 0 (0.0%) |
| Bottled, Tank, or LP Gas | 0 (0.0%) | 0 (0.0%) |
| Electricity | 0 (0.0%) | 0 (0.0%) |
| Fuel Oil or Kerosene | 0 (0.0%) | 0 (0.0%) |
| Coal or Coke | 0 (0.0%) | 0 (0.0%) |
| All other Fuels | 0 (0.0%) | 0 (0.0%) |
| No Fuel Used | 0 (0.0%) | 0 (0.0%) |
| Total | 71 (100.0%) | 0 (0.0%) |
Household Vehicle Usage in Klondike
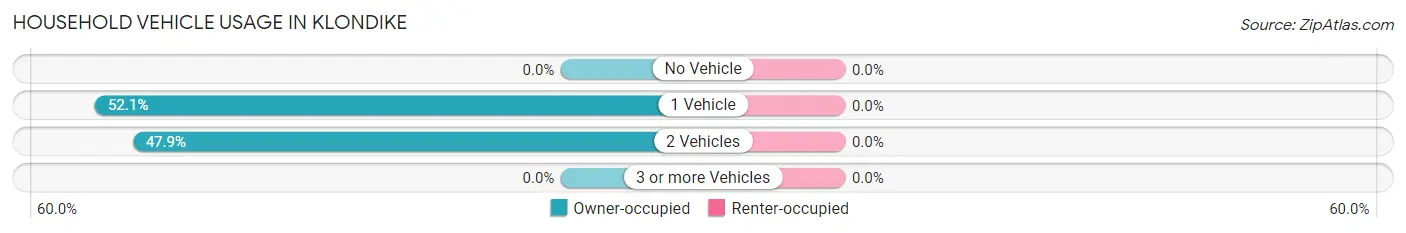
| Vehicles per Household | Owner-occupied | Renter-occupied |
| No Vehicle | 0 (0.0%) | 0 (0.0%) |
| 1 Vehicle | 37 (52.1%) | 0 (0.0%) |
| 2 Vehicles | 34 (47.9%) | 0 (0.0%) |
| 3 or more Vehicles | 0 (0.0%) | 0 (0.0%) |
| Total | 71 (100.0%) | 0 (0.0%) |
Real Estate & Mortgages in Klondike
Real Estate and Mortgage Overview in Klondike
| Characteristic | Without Mortgage | With Mortgage |
| Housing Units | 37 | 34 |
| Median Property Value | - | - |
| Median Household Income | - | - |
| Monthly Housing Costs | - | - |
| Real Estate Taxes | - | - |
Property Value by Mortgage Status in Klondike
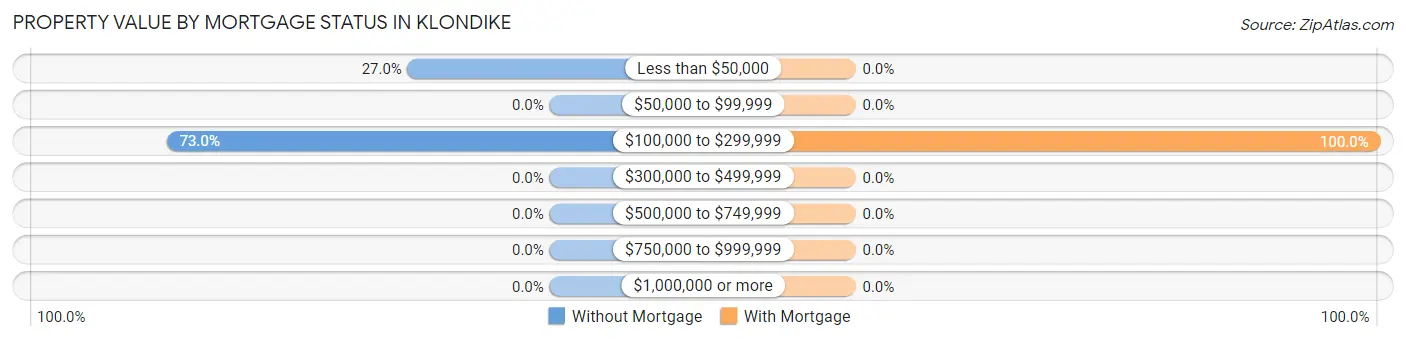
| Property Value | Without Mortgage | With Mortgage |
| Less than $50,000 | 10 (27.0%) | 0 (0.0%) |
| $50,000 to $99,999 | 0 (0.0%) | 0 (0.0%) |
| $100,000 to $299,999 | 27 (73.0%) | 34 (100.0%) |
| $300,000 to $499,999 | 0 (0.0%) | 0 (0.0%) |
| $500,000 to $749,999 | 0 (0.0%) | 0 (0.0%) |
| $750,000 to $999,999 | 0 (0.0%) | 0 (0.0%) |
| $1,000,000 or more | 0 (0.0%) | 0 (0.0%) |
| Total | 37 (100.0%) | 34 (100.0%) |
Household Income by Mortgage Status in Klondike
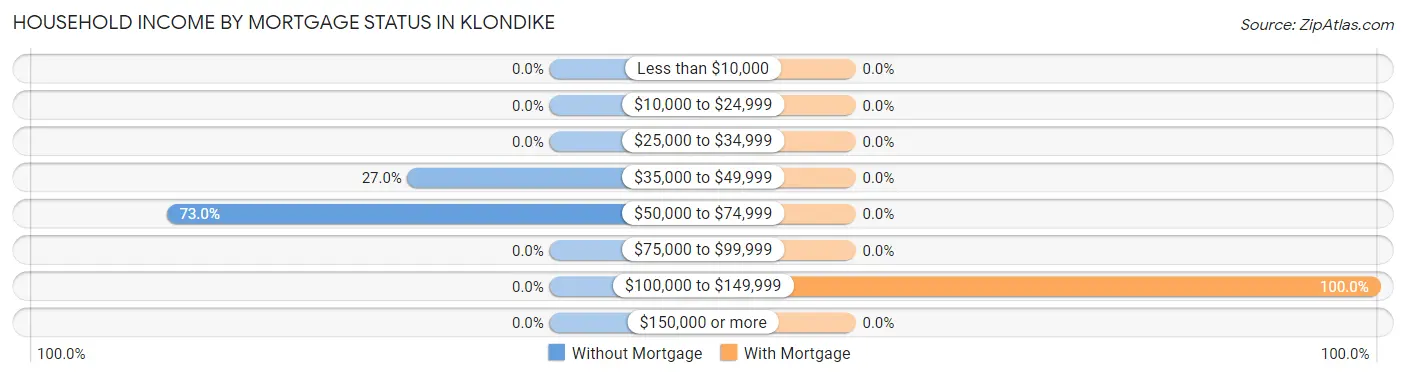
| Household Income | Without Mortgage | With Mortgage |
| Less than $10,000 | 0 (0.0%) | 0 (0.0%) |
| $10,000 to $24,999 | 0 (0.0%) | 0 (0.0%) |
| $25,000 to $34,999 | 0 (0.0%) | 0 (0.0%) |
| $35,000 to $49,999 | 10 (27.0%) | 0 (0.0%) |
| $50,000 to $74,999 | 27 (73.0%) | 0 (0.0%) |
| $75,000 to $99,999 | 0 (0.0%) | 0 (0.0%) |
| $100,000 to $149,999 | 0 (0.0%) | 34 (100.0%) |
| $150,000 or more | 0 (0.0%) | 0 (0.0%) |
| Total | 37 (100.0%) | 34 (100.0%) |
Property Value to Household Income Ratio in Klondike
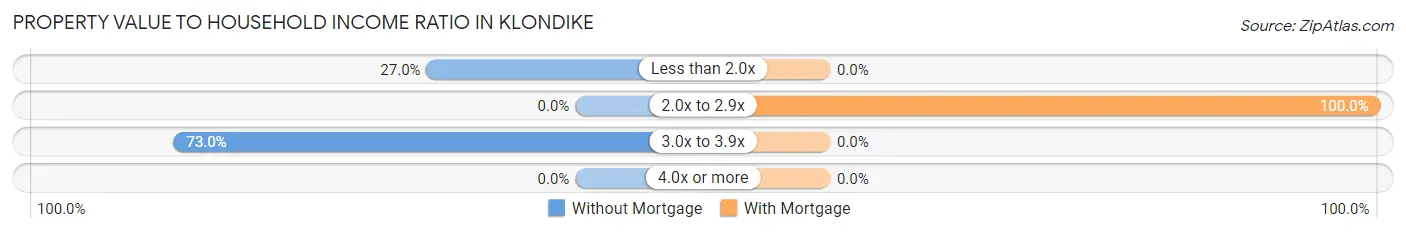
| Value-to-Income Ratio | Without Mortgage | With Mortgage |
| Less than 2.0x | 10 (27.0%) | 0 (0.0%) |
| 2.0x to 2.9x | 0 (0.0%) | 34 (100.0%) |
| 3.0x to 3.9x | 27 (73.0%) | 0 (0.0%) |
| 4.0x or more | 0 (0.0%) | 0 (0.0%) |
| Total | 37 (100.0%) | 34 (100.0%) |
Real Estate Taxes by Mortgage Status in Klondike
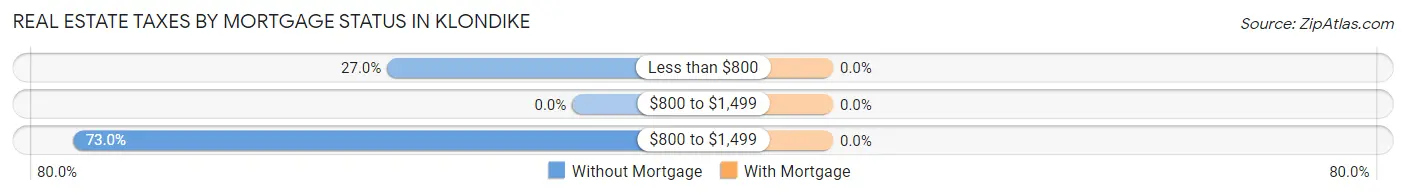
| Property Taxes | Without Mortgage | With Mortgage |
| Less than $800 | 10 (27.0%) | 0 (0.0%) |
| $800 to $1,499 | 0 (0.0%) | 0 (0.0%) |
| $800 to $1,499 | 27 (73.0%) | 0 (0.0%) |
| Total | 37 (100.0%) | 34 (100.0%) |
Health & Disability in Klondike
Health Insurance Coverage by Age in Klondike
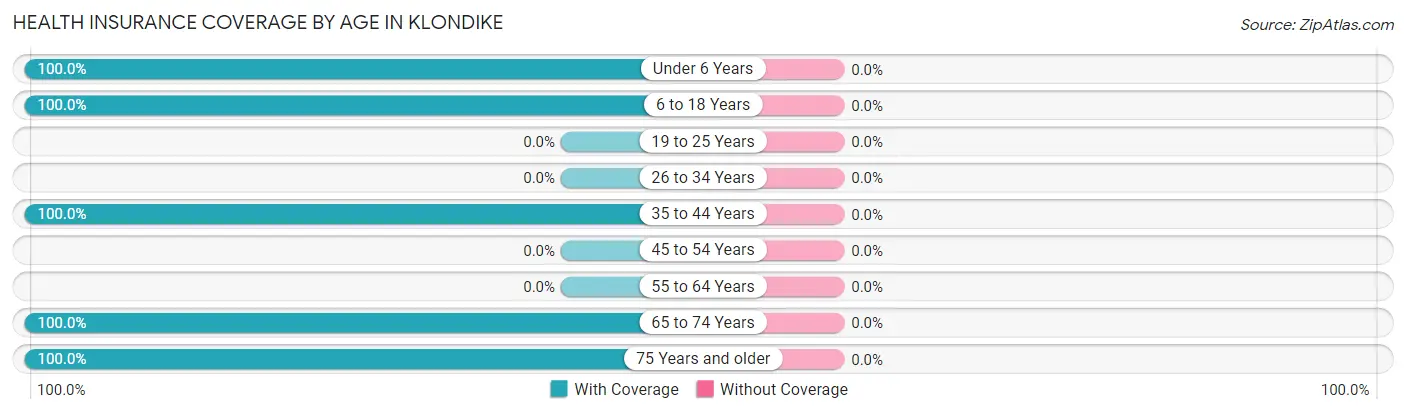
| Age Bracket | With Coverage | Without Coverage |
| Under 6 Years | 40 (100.0%) | 0 (0.0%) |
| 6 to 18 Years | 78 (100.0%) | 0 (0.0%) |
| 19 to 25 Years | 0 (0.0%) | 0 (0.0%) |
| 26 to 34 Years | 0 (0.0%) | 0 (0.0%) |
| 35 to 44 Years | 73 (100.0%) | 0 (0.0%) |
| 45 to 54 Years | 0 (0.0%) | 0 (0.0%) |
| 55 to 64 Years | 0 (0.0%) | 0 (0.0%) |
| 65 to 74 Years | 10 (100.0%) | 0 (0.0%) |
| 75 Years and older | 27 (100.0%) | 0 (0.0%) |
| Total | 228 (100.0%) | 0 (0.0%) |
Health Insurance Coverage by Citizenship Status in Klondike
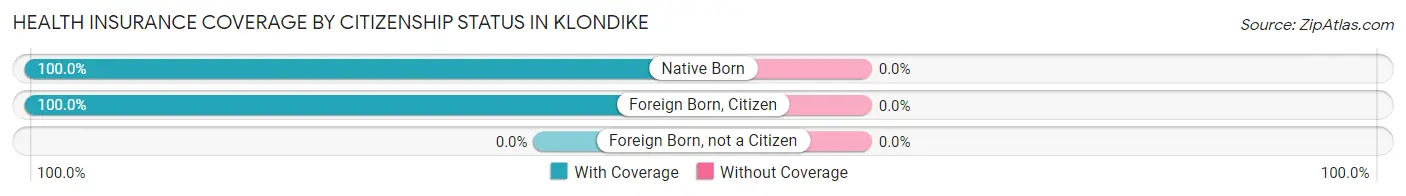
| Citizenship Status | With Coverage | Without Coverage |
| Native Born | 40 (100.0%) | 0 (0.0%) |
| Foreign Born, Citizen | 78 (100.0%) | 0 (0.0%) |
| Foreign Born, not a Citizen | 0 (0.0%) | 0 (0.0%) |
Health Insurance Coverage by Household Income in Klondike
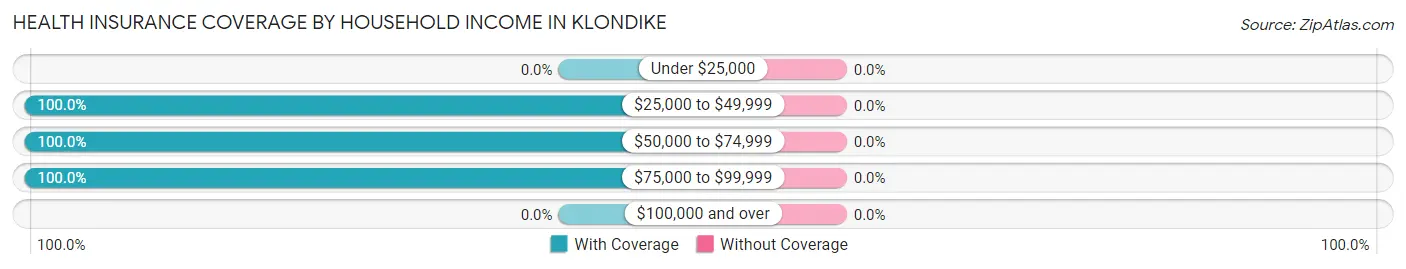
| Household Income | With Coverage | Without Coverage |
| Under $25,000 | 0 (0.0%) | 0 (0.0%) |
| $25,000 to $49,999 | 10 (100.0%) | 0 (0.0%) |
| $50,000 to $74,999 | 27 (100.0%) | 0 (0.0%) |
| $75,000 to $99,999 | 191 (100.0%) | 0 (0.0%) |
| $100,000 and over | 0 (0.0%) | 0 (0.0%) |
Public vs Private Health Insurance Coverage by Age in Klondike
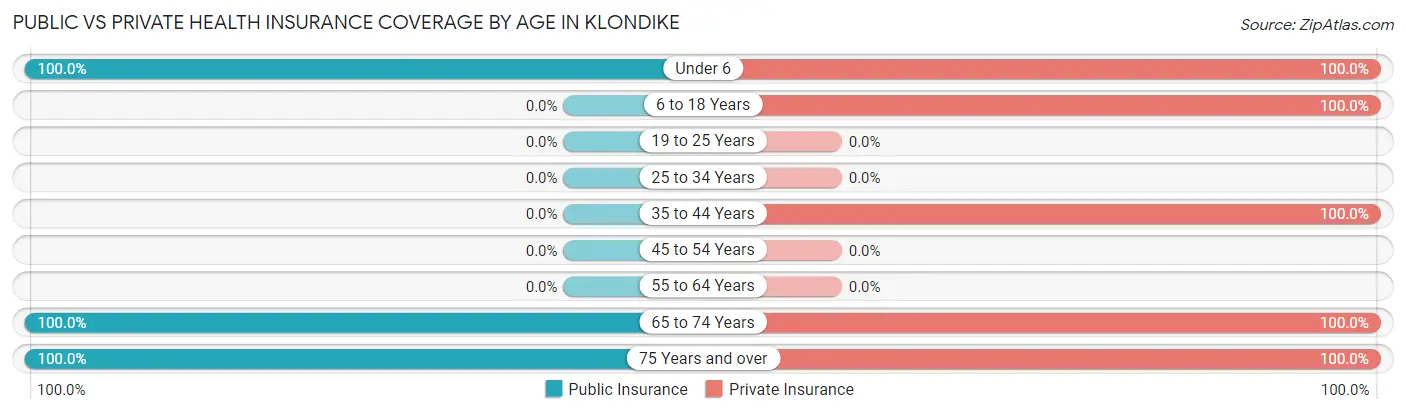
| Age Bracket | Public Insurance | Private Insurance |
| Under 6 | 40 (100.0%) | 40 (100.0%) |
| 6 to 18 Years | 0 (0.0%) | 78 (100.0%) |
| 19 to 25 Years | 0 (0.0%) | 0 (0.0%) |
| 25 to 34 Years | 0 (0.0%) | 0 (0.0%) |
| 35 to 44 Years | 0 (0.0%) | 73 (100.0%) |
| 45 to 54 Years | 0 (0.0%) | 0 (0.0%) |
| 55 to 64 Years | 0 (0.0%) | 0 (0.0%) |
| 65 to 74 Years | 10 (100.0%) | 10 (100.0%) |
| 75 Years and over | 27 (100.0%) | 27 (100.0%) |
| Total | 77 (33.8%) | 228 (100.0%) |
Disability Status by Sex by Age in Klondike
| Age Bracket | Male | Female |
| Under 5 Years | 0 (0.0%) | 0 (0.0%) |
| 5 to 17 Years | 0 (0.0%) | 0 (0.0%) |
| 18 to 34 Years | 0 (0.0%) | 0 (0.0%) |
| 35 to 64 Years | 0 (0.0%) | 0 (0.0%) |
| 65 to 74 Years | 0 (0.0%) | 0 (0.0%) |
| 75 Years and over | 0 (0.0%) | 0 (0.0%) |
Disability Class by Sex by Age in Klondike
Disability Class: Hearing Difficulty
| Age Bracket | Male | Female |
| Under 5 Years | 0 (0.0%) | 0 (0.0%) |
| 5 to 17 Years | 0 (0.0%) | 0 (0.0%) |
| 18 to 34 Years | 0 (0.0%) | 0 (0.0%) |
| 35 to 64 Years | 0 (0.0%) | 0 (0.0%) |
| 65 to 74 Years | 0 (0.0%) | 0 (0.0%) |
| 75 Years and over | 0 (0.0%) | 0 (0.0%) |
Disability Class: Vision Difficulty
| Age Bracket | Male | Female |
| Under 5 Years | 0 (0.0%) | 0 (0.0%) |
| 5 to 17 Years | 0 (0.0%) | 0 (0.0%) |
| 18 to 34 Years | 0 (0.0%) | 0 (0.0%) |
| 35 to 64 Years | 0 (0.0%) | 0 (0.0%) |
| 65 to 74 Years | 0 (0.0%) | 0 (0.0%) |
| 75 Years and over | 0 (0.0%) | 0 (0.0%) |
Disability Class: Cognitive Difficulty
| Age Bracket | Male | Female |
| 5 to 17 Years | 0 (0.0%) | 0 (0.0%) |
| 18 to 34 Years | 0 (0.0%) | 0 (0.0%) |
| 35 to 64 Years | 0 (0.0%) | 0 (0.0%) |
| 65 to 74 Years | 0 (0.0%) | 0 (0.0%) |
| 75 Years and over | 0 (0.0%) | 0 (0.0%) |
Disability Class: Ambulatory Difficulty
| Age Bracket | Male | Female |
| 5 to 17 Years | 0 (0.0%) | 0 (0.0%) |
| 18 to 34 Years | 0 (0.0%) | 0 (0.0%) |
| 35 to 64 Years | 0 (0.0%) | 0 (0.0%) |
| 65 to 74 Years | 0 (0.0%) | 0 (0.0%) |
| 75 Years and over | 0 (0.0%) | 0 (0.0%) |
Disability Class: Self-Care Difficulty

| Age Bracket | Male | Female |
| 5 to 17 Years | 0 (0.0%) | 0 (0.0%) |
| 18 to 34 Years | 0 (0.0%) | 0 (0.0%) |
| 35 to 64 Years | 0 (0.0%) | 0 (0.0%) |
| 65 to 74 Years | 0 (0.0%) | 0 (0.0%) |
| 75 Years and over | 0 (0.0%) | 0 (0.0%) |
Technology Access in Klondike
Computing Device Access in Klondike
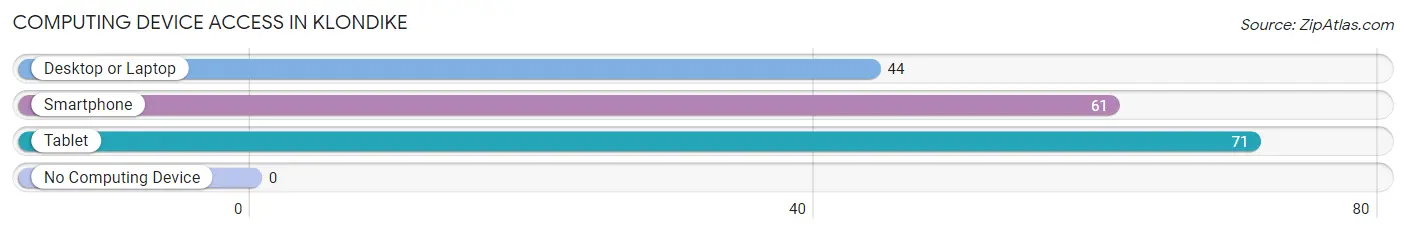
| Device Type | # Households | % Households |
| Desktop or Laptop | 44 | 62.0% |
| Smartphone | 61 | 85.9% |
| Tablet | 71 | 100.0% |
| No Computing Device | 0 | 0.0% |
| Total | 71 | 100.0% |
Internet Access in Klondike
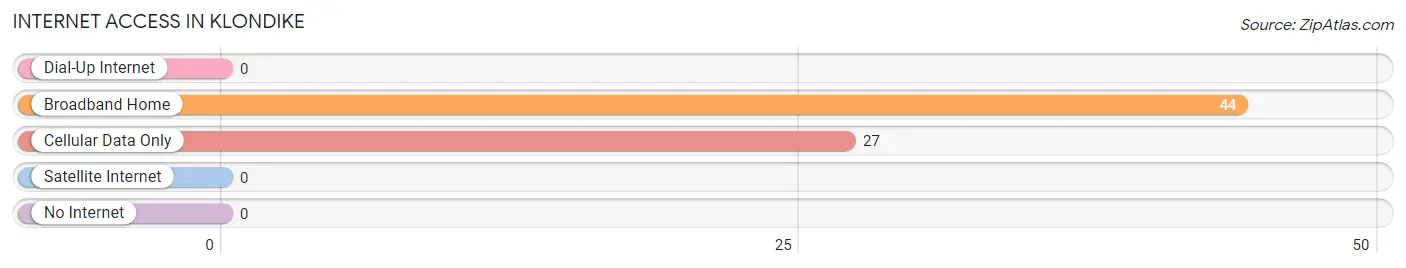
| Internet Type | # Households | % Households |
| Dial-Up Internet | 0 | 0.0% |
| Broadband Home | 44 | 62.0% |
| Cellular Data Only | 27 | 38.0% |
| Satellite Internet | 0 | 0.0% |
| No Internet | 0 | 0.0% |
| Total | 71 | 100.0% |
Klondike Summary
Klondike, Maryland is a small town located in the northern part of the state, in Garrett County. It is situated in the Appalachian Mountains, and is surrounded by lush forests and rolling hills. The town has a population of just over 1,000 people, and is known for its rural charm and small-town atmosphere.
History
Klondike was founded in 1883 by a group of settlers from Pennsylvania. The town was named after the Klondike gold rush, which had taken place in the Yukon Territory of Canada a few years prior. The settlers were drawn to the area by the promise of gold, but instead found a wealth of timber and coal. The town quickly grew, and by the early 1900s, it had become a bustling center of industry.
The town was home to several coal mines, as well as a number of sawmills and other timber-related businesses. The town also had a thriving agricultural sector, with many farmers growing crops such as corn, wheat, and hay. The town was also home to a number of small businesses, such as general stores, blacksmiths, and a hotel.
The town was also home to a number of churches, including the First Presbyterian Church, which was founded in 1884. The church is still active today, and is the oldest church in the town.
Geography
Klondike is located in the northern part of Garrett County, in the Appalachian Mountains. The town is situated at an elevation of 2,000 feet, and is surrounded by lush forests and rolling hills. The town is located near the headwaters of the Youghiogheny River, and is just a few miles from the Pennsylvania border.
The town is located in a temperate climate, with warm summers and cold winters. The average temperature in the summer is around 75 degrees Fahrenheit, and the average temperature in the winter is around 25 degrees Fahrenheit. The town receives an average of 40 inches of precipitation each year, with most of it falling in the form of snow.
Economy
Klondike’s economy is largely based on tourism and agriculture. The town is home to a number of tourist attractions, such as the Klondike Historic District, which is listed on the National Register of Historic Places. The town also has a number of small businesses, such as restaurants, shops, and galleries.
Agriculture is also an important part of the town’s economy. The town is home to a number of farms, which grow crops such as corn, wheat, and hay. The town also has a number of apple orchards, which produce apples for local consumption and for sale at farmers’ markets.
Demographics
As of the 2010 census, Klondike had a population of 1,072 people. The town is predominantly white, with 92.3% of the population identifying as such. The town also has a small Hispanic population, with 4.2% of the population identifying as Hispanic or Latino. The town also has a small African American population, with 1.3% of the population identifying as such.
The median household income in Klondike is $41,250, and the median home value is $117,400. The town has a poverty rate of 11.3%, which is slightly higher than the national average. The town also has a high rate of unemployment, with 8.2% of the population being unemployed.
Klondike is a small town with a rich history and a unique culture. The town is home to a number of tourist attractions, as well as a thriving agricultural sector. The town also has a number of small businesses, and a diverse population. Klondike is a great place to visit, and a wonderful place to call home.
Common Questions
What is Per Capita Income in Klondike?
Per Capita income in Klondike is $21,063.
What is the Median Household income in Klondike?
Median Household Income in Klondike is $59,861.
What is Inequality or Gini Index in Klondike?
Inequality or Gini Index in Klondike is 0.12.
What is the Total Population of Klondike?
Total Population of Klondike is 228.
What is the Total Male Population of Klondike?
Total Male Population of Klondike is 144.
What is the Total Female Population of Klondike?
Total Female Population of Klondike is 84.
What is the Ratio of Males per 100 Females in Klondike?
There are 171.43 Males per 100 Females in Klondike.
What is the Ratio of Females per 100 Males in Klondike?
There are 58.33 Females per 100 Males in Klondike.
What is the Median Population Age in Klondike?
Median Population Age in Klondike is 18.9 Years.
What is the Average Family Size in Klondike
Average Family Size in Klondike is 4.4 People.
What is the Average Household Size in Klondike
Average Household Size in Klondike is 3.2 People.
How Large is the Labor Force in Klondike?
There are 67 People in the Labor Forcein in Klondike.
What is the Percentage of People in the Labor Force in Klondike?
46.9% of People are in the Labor Force in Klondike.