Kettering, MD Map & Demographics
Kettering Map
Kettering Overview
$57,257
PER CAPITA INCOME
$130,775
AVG FAMILY INCOME
$107,703
AVG HOUSEHOLD INCOME
12.4%
WAGE / INCOME GAP [ % ]
87.6¢/ $1
WAGE / INCOME GAP [ $ ]
0.38
INEQUALITY / GINI INDEX
13,873
TOTAL POPULATION
6,010
MALE POPULATION
7,863
FEMALE POPULATION
76.43
MALES / 100 FEMALES
130.83
FEMALES / 100 MALES
49.7
MEDIAN AGE
3.3
AVG FAMILY SIZE
2.3
AVG HOUSEHOLD SIZE
7,346
LABOR FORCE [ PEOPLE ]
62.1%
PERCENT IN LABOR FORCE
6.6%
UNEMPLOYMENT RATE
Income in Kettering
Income Overview in Kettering
Per Capita Income in Kettering is $57,257, while median incomes of families and households are $130,775 and $107,703 respectively.
| Characteristic | Number | Measure |
| Per Capita Income | 13,873 | $57,257 |
| Median Family Income | 3,286 | $130,775 |
| Mean Family Income | 3,286 | $153,021 |
| Median Household Income | 5,937 | $107,703 |
| Mean Household Income | 5,937 | $127,384 |
| Income Deficit | 3,286 | $0 |
| Wage / Income Gap (%) | 13,873 | 12.38% |
| Wage / Income Gap ($) | 13,873 | 87.62¢ per $1 |
| Gini / Inequality Index | 13,873 | 0.38 |
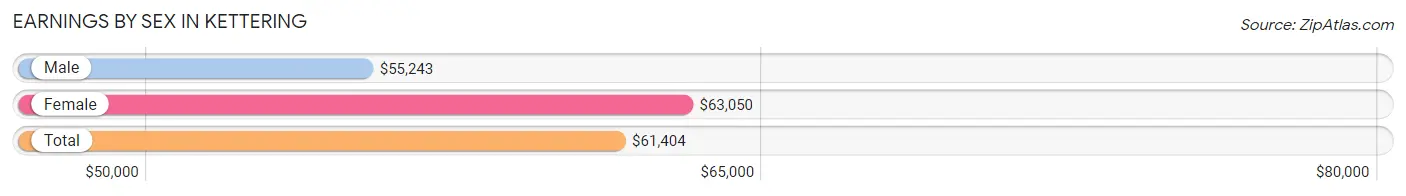
Earnings by Sex in Kettering
Average Earnings in Kettering are $61,404, $55,243 for men and $63,050 for women, a difference of 12.4%.
| Sex | Number | Average Earnings |
| Male | 3,223 (42.9%) | $55,243 |
| Female | 4,296 (57.1%) | $63,050 |
| Total | 7,519 (100.0%) | $61,404 |
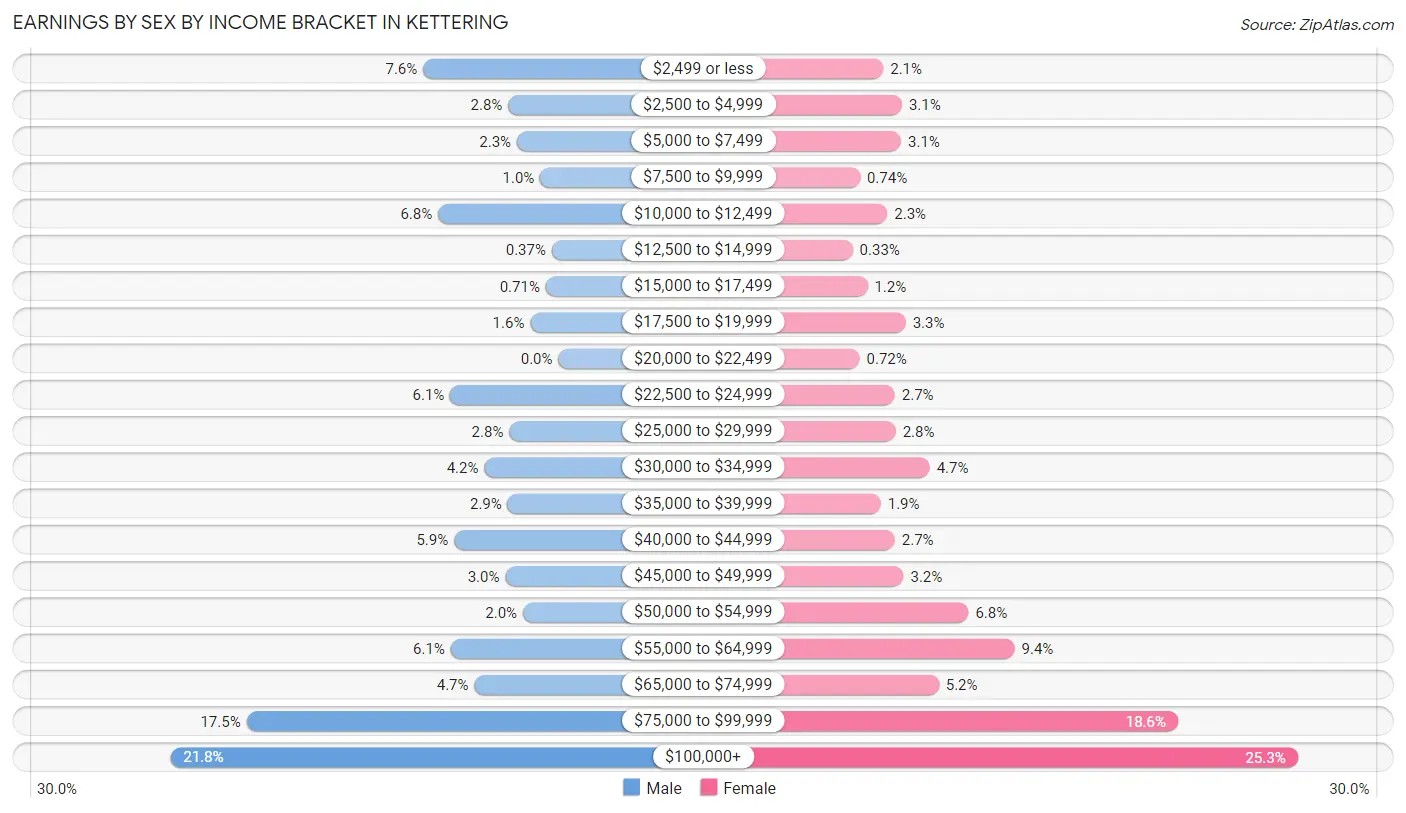
Earnings by Sex by Income Bracket in Kettering
The most common earnings brackets in Kettering are $100,000+ for men (703 | 21.8%) and $100,000+ for women (1,088 | 25.3%).
| Income | Male | Female |
| $2,499 or less | 245 (7.6%) | 88 (2.1%) |
| $2,500 to $4,999 | 91 (2.8%) | 133 (3.1%) |
| $5,000 to $7,499 | 75 (2.3%) | 131 (3.0%) |
| $7,500 to $9,999 | 33 (1.0%) | 32 (0.7%) |
| $10,000 to $12,499 | 218 (6.8%) | 98 (2.3%) |
| $12,500 to $14,999 | 12 (0.4%) | 14 (0.3%) |
| $15,000 to $17,499 | 23 (0.7%) | 50 (1.2%) |
| $17,500 to $19,999 | 51 (1.6%) | 142 (3.3%) |
| $20,000 to $22,499 | 0 (0.0%) | 31 (0.7%) |
| $22,500 to $24,999 | 196 (6.1%) | 116 (2.7%) |
| $25,000 to $29,999 | 89 (2.8%) | 118 (2.8%) |
| $30,000 to $34,999 | 134 (4.2%) | 200 (4.7%) |
| $35,000 to $39,999 | 92 (2.9%) | 82 (1.9%) |
| $40,000 to $44,999 | 189 (5.9%) | 116 (2.7%) |
| $45,000 to $49,999 | 96 (3.0%) | 137 (3.2%) |
| $50,000 to $54,999 | 64 (2.0%) | 294 (6.8%) |
| $55,000 to $64,999 | 195 (6.0%) | 405 (9.4%) |
| $65,000 to $74,999 | 152 (4.7%) | 222 (5.2%) |
| $75,000 to $99,999 | 565 (17.5%) | 799 (18.6%) |
| $100,000+ | 703 (21.8%) | 1,088 (25.3%) |
| Total | 3,223 (100.0%) | 4,296 (100.0%) |
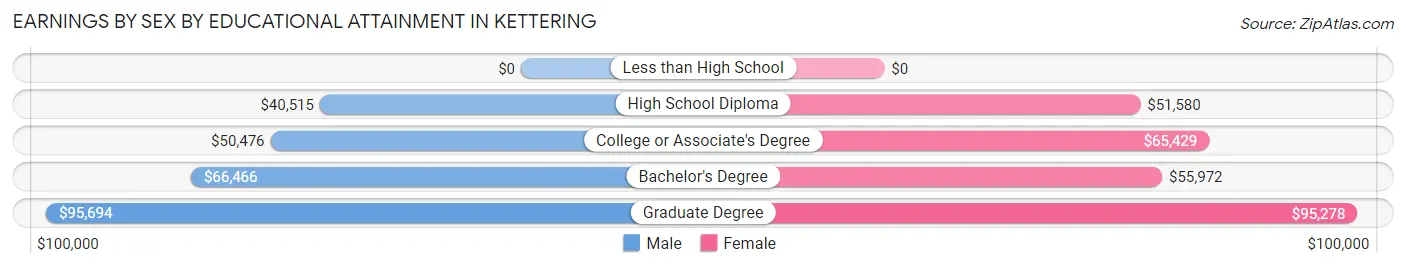
Earnings by Sex by Educational Attainment in Kettering
Average earnings in Kettering are $59,780 for men and $67,951 for women, a difference of 12.0%. Men with an educational attainment of graduate degree enjoy the highest average annual earnings of $95,694, while those with high school diploma education earn the least with $40,515. Women with an educational attainment of graduate degree earn the most with the average annual earnings of $95,278, while those with high school diploma education have the smallest earnings of $51,580.
| Educational Attainment | Male Income | Female Income |
| Less than High School | - | - |
| High School Diploma | $40,515 | $51,580 |
| College or Associate's Degree | $50,476 | $65,429 |
| Bachelor's Degree | $66,466 | $55,972 |
| Graduate Degree | $95,694 | $95,278 |
| Total | $59,780 | $67,951 |
Family Income in Kettering
Family Income Brackets in Kettering
According to the Kettering family income data, there are 943 families falling into the $100,000 to $149,999 income range, which is the most common income bracket and makes up 28.7% of all families.
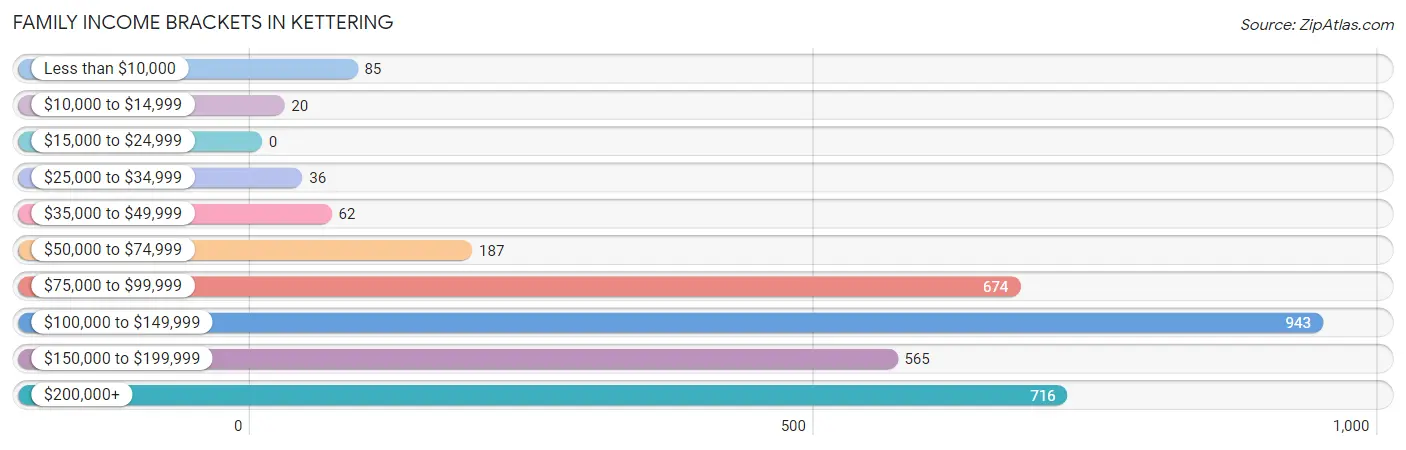
| Income Bracket | # Families | % Families |
| Less than $10,000 | 85 | 2.6% |
| $10,000 to $14,999 | 20 | 0.6% |
| $15,000 to $24,999 | 0 | 0.0% |
| $25,000 to $34,999 | 36 | 1.1% |
| $35,000 to $49,999 | 62 | 1.9% |
| $50,000 to $74,999 | 187 | 5.7% |
| $75,000 to $99,999 | 674 | 20.5% |
| $100,000 to $149,999 | 943 | 28.7% |
| $150,000 to $199,999 | 565 | 17.2% |
| $200,000+ | 716 | 21.8% |
Family Income by Famaliy Size in Kettering
4-person families (580 | 17.6%) account for the highest median family income in Kettering with $198,816 per family, while 2-person families (1,399 | 42.6%) have the highest median income of $56,260 per family member.
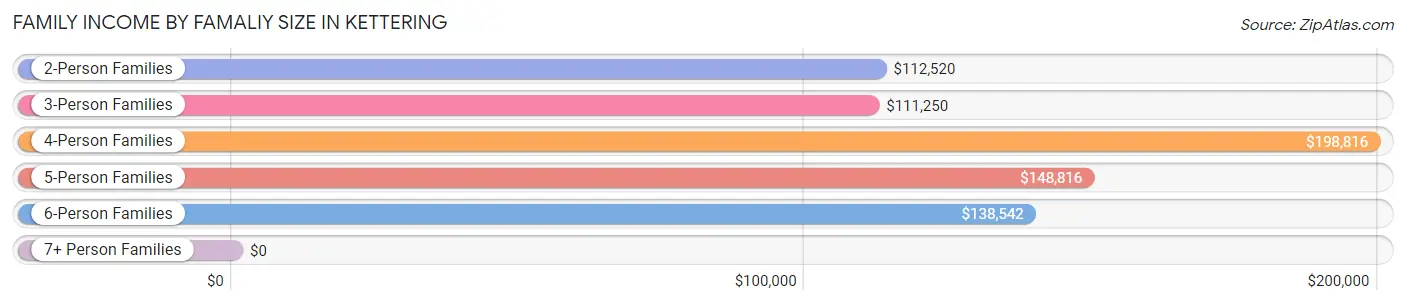
| Income Bracket | # Families | Median Income |
| 2-Person Families | 1,399 (42.6%) | $112,520 |
| 3-Person Families | 796 (24.2%) | $111,250 |
| 4-Person Families | 580 (17.6%) | $198,816 |
| 5-Person Families | 374 (11.4%) | $148,816 |
| 6-Person Families | 101 (3.1%) | $138,542 |
| 7+ Person Families | 36 (1.1%) | $0 |
| Total | 3,286 (100.0%) | $130,775 |
Family Income by Number of Earners in Kettering
The median family income in Kettering is $130,775, with families comprising 3+ earners (691) having the highest median family income of $214,511, while families with no earners (377) have the lowest median family income of $85,469, accounting for 21.0% and 11.5% of families, respectively.
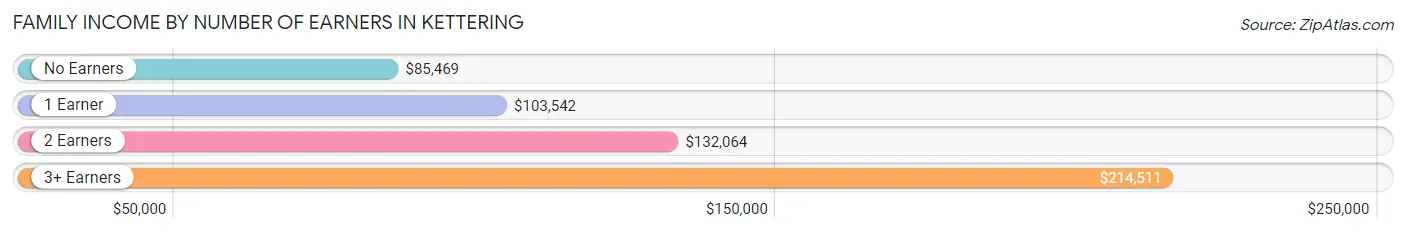
| Number of Earners | # Families | Median Income |
| No Earners | 377 (11.5%) | $85,469 |
| 1 Earner | 1,239 (37.7%) | $103,542 |
| 2 Earners | 979 (29.8%) | $132,064 |
| 3+ Earners | 691 (21.0%) | $214,511 |
| Total | 3,286 (100.0%) | $130,775 |
Household Income in Kettering
Household Income Brackets in Kettering
With 1,674 households falling in the category, the $100,000 to $149,999 income range is the most frequent in Kettering, accounting for 28.2% of all households. In contrast, only 53 households (0.9%) fall into the $10,000 to $14,999 income bracket, making it the least populous group.
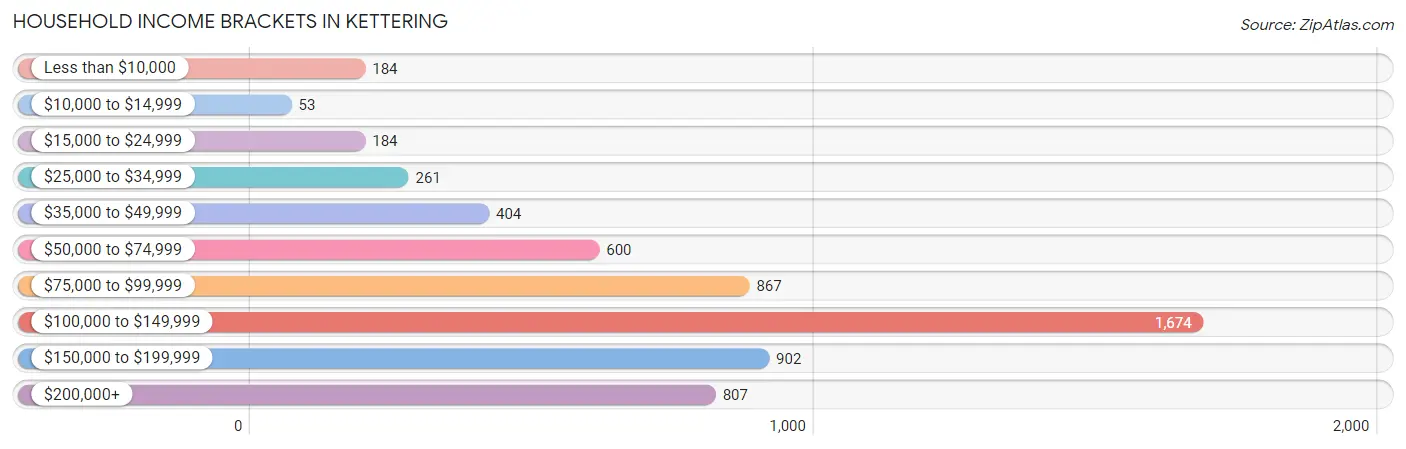
| Income Bracket | # Households | % Households |
| Less than $10,000 | 184 | 3.1% |
| $10,000 to $14,999 | 53 | 0.9% |
| $15,000 to $24,999 | 184 | 3.1% |
| $25,000 to $34,999 | 261 | 4.4% |
| $35,000 to $49,999 | 404 | 6.8% |
| $50,000 to $74,999 | 600 | 10.1% |
| $75,000 to $99,999 | 867 | 14.6% |
| $100,000 to $149,999 | 1,674 | 28.2% |
| $150,000 to $199,999 | 902 | 15.2% |
| $200,000+ | 807 | 13.6% |
Household Income by Householder Age in Kettering
The median household income in Kettering is $107,703, with the highest median household income of $142,308 found in the 45 to 64 years age bracket for the primary householder. A total of 2,422 households (40.8%) fall into this category. Meanwhile, the 65+ years age bracket for the primary householder has the lowest median household income of $78,302, with 2,391 households (40.3%) in this group.
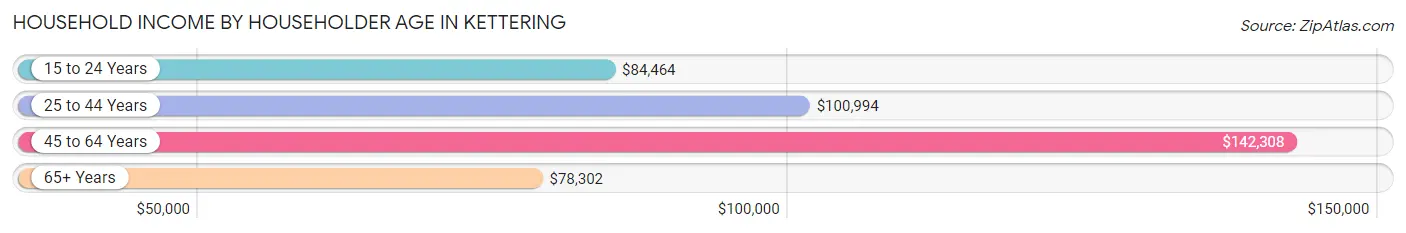
| Income Bracket | # Households | Median Income |
| 15 to 24 Years | 64 (1.1%) | $84,464 |
| 25 to 44 Years | 1,060 (17.8%) | $100,994 |
| 45 to 64 Years | 2,422 (40.8%) | $142,308 |
| 65+ Years | 2,391 (40.3%) | $78,302 |
| Total | 5,937 (100.0%) | $107,703 |
Poverty in Kettering
Income Below Poverty by Sex and Age in Kettering
With 7.6% poverty level for males and 5.1% for females among the residents of Kettering, under 5 year old males and 18 to 24 year old females are the most vulnerable to poverty, with 73 males (43.7%) and 62 females (15.2%) in their respective age groups living below the poverty level.
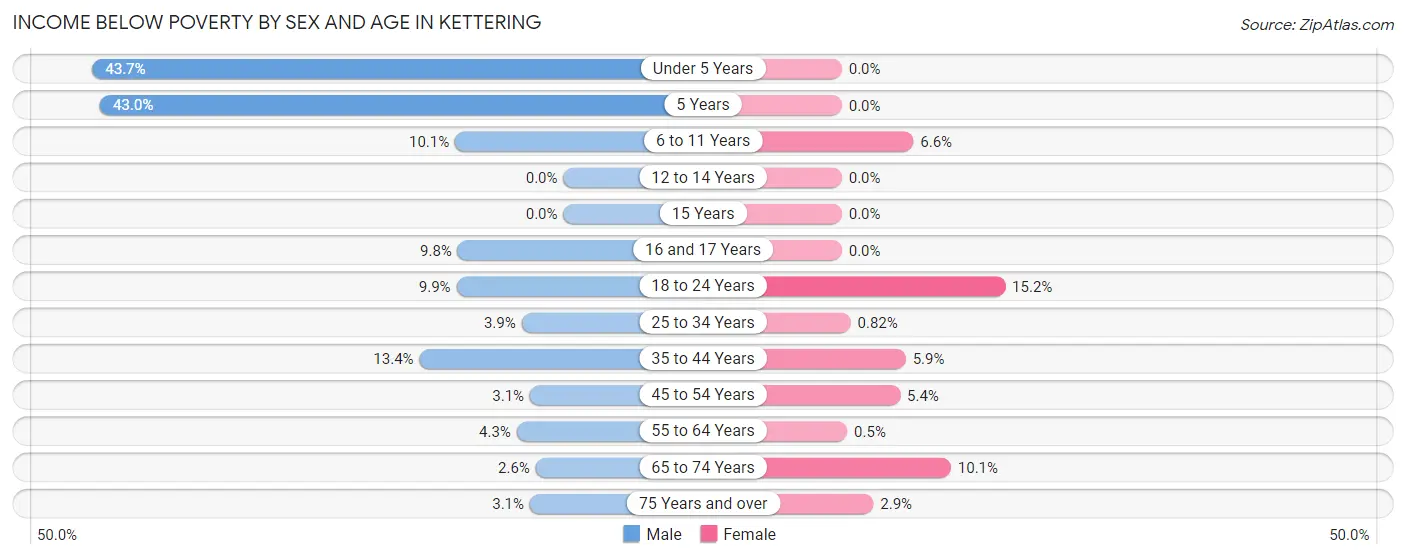
| Age Bracket | Male | Female |
| Under 5 Years | 73 (43.7%) | 0 (0.0%) |
| 5 Years | 43 (43.0%) | 0 (0.0%) |
| 6 to 11 Years | 57 (10.1%) | 29 (6.6%) |
| 12 to 14 Years | 0 (0.0%) | 0 (0.0%) |
| 15 Years | 0 (0.0%) | 0 (0.0%) |
| 16 and 17 Years | 21 (9.8%) | 0 (0.0%) |
| 18 to 24 Years | 39 (9.9%) | 62 (15.2%) |
| 25 to 34 Years | 30 (3.9%) | 4 (0.8%) |
| 35 to 44 Years | 95 (13.4%) | 56 (5.9%) |
| 45 to 54 Years | 29 (3.1%) | 64 (5.4%) |
| 55 to 64 Years | 41 (4.3%) | 7 (0.5%) |
| 65 to 74 Years | 14 (2.6%) | 151 (10.1%) |
| 75 Years and over | 11 (3.1%) | 25 (2.9%) |
| Total | 453 (7.6%) | 398 (5.1%) |
Income Above Poverty by Sex and Age in Kettering
According to the poverty statistics in Kettering, males aged 12 to 14 years and females aged under 5 years are the age groups that are most secure financially, with 100.0% of males and 100.0% of females in these age groups living above the poverty line.
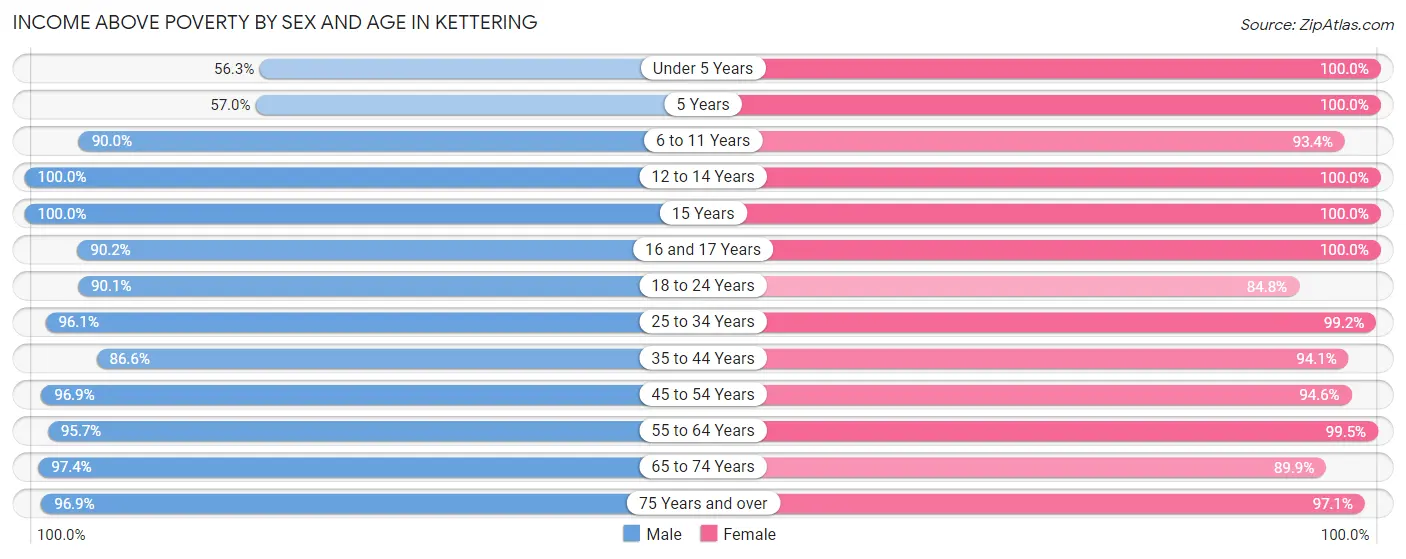
| Age Bracket | Male | Female |
| Under 5 Years | 94 (56.3%) | 173 (100.0%) |
| 5 Years | 57 (57.0%) | 73 (100.0%) |
| 6 to 11 Years | 510 (89.9%) | 408 (93.4%) |
| 12 to 14 Years | 133 (100.0%) | 149 (100.0%) |
| 15 Years | 133 (100.0%) | 112 (100.0%) |
| 16 and 17 Years | 193 (90.2%) | 78 (100.0%) |
| 18 to 24 Years | 354 (90.1%) | 347 (84.8%) |
| 25 to 34 Years | 744 (96.1%) | 485 (99.2%) |
| 35 to 44 Years | 616 (86.6%) | 889 (94.1%) |
| 45 to 54 Years | 906 (96.9%) | 1,118 (94.6%) |
| 55 to 64 Years | 906 (95.7%) | 1,389 (99.5%) |
| 65 to 74 Years | 531 (97.4%) | 1,341 (89.9%) |
| 75 Years and over | 343 (96.9%) | 828 (97.1%) |
| Total | 5,520 (92.4%) | 7,390 (94.9%) |
Income Below Poverty Among Married-Couple Families in Kettering
The poverty statistics for married-couple families in Kettering show that 2.0% or 37 of the total 1,872 families live below the poverty line. Families with 3 or 4 children have the highest poverty rate of 16.9%, comprising of 27 families. On the other hand, families with 1 or 2 children have the lowest poverty rate of 0.0%, which includes 0 families.
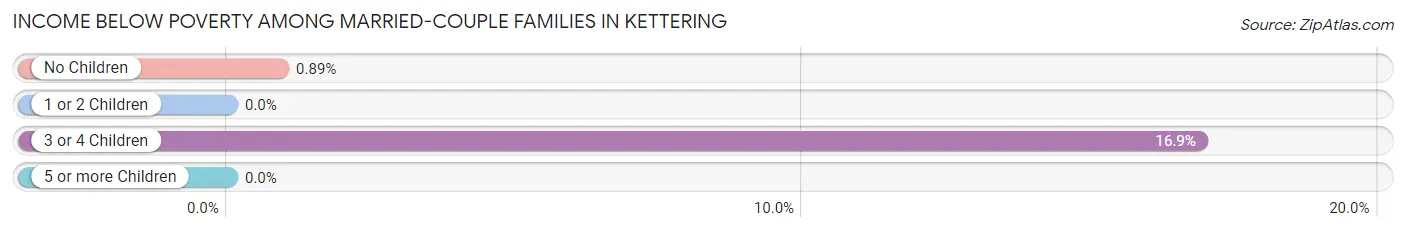
| Children | Above Poverty | Below Poverty |
| No Children | 1,118 (99.1%) | 10 (0.9%) |
| 1 or 2 Children | 584 (100.0%) | 0 (0.0%) |
| 3 or 4 Children | 133 (83.1%) | 27 (16.9%) |
| 5 or more Children | 0 (0.0%) | 0 (0.0%) |
| Total | 1,835 (98.0%) | 37 (2.0%) |
Income Below Poverty Among Single-Parent Households in Kettering
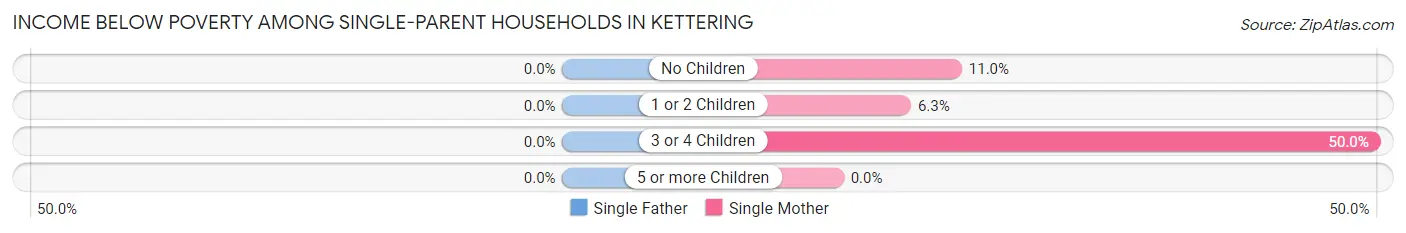
| Children | Single Father | Single Mother |
| No Children | 0 (0.0%) | 58 (11.0%) |
| 1 or 2 Children | 0 (0.0%) | 37 (6.3%) |
| 3 or 4 Children | 0 (0.0%) | 18 (50.0%) |
| 5 or more Children | 0 (0.0%) | 0 (0.0%) |
| Total | 0 (0.0%) | 113 (9.8%) |
Income Below Poverty Among Married-Couple vs Single-Parent Households in Kettering
The poverty data for Kettering shows that 37 of the married-couple family households (2.0%) and 113 of the single-parent households (8.0%) are living below the poverty level. Within the married-couple family households, those with 3 or 4 children have the highest poverty rate, with 27 households (16.9%) falling below the poverty line. Among the single-parent households, those with 3 or 4 children have the highest poverty rate, with 18 household (50.0%) living below poverty.
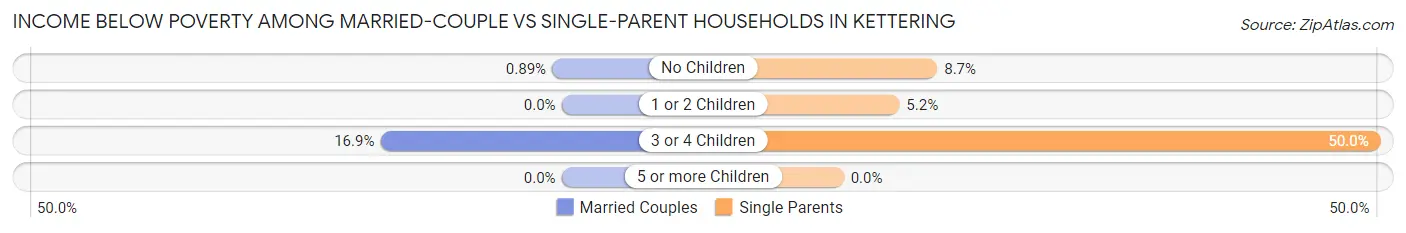
| Children | Married-Couple Families | Single-Parent Households |
| No Children | 10 (0.9%) | 58 (8.7%) |
| 1 or 2 Children | 0 (0.0%) | 37 (5.2%) |
| 3 or 4 Children | 27 (16.9%) | 18 (50.0%) |
| 5 or more Children | 0 (0.0%) | 0 (0.0%) |
| Total | 37 (2.0%) | 113 (8.0%) |
Race in Kettering
The most populous races in Kettering are Black / African American (12,089 | 87.1%), Two or more Races (832 | 6.0%), and White / Caucasian (629 | 4.5%).
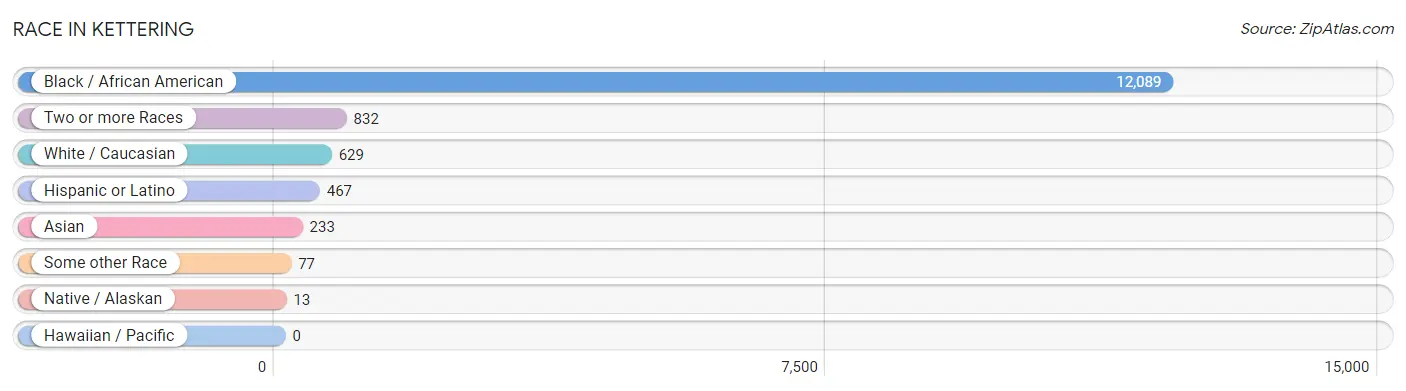
| Race | # Population | % Population |
| Asian | 233 | 1.7% |
| Black / African American | 12,089 | 87.1% |
| Hawaiian / Pacific | 0 | 0.0% |
| Hispanic or Latino | 467 | 3.4% |
| Native / Alaskan | 13 | 0.1% |
| White / Caucasian | 629 | 4.5% |
| Two or more Races | 832 | 6.0% |
| Some other Race | 77 | 0.6% |
| Total | 13,873 | 100.0% |
Ancestry in Kettering
The most populous ancestries reported in Kettering are Subsaharan African (1,440 | 10.4%), American (609 | 4.4%), Jamaican (524 | 3.8%), Nigerian (504 | 3.6%), and Korean (452 | 3.3%), together accounting for 25.4% of all Kettering residents.
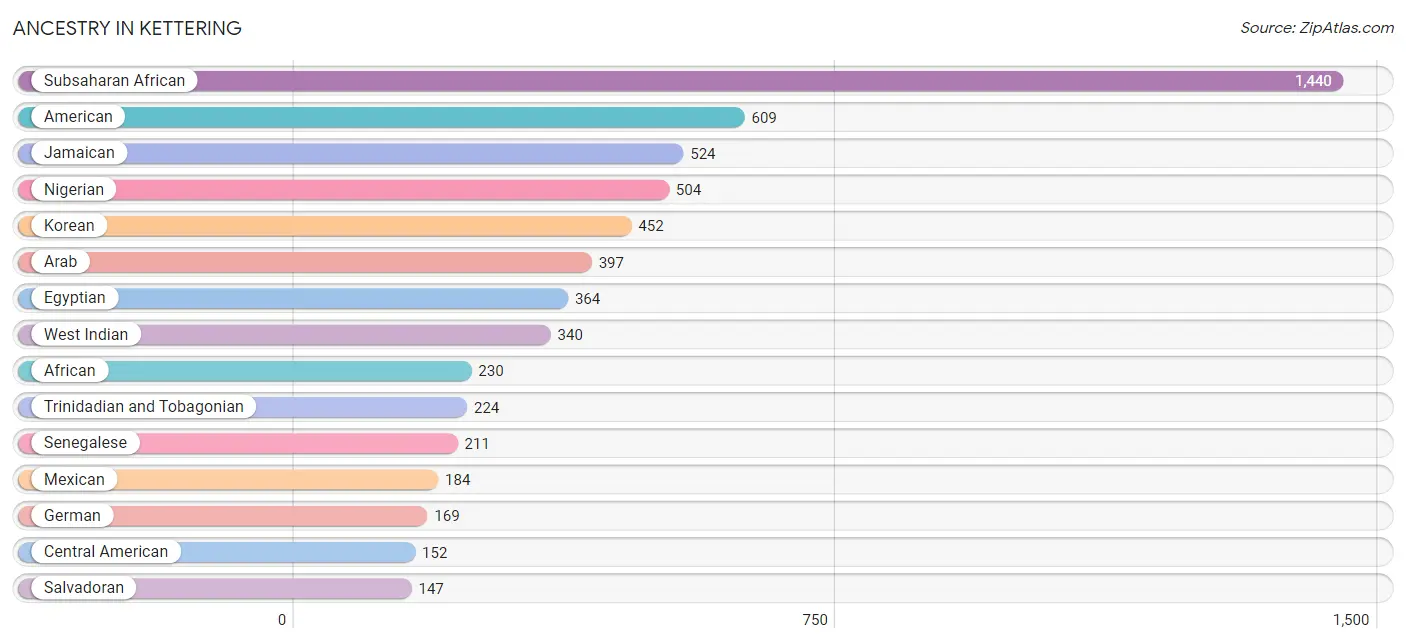
| Ancestry | # Population | % Population |
| African | 230 | 1.7% |
| American | 609 | 4.4% |
| Arab | 397 | 2.9% |
| Barbadian | 10 | 0.1% |
| British | 45 | 0.3% |
| Burmese | 79 | 0.6% |
| Central American | 152 | 1.1% |
| Central American Indian | 140 | 1.0% |
| Costa Rican | 5 | 0.0% |
| Dominican | 96 | 0.7% |
| Egyptian | 364 | 2.6% |
| English | 39 | 0.3% |
| European | 13 | 0.1% |
| French | 55 | 0.4% |
| German | 169 | 1.2% |
| Greek | 30 | 0.2% |
| Guyanese | 106 | 0.8% |
| Haitian | 98 | 0.7% |
| Irish | 73 | 0.5% |
| Italian | 30 | 0.2% |
| Jamaican | 524 | 3.8% |
| Korean | 452 | 3.3% |
| Liberian | 134 | 1.0% |
| Mexican | 184 | 1.3% |
| Mexican American Indian | 86 | 0.6% |
| Moroccan | 33 | 0.2% |
| Nigerian | 504 | 3.6% |
| Polish | 9 | 0.1% |
| Puerto Rican | 35 | 0.3% |
| Salvadoran | 147 | 1.1% |
| Scandinavian | 22 | 0.2% |
| Senegalese | 211 | 1.5% |
| Sierra Leonean | 60 | 0.4% |
| Subsaharan African | 1,440 | 10.4% |
| Thai | 23 | 0.2% |
| Trinidadian and Tobagonian | 224 | 1.6% |
| U.S. Virgin Islander | 9 | 0.1% |
| West Indian | 340 | 2.5% | View All 38 Rows |
Immigrants in Kettering
The most numerous immigrant groups reported in Kettering came from Africa (1,172 | 8.5%), Latin America (777 | 5.6%), Western Africa (580 | 4.2%), Caribbean (550 | 4.0%), and Egypt (311 | 2.2%), together accounting for 24.4% of all Kettering residents.
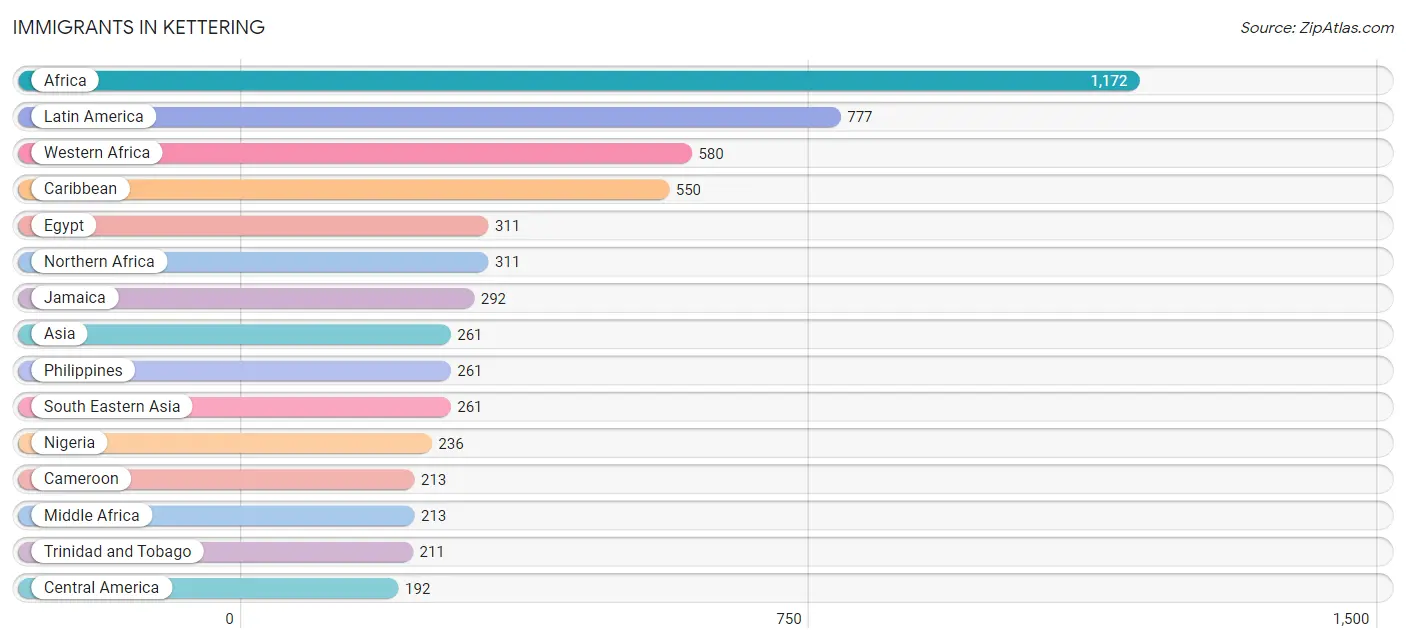
| Immigration Origin | # Population | % Population |
| Africa | 1,172 | 8.5% |
| Asia | 261 | 1.9% |
| Barbados | 16 | 0.1% |
| Cameroon | 213 | 1.5% |
| Caribbean | 550 | 4.0% |
| Central America | 192 | 1.4% |
| Dominican Republic | 31 | 0.2% |
| Eastern Africa | 24 | 0.2% |
| Egypt | 311 | 2.2% |
| El Salvador | 44 | 0.3% |
| Eritrea | 24 | 0.2% |
| Europe | 26 | 0.2% |
| Ghana | 27 | 0.2% |
| Guyana | 35 | 0.3% |
| Jamaica | 292 | 2.1% |
| Latin America | 777 | 5.6% |
| Liberia | 143 | 1.0% |
| Mexico | 148 | 1.1% |
| Middle Africa | 213 | 1.5% |
| Nigeria | 236 | 1.7% |
| Northern Africa | 311 | 2.2% |
| Northern Europe | 26 | 0.2% |
| Philippines | 261 | 1.9% |
| Senegal | 106 | 0.8% |
| Sierra Leone | 60 | 0.4% |
| South America | 35 | 0.3% |
| South Eastern Asia | 261 | 1.9% |
| Trinidad and Tobago | 211 | 1.5% |
| Western Africa | 580 | 4.2% | View All 29 Rows |
Sex and Age in Kettering
Sex and Age in Kettering
The most populous age groups in Kettering are 55 to 59 Years (565 | 9.4%) for men and 70 to 74 Years (905 | 11.5%) for women.
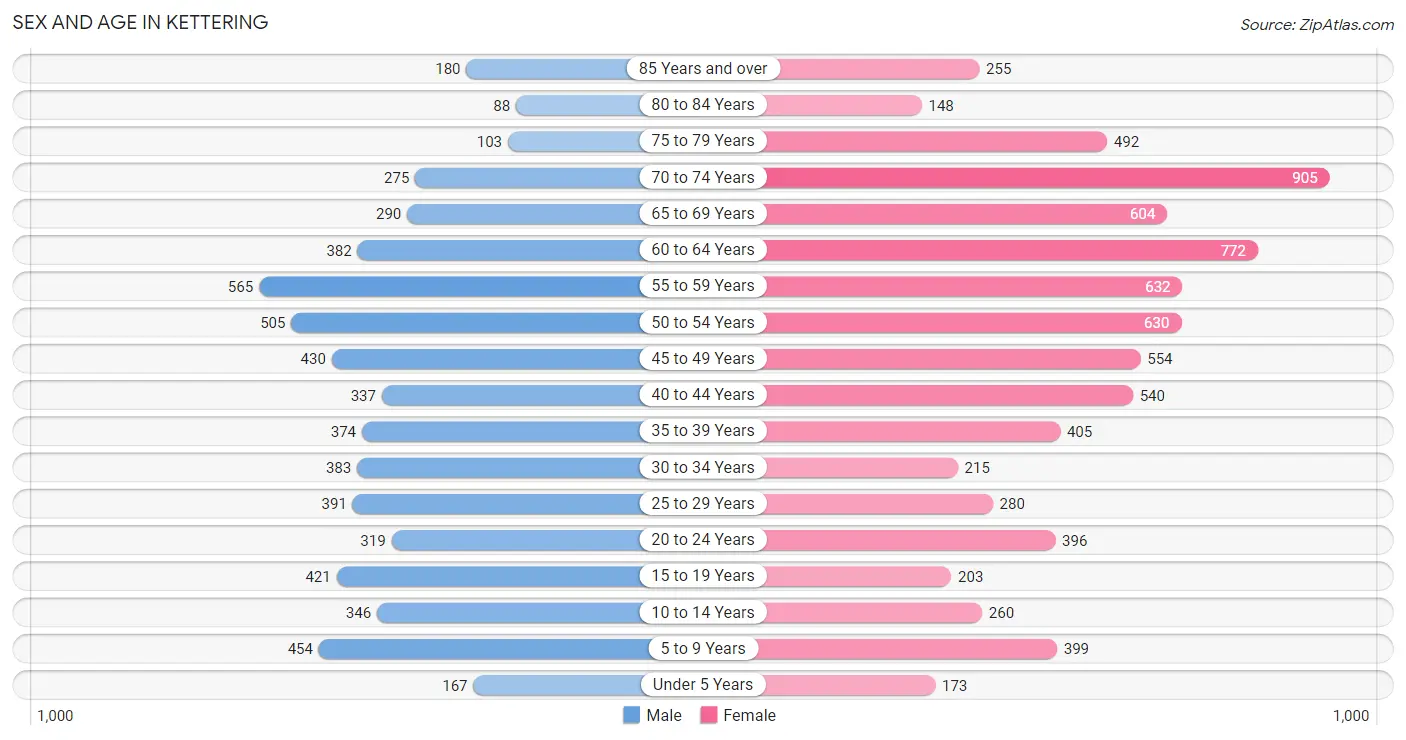
| Age Bracket | Male | Female |
| Under 5 Years | 167 (2.8%) | 173 (2.2%) |
| 5 to 9 Years | 454 (7.5%) | 399 (5.1%) |
| 10 to 14 Years | 346 (5.8%) | 260 (3.3%) |
| 15 to 19 Years | 421 (7.0%) | 203 (2.6%) |
| 20 to 24 Years | 319 (5.3%) | 396 (5.0%) |
| 25 to 29 Years | 391 (6.5%) | 280 (3.6%) |
| 30 to 34 Years | 383 (6.4%) | 215 (2.7%) |
| 35 to 39 Years | 374 (6.2%) | 405 (5.1%) |
| 40 to 44 Years | 337 (5.6%) | 540 (6.9%) |
| 45 to 49 Years | 430 (7.1%) | 554 (7.0%) |
| 50 to 54 Years | 505 (8.4%) | 630 (8.0%) |
| 55 to 59 Years | 565 (9.4%) | 632 (8.0%) |
| 60 to 64 Years | 382 (6.4%) | 772 (9.8%) |
| 65 to 69 Years | 290 (4.8%) | 604 (7.7%) |
| 70 to 74 Years | 275 (4.6%) | 905 (11.5%) |
| 75 to 79 Years | 103 (1.7%) | 492 (6.3%) |
| 80 to 84 Years | 88 (1.5%) | 148 (1.9%) |
| 85 Years and over | 180 (3.0%) | 255 (3.2%) |
| Total | 6,010 (100.0%) | 7,863 (100.0%) |
Families and Households in Kettering
Median Family Size in Kettering
The median family size in Kettering is 3.27 persons per family, with married-couple families (1,872 | 57.0%) accounting for the largest median family size of 3.51 persons per family. On the other hand, single male/father families (261 | 7.9%) represent the smallest median family size with 2.51 persons per family.
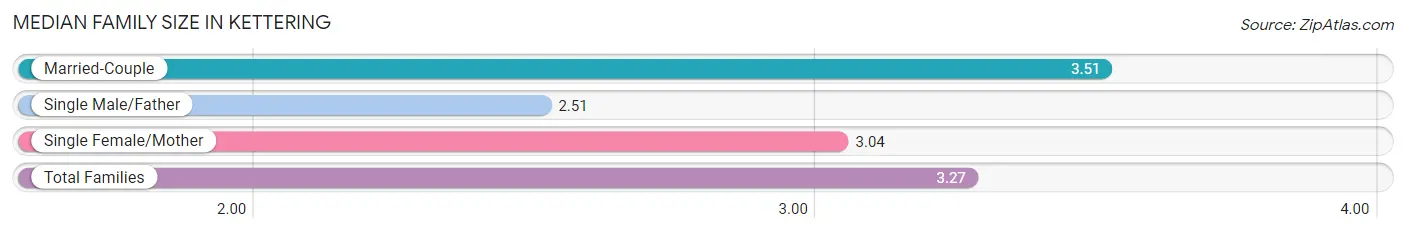
| Family Type | # Families | Family Size |
| Married-Couple | 1,872 (57.0%) | 3.51 |
| Single Male/Father | 261 (7.9%) | 2.51 |
| Single Female/Mother | 1,153 (35.1%) | 3.04 |
| Total Families | 3,286 (100.0%) | 3.27 |
Median Household Size in Kettering
The median household size in Kettering is 2.32 persons per household, with married-couple households (1,872 | 31.5%) accounting for the largest median household size of 3.53 persons per household. non-family households (2,651 | 44.7%) represent the smallest median household size with 1.11 persons per household.
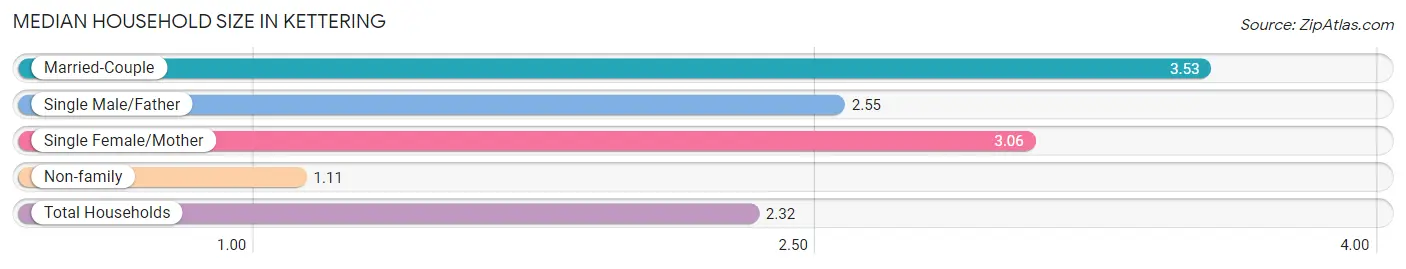
| Household Type | # Households | Household Size |
| Married-Couple | 1,872 (31.5%) | 3.53 |
| Single Male/Father | 261 (4.4%) | 2.55 |
| Single Female/Mother | 1,153 (19.4%) | 3.06 |
| Non-family | 2,651 (44.7%) | 1.11 |
| Total Households | 5,937 (100.0%) | 2.32 |
Household Size by Marriage Status in Kettering
Out of a total of 5,937 households in Kettering, 3,286 (55.3%) are family households, while 2,651 (44.7%) are nonfamily households. The most numerous type of family households are 2-person households, comprising 1,363, and the most common type of nonfamily households are 1-person households, comprising 2,373.
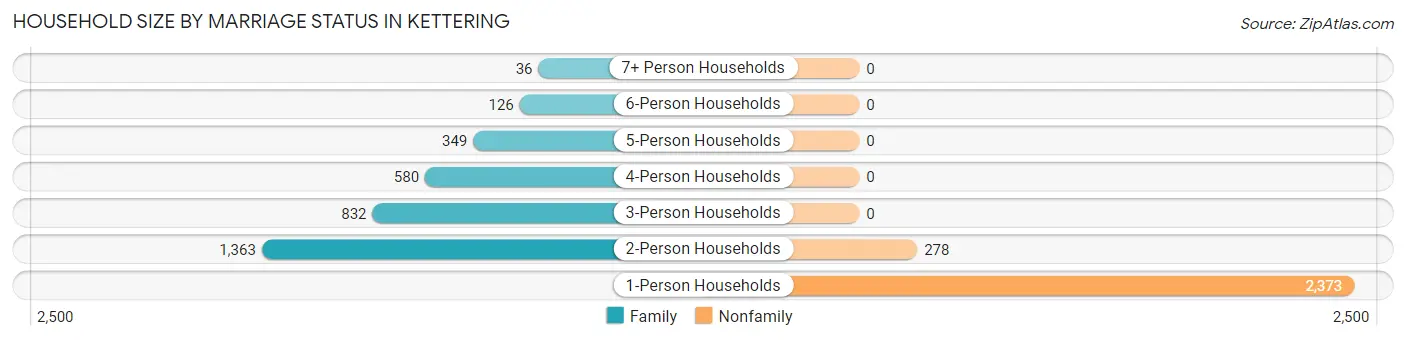
| Household Size | Family Households | Nonfamily Households |
| 1-Person Households | - | 2,373 (40.0%) |
| 2-Person Households | 1,363 (23.0%) | 278 (4.7%) |
| 3-Person Households | 832 (14.0%) | 0 (0.0%) |
| 4-Person Households | 580 (9.8%) | 0 (0.0%) |
| 5-Person Households | 349 (5.9%) | 0 (0.0%) |
| 6-Person Households | 126 (2.1%) | 0 (0.0%) |
| 7+ Person Households | 36 (0.6%) | 0 (0.0%) |
| Total | 3,286 (55.3%) | 2,651 (44.7%) |
Female Fertility in Kettering
Fertility by Age in Kettering
Average fertility rate in Kettering is 36.0 births per 1,000 women. Women in the age bracket of 20 to 34 years have the highest fertility rate with 76.0 births per 1,000 women. Women in the age bracket of 20 to 34 years acount for 69.4% of all women with births.
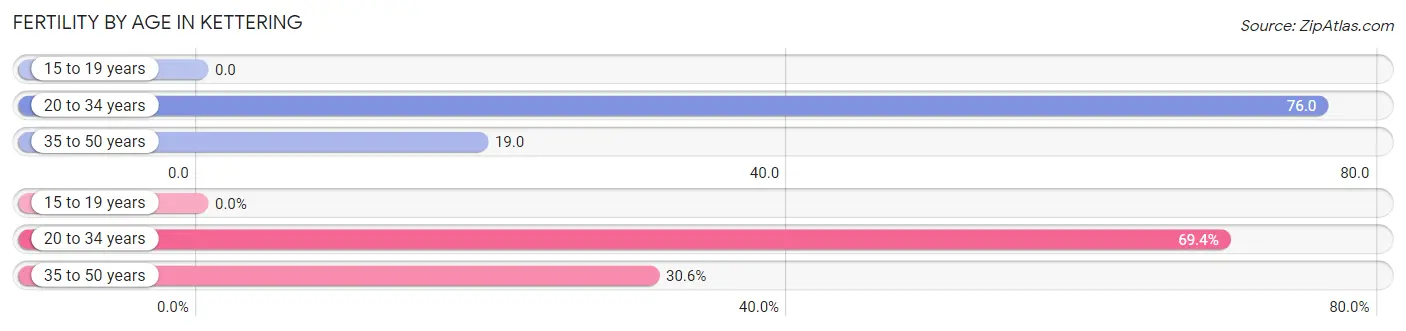
| Age Bracket | Women with Births | Births / 1,000 Women |
| 15 to 19 years | 0 (0.0%) | 0.0 |
| 20 to 34 years | 68 (69.4%) | 76.0 |
| 35 to 50 years | 30 (30.6%) | 19.0 |
| Total | 98 (100.0%) | 36.0 |
Fertility by Age by Marriage Status in Kettering
38.8% of women with births (98) in Kettering are married. The highest percentage of unmarried women with births falls into 20 to 34 years age bracket with 88.2% of them unmarried at the time of birth, while the lowest percentage of unmarried women with births belong to 35 to 50 years age bracket with 0.0% of them unmarried.
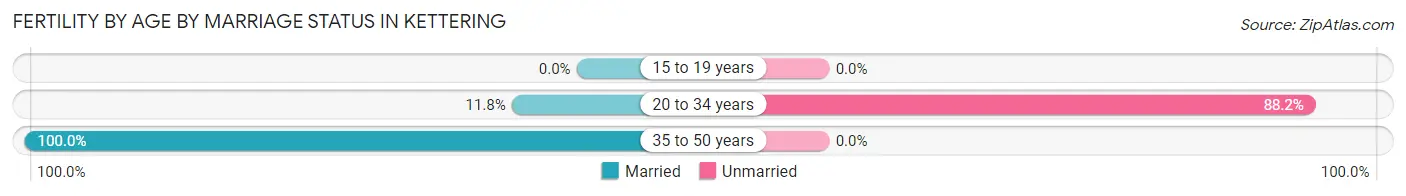
| Age Bracket | Married | Unmarried |
| 15 to 19 years | 0 (0.0%) | 0 (0.0%) |
| 20 to 34 years | 8 (11.8%) | 60 (88.2%) |
| 35 to 50 years | 30 (100.0%) | 0 (0.0%) |
| Total | 38 (38.8%) | 60 (61.2%) |
Fertility by Education in Kettering
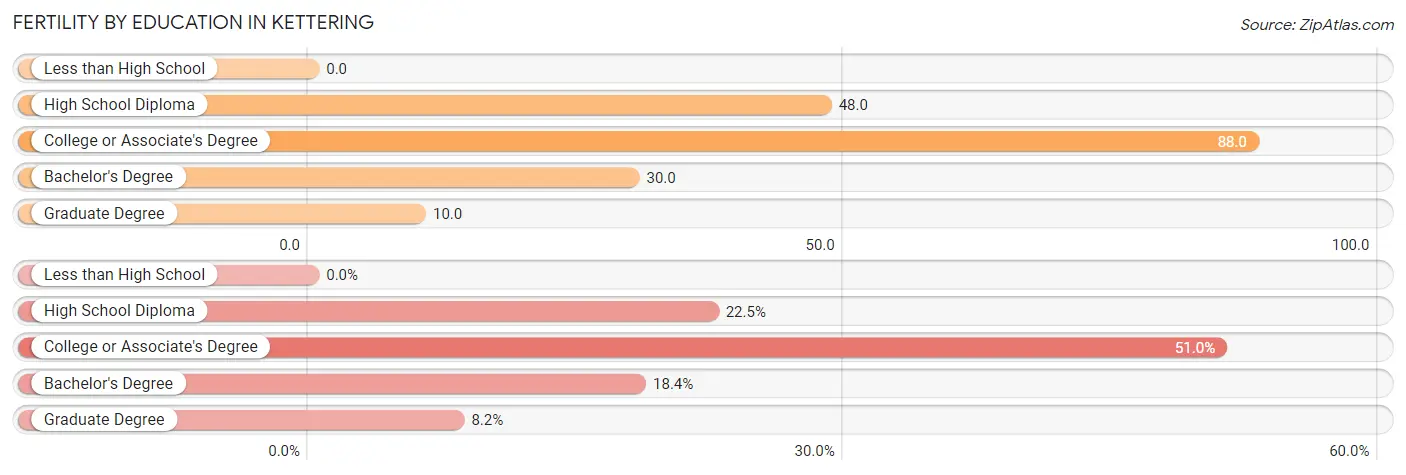
| Educational Attainment | Women with Births | Births / 1,000 Women |
| Less than High School | 0 (0.0%) | 0.0 |
| High School Diploma | 22 (22.5%) | 48.0 |
| College or Associate's Degree | 50 (51.0%) | 88.0 |
| Bachelor's Degree | 18 (18.4%) | 30.0 |
| Graduate Degree | 8 (8.2%) | 10.0 |
| Total | 98 (100.0%) | 36.0 |
Fertility by Education by Marriage Status in Kettering
61.2% of women with births in Kettering are unmarried. Women with the educational attainment of high school diploma are most likely to be married with 100.0% of them married at childbirth, while women with the educational attainment of bachelor's degree are least likely to be married with 100.0% of them unmarried at childbirth.
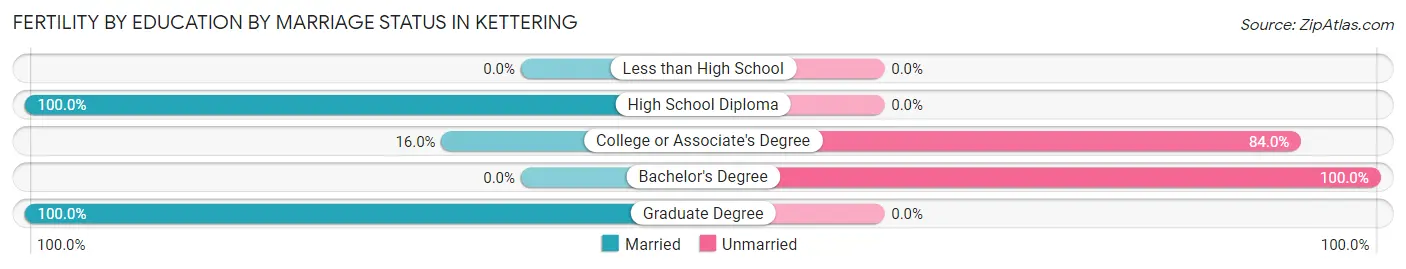
| Educational Attainment | Married | Unmarried |
| Less than High School | 0 (0.0%) | 0 (0.0%) |
| High School Diploma | 22 (100.0%) | 0 (0.0%) |
| College or Associate's Degree | 8 (16.0%) | 42 (84.0%) |
| Bachelor's Degree | 0 (0.0%) | 18 (100.0%) |
| Graduate Degree | 8 (100.0%) | 0 (0.0%) |
| Total | 38 (38.8%) | 60 (61.2%) |
Employment Characteristics in Kettering
Employment by Class of Employer in Kettering
Among the 6,568 employed individuals in Kettering, private company employees (3,177 | 48.4%), federal government employees (1,668 | 25.4%), and not-for-profit organizations (897 | 13.7%) make up the most common classes of employment.
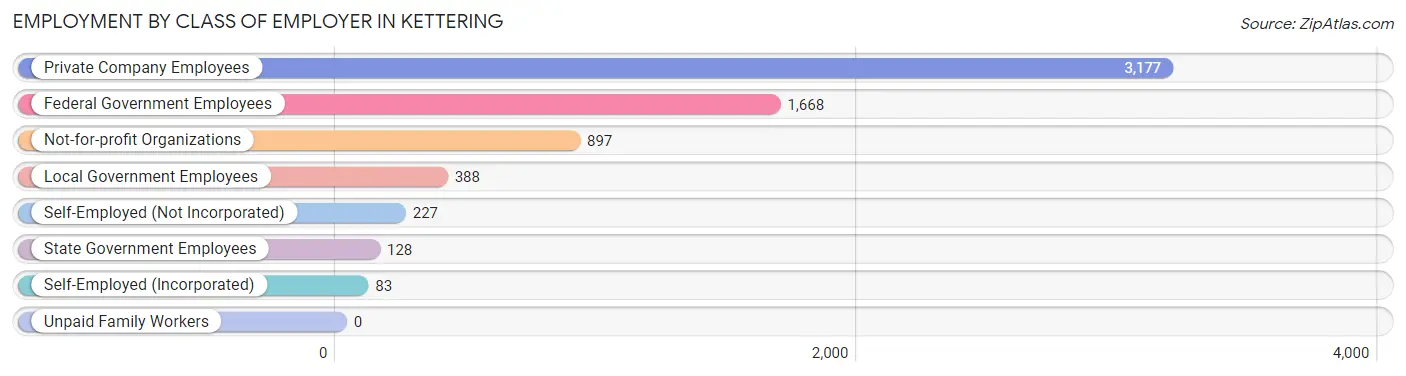
| Employer Class | # Employees | % Employees |
| Private Company Employees | 3,177 | 48.4% |
| Self-Employed (Incorporated) | 83 | 1.3% |
| Self-Employed (Not Incorporated) | 227 | 3.5% |
| Not-for-profit Organizations | 897 | 13.7% |
| Local Government Employees | 388 | 5.9% |
| State Government Employees | 128 | 1.9% |
| Federal Government Employees | 1,668 | 25.4% |
| Unpaid Family Workers | 0 | 0.0% |
| Total | 6,568 | 100.0% |
Employment Status by Age in Kettering
According to the labor force statistics for Kettering, out of the total population over 16 years of age (11,829), 62.1% or 7,346 individuals are in the labor force, with 6.6% or 485 of them unemployed. The age group with the highest labor force participation rate is 30 to 34 years, with 99.0% or 592 individuals in the labor force. Within the labor force, the 16 to 19 years age range has the highest percentage of unemployed individuals, with 38.7% or 63 of them being unemployed.
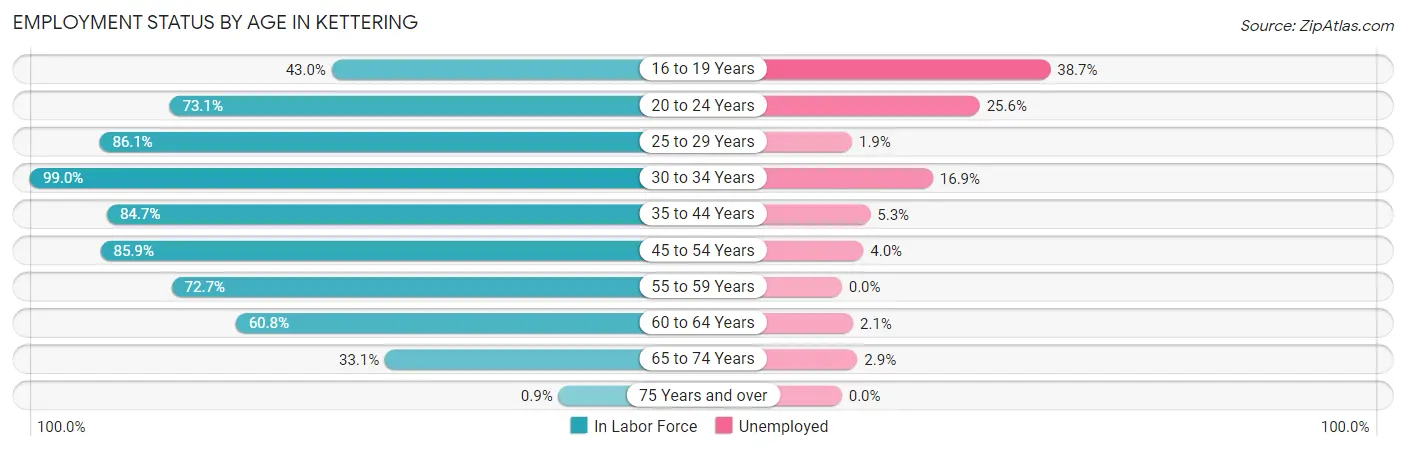
| Age Bracket | In Labor Force | Unemployed |
| 16 to 19 Years | 163 (43.0%) | 63 (38.7%) |
| 20 to 24 Years | 523 (73.1%) | 134 (25.6%) |
| 25 to 29 Years | 578 (86.1%) | 11 (1.9%) |
| 30 to 34 Years | 592 (99.0%) | 100 (16.9%) |
| 35 to 44 Years | 1,403 (84.7%) | 74 (5.3%) |
| 45 to 54 Years | 1,820 (85.9%) | 73 (4.0%) |
| 55 to 59 Years | 870 (72.7%) | 0 (0.0%) |
| 60 to 64 Years | 702 (60.8%) | 15 (2.1%) |
| 65 to 74 Years | 686 (33.1%) | 20 (2.9%) |
| 75 Years and over | 11 (0.9%) | 0 (0.0%) |
| Total | 7,346 (62.1%) | 485 (6.6%) |
Employment Status by Educational Attainment in Kettering
According to labor force statistics for Kettering, 80.7% of individuals (5,968) out of the total population between 25 and 64 years of age (7,395) are in the labor force, with 4.5% or 269 of them being unemployed. The group with the highest labor force participation rate are those with the educational attainment of bachelor's degree or higher, with 88.8% or 2,899 individuals in the labor force. Within the labor force, individuals with less than high school education have the highest percentage of unemployment, with 11.7% or 16 of them being unemployed.
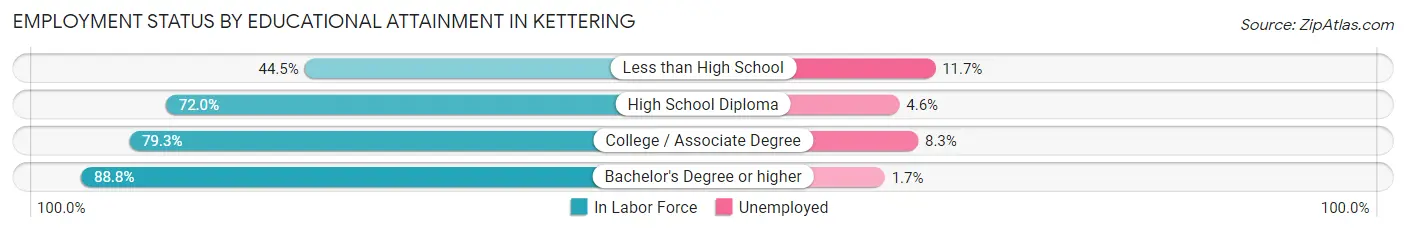
| Educational Attainment | In Labor Force | Unemployed |
| Less than High School | 137 (44.5%) | 36 (11.7%) |
| High School Diploma | 1,024 (72.0%) | 65 (4.6%) |
| College / Associate Degree | 1,903 (79.3%) | 199 (8.3%) |
| Bachelor's Degree or higher | 2,899 (88.8%) | 56 (1.7%) |
| Total | 5,968 (80.7%) | 333 (4.5%) |
Employment Occupations by Sex in Kettering
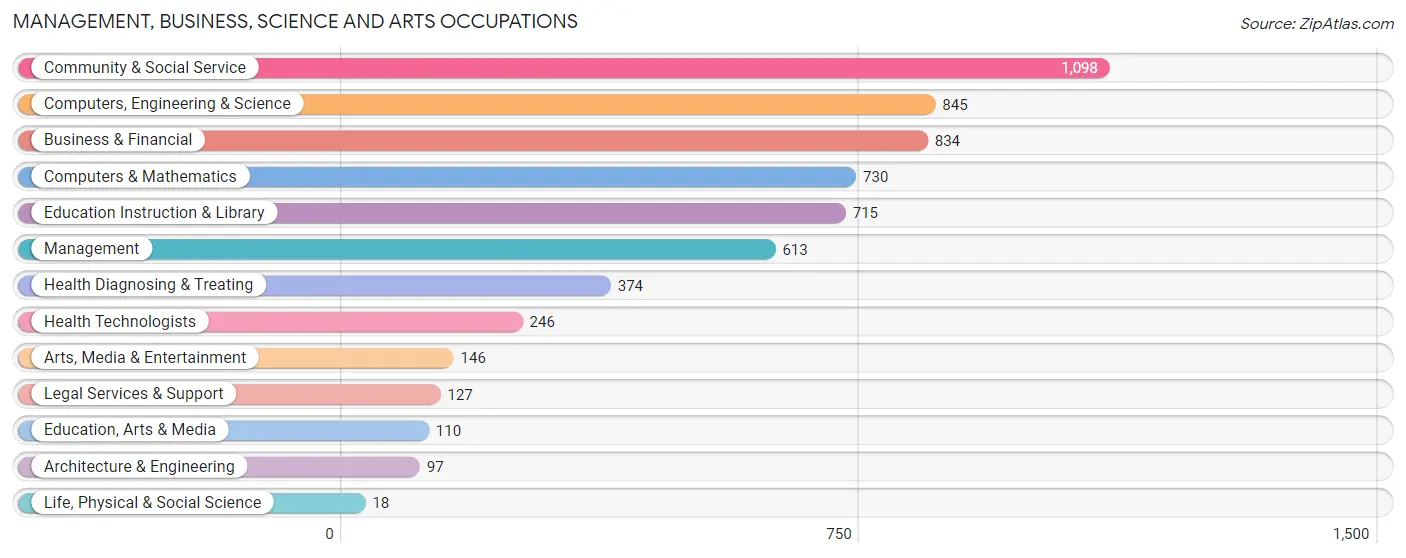
Management, Business, Science and Arts Occupations
The most common Management, Business, Science and Arts occupations in Kettering are Community & Social Service (1,098 | 16.1%), Computers, Engineering & Science (845 | 12.4%), Business & Financial (834 | 12.2%), Computers & Mathematics (730 | 10.7%), and Education Instruction & Library (715 | 10.5%).
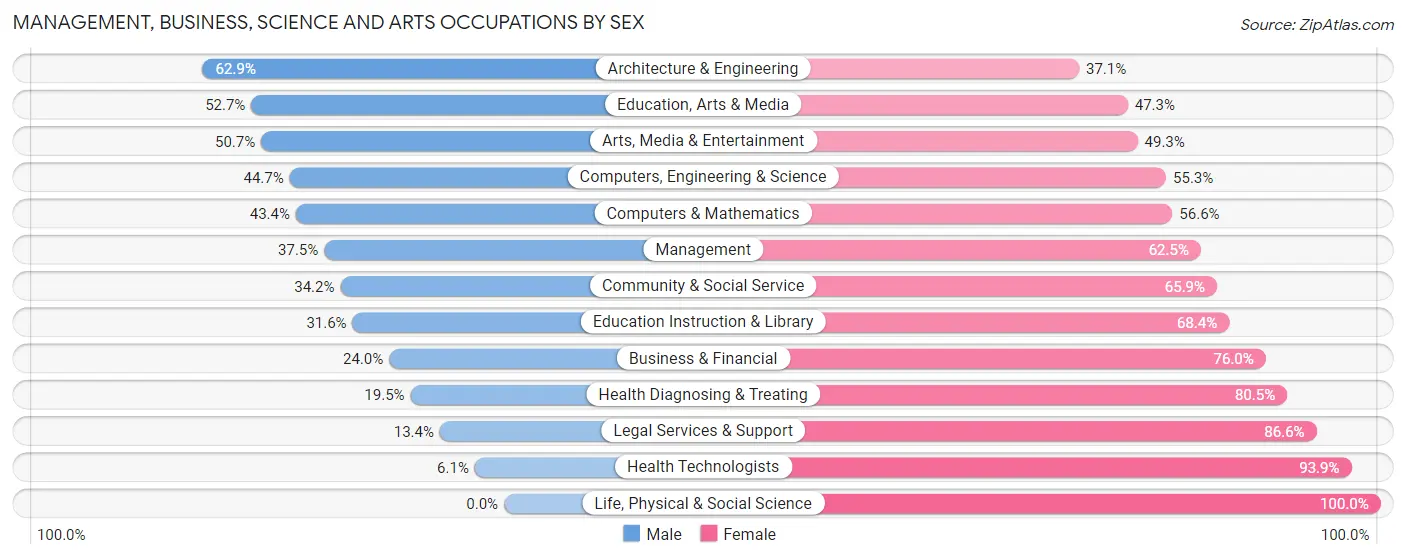
Management, Business, Science and Arts Occupations by Sex
Within the Management, Business, Science and Arts occupations in Kettering, the most male-oriented occupations are Architecture & Engineering (62.9%), Education, Arts & Media (52.7%), and Arts, Media & Entertainment (50.7%), while the most female-oriented occupations are Life, Physical & Social Science (100.0%), Health Technologists (93.9%), and Legal Services & Support (86.6%).
| Occupation | Male | Female |
| Management | 230 (37.5%) | 383 (62.5%) |
| Business & Financial | 200 (24.0%) | 634 (76.0%) |
| Computers, Engineering & Science | 378 (44.7%) | 467 (55.3%) |
| Computers & Mathematics | 317 (43.4%) | 413 (56.6%) |
| Architecture & Engineering | 61 (62.9%) | 36 (37.1%) |
| Life, Physical & Social Science | 0 (0.0%) | 18 (100.0%) |
| Community & Social Service | 375 (34.2%) | 723 (65.8%) |
| Education, Arts & Media | 58 (52.7%) | 52 (47.3%) |
| Legal Services & Support | 17 (13.4%) | 110 (86.6%) |
| Education Instruction & Library | 226 (31.6%) | 489 (68.4%) |
| Arts, Media & Entertainment | 74 (50.7%) | 72 (49.3%) |
| Health Diagnosing & Treating | 73 (19.5%) | 301 (80.5%) |
| Health Technologists | 15 (6.1%) | 231 (93.9%) |
| Total (Category) | 1,256 (33.4%) | 2,508 (66.6%) |
| Total (Overall) | 2,815 (41.2%) | 4,010 (58.8%) |
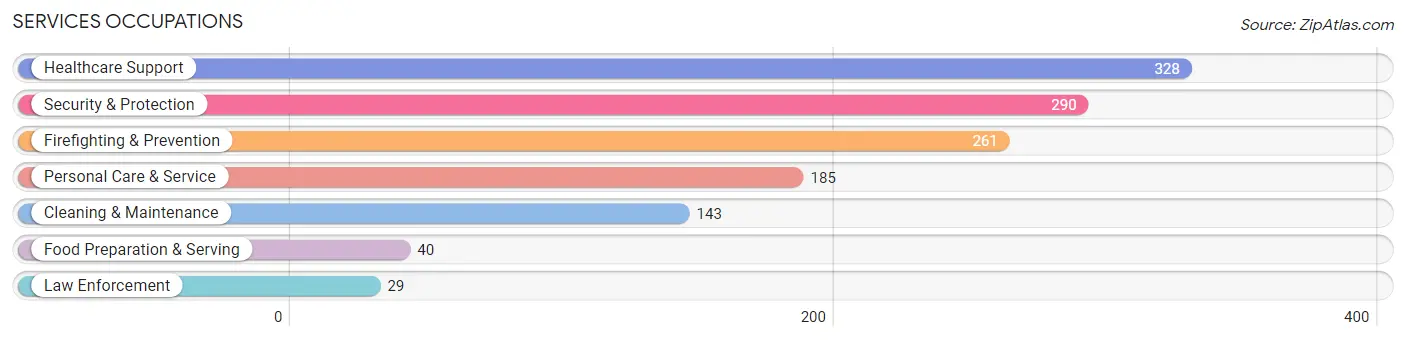
Services Occupations
The most common Services occupations in Kettering are Healthcare Support (328 | 4.8%), Security & Protection (290 | 4.3%), Firefighting & Prevention (261 | 3.8%), Personal Care & Service (185 | 2.7%), and Cleaning & Maintenance (143 | 2.1%).
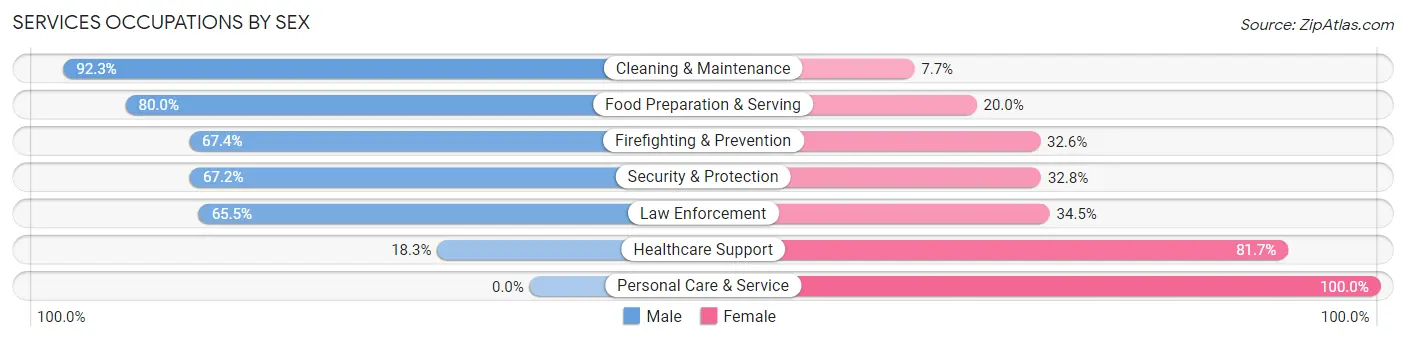
Services Occupations by Sex
Within the Services occupations in Kettering, the most male-oriented occupations are Cleaning & Maintenance (92.3%), Food Preparation & Serving (80.0%), and Firefighting & Prevention (67.4%), while the most female-oriented occupations are Personal Care & Service (100.0%), Healthcare Support (81.7%), and Law Enforcement (34.5%).
| Occupation | Male | Female |
| Healthcare Support | 60 (18.3%) | 268 (81.7%) |
| Security & Protection | 195 (67.2%) | 95 (32.8%) |
| Firefighting & Prevention | 176 (67.4%) | 85 (32.6%) |
| Law Enforcement | 19 (65.5%) | 10 (34.5%) |
| Food Preparation & Serving | 32 (80.0%) | 8 (20.0%) |
| Cleaning & Maintenance | 132 (92.3%) | 11 (7.7%) |
| Personal Care & Service | 0 (0.0%) | 185 (100.0%) |
| Total (Category) | 419 (42.5%) | 567 (57.5%) |
| Total (Overall) | 2,815 (41.2%) | 4,010 (58.8%) |
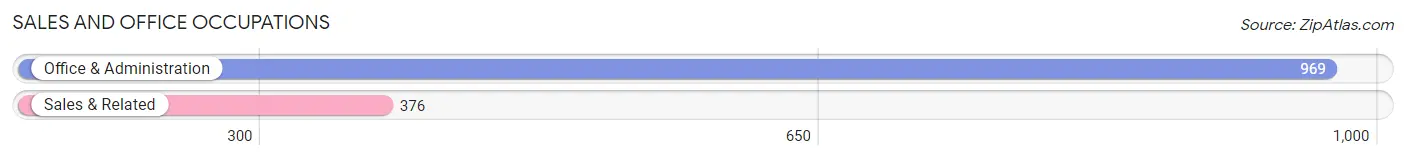
Sales and Office Occupations
The most common Sales and Office occupations in Kettering are Office & Administration (969 | 14.2%), and Sales & Related (376 | 5.5%).
Sales and Office Occupations by Sex
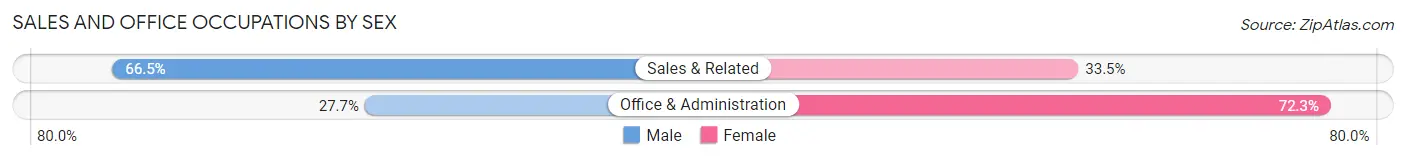
| Occupation | Male | Female |
| Sales & Related | 250 (66.5%) | 126 (33.5%) |
| Office & Administration | 268 (27.7%) | 701 (72.3%) |
| Total (Category) | 518 (38.5%) | 827 (61.5%) |
| Total (Overall) | 2,815 (41.2%) | 4,010 (58.8%) |
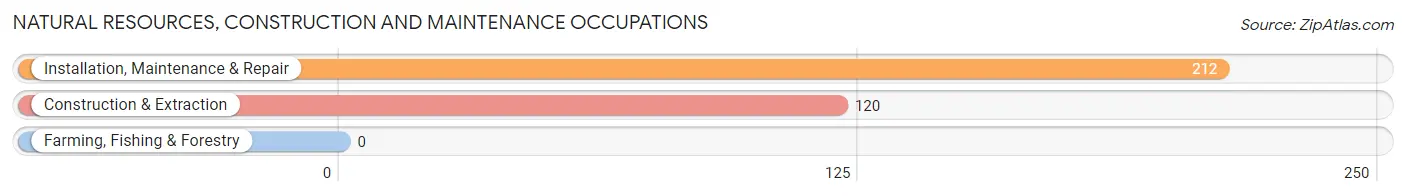
Natural Resources, Construction and Maintenance Occupations
The most common Natural Resources, Construction and Maintenance occupations in Kettering are Installation, Maintenance & Repair (212 | 3.1%), and Construction & Extraction (120 | 1.8%).
Natural Resources, Construction and Maintenance Occupations by Sex
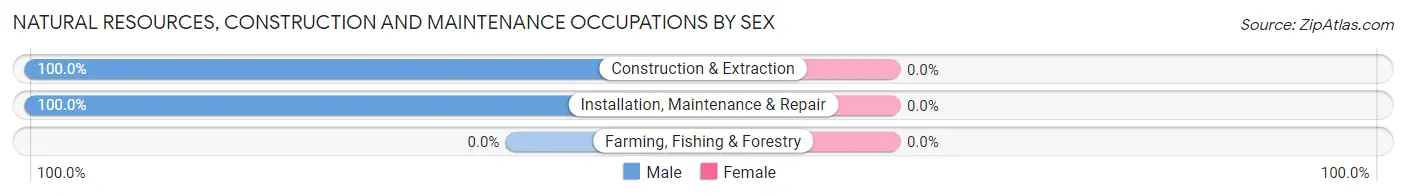
| Occupation | Male | Female |
| Farming, Fishing & Forestry | 0 (0.0%) | 0 (0.0%) |
| Construction & Extraction | 120 (100.0%) | 0 (0.0%) |
| Installation, Maintenance & Repair | 212 (100.0%) | 0 (0.0%) |
| Total (Category) | 332 (100.0%) | 0 (0.0%) |
| Total (Overall) | 2,815 (41.2%) | 4,010 (58.8%) |
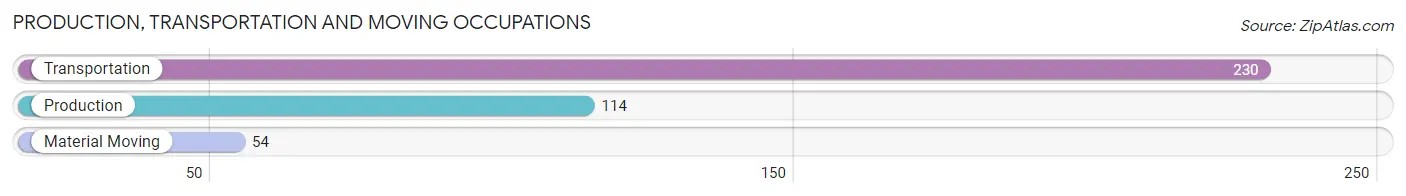
Production, Transportation and Moving Occupations
The most common Production, Transportation and Moving occupations in Kettering are Transportation (230 | 3.4%), Production (114 | 1.7%), and Material Moving (54 | 0.8%).
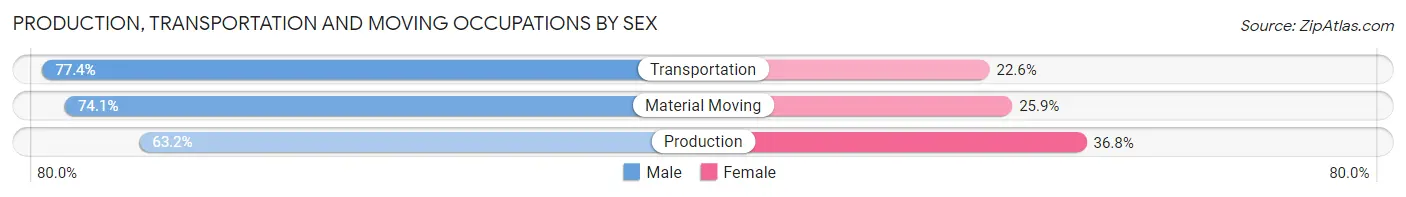
Production, Transportation and Moving Occupations by Sex
| Occupation | Male | Female |
| Production | 72 (63.2%) | 42 (36.8%) |
| Transportation | 178 (77.4%) | 52 (22.6%) |
| Material Moving | 40 (74.1%) | 14 (25.9%) |
| Total (Category) | 290 (72.9%) | 108 (27.1%) |
| Total (Overall) | 2,815 (41.2%) | 4,010 (58.8%) |
Employment Industries by Sex in Kettering
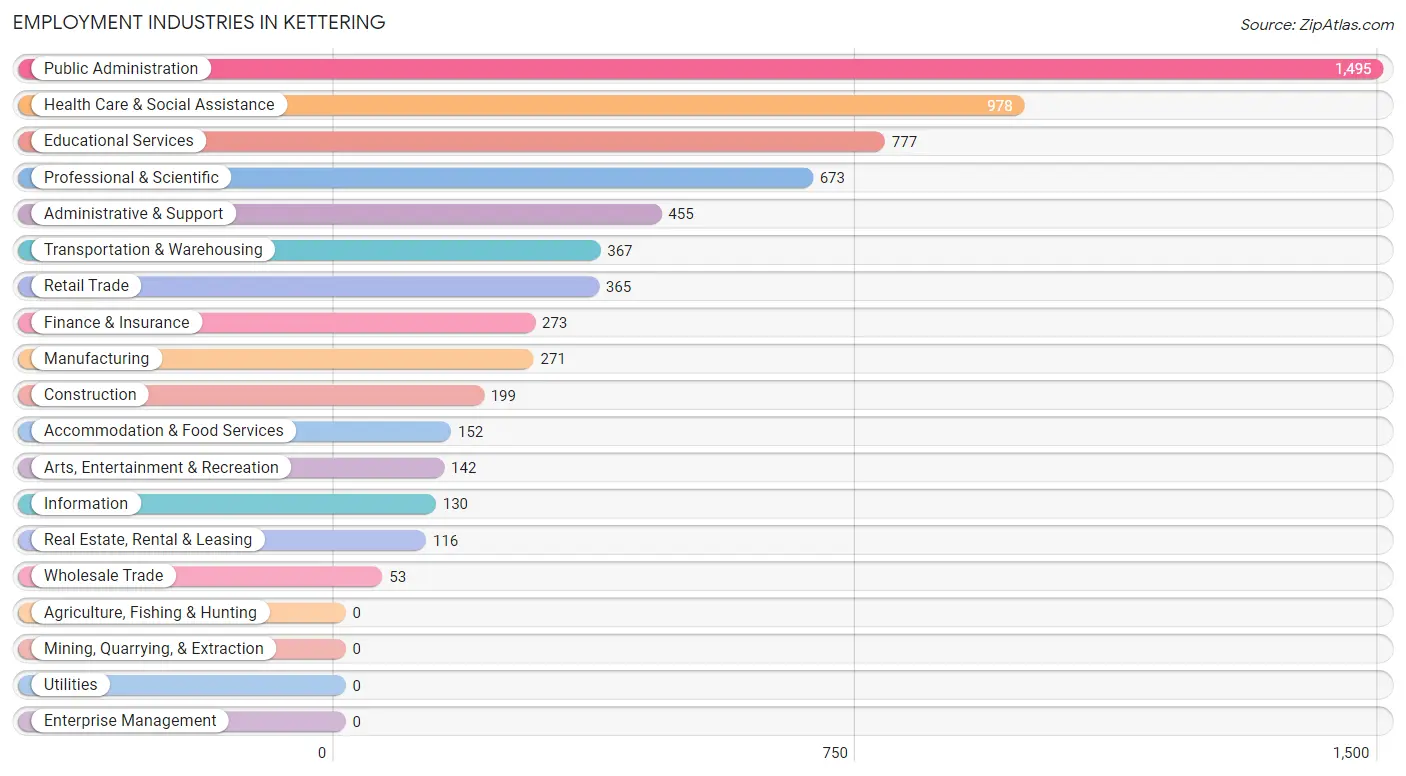
Employment Industries in Kettering
The major employment industries in Kettering include Public Administration (1,495 | 21.9%), Health Care & Social Assistance (978 | 14.3%), Educational Services (777 | 11.4%), Professional & Scientific (673 | 9.9%), and Administrative & Support (455 | 6.7%).
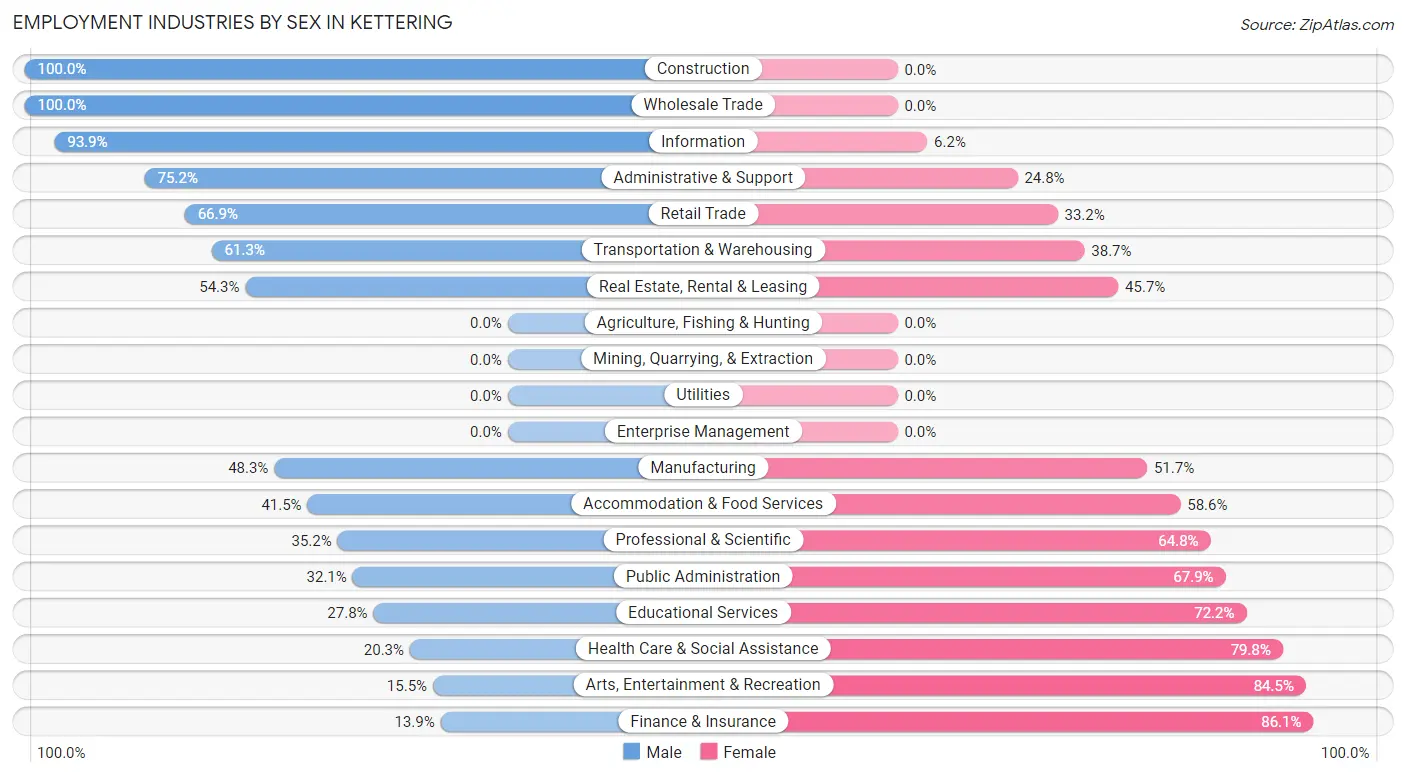
Employment Industries by Sex in Kettering
The Kettering industries that see more men than women are Construction (100.0%), Wholesale Trade (100.0%), and Information (93.9%), whereas the industries that tend to have a higher number of women are Finance & Insurance (86.1%), Arts, Entertainment & Recreation (84.5%), and Health Care & Social Assistance (79.7%).
| Industry | Male | Female |
| Agriculture, Fishing & Hunting | 0 (0.0%) | 0 (0.0%) |
| Mining, Quarrying, & Extraction | 0 (0.0%) | 0 (0.0%) |
| Construction | 199 (100.0%) | 0 (0.0%) |
| Manufacturing | 131 (48.3%) | 140 (51.7%) |
| Wholesale Trade | 53 (100.0%) | 0 (0.0%) |
| Retail Trade | 244 (66.8%) | 121 (33.2%) |
| Transportation & Warehousing | 225 (61.3%) | 142 (38.7%) |
| Utilities | 0 (0.0%) | 0 (0.0%) |
| Information | 122 (93.9%) | 8 (6.1%) |
| Finance & Insurance | 38 (13.9%) | 235 (86.1%) |
| Real Estate, Rental & Leasing | 63 (54.3%) | 53 (45.7%) |
| Professional & Scientific | 237 (35.2%) | 436 (64.8%) |
| Enterprise Management | 0 (0.0%) | 0 (0.0%) |
| Administrative & Support | 342 (75.2%) | 113 (24.8%) |
| Educational Services | 216 (27.8%) | 561 (72.2%) |
| Health Care & Social Assistance | 198 (20.3%) | 780 (79.7%) |
| Arts, Entertainment & Recreation | 22 (15.5%) | 120 (84.5%) |
| Accommodation & Food Services | 63 (41.4%) | 89 (58.6%) |
| Public Administration | 480 (32.1%) | 1,015 (67.9%) |
| Total | 2,815 (41.2%) | 4,010 (58.8%) |
Education in Kettering
School Enrollment in Kettering
The most common levels of schooling among the 2,846 students in Kettering are high school (726 | 25.5%), elementary school (656 | 23.1%), and college / undergraduate (588 | 20.7%).
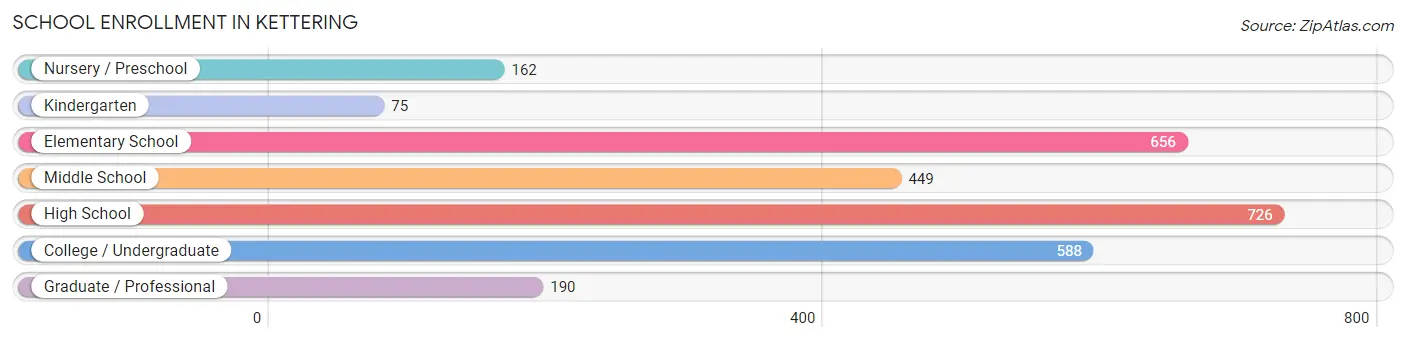
| School Level | # Students | % Students |
| Nursery / Preschool | 162 | 5.7% |
| Kindergarten | 75 | 2.6% |
| Elementary School | 656 | 23.1% |
| Middle School | 449 | 15.8% |
| High School | 726 | 25.5% |
| College / Undergraduate | 588 | 20.7% |
| Graduate / Professional | 190 | 6.7% |
| Total | 2,846 | 100.0% |
School Enrollment by Age by Funding Source in Kettering
Out of a total of 2,846 students who are enrolled in schools in Kettering, 566 (19.9%) attend a private institution, while the remaining 2,280 (80.1%) are enrolled in public schools. The age group of 35 years and over has the highest likelihood of being enrolled in private schools, with 122 (54.0% in the age bracket) enrolled. Conversely, the age group of 3 to 4 year olds has the lowest likelihood of being enrolled in a private school, with 17 (100.0% in the age bracket) attending a public institution.
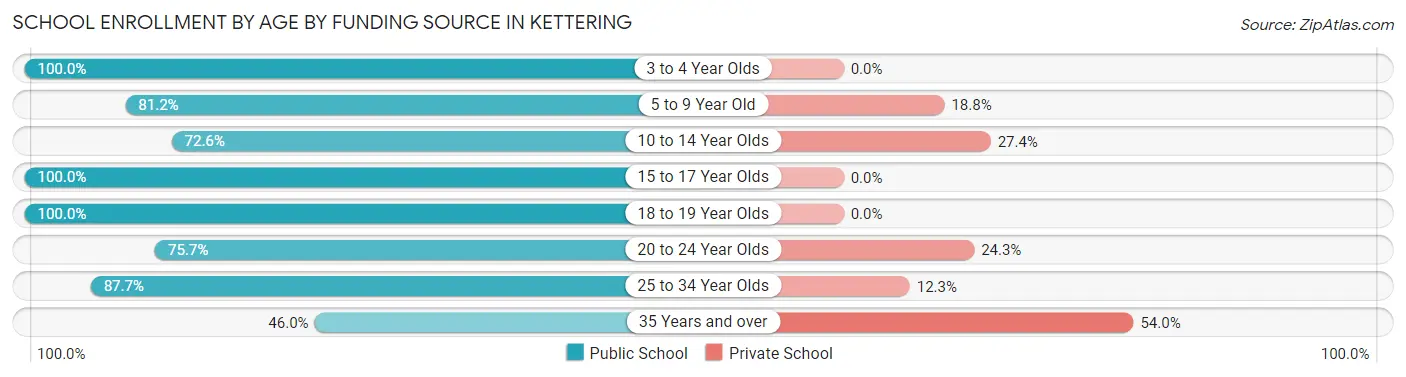
| Age Bracket | Public School | Private School |
| 3 to 4 Year Olds | 17 (100.0%) | 0 (0.0%) |
| 5 to 9 Year Old | 679 (81.2%) | 157 (18.8%) |
| 10 to 14 Year Olds | 440 (72.6%) | 166 (27.4%) |
| 15 to 17 Year Olds | 536 (100.0%) | 0 (0.0%) |
| 18 to 19 Year Olds | 55 (100.0%) | 0 (0.0%) |
| 20 to 24 Year Olds | 327 (75.7%) | 105 (24.3%) |
| 25 to 34 Year Olds | 121 (87.7%) | 17 (12.3%) |
| 35 Years and over | 104 (46.0%) | 122 (54.0%) |
| Total | 2,280 (80.1%) | 566 (19.9%) |
Educational Attainment by Field of Study in Kettering
Business (1,313 | 28.2%), social sciences (607 | 13.0%), education (467 | 10.0%), arts & humanities (449 | 9.6%), and science & technology (425 | 9.1%) are the most common fields of study among 4,663 individuals in Kettering who have obtained a bachelor's degree or higher.
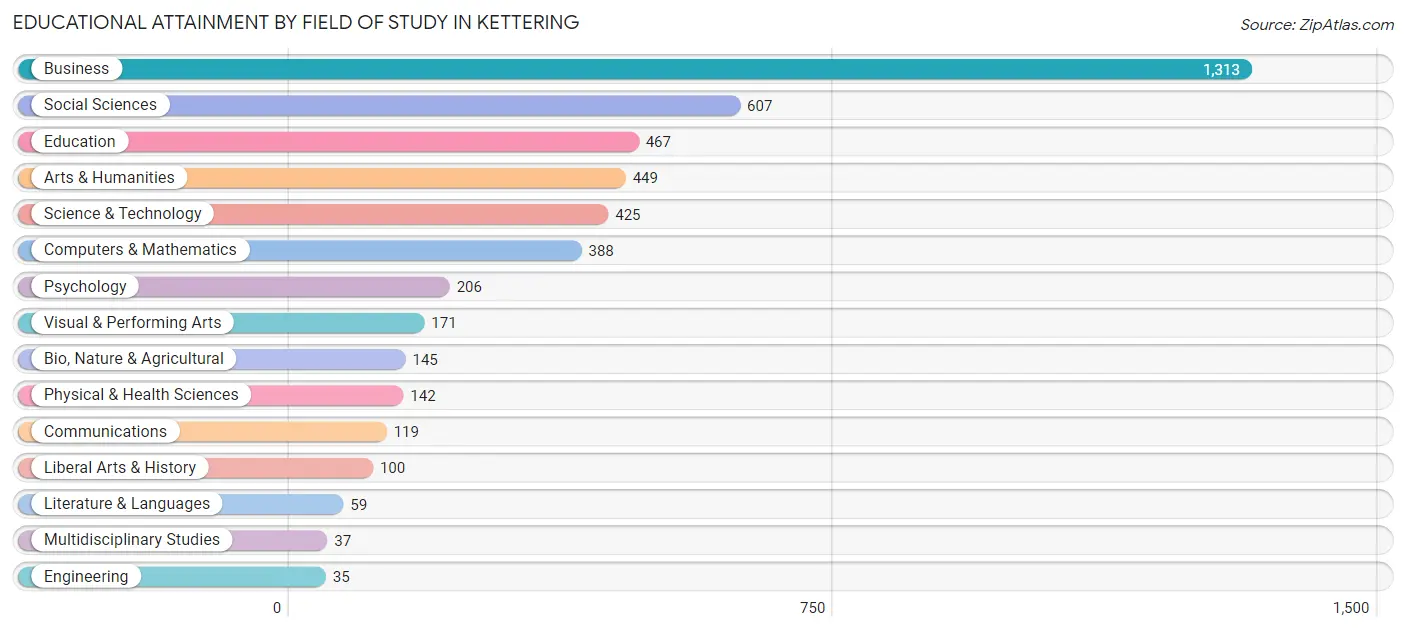
| Field of Study | # Graduates | % Graduates |
| Computers & Mathematics | 388 | 8.3% |
| Bio, Nature & Agricultural | 145 | 3.1% |
| Physical & Health Sciences | 142 | 3.0% |
| Psychology | 206 | 4.4% |
| Social Sciences | 607 | 13.0% |
| Engineering | 35 | 0.7% |
| Multidisciplinary Studies | 37 | 0.8% |
| Science & Technology | 425 | 9.1% |
| Business | 1,313 | 28.2% |
| Education | 467 | 10.0% |
| Literature & Languages | 59 | 1.3% |
| Liberal Arts & History | 100 | 2.1% |
| Visual & Performing Arts | 171 | 3.7% |
| Communications | 119 | 2.5% |
| Arts & Humanities | 449 | 9.6% |
| Total | 4,663 | 100.0% |
Transportation & Commute in Kettering
Vehicle Availability by Sex in Kettering
The most prevalent vehicle ownership categories in Kettering are males with 2 vehicles (894, accounting for 31.7%) and females with 2 vehicles (1,087, making up 23.9%).
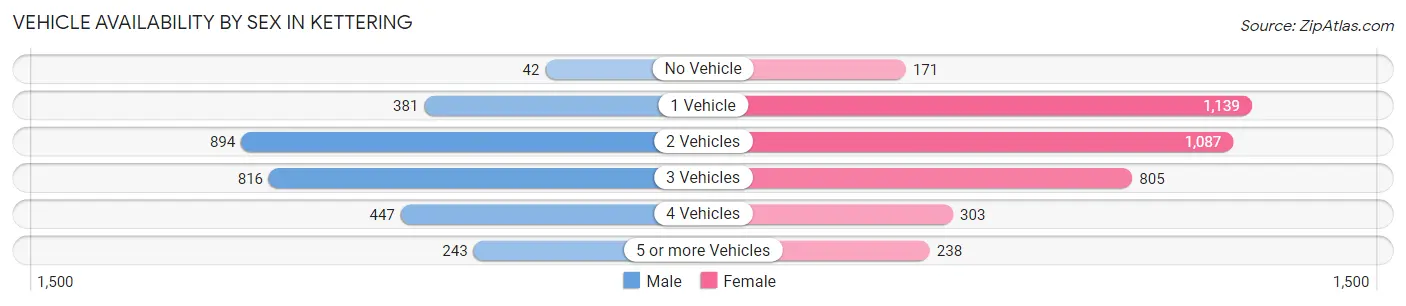
| Vehicles Available | Male | Female |
| No Vehicle | 42 (1.5%) | 171 (4.6%) |
| 1 Vehicle | 381 (13.5%) | 1,139 (30.4%) |
| 2 Vehicles | 894 (31.7%) | 1,087 (29.0%) |
| 3 Vehicles | 816 (28.9%) | 805 (21.5%) |
| 4 Vehicles | 447 (15.8%) | 303 (8.1%) |
| 5 or more Vehicles | 243 (8.6%) | 238 (6.4%) |
| Total | 2,823 (100.0%) | 3,743 (100.0%) |
Commute Time in Kettering
The most frequently occuring commute durations in Kettering are 45 to 59 minutes (1,166 commuters, 20.0%), 30 to 34 minutes (1,017 commuters, 17.4%), and 60 to 89 minutes (880 commuters, 15.1%).
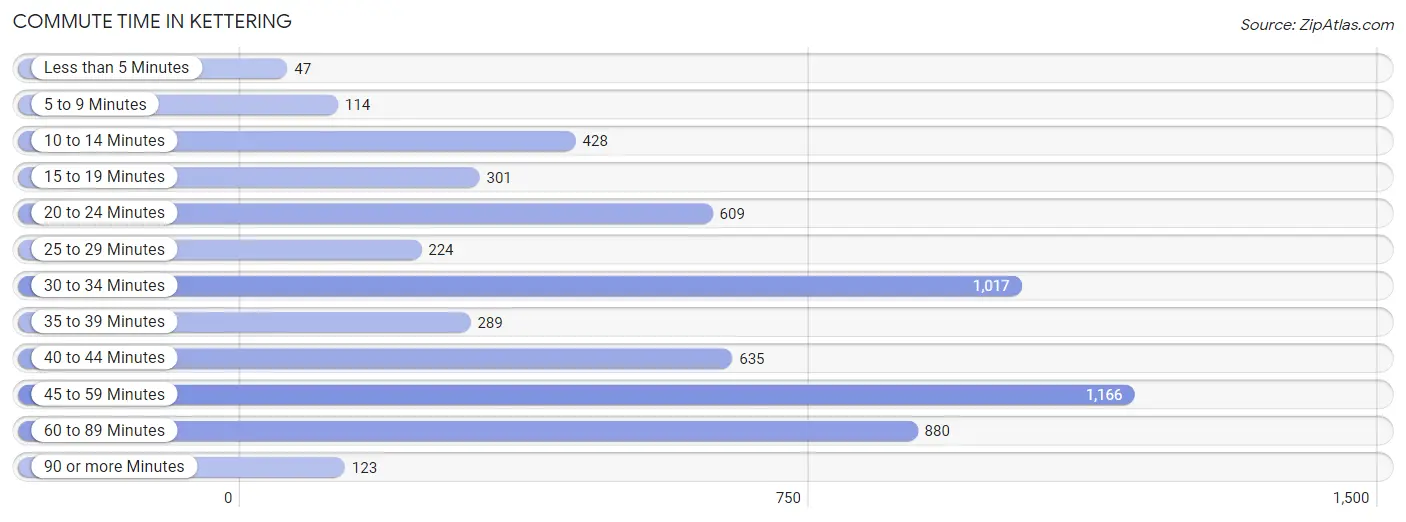
| Commute Time | # Commuters | % Commuters |
| Less than 5 Minutes | 47 | 0.8% |
| 5 to 9 Minutes | 114 | 1.9% |
| 10 to 14 Minutes | 428 | 7.3% |
| 15 to 19 Minutes | 301 | 5.2% |
| 20 to 24 Minutes | 609 | 10.4% |
| 25 to 29 Minutes | 224 | 3.8% |
| 30 to 34 Minutes | 1,017 | 17.4% |
| 35 to 39 Minutes | 289 | 5.0% |
| 40 to 44 Minutes | 635 | 10.9% |
| 45 to 59 Minutes | 1,166 | 20.0% |
| 60 to 89 Minutes | 880 | 15.1% |
| 90 or more Minutes | 123 | 2.1% |
Commute Time by Sex in Kettering
The most common commute times in Kettering are 30 to 34 minutes (620 commuters, 23.6%) for males and 45 to 59 minutes (648 commuters, 20.2%) for females.
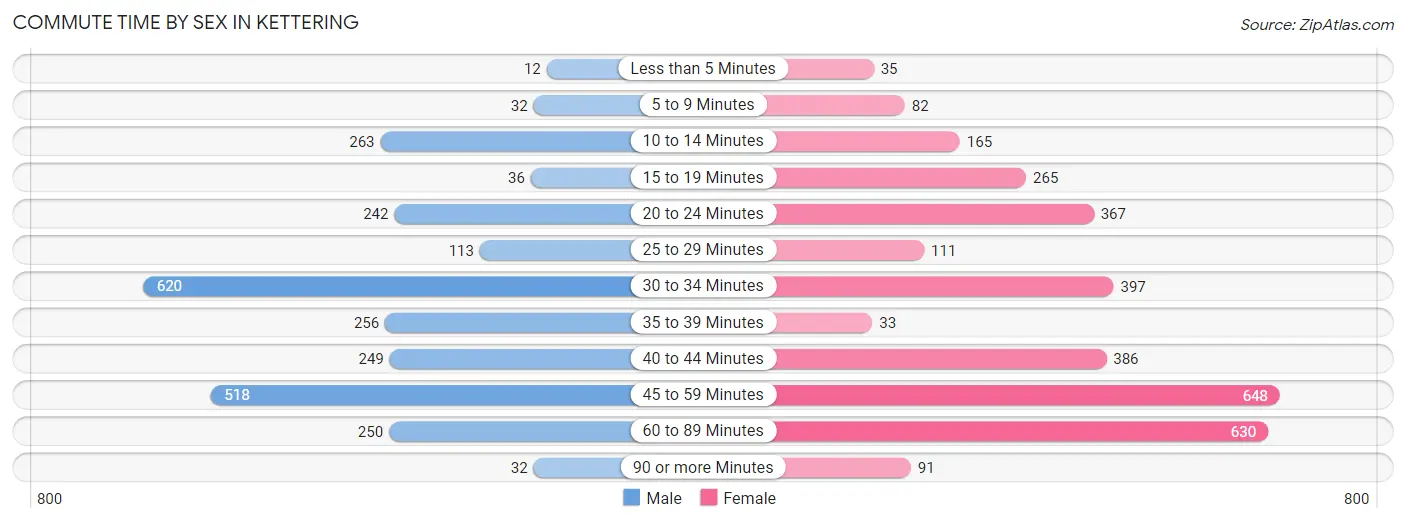
| Commute Time | Male | Female |
| Less than 5 Minutes | 12 (0.5%) | 35 (1.1%) |
| 5 to 9 Minutes | 32 (1.2%) | 82 (2.5%) |
| 10 to 14 Minutes | 263 (10.0%) | 165 (5.1%) |
| 15 to 19 Minutes | 36 (1.4%) | 265 (8.3%) |
| 20 to 24 Minutes | 242 (9.2%) | 367 (11.4%) |
| 25 to 29 Minutes | 113 (4.3%) | 111 (3.5%) |
| 30 to 34 Minutes | 620 (23.6%) | 397 (12.4%) |
| 35 to 39 Minutes | 256 (9.8%) | 33 (1.0%) |
| 40 to 44 Minutes | 249 (9.5%) | 386 (12.0%) |
| 45 to 59 Minutes | 518 (19.8%) | 648 (20.2%) |
| 60 to 89 Minutes | 250 (9.5%) | 630 (19.6%) |
| 90 or more Minutes | 32 (1.2%) | 91 (2.8%) |
Time of Departure to Work by Sex in Kettering
The most frequent times of departure to work in Kettering are 5:30 AM to 5:59 AM (365, 13.9%) for males and 7:00 AM to 7:29 AM (558, 17.4%) for females.
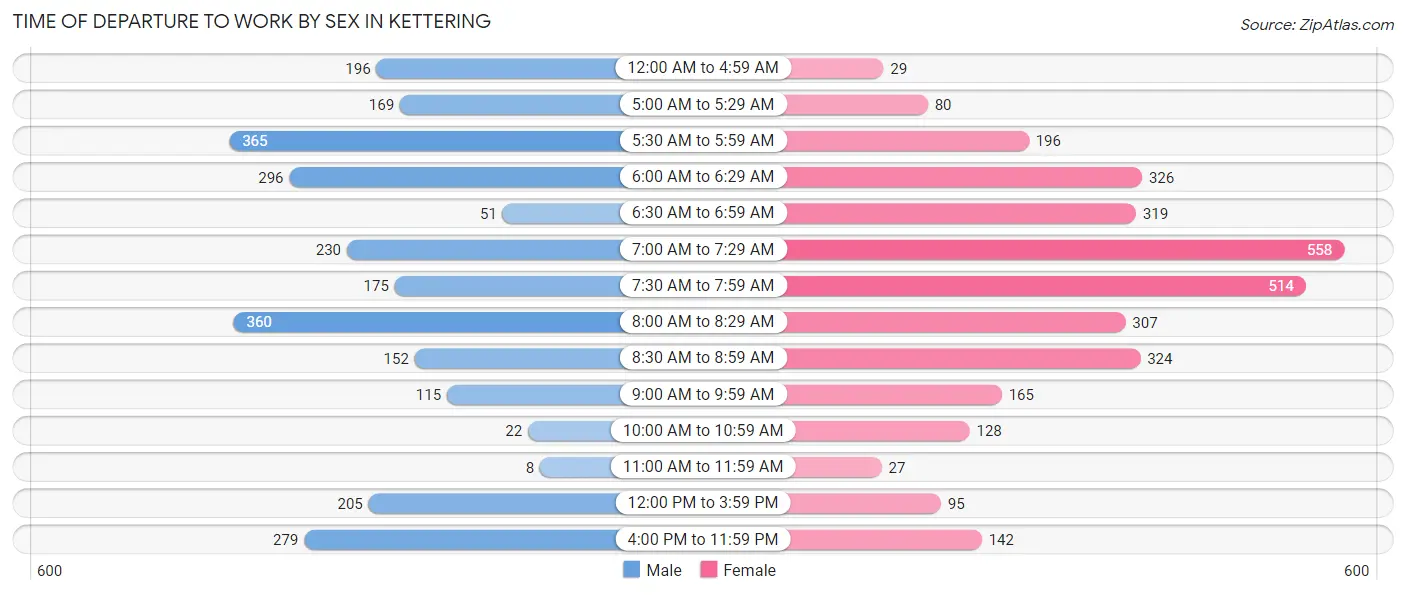
| Time of Departure | Male | Female |
| 12:00 AM to 4:59 AM | 196 (7.5%) | 29 (0.9%) |
| 5:00 AM to 5:29 AM | 169 (6.4%) | 80 (2.5%) |
| 5:30 AM to 5:59 AM | 365 (13.9%) | 196 (6.1%) |
| 6:00 AM to 6:29 AM | 296 (11.3%) | 326 (10.2%) |
| 6:30 AM to 6:59 AM | 51 (1.9%) | 319 (9.9%) |
| 7:00 AM to 7:29 AM | 230 (8.8%) | 558 (17.4%) |
| 7:30 AM to 7:59 AM | 175 (6.7%) | 514 (16.0%) |
| 8:00 AM to 8:29 AM | 360 (13.7%) | 307 (9.6%) |
| 8:30 AM to 8:59 AM | 152 (5.8%) | 324 (10.1%) |
| 9:00 AM to 9:59 AM | 115 (4.4%) | 165 (5.1%) |
| 10:00 AM to 10:59 AM | 22 (0.8%) | 128 (4.0%) |
| 11:00 AM to 11:59 AM | 8 (0.3%) | 27 (0.8%) |
| 12:00 PM to 3:59 PM | 205 (7.8%) | 95 (3.0%) |
| 4:00 PM to 11:59 PM | 279 (10.6%) | 142 (4.4%) |
| Total | 2,623 (100.0%) | 3,210 (100.0%) |
Housing Occupancy in Kettering
Occupancy by Ownership in Kettering
Of the total 5,937 dwellings in Kettering, owner-occupied units account for 5,222 (88.0%), while renter-occupied units make up 715 (12.0%).
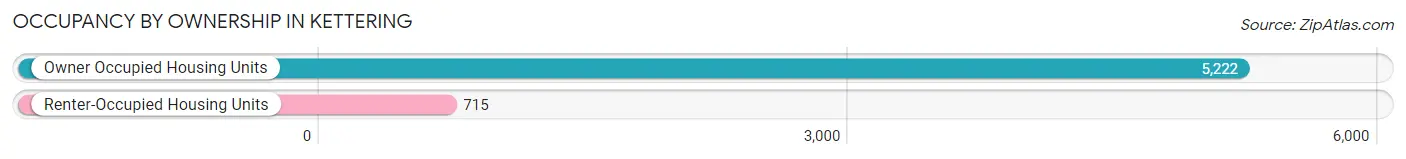
| Occupancy | # Housing Units | % Housing Units |
| Owner Occupied Housing Units | 5,222 | 88.0% |
| Renter-Occupied Housing Units | 715 | 12.0% |
| Total Occupied Housing Units | 5,937 | 100.0% |
Occupancy by Household Size in Kettering
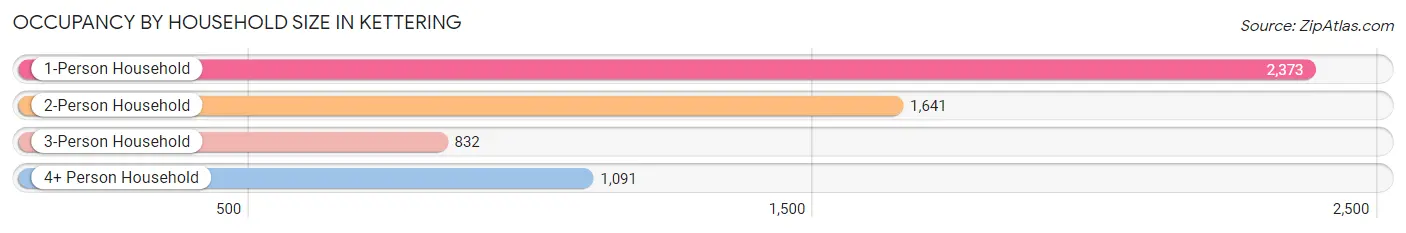
| Household Size | # Housing Units | % Housing Units |
| 1-Person Household | 2,373 | 40.0% |
| 2-Person Household | 1,641 | 27.6% |
| 3-Person Household | 832 | 14.0% |
| 4+ Person Household | 1,091 | 18.4% |
| Total Housing Units | 5,937 | 100.0% |
Occupancy by Ownership by Household Size in Kettering
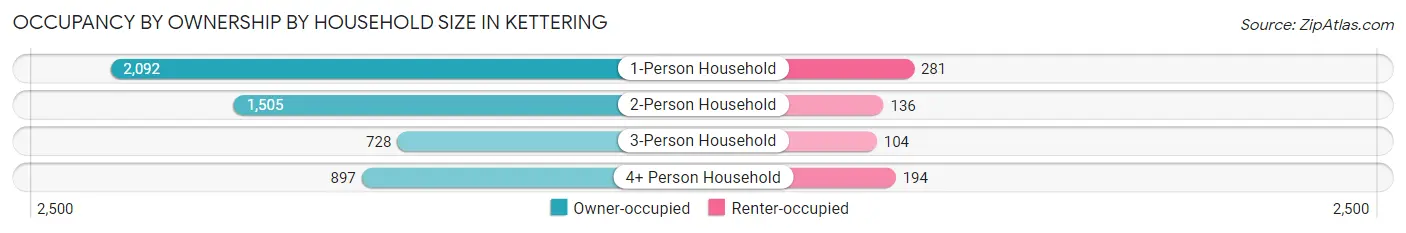
| Household Size | Owner-occupied | Renter-occupied |
| 1-Person Household | 2,092 (88.2%) | 281 (11.8%) |
| 2-Person Household | 1,505 (91.7%) | 136 (8.3%) |
| 3-Person Household | 728 (87.5%) | 104 (12.5%) |
| 4+ Person Household | 897 (82.2%) | 194 (17.8%) |
| Total Housing Units | 5,222 (88.0%) | 715 (12.0%) |
Occupancy by Educational Attainment in Kettering
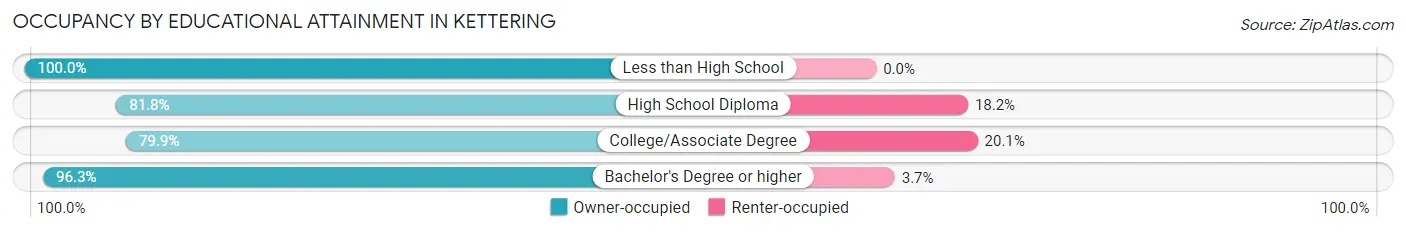
| Household Size | Owner-occupied | Renter-occupied |
| Less than High School | 39 (100.0%) | 0 (0.0%) |
| High School Diploma | 935 (81.8%) | 208 (18.2%) |
| College/Associate Degree | 1,613 (79.9%) | 406 (20.1%) |
| Bachelor's Degree or higher | 2,635 (96.3%) | 101 (3.7%) |
Occupancy by Age of Householder in Kettering
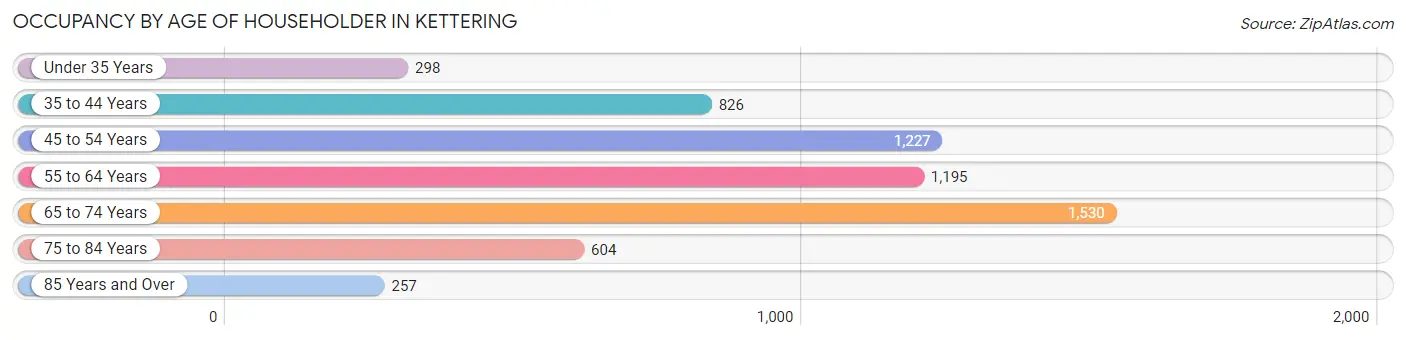
| Age Bracket | # Households | % Households |
| Under 35 Years | 298 | 5.0% |
| 35 to 44 Years | 826 | 13.9% |
| 45 to 54 Years | 1,227 | 20.7% |
| 55 to 64 Years | 1,195 | 20.1% |
| 65 to 74 Years | 1,530 | 25.8% |
| 75 to 84 Years | 604 | 10.2% |
| 85 Years and Over | 257 | 4.3% |
| Total | 5,937 | 100.0% |
Housing Finances in Kettering
Median Income by Occupancy in Kettering
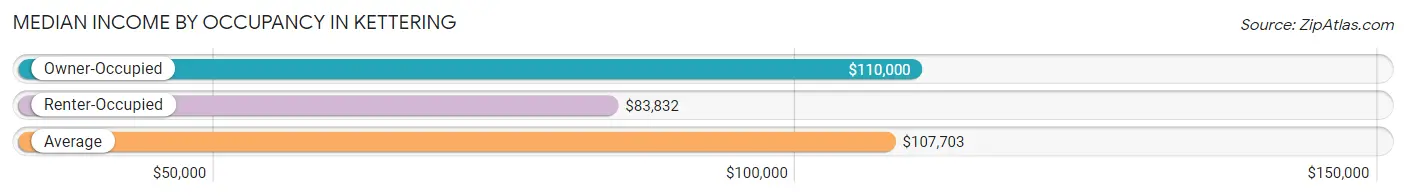
| Occupancy Type | # Households | Median Income |
| Owner-Occupied | 5,222 (88.0%) | $110,000 |
| Renter-Occupied | 715 (12.0%) | $83,832 |
| Average | 5,937 (100.0%) | $107,703 |
Occupancy by Householder Income Bracket in Kettering
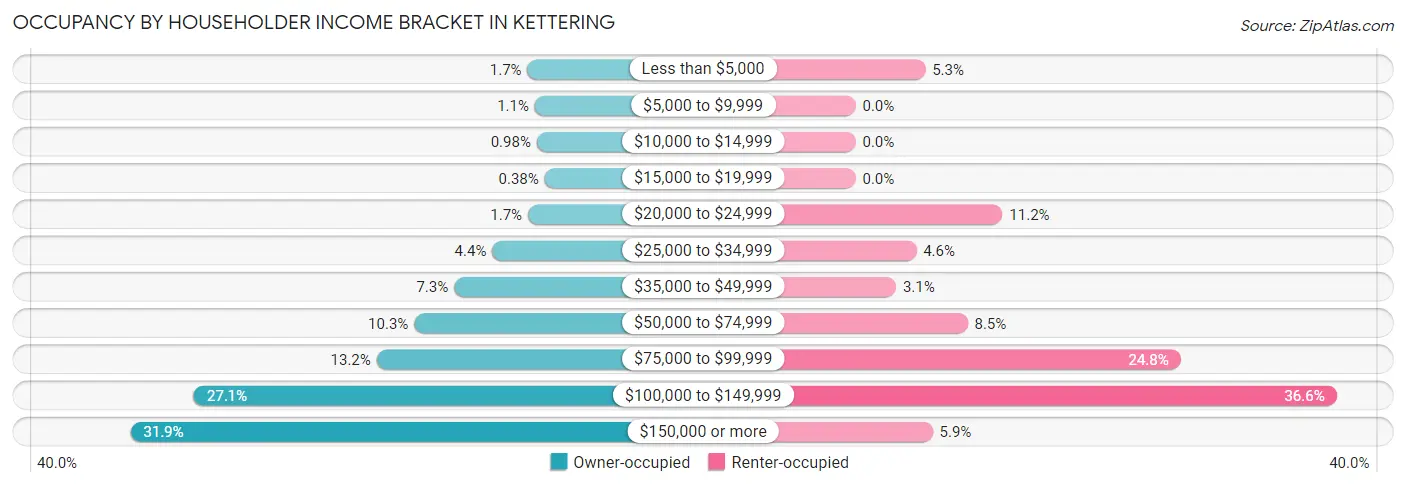
| Income Bracket | Owner-occupied | Renter-occupied |
| Less than $5,000 | 88 (1.7%) | 38 (5.3%) |
| $5,000 to $9,999 | 59 (1.1%) | 0 (0.0%) |
| $10,000 to $14,999 | 51 (1.0%) | 0 (0.0%) |
| $15,000 to $19,999 | 20 (0.4%) | 0 (0.0%) |
| $20,000 to $24,999 | 86 (1.7%) | 80 (11.2%) |
| $25,000 to $34,999 | 228 (4.4%) | 33 (4.6%) |
| $35,000 to $49,999 | 380 (7.3%) | 22 (3.1%) |
| $50,000 to $74,999 | 539 (10.3%) | 61 (8.5%) |
| $75,000 to $99,999 | 688 (13.2%) | 177 (24.8%) |
| $100,000 to $149,999 | 1,415 (27.1%) | 262 (36.6%) |
| $150,000 or more | 1,668 (31.9%) | 42 (5.9%) |
| Total | 5,222 (100.0%) | 715 (100.0%) |
Monthly Housing Cost Tiers in Kettering
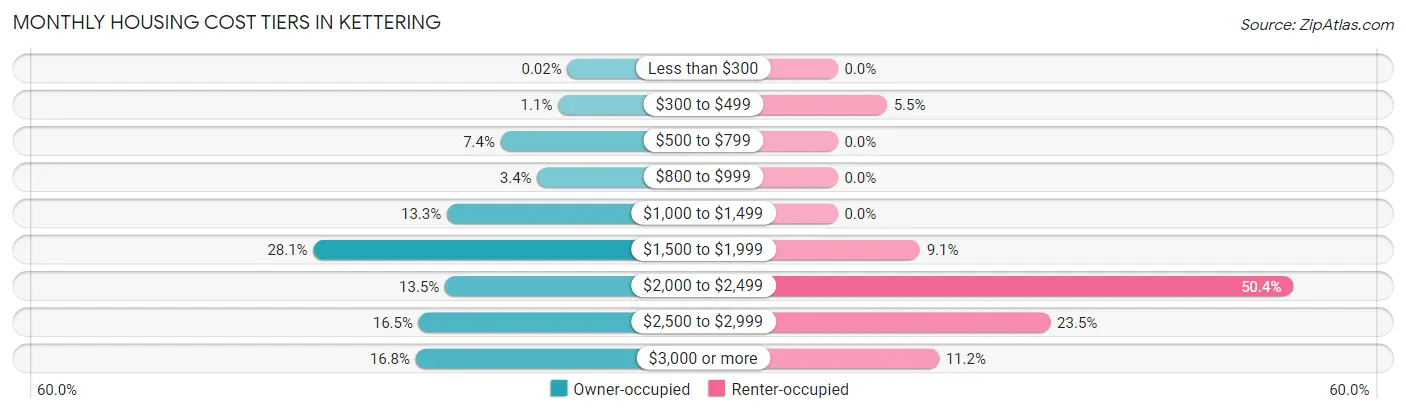
| Monthly Cost | Owner-occupied | Renter-occupied |
| Less than $300 | 1 (0.0%) | 0 (0.0%) |
| $300 to $499 | 55 (1.1%) | 39 (5.4%) |
| $500 to $799 | 386 (7.4%) | 0 (0.0%) |
| $800 to $999 | 175 (3.4%) | 0 (0.0%) |
| $1,000 to $1,499 | 696 (13.3%) | 0 (0.0%) |
| $1,500 to $1,999 | 1,467 (28.1%) | 65 (9.1%) |
| $2,000 to $2,499 | 707 (13.5%) | 360 (50.3%) |
| $2,500 to $2,999 | 859 (16.5%) | 168 (23.5%) |
| $3,000 or more | 876 (16.8%) | 80 (11.2%) |
| Total | 5,222 (100.0%) | 715 (100.0%) |
Physical Housing Characteristics in Kettering
Housing Structures in Kettering
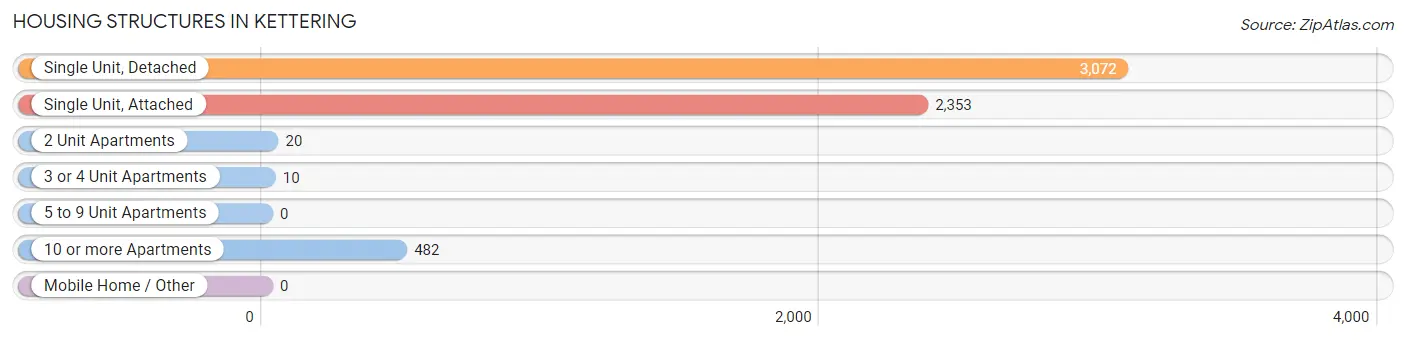
| Structure Type | # Housing Units | % Housing Units |
| Single Unit, Detached | 3,072 | 51.7% |
| Single Unit, Attached | 2,353 | 39.6% |
| 2 Unit Apartments | 20 | 0.3% |
| 3 or 4 Unit Apartments | 10 | 0.2% |
| 5 to 9 Unit Apartments | 0 | 0.0% |
| 10 or more Apartments | 482 | 8.1% |
| Mobile Home / Other | 0 | 0.0% |
| Total | 5,937 | 100.0% |
Housing Structures by Occupancy in Kettering
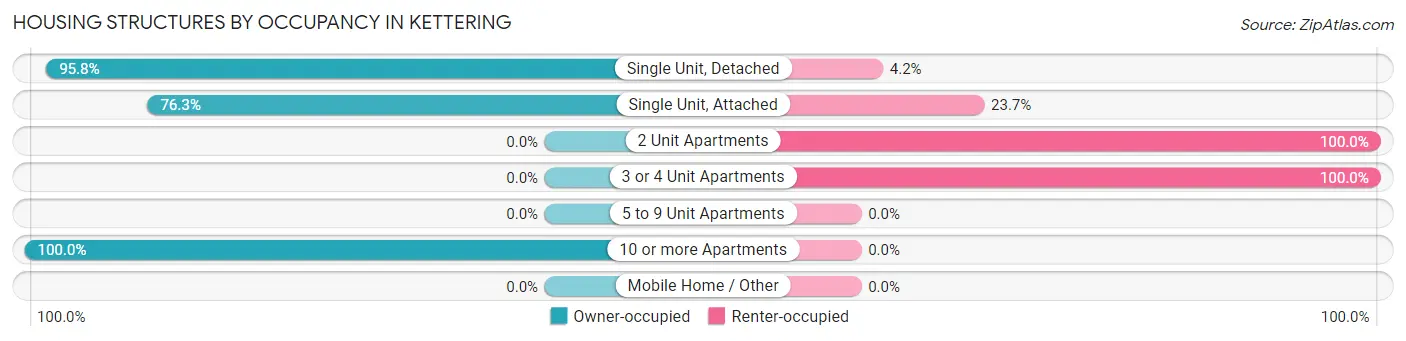
| Structure Type | Owner-occupied | Renter-occupied |
| Single Unit, Detached | 2,944 (95.8%) | 128 (4.2%) |
| Single Unit, Attached | 1,796 (76.3%) | 557 (23.7%) |
| 2 Unit Apartments | 0 (0.0%) | 20 (100.0%) |
| 3 or 4 Unit Apartments | 0 (0.0%) | 10 (100.0%) |
| 5 to 9 Unit Apartments | 0 (0.0%) | 0 (0.0%) |
| 10 or more Apartments | 482 (100.0%) | 0 (0.0%) |
| Mobile Home / Other | 0 (0.0%) | 0 (0.0%) |
| Total | 5,222 (88.0%) | 715 (12.0%) |
Housing Structures by Number of Rooms in Kettering
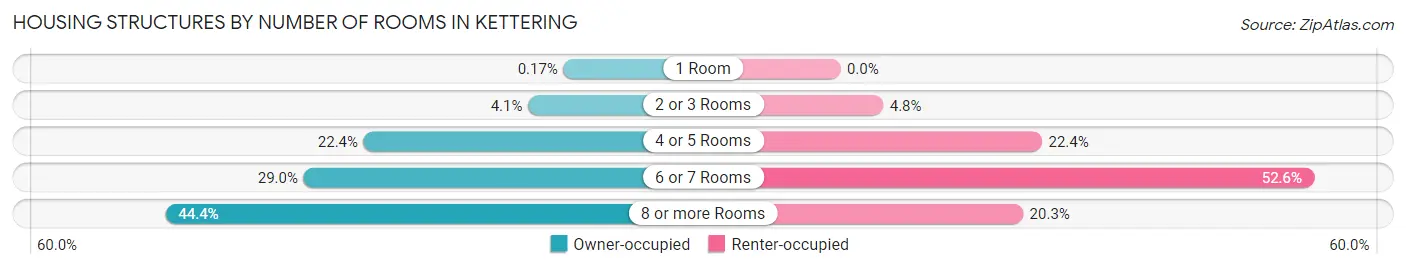
| Number of Rooms | Owner-occupied | Renter-occupied |
| 1 Room | 9 (0.2%) | 0 (0.0%) |
| 2 or 3 Rooms | 214 (4.1%) | 34 (4.8%) |
| 4 or 5 Rooms | 1,167 (22.4%) | 160 (22.4%) |
| 6 or 7 Rooms | 1,515 (29.0%) | 376 (52.6%) |
| 8 or more Rooms | 2,317 (44.4%) | 145 (20.3%) |
| Total | 5,222 (100.0%) | 715 (100.0%) |
Housing Structure by Heating Type in Kettering
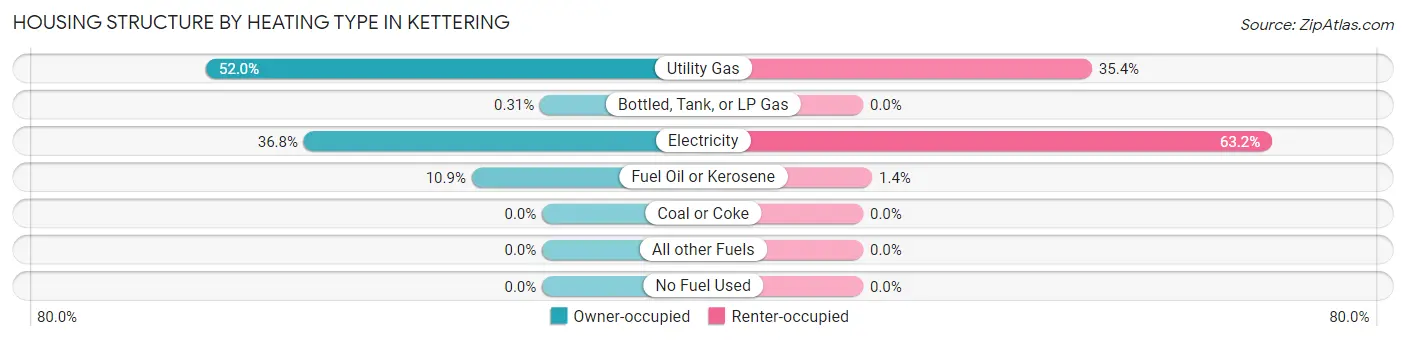
| Heating Type | Owner-occupied | Renter-occupied |
| Utility Gas | 2,714 (52.0%) | 253 (35.4%) |
| Bottled, Tank, or LP Gas | 16 (0.3%) | 0 (0.0%) |
| Electricity | 1,924 (36.8%) | 452 (63.2%) |
| Fuel Oil or Kerosene | 568 (10.9%) | 10 (1.4%) |
| Coal or Coke | 0 (0.0%) | 0 (0.0%) |
| All other Fuels | 0 (0.0%) | 0 (0.0%) |
| No Fuel Used | 0 (0.0%) | 0 (0.0%) |
| Total | 5,222 (100.0%) | 715 (100.0%) |
Household Vehicle Usage in Kettering
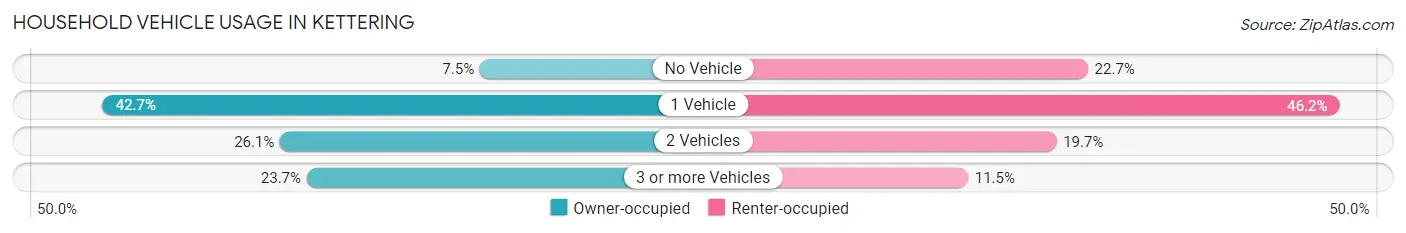
| Vehicles per Household | Owner-occupied | Renter-occupied |
| No Vehicle | 391 (7.5%) | 162 (22.7%) |
| 1 Vehicle | 2,231 (42.7%) | 330 (46.2%) |
| 2 Vehicles | 1,365 (26.1%) | 141 (19.7%) |
| 3 or more Vehicles | 1,235 (23.6%) | 82 (11.5%) |
| Total | 5,222 (100.0%) | 715 (100.0%) |
Real Estate & Mortgages in Kettering
Real Estate and Mortgage Overview in Kettering
| Characteristic | Without Mortgage | With Mortgage |
| Housing Units | 688 | 4,534 |
| Median Property Value | $406,300 | $379,200 |
| Median Household Income | $94,722 | $1,550 |
| Monthly Housing Costs | $806 | $876 |
| Real Estate Taxes | $4,428 | $138 |
Property Value by Mortgage Status in Kettering
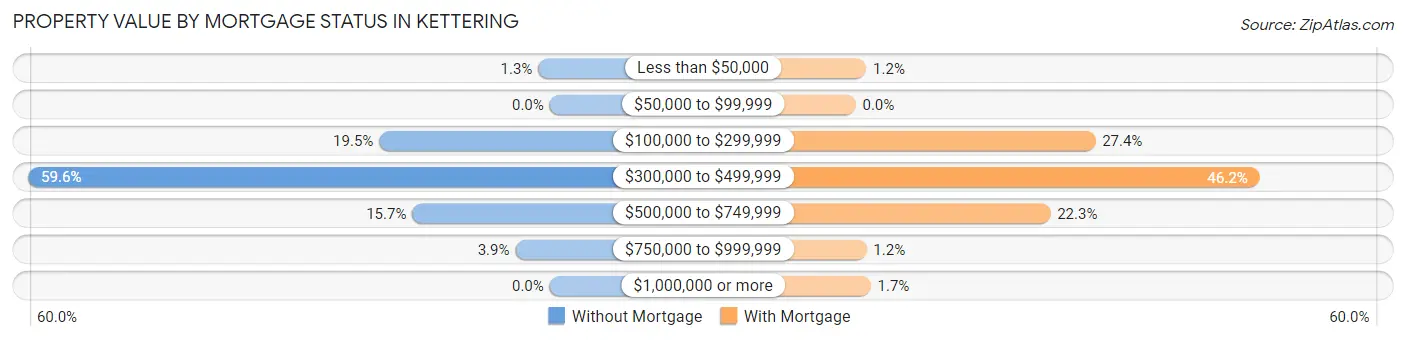
| Property Value | Without Mortgage | With Mortgage |
| Less than $50,000 | 9 (1.3%) | 55 (1.2%) |
| $50,000 to $99,999 | 0 (0.0%) | 0 (0.0%) |
| $100,000 to $299,999 | 134 (19.5%) | 1,242 (27.4%) |
| $300,000 to $499,999 | 410 (59.6%) | 2,094 (46.2%) |
| $500,000 to $749,999 | 108 (15.7%) | 1,009 (22.3%) |
| $750,000 to $999,999 | 27 (3.9%) | 56 (1.2%) |
| $1,000,000 or more | 0 (0.0%) | 78 (1.7%) |
| Total | 688 (100.0%) | 4,534 (100.0%) |
Household Income by Mortgage Status in Kettering
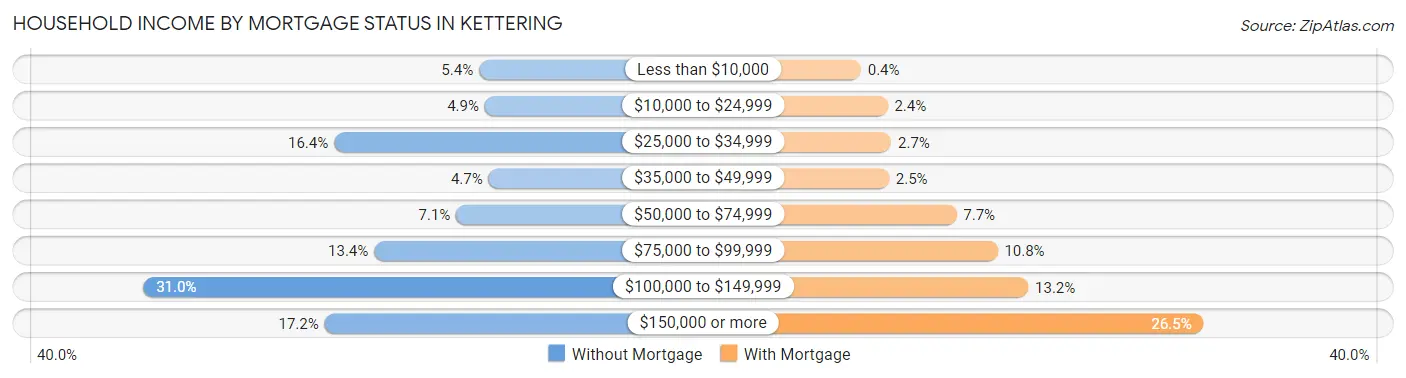
| Household Income | Without Mortgage | With Mortgage |
| Less than $10,000 | 37 (5.4%) | 18 (0.4%) |
| $10,000 to $24,999 | 34 (4.9%) | 110 (2.4%) |
| $25,000 to $34,999 | 113 (16.4%) | 123 (2.7%) |
| $35,000 to $49,999 | 32 (4.6%) | 115 (2.5%) |
| $50,000 to $74,999 | 49 (7.1%) | 348 (7.7%) |
| $75,000 to $99,999 | 92 (13.4%) | 490 (10.8%) |
| $100,000 to $149,999 | 213 (31.0%) | 596 (13.2%) |
| $150,000 or more | 118 (17.2%) | 1,202 (26.5%) |
| Total | 688 (100.0%) | 4,534 (100.0%) |
Property Value to Household Income Ratio in Kettering
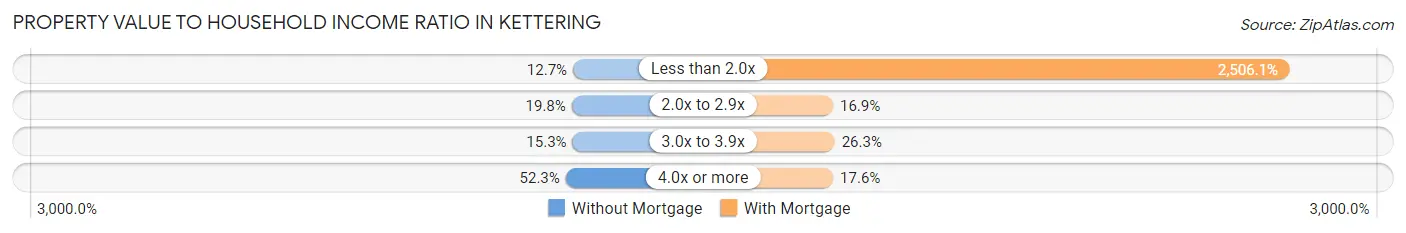
| Value-to-Income Ratio | Without Mortgage | With Mortgage |
| Less than 2.0x | 87 (12.7%) | 113,625 (2,506.1%) |
| 2.0x to 2.9x | 136 (19.8%) | 767 (16.9%) |
| 3.0x to 3.9x | 105 (15.3%) | 1,190 (26.3%) |
| 4.0x or more | 360 (52.3%) | 799 (17.6%) |
| Total | 688 (100.0%) | 4,534 (100.0%) |
Real Estate Taxes by Mortgage Status in Kettering
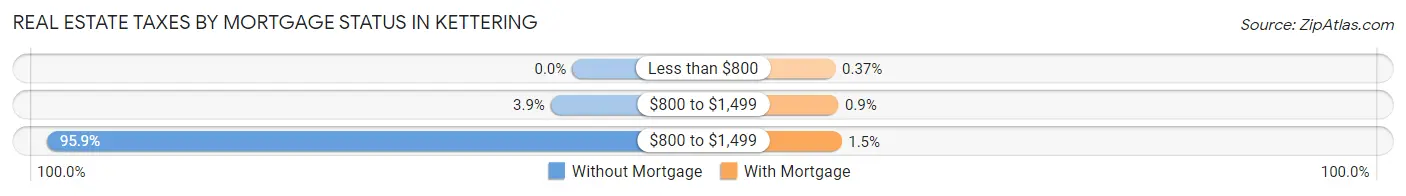
| Property Taxes | Without Mortgage | With Mortgage |
| Less than $800 | 0 (0.0%) | 17 (0.4%) |
| $800 to $1,499 | 27 (3.9%) | 41 (0.9%) |
| $800 to $1,499 | 660 (95.9%) | 68 (1.5%) |
| Total | 688 (100.0%) | 4,534 (100.0%) |
Health & Disability in Kettering
Health Insurance Coverage by Age in Kettering
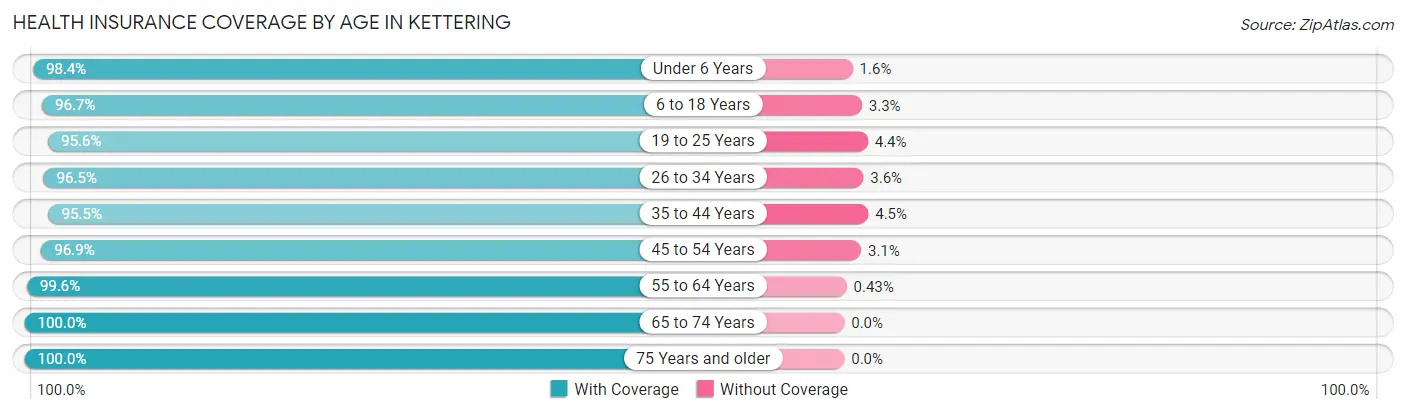
| Age Bracket | With Coverage | Without Coverage |
| Under 6 Years | 505 (98.4%) | 8 (1.6%) |
| 6 to 18 Years | 1,802 (96.7%) | 61 (3.3%) |
| 19 to 25 Years | 873 (95.6%) | 40 (4.4%) |
| 26 to 34 Years | 1,033 (96.5%) | 38 (3.5%) |
| 35 to 44 Years | 1,582 (95.5%) | 74 (4.5%) |
| 45 to 54 Years | 2,051 (96.9%) | 66 (3.1%) |
| 55 to 64 Years | 2,333 (99.6%) | 10 (0.4%) |
| 65 to 74 Years | 2,037 (100.0%) | 0 (0.0%) |
| 75 Years and older | 1,207 (100.0%) | 0 (0.0%) |
| Total | 13,423 (97.8%) | 297 (2.2%) |
Health Insurance Coverage by Citizenship Status in Kettering
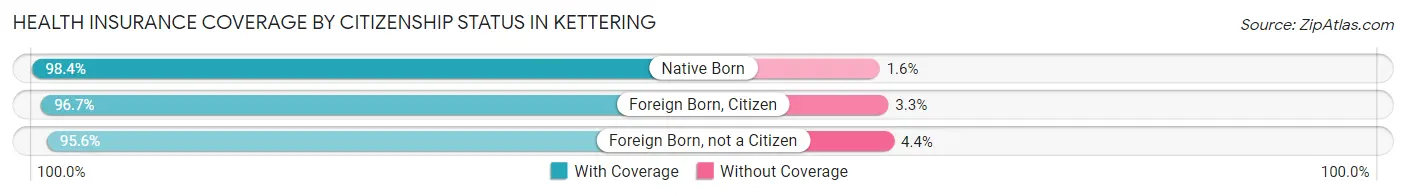
| Citizenship Status | With Coverage | Without Coverage |
| Native Born | 505 (98.4%) | 8 (1.6%) |
| Foreign Born, Citizen | 1,802 (96.7%) | 61 (3.3%) |
| Foreign Born, not a Citizen | 873 (95.6%) | 40 (4.4%) |
Health Insurance Coverage by Household Income in Kettering
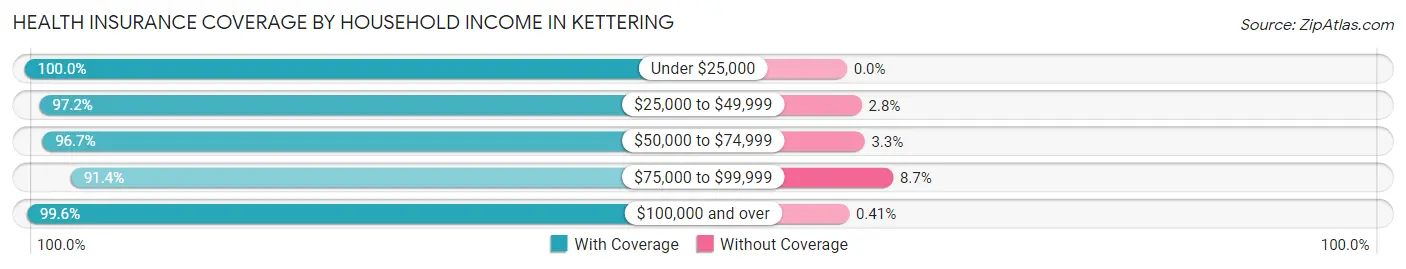
| Household Income | With Coverage | Without Coverage |
| Under $25,000 | 610 (100.0%) | 0 (0.0%) |
| $25,000 to $49,999 | 979 (97.2%) | 28 (2.8%) |
| $50,000 to $74,999 | 906 (96.7%) | 31 (3.3%) |
| $75,000 to $99,999 | 2,132 (91.3%) | 202 (8.6%) |
| $100,000 and over | 8,790 (99.6%) | 36 (0.4%) |
Public vs Private Health Insurance Coverage by Age in Kettering
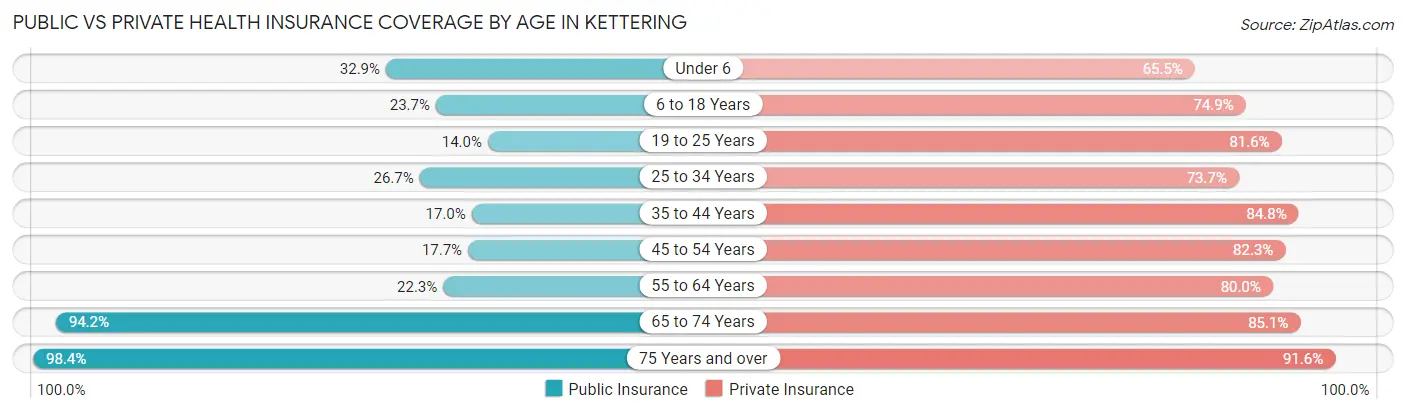
| Age Bracket | Public Insurance | Private Insurance |
| Under 6 | 169 (32.9%) | 336 (65.5%) |
| 6 to 18 Years | 441 (23.7%) | 1,396 (74.9%) |
| 19 to 25 Years | 128 (14.0%) | 745 (81.6%) |
| 25 to 34 Years | 286 (26.7%) | 789 (73.7%) |
| 35 to 44 Years | 282 (17.0%) | 1,404 (84.8%) |
| 45 to 54 Years | 375 (17.7%) | 1,742 (82.3%) |
| 55 to 64 Years | 523 (22.3%) | 1,874 (80.0%) |
| 65 to 74 Years | 1,919 (94.2%) | 1,733 (85.1%) |
| 75 Years and over | 1,188 (98.4%) | 1,105 (91.5%) |
| Total | 5,311 (38.7%) | 11,124 (81.1%) |
Disability Status by Sex by Age in Kettering
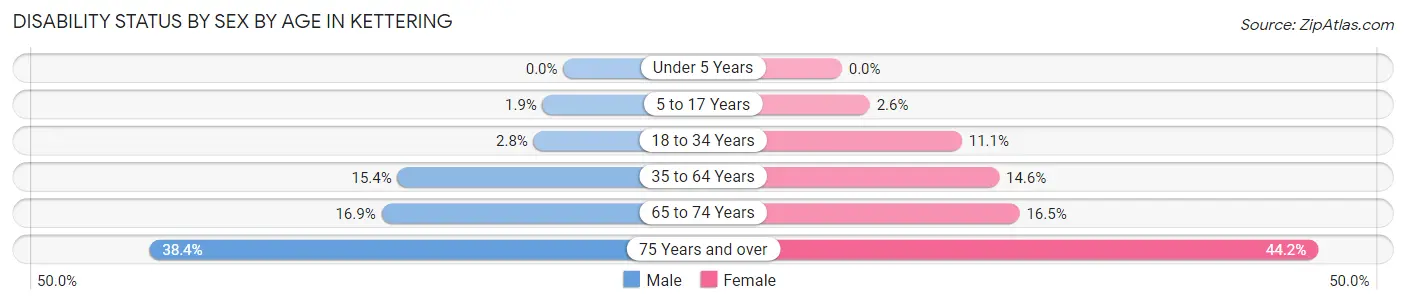
| Age Bracket | Male | Female |
| Under 5 Years | 0 (0.0%) | 0 (0.0%) |
| 5 to 17 Years | 22 (1.9%) | 22 (2.6%) |
| 18 to 34 Years | 31 (2.8%) | 100 (11.1%) |
| 35 to 64 Years | 399 (15.4%) | 514 (14.6%) |
| 65 to 74 Years | 92 (16.9%) | 246 (16.5%) |
| 75 Years and over | 136 (38.4%) | 377 (44.2%) |
Disability Class by Sex by Age in Kettering
Disability Class: Hearing Difficulty
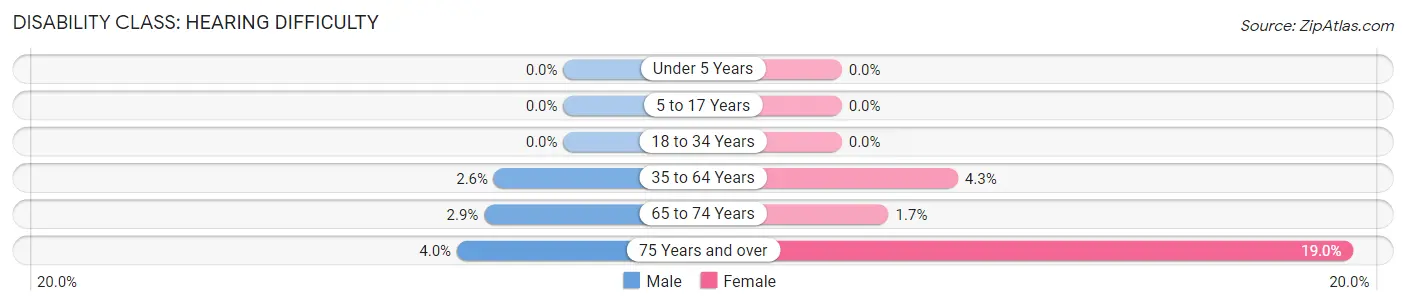
| Age Bracket | Male | Female |
| Under 5 Years | 0 (0.0%) | 0 (0.0%) |
| 5 to 17 Years | 0 (0.0%) | 0 (0.0%) |
| 18 to 34 Years | 0 (0.0%) | 0 (0.0%) |
| 35 to 64 Years | 67 (2.6%) | 152 (4.3%) |
| 65 to 74 Years | 16 (2.9%) | 26 (1.7%) |
| 75 Years and over | 14 (4.0%) | 162 (19.0%) |
Disability Class: Vision Difficulty
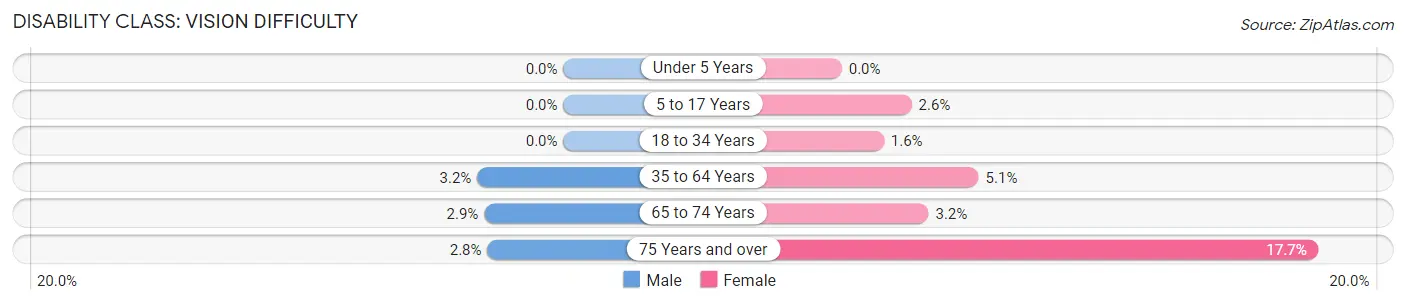
| Age Bracket | Male | Female |
| Under 5 Years | 0 (0.0%) | 0 (0.0%) |
| 5 to 17 Years | 0 (0.0%) | 22 (2.6%) |
| 18 to 34 Years | 0 (0.0%) | 14 (1.6%) |
| 35 to 64 Years | 83 (3.2%) | 179 (5.1%) |
| 65 to 74 Years | 16 (2.9%) | 48 (3.2%) |
| 75 Years and over | 10 (2.8%) | 151 (17.7%) |
Disability Class: Cognitive Difficulty
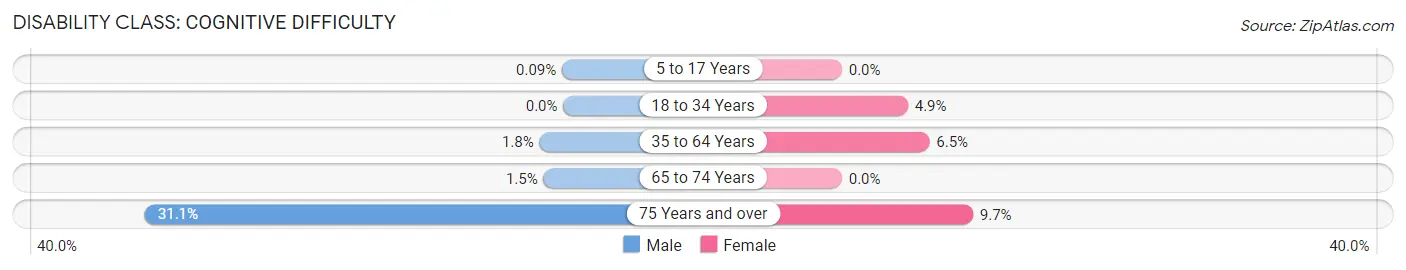
| Age Bracket | Male | Female |
| 5 to 17 Years | 1 (0.1%) | 0 (0.0%) |
| 18 to 34 Years | 0 (0.0%) | 44 (4.9%) |
| 35 to 64 Years | 46 (1.8%) | 229 (6.5%) |
| 65 to 74 Years | 8 (1.5%) | 0 (0.0%) |
| 75 Years and over | 110 (31.1%) | 83 (9.7%) |
Disability Class: Ambulatory Difficulty
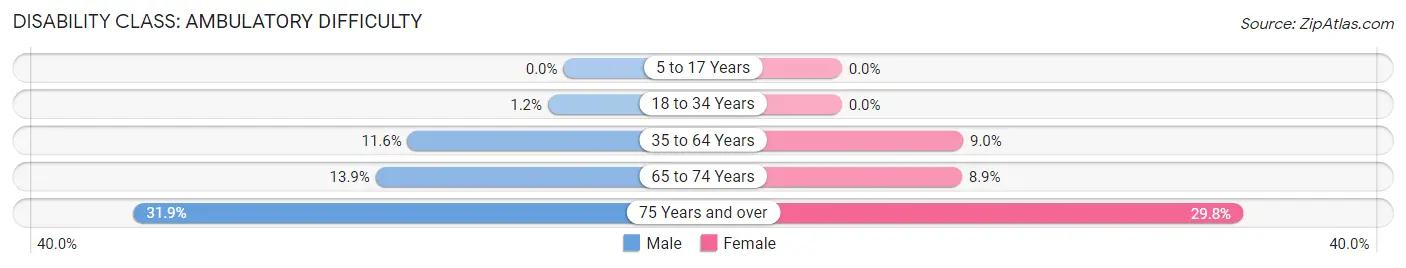
| Age Bracket | Male | Female |
| 5 to 17 Years | 0 (0.0%) | 0 (0.0%) |
| 18 to 34 Years | 13 (1.1%) | 0 (0.0%) |
| 35 to 64 Years | 300 (11.6%) | 317 (9.0%) |
| 65 to 74 Years | 76 (13.9%) | 133 (8.9%) |
| 75 Years and over | 113 (31.9%) | 254 (29.8%) |
Disability Class: Self-Care Difficulty
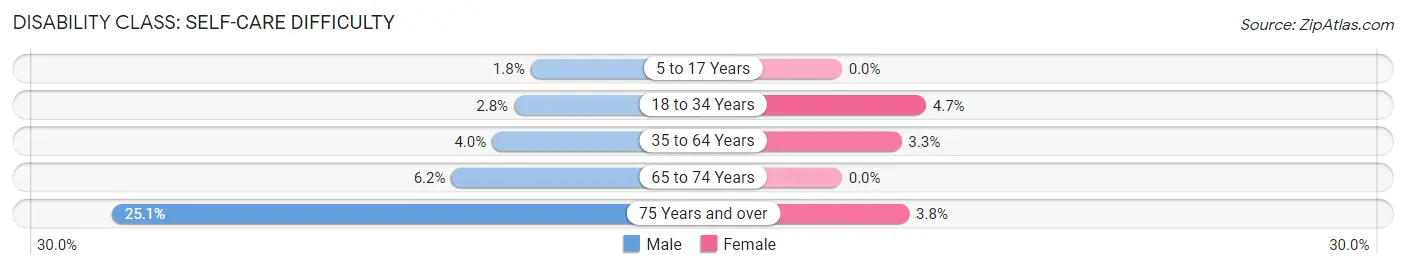
| Age Bracket | Male | Female |
| 5 to 17 Years | 21 (1.8%) | 0 (0.0%) |
| 18 to 34 Years | 31 (2.8%) | 42 (4.7%) |
| 35 to 64 Years | 103 (4.0%) | 117 (3.3%) |
| 65 to 74 Years | 34 (6.2%) | 0 (0.0%) |
| 75 Years and over | 89 (25.1%) | 32 (3.7%) |
Technology Access in Kettering
Computing Device Access in Kettering
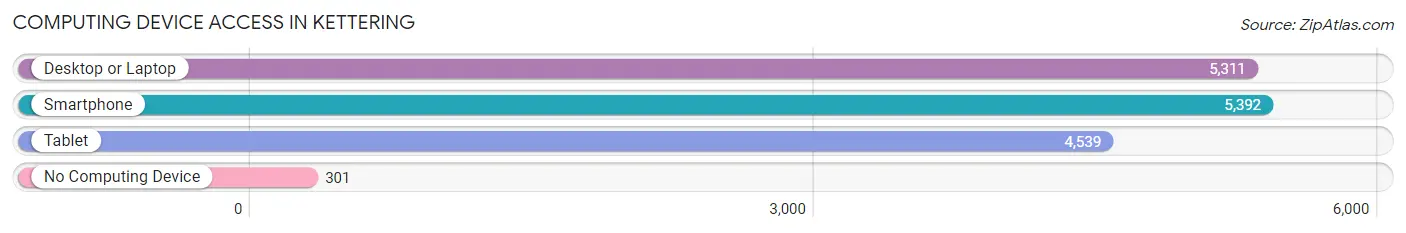
| Device Type | # Households | % Households |
| Desktop or Laptop | 5,311 | 89.5% |
| Smartphone | 5,392 | 90.8% |
| Tablet | 4,539 | 76.4% |
| No Computing Device | 301 | 5.1% |
| Total | 5,937 | 100.0% |
Internet Access in Kettering
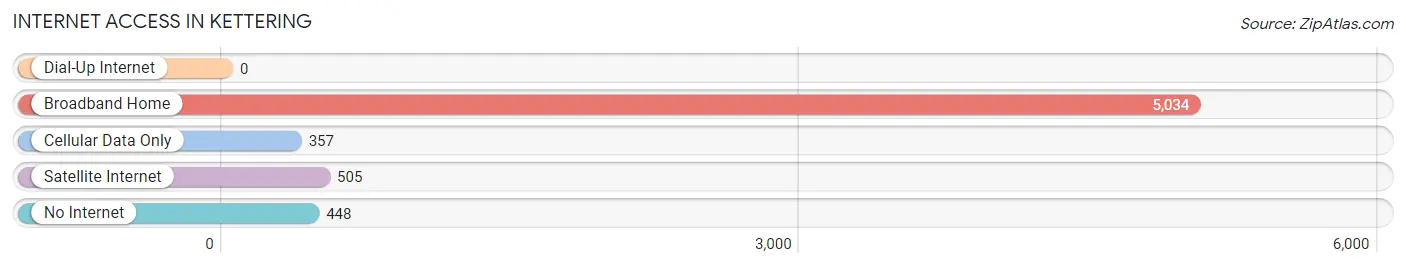
| Internet Type | # Households | % Households |
| Dial-Up Internet | 0 | 0.0% |
| Broadband Home | 5,034 | 84.8% |
| Cellular Data Only | 357 | 6.0% |
| Satellite Internet | 505 | 8.5% |
| No Internet | 448 | 7.5% |
| Total | 5,937 | 100.0% |
Kettering Summary
Kettering is a census-designated place (CDP) located in Prince George's County, Maryland, United States. The population was 8,945 at the 2010 census.
Geography
Kettering is located at 38°51'45" North, 76°53'45" West (38.8624, -76.8958). According to the United States Census Bureau, the CDP has a total area of 4.2 square miles (10.8 km2), all of it land.
History
Kettering was first settled in the late 1700s by the Kettering family, who owned a large tract of land in the area. The family built a large house on the property, which is still standing today. The area was known as Kettering's Corner until the early 1900s, when it was renamed Kettering.
In the early 1900s, the area was mostly farmland, with a few small businesses. In the 1950s, the area began to develop rapidly, with the construction of new homes and businesses. The population of Kettering grew steadily throughout the 20th century, reaching 8,945 in 2010.
Economy
Kettering is primarily a residential community, with a few small businesses. The largest employers in the area are the Prince George's County Public Schools, the University of Maryland Medical Center, and the Prince George's County Government.
Demographics
As of the 2010 census, there were 8,945 people, 3,093 households, and 2,092 families residing in the CDP. The population density was 2,133.3 people per square mile (822.7/km2). There were 3,309 housing units at an average density of 790.2 per square mile (305.3/km2). The racial makeup of the CDP was 33.2% White, 57.2% African American, 0.3% Native American, 3.2% Asian, 0.1% Pacific Islander, 3.2% from other races, and 2.9% from two or more races. Hispanic or Latino of any race were 6.7% of the population.
There were 3,093 households, out of which 33.2% had children under the age of 18 living with them, 43.2% were married couples living together, 17.7% had a female householder with no husband present, and 32.2% were non-families. 24.7% of all households were made up of individuals, and 6.2% had someone living alone who was 65 years of age or older. The average household size was 2.90 and the average family size was 3.45.
In the CDP, the population was spread out, with 25.7% under the age of 18, 8.7% from 18 to 24, 33.2% from 25 to 44, 22.7% from 45 to 64, and 9.7% who were 65 years of age or older. The median age was 34 years. For every 100 females, there were 91.2 males. For every 100 females age 18 and over, there were 87.3 males.
The median income for a household in the CDP was $60,938, and the median income for a family was $68,958. Males had a median income of $41,919 versus $37,917 for females. The per capita income for the CDP was $25,845. About 4.2% of families and 6.2% of the population were below the poverty line, including 8.2% of those under age 18 and 4.2% of those age 65 or over.
Common Questions
What is Per Capita Income in Kettering?
Per Capita income in Kettering is $57,257.
What is the Median Family Income in Kettering?
Median Family Income in Kettering is $130,775.
What is the Median Household income in Kettering?
Median Household Income in Kettering is $107,703.
What is Income or Wage Gap in Kettering?
Income or Wage Gap in Kettering is 12.4%.
Women in Kettering earn 87.6 cents for every dollar earned by a man.
What is Inequality or Gini Index in Kettering?
Inequality or Gini Index in Kettering is 0.38.
What is the Total Population of Kettering?
Total Population of Kettering is 13,873.
What is the Total Male Population of Kettering?
Total Male Population of Kettering is 6,010.
What is the Total Female Population of Kettering?
Total Female Population of Kettering is 7,863.
What is the Ratio of Males per 100 Females in Kettering?
There are 76.43 Males per 100 Females in Kettering.
What is the Ratio of Females per 100 Males in Kettering?
There are 130.83 Females per 100 Males in Kettering.
What is the Median Population Age in Kettering?
Median Population Age in Kettering is 49.7 Years.
What is the Average Family Size in Kettering
Average Family Size in Kettering is 3.3 People.
What is the Average Household Size in Kettering
Average Household Size in Kettering is 2.3 People.
How Large is the Labor Force in Kettering?
There are 7,346 People in the Labor Forcein in Kettering.
What is the Percentage of People in the Labor Force in Kettering?
62.1% of People are in the Labor Force in Kettering.
What is the Unemployment Rate in Kettering?
Unemployment Rate in Kettering is 6.6%.