Luke, MD Map & Demographics
Luke Map
Luke Overview
$23,507
PER CAPITA INCOME
$63,125
AVG HOUSEHOLD INCOME
0.31
INEQUALITY / GINI INDEX
94
TOTAL POPULATION
48
MALE POPULATION
46
FEMALE POPULATION
104.35
MALES / 100 FEMALES
95.83
FEMALES / 100 MALES
33.3
MEDIAN AGE
3.1
AVG FAMILY SIZE
2.9
AVG HOUSEHOLD SIZE
45
LABOR FORCE [ PEOPLE ]
58.4%
PERCENT IN LABOR FORCE
6.7%
UNEMPLOYMENT RATE
Luke Zip Codes
Luke Area Codes
Income in Luke
Income Overview in Luke
| Characteristic | Number | Measure |
| Per Capita Income | 94 | $23,507 |
| Median Family Income | 25 | $0 |
| Mean Family Income | 25 | $64,080 |
| Median Household Income | 31 | $63,125 |
| Mean Household Income | 31 | $67,668 |
| Income Deficit | 25 | $0 |
| Wage / Income Gap (%) | 94 | 0.00% |
| Wage / Income Gap ($) | 94 | 100.00¢ per $1 |
| Gini / Inequality Index | 94 | 0.31 |
Earnings by Sex in Luke
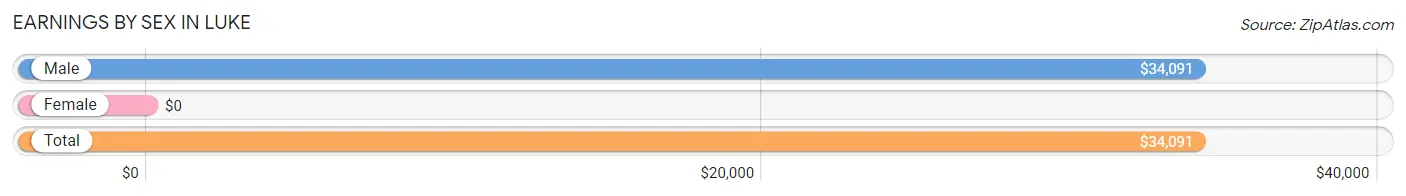
| Sex | Number | Average Earnings |
| Male | 26 (52.0%) | $34,091 |
| Female | 24 (48.0%) | $0 |
| Total | 50 (100.0%) | $34,091 |
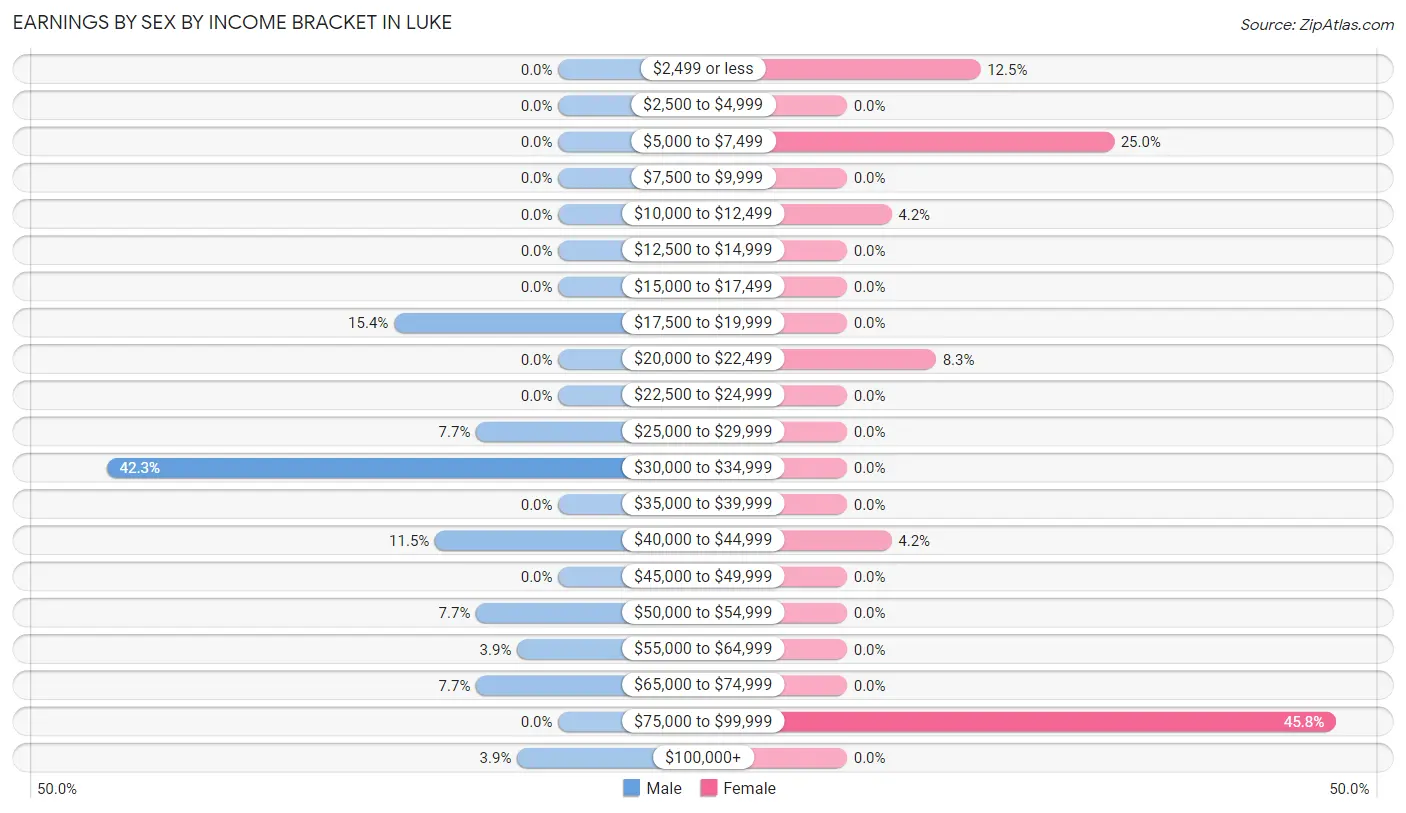
Earnings by Sex by Income Bracket in Luke
The most common earnings brackets in Luke are $30,000 to $34,999 for men (11 | 42.3%) and $75,000 to $99,999 for women (11 | 45.8%).
| Income | Male | Female |
| $2,499 or less | 0 (0.0%) | 3 (12.5%) |
| $2,500 to $4,999 | 0 (0.0%) | 0 (0.0%) |
| $5,000 to $7,499 | 0 (0.0%) | 6 (25.0%) |
| $7,500 to $9,999 | 0 (0.0%) | 0 (0.0%) |
| $10,000 to $12,499 | 0 (0.0%) | 1 (4.2%) |
| $12,500 to $14,999 | 0 (0.0%) | 0 (0.0%) |
| $15,000 to $17,499 | 0 (0.0%) | 0 (0.0%) |
| $17,500 to $19,999 | 4 (15.4%) | 0 (0.0%) |
| $20,000 to $22,499 | 0 (0.0%) | 2 (8.3%) |
| $22,500 to $24,999 | 0 (0.0%) | 0 (0.0%) |
| $25,000 to $29,999 | 2 (7.7%) | 0 (0.0%) |
| $30,000 to $34,999 | 11 (42.3%) | 0 (0.0%) |
| $35,000 to $39,999 | 0 (0.0%) | 0 (0.0%) |
| $40,000 to $44,999 | 3 (11.5%) | 1 (4.2%) |
| $45,000 to $49,999 | 0 (0.0%) | 0 (0.0%) |
| $50,000 to $54,999 | 2 (7.7%) | 0 (0.0%) |
| $55,000 to $64,999 | 1 (3.8%) | 0 (0.0%) |
| $65,000 to $74,999 | 2 (7.7%) | 0 (0.0%) |
| $75,000 to $99,999 | 0 (0.0%) | 11 (45.8%) |
| $100,000+ | 1 (3.8%) | 0 (0.0%) |
| Total | 26 (100.0%) | 24 (100.0%) |
Earnings by Sex by Educational Attainment in Luke
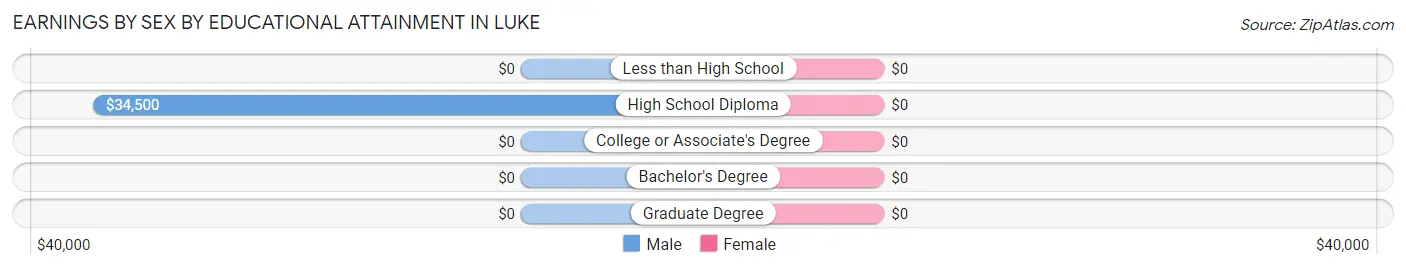
| Educational Attainment | Male Income | Female Income |
| Less than High School | - | - |
| High School Diploma | $34,500 | $0 |
| College or Associate's Degree | - | - |
| Bachelor's Degree | - | - |
| Graduate Degree | - | - |
| Total | $34,318 | $0 |
Family Income in Luke
Family Income Brackets in Luke
According to the Luke family income data, there are 9 families falling into the $100,000 to $149,999 income range, which is the most common income bracket and makes up 36.0% of all families.
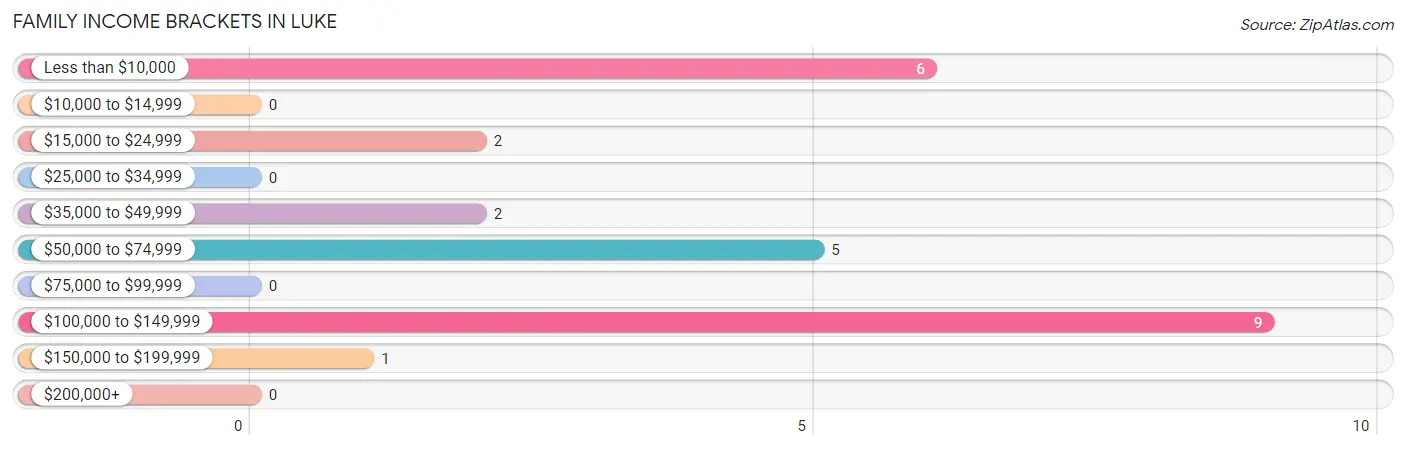
| Income Bracket | # Families | % Families |
| Less than $10,000 | 6 | 24.0% |
| $10,000 to $14,999 | 0 | 0.0% |
| $15,000 to $24,999 | 2 | 8.0% |
| $25,000 to $34,999 | 0 | 0.0% |
| $35,000 to $49,999 | 2 | 8.0% |
| $50,000 to $74,999 | 5 | 20.0% |
| $75,000 to $99,999 | 0 | 0.0% |
| $100,000 to $149,999 | 9 | 36.0% |
| $150,000 to $199,999 | 1 | 4.0% |
| $200,000+ | 0 | 0.0% |
Family Income by Famaliy Size in Luke
| Income Bracket | # Families | Median Income |
| 2-Person Families | 7 (28.0%) | $0 |
| 3-Person Families | 7 (28.0%) | $0 |
| 4-Person Families | 11 (44.0%) | $0 |
| 5-Person Families | 0 (0.0%) | $0 |
| 6-Person Families | 0 (0.0%) | $0 |
| 7+ Person Families | 0 (0.0%) | $0 |
| Total | 25 (100.0%) | $0 |
Family Income by Number of Earners in Luke
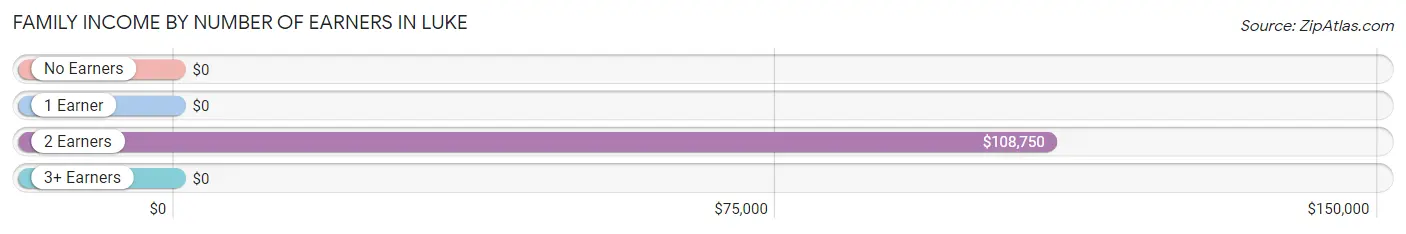
| Number of Earners | # Families | Median Income |
| No Earners | 2 (8.0%) | $0 |
| 1 Earner | 10 (40.0%) | $0 |
| 2 Earners | 11 (44.0%) | $108,750 |
| 3+ Earners | 2 (8.0%) | $0 |
| Total | 25 (100.0%) | $0 |
Household Income in Luke
Household Income Brackets in Luke
With 9 households falling in the category, the $100,000 to $149,999 income range is the most frequent in Luke, accounting for 29.0% of all households.
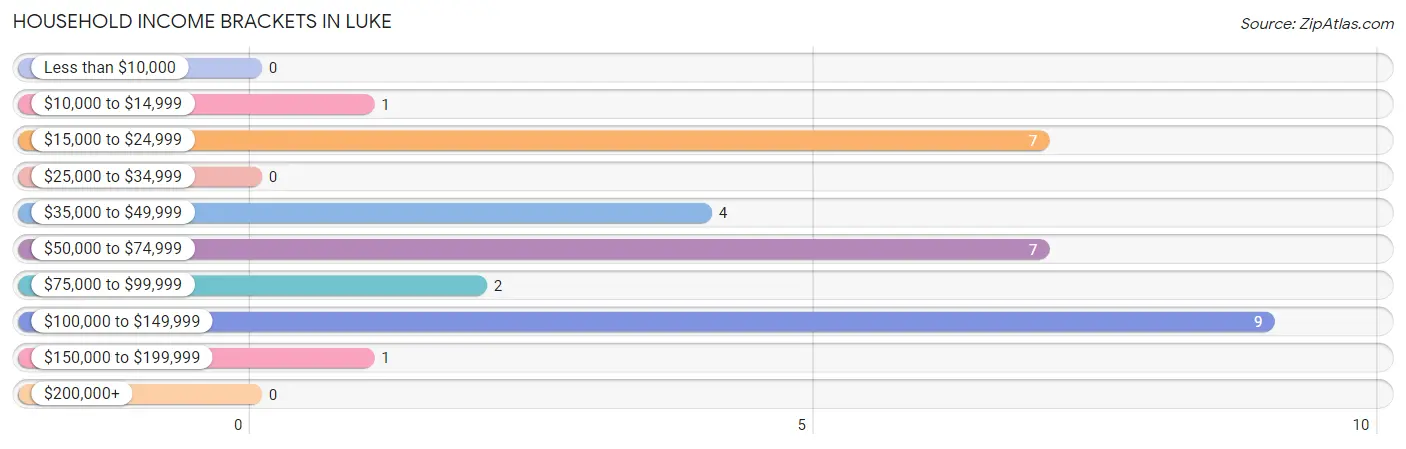
| Income Bracket | # Households | % Households |
| Less than $10,000 | 0 | 0.0% |
| $10,000 to $14,999 | 1 | 3.2% |
| $15,000 to $24,999 | 7 | 22.6% |
| $25,000 to $34,999 | 0 | 0.0% |
| $35,000 to $49,999 | 4 | 12.9% |
| $50,000 to $74,999 | 7 | 22.6% |
| $75,000 to $99,999 | 2 | 6.5% |
| $100,000 to $149,999 | 9 | 29.0% |
| $150,000 to $199,999 | 1 | 3.2% |
| $200,000+ | 0 | 0.0% |
Household Income by Householder Age in Luke
The median household income in Luke is $63,125, with the highest median household income of $108,056 found in the 45 to 64 years age bracket for the primary householder. A total of 16 households (51.6%) fall into this category.
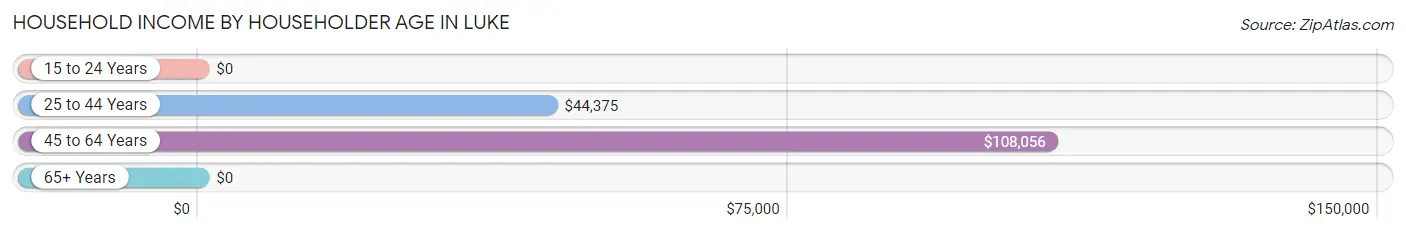
| Income Bracket | # Households | Median Income |
| 15 to 24 Years | 0 (0.0%) | $0 |
| 25 to 44 Years | 11 (35.5%) | $44,375 |
| 45 to 64 Years | 16 (51.6%) | $108,056 |
| 65+ Years | 4 (12.9%) | $0 |
| Total | 31 (100.0%) | $63,125 |
Poverty in Luke
Income Below Poverty by Sex and Age in Luke
With 8.3% poverty level for males and 30.4% for females among the residents of Luke, 6 to 11 year old males and under 5 year old females are the most vulnerable to poverty, with 4 males (100.0%) and 2 females (100.0%) in their respective age groups living below the poverty level.
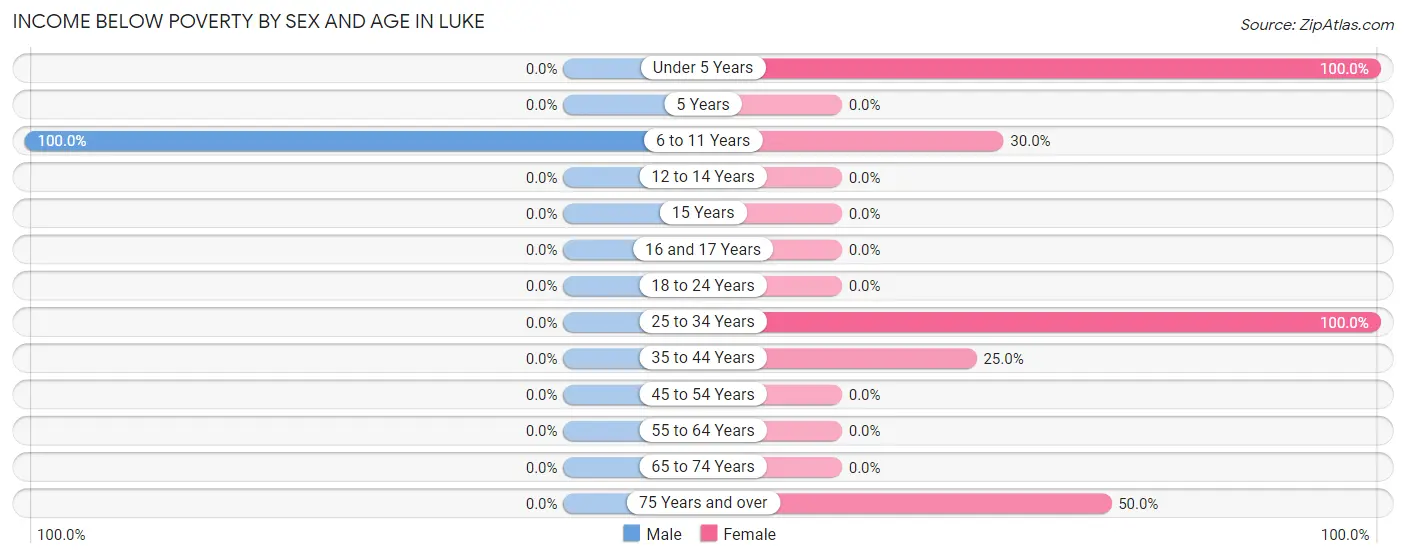
| Age Bracket | Male | Female |
| Under 5 Years | 0 (0.0%) | 2 (100.0%) |
| 5 Years | 0 (0.0%) | 0 (0.0%) |
| 6 to 11 Years | 4 (100.0%) | 3 (30.0%) |
| 12 to 14 Years | 0 (0.0%) | 0 (0.0%) |
| 15 Years | 0 (0.0%) | 0 (0.0%) |
| 16 and 17 Years | 0 (0.0%) | 0 (0.0%) |
| 18 to 24 Years | 0 (0.0%) | 0 (0.0%) |
| 25 to 34 Years | 0 (0.0%) | 7 (100.0%) |
| 35 to 44 Years | 0 (0.0%) | 1 (25.0%) |
| 45 to 54 Years | 0 (0.0%) | 0 (0.0%) |
| 55 to 64 Years | 0 (0.0%) | 0 (0.0%) |
| 65 to 74 Years | 0 (0.0%) | 0 (0.0%) |
| 75 Years and over | 0 (0.0%) | 1 (50.0%) |
| Total | 4 (8.3%) | 14 (30.4%) |
Income Above Poverty by Sex and Age in Luke
According to the poverty statistics in Luke, males aged 16 and 17 years and females aged 12 to 14 years are the age groups that are most secure financially, with 100.0% of males and 100.0% of females in these age groups living above the poverty line.
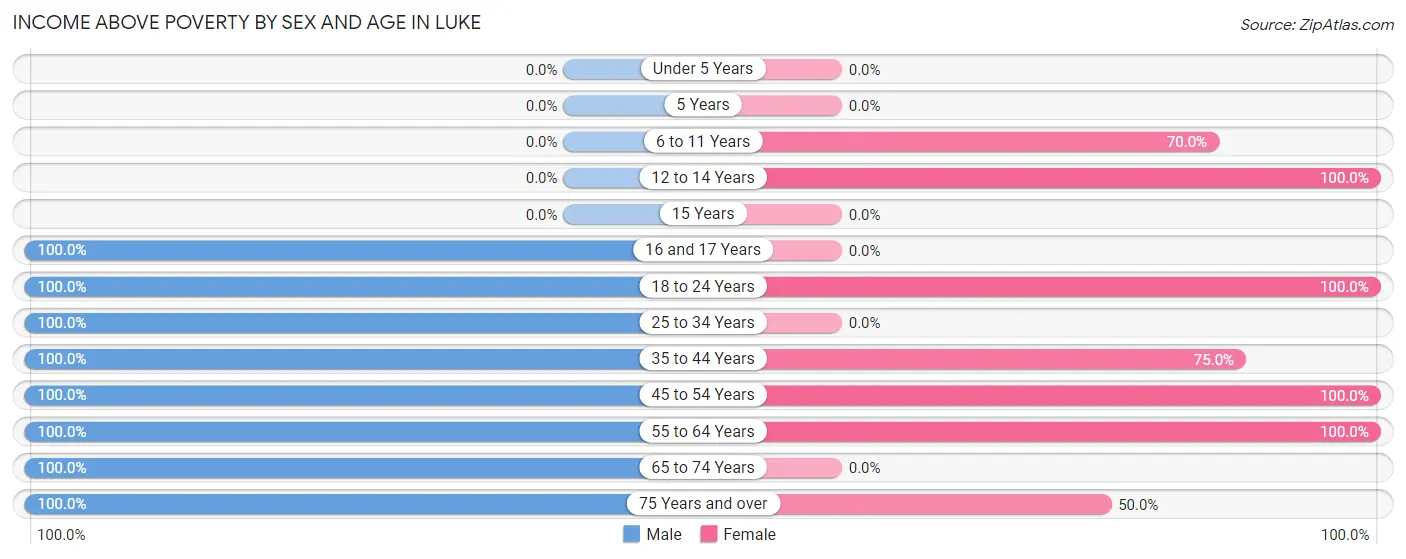
| Age Bracket | Male | Female |
| Under 5 Years | 0 (0.0%) | 0 (0.0%) |
| 5 Years | 0 (0.0%) | 0 (0.0%) |
| 6 to 11 Years | 0 (0.0%) | 7 (70.0%) |
| 12 to 14 Years | 0 (0.0%) | 1 (100.0%) |
| 15 Years | 0 (0.0%) | 0 (0.0%) |
| 16 and 17 Years | 14 (100.0%) | 0 (0.0%) |
| 18 to 24 Years | 2 (100.0%) | 3 (100.0%) |
| 25 to 34 Years | 7 (100.0%) | 0 (0.0%) |
| 35 to 44 Years | 4 (100.0%) | 3 (75.0%) |
| 45 to 54 Years | 13 (100.0%) | 12 (100.0%) |
| 55 to 64 Years | 1 (100.0%) | 5 (100.0%) |
| 65 to 74 Years | 2 (100.0%) | 0 (0.0%) |
| 75 Years and over | 1 (100.0%) | 1 (50.0%) |
| Total | 44 (91.7%) | 32 (69.6%) |
Income Below Poverty Among Married-Couple Families in Luke
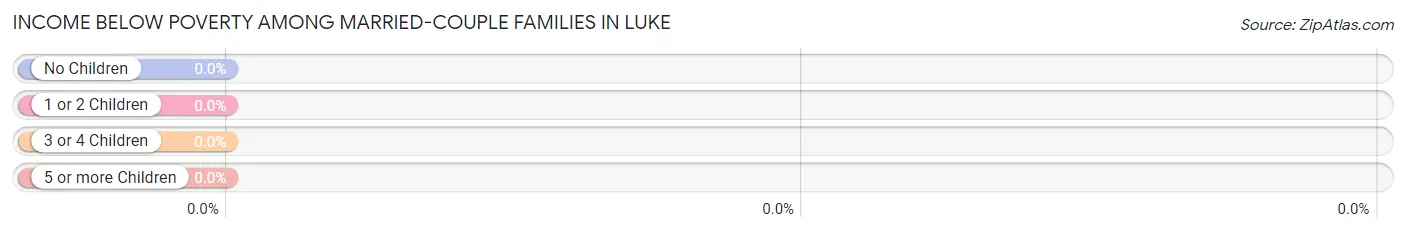
| Children | Above Poverty | Below Poverty |
| No Children | 7 (100.0%) | 0 (0.0%) |
| 1 or 2 Children | 10 (100.0%) | 0 (0.0%) |
| 3 or 4 Children | 0 (0.0%) | 0 (0.0%) |
| 5 or more Children | 0 (0.0%) | 0 (0.0%) |
| Total | 17 (100.0%) | 0 (0.0%) |
Income Below Poverty Among Single-Parent Households in Luke
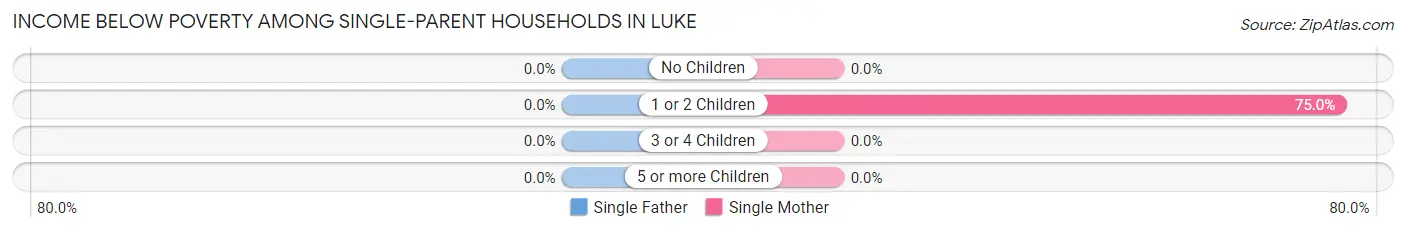
| Children | Single Father | Single Mother |
| No Children | 0 (0.0%) | 0 (0.0%) |
| 1 or 2 Children | 0 (0.0%) | 6 (75.0%) |
| 3 or 4 Children | 0 (0.0%) | 0 (0.0%) |
| 5 or more Children | 0 (0.0%) | 0 (0.0%) |
| Total | 0 (0.0%) | 6 (75.0%) |
Income Below Poverty Among Married-Couple vs Single-Parent Households in Luke
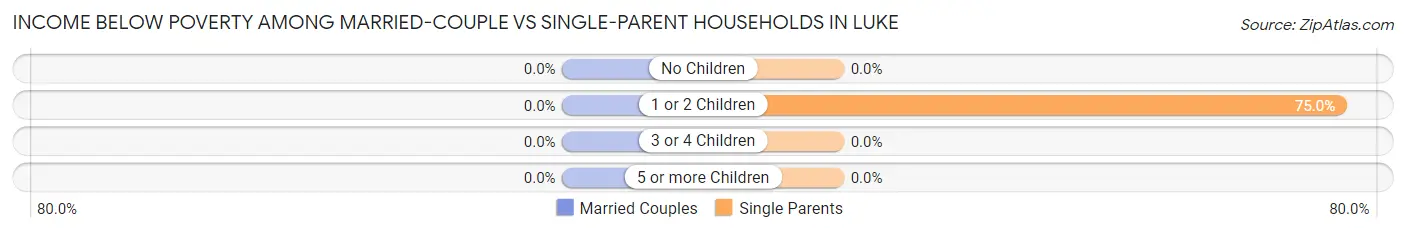
| Children | Married-Couple Families | Single-Parent Households |
| No Children | 0 (0.0%) | 0 (0.0%) |
| 1 or 2 Children | 0 (0.0%) | 6 (75.0%) |
| 3 or 4 Children | 0 (0.0%) | 0 (0.0%) |
| 5 or more Children | 0 (0.0%) | 0 (0.0%) |
| Total | 0 (0.0%) | 6 (75.0%) |
Race in Luke
The most populous races in Luke are White / Caucasian (92 | 97.9%), Black / African American (1 | 1.1%), and Hispanic or Latino (1 | 1.1%).
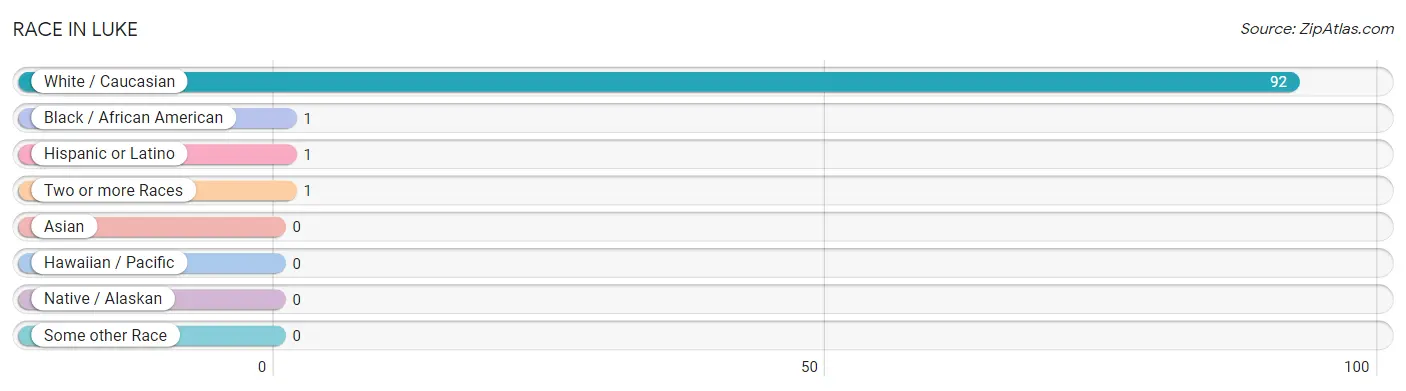
| Race | # Population | % Population |
| Asian | 0 | 0.0% |
| Black / African American | 1 | 1.1% |
| Hawaiian / Pacific | 0 | 0.0% |
| Hispanic or Latino | 1 | 1.1% |
| Native / Alaskan | 0 | 0.0% |
| White / Caucasian | 92 | 97.9% |
| Two or more Races | 1 | 1.1% |
| Some other Race | 0 | 0.0% |
| Total | 94 | 100.0% |
Ancestry in Luke
The most populous ancestries reported in Luke are American (14 | 14.9%), Irish (3 | 3.2%), German (2 | 2.1%), Italian (2 | 2.1%), and Polish (2 | 2.1%), together accounting for 24.5% of all Luke residents.
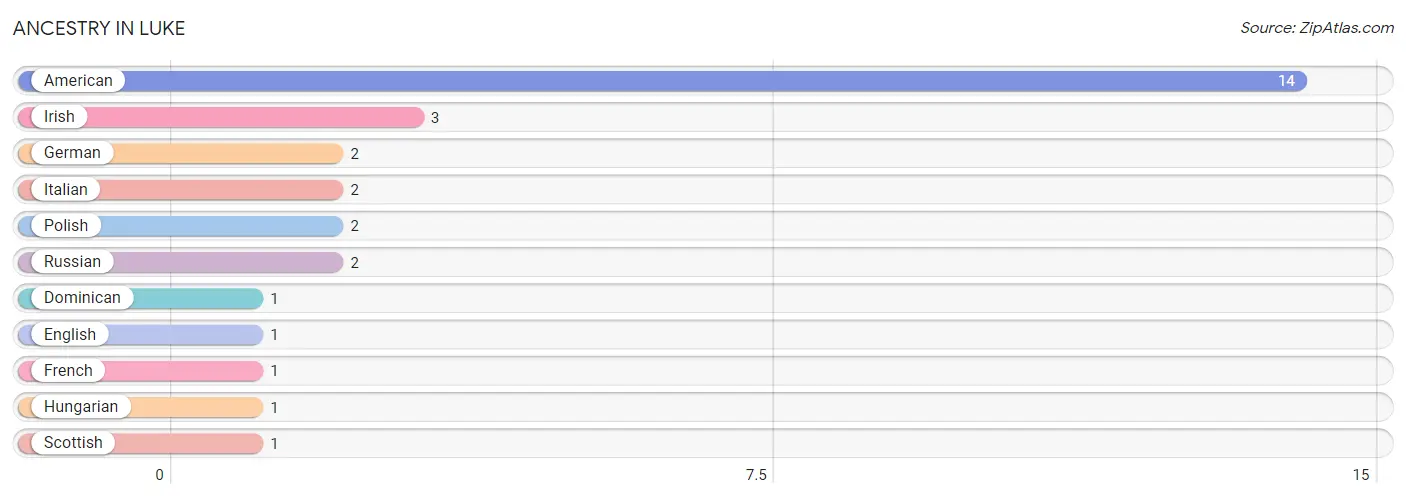
| Ancestry | # Population | % Population |
| American | 14 | 14.9% |
| Dominican | 1 | 1.1% |
| English | 1 | 1.1% |
| French | 1 | 1.1% |
| German | 2 | 2.1% |
| Hungarian | 1 | 1.1% |
| Irish | 3 | 3.2% |
| Italian | 2 | 2.1% |
| Polish | 2 | 2.1% |
| Russian | 2 | 2.1% |
| Scottish | 1 | 1.1% | View All 11 Rows |
Immigrants in Luke

| Immigration Origin | # Population | % Population | View All 0 Rows |
Sex and Age in Luke
Sex and Age in Luke
The most populous age groups in Luke are 15 to 19 Years (14 | 29.2%) for men and 45 to 49 Years (11 | 23.9%) for women.
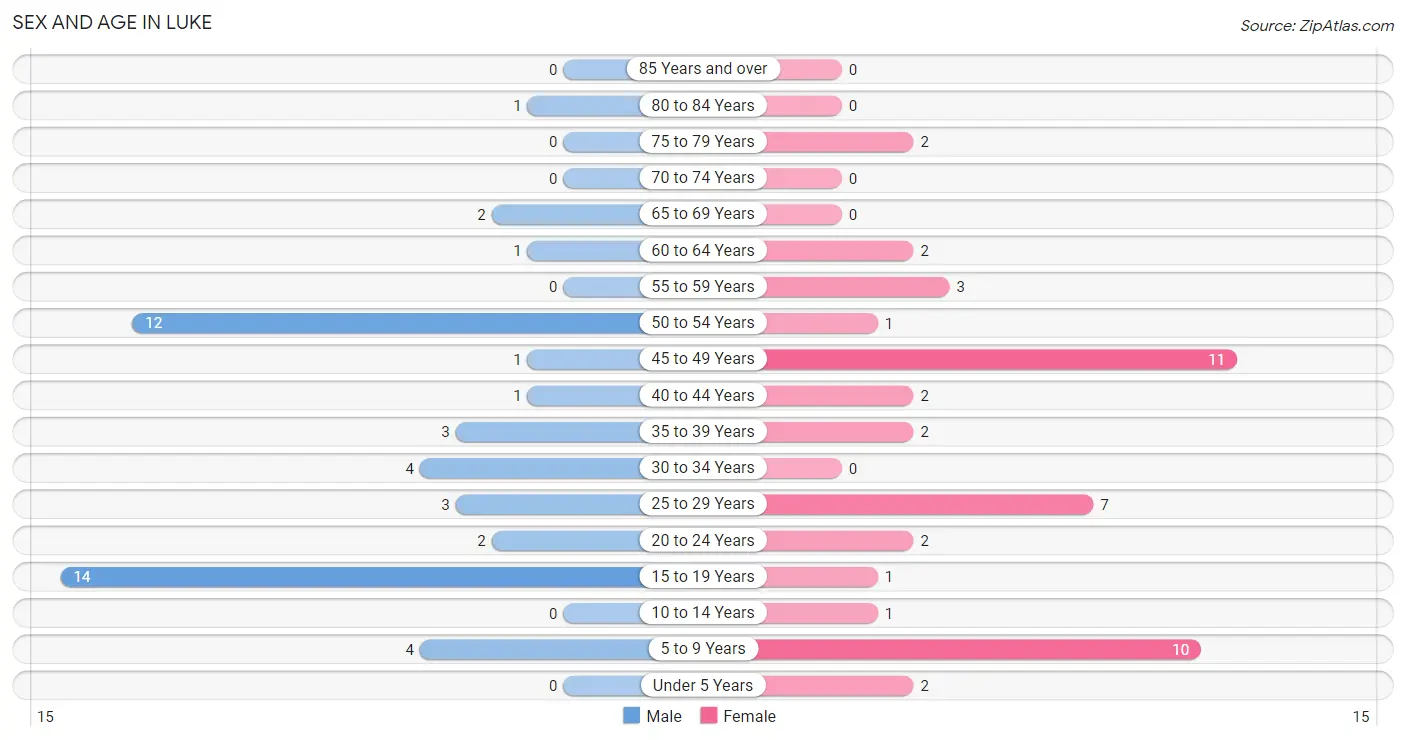
| Age Bracket | Male | Female |
| Under 5 Years | 0 (0.0%) | 2 (4.3%) |
| 5 to 9 Years | 4 (8.3%) | 10 (21.7%) |
| 10 to 14 Years | 0 (0.0%) | 1 (2.2%) |
| 15 to 19 Years | 14 (29.2%) | 1 (2.2%) |
| 20 to 24 Years | 2 (4.2%) | 2 (4.3%) |
| 25 to 29 Years | 3 (6.2%) | 7 (15.2%) |
| 30 to 34 Years | 4 (8.3%) | 0 (0.0%) |
| 35 to 39 Years | 3 (6.2%) | 2 (4.3%) |
| 40 to 44 Years | 1 (2.1%) | 2 (4.3%) |
| 45 to 49 Years | 1 (2.1%) | 11 (23.9%) |
| 50 to 54 Years | 12 (25.0%) | 1 (2.2%) |
| 55 to 59 Years | 0 (0.0%) | 3 (6.5%) |
| 60 to 64 Years | 1 (2.1%) | 2 (4.3%) |
| 65 to 69 Years | 2 (4.2%) | 0 (0.0%) |
| 70 to 74 Years | 0 (0.0%) | 0 (0.0%) |
| 75 to 79 Years | 0 (0.0%) | 2 (4.3%) |
| 80 to 84 Years | 1 (2.1%) | 0 (0.0%) |
| 85 Years and over | 0 (0.0%) | 0 (0.0%) |
| Total | 48 (100.0%) | 46 (100.0%) |
Families and Households in Luke
Median Family Size in Luke
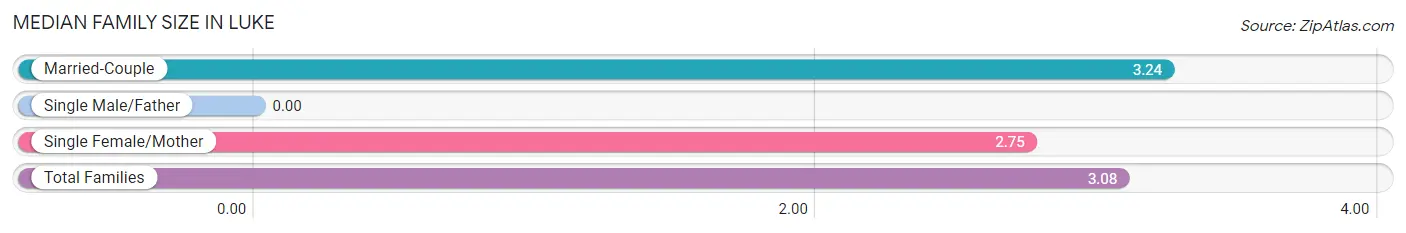
| Family Type | # Families | Family Size |
| Married-Couple | 17 (68.0%) | 3.24 |
| Single Male/Father | 0 (0.0%) | - |
| Single Female/Mother | 8 (32.0%) | 2.75 |
| Total Families | 25 (100.0%) | 3.08 |
Median Household Size in Luke
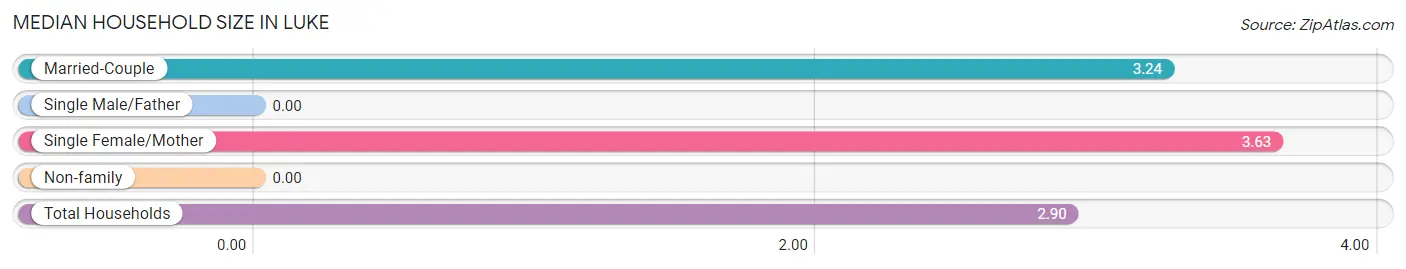
| Household Type | # Households | Household Size |
| Married-Couple | 17 (54.8%) | 3.24 |
| Single Male/Father | 0 (0.0%) | - |
| Single Female/Mother | 8 (25.8%) | 3.63 |
| Non-family | 6 (19.4%) | - |
| Total Households | 31 (100.0%) | 2.90 |
Household Size by Marriage Status in Luke
Out of a total of 31 households in Luke, 25 (80.6%) are family households, while 6 (19.4%) are nonfamily households. The most numerous type of family households are 4-person households, comprising 15, and the most common type of nonfamily households are 1-person households, comprising 6.
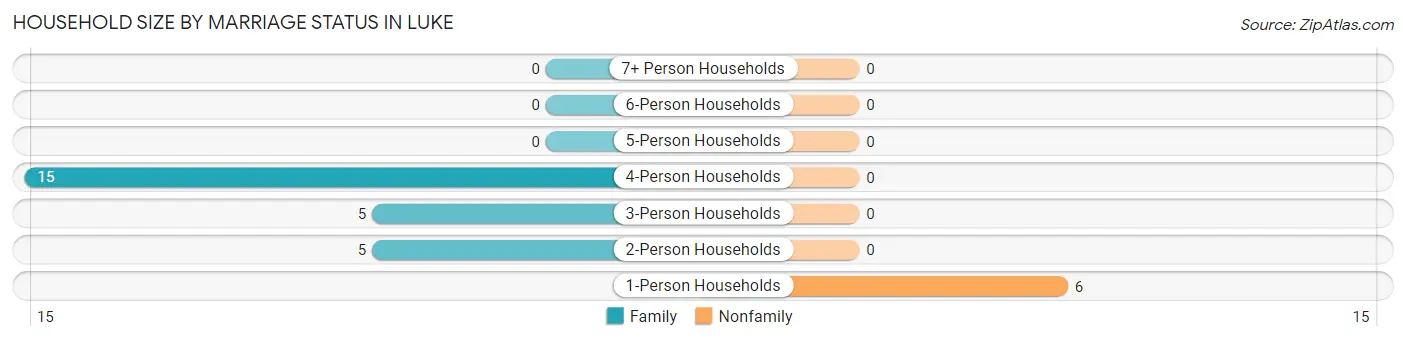
| Household Size | Family Households | Nonfamily Households |
| 1-Person Households | - | 6 (19.4%) |
| 2-Person Households | 5 (16.1%) | 0 (0.0%) |
| 3-Person Households | 5 (16.1%) | 0 (0.0%) |
| 4-Person Households | 15 (48.4%) | 0 (0.0%) |
| 5-Person Households | 0 (0.0%) | 0 (0.0%) |
| 6-Person Households | 0 (0.0%) | 0 (0.0%) |
| 7+ Person Households | 0 (0.0%) | 0 (0.0%) |
| Total | 25 (80.6%) | 6 (19.4%) |
Female Fertility in Luke
Fertility by Age in Luke
Average fertility rate in Luke is 38.0 births per 1,000 women. Women in the age bracket of 20 to 34 years have the highest fertility rate with 111.0 births per 1,000 women. Women in the age bracket of 20 to 34 years acount for 100.0% of all women with births.
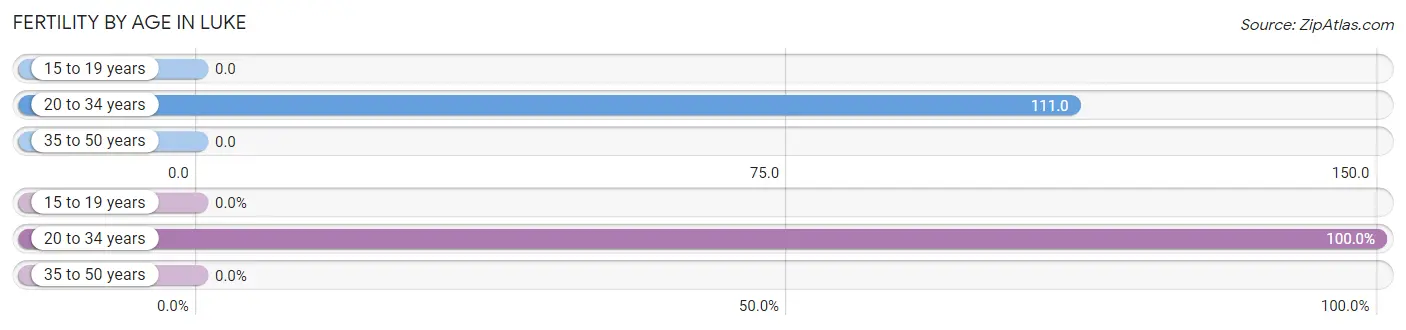
| Age Bracket | Women with Births | Births / 1,000 Women |
| 15 to 19 years | 0 (0.0%) | 0.0 |
| 20 to 34 years | 1 (100.0%) | 111.0 |
| 35 to 50 years | 0 (0.0%) | 0.0 |
| Total | 1 (100.0%) | 38.0 |
Fertility by Age by Marriage Status in Luke
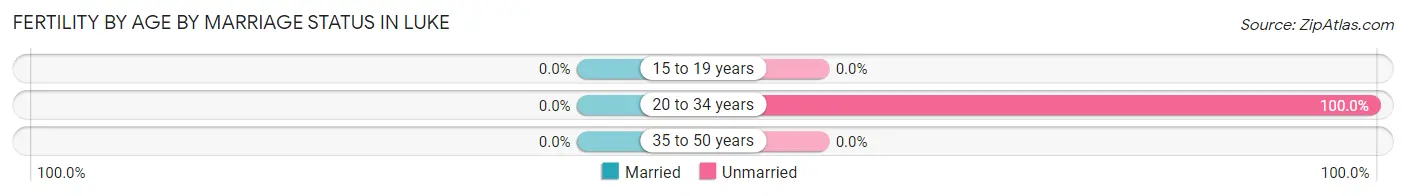
| Age Bracket | Married | Unmarried |
| 15 to 19 years | 0 (0.0%) | 0 (0.0%) |
| 20 to 34 years | 0 (0.0%) | 1 (100.0%) |
| 35 to 50 years | 0 (0.0%) | 0 (0.0%) |
| Total | 0 (0.0%) | 1 (100.0%) |
Fertility by Education in Luke
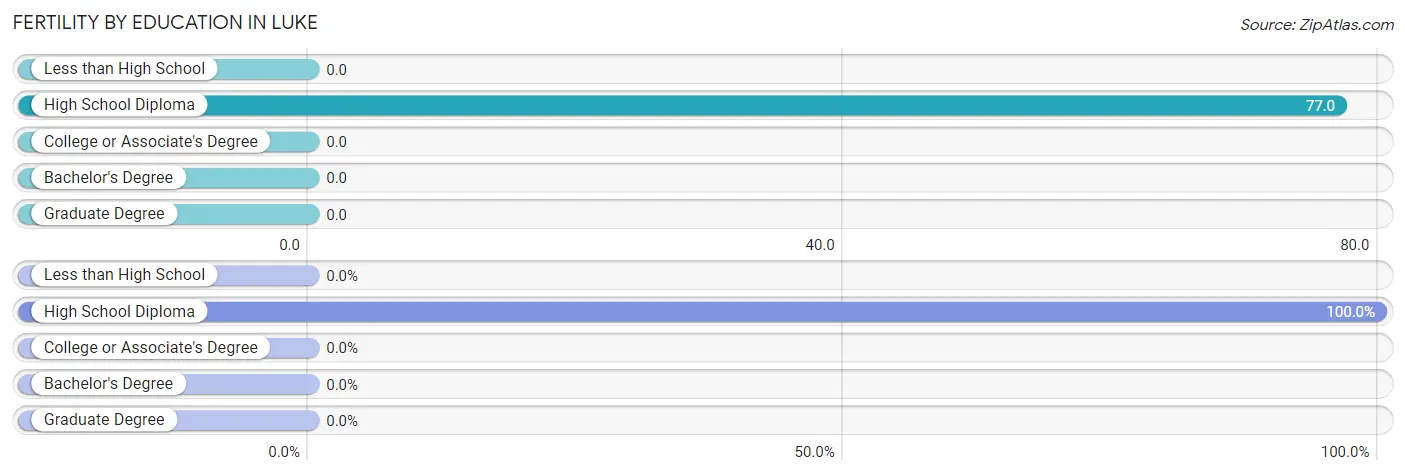
| Educational Attainment | Women with Births | Births / 1,000 Women |
| Less than High School | 0 (0.0%) | 0.0 |
| High School Diploma | 1 (100.0%) | 77.0 |
| College or Associate's Degree | 0 (0.0%) | 0.0 |
| Bachelor's Degree | 0 (0.0%) | 0.0 |
| Graduate Degree | 0 (0.0%) | 0.0 |
| Total | 1 (100.0%) | 38.0 |
Fertility by Education by Marriage Status in Luke
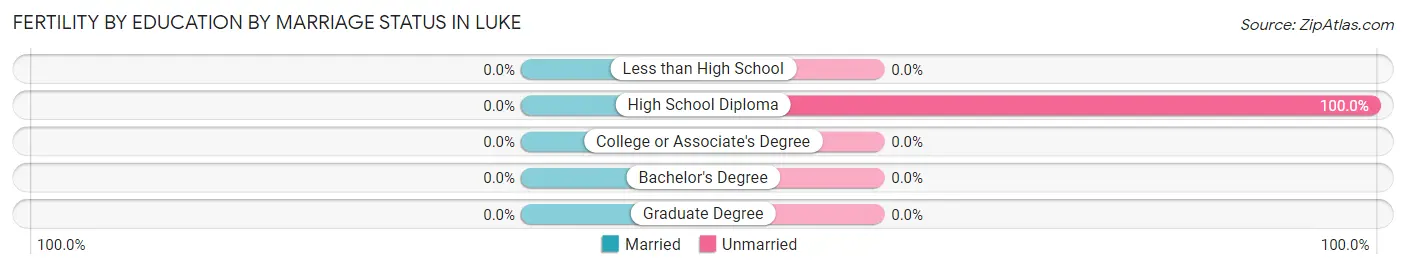
| Educational Attainment | Married | Unmarried |
| Less than High School | 0 (0.0%) | 0 (0.0%) |
| High School Diploma | 0 (0.0%) | 1 (100.0%) |
| College or Associate's Degree | 0 (0.0%) | 0 (0.0%) |
| Bachelor's Degree | 0 (0.0%) | 0 (0.0%) |
| Graduate Degree | 0 (0.0%) | 0 (0.0%) |
| Total | 0 (0.0%) | 1 (100.0%) |
Employment Characteristics in Luke
Employment by Class of Employer in Luke
Among the 38 employed individuals in Luke, private company employees (35 | 92.1%), state government employees (2 | 5.3%), and not-for-profit organizations (1 | 2.6%) make up the most common classes of employment.
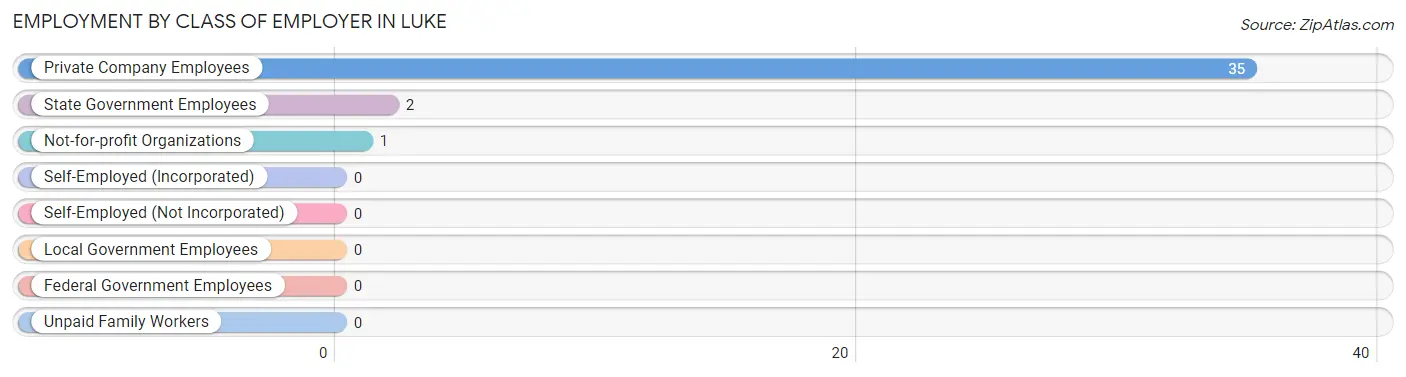
| Employer Class | # Employees | % Employees |
| Private Company Employees | 35 | 92.1% |
| Self-Employed (Incorporated) | 0 | 0.0% |
| Self-Employed (Not Incorporated) | 0 | 0.0% |
| Not-for-profit Organizations | 1 | 2.6% |
| Local Government Employees | 0 | 0.0% |
| State Government Employees | 2 | 5.3% |
| Federal Government Employees | 0 | 0.0% |
| Unpaid Family Workers | 0 | 0.0% |
| Total | 38 | 100.0% |
Employment Status by Age in Luke
According to the labor force statistics for Luke, out of the total population over 16 years of age (77), 58.4% or 45 individuals are in the labor force, with 6.7% or 3 of them unemployed. The age group with the highest labor force participation rate is 30 to 34 years, with 100.0% or 4 individuals in the labor force. Within the labor force, the 35 to 44 years age range has the highest percentage of unemployed individuals, with 28.6% or 2 of them being unemployed.
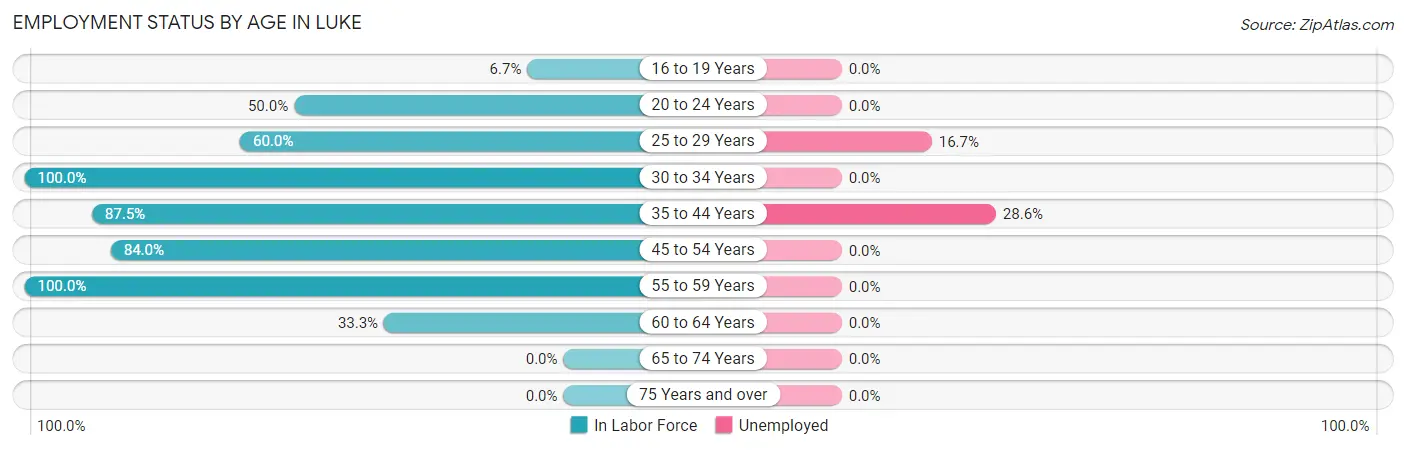
| Age Bracket | In Labor Force | Unemployed |
| 16 to 19 Years | 1 (6.7%) | 0 (0.0%) |
| 20 to 24 Years | 2 (50.0%) | 0 (0.0%) |
| 25 to 29 Years | 6 (60.0%) | 1 (16.7%) |
| 30 to 34 Years | 4 (100.0%) | 0 (0.0%) |
| 35 to 44 Years | 7 (87.5%) | 2 (28.6%) |
| 45 to 54 Years | 21 (84.0%) | 0 (0.0%) |
| 55 to 59 Years | 3 (100.0%) | 0 (0.0%) |
| 60 to 64 Years | 1 (33.3%) | 0 (0.0%) |
| 65 to 74 Years | 0 (0.0%) | 0 (0.0%) |
| 75 Years and over | 0 (0.0%) | 0 (0.0%) |
| Total | 45 (58.4%) | 3 (6.7%) |
Employment Status by Educational Attainment in Luke
According to labor force statistics for Luke, 79.2% of individuals (42) out of the total population between 25 and 64 years of age (53) are in the labor force, with 7.1% or 3 of them being unemployed. The group with the highest labor force participation rate are those with the educational attainment of bachelor's degree or higher, with 100.0% or 3 individuals in the labor force. Within the labor force, individuals with college / associate degree education have the highest percentage of unemployment, with 18.2% or 2 of them being unemployed.
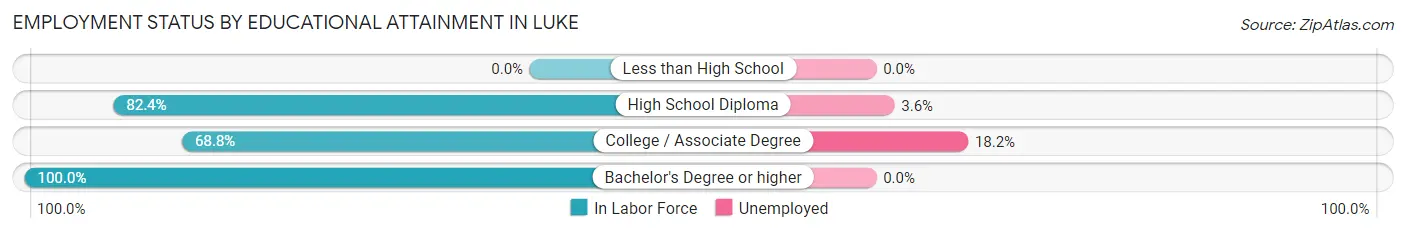
| Educational Attainment | In Labor Force | Unemployed |
| Less than High School | 0 (0.0%) | 0 (0.0%) |
| High School Diploma | 28 (82.4%) | 1 (3.6%) |
| College / Associate Degree | 11 (68.8%) | 3 (18.2%) |
| Bachelor's Degree or higher | 3 (100.0%) | 0 (0.0%) |
| Total | 42 (79.2%) | 4 (7.1%) |
Employment Occupations by Sex in Luke
Management, Business, Science and Arts Occupations
The most common Management, Business, Science and Arts occupations in Luke are Management (19 | 45.2%), Business & Financial (1 | 2.4%), Community & Social Service (1 | 2.4%), and Education, Arts & Media (1 | 2.4%).

Management, Business, Science and Arts Occupations by Sex
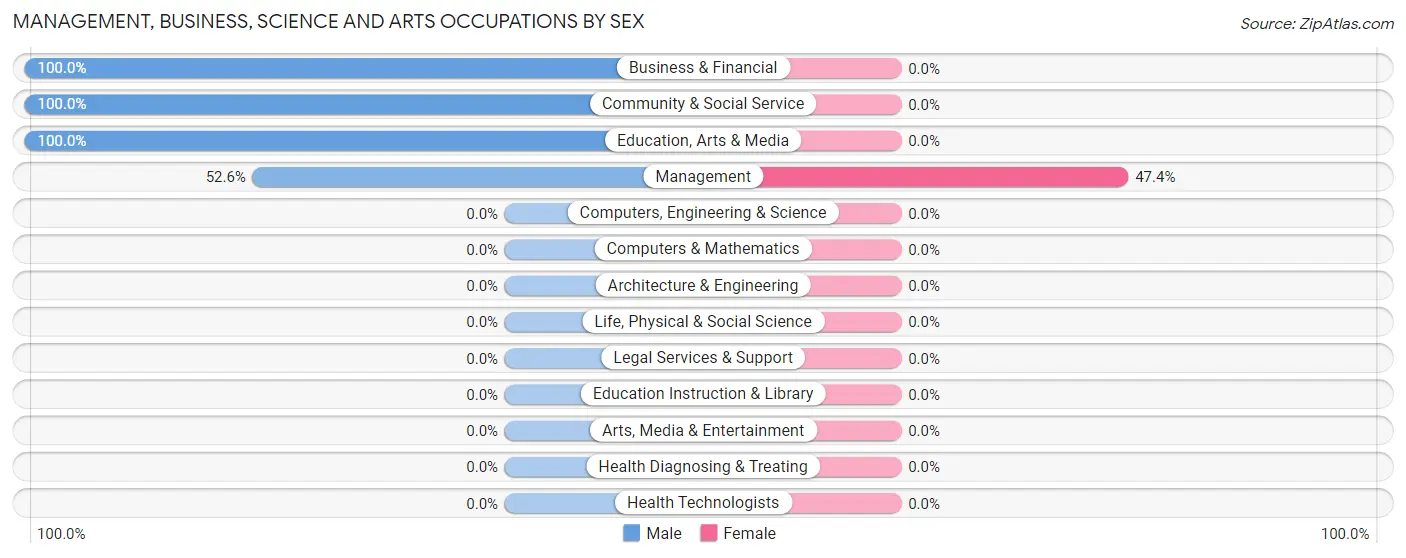
| Occupation | Male | Female |
| Management | 10 (52.6%) | 9 (47.4%) |
| Business & Financial | 1 (100.0%) | 0 (0.0%) |
| Computers, Engineering & Science | 0 (0.0%) | 0 (0.0%) |
| Computers & Mathematics | 0 (0.0%) | 0 (0.0%) |
| Architecture & Engineering | 0 (0.0%) | 0 (0.0%) |
| Life, Physical & Social Science | 0 (0.0%) | 0 (0.0%) |
| Community & Social Service | 1 (100.0%) | 0 (0.0%) |
| Education, Arts & Media | 1 (100.0%) | 0 (0.0%) |
| Legal Services & Support | 0 (0.0%) | 0 (0.0%) |
| Education Instruction & Library | 0 (0.0%) | 0 (0.0%) |
| Arts, Media & Entertainment | 0 (0.0%) | 0 (0.0%) |
| Health Diagnosing & Treating | 0 (0.0%) | 0 (0.0%) |
| Health Technologists | 0 (0.0%) | 0 (0.0%) |
| Total (Category) | 12 (57.1%) | 9 (42.9%) |
| Total (Overall) | 25 (59.5%) | 17 (40.5%) |
Services Occupations
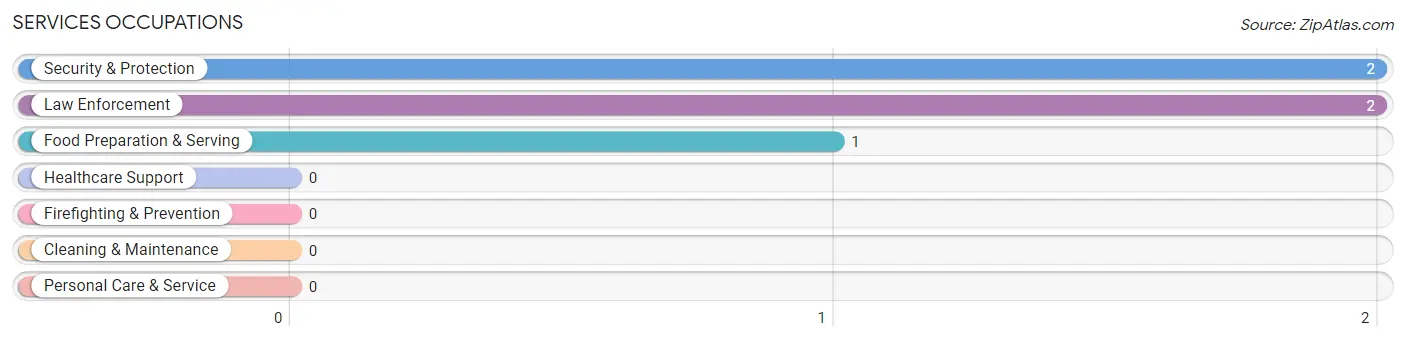
The most common Services occupations in Luke are Security & Protection (2 | 4.8%), Law Enforcement (2 | 4.8%), and Food Preparation & Serving (1 | 2.4%).
Services Occupations by Sex
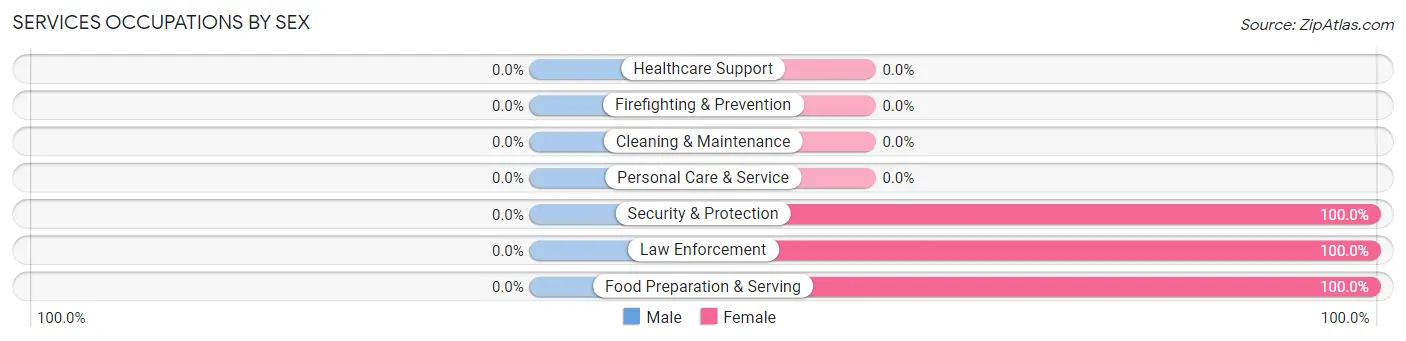
| Occupation | Male | Female |
| Healthcare Support | 0 (0.0%) | 0 (0.0%) |
| Security & Protection | 0 (0.0%) | 2 (100.0%) |
| Firefighting & Prevention | 0 (0.0%) | 0 (0.0%) |
| Law Enforcement | 0 (0.0%) | 2 (100.0%) |
| Food Preparation & Serving | 0 (0.0%) | 1 (100.0%) |
| Cleaning & Maintenance | 0 (0.0%) | 0 (0.0%) |
| Personal Care & Service | 0 (0.0%) | 0 (0.0%) |
| Total (Category) | 0 (0.0%) | 3 (100.0%) |
| Total (Overall) | 25 (59.5%) | 17 (40.5%) |
Sales and Office Occupations
The most common Sales and Office occupations in Luke are , and Sales & Related (4 | 9.5%).

Sales and Office Occupations by Sex

| Occupation | Male | Female |
| Sales & Related | 0 (0.0%) | 4 (100.0%) |
| Office & Administration | 0 (0.0%) | 0 (0.0%) |
| Total (Category) | 0 (0.0%) | 4 (100.0%) |
| Total (Overall) | 25 (59.5%) | 17 (40.5%) |
Natural Resources, Construction and Maintenance Occupations
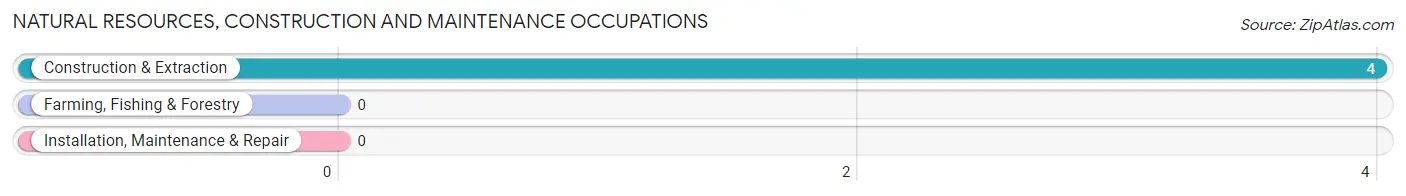
The most common Natural Resources, Construction and Maintenance occupations in Luke are , and Construction & Extraction (4 | 9.5%).
Natural Resources, Construction and Maintenance Occupations by Sex
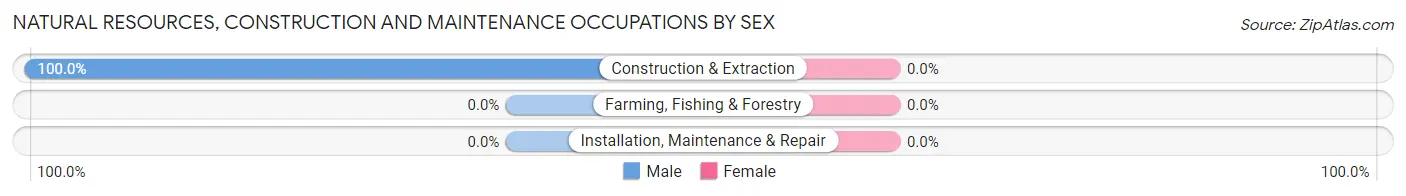
| Occupation | Male | Female |
| Farming, Fishing & Forestry | 0 (0.0%) | 0 (0.0%) |
| Construction & Extraction | 4 (100.0%) | 0 (0.0%) |
| Installation, Maintenance & Repair | 0 (0.0%) | 0 (0.0%) |
| Total (Category) | 4 (100.0%) | 0 (0.0%) |
| Total (Overall) | 25 (59.5%) | 17 (40.5%) |
Production, Transportation and Moving Occupations
The most common Production, Transportation and Moving occupations in Luke are Production (5 | 11.9%), and Material Moving (5 | 11.9%).
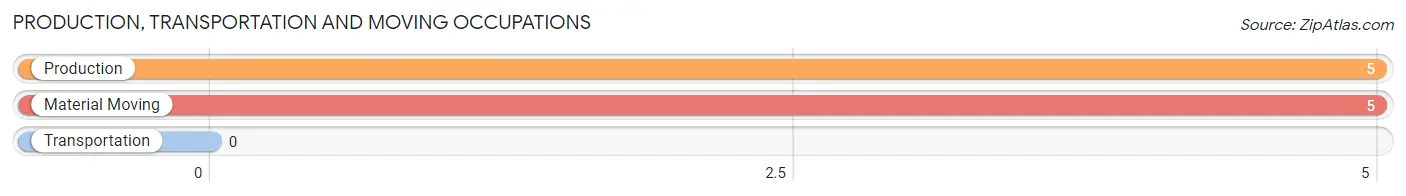
Production, Transportation and Moving Occupations by Sex
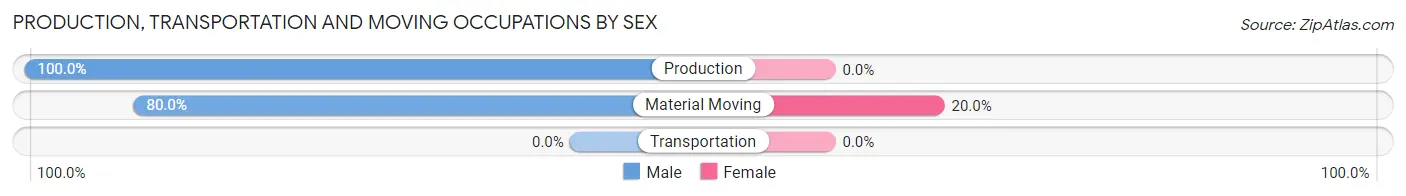
| Occupation | Male | Female |
| Production | 5 (100.0%) | 0 (0.0%) |
| Transportation | 0 (0.0%) | 0 (0.0%) |
| Material Moving | 4 (80.0%) | 1 (20.0%) |
| Total (Category) | 9 (90.0%) | 1 (10.0%) |
| Total (Overall) | 25 (59.5%) | 17 (40.5%) |
Employment Industries by Sex in Luke
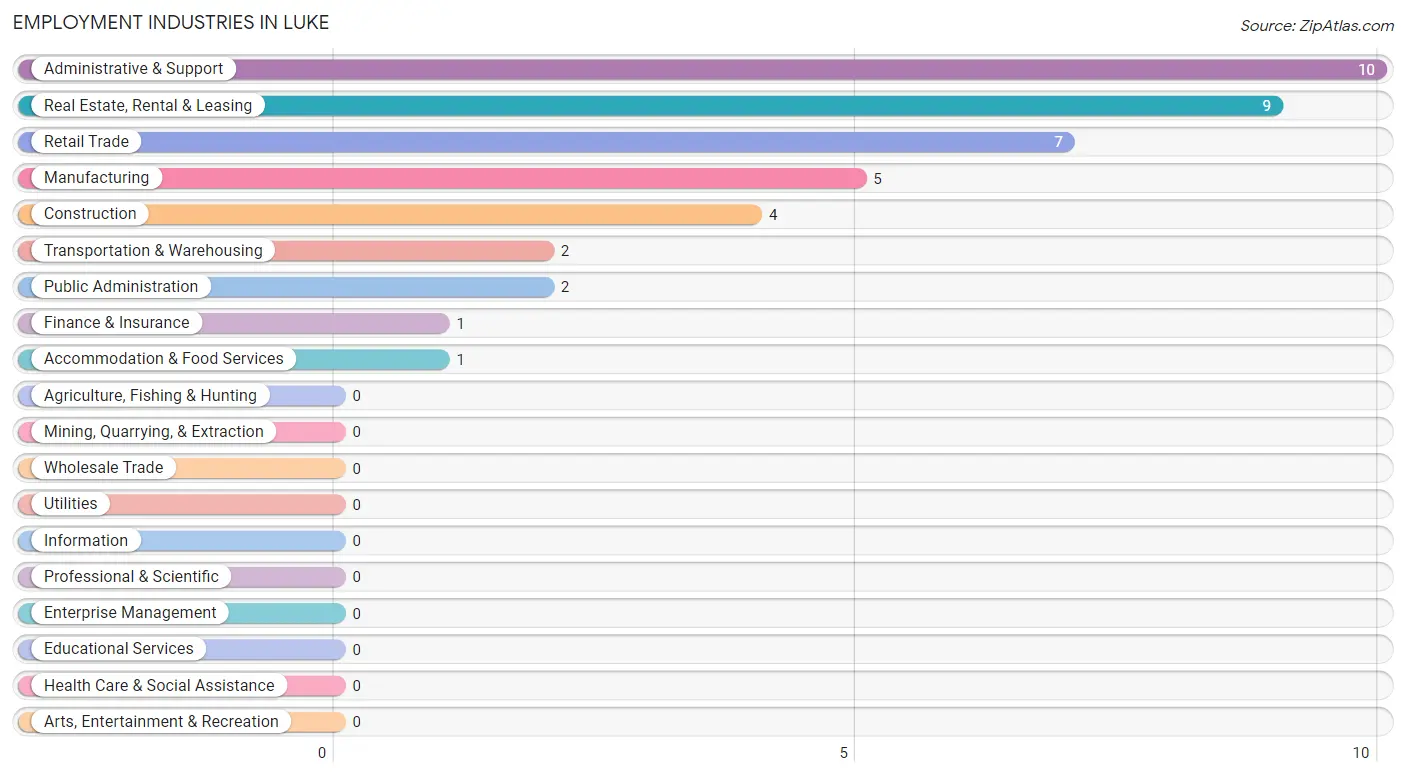
Employment Industries in Luke
The major employment industries in Luke include Administrative & Support (10 | 23.8%), Real Estate, Rental & Leasing (9 | 21.4%), Retail Trade (7 | 16.7%), Manufacturing (5 | 11.9%), and Construction (4 | 9.5%).
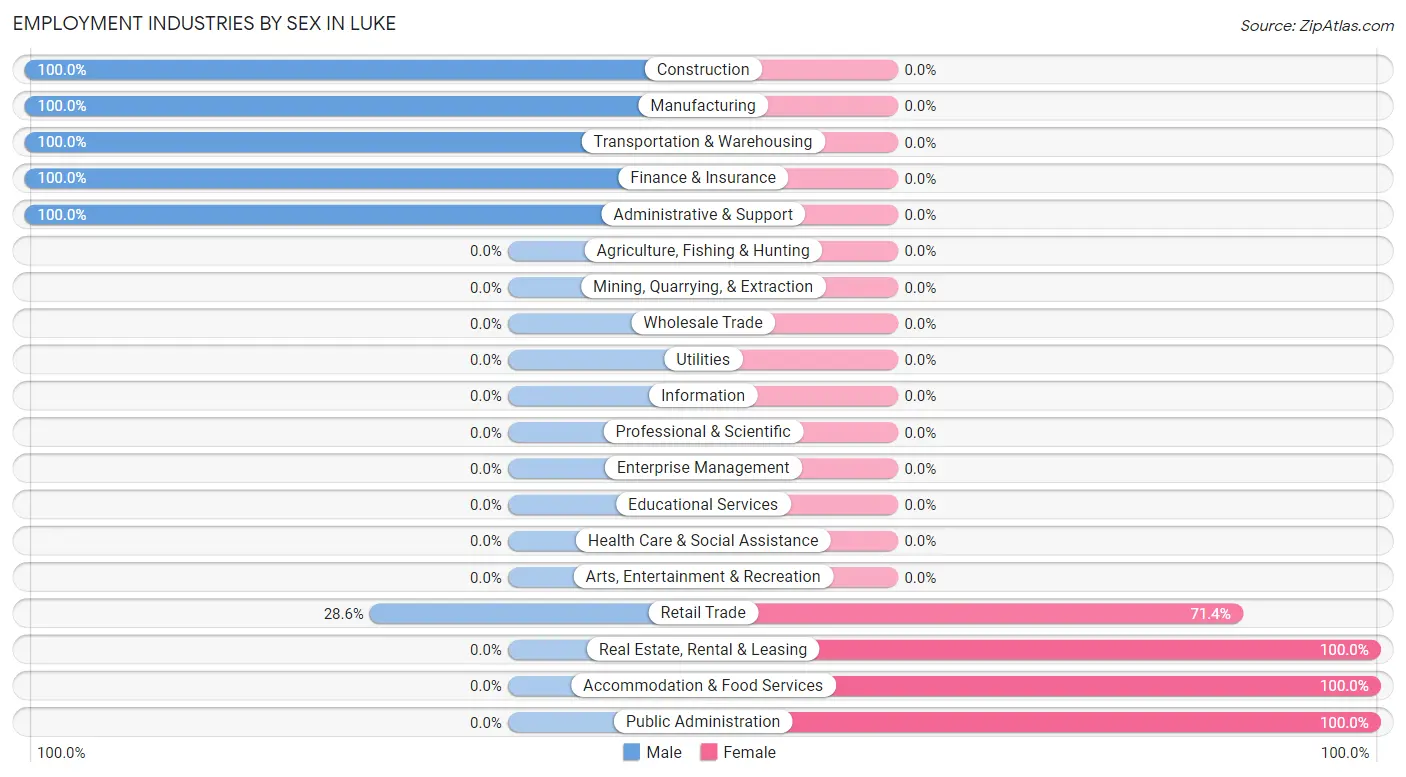
Employment Industries by Sex in Luke
The Luke industries that see more men than women are Construction (100.0%), Manufacturing (100.0%), and Transportation & Warehousing (100.0%), whereas the industries that tend to have a higher number of women are Real Estate, Rental & Leasing (100.0%), Accommodation & Food Services (100.0%), and Public Administration (100.0%).
| Industry | Male | Female |
| Agriculture, Fishing & Hunting | 0 (0.0%) | 0 (0.0%) |
| Mining, Quarrying, & Extraction | 0 (0.0%) | 0 (0.0%) |
| Construction | 4 (100.0%) | 0 (0.0%) |
| Manufacturing | 5 (100.0%) | 0 (0.0%) |
| Wholesale Trade | 0 (0.0%) | 0 (0.0%) |
| Retail Trade | 2 (28.6%) | 5 (71.4%) |
| Transportation & Warehousing | 2 (100.0%) | 0 (0.0%) |
| Utilities | 0 (0.0%) | 0 (0.0%) |
| Information | 0 (0.0%) | 0 (0.0%) |
| Finance & Insurance | 1 (100.0%) | 0 (0.0%) |
| Real Estate, Rental & Leasing | 0 (0.0%) | 9 (100.0%) |
| Professional & Scientific | 0 (0.0%) | 0 (0.0%) |
| Enterprise Management | 0 (0.0%) | 0 (0.0%) |
| Administrative & Support | 10 (100.0%) | 0 (0.0%) |
| Educational Services | 0 (0.0%) | 0 (0.0%) |
| Health Care & Social Assistance | 0 (0.0%) | 0 (0.0%) |
| Arts, Entertainment & Recreation | 0 (0.0%) | 0 (0.0%) |
| Accommodation & Food Services | 0 (0.0%) | 1 (100.0%) |
| Public Administration | 0 (0.0%) | 2 (100.0%) |
| Total | 25 (59.5%) | 17 (40.5%) |
Education in Luke
School Enrollment in Luke
The most common levels of schooling among the 30 students in Luke are high school (15 | 50.0%), middle school (8 | 26.7%), and elementary school (4 | 13.3%).
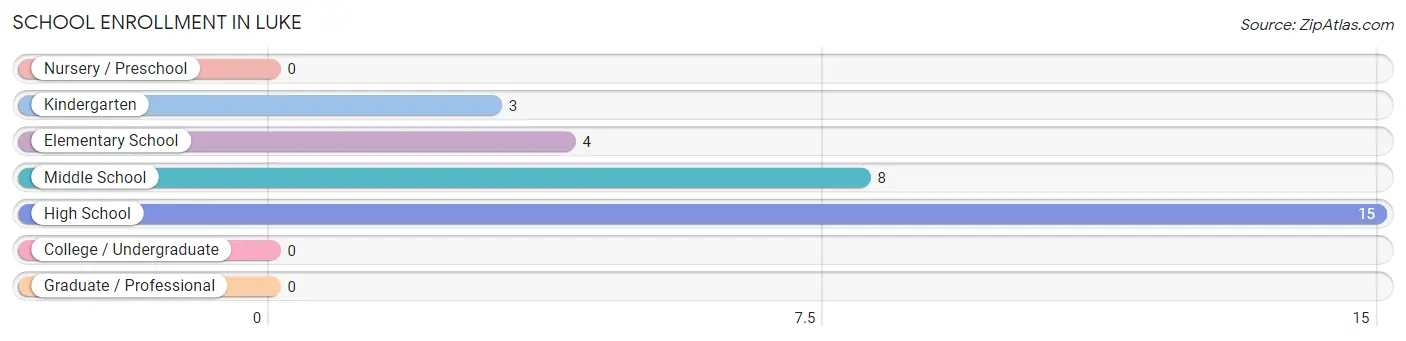
| School Level | # Students | % Students |
| Nursery / Preschool | 0 | 0.0% |
| Kindergarten | 3 | 10.0% |
| Elementary School | 4 | 13.3% |
| Middle School | 8 | 26.7% |
| High School | 15 | 50.0% |
| College / Undergraduate | 0 | 0.0% |
| Graduate / Professional | 0 | 0.0% |
| Total | 30 | 100.0% |
School Enrollment by Age by Funding Source in Luke
Out of a total of 30 students who are enrolled in schools in Luke, 7 (23.3%) attend a private institution, while the remaining 23 (76.7%) are enrolled in public schools. The age group of 5 to 9 year old has the highest likelihood of being enrolled in private schools, with 7 (50.0% in the age bracket) enrolled. Conversely, the age group of 10 to 14 year olds has the lowest likelihood of being enrolled in a private school, with 1 (100.0% in the age bracket) attending a public institution.
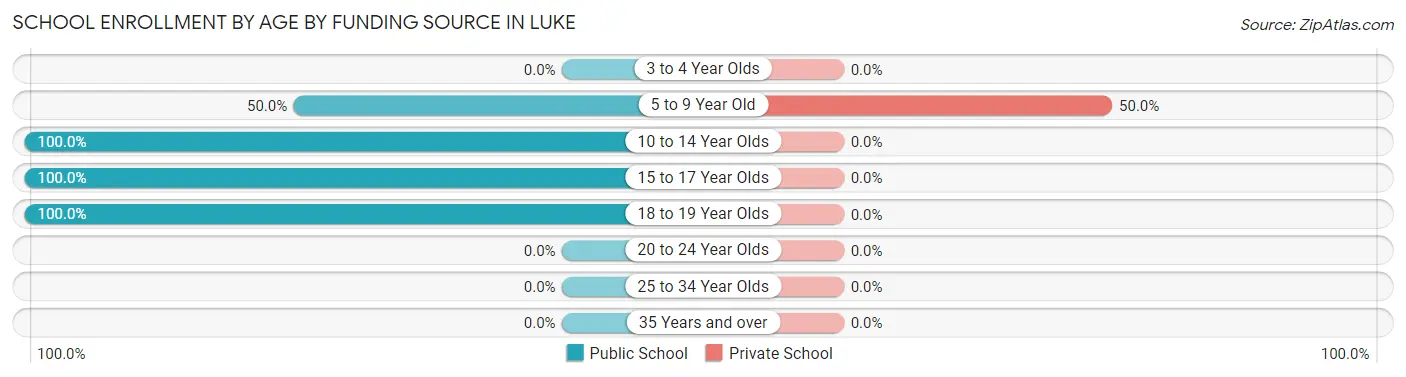
| Age Bracket | Public School | Private School |
| 3 to 4 Year Olds | 0 (0.0%) | 0 (0.0%) |
| 5 to 9 Year Old | 7 (50.0%) | 7 (50.0%) |
| 10 to 14 Year Olds | 1 (100.0%) | 0 (0.0%) |
| 15 to 17 Year Olds | 14 (100.0%) | 0 (0.0%) |
| 18 to 19 Year Olds | 1 (100.0%) | 0 (0.0%) |
| 20 to 24 Year Olds | 0 (0.0%) | 0 (0.0%) |
| 25 to 34 Year Olds | 0 (0.0%) | 0 (0.0%) |
| 35 Years and over | 0 (0.0%) | 0 (0.0%) |
| Total | 23 (76.7%) | 7 (23.3%) |
Educational Attainment by Field of Study in Luke
Bio, nature & agricultural (2 | 40.0%), liberal arts & history (2 | 40.0%), and literature & languages (1 | 20.0%) are the most common fields of study among 5 individuals in Luke who have obtained a bachelor's degree or higher.
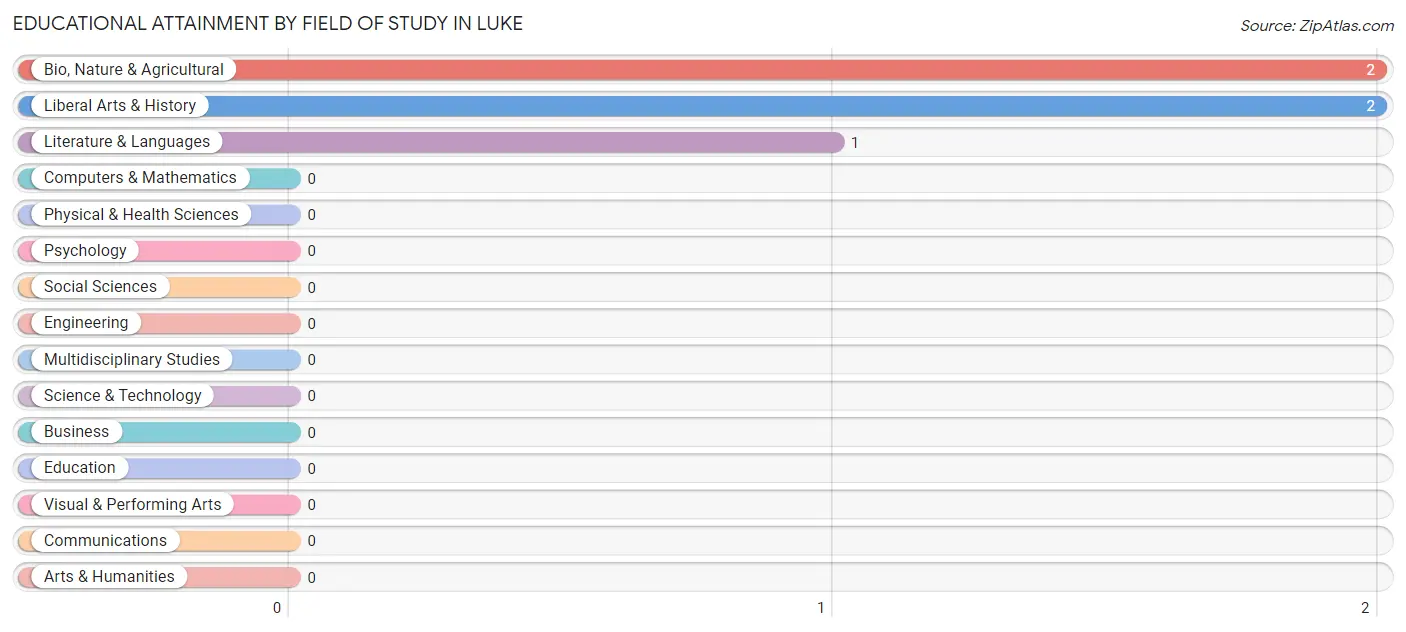
| Field of Study | # Graduates | % Graduates |
| Computers & Mathematics | 0 | 0.0% |
| Bio, Nature & Agricultural | 2 | 40.0% |
| Physical & Health Sciences | 0 | 0.0% |
| Psychology | 0 | 0.0% |
| Social Sciences | 0 | 0.0% |
| Engineering | 0 | 0.0% |
| Multidisciplinary Studies | 0 | 0.0% |
| Science & Technology | 0 | 0.0% |
| Business | 0 | 0.0% |
| Education | 0 | 0.0% |
| Literature & Languages | 1 | 20.0% |
| Liberal Arts & History | 2 | 40.0% |
| Visual & Performing Arts | 0 | 0.0% |
| Communications | 0 | 0.0% |
| Arts & Humanities | 0 | 0.0% |
| Total | 5 | 100.0% |
Transportation & Commute in Luke
Vehicle Availability by Sex in Luke
The most prevalent vehicle ownership categories in Luke are males with 1 vehicle (12, accounting for 60.0%) and females with 1 vehicle (11, making up 70.6%).
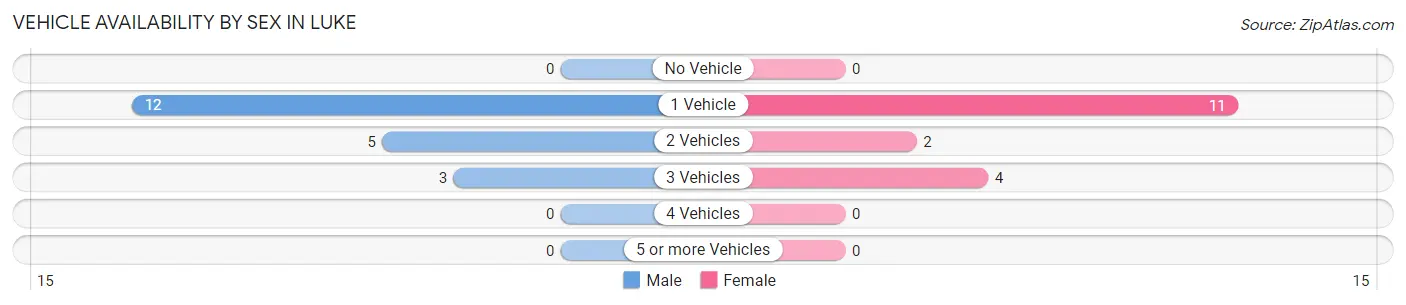
| Vehicles Available | Male | Female |
| No Vehicle | 0 (0.0%) | 0 (0.0%) |
| 1 Vehicle | 12 (60.0%) | 11 (64.7%) |
| 2 Vehicles | 5 (25.0%) | 2 (11.8%) |
| 3 Vehicles | 3 (15.0%) | 4 (23.5%) |
| 4 Vehicles | 0 (0.0%) | 0 (0.0%) |
| 5 or more Vehicles | 0 (0.0%) | 0 (0.0%) |
| Total | 20 (100.0%) | 17 (100.0%) |
Commute Time in Luke
The most frequently occuring commute durations in Luke are 15 to 19 minutes (14 commuters, 36.8%), 5 to 9 minutes (9 commuters, 23.7%), and less than 5 minutes (3 commuters, 7.9%).
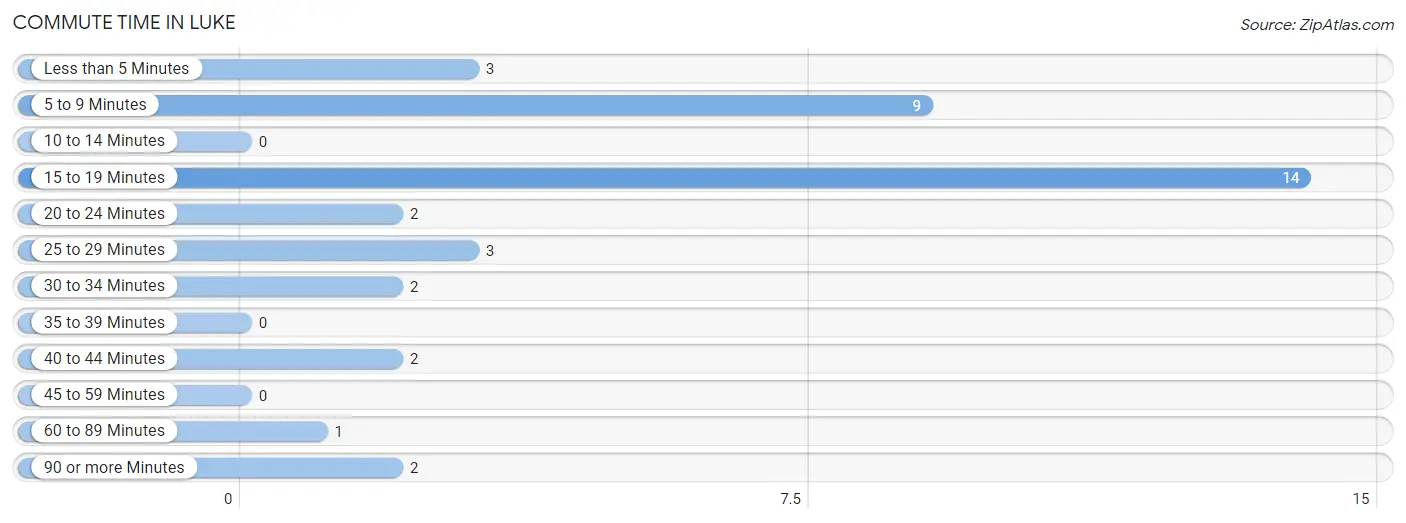
| Commute Time | # Commuters | % Commuters |
| Less than 5 Minutes | 3 | 7.9% |
| 5 to 9 Minutes | 9 | 23.7% |
| 10 to 14 Minutes | 0 | 0.0% |
| 15 to 19 Minutes | 14 | 36.8% |
| 20 to 24 Minutes | 2 | 5.3% |
| 25 to 29 Minutes | 3 | 7.9% |
| 30 to 34 Minutes | 2 | 5.3% |
| 35 to 39 Minutes | 0 | 0.0% |
| 40 to 44 Minutes | 2 | 5.3% |
| 45 to 59 Minutes | 0 | 0.0% |
| 60 to 89 Minutes | 1 | 2.6% |
| 90 or more Minutes | 2 | 5.3% |
Commute Time by Sex in Luke
The most common commute times in Luke are 15 to 19 minutes (11 commuters, 52.4%) for males and 5 to 9 minutes (9 commuters, 52.9%) for females.
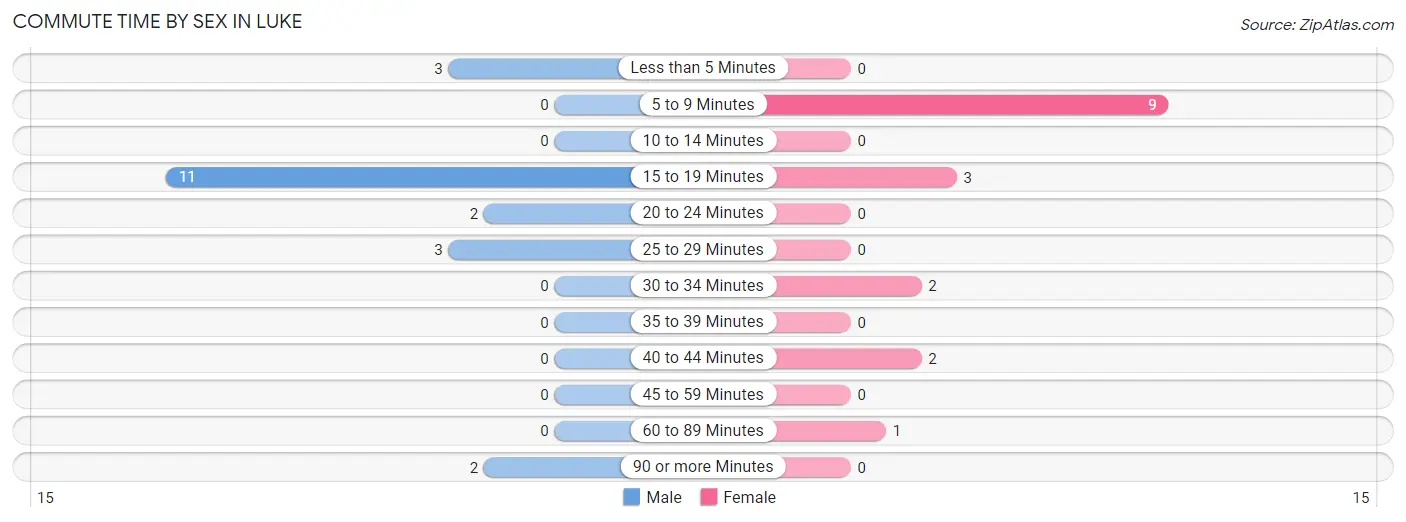
| Commute Time | Male | Female |
| Less than 5 Minutes | 3 (14.3%) | 0 (0.0%) |
| 5 to 9 Minutes | 0 (0.0%) | 9 (52.9%) |
| 10 to 14 Minutes | 0 (0.0%) | 0 (0.0%) |
| 15 to 19 Minutes | 11 (52.4%) | 3 (17.6%) |
| 20 to 24 Minutes | 2 (9.5%) | 0 (0.0%) |
| 25 to 29 Minutes | 3 (14.3%) | 0 (0.0%) |
| 30 to 34 Minutes | 0 (0.0%) | 2 (11.8%) |
| 35 to 39 Minutes | 0 (0.0%) | 0 (0.0%) |
| 40 to 44 Minutes | 0 (0.0%) | 2 (11.8%) |
| 45 to 59 Minutes | 0 (0.0%) | 0 (0.0%) |
| 60 to 89 Minutes | 0 (0.0%) | 1 (5.9%) |
| 90 or more Minutes | 2 (9.5%) | 0 (0.0%) |
Time of Departure to Work by Sex in Luke
The most frequent times of departure to work in Luke are 7:00 AM to 7:29 AM (10, 47.6%) for males and 7:00 AM to 7:29 AM (10, 58.8%) for females.
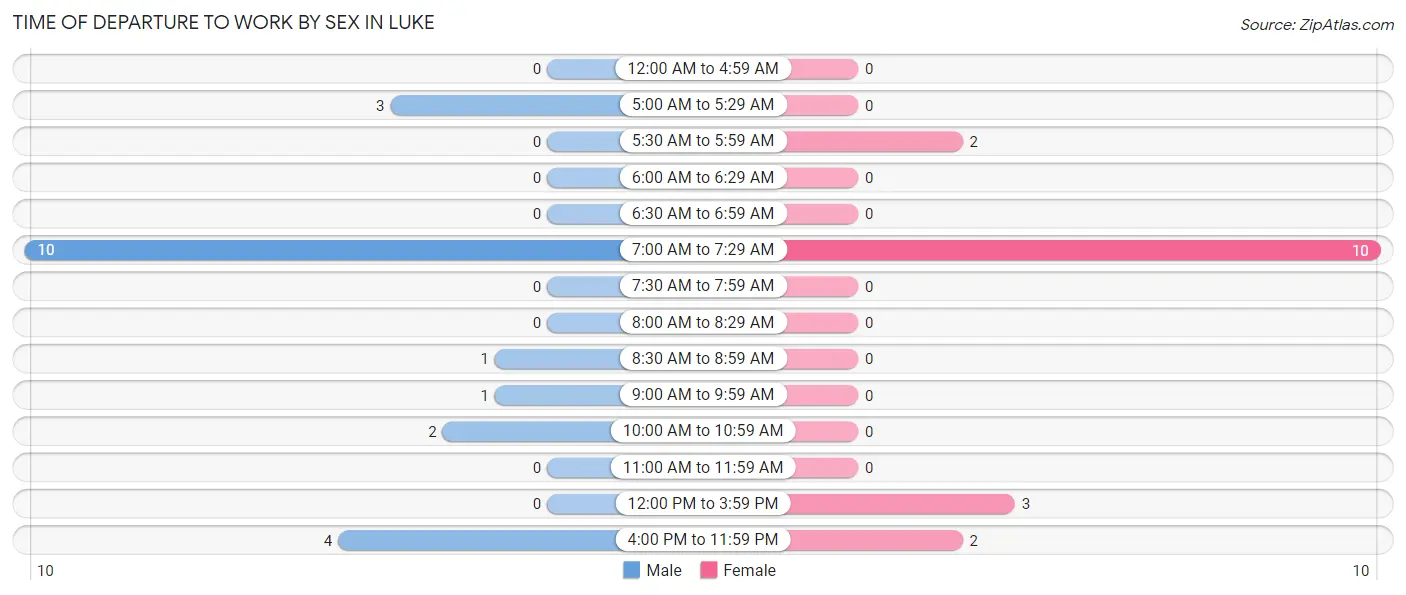
| Time of Departure | Male | Female |
| 12:00 AM to 4:59 AM | 0 (0.0%) | 0 (0.0%) |
| 5:00 AM to 5:29 AM | 3 (14.3%) | 0 (0.0%) |
| 5:30 AM to 5:59 AM | 0 (0.0%) | 2 (11.8%) |
| 6:00 AM to 6:29 AM | 0 (0.0%) | 0 (0.0%) |
| 6:30 AM to 6:59 AM | 0 (0.0%) | 0 (0.0%) |
| 7:00 AM to 7:29 AM | 10 (47.6%) | 10 (58.8%) |
| 7:30 AM to 7:59 AM | 0 (0.0%) | 0 (0.0%) |
| 8:00 AM to 8:29 AM | 0 (0.0%) | 0 (0.0%) |
| 8:30 AM to 8:59 AM | 1 (4.8%) | 0 (0.0%) |
| 9:00 AM to 9:59 AM | 1 (4.8%) | 0 (0.0%) |
| 10:00 AM to 10:59 AM | 2 (9.5%) | 0 (0.0%) |
| 11:00 AM to 11:59 AM | 0 (0.0%) | 0 (0.0%) |
| 12:00 PM to 3:59 PM | 0 (0.0%) | 3 (17.6%) |
| 4:00 PM to 11:59 PM | 4 (19.1%) | 2 (11.8%) |
| Total | 21 (100.0%) | 17 (100.0%) |
Housing Occupancy in Luke
Occupancy by Ownership in Luke
Of the total 31 dwellings in Luke, owner-occupied units account for 22 (71.0%), while renter-occupied units make up 9 (29.0%).
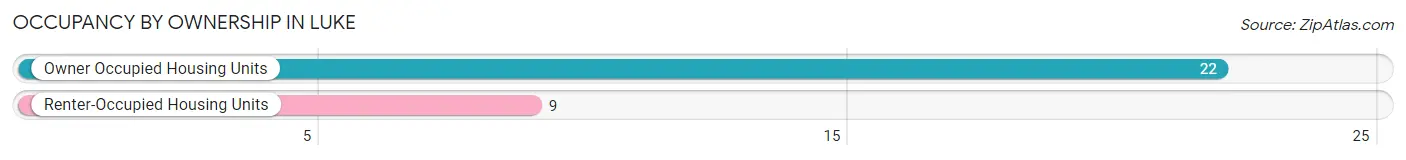
| Occupancy | # Housing Units | % Housing Units |
| Owner Occupied Housing Units | 22 | 71.0% |
| Renter-Occupied Housing Units | 9 | 29.0% |
| Total Occupied Housing Units | 31 | 100.0% |
Occupancy by Household Size in Luke
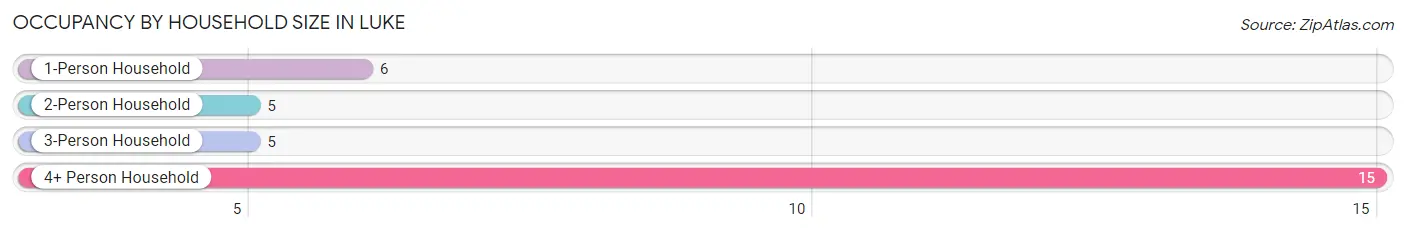
| Household Size | # Housing Units | % Housing Units |
| 1-Person Household | 6 | 19.4% |
| 2-Person Household | 5 | 16.1% |
| 3-Person Household | 5 | 16.1% |
| 4+ Person Household | 15 | 48.4% |
| Total Housing Units | 31 | 100.0% |
Occupancy by Ownership by Household Size in Luke
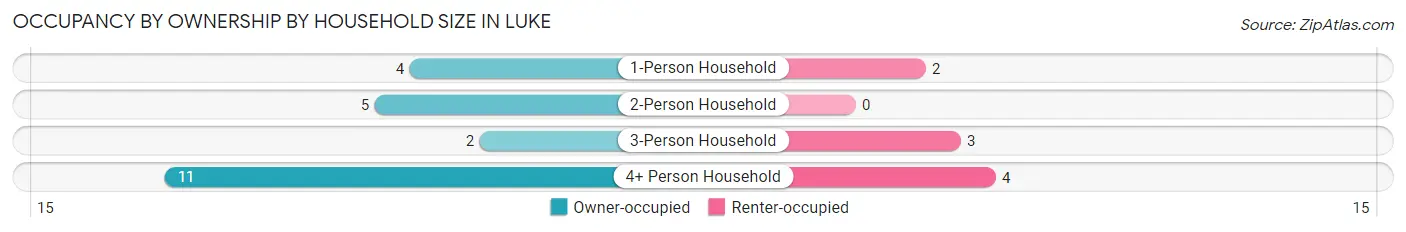
| Household Size | Owner-occupied | Renter-occupied |
| 1-Person Household | 4 (66.7%) | 2 (33.3%) |
| 2-Person Household | 5 (100.0%) | 0 (0.0%) |
| 3-Person Household | 2 (40.0%) | 3 (60.0%) |
| 4+ Person Household | 11 (73.3%) | 4 (26.7%) |
| Total Housing Units | 22 (71.0%) | 9 (29.0%) |
Occupancy by Educational Attainment in Luke
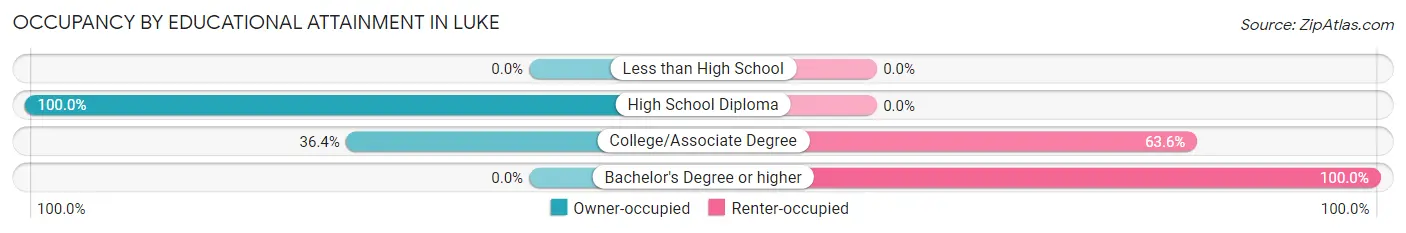
| Household Size | Owner-occupied | Renter-occupied |
| Less than High School | 0 (0.0%) | 0 (0.0%) |
| High School Diploma | 18 (100.0%) | 0 (0.0%) |
| College/Associate Degree | 4 (36.4%) | 7 (63.6%) |
| Bachelor's Degree or higher | 0 (0.0%) | 2 (100.0%) |
Occupancy by Age of Householder in Luke
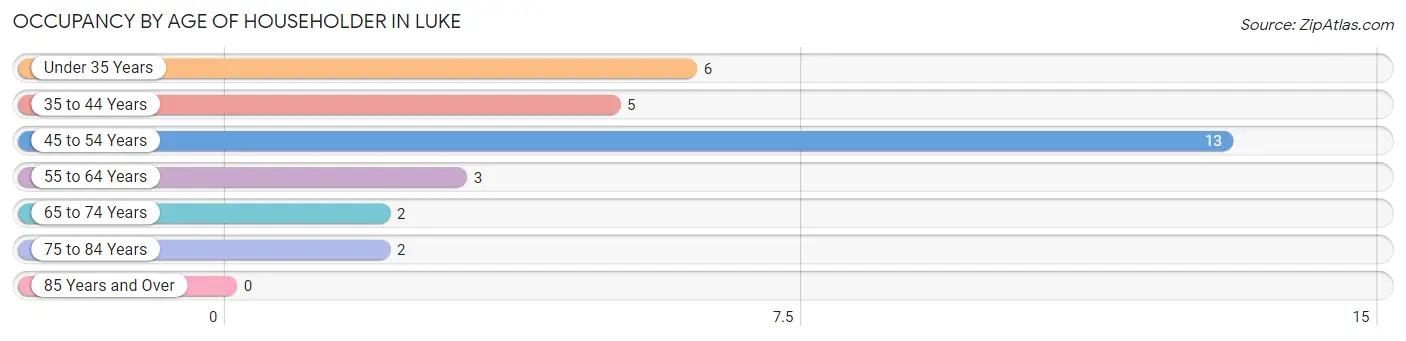
| Age Bracket | # Households | % Households |
| Under 35 Years | 6 | 19.4% |
| 35 to 44 Years | 5 | 16.1% |
| 45 to 54 Years | 13 | 41.9% |
| 55 to 64 Years | 3 | 9.7% |
| 65 to 74 Years | 2 | 6.5% |
| 75 to 84 Years | 2 | 6.5% |
| 85 Years and Over | 0 | 0.0% |
| Total | 31 | 100.0% |
Housing Finances in Luke
Median Income by Occupancy in Luke
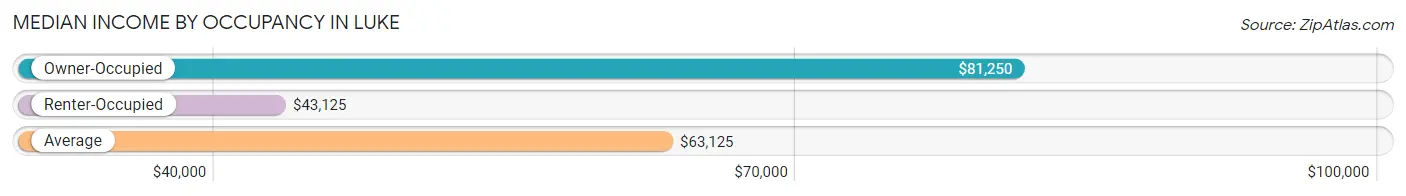
| Occupancy Type | # Households | Median Income |
| Owner-Occupied | 22 (71.0%) | $81,250 |
| Renter-Occupied | 9 (29.0%) | $43,125 |
| Average | 31 (100.0%) | $63,125 |
Occupancy by Householder Income Bracket in Luke
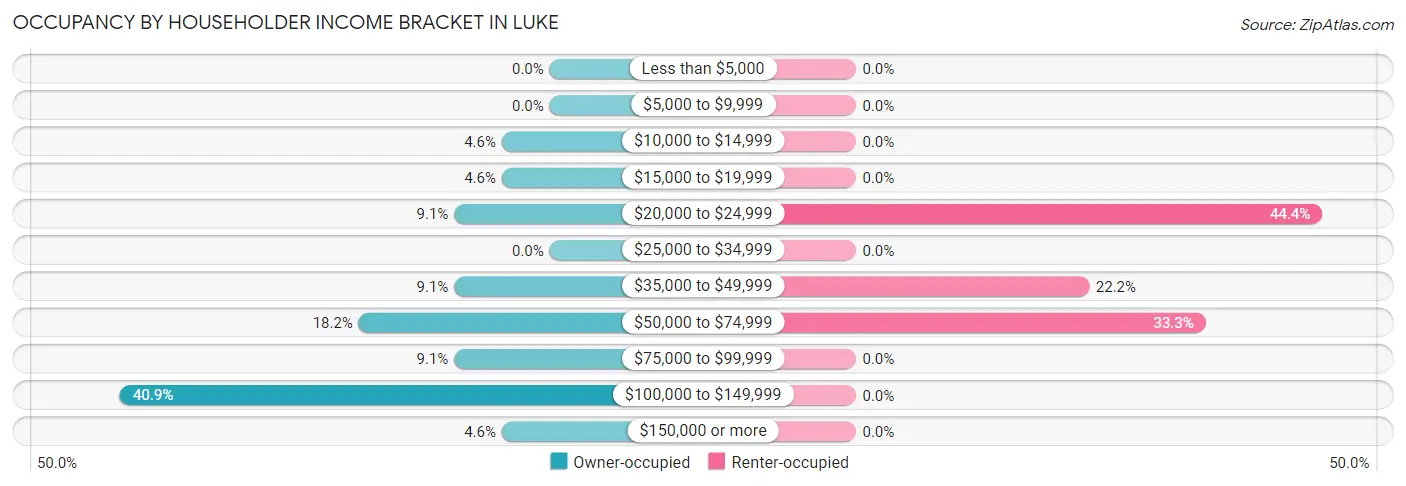
| Income Bracket | Owner-occupied | Renter-occupied |
| Less than $5,000 | 0 (0.0%) | 0 (0.0%) |
| $5,000 to $9,999 | 0 (0.0%) | 0 (0.0%) |
| $10,000 to $14,999 | 1 (4.5%) | 0 (0.0%) |
| $15,000 to $19,999 | 1 (4.5%) | 0 (0.0%) |
| $20,000 to $24,999 | 2 (9.1%) | 4 (44.4%) |
| $25,000 to $34,999 | 0 (0.0%) | 0 (0.0%) |
| $35,000 to $49,999 | 2 (9.1%) | 2 (22.2%) |
| $50,000 to $74,999 | 4 (18.2%) | 3 (33.3%) |
| $75,000 to $99,999 | 2 (9.1%) | 0 (0.0%) |
| $100,000 to $149,999 | 9 (40.9%) | 0 (0.0%) |
| $150,000 or more | 1 (4.5%) | 0 (0.0%) |
| Total | 22 (100.0%) | 9 (100.0%) |
Monthly Housing Cost Tiers in Luke
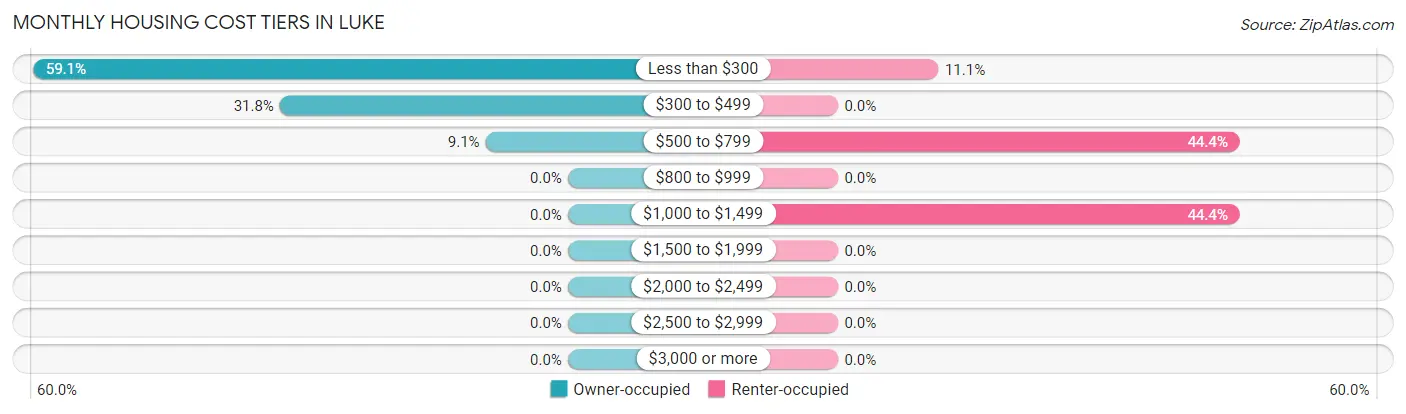
| Monthly Cost | Owner-occupied | Renter-occupied |
| Less than $300 | 13 (59.1%) | 1 (11.1%) |
| $300 to $499 | 7 (31.8%) | 0 (0.0%) |
| $500 to $799 | 2 (9.1%) | 4 (44.4%) |
| $800 to $999 | 0 (0.0%) | 0 (0.0%) |
| $1,000 to $1,499 | 0 (0.0%) | 4 (44.4%) |
| $1,500 to $1,999 | 0 (0.0%) | 0 (0.0%) |
| $2,000 to $2,499 | 0 (0.0%) | 0 (0.0%) |
| $2,500 to $2,999 | 0 (0.0%) | 0 (0.0%) |
| $3,000 or more | 0 (0.0%) | 0 (0.0%) |
| Total | 22 (100.0%) | 9 (100.0%) |
Physical Housing Characteristics in Luke
Housing Structures in Luke
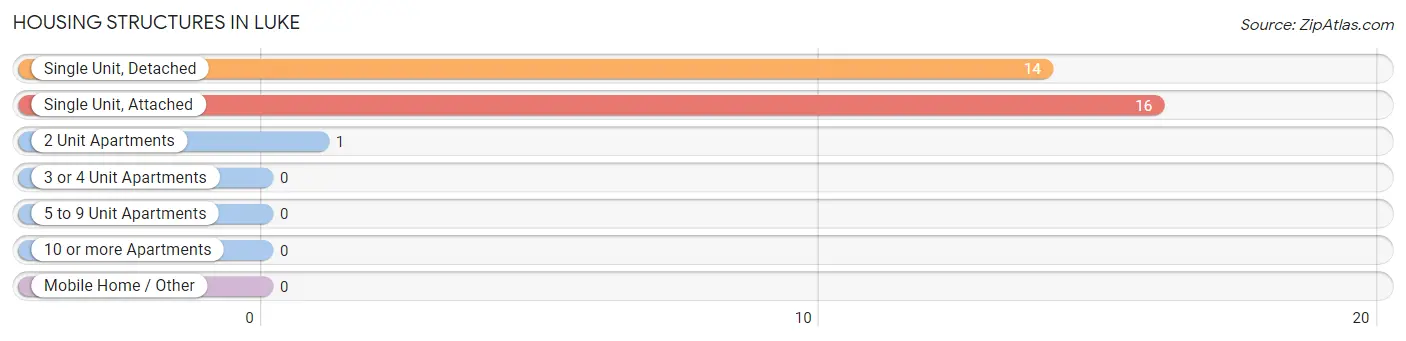
| Structure Type | # Housing Units | % Housing Units |
| Single Unit, Detached | 14 | 45.2% |
| Single Unit, Attached | 16 | 51.6% |
| 2 Unit Apartments | 1 | 3.2% |
| 3 or 4 Unit Apartments | 0 | 0.0% |
| 5 to 9 Unit Apartments | 0 | 0.0% |
| 10 or more Apartments | 0 | 0.0% |
| Mobile Home / Other | 0 | 0.0% |
| Total | 31 | 100.0% |
Housing Structures by Occupancy in Luke
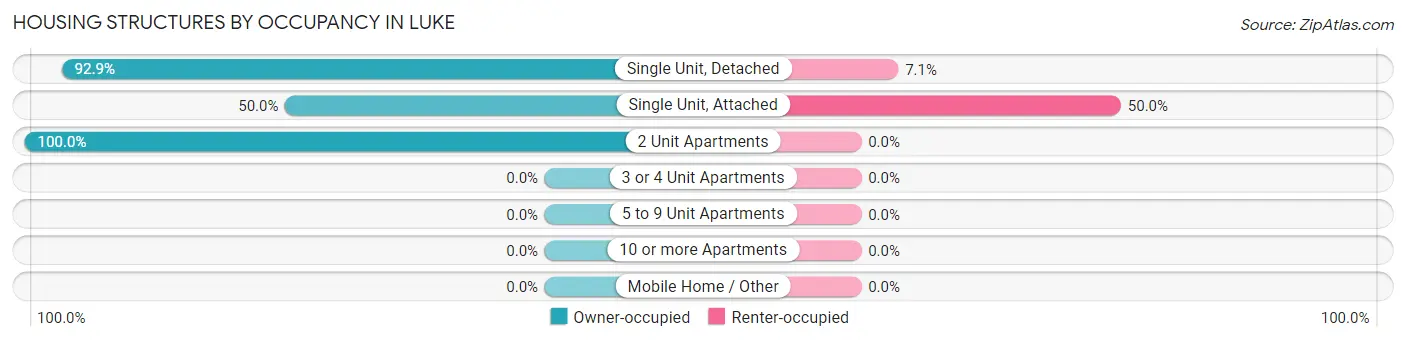
| Structure Type | Owner-occupied | Renter-occupied |
| Single Unit, Detached | 13 (92.9%) | 1 (7.1%) |
| Single Unit, Attached | 8 (50.0%) | 8 (50.0%) |
| 2 Unit Apartments | 1 (100.0%) | 0 (0.0%) |
| 3 or 4 Unit Apartments | 0 (0.0%) | 0 (0.0%) |
| 5 to 9 Unit Apartments | 0 (0.0%) | 0 (0.0%) |
| 10 or more Apartments | 0 (0.0%) | 0 (0.0%) |
| Mobile Home / Other | 0 (0.0%) | 0 (0.0%) |
| Total | 22 (71.0%) | 9 (29.0%) |
Housing Structures by Number of Rooms in Luke
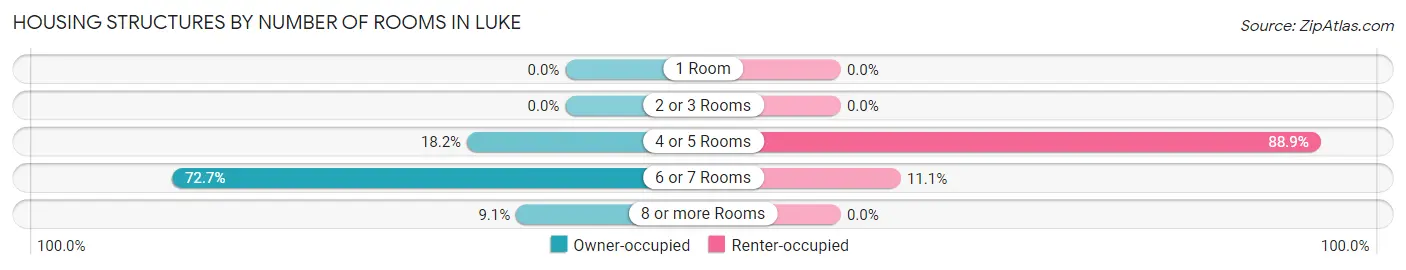
| Number of Rooms | Owner-occupied | Renter-occupied |
| 1 Room | 0 (0.0%) | 0 (0.0%) |
| 2 or 3 Rooms | 0 (0.0%) | 0 (0.0%) |
| 4 or 5 Rooms | 4 (18.2%) | 8 (88.9%) |
| 6 or 7 Rooms | 16 (72.7%) | 1 (11.1%) |
| 8 or more Rooms | 2 (9.1%) | 0 (0.0%) |
| Total | 22 (100.0%) | 9 (100.0%) |
Housing Structure by Heating Type in Luke
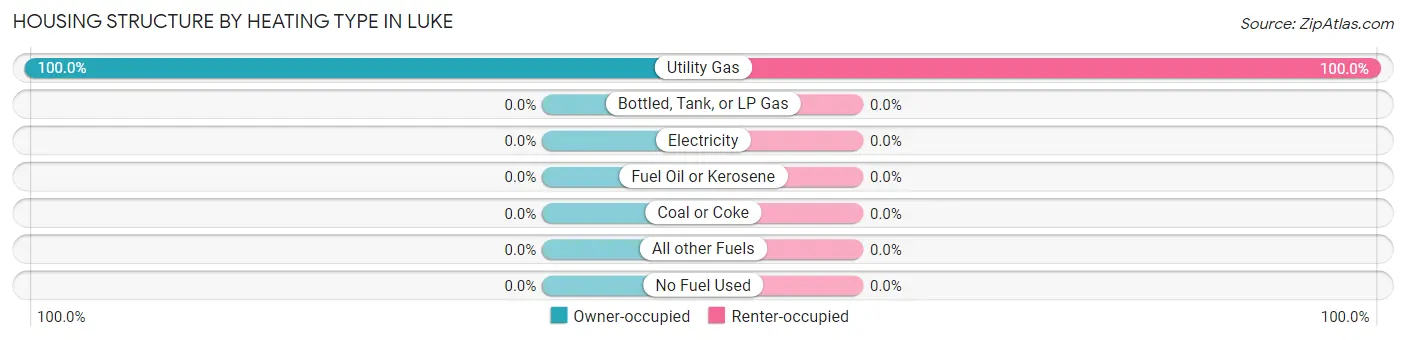
| Heating Type | Owner-occupied | Renter-occupied |
| Utility Gas | 22 (100.0%) | 9 (100.0%) |
| Bottled, Tank, or LP Gas | 0 (0.0%) | 0 (0.0%) |
| Electricity | 0 (0.0%) | 0 (0.0%) |
| Fuel Oil or Kerosene | 0 (0.0%) | 0 (0.0%) |
| Coal or Coke | 0 (0.0%) | 0 (0.0%) |
| All other Fuels | 0 (0.0%) | 0 (0.0%) |
| No Fuel Used | 0 (0.0%) | 0 (0.0%) |
| Total | 22 (100.0%) | 9 (100.0%) |
Household Vehicle Usage in Luke
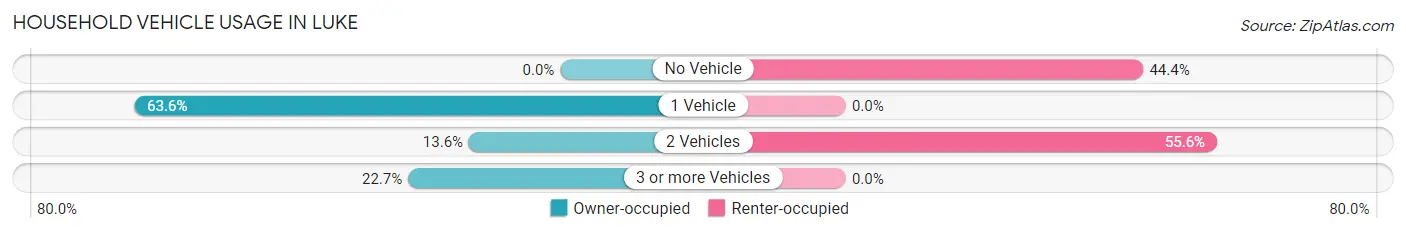
| Vehicles per Household | Owner-occupied | Renter-occupied |
| No Vehicle | 0 (0.0%) | 4 (44.4%) |
| 1 Vehicle | 14 (63.6%) | 0 (0.0%) |
| 2 Vehicles | 3 (13.6%) | 5 (55.6%) |
| 3 or more Vehicles | 5 (22.7%) | 0 (0.0%) |
| Total | 22 (100.0%) | 9 (100.0%) |
Real Estate & Mortgages in Luke
Real Estate and Mortgage Overview in Luke
| Characteristic | Without Mortgage | With Mortgage |
| Housing Units | 20 | 2 |
| Median Property Value | $43,000 | $0 |
| Median Household Income | $95,000 | $0 |
| Monthly Housing Costs | $283 | $0 |
| Real Estate Taxes | $700 | $0 |
Property Value by Mortgage Status in Luke
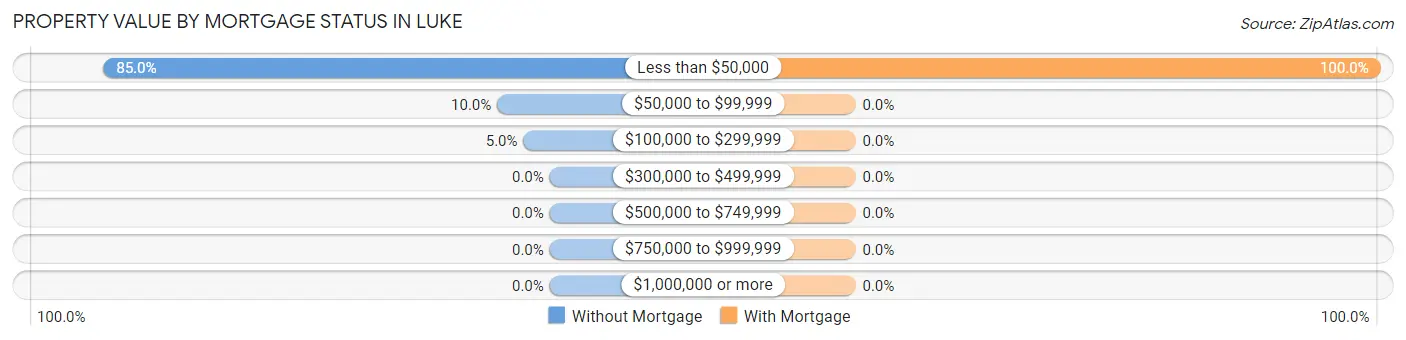
| Property Value | Without Mortgage | With Mortgage |
| Less than $50,000 | 17 (85.0%) | 2 (100.0%) |
| $50,000 to $99,999 | 2 (10.0%) | 0 (0.0%) |
| $100,000 to $299,999 | 1 (5.0%) | 0 (0.0%) |
| $300,000 to $499,999 | 0 (0.0%) | 0 (0.0%) |
| $500,000 to $749,999 | 0 (0.0%) | 0 (0.0%) |
| $750,000 to $999,999 | 0 (0.0%) | 0 (0.0%) |
| $1,000,000 or more | 0 (0.0%) | 0 (0.0%) |
| Total | 20 (100.0%) | 2 (100.0%) |
Household Income by Mortgage Status in Luke
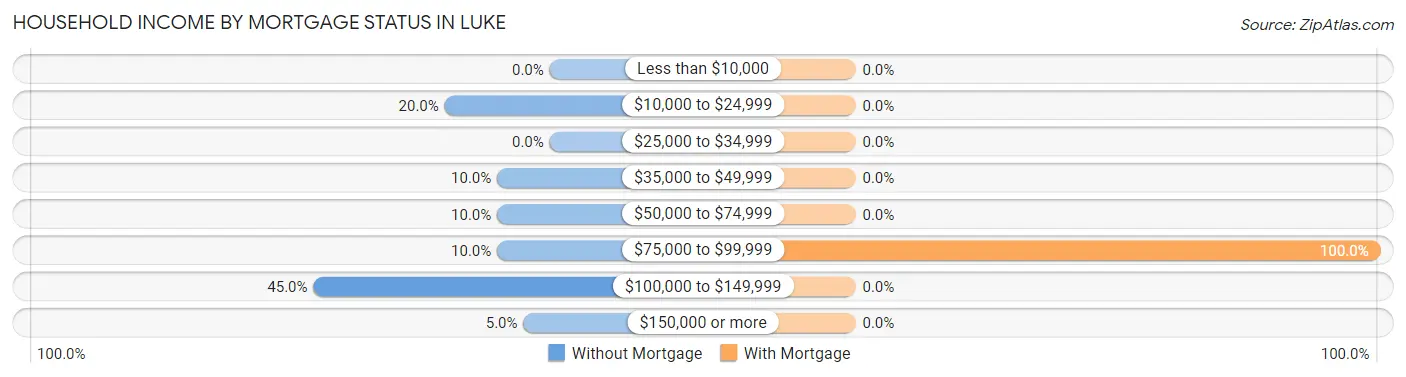
| Household Income | Without Mortgage | With Mortgage |
| Less than $10,000 | 0 (0.0%) | 0 (0.0%) |
| $10,000 to $24,999 | 4 (20.0%) | 0 (0.0%) |
| $25,000 to $34,999 | 0 (0.0%) | 0 (0.0%) |
| $35,000 to $49,999 | 2 (10.0%) | 0 (0.0%) |
| $50,000 to $74,999 | 2 (10.0%) | 0 (0.0%) |
| $75,000 to $99,999 | 2 (10.0%) | 2 (100.0%) |
| $100,000 to $149,999 | 9 (45.0%) | 0 (0.0%) |
| $150,000 or more | 1 (5.0%) | 0 (0.0%) |
| Total | 20 (100.0%) | 2 (100.0%) |
Property Value to Household Income Ratio in Luke
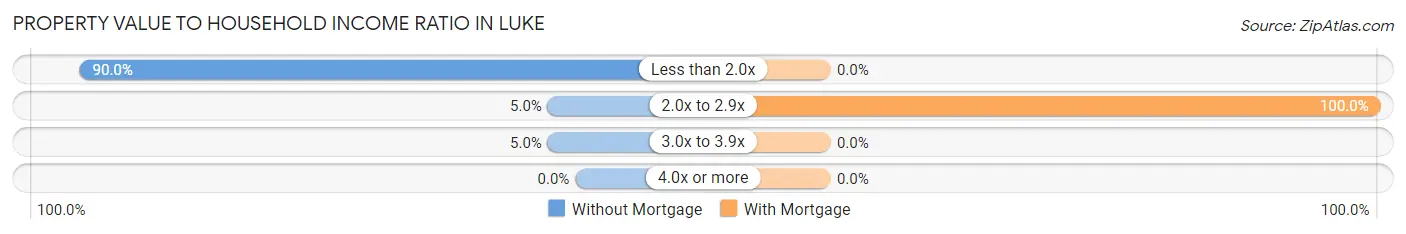
| Value-to-Income Ratio | Without Mortgage | With Mortgage |
| Less than 2.0x | 18 (90.0%) | 0 (0.0%) |
| 2.0x to 2.9x | 1 (5.0%) | 2 (100.0%) |
| 3.0x to 3.9x | 1 (5.0%) | 0 (0.0%) |
| 4.0x or more | 0 (0.0%) | 0 (0.0%) |
| Total | 20 (100.0%) | 2 (100.0%) |
Real Estate Taxes by Mortgage Status in Luke
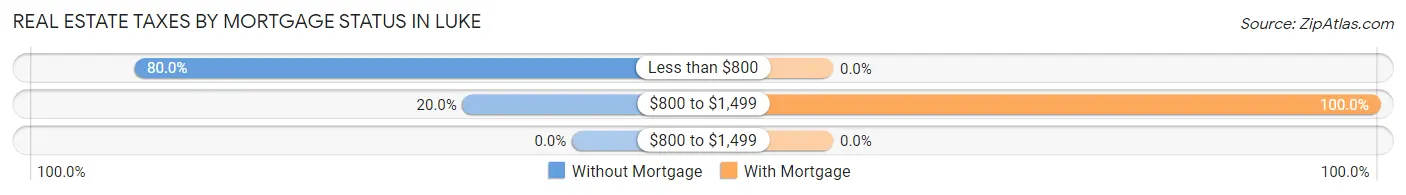
| Property Taxes | Without Mortgage | With Mortgage |
| Less than $800 | 16 (80.0%) | 0 (0.0%) |
| $800 to $1,499 | 4 (20.0%) | 2 (100.0%) |
| $800 to $1,499 | 0 (0.0%) | 0 (0.0%) |
| Total | 20 (100.0%) | 2 (100.0%) |
Health & Disability in Luke
Health Insurance Coverage by Age in Luke
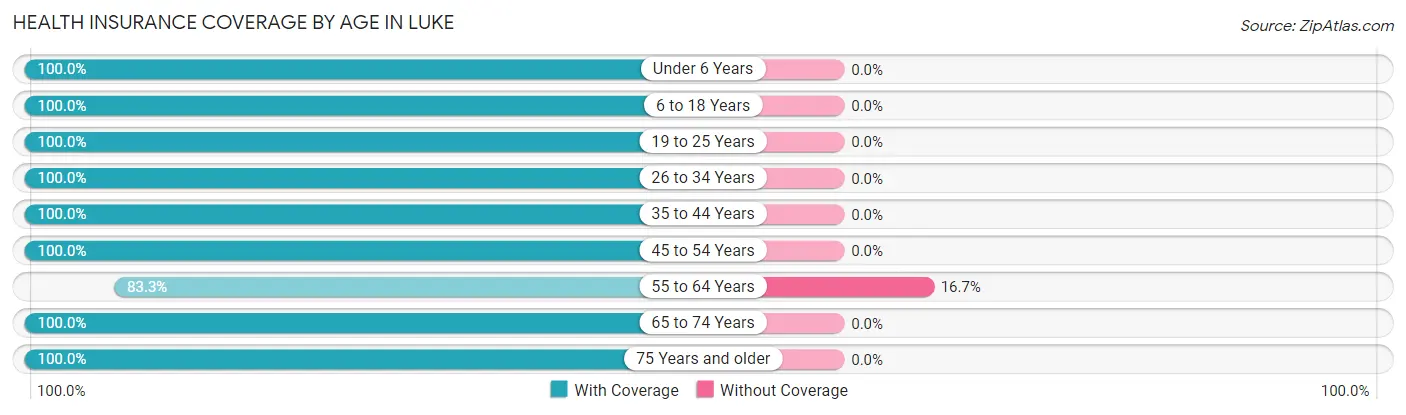
| Age Bracket | With Coverage | Without Coverage |
| Under 6 Years | 2 (100.0%) | 0 (0.0%) |
| 6 to 18 Years | 30 (100.0%) | 0 (0.0%) |
| 19 to 25 Years | 4 (100.0%) | 0 (0.0%) |
| 26 to 34 Years | 14 (100.0%) | 0 (0.0%) |
| 35 to 44 Years | 8 (100.0%) | 0 (0.0%) |
| 45 to 54 Years | 25 (100.0%) | 0 (0.0%) |
| 55 to 64 Years | 5 (83.3%) | 1 (16.7%) |
| 65 to 74 Years | 2 (100.0%) | 0 (0.0%) |
| 75 Years and older | 3 (100.0%) | 0 (0.0%) |
| Total | 93 (98.9%) | 1 (1.1%) |
Health Insurance Coverage by Citizenship Status in Luke
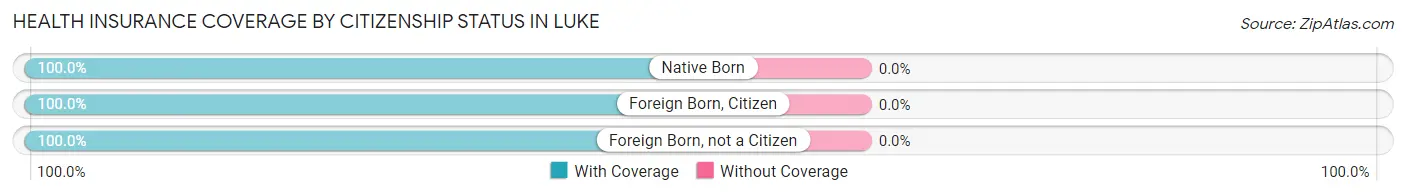
| Citizenship Status | With Coverage | Without Coverage |
| Native Born | 2 (100.0%) | 0 (0.0%) |
| Foreign Born, Citizen | 30 (100.0%) | 0 (0.0%) |
| Foreign Born, not a Citizen | 4 (100.0%) | 0 (0.0%) |
Health Insurance Coverage by Household Income in Luke
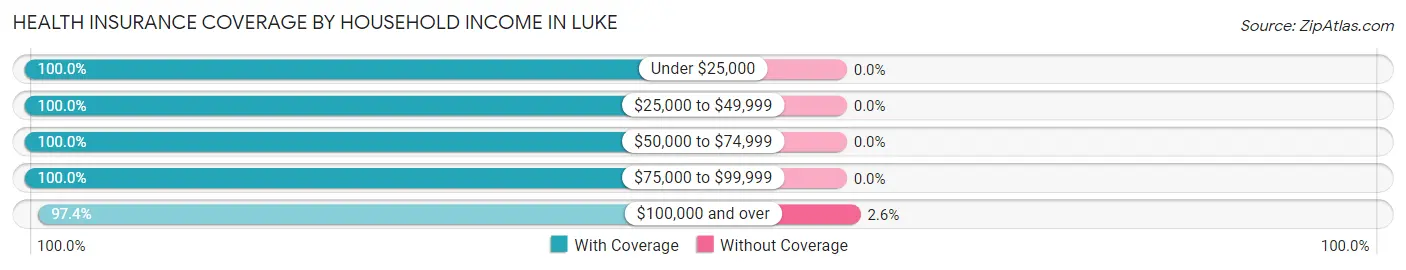
| Household Income | With Coverage | Without Coverage |
| Under $25,000 | 24 (100.0%) | 0 (0.0%) |
| $25,000 to $49,999 | 11 (100.0%) | 0 (0.0%) |
| $50,000 to $74,999 | 14 (100.0%) | 0 (0.0%) |
| $75,000 to $99,999 | 2 (100.0%) | 0 (0.0%) |
| $100,000 and over | 38 (97.4%) | 1 (2.6%) |
Public vs Private Health Insurance Coverage by Age in Luke
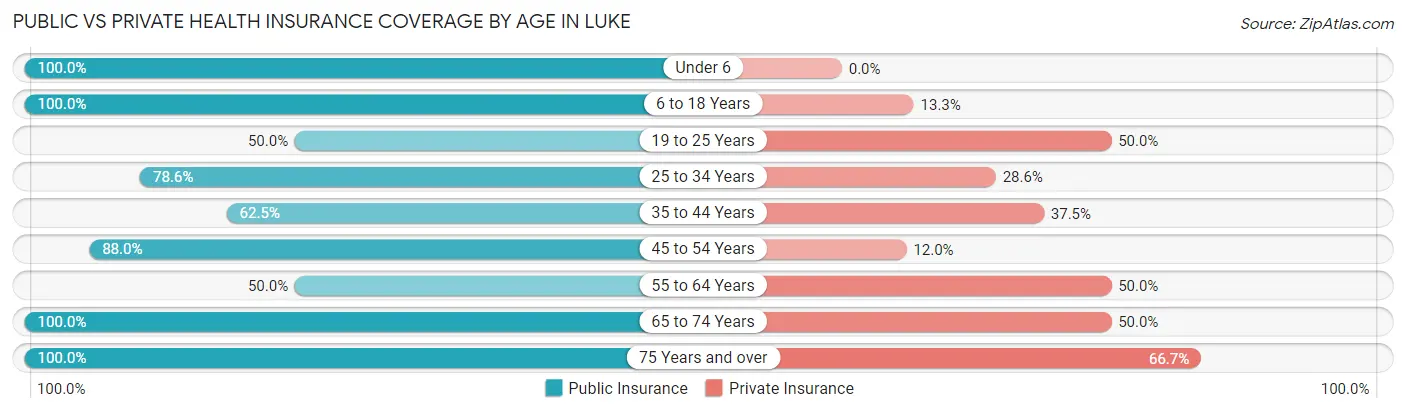
| Age Bracket | Public Insurance | Private Insurance |
| Under 6 | 2 (100.0%) | 0 (0.0%) |
| 6 to 18 Years | 30 (100.0%) | 4 (13.3%) |
| 19 to 25 Years | 2 (50.0%) | 2 (50.0%) |
| 25 to 34 Years | 11 (78.6%) | 4 (28.6%) |
| 35 to 44 Years | 5 (62.5%) | 3 (37.5%) |
| 45 to 54 Years | 22 (88.0%) | 3 (12.0%) |
| 55 to 64 Years | 3 (50.0%) | 3 (50.0%) |
| 65 to 74 Years | 2 (100.0%) | 1 (50.0%) |
| 75 Years and over | 3 (100.0%) | 2 (66.7%) |
| Total | 80 (85.1%) | 22 (23.4%) |
Disability Status by Sex by Age in Luke
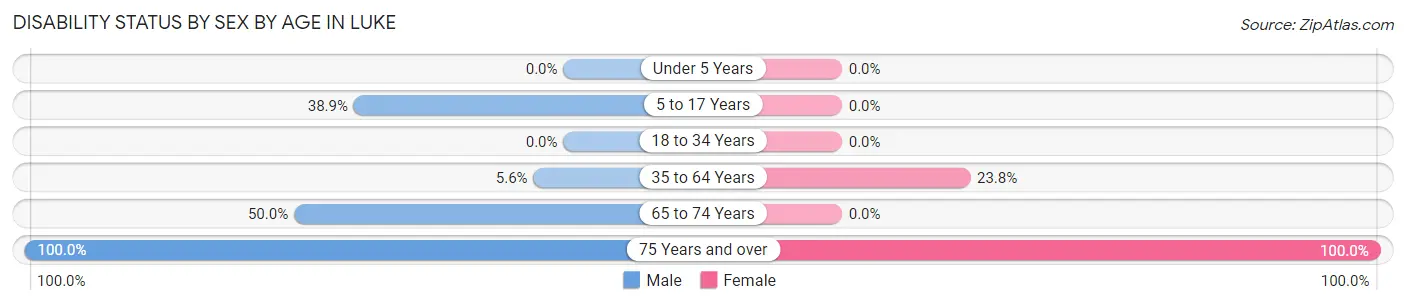
| Age Bracket | Male | Female |
| Under 5 Years | 0 (0.0%) | 0 (0.0%) |
| 5 to 17 Years | 7 (38.9%) | 0 (0.0%) |
| 18 to 34 Years | 0 (0.0%) | 0 (0.0%) |
| 35 to 64 Years | 1 (5.6%) | 5 (23.8%) |
| 65 to 74 Years | 1 (50.0%) | 0 (0.0%) |
| 75 Years and over | 1 (100.0%) | 2 (100.0%) |
Disability Class by Sex by Age in Luke
Disability Class: Hearing Difficulty
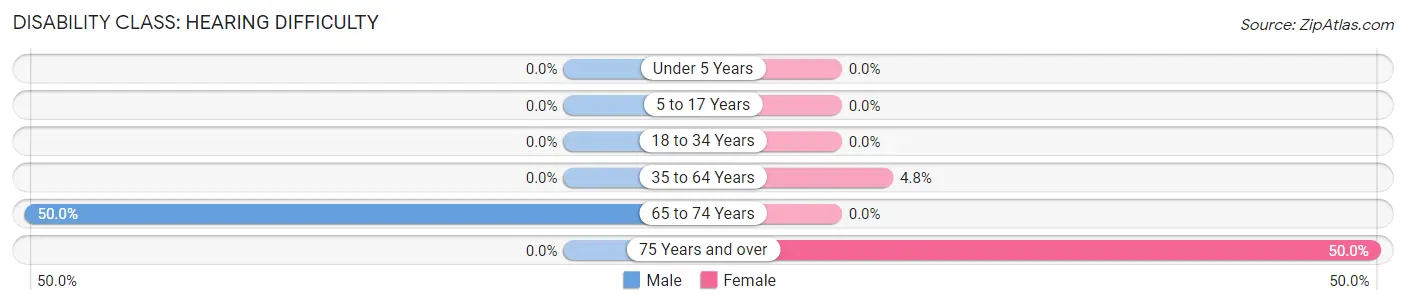
| Age Bracket | Male | Female |
| Under 5 Years | 0 (0.0%) | 0 (0.0%) |
| 5 to 17 Years | 0 (0.0%) | 0 (0.0%) |
| 18 to 34 Years | 0 (0.0%) | 0 (0.0%) |
| 35 to 64 Years | 0 (0.0%) | 1 (4.8%) |
| 65 to 74 Years | 1 (50.0%) | 0 (0.0%) |
| 75 Years and over | 0 (0.0%) | 1 (50.0%) |
Disability Class: Vision Difficulty
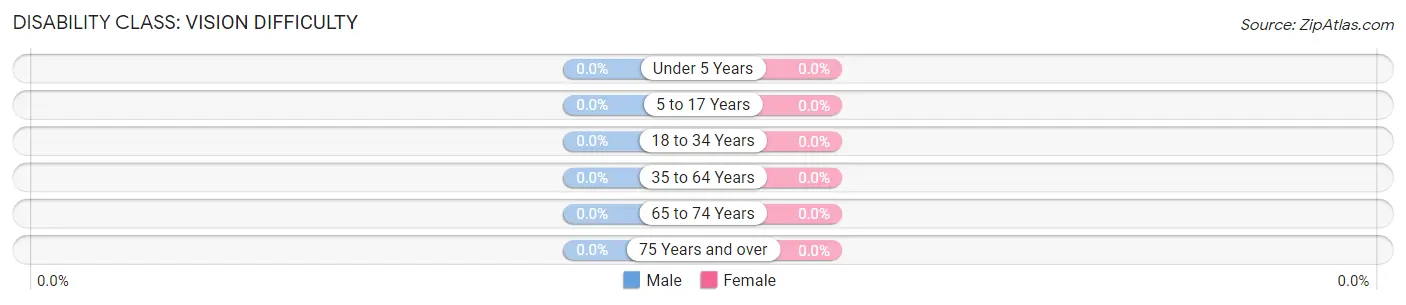
| Age Bracket | Male | Female |
| Under 5 Years | 0 (0.0%) | 0 (0.0%) |
| 5 to 17 Years | 0 (0.0%) | 0 (0.0%) |
| 18 to 34 Years | 0 (0.0%) | 0 (0.0%) |
| 35 to 64 Years | 0 (0.0%) | 0 (0.0%) |
| 65 to 74 Years | 0 (0.0%) | 0 (0.0%) |
| 75 Years and over | 0 (0.0%) | 0 (0.0%) |
Disability Class: Cognitive Difficulty
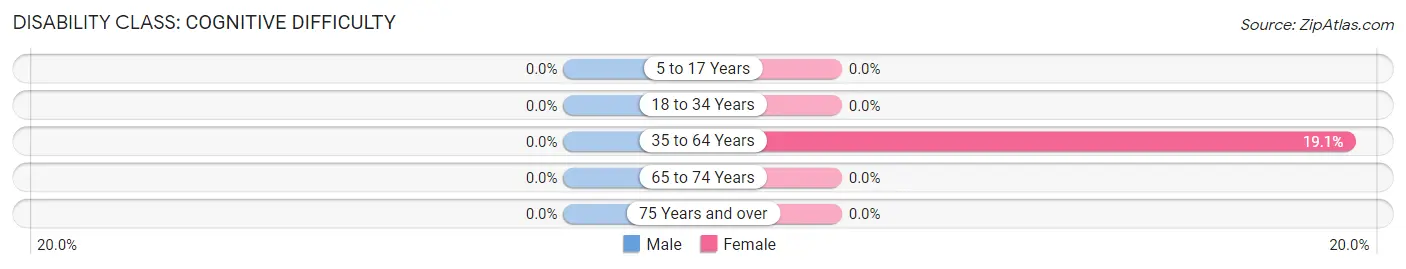
| Age Bracket | Male | Female |
| 5 to 17 Years | 0 (0.0%) | 0 (0.0%) |
| 18 to 34 Years | 0 (0.0%) | 0 (0.0%) |
| 35 to 64 Years | 0 (0.0%) | 4 (19.1%) |
| 65 to 74 Years | 0 (0.0%) | 0 (0.0%) |
| 75 Years and over | 0 (0.0%) | 0 (0.0%) |
Disability Class: Ambulatory Difficulty
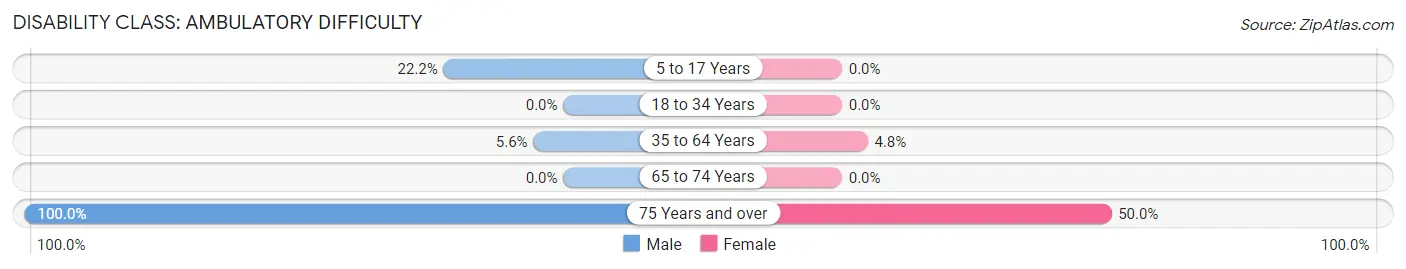
| Age Bracket | Male | Female |
| 5 to 17 Years | 4 (22.2%) | 0 (0.0%) |
| 18 to 34 Years | 0 (0.0%) | 0 (0.0%) |
| 35 to 64 Years | 1 (5.6%) | 1 (4.8%) |
| 65 to 74 Years | 0 (0.0%) | 0 (0.0%) |
| 75 Years and over | 1 (100.0%) | 1 (50.0%) |
Disability Class: Self-Care Difficulty
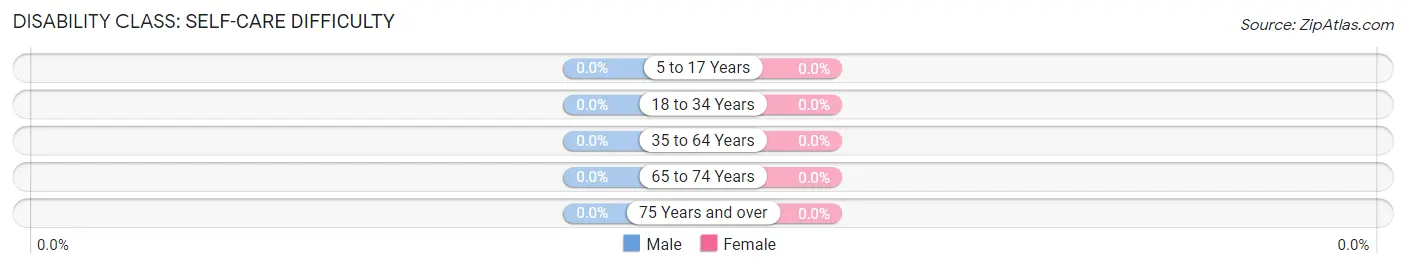
| Age Bracket | Male | Female |
| 5 to 17 Years | 0 (0.0%) | 0 (0.0%) |
| 18 to 34 Years | 0 (0.0%) | 0 (0.0%) |
| 35 to 64 Years | 0 (0.0%) | 0 (0.0%) |
| 65 to 74 Years | 0 (0.0%) | 0 (0.0%) |
| 75 Years and over | 0 (0.0%) | 0 (0.0%) |
Technology Access in Luke
Computing Device Access in Luke
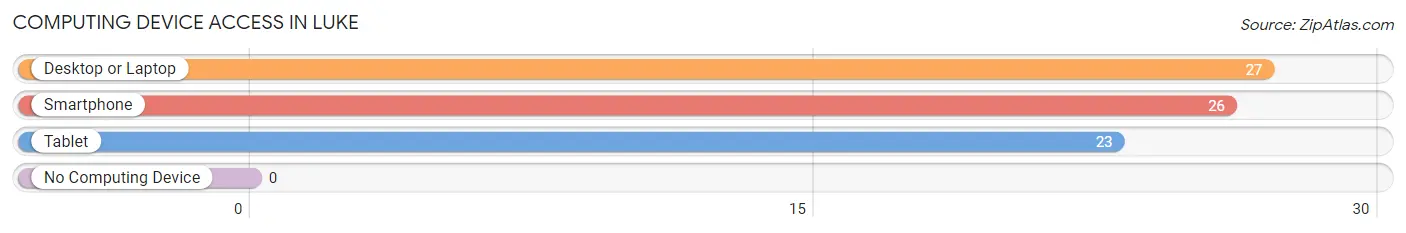
| Device Type | # Households | % Households |
| Desktop or Laptop | 27 | 87.1% |
| Smartphone | 26 | 83.9% |
| Tablet | 23 | 74.2% |
| No Computing Device | 0 | 0.0% |
| Total | 31 | 100.0% |
Internet Access in Luke
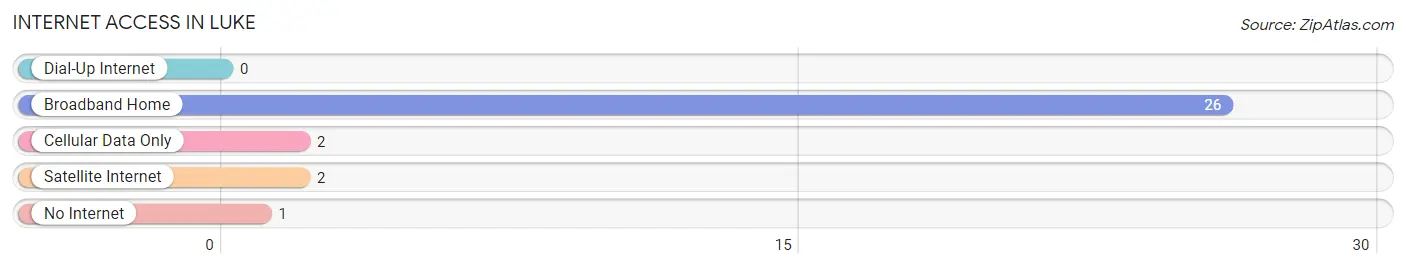
| Internet Type | # Households | % Households |
| Dial-Up Internet | 0 | 0.0% |
| Broadband Home | 26 | 83.9% |
| Cellular Data Only | 2 | 6.5% |
| Satellite Internet | 2 | 6.5% |
| No Internet | 1 | 3.2% |
| Total | 31 | 100.0% |
Luke Summary
History
Maryland is a state located in the Mid-Atlantic region of the United States. It is bordered by Virginia, West Virginia, and the District of Columbia to the south and west; Pennsylvania to the north; and Delaware to the east. The state was named after Queen Henrietta Maria of England, wife of King Charles I. Maryland was one of the original thirteen colonies that formed the United States.
The first Europeans to explore the area were the Spanish, who arrived in the early 16th century. They were followed by the English, who established the first permanent settlement in 1634. The colony was initially a haven for English Catholics, who were persecuted in England. The colony was also a major center of the slave trade, and many of the early settlers were slave owners.
In 1776, Maryland became the seventh state to ratify the Declaration of Independence. During the American Revolution, Maryland was a major battleground, with several major battles taking place in the state. After the war, Maryland was one of the original states to ratify the Constitution.
In the 19th century, Maryland was a major center of industry and manufacturing. The state was also a major center of the abolitionist movement, and many of the state's citizens were active in the Underground Railroad.
Geography
Maryland is located in the Mid-Atlantic region of the United States. It is bordered by Virginia, West Virginia, and the District of Columbia to the south and west; Pennsylvania to the north; and Delaware to the east. The state has a total area of 12,407 square miles, making it the 42nd largest state in the country.
The terrain of Maryland is mostly flat, with rolling hills in the western part of the state. The highest point in the state is Hoye-Crest, located in Garrett County, which has an elevation of 3,360 feet. The state is home to several major rivers, including the Potomac, Patuxent, and Susquehanna.
Economy
Maryland has a diverse economy, with a mix of industries including manufacturing, technology, agriculture, and tourism. The state is home to several major companies, including Lockheed Martin, Northrop Grumman, and Under Armour.
The state's largest industry is manufacturing, which accounts for about 15% of the state's GDP. Major products include chemicals, electronics, and food products. The state is also a major center of technology, with several major tech companies located in the state.
Agriculture is also an important part of the state's economy. Major crops include corn, soybeans, and wheat. The state is also home to several major wineries, and is a major producer of seafood.
Demographics
As of 2019, the population of Maryland was estimated to be 6,045,680. The state has a population density of 488 people per square mile, making it the 19th most densely populated state in the country.
The largest racial group in the state is white, making up 59.2% of the population. African Americans make up 30.2% of the population, while Hispanics make up 8.3%. The median household income in the state is $80,776, and the median age is 38.7.
Common Questions
What is Per Capita Income in Luke?
Per Capita income in Luke is $23,507.
What is the Median Household income in Luke?
Median Household Income in Luke is $63,125.
What is Inequality or Gini Index in Luke?
Inequality or Gini Index in Luke is 0.31.
What is the Total Population of Luke?
Total Population of Luke is 94.
What is the Total Male Population of Luke?
Total Male Population of Luke is 48.
What is the Total Female Population of Luke?
Total Female Population of Luke is 46.
What is the Ratio of Males per 100 Females in Luke?
There are 104.35 Males per 100 Females in Luke.
What is the Ratio of Females per 100 Males in Luke?
There are 95.83 Females per 100 Males in Luke.
What is the Median Population Age in Luke?
Median Population Age in Luke is 33.3 Years.
What is the Average Family Size in Luke
Average Family Size in Luke is 3.1 People.
What is the Average Household Size in Luke
Average Household Size in Luke is 2.9 People.
How Large is the Labor Force in Luke?
There are 45 People in the Labor Forcein in Luke.
What is the Percentage of People in the Labor Force in Luke?
58.4% of People are in the Labor Force in Luke.
What is the Unemployment Rate in Luke?
Unemployment Rate in Luke is 6.7%.