Clinton, MD Map & Demographics
Clinton Map
Clinton Overview
$48,945
PER CAPITA INCOME
$137,985
AVG FAMILY INCOME
$122,266
AVG HOUSEHOLD INCOME
2.3%
WAGE / INCOME GAP [ % ]
97.7¢/ $1
WAGE / INCOME GAP [ $ ]
$9,677
FAMILY INCOME DEFICIT
0.36
INEQUALITY / GINI INDEX
40,224
TOTAL POPULATION
19,756
MALE POPULATION
20,468
FEMALE POPULATION
96.52
MALES / 100 FEMALES
103.60
FEMALES / 100 MALES
44.5
MEDIAN AGE
3.4
AVG FAMILY SIZE
2.9
AVG HOUSEHOLD SIZE
22,721
LABOR FORCE [ PEOPLE ]
67.5%
PERCENT IN LABOR FORCE
5.7%
UNEMPLOYMENT RATE
Clinton Zip Codes
Income in Clinton
Income Overview in Clinton
Per Capita Income in Clinton is $48,945, while median incomes of families and households are $137,985 and $122,266 respectively.
| Characteristic | Number | Measure |
| Per Capita Income | 40,224 | $48,945 |
| Median Family Income | 10,114 | $137,985 |
| Mean Family Income | 10,114 | $154,724 |
| Median Household Income | 13,605 | $122,266 |
| Mean Household Income | 13,605 | $139,504 |
| Income Deficit | 10,114 | $9,677 |
| Wage / Income Gap (%) | 40,224 | 2.34% |
| Wage / Income Gap ($) | 40,224 | 97.66¢ per $1 |
| Gini / Inequality Index | 40,224 | 0.36 |
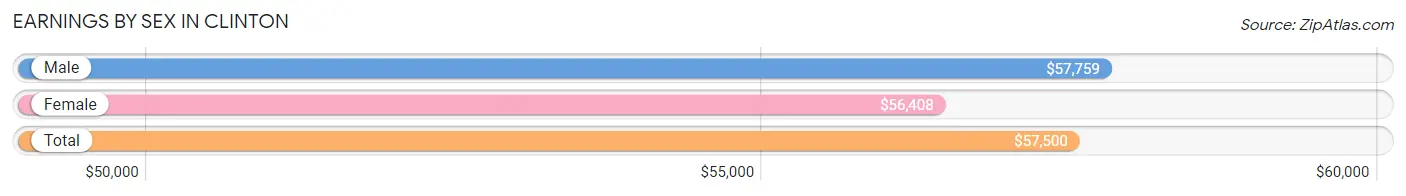
Earnings by Sex in Clinton
Average Earnings in Clinton are $57,500, $57,759 for men and $56,408 for women, a difference of 2.3%.
| Sex | Number | Average Earnings |
| Male | 11,723 (50.9%) | $57,759 |
| Female | 11,323 (49.1%) | $56,408 |
| Total | 23,046 (100.0%) | $57,500 |
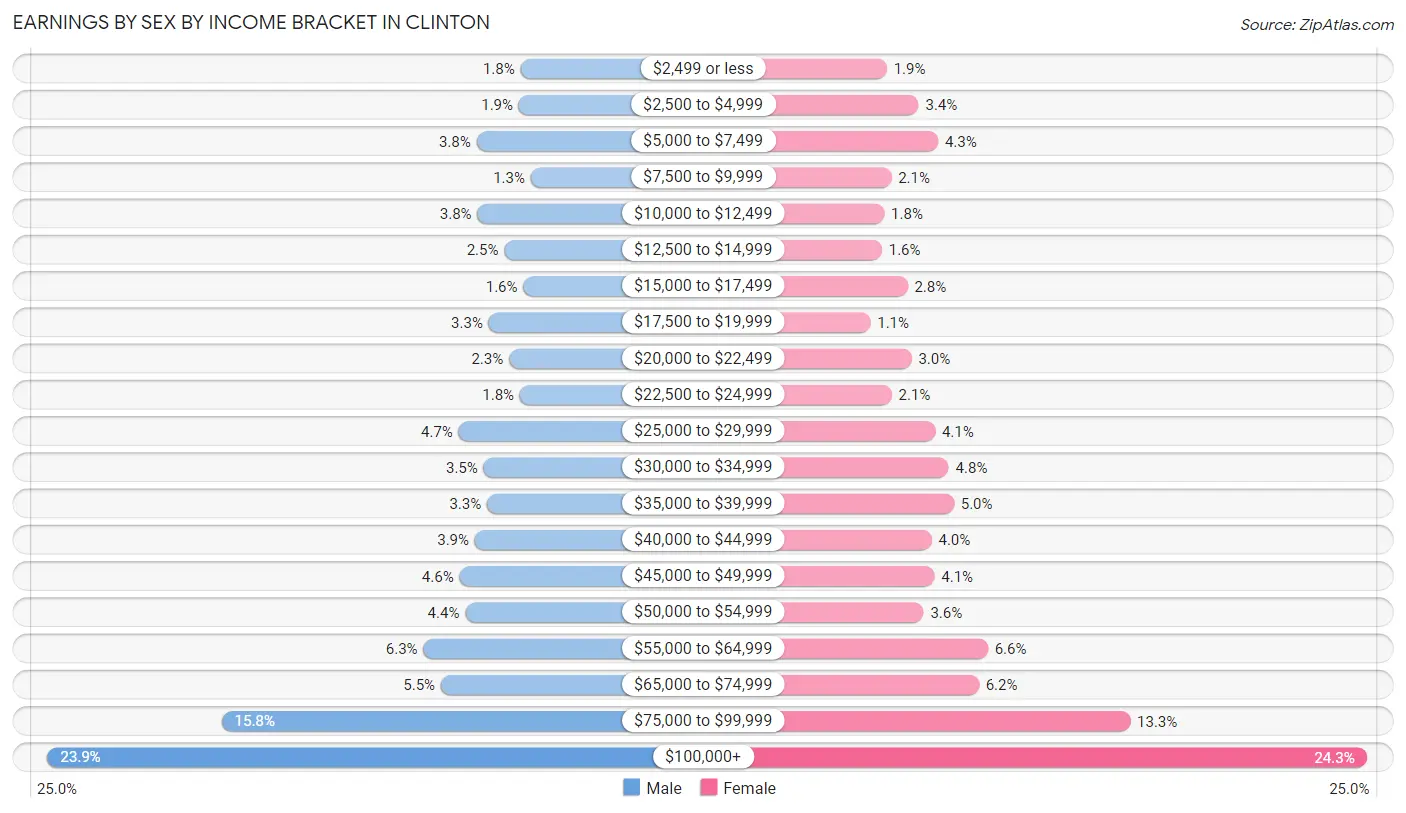
Earnings by Sex by Income Bracket in Clinton
The most common earnings brackets in Clinton are $100,000+ for men (2,805 | 23.9%) and $100,000+ for women (2,756 | 24.3%).
| Income | Male | Female |
| $2,499 or less | 208 (1.8%) | 212 (1.9%) |
| $2,500 to $4,999 | 217 (1.8%) | 380 (3.4%) |
| $5,000 to $7,499 | 449 (3.8%) | 483 (4.3%) |
| $7,500 to $9,999 | 151 (1.3%) | 235 (2.1%) |
| $10,000 to $12,499 | 444 (3.8%) | 198 (1.8%) |
| $12,500 to $14,999 | 297 (2.5%) | 186 (1.6%) |
| $15,000 to $17,499 | 192 (1.6%) | 322 (2.8%) |
| $17,500 to $19,999 | 382 (3.3%) | 124 (1.1%) |
| $20,000 to $22,499 | 271 (2.3%) | 343 (3.0%) |
| $22,500 to $24,999 | 211 (1.8%) | 238 (2.1%) |
| $25,000 to $29,999 | 547 (4.7%) | 468 (4.1%) |
| $30,000 to $34,999 | 410 (3.5%) | 540 (4.8%) |
| $35,000 to $39,999 | 392 (3.3%) | 567 (5.0%) |
| $40,000 to $44,999 | 458 (3.9%) | 450 (4.0%) |
| $45,000 to $49,999 | 543 (4.6%) | 464 (4.1%) |
| $50,000 to $54,999 | 511 (4.4%) | 407 (3.6%) |
| $55,000 to $64,999 | 741 (6.3%) | 747 (6.6%) |
| $65,000 to $74,999 | 645 (5.5%) | 700 (6.2%) |
| $75,000 to $99,999 | 1,849 (15.8%) | 1,503 (13.3%) |
| $100,000+ | 2,805 (23.9%) | 2,756 (24.3%) |
| Total | 11,723 (100.0%) | 11,323 (100.0%) |
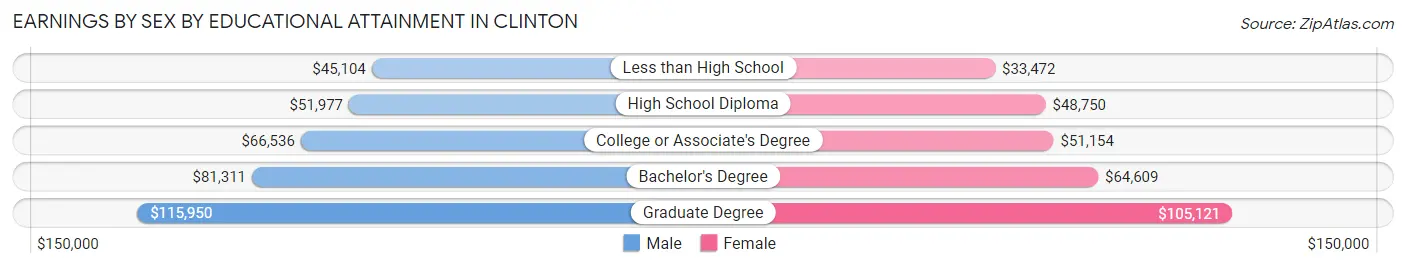
Earnings by Sex by Educational Attainment in Clinton
Average earnings in Clinton are $66,612 for men and $64,784 for women, a difference of 2.7%. Men with an educational attainment of graduate degree enjoy the highest average annual earnings of $115,950, while those with less than high school education earn the least with $45,104. Women with an educational attainment of graduate degree earn the most with the average annual earnings of $105,121, while those with less than high school education have the smallest earnings of $33,472.
| Educational Attainment | Male Income | Female Income |
| Less than High School | $45,104 | $33,472 |
| High School Diploma | $51,977 | $48,750 |
| College or Associate's Degree | $66,536 | $51,154 |
| Bachelor's Degree | $81,311 | $64,609 |
| Graduate Degree | $115,950 | $105,121 |
| Total | $66,612 | $64,784 |
Family Income in Clinton
Family Income Brackets in Clinton
According to the Clinton family income data, there are 2,872 families falling into the $100,000 to $149,999 income range, which is the most common income bracket and makes up 28.4% of all families. Conversely, the $15,000 to $24,999 income bracket is the least frequent group with only 121 families (1.2%) belonging to this category.
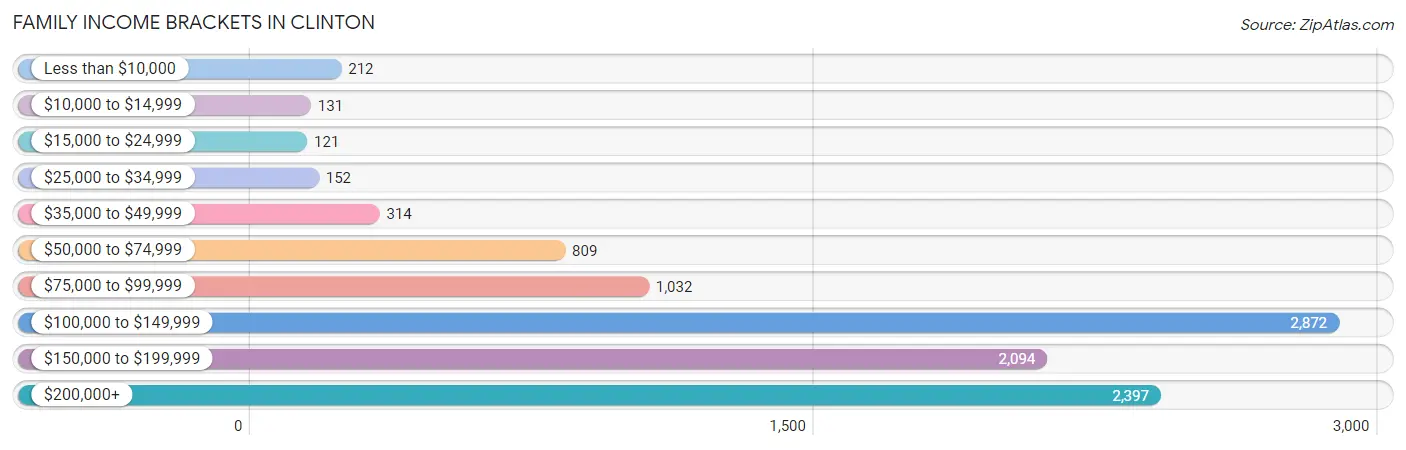
| Income Bracket | # Families | % Families |
| Less than $10,000 | 212 | 2.1% |
| $10,000 to $14,999 | 131 | 1.3% |
| $15,000 to $24,999 | 121 | 1.2% |
| $25,000 to $34,999 | 152 | 1.5% |
| $35,000 to $49,999 | 314 | 3.1% |
| $50,000 to $74,999 | 809 | 8.0% |
| $75,000 to $99,999 | 1,032 | 10.2% |
| $100,000 to $149,999 | 2,872 | 28.4% |
| $150,000 to $199,999 | 2,094 | 20.7% |
| $200,000+ | 2,397 | 23.7% |
Family Income by Famaliy Size in Clinton
5-person families (892 | 8.8%) account for the highest median family income in Clinton with $183,095 per family, while 2-person families (3,951 | 39.1%) have the highest median income of $57,676 per family member.
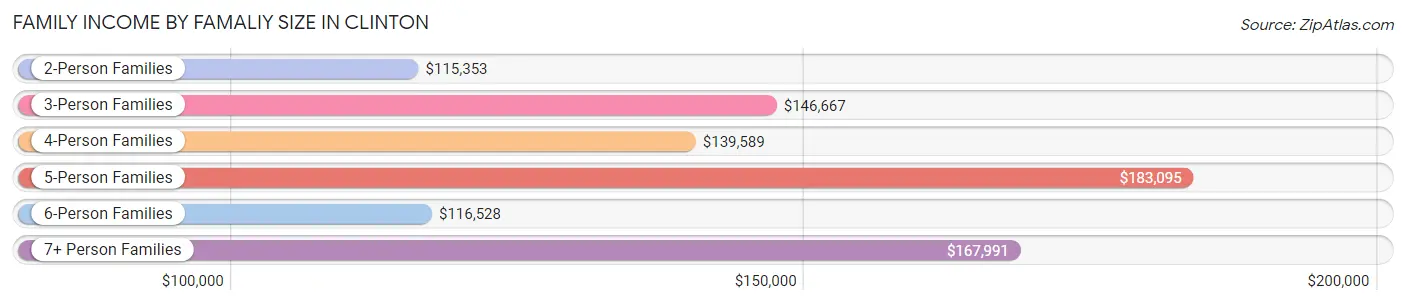
| Income Bracket | # Families | Median Income |
| 2-Person Families | 3,951 (39.1%) | $115,353 |
| 3-Person Families | 2,698 (26.7%) | $146,667 |
| 4-Person Families | 1,864 (18.4%) | $139,589 |
| 5-Person Families | 892 (8.8%) | $183,095 |
| 6-Person Families | 354 (3.5%) | $116,528 |
| 7+ Person Families | 355 (3.5%) | $167,991 |
| Total | 10,114 (100.0%) | $137,985 |
Family Income by Number of Earners in Clinton
The median family income in Clinton is $137,985, with families comprising 3+ earners (2,137) having the highest median family income of $169,866, while families with no earners (1,094) have the lowest median family income of $64,688, accounting for 21.1% and 10.8% of families, respectively.
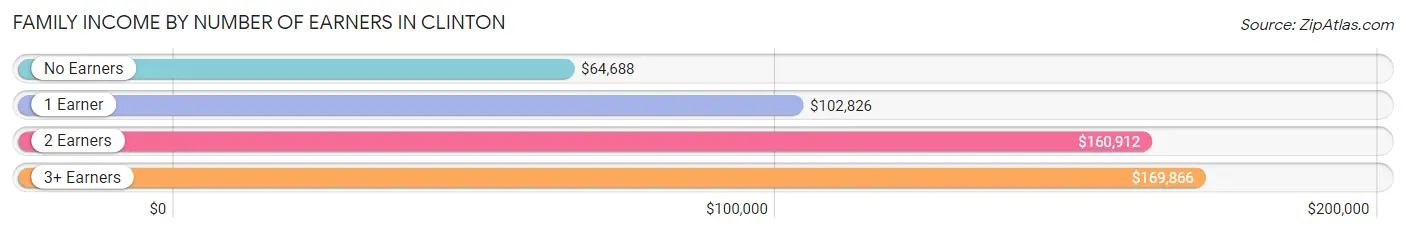
| Number of Earners | # Families | Median Income |
| No Earners | 1,094 (10.8%) | $64,688 |
| 1 Earner | 2,492 (24.6%) | $102,826 |
| 2 Earners | 4,391 (43.4%) | $160,912 |
| 3+ Earners | 2,137 (21.1%) | $169,866 |
| Total | 10,114 (100.0%) | $137,985 |
Household Income in Clinton
Household Income Brackets in Clinton
With 3,415 households falling in the category, the $100,000 to $149,999 income range is the most frequent in Clinton, accounting for 25.1% of all households. In contrast, only 190 households (1.4%) fall into the $10,000 to $14,999 income bracket, making it the least populous group.
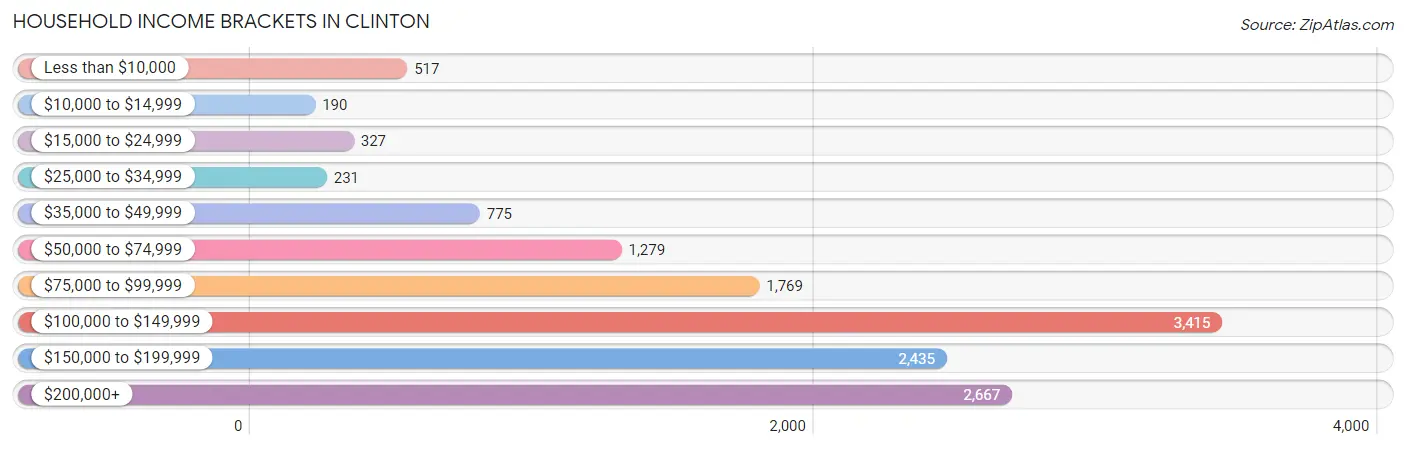
| Income Bracket | # Households | % Households |
| Less than $10,000 | 517 | 3.8% |
| $10,000 to $14,999 | 190 | 1.4% |
| $15,000 to $24,999 | 327 | 2.4% |
| $25,000 to $34,999 | 231 | 1.7% |
| $35,000 to $49,999 | 775 | 5.7% |
| $50,000 to $74,999 | 1,279 | 9.4% |
| $75,000 to $99,999 | 1,769 | 13.0% |
| $100,000 to $149,999 | 3,415 | 25.1% |
| $150,000 to $199,999 | 2,435 | 17.9% |
| $200,000+ | 2,667 | 19.6% |
Household Income by Householder Age in Clinton
The median household income in Clinton is $122,266, with the highest median household income of $139,086 found in the 45 to 64 years age bracket for the primary householder. A total of 6,860 households (50.4%) fall into this category. Meanwhile, the 15 to 24 years age bracket for the primary householder has the lowest median household income of $0, with 37 households (0.3%) in this group.
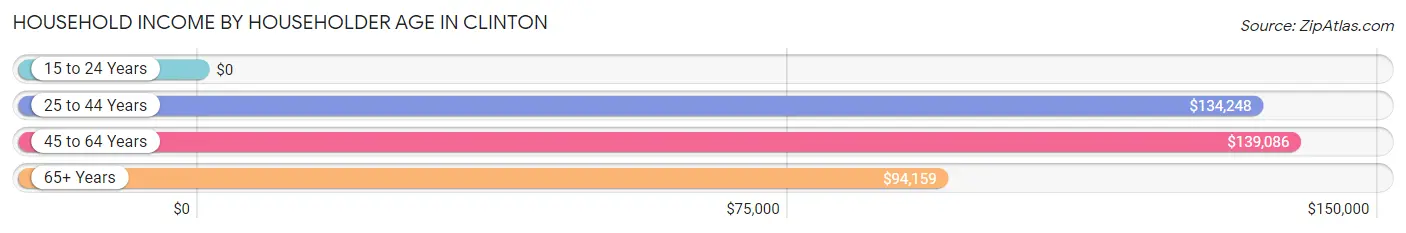
| Income Bracket | # Households | Median Income |
| 15 to 24 Years | 37 (0.3%) | $0 |
| 25 to 44 Years | 2,829 (20.8%) | $134,248 |
| 45 to 64 Years | 6,860 (50.4%) | $139,086 |
| 65+ Years | 3,879 (28.5%) | $94,159 |
| Total | 13,605 (100.0%) | $122,266 |
Poverty in Clinton
Income Below Poverty by Sex and Age in Clinton
With 7.1% poverty level for males and 6.0% for females among the residents of Clinton, 75 year old and over males and 75 year old and over females are the most vulnerable to poverty, with 145 males (18.0%) and 222 females (16.3%) in their respective age groups living below the poverty level.
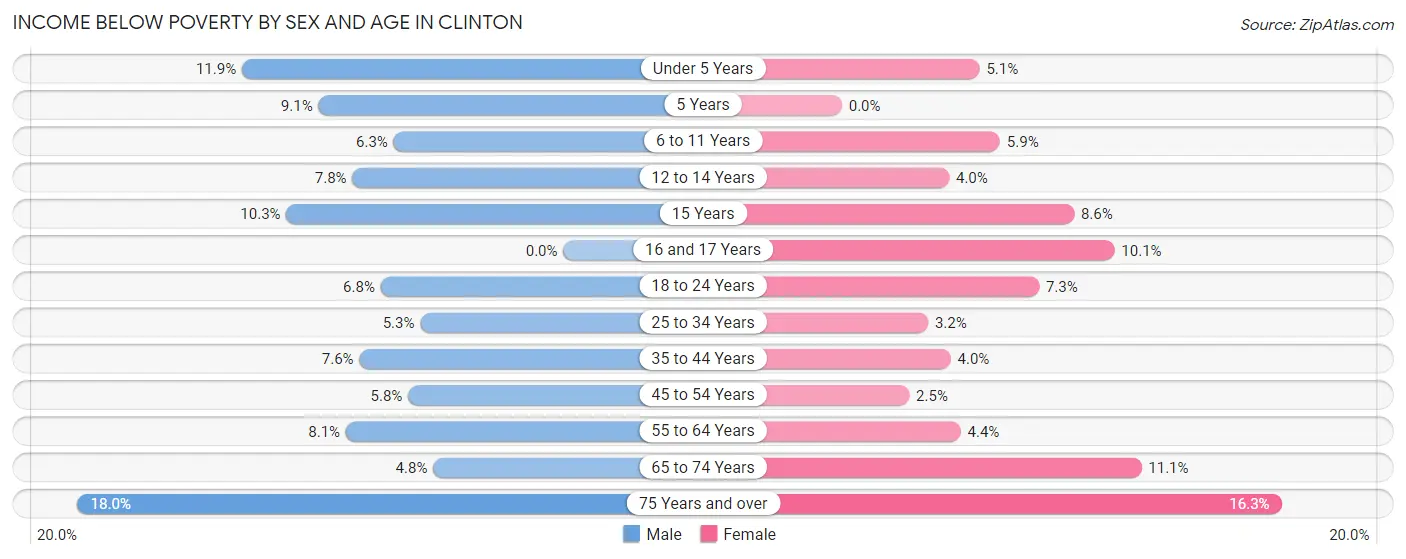
| Age Bracket | Male | Female |
| Under 5 Years | 95 (11.9%) | 33 (5.1%) |
| 5 Years | 22 (9.1%) | 0 (0.0%) |
| 6 to 11 Years | 66 (6.3%) | 70 (5.9%) |
| 12 to 14 Years | 81 (7.8%) | 36 (4.0%) |
| 15 Years | 22 (10.3%) | 25 (8.6%) |
| 16 and 17 Years | 0 (0.0%) | 41 (10.1%) |
| 18 to 24 Years | 123 (6.8%) | 120 (7.3%) |
| 25 to 34 Years | 137 (5.3%) | 61 (3.2%) |
| 35 to 44 Years | 183 (7.6%) | 105 (4.0%) |
| 45 to 54 Years | 178 (5.8%) | 78 (2.5%) |
| 55 to 64 Years | 222 (8.1%) | 155 (4.4%) |
| 65 to 74 Years | 103 (4.8%) | 270 (11.1%) |
| 75 Years and over | 145 (18.0%) | 222 (16.3%) |
| Total | 1,377 (7.1%) | 1,216 (6.0%) |
Income Above Poverty by Sex and Age in Clinton
According to the poverty statistics in Clinton, males aged 16 and 17 years and females aged 5 years are the age groups that are most secure financially, with 100.0% of males and 100.0% of females in these age groups living above the poverty line.
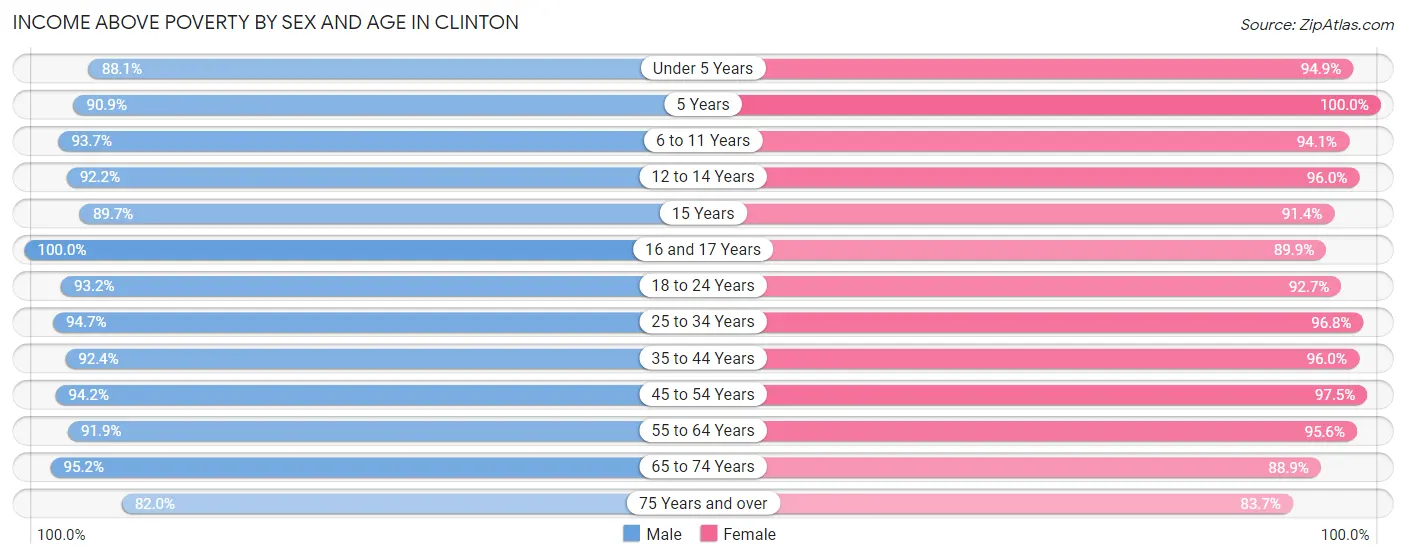
| Age Bracket | Male | Female |
| Under 5 Years | 701 (88.1%) | 613 (94.9%) |
| 5 Years | 220 (90.9%) | 107 (100.0%) |
| 6 to 11 Years | 981 (93.7%) | 1,123 (94.1%) |
| 12 to 14 Years | 954 (92.2%) | 868 (96.0%) |
| 15 Years | 192 (89.7%) | 265 (91.4%) |
| 16 and 17 Years | 435 (100.0%) | 364 (89.9%) |
| 18 to 24 Years | 1,692 (93.2%) | 1,520 (92.7%) |
| 25 to 34 Years | 2,443 (94.7%) | 1,844 (96.8%) |
| 35 to 44 Years | 2,235 (92.4%) | 2,493 (96.0%) |
| 45 to 54 Years | 2,911 (94.2%) | 3,037 (97.5%) |
| 55 to 64 Years | 2,528 (91.9%) | 3,357 (95.6%) |
| 65 to 74 Years | 2,031 (95.2%) | 2,157 (88.9%) |
| 75 Years and over | 659 (82.0%) | 1,138 (83.7%) |
| Total | 17,982 (92.9%) | 18,886 (94.0%) |
Income Below Poverty Among Married-Couple Families in Clinton
The poverty statistics for married-couple families in Clinton show that 3.6% or 234 of the total 6,572 families live below the poverty line. Families with 3 or 4 children have the highest poverty rate of 11.6%, comprising of 60 families. On the other hand, families with 5 or more children have the lowest poverty rate of 0.0%, which includes 0 families.
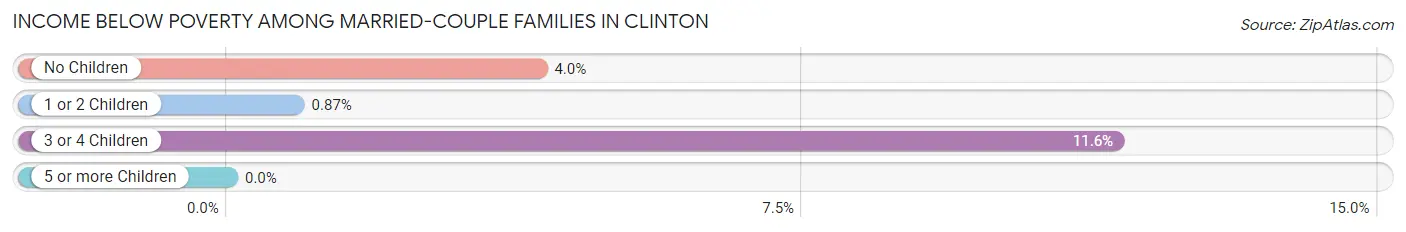
| Children | Above Poverty | Below Poverty |
| No Children | 3,679 (96.0%) | 155 (4.0%) |
| 1 or 2 Children | 2,177 (99.1%) | 19 (0.9%) |
| 3 or 4 Children | 458 (88.4%) | 60 (11.6%) |
| 5 or more Children | 24 (100.0%) | 0 (0.0%) |
| Total | 6,338 (96.4%) | 234 (3.6%) |
Income Below Poverty Among Single-Parent Households in Clinton
According to the poverty data in Clinton, 16.4% or 150 single-father households and 3.4% or 90 single-mother households are living below the poverty line. Among single-father households, those with 1 or 2 children have the highest poverty rate, with 89 households (17.2%) experiencing poverty. Likewise, among single-mother households, those with 1 or 2 children have the highest poverty rate, with 79 households (7.1%) falling below the poverty line.
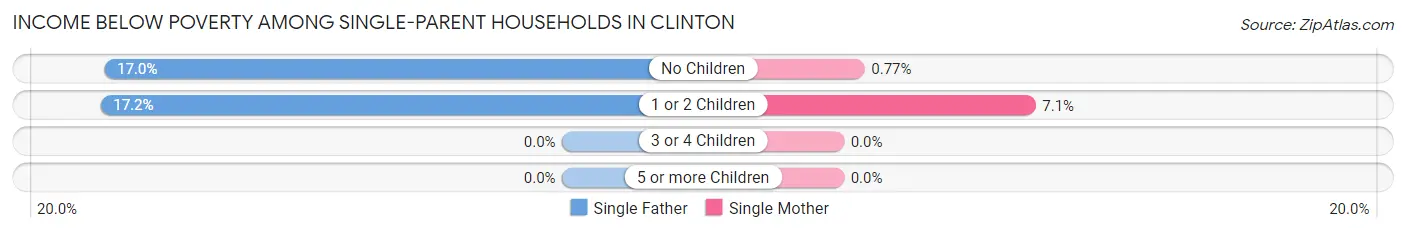
| Children | Single Father | Single Mother |
| No Children | 61 (17.0%) | 11 (0.8%) |
| 1 or 2 Children | 89 (17.2%) | 79 (7.1%) |
| 3 or 4 Children | 0 (0.0%) | 0 (0.0%) |
| 5 or more Children | 0 (0.0%) | 0 (0.0%) |
| Total | 150 (16.4%) | 90 (3.4%) |
Income Below Poverty Among Married-Couple vs Single-Parent Households in Clinton
The poverty data for Clinton shows that 234 of the married-couple family households (3.6%) and 240 of the single-parent households (6.8%) are living below the poverty level. Within the married-couple family households, those with 3 or 4 children have the highest poverty rate, with 60 households (11.6%) falling below the poverty line. Among the single-parent households, those with 1 or 2 children have the highest poverty rate, with 168 household (10.3%) living below poverty.
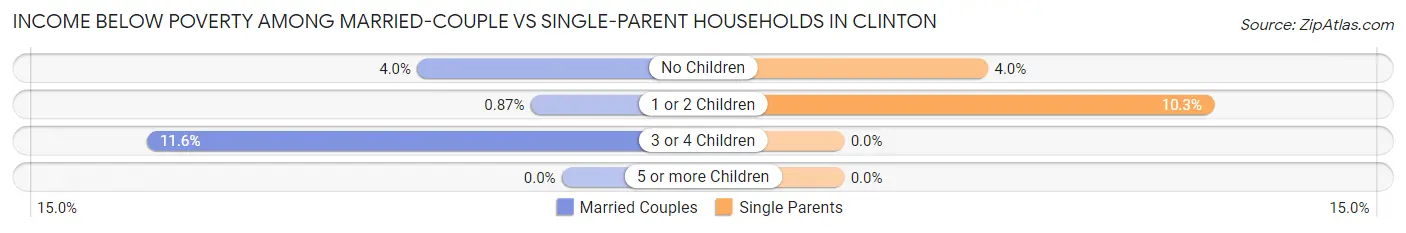
| Children | Married-Couple Families | Single-Parent Households |
| No Children | 155 (4.0%) | 72 (4.0%) |
| 1 or 2 Children | 19 (0.9%) | 168 (10.3%) |
| 3 or 4 Children | 60 (11.6%) | 0 (0.0%) |
| 5 or more Children | 0 (0.0%) | 0 (0.0%) |
| Total | 234 (3.6%) | 240 (6.8%) |
Race in Clinton
The most populous races in Clinton are Black / African American (31,180 | 77.5%), Hispanic or Latino (3,897 | 9.7%), and White / Caucasian (3,098 | 7.7%).
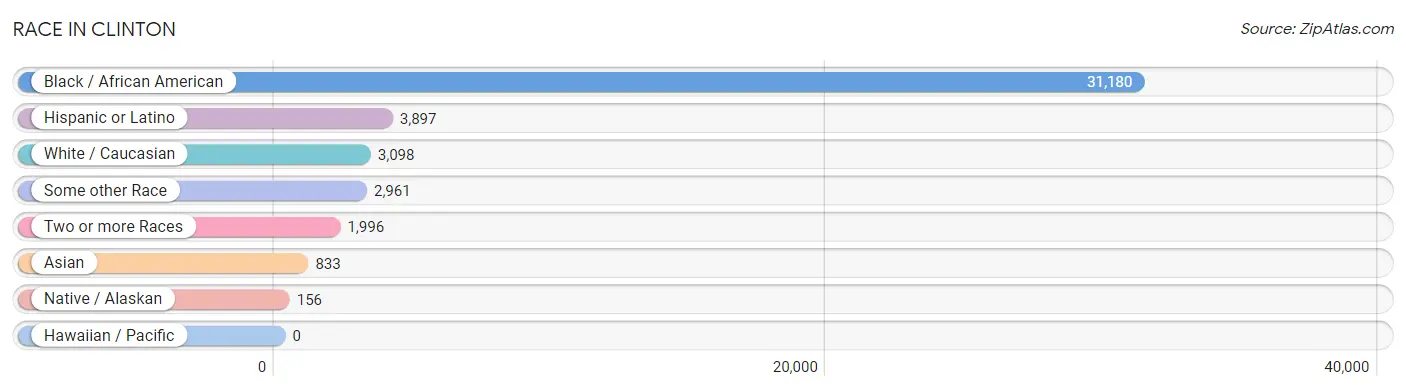
| Race | # Population | % Population |
| Asian | 833 | 2.1% |
| Black / African American | 31,180 | 77.5% |
| Hawaiian / Pacific | 0 | 0.0% |
| Hispanic or Latino | 3,897 | 9.7% |
| Native / Alaskan | 156 | 0.4% |
| White / Caucasian | 3,098 | 7.7% |
| Two or more Races | 1,996 | 5.0% |
| Some other Race | 2,961 | 7.4% |
| Total | 40,224 | 100.0% |
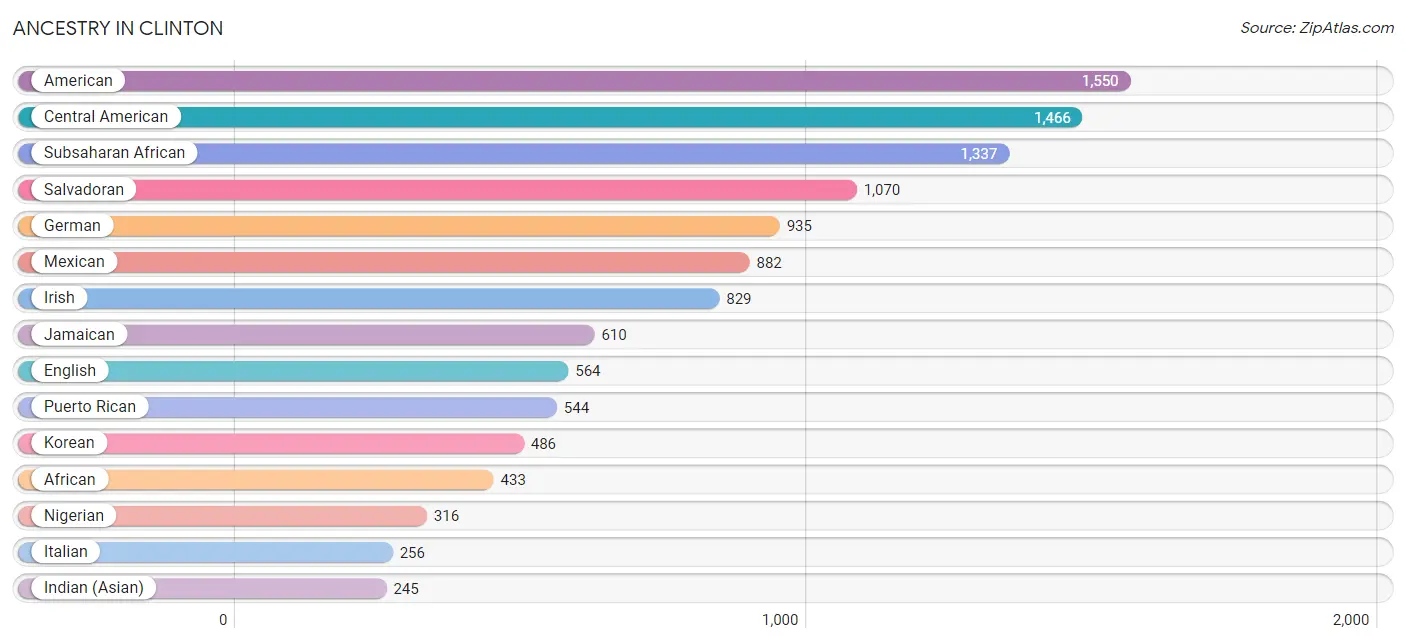
Ancestry in Clinton
The most populous ancestries reported in Clinton are American (1,550 | 3.8%), Central American (1,466 | 3.6%), Subsaharan African (1,337 | 3.3%), Salvadoran (1,070 | 2.7%), and German (935 | 2.3%), together accounting for 15.8% of all Clinton residents.
| Ancestry | # Population | % Population |
| African | 433 | 1.1% |
| Albanian | 8 | 0.0% |
| American | 1,550 | 3.8% |
| Arapaho | 24 | 0.1% |
| Argentinean | 6 | 0.0% |
| Austrian | 7 | 0.0% |
| Bahamian | 47 | 0.1% |
| Bhutanese | 172 | 0.4% |
| Bolivian | 51 | 0.1% |
| British | 11 | 0.0% |
| British West Indian | 131 | 0.3% |
| Burmese | 34 | 0.1% |
| Cape Verdean | 14 | 0.0% |
| Central American | 1,466 | 3.6% |
| Central American Indian | 43 | 0.1% |
| Cherokee | 149 | 0.4% |
| Chilean | 13 | 0.0% |
| Colombian | 10 | 0.0% |
| Costa Rican | 25 | 0.1% |
| Croatian | 10 | 0.0% |
| Cuban | 174 | 0.4% |
| Danish | 12 | 0.0% |
| Dominican | 197 | 0.5% |
| Dutch | 21 | 0.1% |
| English | 564 | 1.4% |
| Ethiopian | 92 | 0.2% |
| European | 64 | 0.2% |
| Finnish | 7 | 0.0% |
| French | 11 | 0.0% |
| French Canadian | 19 | 0.1% |
| German | 935 | 2.3% |
| German Russian | 33 | 0.1% |
| Ghanaian | 160 | 0.4% |
| Greek | 17 | 0.0% |
| Guatemalan | 183 | 0.4% |
| Guyanese | 157 | 0.4% |
| Haitian | 84 | 0.2% |
| Honduran | 29 | 0.1% |
| Indian (Asian) | 245 | 0.6% |
| Irish | 829 | 2.1% |
| Iroquois | 10 | 0.0% |
| Italian | 256 | 0.6% |
| Jamaican | 610 | 1.5% |
| Kenyan | 10 | 0.0% |
| Korean | 486 | 1.2% |
| Lithuanian | 22 | 0.1% |
| Mexican | 882 | 2.2% |
| Native Hawaiian | 10 | 0.0% |
| Nigerian | 316 | 0.8% |
| Norwegian | 33 | 0.1% |
| Pakistani | 95 | 0.2% |
| Panamanian | 159 | 0.4% |
| Pennsylvania German | 7 | 0.0% |
| Peruvian | 101 | 0.3% |
| Polish | 133 | 0.3% |
| Portuguese | 17 | 0.0% |
| Puerto Rican | 544 | 1.3% |
| Russian | 14 | 0.0% |
| Salvadoran | 1,070 | 2.7% |
| Scandinavian | 18 | 0.0% |
| Scotch-Irish | 20 | 0.1% |
| Scottish | 79 | 0.2% |
| Senegalese | 7 | 0.0% |
| Sioux | 9 | 0.0% |
| South American | 181 | 0.4% |
| Spaniard | 28 | 0.1% |
| Spanish | 27 | 0.1% |
| Sri Lankan | 102 | 0.3% |
| Subsaharan African | 1,337 | 3.3% |
| Swedish | 11 | 0.0% |
| Thai | 32 | 0.1% |
| Trinidadian and Tobagonian | 150 | 0.4% |
| West Indian | 91 | 0.2% | View All 73 Rows |
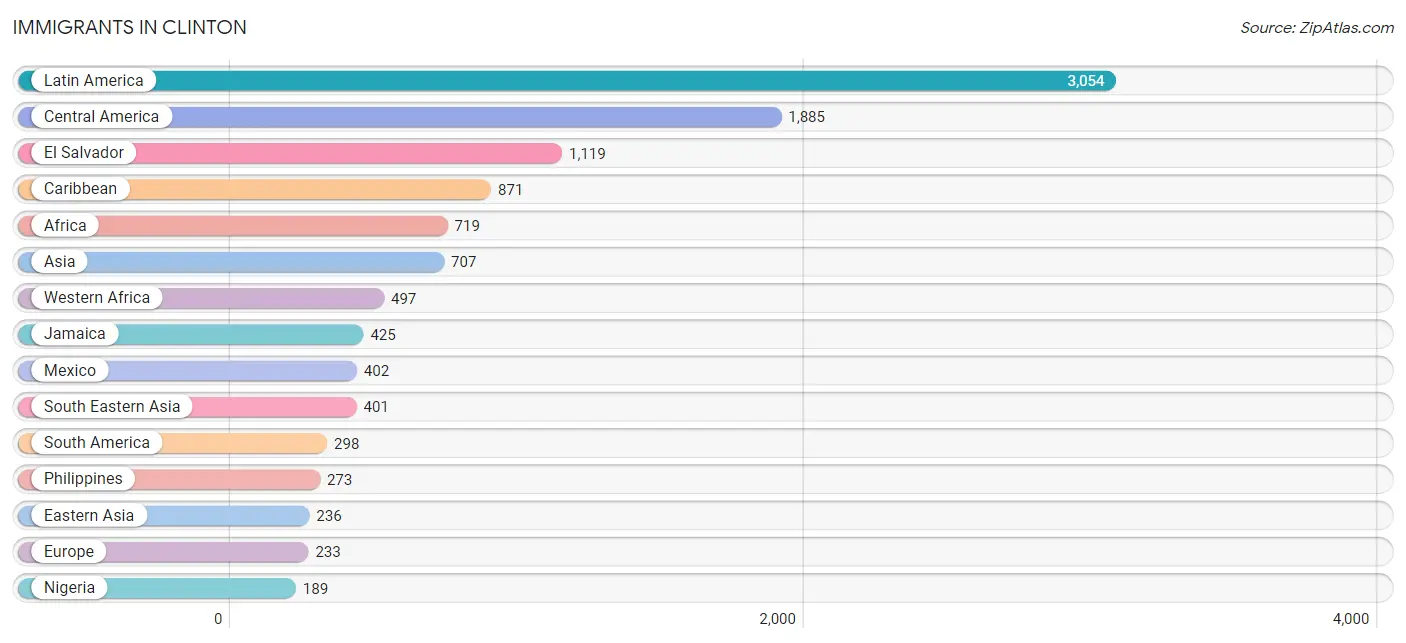
Immigrants in Clinton
The most numerous immigrant groups reported in Clinton came from Latin America (3,054 | 7.6%), Central America (1,885 | 4.7%), El Salvador (1,119 | 2.8%), Caribbean (871 | 2.2%), and Africa (719 | 1.8%), together accounting for 19.0% of all Clinton residents.
| Immigration Origin | # Population | % Population |
| Africa | 719 | 1.8% |
| Albania | 8 | 0.0% |
| Argentina | 6 | 0.0% |
| Asia | 707 | 1.8% |
| Bahamas | 39 | 0.1% |
| Barbados | 25 | 0.1% |
| Bolivia | 18 | 0.0% |
| Canada | 26 | 0.1% |
| Caribbean | 871 | 2.2% |
| Central America | 1,885 | 4.7% |
| China | 147 | 0.4% |
| Colombia | 10 | 0.0% |
| Cuba | 105 | 0.3% |
| Dominican Republic | 29 | 0.1% |
| Eastern Africa | 140 | 0.4% |
| Eastern Asia | 236 | 0.6% |
| Eastern Europe | 8 | 0.0% |
| El Salvador | 1,119 | 2.8% |
| England | 9 | 0.0% |
| Ethiopia | 65 | 0.2% |
| Europe | 233 | 0.6% |
| France | 115 | 0.3% |
| Germany | 46 | 0.1% |
| Ghana | 122 | 0.3% |
| Grenada | 10 | 0.0% |
| Guatemala | 114 | 0.3% |
| Guyana | 102 | 0.3% |
| Honduras | 66 | 0.2% |
| India | 12 | 0.0% |
| Italy | 50 | 0.1% |
| Jamaica | 425 | 1.1% |
| Japan | 49 | 0.1% |
| Kenya | 19 | 0.1% |
| Korea | 40 | 0.1% |
| Latin America | 3,054 | 7.6% |
| Mexico | 402 | 1.0% |
| Netherlands | 5 | 0.0% |
| Nicaragua | 25 | 0.1% |
| Nigeria | 189 | 0.5% |
| Northern Africa | 71 | 0.2% |
| Northern Europe | 9 | 0.0% |
| Pakistan | 58 | 0.1% |
| Panama | 159 | 0.4% |
| Peru | 162 | 0.4% |
| Philippines | 273 | 0.7% |
| Sierra Leone | 186 | 0.5% |
| Somalia | 21 | 0.1% |
| South America | 298 | 0.7% |
| South Central Asia | 70 | 0.2% |
| South Eastern Asia | 401 | 1.0% |
| Southern Europe | 50 | 0.1% |
| St. Vincent and the Grenadines | 94 | 0.2% |
| Sudan | 71 | 0.2% |
| Taiwan | 18 | 0.0% |
| Thailand | 60 | 0.2% |
| Trinidad and Tobago | 111 | 0.3% |
| Vietnam | 68 | 0.2% |
| Western Africa | 497 | 1.2% |
| Western Europe | 166 | 0.4% |
| Zimbabwe | 12 | 0.0% | View All 60 Rows |
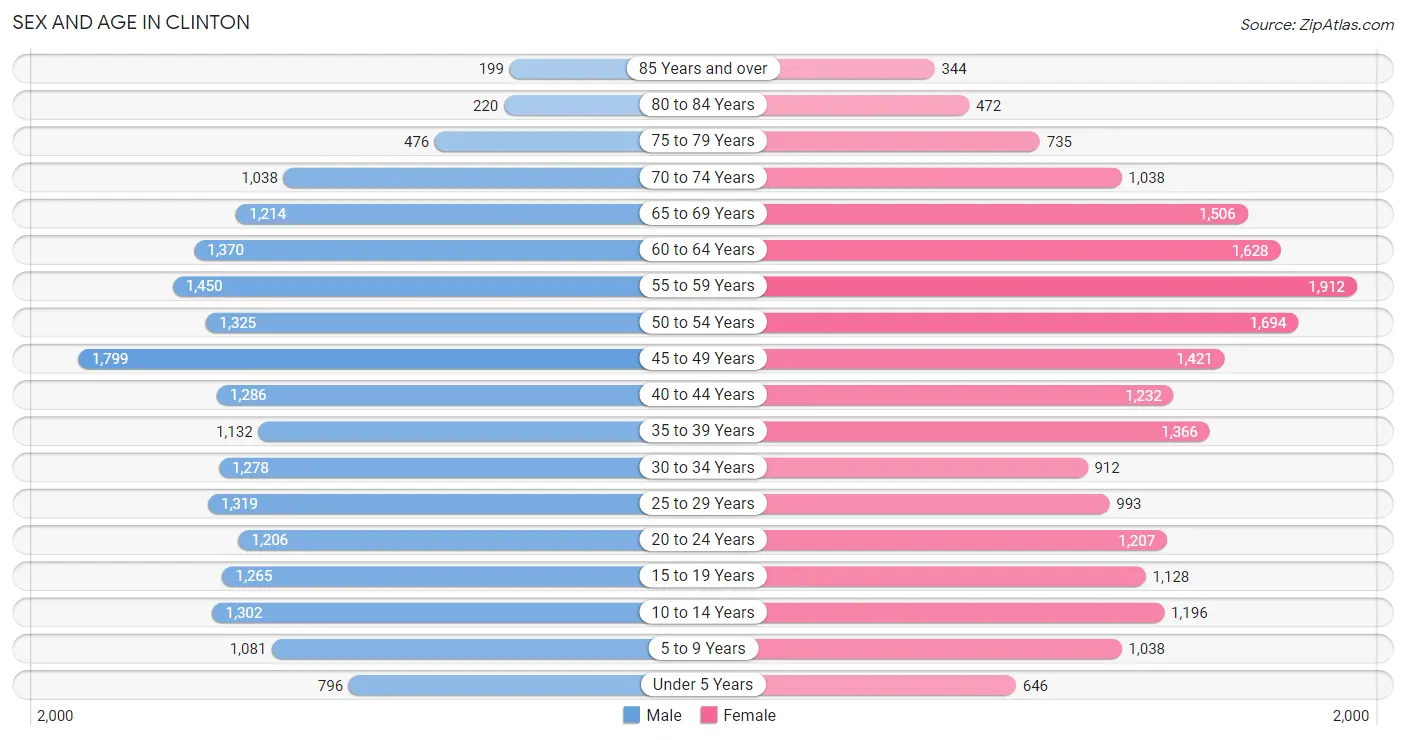
Sex and Age in Clinton
Sex and Age in Clinton
The most populous age groups in Clinton are 45 to 49 Years (1,799 | 9.1%) for men and 55 to 59 Years (1,912 | 9.3%) for women.
| Age Bracket | Male | Female |
| Under 5 Years | 796 (4.0%) | 646 (3.2%) |
| 5 to 9 Years | 1,081 (5.5%) | 1,038 (5.1%) |
| 10 to 14 Years | 1,302 (6.6%) | 1,196 (5.8%) |
| 15 to 19 Years | 1,265 (6.4%) | 1,128 (5.5%) |
| 20 to 24 Years | 1,206 (6.1%) | 1,207 (5.9%) |
| 25 to 29 Years | 1,319 (6.7%) | 993 (4.9%) |
| 30 to 34 Years | 1,278 (6.5%) | 912 (4.5%) |
| 35 to 39 Years | 1,132 (5.7%) | 1,366 (6.7%) |
| 40 to 44 Years | 1,286 (6.5%) | 1,232 (6.0%) |
| 45 to 49 Years | 1,799 (9.1%) | 1,421 (6.9%) |
| 50 to 54 Years | 1,325 (6.7%) | 1,694 (8.3%) |
| 55 to 59 Years | 1,450 (7.3%) | 1,912 (9.3%) |
| 60 to 64 Years | 1,370 (6.9%) | 1,628 (8.0%) |
| 65 to 69 Years | 1,214 (6.1%) | 1,506 (7.4%) |
| 70 to 74 Years | 1,038 (5.2%) | 1,038 (5.1%) |
| 75 to 79 Years | 476 (2.4%) | 735 (3.6%) |
| 80 to 84 Years | 220 (1.1%) | 472 (2.3%) |
| 85 Years and over | 199 (1.0%) | 344 (1.7%) |
| Total | 19,756 (100.0%) | 20,468 (100.0%) |
Families and Households in Clinton
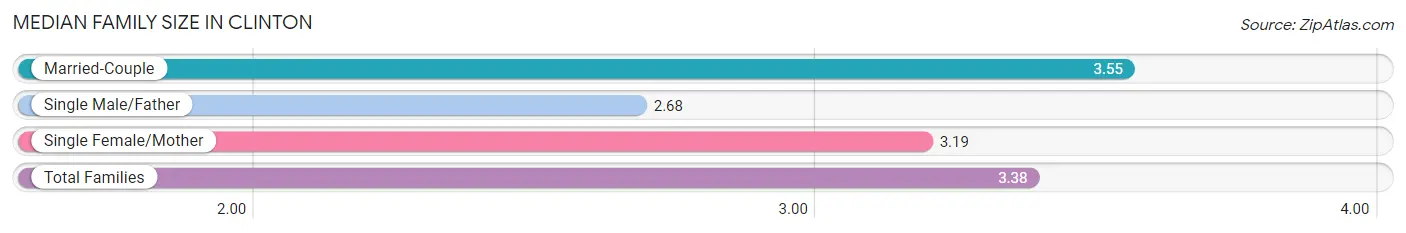
Median Family Size in Clinton
The median family size in Clinton is 3.38 persons per family, with married-couple families (6,572 | 65.0%) accounting for the largest median family size of 3.55 persons per family. On the other hand, single male/father families (915 | 9.0%) represent the smallest median family size with 2.68 persons per family.
| Family Type | # Families | Family Size |
| Married-Couple | 6,572 (65.0%) | 3.55 |
| Single Male/Father | 915 (9.0%) | 2.68 |
| Single Female/Mother | 2,627 (26.0%) | 3.19 |
| Total Families | 10,114 (100.0%) | 3.38 |
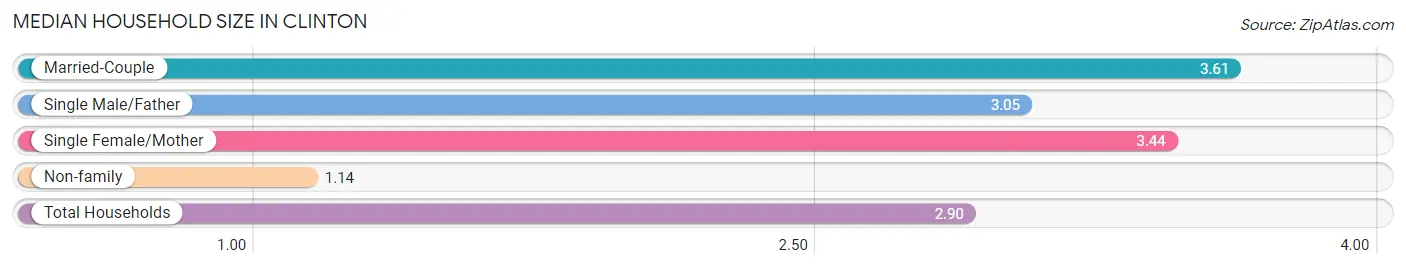
Median Household Size in Clinton
The median household size in Clinton is 2.90 persons per household, with married-couple households (6,572 | 48.3%) accounting for the largest median household size of 3.61 persons per household. non-family households (3,491 | 25.7%) represent the smallest median household size with 1.14 persons per household.
| Household Type | # Households | Household Size |
| Married-Couple | 6,572 (48.3%) | 3.61 |
| Single Male/Father | 915 (6.7%) | 3.05 |
| Single Female/Mother | 2,627 (19.3%) | 3.44 |
| Non-family | 3,491 (25.7%) | 1.14 |
| Total Households | 13,605 (100.0%) | 2.90 |
Household Size by Marriage Status in Clinton
Out of a total of 13,605 households in Clinton, 10,114 (74.3%) are family households, while 3,491 (25.7%) are nonfamily households. The most numerous type of family households are 2-person households, comprising 3,600, and the most common type of nonfamily households are 1-person households, comprising 3,171.
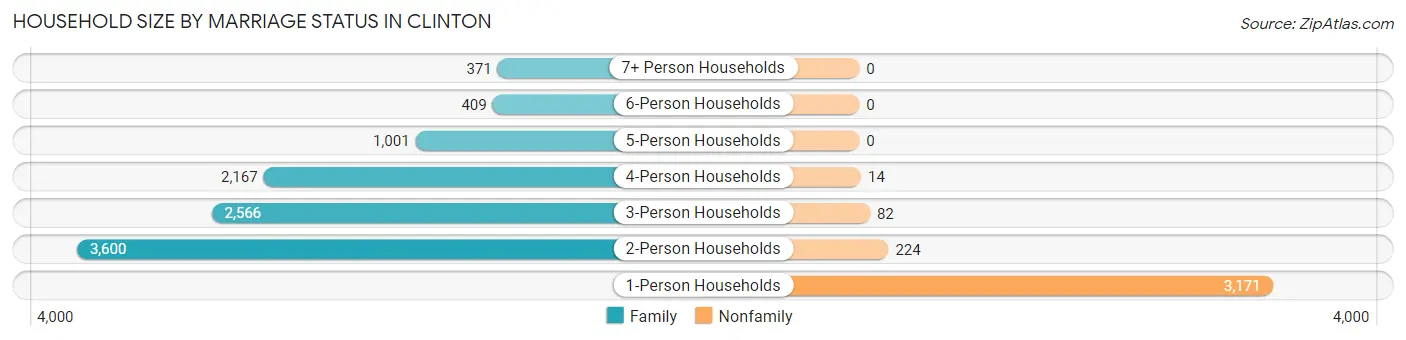
| Household Size | Family Households | Nonfamily Households |
| 1-Person Households | - | 3,171 (23.3%) |
| 2-Person Households | 3,600 (26.5%) | 224 (1.7%) |
| 3-Person Households | 2,566 (18.9%) | 82 (0.6%) |
| 4-Person Households | 2,167 (15.9%) | 14 (0.1%) |
| 5-Person Households | 1,001 (7.4%) | 0 (0.0%) |
| 6-Person Households | 409 (3.0%) | 0 (0.0%) |
| 7+ Person Households | 371 (2.7%) | 0 (0.0%) |
| Total | 10,114 (74.3%) | 3,491 (25.7%) |
Female Fertility in Clinton
Fertility by Age in Clinton
Average fertility rate in Clinton is 28.0 births per 1,000 women. Women in the age bracket of 20 to 34 years have the highest fertility rate with 44.0 births per 1,000 women. Women in the age bracket of 20 to 34 years acount for 55.9% of all women with births.
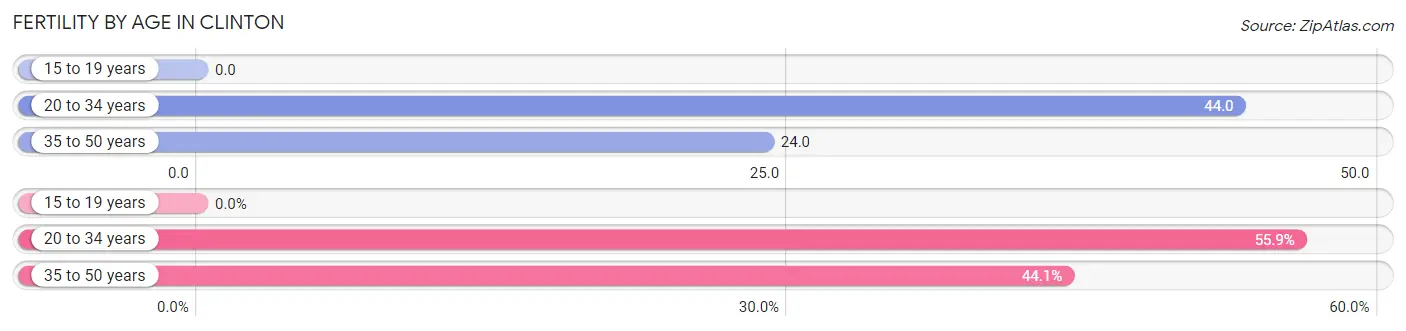
| Age Bracket | Women with Births | Births / 1,000 Women |
| 15 to 19 years | 0 (0.0%) | 0.0 |
| 20 to 34 years | 137 (55.9%) | 44.0 |
| 35 to 50 years | 108 (44.1%) | 24.0 |
| Total | 245 (100.0%) | 28.0 |
Fertility by Age by Marriage Status in Clinton
51.8% of women with births (245) in Clinton are married. The highest percentage of unmarried women with births falls into 20 to 34 years age bracket with 61.3% of them unmarried at the time of birth, while the lowest percentage of unmarried women with births belong to 35 to 50 years age bracket with 31.5% of them unmarried.
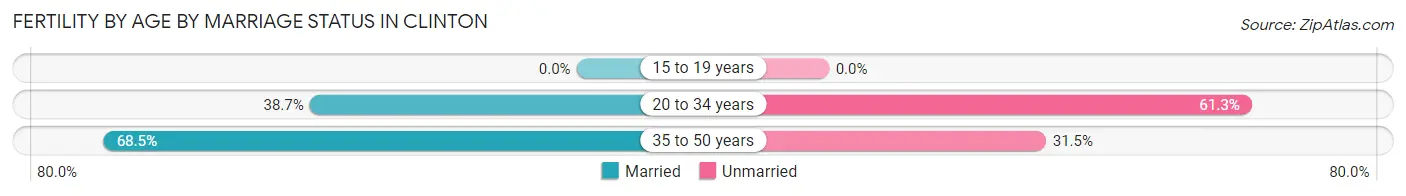
| Age Bracket | Married | Unmarried |
| 15 to 19 years | 0 (0.0%) | 0 (0.0%) |
| 20 to 34 years | 53 (38.7%) | 84 (61.3%) |
| 35 to 50 years | 74 (68.5%) | 34 (31.5%) |
| Total | 127 (51.8%) | 118 (48.2%) |
Fertility by Education in Clinton
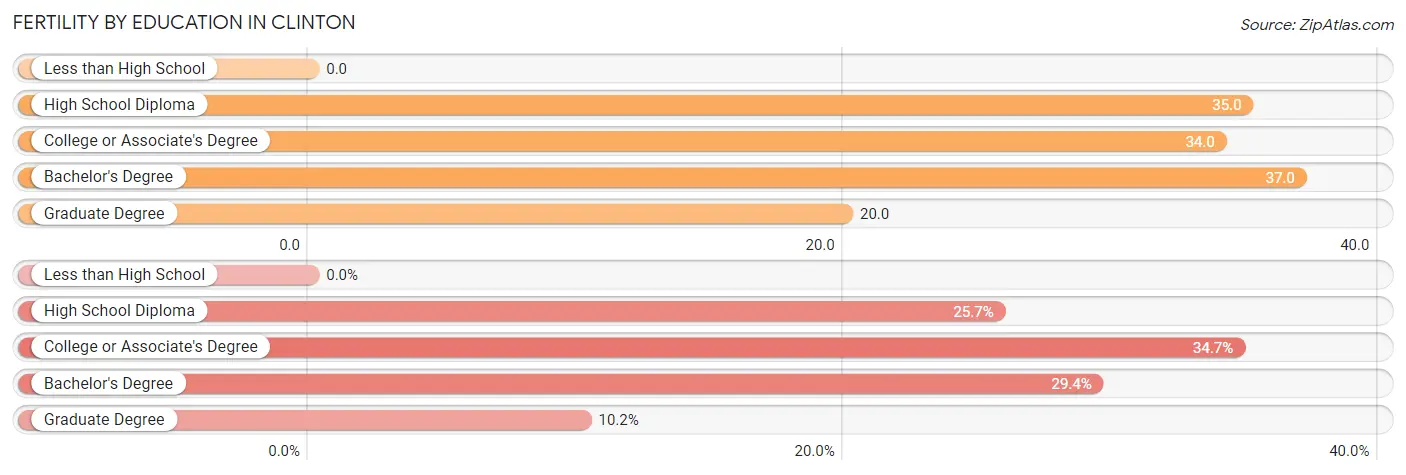
| Educational Attainment | Women with Births | Births / 1,000 Women |
| Less than High School | 0 (0.0%) | 0.0 |
| High School Diploma | 63 (25.7%) | 35.0 |
| College or Associate's Degree | 85 (34.7%) | 34.0 |
| Bachelor's Degree | 72 (29.4%) | 37.0 |
| Graduate Degree | 25 (10.2%) | 20.0 |
| Total | 245 (100.0%) | 28.0 |
Fertility by Education by Marriage Status in Clinton
48.2% of women with births in Clinton are unmarried. Women with the educational attainment of graduate degree are most likely to be married with 100.0% of them married at childbirth, while women with the educational attainment of high school diploma are least likely to be married with 93.6% of them unmarried at childbirth.
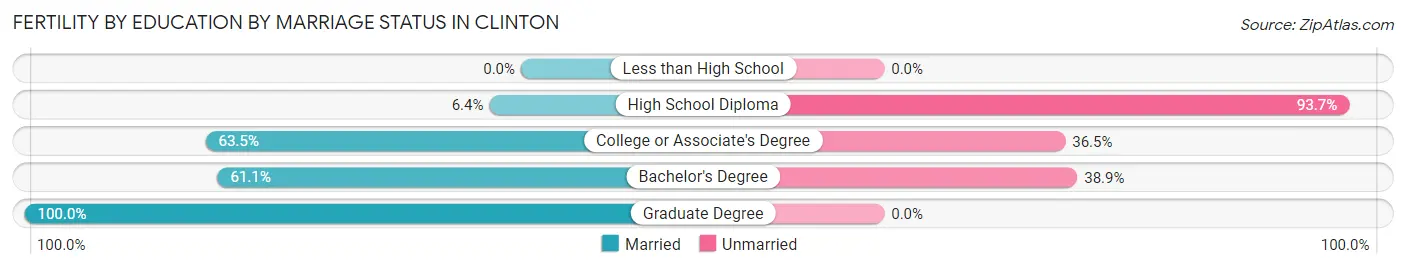
| Educational Attainment | Married | Unmarried |
| Less than High School | 0 (0.0%) | 0 (0.0%) |
| High School Diploma | 4 (6.4%) | 59 (93.6%) |
| College or Associate's Degree | 54 (63.5%) | 31 (36.5%) |
| Bachelor's Degree | 44 (61.1%) | 28 (38.9%) |
| Graduate Degree | 25 (100.0%) | 0 (0.0%) |
| Total | 127 (51.8%) | 118 (48.2%) |
Employment Characteristics in Clinton
Employment by Class of Employer in Clinton
Among the 21,255 employed individuals in Clinton, private company employees (10,438 | 49.1%), federal government employees (4,831 | 22.7%), and not-for-profit organizations (1,932 | 9.1%) make up the most common classes of employment.
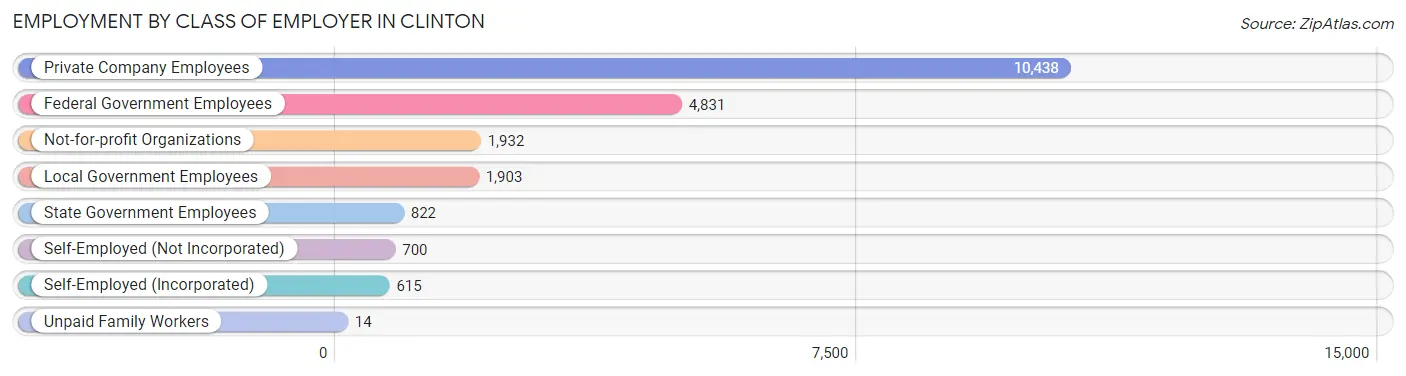
| Employer Class | # Employees | % Employees |
| Private Company Employees | 10,438 | 49.1% |
| Self-Employed (Incorporated) | 615 | 2.9% |
| Self-Employed (Not Incorporated) | 700 | 3.3% |
| Not-for-profit Organizations | 1,932 | 9.1% |
| Local Government Employees | 1,903 | 8.9% |
| State Government Employees | 822 | 3.9% |
| Federal Government Employees | 4,831 | 22.7% |
| Unpaid Family Workers | 14 | 0.1% |
| Total | 21,255 | 100.0% |
Employment Status by Age in Clinton
According to the labor force statistics for Clinton, out of the total population over 16 years of age (33,661), 67.5% or 22,721 individuals are in the labor force, with 5.7% or 1,295 of them unemployed. The age group with the highest labor force participation rate is 30 to 34 years, with 90.1% or 1,973 individuals in the labor force. Within the labor force, the 16 to 19 years age range has the highest percentage of unemployed individuals, with 33.9% or 214 of them being unemployed.
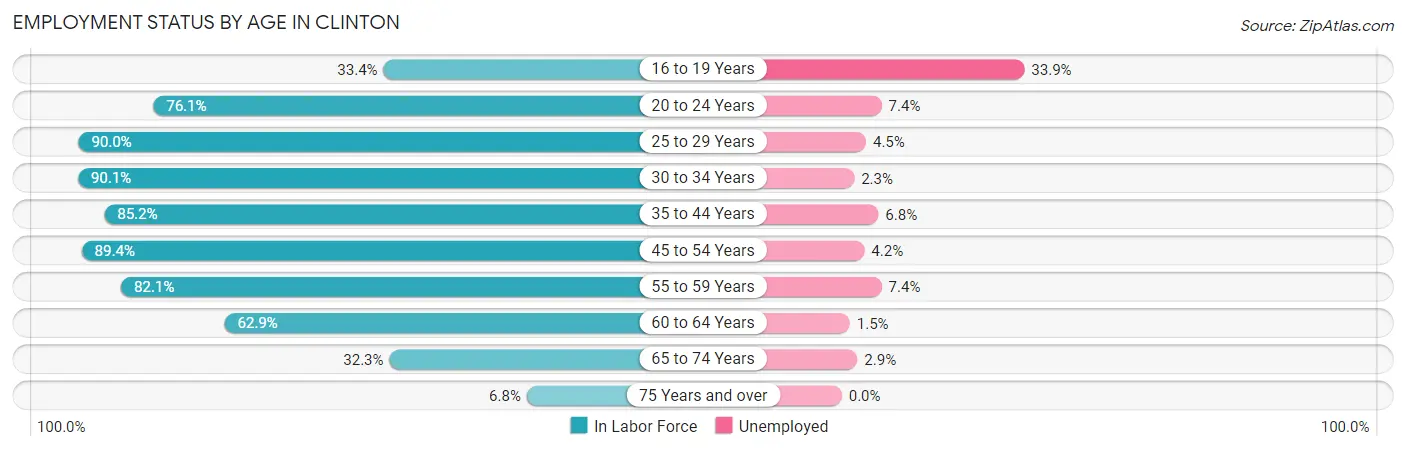
| Age Bracket | In Labor Force | Unemployed |
| 16 to 19 Years | 631 (33.4%) | 214 (33.9%) |
| 20 to 24 Years | 1,836 (76.1%) | 136 (7.4%) |
| 25 to 29 Years | 2,081 (90.0%) | 94 (4.5%) |
| 30 to 34 Years | 1,973 (90.1%) | 45 (2.3%) |
| 35 to 44 Years | 4,274 (85.2%) | 291 (6.8%) |
| 45 to 54 Years | 5,578 (89.4%) | 234 (4.2%) |
| 55 to 59 Years | 2,760 (82.1%) | 204 (7.4%) |
| 60 to 64 Years | 1,886 (62.9%) | 28 (1.5%) |
| 65 to 74 Years | 1,549 (32.3%) | 45 (2.9%) |
| 75 Years and over | 166 (6.8%) | 0 (0.0%) |
| Total | 22,721 (67.5%) | 1,295 (5.7%) |
Employment Status by Educational Attainment in Clinton
According to labor force statistics for Clinton, 83.9% of individuals (18,556) out of the total population between 25 and 64 years of age (22,117) are in the labor force, with 4.8% or 891 of them being unemployed. The group with the highest labor force participation rate are those with the educational attainment of bachelor's degree or higher, with 92.2% or 7,163 individuals in the labor force. Within the labor force, individuals with less than high school education have the highest percentage of unemployment, with 7.3% or 85 of them being unemployed.
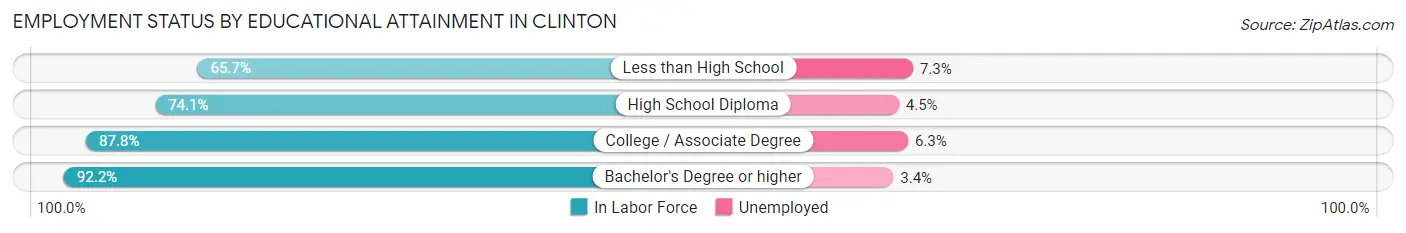
| Educational Attainment | In Labor Force | Unemployed |
| Less than High School | 1,170 (65.7%) | 130 (7.3%) |
| High School Diploma | 4,413 (74.1%) | 268 (4.5%) |
| College / Associate Degree | 5,805 (87.8%) | 417 (6.3%) |
| Bachelor's Degree or higher | 7,163 (92.2%) | 264 (3.4%) |
| Total | 18,556 (83.9%) | 1,062 (4.8%) |
Employment Occupations by Sex in Clinton
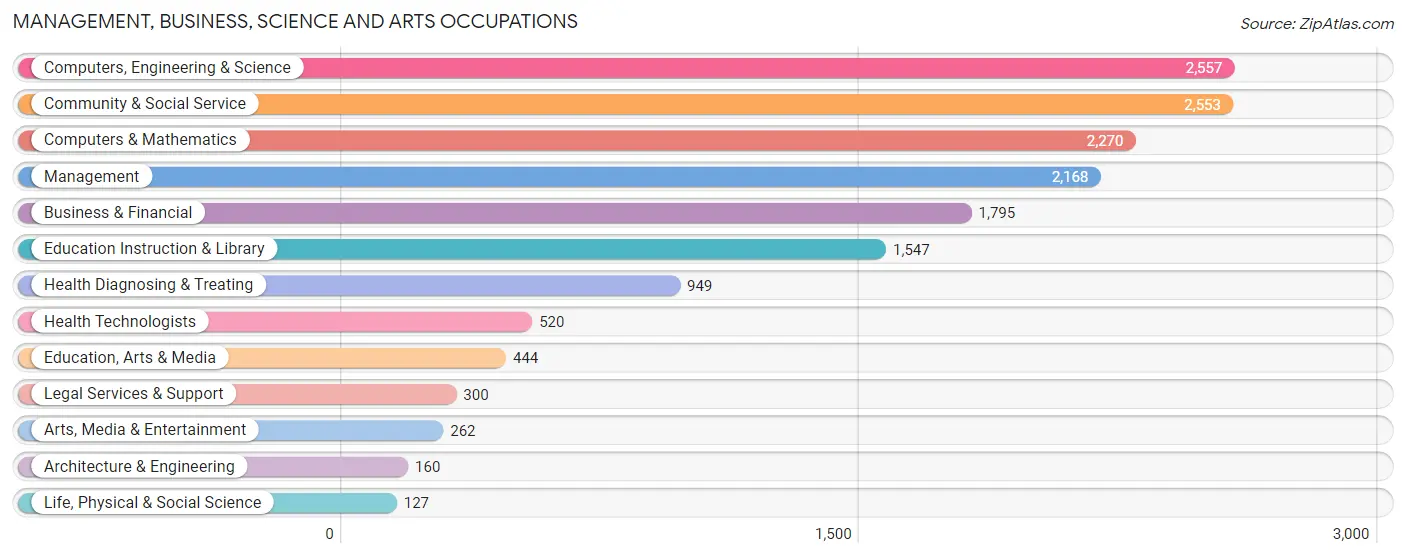
Management, Business, Science and Arts Occupations
The most common Management, Business, Science and Arts occupations in Clinton are Computers, Engineering & Science (2,557 | 12.0%), Community & Social Service (2,553 | 12.0%), Computers & Mathematics (2,270 | 10.7%), Management (2,168 | 10.2%), and Business & Financial (1,795 | 8.4%).
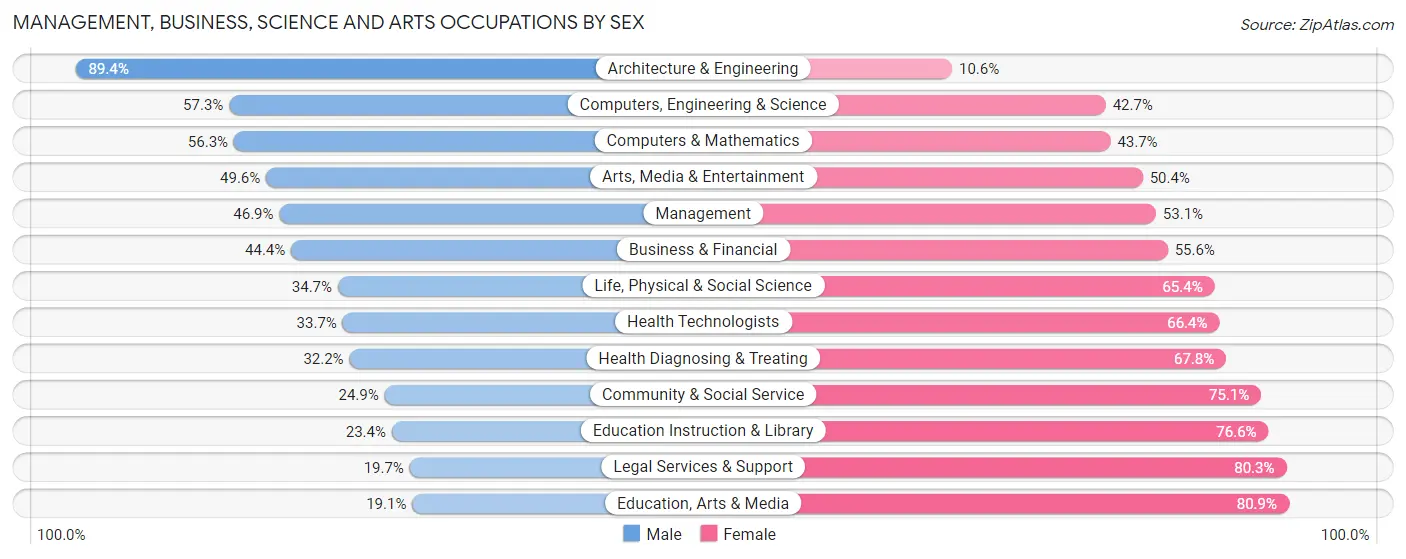
Management, Business, Science and Arts Occupations by Sex
Within the Management, Business, Science and Arts occupations in Clinton, the most male-oriented occupations are Architecture & Engineering (89.4%), Computers, Engineering & Science (57.3%), and Computers & Mathematics (56.3%), while the most female-oriented occupations are Education, Arts & Media (80.9%), Legal Services & Support (80.3%), and Education Instruction & Library (76.6%).
| Occupation | Male | Female |
| Management | 1,016 (46.9%) | 1,152 (53.1%) |
| Business & Financial | 797 (44.4%) | 998 (55.6%) |
| Computers, Engineering & Science | 1,466 (57.3%) | 1,091 (42.7%) |
| Computers & Mathematics | 1,279 (56.3%) | 991 (43.7%) |
| Architecture & Engineering | 143 (89.4%) | 17 (10.6%) |
| Life, Physical & Social Science | 44 (34.6%) | 83 (65.3%) |
| Community & Social Service | 636 (24.9%) | 1,917 (75.1%) |
| Education, Arts & Media | 85 (19.1%) | 359 (80.9%) |
| Legal Services & Support | 59 (19.7%) | 241 (80.3%) |
| Education Instruction & Library | 362 (23.4%) | 1,185 (76.6%) |
| Arts, Media & Entertainment | 130 (49.6%) | 132 (50.4%) |
| Health Diagnosing & Treating | 306 (32.2%) | 643 (67.8%) |
| Health Technologists | 175 (33.7%) | 345 (66.3%) |
| Total (Category) | 4,221 (42.1%) | 5,801 (57.9%) |
| Total (Overall) | 10,652 (50.0%) | 10,634 (50.0%) |
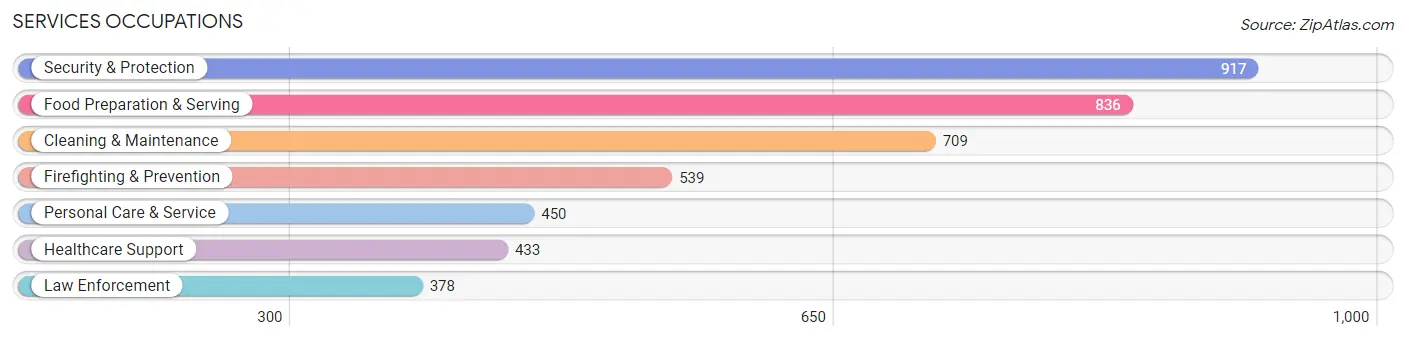
Services Occupations
The most common Services occupations in Clinton are Security & Protection (917 | 4.3%), Food Preparation & Serving (836 | 3.9%), Cleaning & Maintenance (709 | 3.3%), Firefighting & Prevention (539 | 2.5%), and Personal Care & Service (450 | 2.1%).
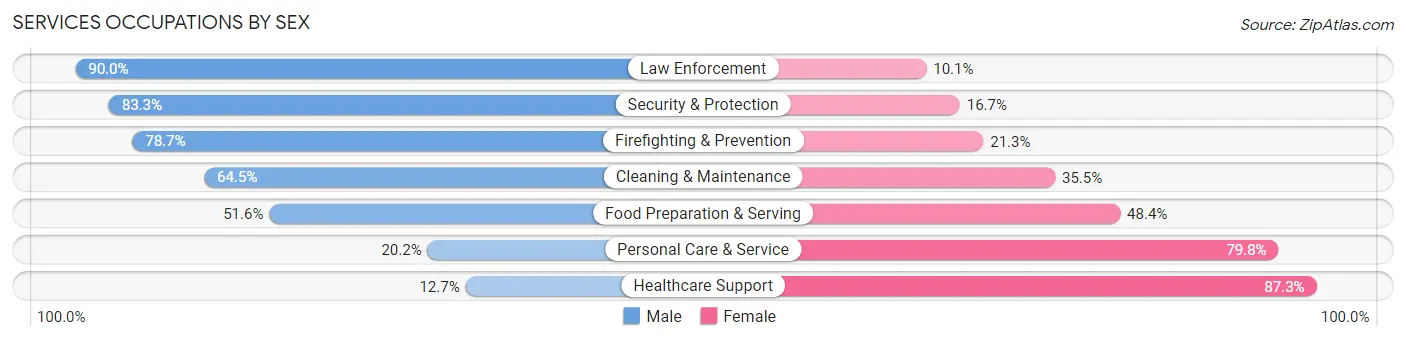
Services Occupations by Sex
Within the Services occupations in Clinton, the most male-oriented occupations are Law Enforcement (89.9%), Security & Protection (83.3%), and Firefighting & Prevention (78.7%), while the most female-oriented occupations are Healthcare Support (87.3%), Personal Care & Service (79.8%), and Food Preparation & Serving (48.4%).
| Occupation | Male | Female |
| Healthcare Support | 55 (12.7%) | 378 (87.3%) |
| Security & Protection | 764 (83.3%) | 153 (16.7%) |
| Firefighting & Prevention | 424 (78.7%) | 115 (21.3%) |
| Law Enforcement | 340 (89.9%) | 38 (10.1%) |
| Food Preparation & Serving | 431 (51.6%) | 405 (48.4%) |
| Cleaning & Maintenance | 457 (64.5%) | 252 (35.5%) |
| Personal Care & Service | 91 (20.2%) | 359 (79.8%) |
| Total (Category) | 1,798 (53.7%) | 1,547 (46.3%) |
| Total (Overall) | 10,652 (50.0%) | 10,634 (50.0%) |
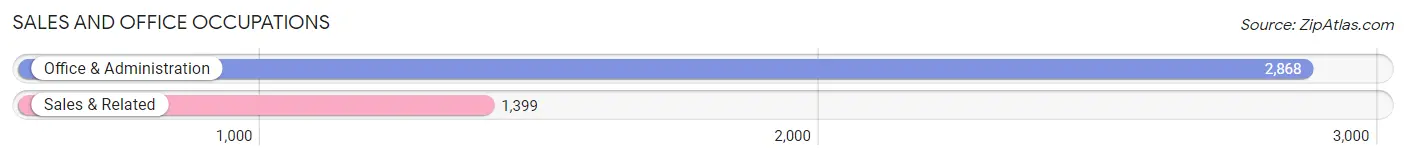
Sales and Office Occupations
The most common Sales and Office occupations in Clinton are Office & Administration (2,868 | 13.5%), and Sales & Related (1,399 | 6.6%).
Sales and Office Occupations by Sex
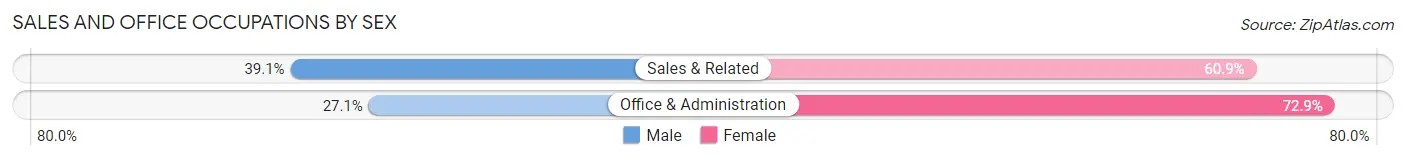
| Occupation | Male | Female |
| Sales & Related | 547 (39.1%) | 852 (60.9%) |
| Office & Administration | 776 (27.1%) | 2,092 (72.9%) |
| Total (Category) | 1,323 (31.0%) | 2,944 (69.0%) |
| Total (Overall) | 10,652 (50.0%) | 10,634 (50.0%) |
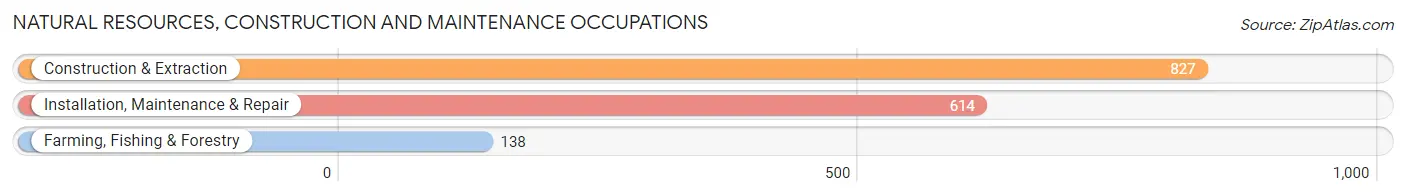
Natural Resources, Construction and Maintenance Occupations
The most common Natural Resources, Construction and Maintenance occupations in Clinton are Construction & Extraction (827 | 3.9%), Installation, Maintenance & Repair (614 | 2.9%), and Farming, Fishing & Forestry (138 | 0.6%).
Natural Resources, Construction and Maintenance Occupations by Sex
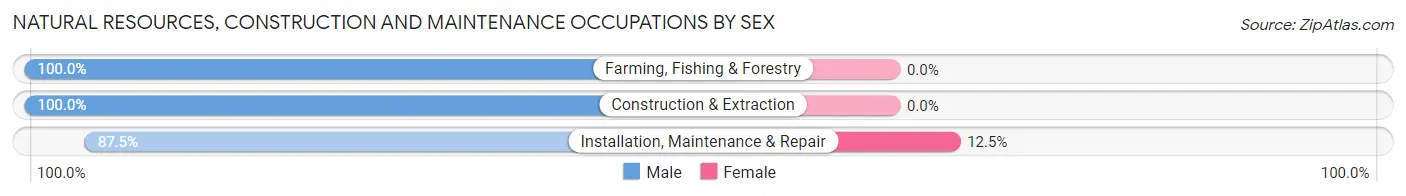
| Occupation | Male | Female |
| Farming, Fishing & Forestry | 138 (100.0%) | 0 (0.0%) |
| Construction & Extraction | 827 (100.0%) | 0 (0.0%) |
| Installation, Maintenance & Repair | 537 (87.5%) | 77 (12.5%) |
| Total (Category) | 1,502 (95.1%) | 77 (4.9%) |
| Total (Overall) | 10,652 (50.0%) | 10,634 (50.0%) |
Production, Transportation and Moving Occupations
The most common Production, Transportation and Moving occupations in Clinton are Material Moving (935 | 4.4%), Transportation (822 | 3.9%), and Production (316 | 1.5%).
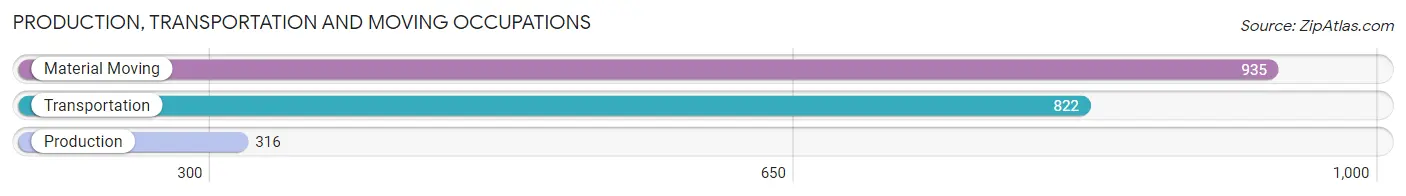
Production, Transportation and Moving Occupations by Sex
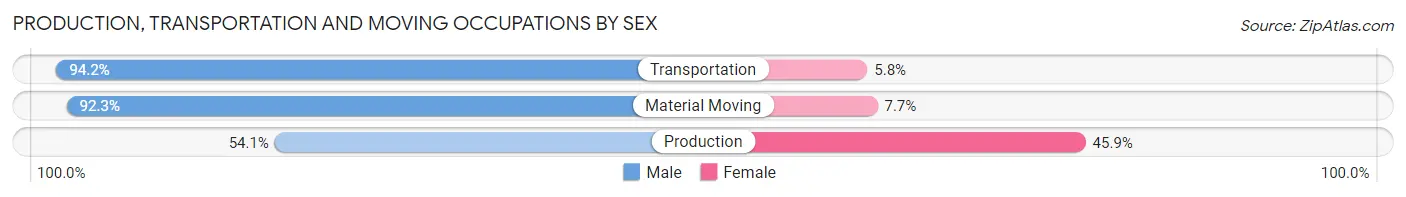
| Occupation | Male | Female |
| Production | 171 (54.1%) | 145 (45.9%) |
| Transportation | 774 (94.2%) | 48 (5.8%) |
| Material Moving | 863 (92.3%) | 72 (7.7%) |
| Total (Category) | 1,808 (87.2%) | 265 (12.8%) |
| Total (Overall) | 10,652 (50.0%) | 10,634 (50.0%) |
Employment Industries by Sex in Clinton
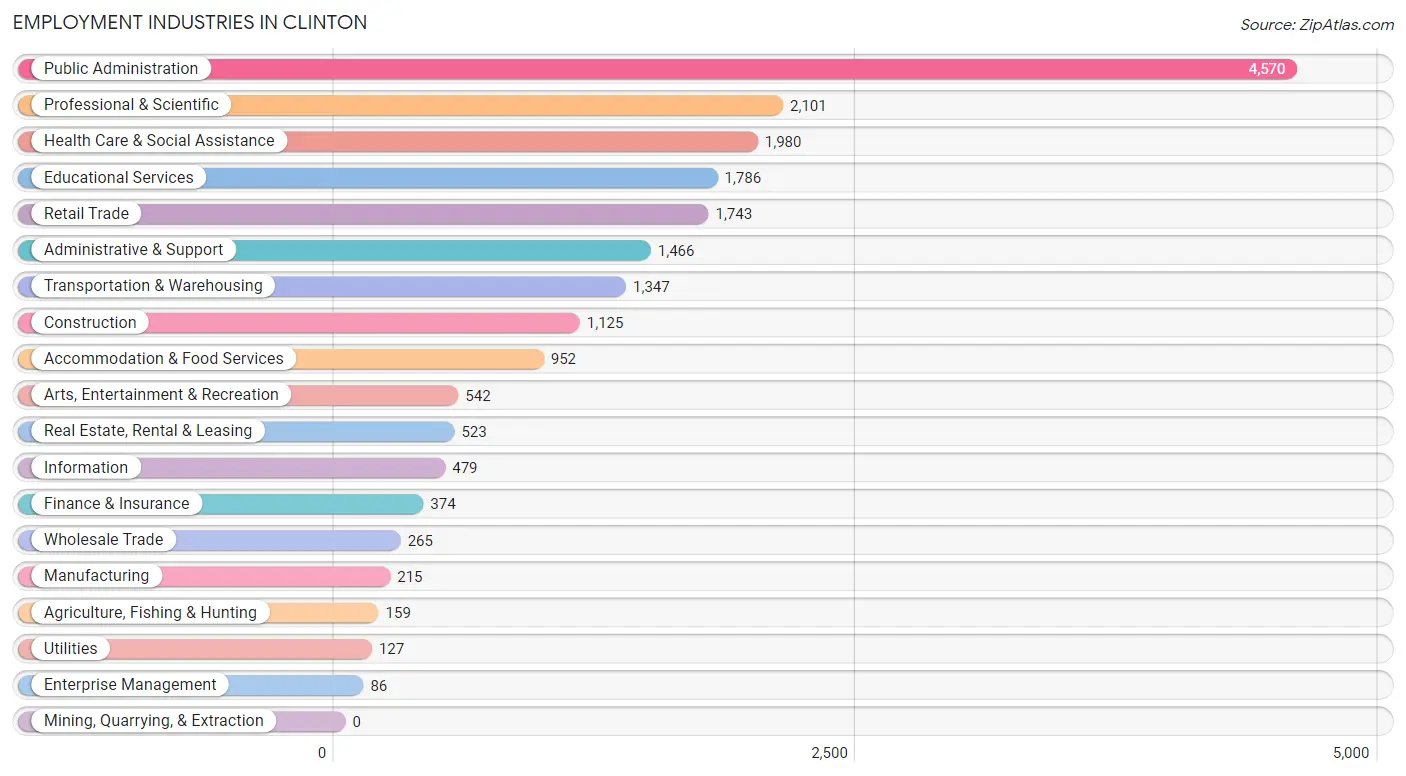
Employment Industries in Clinton
The major employment industries in Clinton include Public Administration (4,570 | 21.5%), Professional & Scientific (2,101 | 9.9%), Health Care & Social Assistance (1,980 | 9.3%), Educational Services (1,786 | 8.4%), and Retail Trade (1,743 | 8.2%).
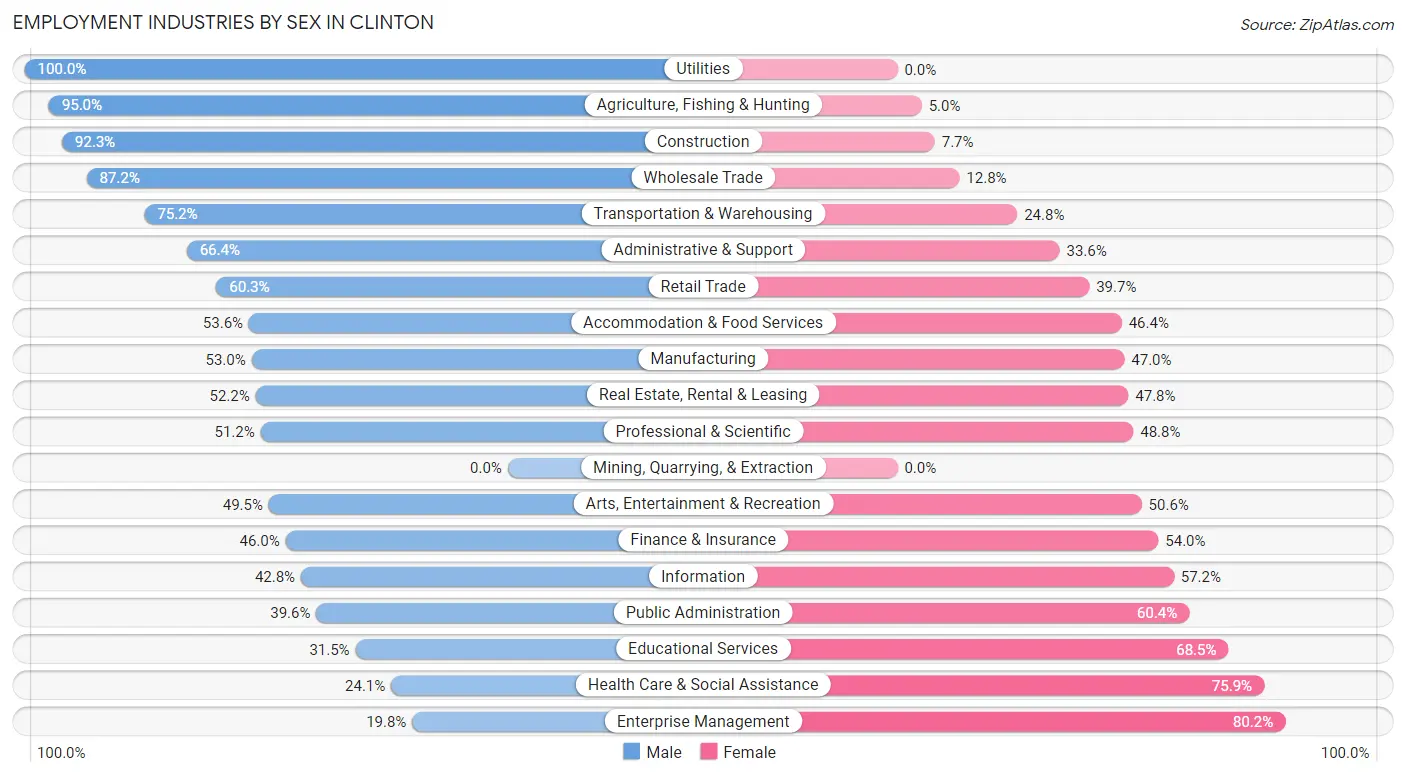
Employment Industries by Sex in Clinton
The Clinton industries that see more men than women are Utilities (100.0%), Agriculture, Fishing & Hunting (95.0%), and Construction (92.3%), whereas the industries that tend to have a higher number of women are Enterprise Management (80.2%), Health Care & Social Assistance (75.9%), and Educational Services (68.5%).
| Industry | Male | Female |
| Agriculture, Fishing & Hunting | 151 (95.0%) | 8 (5.0%) |
| Mining, Quarrying, & Extraction | 0 (0.0%) | 0 (0.0%) |
| Construction | 1,038 (92.3%) | 87 (7.7%) |
| Manufacturing | 114 (53.0%) | 101 (47.0%) |
| Wholesale Trade | 231 (87.2%) | 34 (12.8%) |
| Retail Trade | 1,051 (60.3%) | 692 (39.7%) |
| Transportation & Warehousing | 1,013 (75.2%) | 334 (24.8%) |
| Utilities | 127 (100.0%) | 0 (0.0%) |
| Information | 205 (42.8%) | 274 (57.2%) |
| Finance & Insurance | 172 (46.0%) | 202 (54.0%) |
| Real Estate, Rental & Leasing | 273 (52.2%) | 250 (47.8%) |
| Professional & Scientific | 1,075 (51.2%) | 1,026 (48.8%) |
| Enterprise Management | 17 (19.8%) | 69 (80.2%) |
| Administrative & Support | 974 (66.4%) | 492 (33.6%) |
| Educational Services | 563 (31.5%) | 1,223 (68.5%) |
| Health Care & Social Assistance | 478 (24.1%) | 1,502 (75.9%) |
| Arts, Entertainment & Recreation | 268 (49.4%) | 274 (50.5%) |
| Accommodation & Food Services | 510 (53.6%) | 442 (46.4%) |
| Public Administration | 1,811 (39.6%) | 2,759 (60.4%) |
| Total | 10,652 (50.0%) | 10,634 (50.0%) |
Education in Clinton
School Enrollment in Clinton
The most common levels of schooling among the 8,878 students in Clinton are high school (2,170 | 24.4%), middle school (1,793 | 20.2%), and college / undergraduate (1,733 | 19.5%).
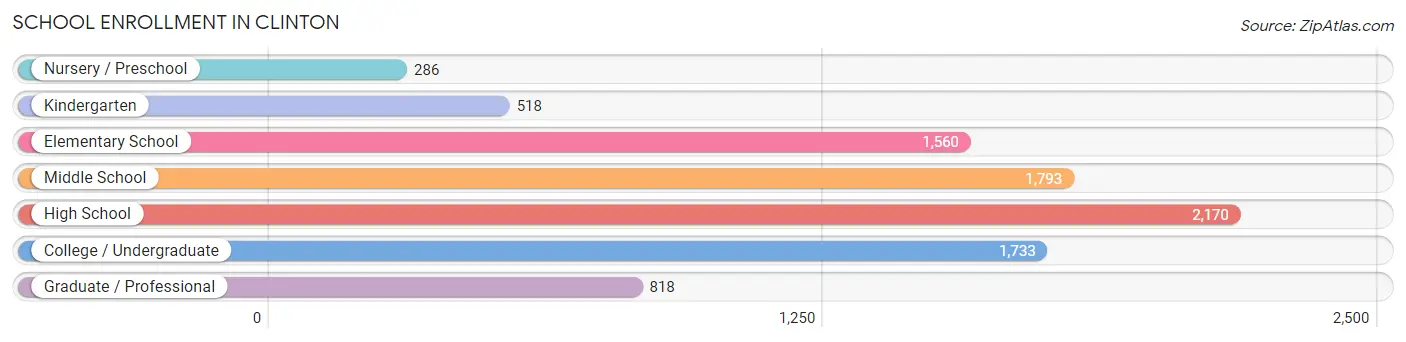
| School Level | # Students | % Students |
| Nursery / Preschool | 286 | 3.2% |
| Kindergarten | 518 | 5.8% |
| Elementary School | 1,560 | 17.6% |
| Middle School | 1,793 | 20.2% |
| High School | 2,170 | 24.4% |
| College / Undergraduate | 1,733 | 19.5% |
| Graduate / Professional | 818 | 9.2% |
| Total | 8,878 | 100.0% |
School Enrollment by Age by Funding Source in Clinton
Out of a total of 8,878 students who are enrolled in schools in Clinton, 1,731 (19.5%) attend a private institution, while the remaining 7,147 (80.5%) are enrolled in public schools. The age group of 3 to 4 year olds has the highest likelihood of being enrolled in private schools, with 146 (57.0% in the age bracket) enrolled. Conversely, the age group of 20 to 24 year olds has the lowest likelihood of being enrolled in a private school, with 846 (94.1% in the age bracket) attending a public institution.
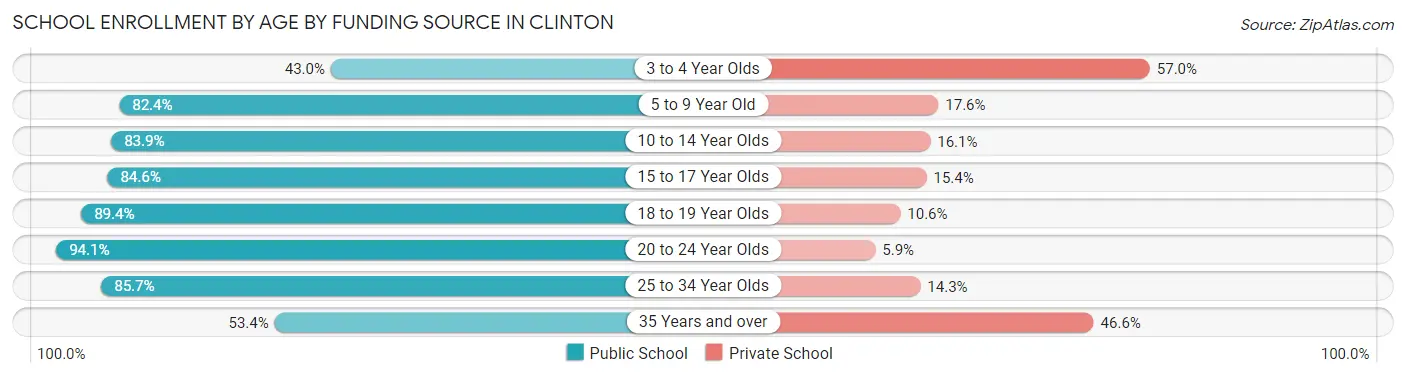
| Age Bracket | Public School | Private School |
| 3 to 4 Year Olds | 110 (43.0%) | 146 (57.0%) |
| 5 to 9 Year Old | 1,643 (82.4%) | 352 (17.6%) |
| 10 to 14 Year Olds | 2,006 (83.9%) | 386 (16.1%) |
| 15 to 17 Year Olds | 1,128 (84.6%) | 206 (15.4%) |
| 18 to 19 Year Olds | 593 (89.4%) | 70 (10.6%) |
| 20 to 24 Year Olds | 846 (94.1%) | 53 (5.9%) |
| 25 to 34 Year Olds | 288 (85.7%) | 48 (14.3%) |
| 35 Years and over | 536 (53.4%) | 467 (46.6%) |
| Total | 7,147 (80.5%) | 1,731 (19.5%) |
Educational Attainment by Field of Study in Clinton
Business (2,699 | 26.7%), computers & mathematics (985 | 9.8%), education (930 | 9.2%), social sciences (902 | 8.9%), and science & technology (887 | 8.8%) are the most common fields of study among 10,106 individuals in Clinton who have obtained a bachelor's degree or higher.
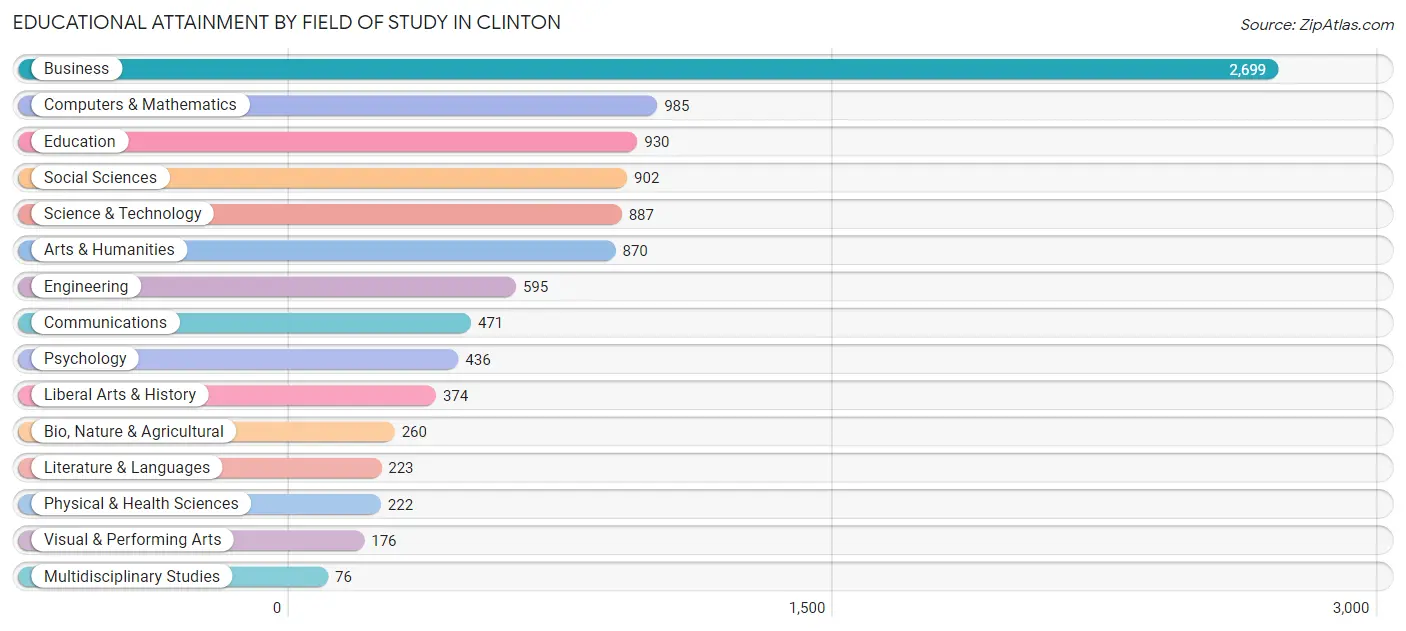
| Field of Study | # Graduates | % Graduates |
| Computers & Mathematics | 985 | 9.8% |
| Bio, Nature & Agricultural | 260 | 2.6% |
| Physical & Health Sciences | 222 | 2.2% |
| Psychology | 436 | 4.3% |
| Social Sciences | 902 | 8.9% |
| Engineering | 595 | 5.9% |
| Multidisciplinary Studies | 76 | 0.7% |
| Science & Technology | 887 | 8.8% |
| Business | 2,699 | 26.7% |
| Education | 930 | 9.2% |
| Literature & Languages | 223 | 2.2% |
| Liberal Arts & History | 374 | 3.7% |
| Visual & Performing Arts | 176 | 1.7% |
| Communications | 471 | 4.7% |
| Arts & Humanities | 870 | 8.6% |
| Total | 10,106 | 100.0% |
Transportation & Commute in Clinton
Vehicle Availability by Sex in Clinton
The most prevalent vehicle ownership categories in Clinton are males with 2 vehicles (3,850, accounting for 36.2%) and females with 2 vehicles (3,698, making up 36.4%).
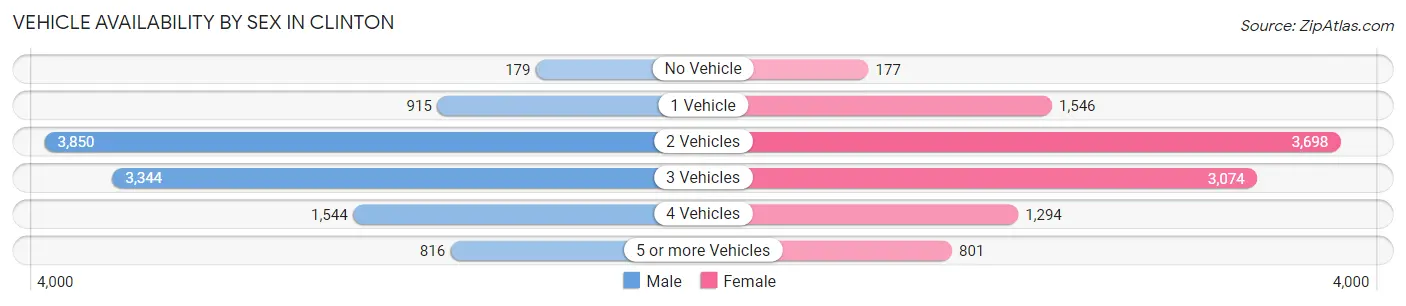
| Vehicles Available | Male | Female |
| No Vehicle | 179 (1.7%) | 177 (1.7%) |
| 1 Vehicle | 915 (8.6%) | 1,546 (14.6%) |
| 2 Vehicles | 3,850 (36.2%) | 3,698 (34.9%) |
| 3 Vehicles | 3,344 (31.4%) | 3,074 (29.0%) |
| 4 Vehicles | 1,544 (14.5%) | 1,294 (12.2%) |
| 5 or more Vehicles | 816 (7.7%) | 801 (7.6%) |
| Total | 10,648 (100.0%) | 10,590 (100.0%) |
Commute Time in Clinton
The most frequently occuring commute durations in Clinton are 45 to 59 minutes (3,520 commuters, 19.2%), 30 to 34 minutes (3,442 commuters, 18.8%), and 60 to 89 minutes (2,794 commuters, 15.3%).
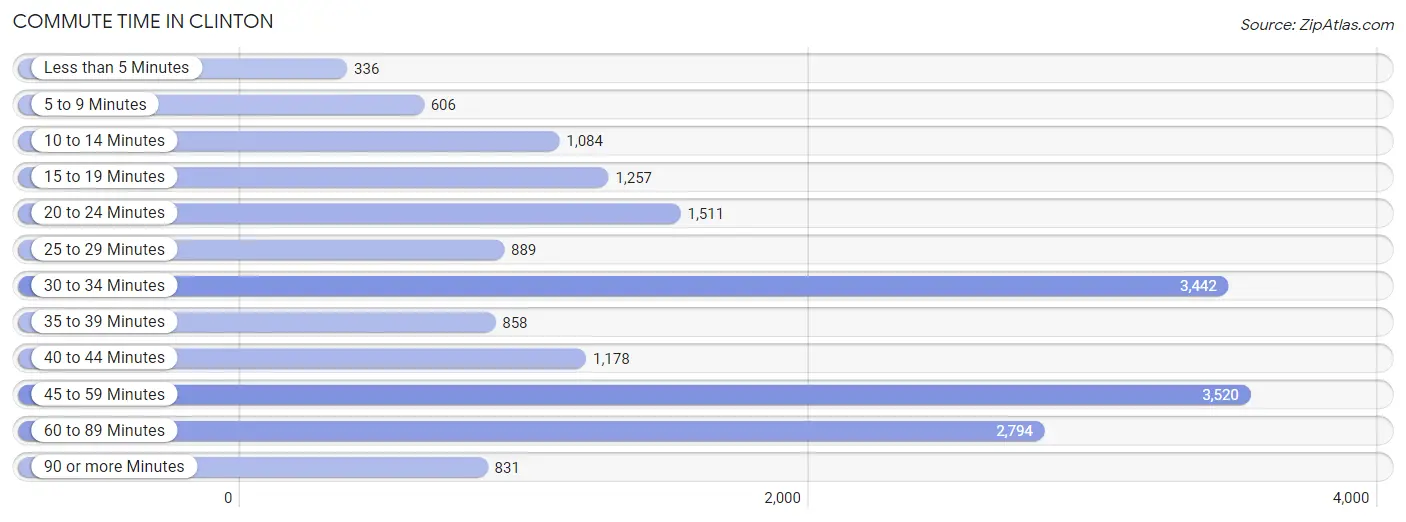
| Commute Time | # Commuters | % Commuters |
| Less than 5 Minutes | 336 | 1.8% |
| 5 to 9 Minutes | 606 | 3.3% |
| 10 to 14 Minutes | 1,084 | 5.9% |
| 15 to 19 Minutes | 1,257 | 6.9% |
| 20 to 24 Minutes | 1,511 | 8.3% |
| 25 to 29 Minutes | 889 | 4.9% |
| 30 to 34 Minutes | 3,442 | 18.8% |
| 35 to 39 Minutes | 858 | 4.7% |
| 40 to 44 Minutes | 1,178 | 6.4% |
| 45 to 59 Minutes | 3,520 | 19.2% |
| 60 to 89 Minutes | 2,794 | 15.3% |
| 90 or more Minutes | 831 | 4.5% |
Commute Time by Sex in Clinton
The most common commute times in Clinton are 30 to 34 minutes (2,124 commuters, 22.2%) for males and 60 to 89 minutes (1,683 commuters, 19.2%) for females.
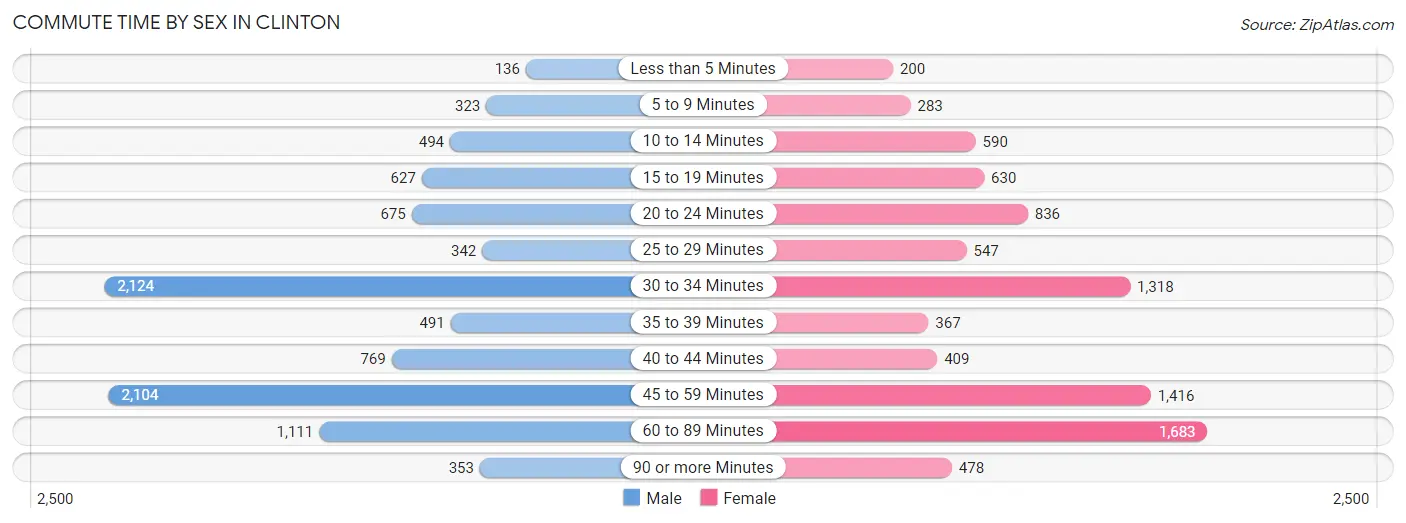
| Commute Time | Male | Female |
| Less than 5 Minutes | 136 (1.4%) | 200 (2.3%) |
| 5 to 9 Minutes | 323 (3.4%) | 283 (3.2%) |
| 10 to 14 Minutes | 494 (5.2%) | 590 (6.7%) |
| 15 to 19 Minutes | 627 (6.6%) | 630 (7.2%) |
| 20 to 24 Minutes | 675 (7.1%) | 836 (9.6%) |
| 25 to 29 Minutes | 342 (3.6%) | 547 (6.2%) |
| 30 to 34 Minutes | 2,124 (22.2%) | 1,318 (15.0%) |
| 35 to 39 Minutes | 491 (5.1%) | 367 (4.2%) |
| 40 to 44 Minutes | 769 (8.1%) | 409 (4.7%) |
| 45 to 59 Minutes | 2,104 (22.0%) | 1,416 (16.2%) |
| 60 to 89 Minutes | 1,111 (11.6%) | 1,683 (19.2%) |
| 90 or more Minutes | 353 (3.7%) | 478 (5.5%) |
Time of Departure to Work by Sex in Clinton
The most frequent times of departure to work in Clinton are 12:00 AM to 4:59 AM (1,293, 13.5%) for males and 7:00 AM to 7:29 AM (1,542, 17.6%) for females.
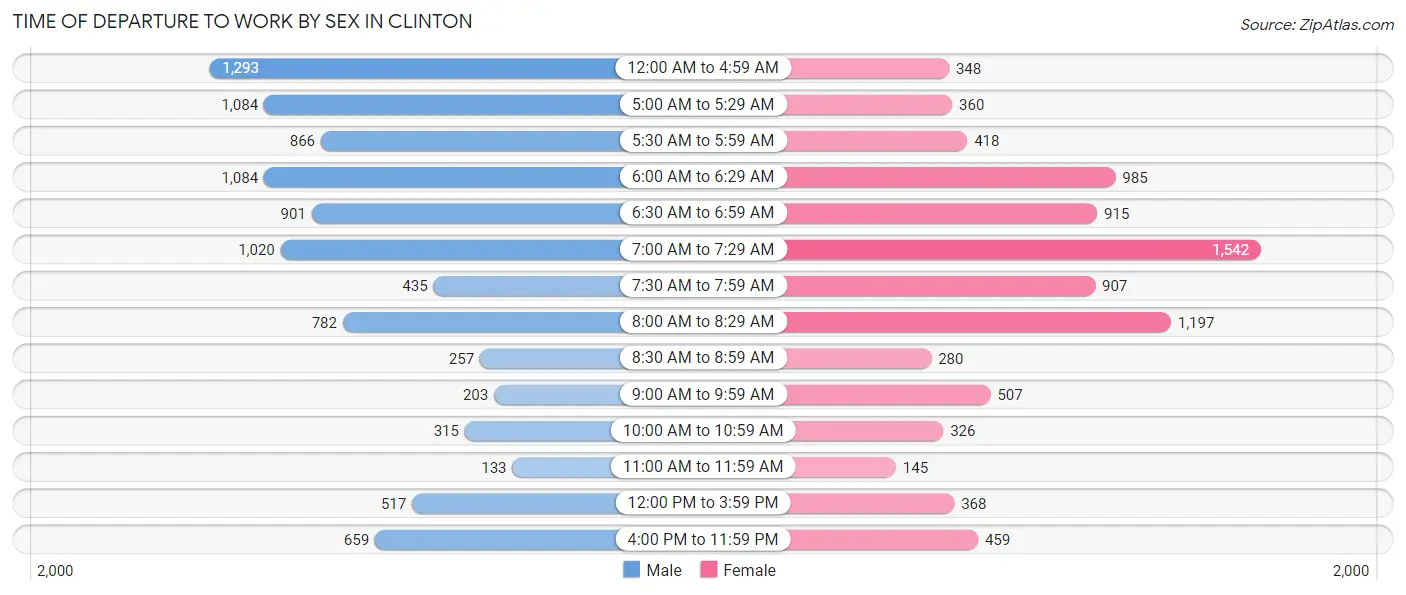
| Time of Departure | Male | Female |
| 12:00 AM to 4:59 AM | 1,293 (13.5%) | 348 (4.0%) |
| 5:00 AM to 5:29 AM | 1,084 (11.4%) | 360 (4.1%) |
| 5:30 AM to 5:59 AM | 866 (9.1%) | 418 (4.8%) |
| 6:00 AM to 6:29 AM | 1,084 (11.4%) | 985 (11.3%) |
| 6:30 AM to 6:59 AM | 901 (9.4%) | 915 (10.4%) |
| 7:00 AM to 7:29 AM | 1,020 (10.7%) | 1,542 (17.6%) |
| 7:30 AM to 7:59 AM | 435 (4.6%) | 907 (10.4%) |
| 8:00 AM to 8:29 AM | 782 (8.2%) | 1,197 (13.7%) |
| 8:30 AM to 8:59 AM | 257 (2.7%) | 280 (3.2%) |
| 9:00 AM to 9:59 AM | 203 (2.1%) | 507 (5.8%) |
| 10:00 AM to 10:59 AM | 315 (3.3%) | 326 (3.7%) |
| 11:00 AM to 11:59 AM | 133 (1.4%) | 145 (1.7%) |
| 12:00 PM to 3:59 PM | 517 (5.4%) | 368 (4.2%) |
| 4:00 PM to 11:59 PM | 659 (6.9%) | 459 (5.2%) |
| Total | 9,549 (100.0%) | 8,757 (100.0%) |
Housing Occupancy in Clinton
Occupancy by Ownership in Clinton
Of the total 13,605 dwellings in Clinton, owner-occupied units account for 12,353 (90.8%), while renter-occupied units make up 1,252 (9.2%).
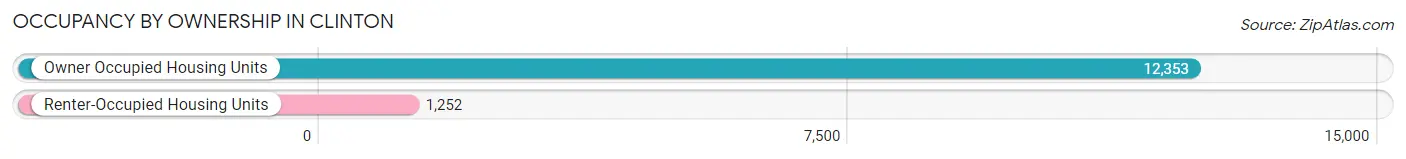
| Occupancy | # Housing Units | % Housing Units |
| Owner Occupied Housing Units | 12,353 | 90.8% |
| Renter-Occupied Housing Units | 1,252 | 9.2% |
| Total Occupied Housing Units | 13,605 | 100.0% |
Occupancy by Household Size in Clinton
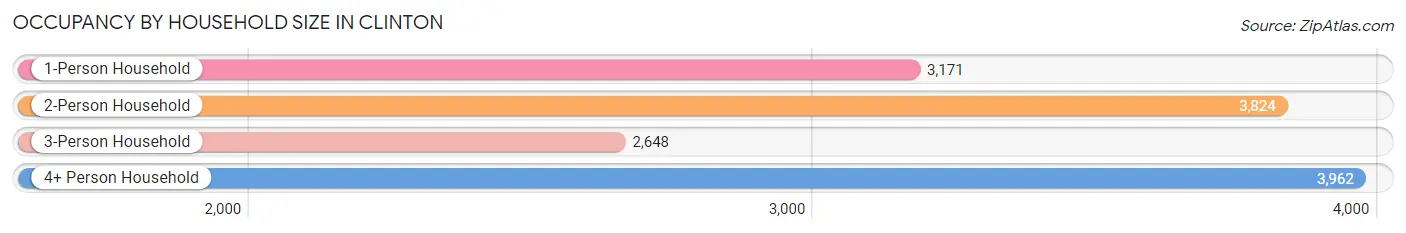
| Household Size | # Housing Units | % Housing Units |
| 1-Person Household | 3,171 | 23.3% |
| 2-Person Household | 3,824 | 28.1% |
| 3-Person Household | 2,648 | 19.5% |
| 4+ Person Household | 3,962 | 29.1% |
| Total Housing Units | 13,605 | 100.0% |
Occupancy by Ownership by Household Size in Clinton
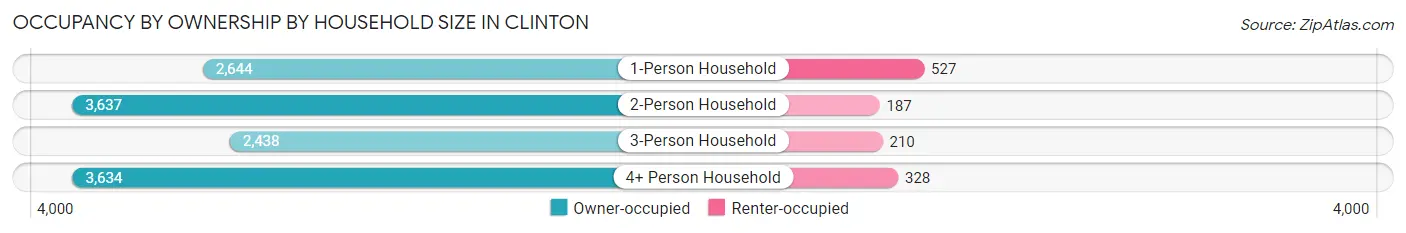
| Household Size | Owner-occupied | Renter-occupied |
| 1-Person Household | 2,644 (83.4%) | 527 (16.6%) |
| 2-Person Household | 3,637 (95.1%) | 187 (4.9%) |
| 3-Person Household | 2,438 (92.1%) | 210 (7.9%) |
| 4+ Person Household | 3,634 (91.7%) | 328 (8.3%) |
| Total Housing Units | 12,353 (90.8%) | 1,252 (9.2%) |
Occupancy by Educational Attainment in Clinton
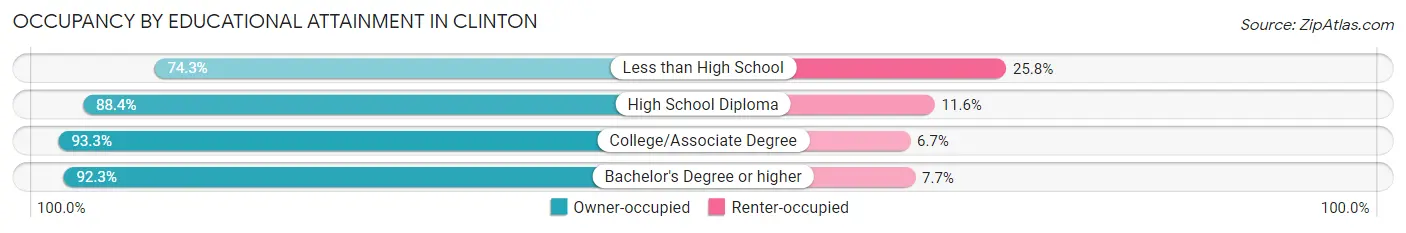
| Household Size | Owner-occupied | Renter-occupied |
| Less than High School | 522 (74.3%) | 181 (25.8%) |
| High School Diploma | 2,732 (88.4%) | 358 (11.6%) |
| College/Associate Degree | 4,212 (93.3%) | 304 (6.7%) |
| Bachelor's Degree or higher | 4,887 (92.3%) | 409 (7.7%) |
Occupancy by Age of Householder in Clinton
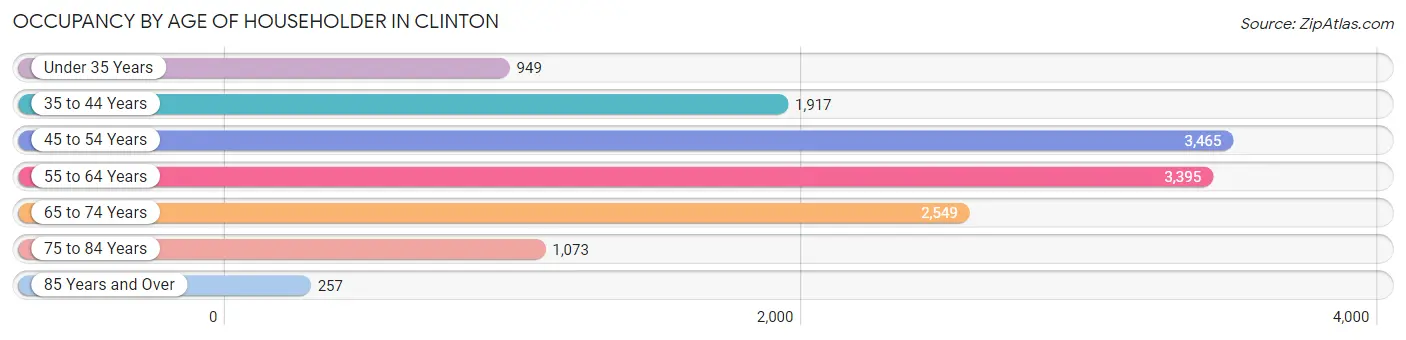
| Age Bracket | # Households | % Households |
| Under 35 Years | 949 | 7.0% |
| 35 to 44 Years | 1,917 | 14.1% |
| 45 to 54 Years | 3,465 | 25.5% |
| 55 to 64 Years | 3,395 | 24.9% |
| 65 to 74 Years | 2,549 | 18.7% |
| 75 to 84 Years | 1,073 | 7.9% |
| 85 Years and Over | 257 | 1.9% |
| Total | 13,605 | 100.0% |
Housing Finances in Clinton
Median Income by Occupancy in Clinton
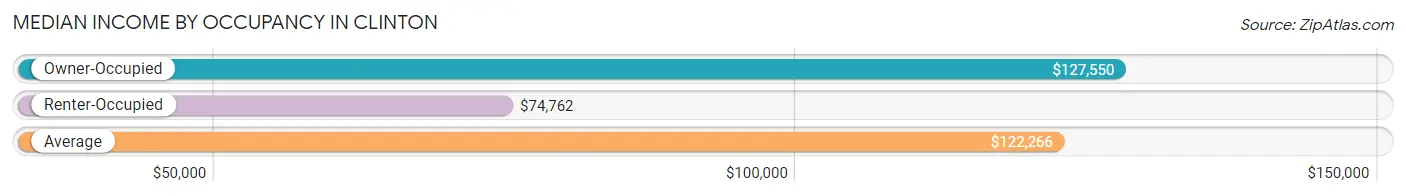
| Occupancy Type | # Households | Median Income |
| Owner-Occupied | 12,353 (90.8%) | $127,550 |
| Renter-Occupied | 1,252 (9.2%) | $74,762 |
| Average | 13,605 (100.0%) | $122,266 |
Occupancy by Householder Income Bracket in Clinton
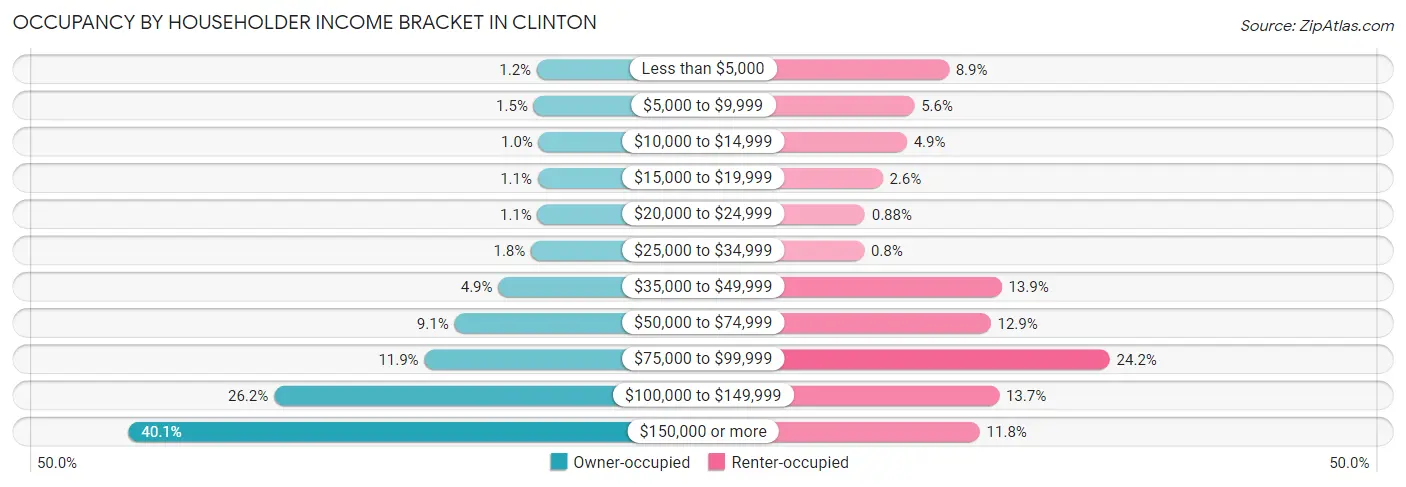
| Income Bracket | Owner-occupied | Renter-occupied |
| Less than $5,000 | 149 (1.2%) | 111 (8.9%) |
| $5,000 to $9,999 | 187 (1.5%) | 70 (5.6%) |
| $10,000 to $14,999 | 129 (1.0%) | 61 (4.9%) |
| $15,000 to $19,999 | 138 (1.1%) | 32 (2.6%) |
| $20,000 to $24,999 | 141 (1.1%) | 11 (0.9%) |
| $25,000 to $34,999 | 218 (1.8%) | 10 (0.8%) |
| $35,000 to $49,999 | 603 (4.9%) | 174 (13.9%) |
| $50,000 to $74,999 | 1,119 (9.1%) | 161 (12.9%) |
| $75,000 to $99,999 | 1,472 (11.9%) | 303 (24.2%) |
| $100,000 to $149,999 | 3,242 (26.2%) | 171 (13.7%) |
| $150,000 or more | 4,955 (40.1%) | 148 (11.8%) |
| Total | 12,353 (100.0%) | 1,252 (100.0%) |
Monthly Housing Cost Tiers in Clinton
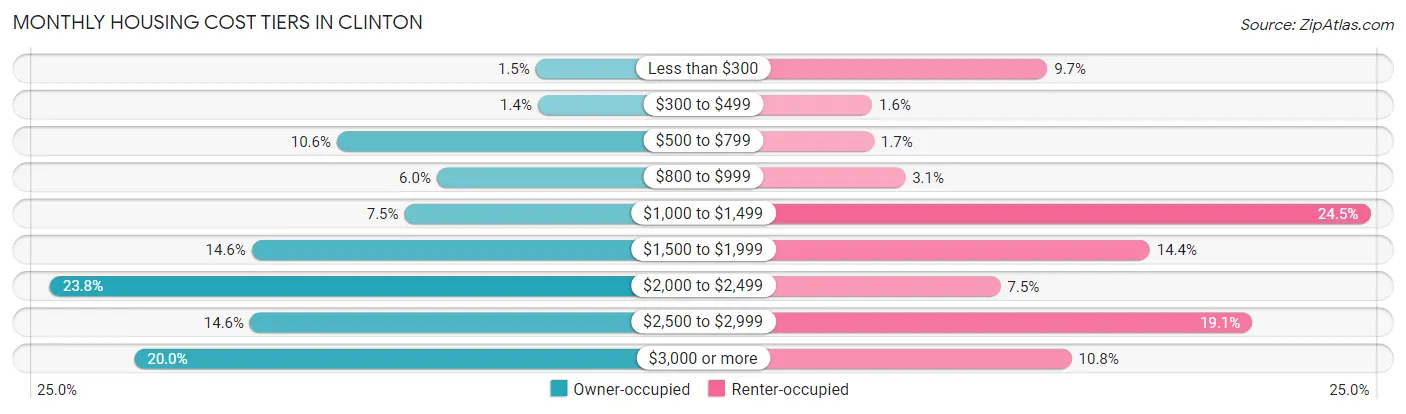
| Monthly Cost | Owner-occupied | Renter-occupied |
| Less than $300 | 183 (1.5%) | 121 (9.7%) |
| $300 to $499 | 170 (1.4%) | 20 (1.6%) |
| $500 to $799 | 1,313 (10.6%) | 21 (1.7%) |
| $800 to $999 | 745 (6.0%) | 39 (3.1%) |
| $1,000 to $1,499 | 929 (7.5%) | 307 (24.5%) |
| $1,500 to $1,999 | 1,797 (14.5%) | 180 (14.4%) |
| $2,000 to $2,499 | 2,945 (23.8%) | 94 (7.5%) |
| $2,500 to $2,999 | 1,807 (14.6%) | 239 (19.1%) |
| $3,000 or more | 2,464 (20.0%) | 135 (10.8%) |
| Total | 12,353 (100.0%) | 1,252 (100.0%) |
Physical Housing Characteristics in Clinton
Housing Structures in Clinton
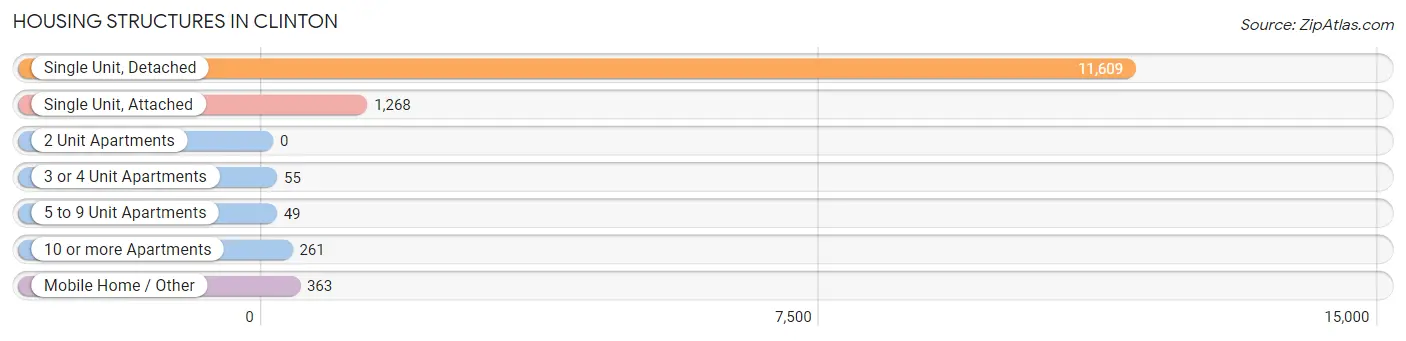
| Structure Type | # Housing Units | % Housing Units |
| Single Unit, Detached | 11,609 | 85.3% |
| Single Unit, Attached | 1,268 | 9.3% |
| 2 Unit Apartments | 0 | 0.0% |
| 3 or 4 Unit Apartments | 55 | 0.4% |
| 5 to 9 Unit Apartments | 49 | 0.4% |
| 10 or more Apartments | 261 | 1.9% |
| Mobile Home / Other | 363 | 2.7% |
| Total | 13,605 | 100.0% |
Housing Structures by Occupancy in Clinton
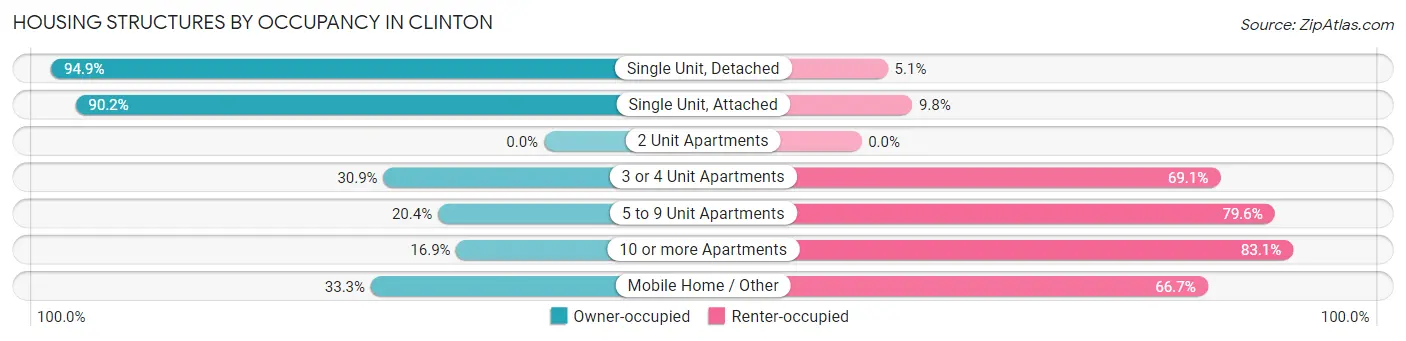
| Structure Type | Owner-occupied | Renter-occupied |
| Single Unit, Detached | 11,017 (94.9%) | 592 (5.1%) |
| Single Unit, Attached | 1,144 (90.2%) | 124 (9.8%) |
| 2 Unit Apartments | 0 (0.0%) | 0 (0.0%) |
| 3 or 4 Unit Apartments | 17 (30.9%) | 38 (69.1%) |
| 5 to 9 Unit Apartments | 10 (20.4%) | 39 (79.6%) |
| 10 or more Apartments | 44 (16.9%) | 217 (83.1%) |
| Mobile Home / Other | 121 (33.3%) | 242 (66.7%) |
| Total | 12,353 (90.8%) | 1,252 (9.2%) |
Housing Structures by Number of Rooms in Clinton
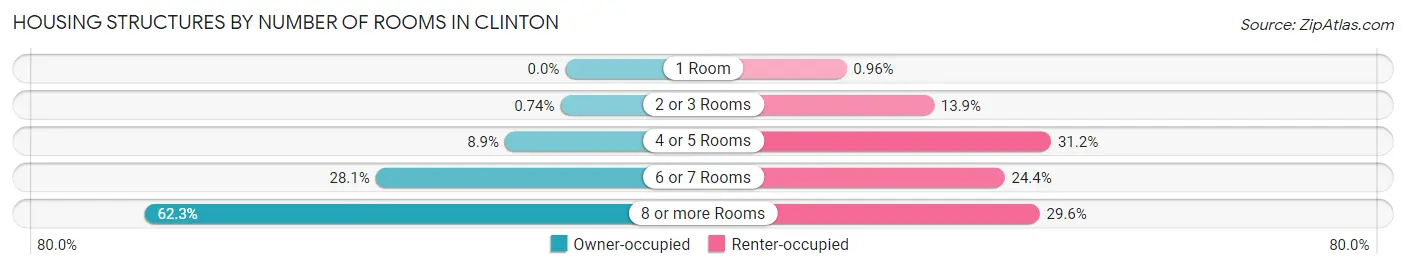
| Number of Rooms | Owner-occupied | Renter-occupied |
| 1 Room | 0 (0.0%) | 12 (1.0%) |
| 2 or 3 Rooms | 92 (0.7%) | 174 (13.9%) |
| 4 or 5 Rooms | 1,103 (8.9%) | 391 (31.2%) |
| 6 or 7 Rooms | 3,467 (28.1%) | 305 (24.4%) |
| 8 or more Rooms | 7,691 (62.3%) | 370 (29.5%) |
| Total | 12,353 (100.0%) | 1,252 (100.0%) |
Housing Structure by Heating Type in Clinton
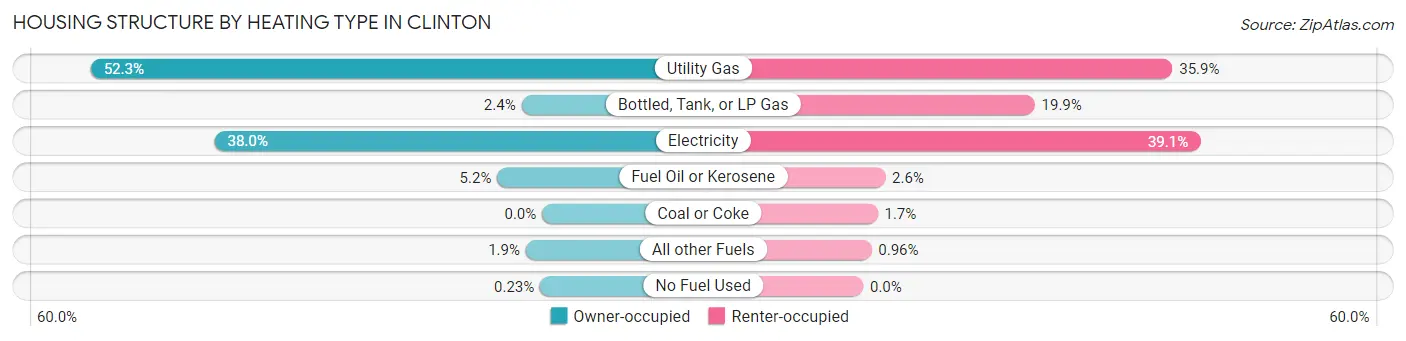
| Heating Type | Owner-occupied | Renter-occupied |
| Utility Gas | 6,464 (52.3%) | 449 (35.9%) |
| Bottled, Tank, or LP Gas | 295 (2.4%) | 249 (19.9%) |
| Electricity | 4,691 (38.0%) | 489 (39.1%) |
| Fuel Oil or Kerosene | 642 (5.2%) | 32 (2.6%) |
| Coal or Coke | 0 (0.0%) | 21 (1.7%) |
| All other Fuels | 233 (1.9%) | 12 (1.0%) |
| No Fuel Used | 28 (0.2%) | 0 (0.0%) |
| Total | 12,353 (100.0%) | 1,252 (100.0%) |
Household Vehicle Usage in Clinton
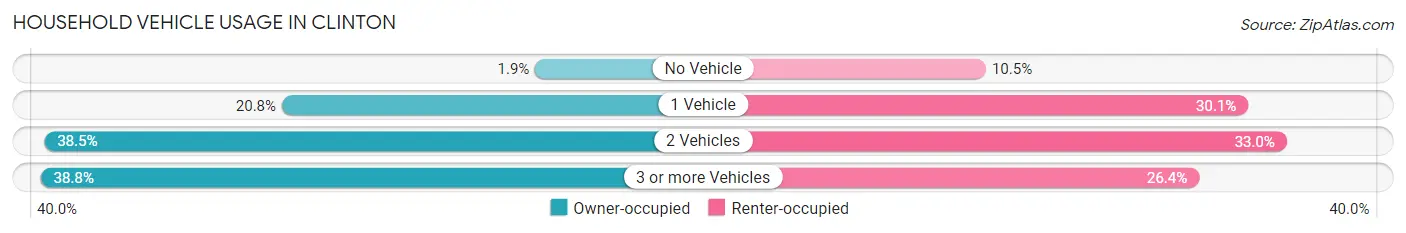
| Vehicles per Household | Owner-occupied | Renter-occupied |
| No Vehicle | 231 (1.9%) | 131 (10.5%) |
| 1 Vehicle | 2,568 (20.8%) | 377 (30.1%) |
| 2 Vehicles | 4,760 (38.5%) | 413 (33.0%) |
| 3 or more Vehicles | 4,794 (38.8%) | 331 (26.4%) |
| Total | 12,353 (100.0%) | 1,252 (100.0%) |
Real Estate & Mortgages in Clinton
Real Estate and Mortgage Overview in Clinton
| Characteristic | Without Mortgage | With Mortgage |
| Housing Units | 2,475 | 9,878 |
| Median Property Value | $349,600 | $386,700 |
| Median Household Income | $96,635 | $4,295 |
| Monthly Housing Costs | $741 | $2,450 |
| Real Estate Taxes | $4,310 | $229 |
Property Value by Mortgage Status in Clinton
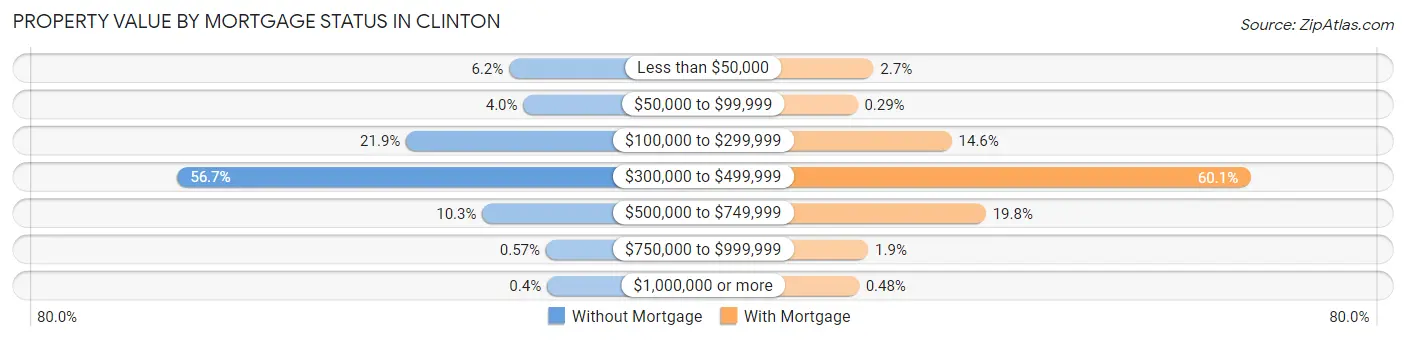
| Property Value | Without Mortgage | With Mortgage |
| Less than $50,000 | 153 (6.2%) | 269 (2.7%) |
| $50,000 to $99,999 | 99 (4.0%) | 29 (0.3%) |
| $100,000 to $299,999 | 541 (21.9%) | 1,446 (14.6%) |
| $300,000 to $499,999 | 1,404 (56.7%) | 5,937 (60.1%) |
| $500,000 to $749,999 | 254 (10.3%) | 1,960 (19.8%) |
| $750,000 to $999,999 | 14 (0.6%) | 190 (1.9%) |
| $1,000,000 or more | 10 (0.4%) | 47 (0.5%) |
| Total | 2,475 (100.0%) | 9,878 (100.0%) |
Household Income by Mortgage Status in Clinton
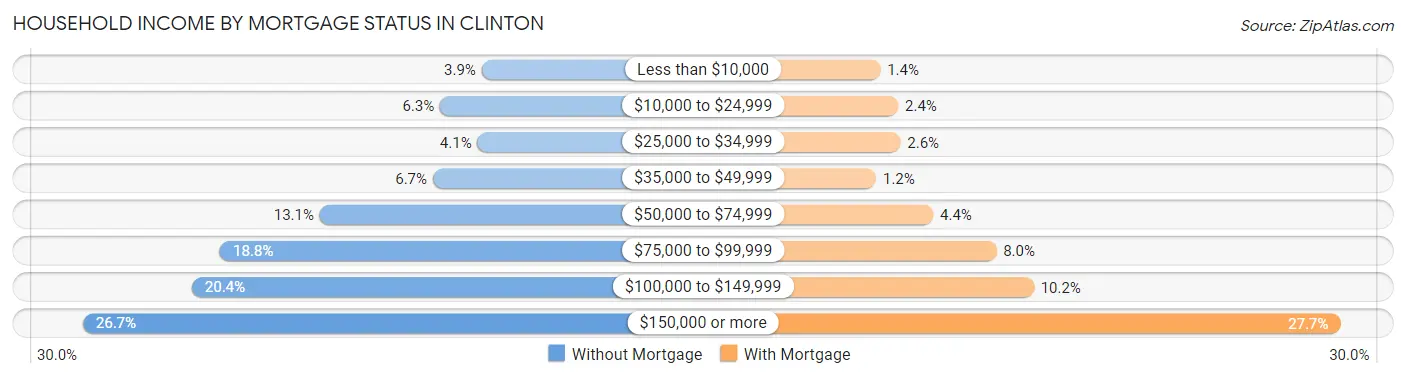
| Household Income | Without Mortgage | With Mortgage |
| Less than $10,000 | 96 (3.9%) | 139 (1.4%) |
| $10,000 to $24,999 | 155 (6.3%) | 240 (2.4%) |
| $25,000 to $34,999 | 102 (4.1%) | 253 (2.6%) |
| $35,000 to $49,999 | 165 (6.7%) | 116 (1.2%) |
| $50,000 to $74,999 | 325 (13.1%) | 438 (4.4%) |
| $75,000 to $99,999 | 466 (18.8%) | 794 (8.0%) |
| $100,000 to $149,999 | 506 (20.4%) | 1,006 (10.2%) |
| $150,000 or more | 660 (26.7%) | 2,736 (27.7%) |
| Total | 2,475 (100.0%) | 9,878 (100.0%) |
Property Value to Household Income Ratio in Clinton
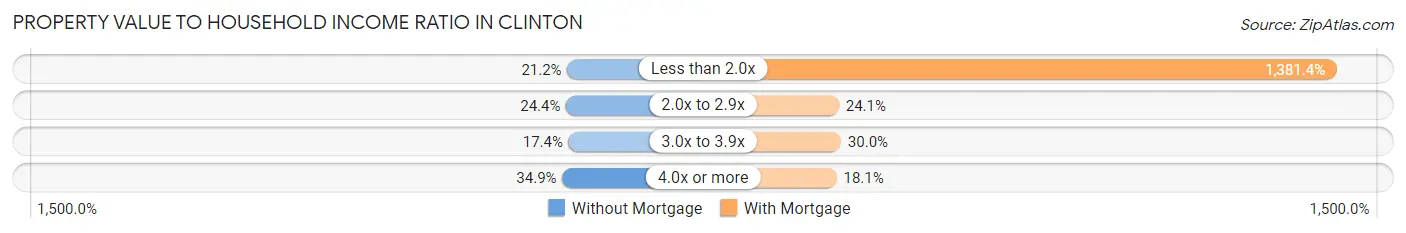
| Value-to-Income Ratio | Without Mortgage | With Mortgage |
| Less than 2.0x | 524 (21.2%) | 136,458 (1,381.4%) |
| 2.0x to 2.9x | 603 (24.4%) | 2,380 (24.1%) |
| 3.0x to 3.9x | 431 (17.4%) | 2,961 (30.0%) |
| 4.0x or more | 864 (34.9%) | 1,783 (18.0%) |
| Total | 2,475 (100.0%) | 9,878 (100.0%) |
Real Estate Taxes by Mortgage Status in Clinton
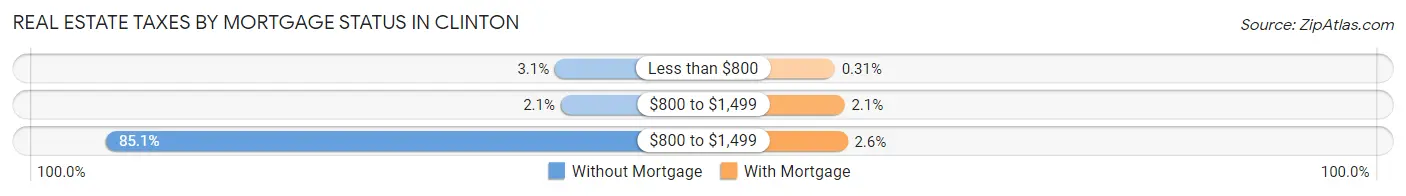
| Property Taxes | Without Mortgage | With Mortgage |
| Less than $800 | 77 (3.1%) | 31 (0.3%) |
| $800 to $1,499 | 51 (2.1%) | 206 (2.1%) |
| $800 to $1,499 | 2,107 (85.1%) | 260 (2.6%) |
| Total | 2,475 (100.0%) | 9,878 (100.0%) |
Health & Disability in Clinton
Health Insurance Coverage by Age in Clinton
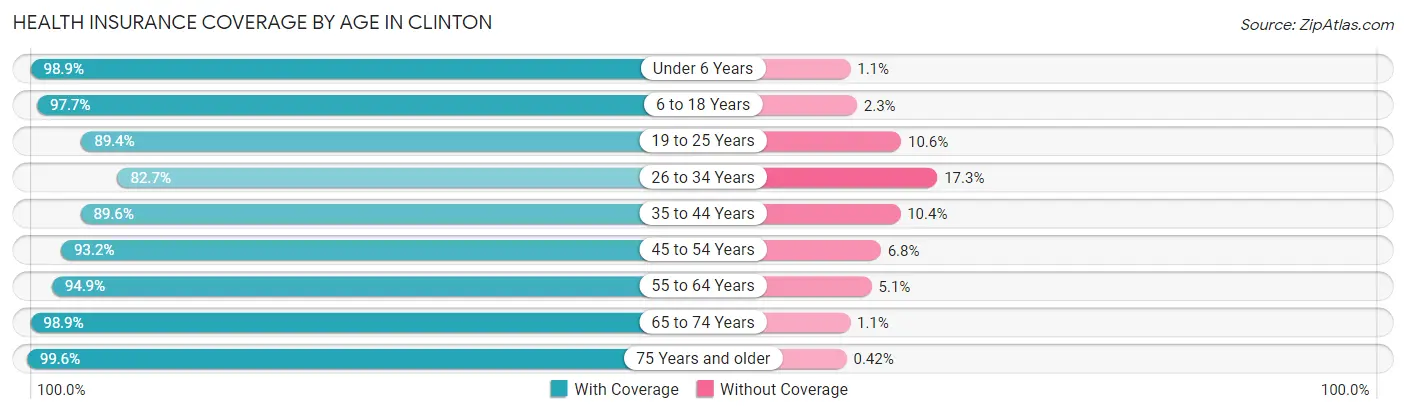
| Age Bracket | With Coverage | Without Coverage |
| Under 6 Years | 1,771 (98.9%) | 20 (1.1%) |
| 6 to 18 Years | 6,100 (97.7%) | 146 (2.3%) |
| 19 to 25 Years | 2,900 (89.4%) | 343 (10.6%) |
| 26 to 34 Years | 3,297 (82.7%) | 691 (17.3%) |
| 35 to 44 Years | 4,449 (89.6%) | 518 (10.4%) |
| 45 to 54 Years | 5,738 (93.2%) | 418 (6.8%) |
| 55 to 64 Years | 5,943 (94.9%) | 319 (5.1%) |
| 65 to 74 Years | 4,512 (98.9%) | 49 (1.1%) |
| 75 Years and older | 2,155 (99.6%) | 9 (0.4%) |
| Total | 36,865 (93.6%) | 2,513 (6.4%) |
Health Insurance Coverage by Citizenship Status in Clinton
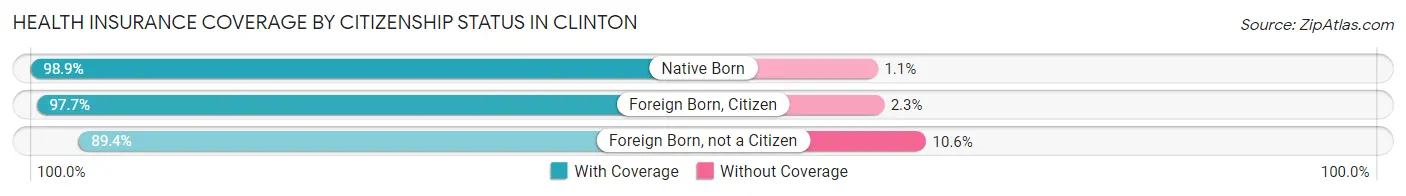
| Citizenship Status | With Coverage | Without Coverage |
| Native Born | 1,771 (98.9%) | 20 (1.1%) |
| Foreign Born, Citizen | 6,100 (97.7%) | 146 (2.3%) |
| Foreign Born, not a Citizen | 2,900 (89.4%) | 343 (10.6%) |
Health Insurance Coverage by Household Income in Clinton
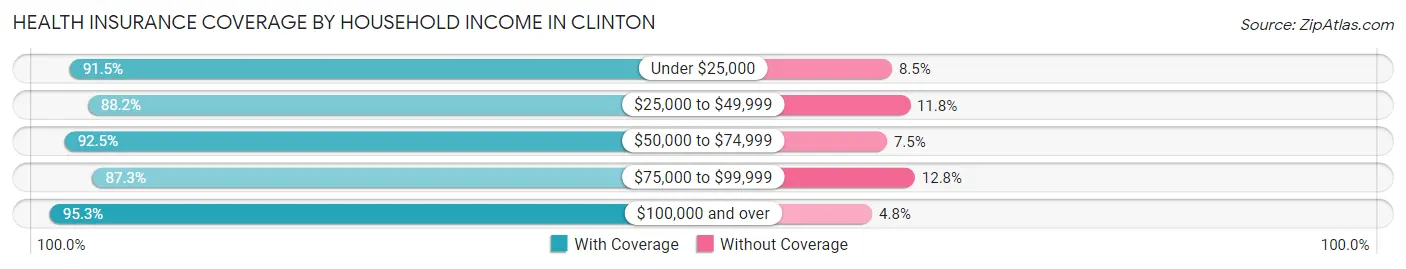
| Household Income | With Coverage | Without Coverage |
| Under $25,000 | 1,504 (91.5%) | 139 (8.5%) |
| $25,000 to $49,999 | 2,218 (88.2%) | 298 (11.8%) |
| $50,000 to $74,999 | 2,712 (92.5%) | 221 (7.5%) |
| $75,000 to $99,999 | 3,462 (87.3%) | 506 (12.8%) |
| $100,000 and over | 26,928 (95.3%) | 1,342 (4.8%) |
Public vs Private Health Insurance Coverage by Age in Clinton
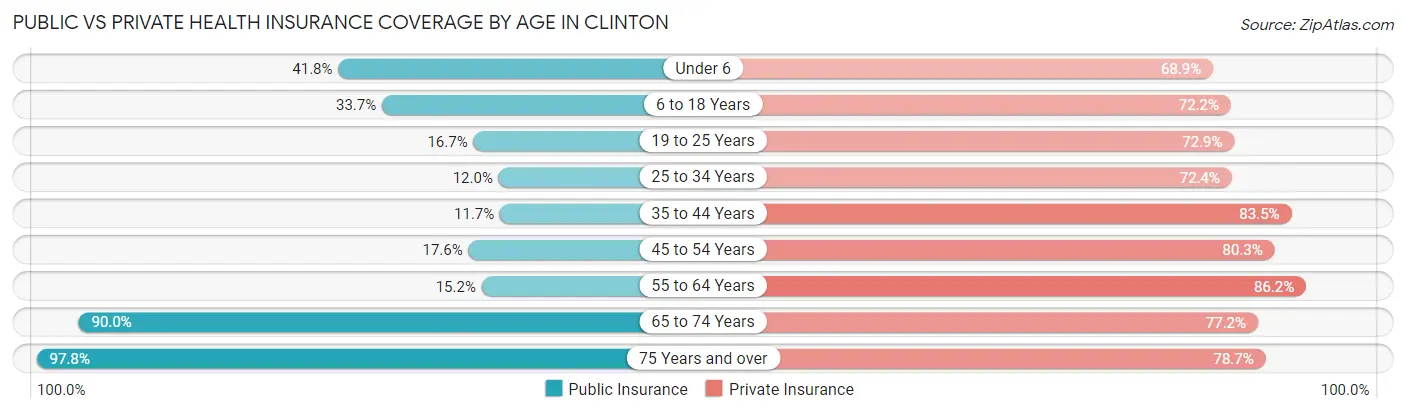
| Age Bracket | Public Insurance | Private Insurance |
| Under 6 | 748 (41.8%) | 1,234 (68.9%) |
| 6 to 18 Years | 2,102 (33.7%) | 4,510 (72.2%) |
| 19 to 25 Years | 541 (16.7%) | 2,363 (72.9%) |
| 25 to 34 Years | 478 (12.0%) | 2,887 (72.4%) |
| 35 to 44 Years | 583 (11.7%) | 4,145 (83.5%) |
| 45 to 54 Years | 1,083 (17.6%) | 4,945 (80.3%) |
| 55 to 64 Years | 949 (15.1%) | 5,396 (86.2%) |
| 65 to 74 Years | 4,105 (90.0%) | 3,522 (77.2%) |
| 75 Years and over | 2,116 (97.8%) | 1,702 (78.6%) |
| Total | 12,705 (32.3%) | 30,704 (78.0%) |
Disability Status by Sex by Age in Clinton
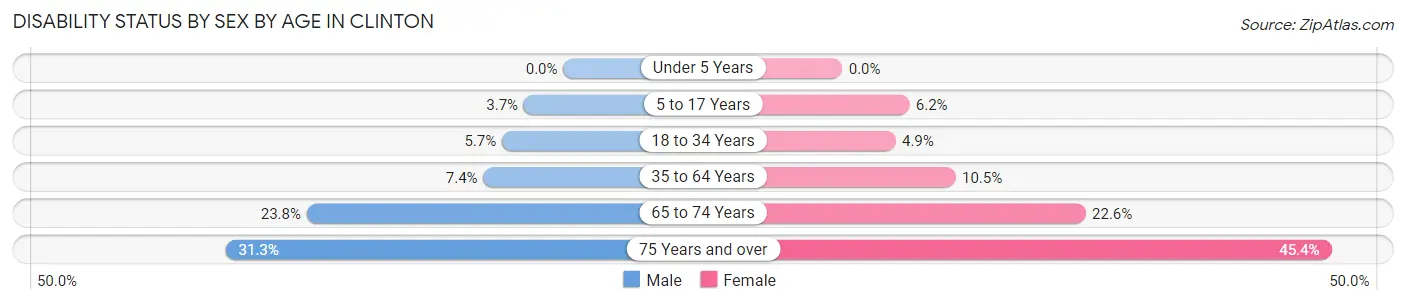
| Age Bracket | Male | Female |
| Under 5 Years | 0 (0.0%) | 0 (0.0%) |
| 5 to 17 Years | 111 (3.7%) | 182 (6.2%) |
| 18 to 34 Years | 246 (5.7%) | 175 (4.9%) |
| 35 to 64 Years | 610 (7.4%) | 963 (10.5%) |
| 65 to 74 Years | 508 (23.8%) | 548 (22.6%) |
| 75 Years and over | 252 (31.3%) | 618 (45.4%) |
Disability Class by Sex by Age in Clinton
Disability Class: Hearing Difficulty
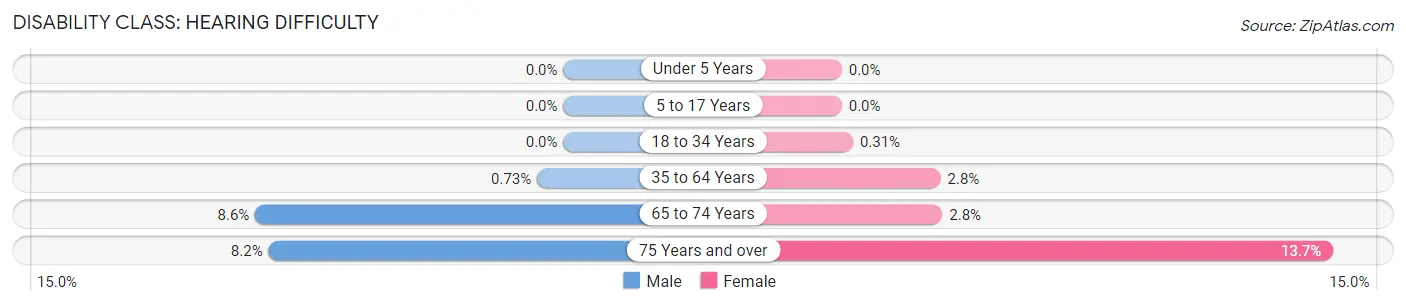
| Age Bracket | Male | Female |
| Under 5 Years | 0 (0.0%) | 0 (0.0%) |
| 5 to 17 Years | 0 (0.0%) | 0 (0.0%) |
| 18 to 34 Years | 0 (0.0%) | 11 (0.3%) |
| 35 to 64 Years | 60 (0.7%) | 252 (2.8%) |
| 65 to 74 Years | 183 (8.6%) | 68 (2.8%) |
| 75 Years and over | 66 (8.2%) | 186 (13.7%) |
Disability Class: Vision Difficulty
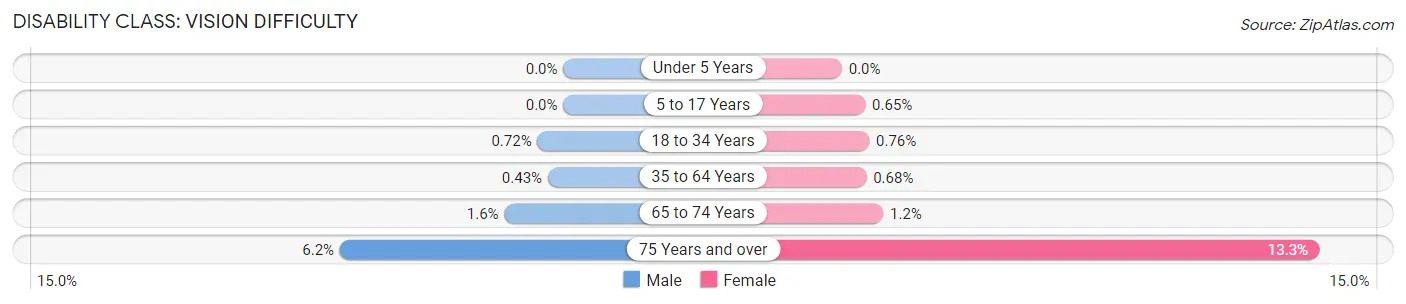
| Age Bracket | Male | Female |
| Under 5 Years | 0 (0.0%) | 0 (0.0%) |
| 5 to 17 Years | 0 (0.0%) | 19 (0.6%) |
| 18 to 34 Years | 31 (0.7%) | 27 (0.8%) |
| 35 to 64 Years | 35 (0.4%) | 62 (0.7%) |
| 65 to 74 Years | 35 (1.6%) | 28 (1.1%) |
| 75 Years and over | 50 (6.2%) | 181 (13.3%) |
Disability Class: Cognitive Difficulty
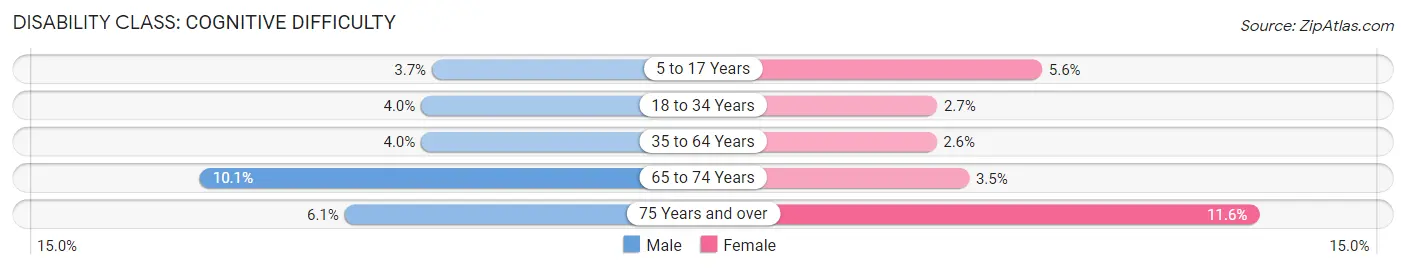
| Age Bracket | Male | Female |
| 5 to 17 Years | 111 (3.7%) | 163 (5.6%) |
| 18 to 34 Years | 171 (4.0%) | 94 (2.6%) |
| 35 to 64 Years | 326 (4.0%) | 241 (2.6%) |
| 65 to 74 Years | 216 (10.1%) | 86 (3.5%) |
| 75 Years and over | 49 (6.1%) | 158 (11.6%) |
Disability Class: Ambulatory Difficulty
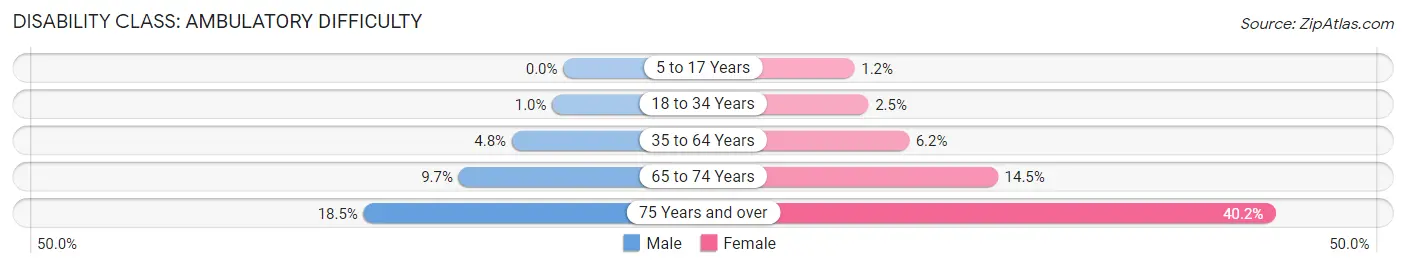
| Age Bracket | Male | Female |
| 5 to 17 Years | 0 (0.0%) | 34 (1.2%) |
| 18 to 34 Years | 44 (1.0%) | 87 (2.5%) |
| 35 to 64 Years | 392 (4.8%) | 569 (6.2%) |
| 65 to 74 Years | 207 (9.7%) | 351 (14.5%) |
| 75 Years and over | 149 (18.5%) | 547 (40.2%) |
Disability Class: Self-Care Difficulty
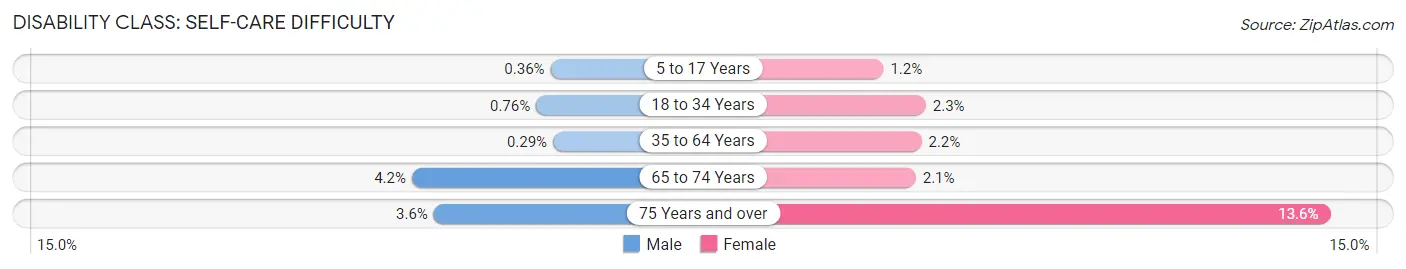
| Age Bracket | Male | Female |
| 5 to 17 Years | 11 (0.4%) | 34 (1.2%) |
| 18 to 34 Years | 33 (0.8%) | 83 (2.3%) |
| 35 to 64 Years | 24 (0.3%) | 203 (2.2%) |
| 65 to 74 Years | 90 (4.2%) | 50 (2.1%) |
| 75 Years and over | 29 (3.6%) | 185 (13.6%) |
Technology Access in Clinton
Computing Device Access in Clinton
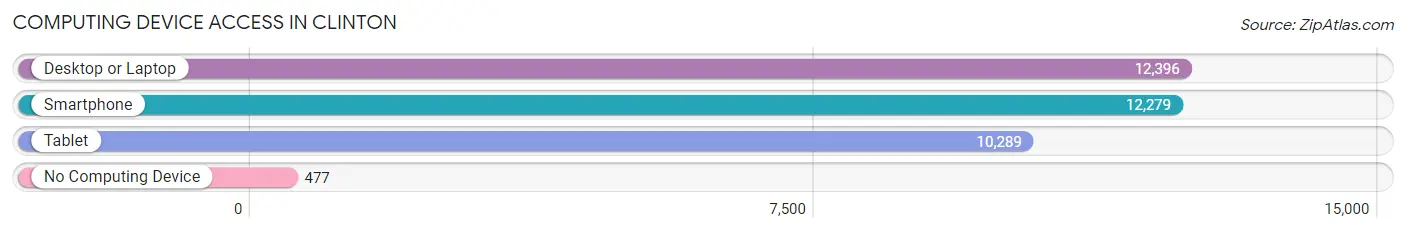
| Device Type | # Households | % Households |
| Desktop or Laptop | 12,396 | 91.1% |
| Smartphone | 12,279 | 90.2% |
| Tablet | 10,289 | 75.6% |
| No Computing Device | 477 | 3.5% |
| Total | 13,605 | 100.0% |
Internet Access in Clinton
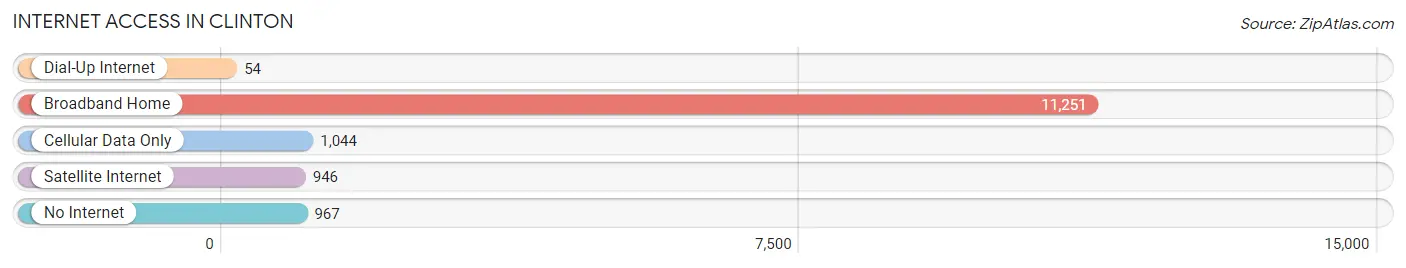
| Internet Type | # Households | % Households |
| Dial-Up Internet | 54 | 0.4% |
| Broadband Home | 11,251 | 82.7% |
| Cellular Data Only | 1,044 | 7.7% |
| Satellite Internet | 946 | 7.0% |
| No Internet | 967 | 7.1% |
| Total | 13,605 | 100.0% |
Clinton Summary
Clinton, Maryland is a small town located in Prince George’s County, Maryland, just outside of Washington, D.C. It is a part of the Washington Metropolitan Area and is home to a population of about 35,000 people. Clinton is known for its small-town charm and its close proximity to the nation’s capital.
History
The area that is now Clinton was first settled in the late 1700s by a group of Quakers from Pennsylvania. The town was originally known as Surrattsville, after the Surratt family who owned much of the land in the area. The town was renamed Clinton in 1872 after the nearby post office was named for DeWitt Clinton, the former governor of New York.
In the late 1800s, Clinton began to grow as a railroad town. The Baltimore and Ohio Railroad built a station in the town, and the town became a popular stop for travelers. The town also became a popular destination for African Americans who were looking for work in the area.
In the early 1900s, the town began to grow rapidly. The population increased from just over 1,000 in 1900 to over 5,000 by 1930. The town was incorporated in 1924 and the population continued to grow throughout the 20th century.
Geography
Clinton is located in Prince George’s County, Maryland, just outside of Washington, D.C. It is bordered by the towns of Brandywine, Waldorf, and White Plains. The town is situated on the banks of the Potomac River and is about 20 miles south of Washington, D.C.
The town has a total area of 4.2 square miles, all of which is land. The town is mostly flat, with some rolling hills in the northern part of town. The town is located in a humid subtropical climate zone, with hot, humid summers and mild winters.
Economy
The economy of Clinton is largely based on the service industry. The town is home to several large employers, including the Prince George’s County Public Schools, the University of Maryland Medical Center, and the National Institutes of Health. The town is also home to several small businesses, including restaurants, retail stores, and professional services.
The median household income in Clinton is $76,000, which is higher than the national average. The unemployment rate in the town is 4.2%, which is lower than the national average.
Demographics
As of the 2010 census, the population of Clinton was 35,094. The racial makeup of the town was 57.3% African American, 33.2% White, 4.2% Hispanic or Latino, 2.2% Asian, and 0.3% Native American.
The median age in Clinton is 37.5 years, which is slightly lower than the national average. The town has a higher percentage of people under the age of 18 than the national average, and a lower percentage of people over the age of 65.
The town has a higher percentage of people with a college degree than the national average. The town also has a higher percentage of people with a high school diploma or equivalent than the national average.
Conclusion
Clinton, Maryland is a small town located in Prince George’s County, Maryland, just outside of Washington, D.C. It is known for its small-town charm and its close proximity to the nation’s capital. The town has a rich history, a diverse geography, and a strong economy. The town is home to a population of about 35,000 people, with a median age of 37.5 years and a median household income of $76,000. The town has a higher percentage of people with a college degree than the national average, and a lower percentage of people over the age of 65.
Common Questions
What is Per Capita Income in Clinton?
Per Capita income in Clinton is $48,945.
What is the Median Family Income in Clinton?
Median Family Income in Clinton is $137,985.
What is the Median Household income in Clinton?
Median Household Income in Clinton is $122,266.
What is Income or Wage Gap in Clinton?
Income or Wage Gap in Clinton is 2.3%.
Women in Clinton earn 97.7 cents for every dollar earned by a man.
What is Family Income Deficit in Clinton?
Family Income Deficit in Clinton is $9,677.
Families that are below poverty line in Clinton earn $9,677 less on average than the poverty threshold level.
What is Inequality or Gini Index in Clinton?
Inequality or Gini Index in Clinton is 0.36.
What is the Total Population of Clinton?
Total Population of Clinton is 40,224.
What is the Total Male Population of Clinton?
Total Male Population of Clinton is 19,756.
What is the Total Female Population of Clinton?
Total Female Population of Clinton is 20,468.
What is the Ratio of Males per 100 Females in Clinton?
There are 96.52 Males per 100 Females in Clinton.
What is the Ratio of Females per 100 Males in Clinton?
There are 103.60 Females per 100 Males in Clinton.
What is the Median Population Age in Clinton?
Median Population Age in Clinton is 44.5 Years.
What is the Average Family Size in Clinton
Average Family Size in Clinton is 3.4 People.
What is the Average Household Size in Clinton
Average Household Size in Clinton is 2.9 People.
How Large is the Labor Force in Clinton?
There are 22,721 People in the Labor Forcein in Clinton.
What is the Percentage of People in the Labor Force in Clinton?
67.5% of People are in the Labor Force in Clinton.
What is the Unemployment Rate in Clinton?
Unemployment Rate in Clinton is 5.7%.