Pylesville, MD Map & Demographics
Pylesville Map
Pylesville Overview
$48,077
PER CAPITA INCOME
$160,142
AVG FAMILY INCOME
$160,142
AVG HOUSEHOLD INCOME
68.7%
WAGE / INCOME GAP [ % ]
31.3¢/ $1
WAGE / INCOME GAP [ $ ]
0.50
INEQUALITY / GINI INDEX
780
TOTAL POPULATION
317
MALE POPULATION
463
FEMALE POPULATION
68.47
MALES / 100 FEMALES
146.06
FEMALES / 100 MALES
28.3
MEDIAN AGE
3.3
AVG FAMILY SIZE
3.5
AVG HOUSEHOLD SIZE
349
LABOR FORCE [ PEOPLE ]
77.4%
PERCENT IN LABOR FORCE
Pylesville Zip Codes
Pylesville Area Codes
Income in Pylesville
Income Overview in Pylesville
Per Capita Income in Pylesville is $48,077, while median incomes of families and households are $160,142 and $160,142 respectively.
| Characteristic | Number | Measure |
| Per Capita Income | 780 | $48,077 |
| Median Family Income | 222 | $160,142 |
| Mean Family Income | 222 | $166,748 |
| Median Household Income | 222 | $160,142 |
| Mean Household Income | 222 | $170,989 |
| Income Deficit | 222 | $0 |
| Wage / Income Gap (%) | 780 | 68.72% |
| Wage / Income Gap ($) | 780 | 31.28¢ per $1 |
| Gini / Inequality Index | 780 | 0.50 |
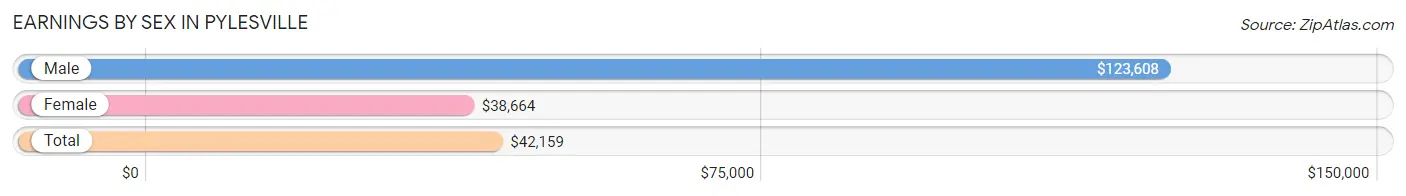
Earnings by Sex in Pylesville
Average Earnings in Pylesville are $42,159, $123,608 for men and $38,664 for women, a difference of 68.7%.
| Sex | Number | Average Earnings |
| Male | 127 (36.4%) | $123,608 |
| Female | 222 (63.6%) | $38,664 |
| Total | 349 (100.0%) | $42,159 |
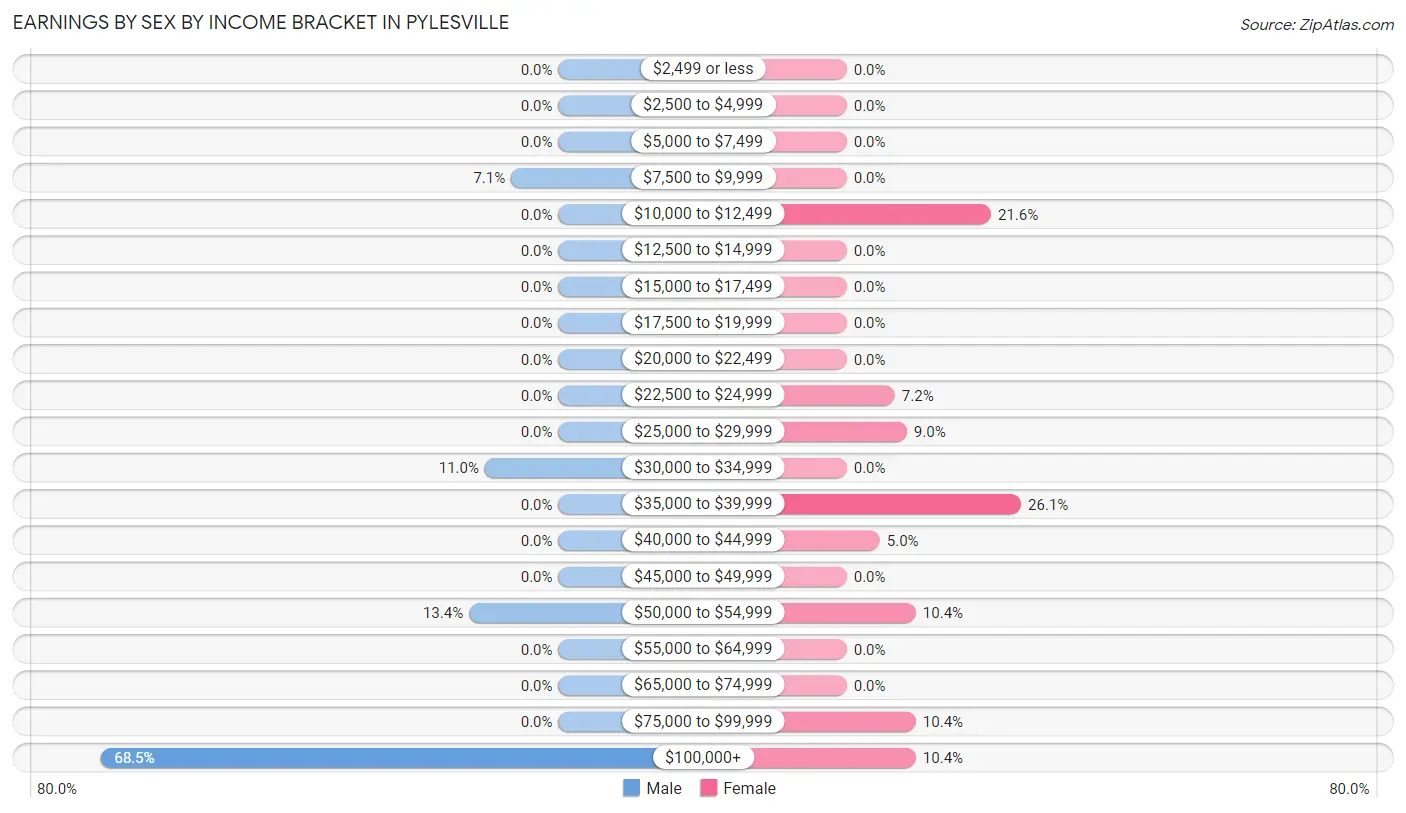
Earnings by Sex by Income Bracket in Pylesville
The most common earnings brackets in Pylesville are $100,000+ for men (87 | 68.5%) and $35,000 to $39,999 for women (58 | 26.1%).
| Income | Male | Female |
| $2,499 or less | 0 (0.0%) | 0 (0.0%) |
| $2,500 to $4,999 | 0 (0.0%) | 0 (0.0%) |
| $5,000 to $7,499 | 0 (0.0%) | 0 (0.0%) |
| $7,500 to $9,999 | 9 (7.1%) | 0 (0.0%) |
| $10,000 to $12,499 | 0 (0.0%) | 48 (21.6%) |
| $12,500 to $14,999 | 0 (0.0%) | 0 (0.0%) |
| $15,000 to $17,499 | 0 (0.0%) | 0 (0.0%) |
| $17,500 to $19,999 | 0 (0.0%) | 0 (0.0%) |
| $20,000 to $22,499 | 0 (0.0%) | 0 (0.0%) |
| $22,500 to $24,999 | 0 (0.0%) | 16 (7.2%) |
| $25,000 to $29,999 | 0 (0.0%) | 20 (9.0%) |
| $30,000 to $34,999 | 14 (11.0%) | 0 (0.0%) |
| $35,000 to $39,999 | 0 (0.0%) | 58 (26.1%) |
| $40,000 to $44,999 | 0 (0.0%) | 11 (5.0%) |
| $45,000 to $49,999 | 0 (0.0%) | 0 (0.0%) |
| $50,000 to $54,999 | 17 (13.4%) | 23 (10.4%) |
| $55,000 to $64,999 | 0 (0.0%) | 0 (0.0%) |
| $65,000 to $74,999 | 0 (0.0%) | 0 (0.0%) |
| $75,000 to $99,999 | 0 (0.0%) | 23 (10.4%) |
| $100,000+ | 87 (68.5%) | 23 (10.4%) |
| Total | 127 (100.0%) | 222 (100.0%) |
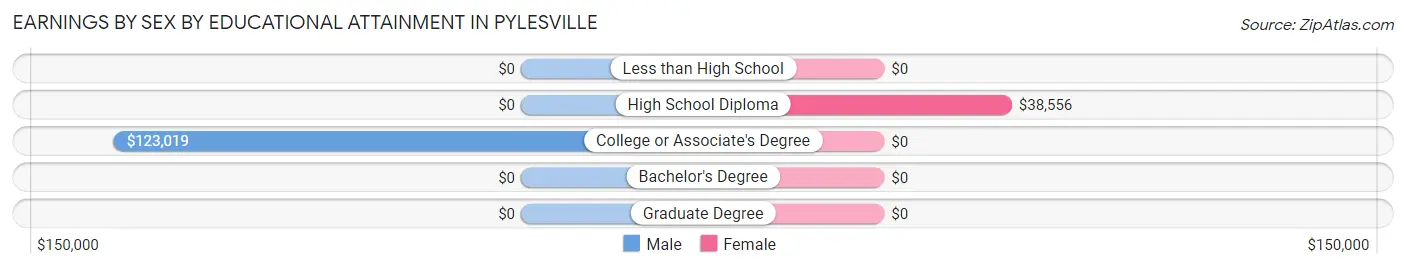
Earnings by Sex by Educational Attainment in Pylesville
Average earnings in Pylesville are $123,608 for men and $38,664 for women, a difference of 68.7%. Men with an educational attainment of college or associate's degree enjoy the highest average annual earnings of $123,019, while those with college or associate's degree education earn the least with $123,019. Women with an educational attainment of high school diploma earn the most with the average annual earnings of $38,556, while those with high school diploma education have the smallest earnings of $38,556.
| Educational Attainment | Male Income | Female Income |
| Less than High School | - | - |
| High School Diploma | - | - |
| College or Associate's Degree | $123,019 | $0 |
| Bachelor's Degree | - | - |
| Graduate Degree | - | - |
| Total | $123,608 | $38,664 |
Family Income in Pylesville
Family Income Brackets in Pylesville
According to the Pylesville family income data, there are 78 families falling into the $150,000 to $199,999 income range, which is the most common income bracket and makes up 35.1% of all families.
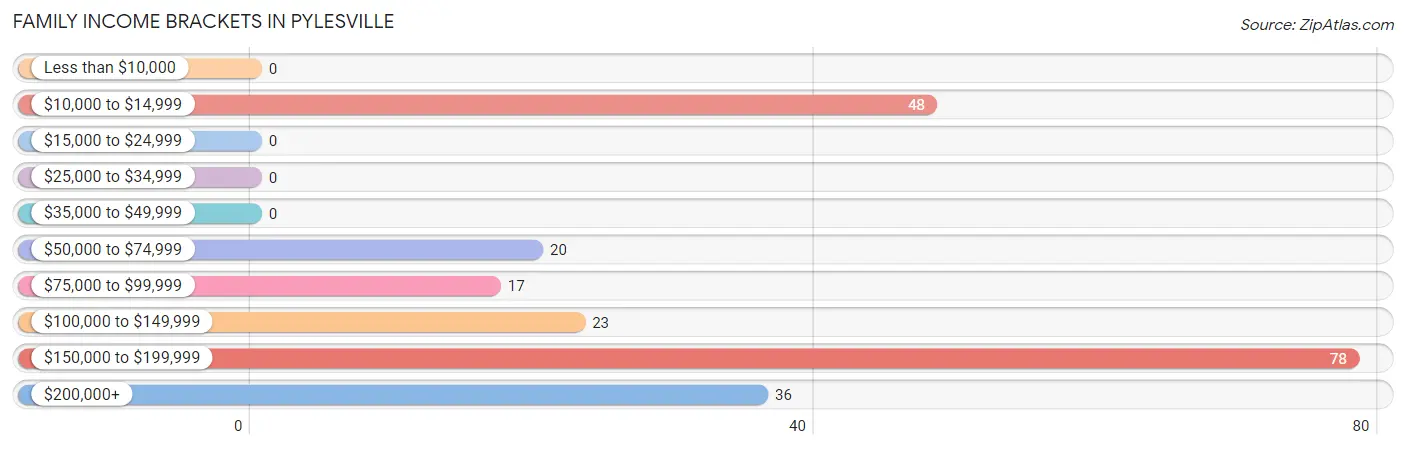
| Income Bracket | # Families | % Families |
| Less than $10,000 | 0 | 0.0% |
| $10,000 to $14,999 | 48 | 21.6% |
| $15,000 to $24,999 | 0 | 0.0% |
| $25,000 to $34,999 | 0 | 0.0% |
| $35,000 to $49,999 | 0 | 0.0% |
| $50,000 to $74,999 | 20 | 9.0% |
| $75,000 to $99,999 | 17 | 7.7% |
| $100,000 to $149,999 | 23 | 10.4% |
| $150,000 to $199,999 | 78 | 35.1% |
| $200,000+ | 36 | 16.2% |
Family Income by Famaliy Size in Pylesville
2-person families (98 | 44.1%) account for the highest median family income in Pylesville with $161,509 per family, while 2-person families (98 | 44.1%) have the highest median income of $80,754 per family member.
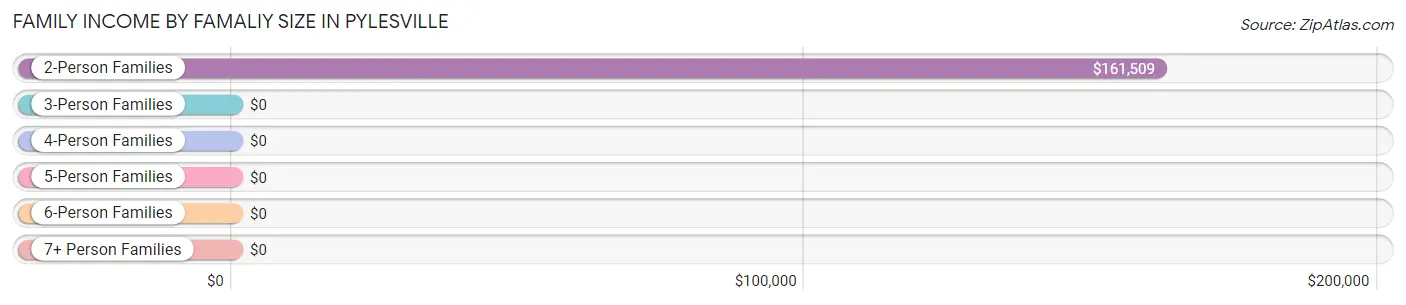
| Income Bracket | # Families | Median Income |
| 2-Person Families | 98 (44.1%) | $161,509 |
| 3-Person Families | 23 (10.4%) | $0 |
| 4-Person Families | 44 (19.8%) | $0 |
| 5-Person Families | 48 (21.6%) | $0 |
| 6-Person Families | 9 (4.1%) | $0 |
| 7+ Person Families | 0 (0.0%) | $0 |
| Total | 222 (100.0%) | $160,142 |
Family Income by Number of Earners in Pylesville
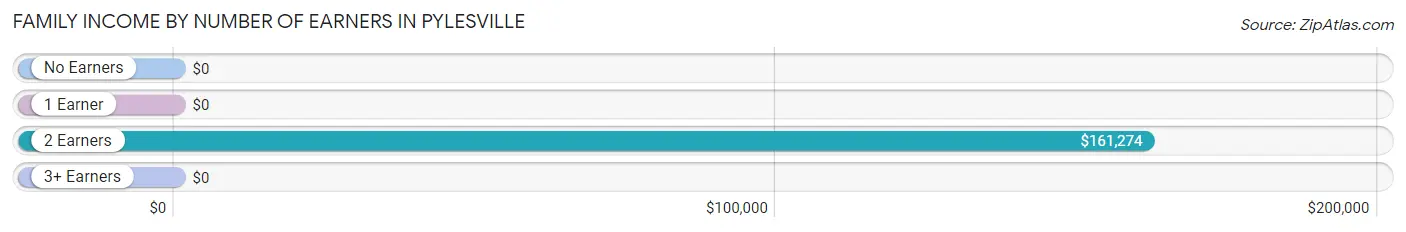
| Number of Earners | # Families | Median Income |
| No Earners | 17 (7.7%) | $0 |
| 1 Earner | 65 (29.3%) | $0 |
| 2 Earners | 140 (63.1%) | $161,274 |
| 3+ Earners | 0 (0.0%) | $0 |
| Total | 222 (100.0%) | $160,142 |
Household Income in Pylesville
Household Income Brackets in Pylesville
With 78 households falling in the category, the $150,000 to $199,999 income range is the most frequent in Pylesville, accounting for 35.1% of all households.
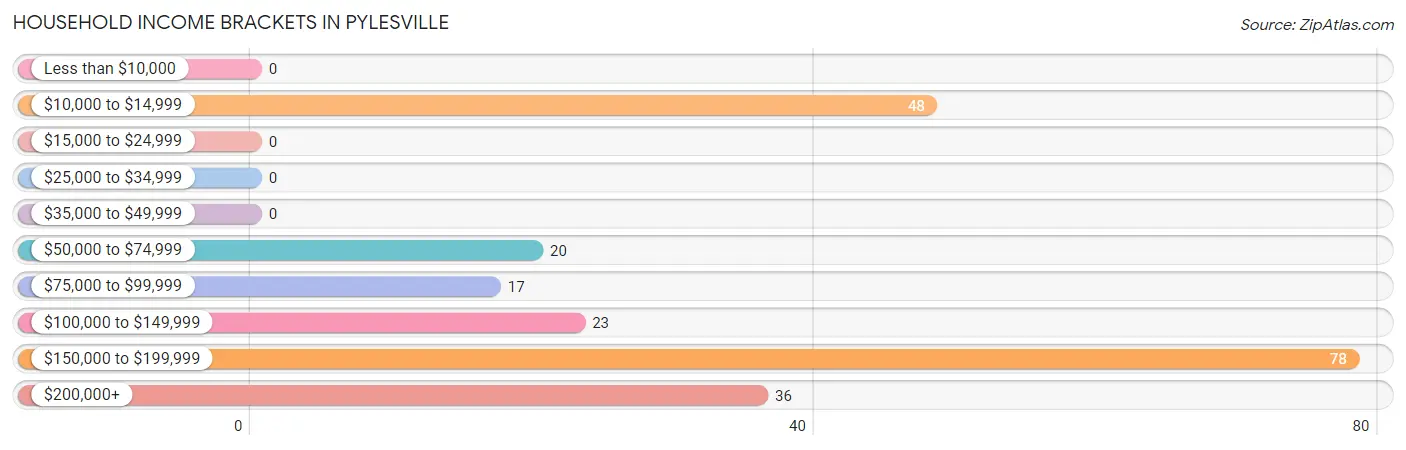
| Income Bracket | # Households | % Households |
| Less than $10,000 | 0 | 0.0% |
| $10,000 to $14,999 | 48 | 21.6% |
| $15,000 to $24,999 | 0 | 0.0% |
| $25,000 to $34,999 | 0 | 0.0% |
| $35,000 to $49,999 | 0 | 0.0% |
| $50,000 to $74,999 | 20 | 9.0% |
| $75,000 to $99,999 | 17 | 7.7% |
| $100,000 to $149,999 | 23 | 10.4% |
| $150,000 to $199,999 | 78 | 35.1% |
| $200,000+ | 36 | 16.2% |
Household Income by Householder Age in Pylesville
The median household income in Pylesville is $160,142, with the highest median household income of $160,967 found in the 45 to 64 years age bracket for the primary householder. A total of 81 households (36.5%) fall into this category.
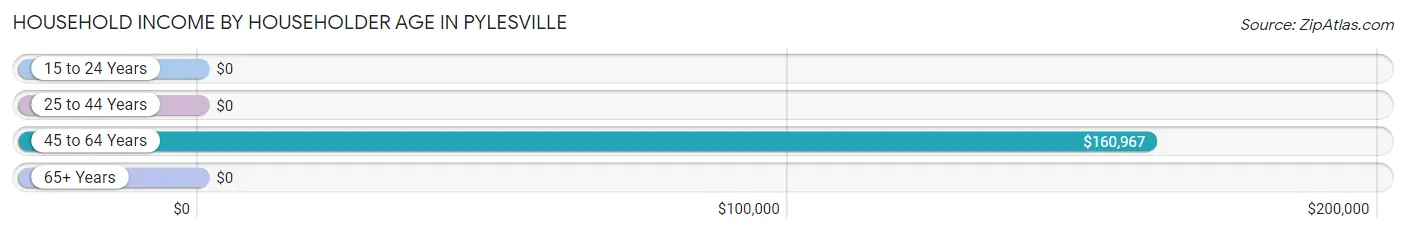
| Income Bracket | # Households | Median Income |
| 15 to 24 Years | 0 (0.0%) | $0 |
| 25 to 44 Years | 107 (48.2%) | $0 |
| 45 to 64 Years | 81 (36.5%) | $160,967 |
| 65+ Years | 34 (15.3%) | $0 |
| Total | 222 (100.0%) | $160,142 |
Poverty in Pylesville
Income Below Poverty by Sex and Age in Pylesville
With 17.5% poverty level for males and 44.0% for females among the residents of Pylesville, 6 to 11 year old males and under 5 year old females are the most vulnerable to poverty, with 54 males (53.5%) and 44 females (100.0%) in their respective age groups living below the poverty level.
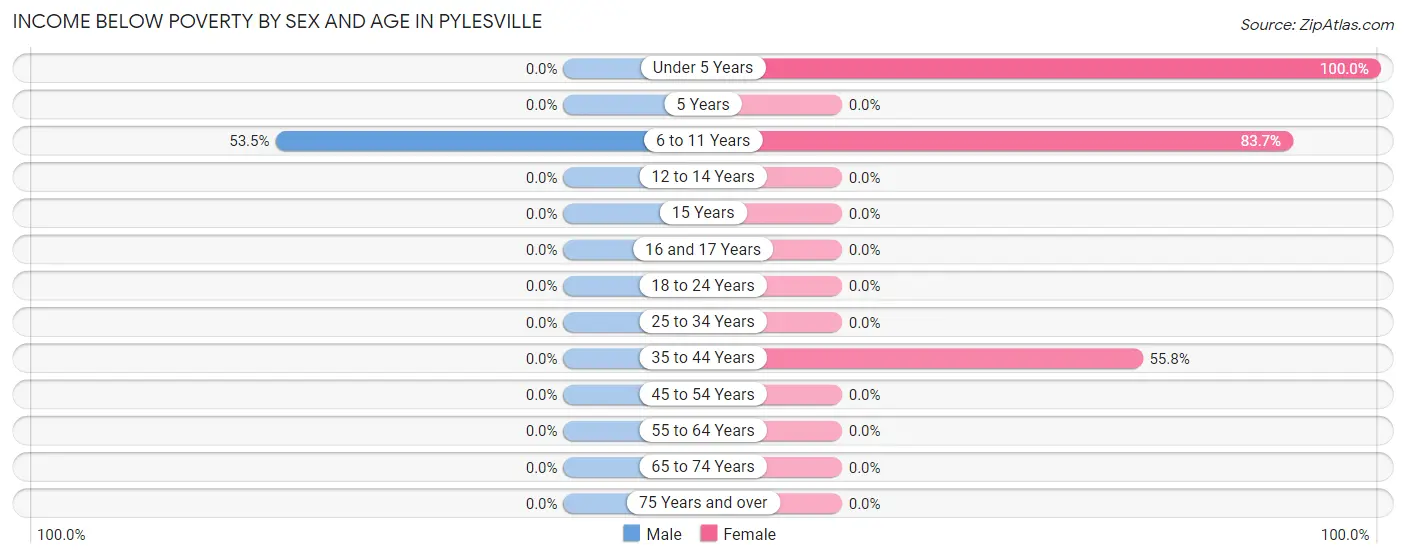
| Age Bracket | Male | Female |
| Under 5 Years | 0 (0.0%) | 44 (100.0%) |
| 5 Years | 0 (0.0%) | 0 (0.0%) |
| 6 to 11 Years | 54 (53.5%) | 108 (83.7%) |
| 12 to 14 Years | 0 (0.0%) | 0 (0.0%) |
| 15 Years | 0 (0.0%) | 0 (0.0%) |
| 16 and 17 Years | 0 (0.0%) | 0 (0.0%) |
| 18 to 24 Years | 0 (0.0%) | 0 (0.0%) |
| 25 to 34 Years | 0 (0.0%) | 0 (0.0%) |
| 35 to 44 Years | 0 (0.0%) | 48 (55.8%) |
| 45 to 54 Years | 0 (0.0%) | 0 (0.0%) |
| 55 to 64 Years | 0 (0.0%) | 0 (0.0%) |
| 65 to 74 Years | 0 (0.0%) | 0 (0.0%) |
| 75 Years and over | 0 (0.0%) | 0 (0.0%) |
| Total | 54 (17.5%) | 200 (44.0%) |
Income Above Poverty by Sex and Age in Pylesville
According to the poverty statistics in Pylesville, males aged under 5 years and females aged 12 to 14 years are the age groups that are most secure financially, with 100.0% of males and 100.0% of females in these age groups living above the poverty line.
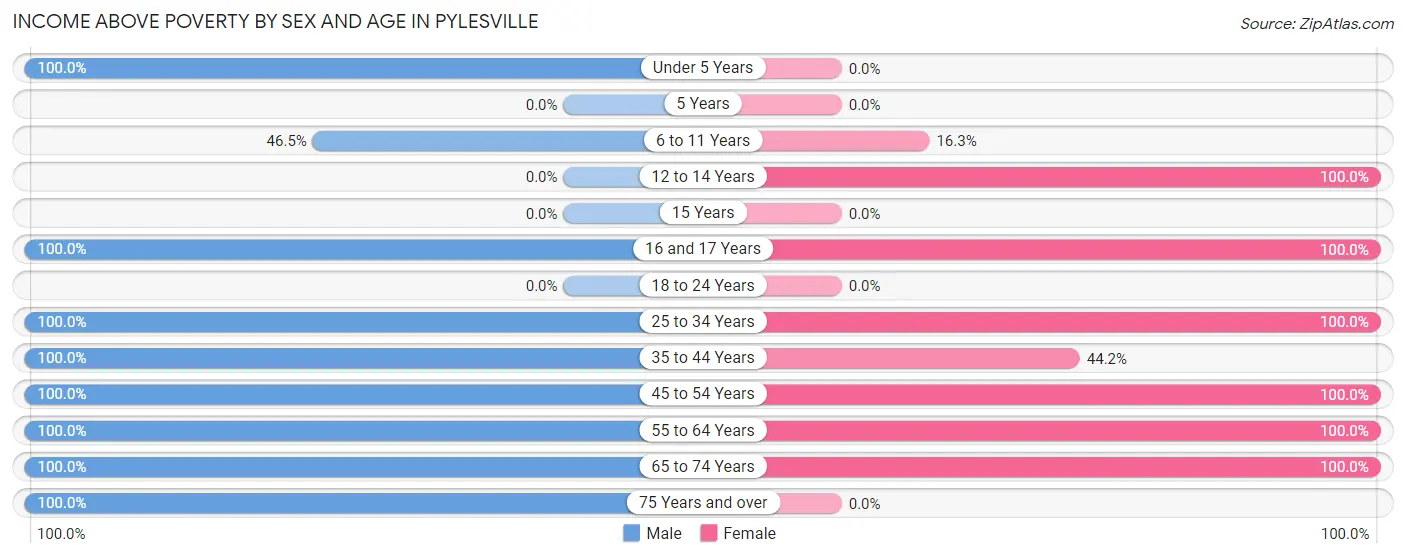
| Age Bracket | Male | Female |
| Under 5 Years | 13 (100.0%) | 0 (0.0%) |
| 5 Years | 0 (0.0%) | 0 (0.0%) |
| 6 to 11 Years | 47 (46.5%) | 21 (16.3%) |
| 12 to 14 Years | 0 (0.0%) | 25 (100.0%) |
| 15 Years | 0 (0.0%) | 0 (0.0%) |
| 16 and 17 Years | 23 (100.0%) | 18 (100.0%) |
| 18 to 24 Years | 0 (0.0%) | 0 (0.0%) |
| 25 to 34 Years | 26 (100.0%) | 34 (100.0%) |
| 35 to 44 Years | 34 (100.0%) | 38 (44.2%) |
| 45 to 54 Years | 14 (100.0%) | 28 (100.0%) |
| 55 to 64 Years | 53 (100.0%) | 74 (100.0%) |
| 65 to 74 Years | 17 (100.0%) | 17 (100.0%) |
| 75 Years and over | 27 (100.0%) | 0 (0.0%) |
| Total | 254 (82.5%) | 255 (56.0%) |
Income Below Poverty Among Married-Couple Families in Pylesville
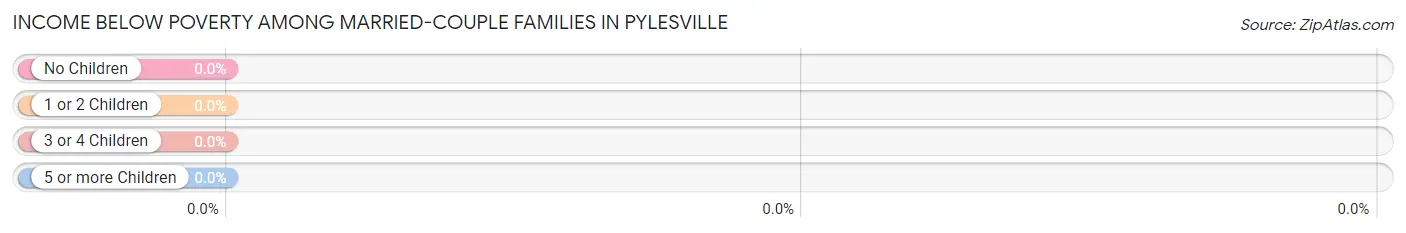
| Children | Above Poverty | Below Poverty |
| No Children | 90 (100.0%) | 0 (0.0%) |
| 1 or 2 Children | 67 (100.0%) | 0 (0.0%) |
| 3 or 4 Children | 9 (100.0%) | 0 (0.0%) |
| 5 or more Children | 0 (0.0%) | 0 (0.0%) |
| Total | 166 (100.0%) | 0 (0.0%) |
Income Below Poverty Among Single-Parent Households in Pylesville
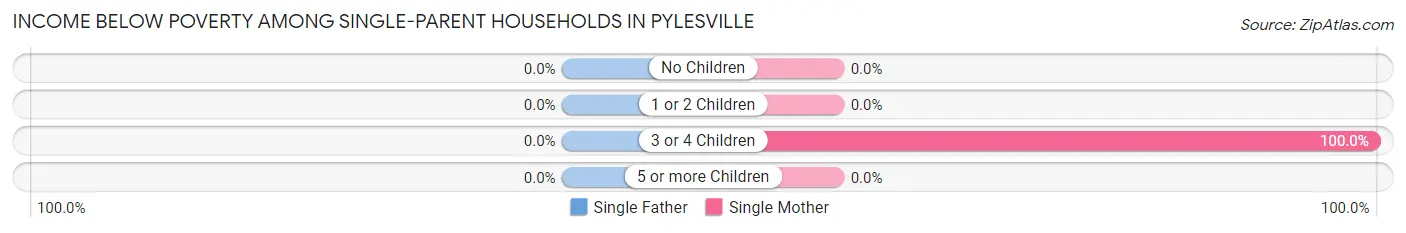
| Children | Single Father | Single Mother |
| No Children | 0 (0.0%) | 0 (0.0%) |
| 1 or 2 Children | 0 (0.0%) | 0 (0.0%) |
| 3 or 4 Children | 0 (0.0%) | 48 (100.0%) |
| 5 or more Children | 0 (0.0%) | 0 (0.0%) |
| Total | 0 (0.0%) | 48 (85.7%) |
Income Below Poverty Among Married-Couple vs Single-Parent Households in Pylesville
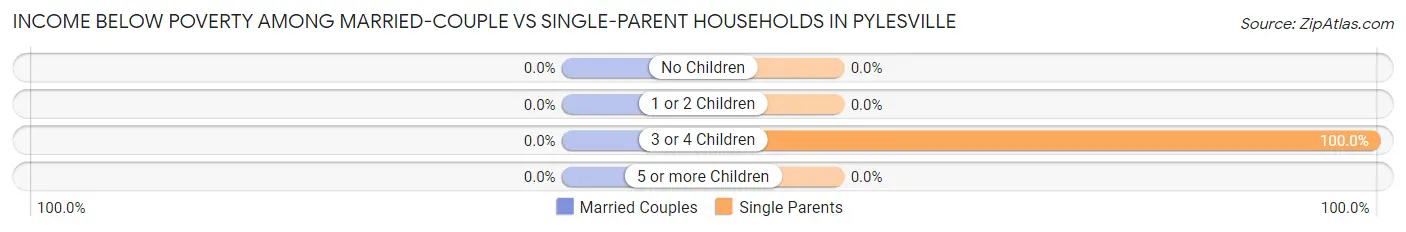
| Children | Married-Couple Families | Single-Parent Households |
| No Children | 0 (0.0%) | 0 (0.0%) |
| 1 or 2 Children | 0 (0.0%) | 0 (0.0%) |
| 3 or 4 Children | 0 (0.0%) | 48 (100.0%) |
| 5 or more Children | 0 (0.0%) | 0 (0.0%) |
| Total | 0 (0.0%) | 48 (85.7%) |
Race in Pylesville
The most populous races in Pylesville are , and White / Caucasian (780 | 100.0%).
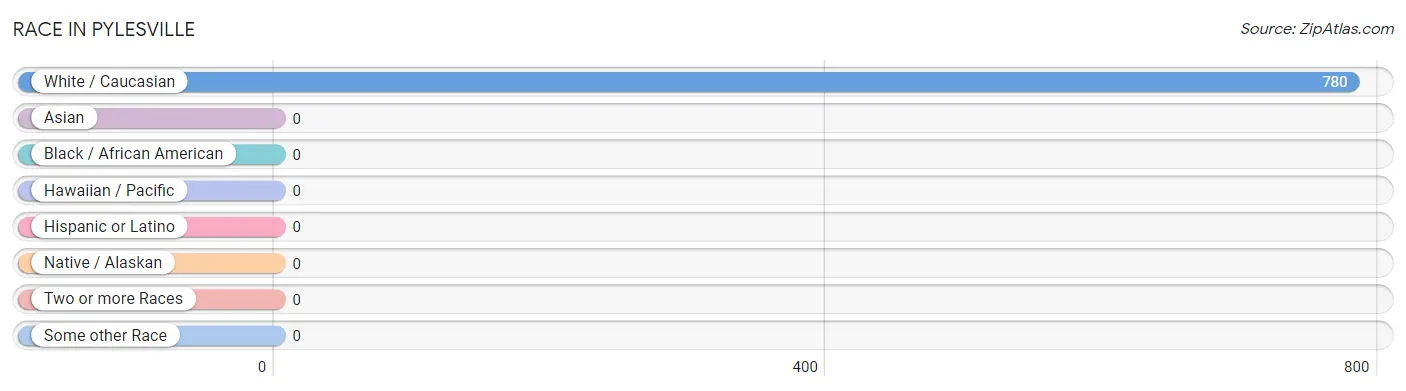
| Race | # Population | % Population |
| Asian | 0 | 0.0% |
| Black / African American | 0 | 0.0% |
| Hawaiian / Pacific | 0 | 0.0% |
| Hispanic or Latino | 0 | 0.0% |
| Native / Alaskan | 0 | 0.0% |
| White / Caucasian | 780 | 100.0% |
| Two or more Races | 0 | 0.0% |
| Some other Race | 0 | 0.0% |
| Total | 780 | 100.0% |
Ancestry in Pylesville
The most populous ancestries reported in Pylesville are Italian (254 | 32.6%), English (167 | 21.4%), German (105 | 13.5%), Irish (41 | 5.3%), and French (20 | 2.6%), together accounting for 75.3% of all Pylesville residents.
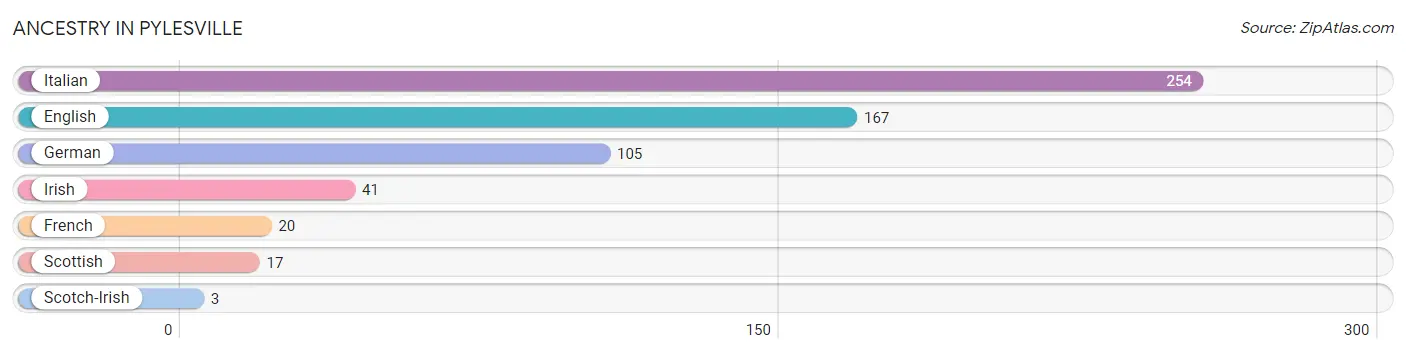
| Ancestry | # Population | % Population |
| English | 167 | 21.4% |
| French | 20 | 2.6% |
| German | 105 | 13.5% |
| Irish | 41 | 5.3% |
| Italian | 254 | 32.6% |
| Scotch-Irish | 3 | 0.4% |
| Scottish | 17 | 2.2% | View All 7 Rows |
Immigrants in Pylesville

| Immigration Origin | # Population | % Population | View All 0 Rows |
Sex and Age in Pylesville
Sex and Age in Pylesville
The most populous age groups in Pylesville are 5 to 9 Years (54 | 17.0%) for men and 10 to 14 Years (133 | 28.7%) for women.
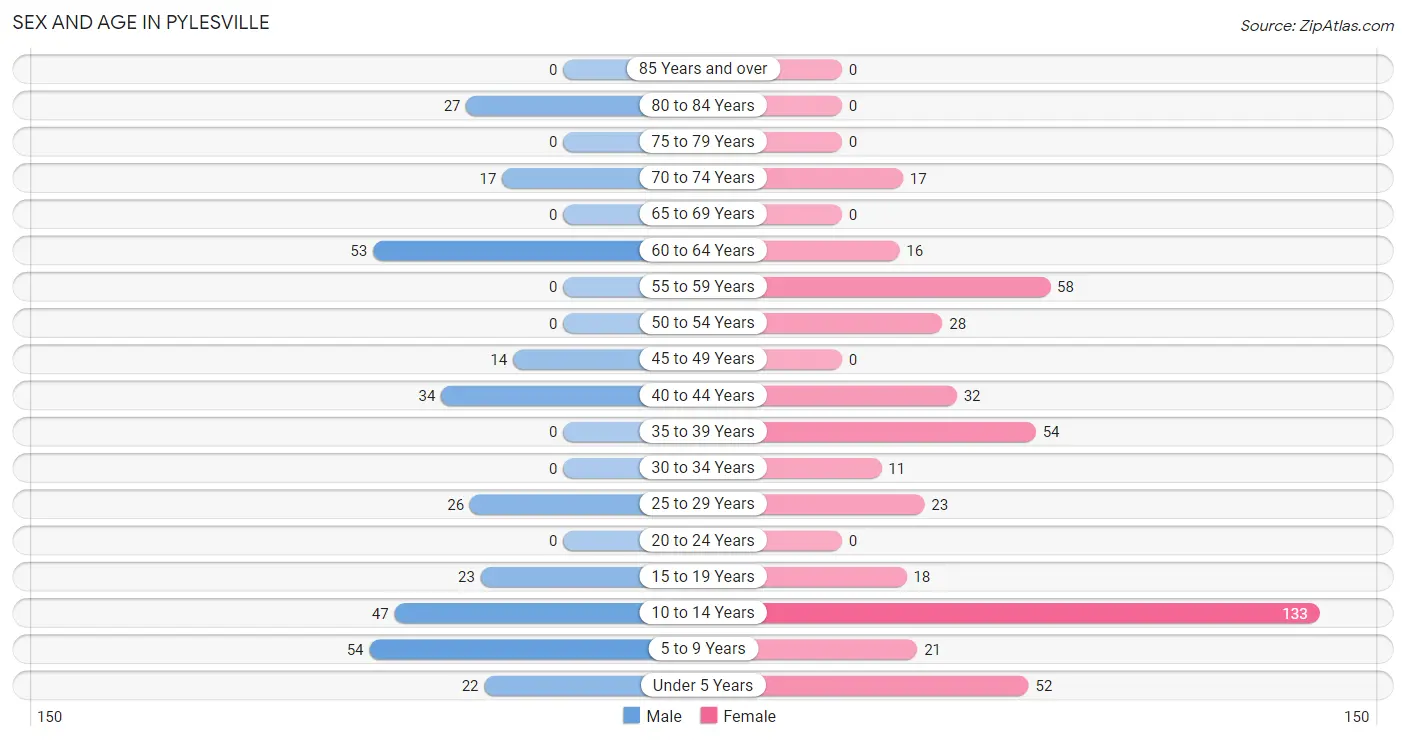
| Age Bracket | Male | Female |
| Under 5 Years | 22 (6.9%) | 52 (11.2%) |
| 5 to 9 Years | 54 (17.0%) | 21 (4.5%) |
| 10 to 14 Years | 47 (14.8%) | 133 (28.7%) |
| 15 to 19 Years | 23 (7.3%) | 18 (3.9%) |
| 20 to 24 Years | 0 (0.0%) | 0 (0.0%) |
| 25 to 29 Years | 26 (8.2%) | 23 (5.0%) |
| 30 to 34 Years | 0 (0.0%) | 11 (2.4%) |
| 35 to 39 Years | 0 (0.0%) | 54 (11.7%) |
| 40 to 44 Years | 34 (10.7%) | 32 (6.9%) |
| 45 to 49 Years | 14 (4.4%) | 0 (0.0%) |
| 50 to 54 Years | 0 (0.0%) | 28 (6.0%) |
| 55 to 59 Years | 0 (0.0%) | 58 (12.5%) |
| 60 to 64 Years | 53 (16.7%) | 16 (3.5%) |
| 65 to 69 Years | 0 (0.0%) | 0 (0.0%) |
| 70 to 74 Years | 17 (5.4%) | 17 (3.7%) |
| 75 to 79 Years | 0 (0.0%) | 0 (0.0%) |
| 80 to 84 Years | 27 (8.5%) | 0 (0.0%) |
| 85 Years and over | 0 (0.0%) | 0 (0.0%) |
| Total | 317 (100.0%) | 463 (100.0%) |
Families and Households in Pylesville
Median Family Size in Pylesville
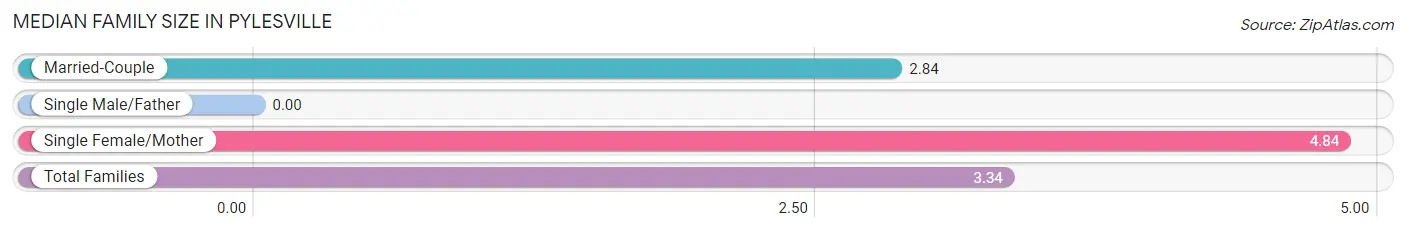
| Family Type | # Families | Family Size |
| Married-Couple | 166 (74.8%) | 2.84 |
| Single Male/Father | 0 (0.0%) | - |
| Single Female/Mother | 56 (25.2%) | 4.84 |
| Total Families | 222 (100.0%) | 3.34 |
Median Household Size in Pylesville
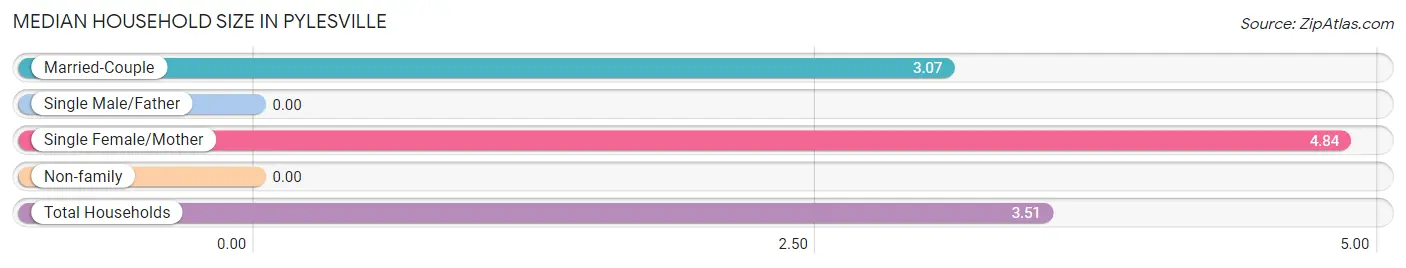
| Household Type | # Households | Household Size |
| Married-Couple | 166 (74.8%) | 3.07 |
| Single Male/Father | 0 (0.0%) | - |
| Single Female/Mother | 56 (25.2%) | 4.84 |
| Non-family | 0 (0.0%) | - |
| Total Households | 222 (100.0%) | 3.51 |
Household Size by Marriage Status in Pylesville
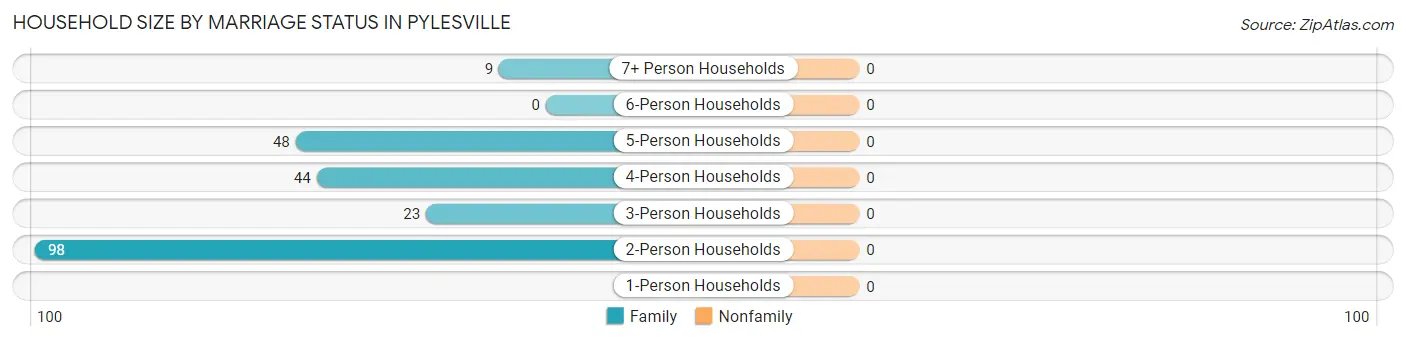
| Household Size | Family Households | Nonfamily Households |
| 1-Person Households | - | 0 (0.0%) |
| 2-Person Households | 98 (44.1%) | 0 (0.0%) |
| 3-Person Households | 23 (10.4%) | 0 (0.0%) |
| 4-Person Households | 44 (19.8%) | 0 (0.0%) |
| 5-Person Households | 48 (21.6%) | 0 (0.0%) |
| 6-Person Households | 0 (0.0%) | 0 (0.0%) |
| 7+ Person Households | 9 (4.1%) | 0 (0.0%) |
| Total | 222 (100.0%) | 0 (0.0%) |
Female Fertility in Pylesville
Fertility by Age in Pylesville
| Age Bracket | Women with Births | Births / 1,000 Women |
| 15 to 19 years | 0 (0.0%) | 0.0 |
| 20 to 34 years | 0 (0.0%) | 0.0 |
| 35 to 50 years | 0 (0.0%) | 0.0 |
| Total | 0 (0.0%) | 0.0 |
Fertility by Age by Marriage Status in Pylesville
| Age Bracket | Married | Unmarried |
| 15 to 19 years | 0 (0.0%) | 0 (0.0%) |
| 20 to 34 years | 0 (0.0%) | 0 (0.0%) |
| 35 to 50 years | 0 (0.0%) | 0 (0.0%) |
| Total | 0 (0.0%) | 0 (0.0%) |
Fertility by Education in Pylesville
| Educational Attainment | Women with Births | Births / 1,000 Women |
| Less than High School | 0 (0.0%) | 0.0 |
| High School Diploma | 0 (0.0%) | 0.0 |
| College or Associate's Degree | 0 (0.0%) | 0.0 |
| Bachelor's Degree | 0 (0.0%) | 0.0 |
| Graduate Degree | 0 (0.0%) | 0.0 |
| Total | 0 (0.0%) | 0.0 |
Fertility by Education by Marriage Status in Pylesville
| Educational Attainment | Married | Unmarried |
| Less than High School | 0 (0.0%) | 0 (0.0%) |
| High School Diploma | 0 (0.0%) | 0 (0.0%) |
| College or Associate's Degree | 0 (0.0%) | 0 (0.0%) |
| Bachelor's Degree | 0 (0.0%) | 0 (0.0%) |
| Graduate Degree | 0 (0.0%) | 0 (0.0%) |
| Total | 0 (0.0%) | 0 (0.0%) |
Employment Characteristics in Pylesville
Employment by Class of Employer in Pylesville
Among the 349 employed individuals in Pylesville, private company employees (172 | 49.3%), state government employees (53 | 15.2%), and self-employed (incorporated) (48 | 13.8%) make up the most common classes of employment.
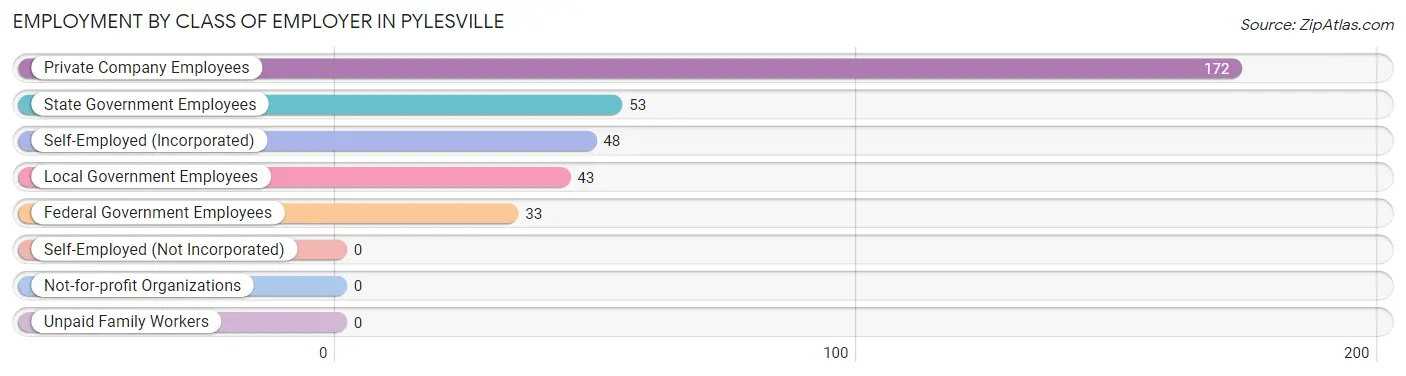
| Employer Class | # Employees | % Employees |
| Private Company Employees | 172 | 49.3% |
| Self-Employed (Incorporated) | 48 | 13.8% |
| Self-Employed (Not Incorporated) | 0 | 0.0% |
| Not-for-profit Organizations | 0 | 0.0% |
| Local Government Employees | 43 | 12.3% |
| State Government Employees | 53 | 15.2% |
| Federal Government Employees | 33 | 9.5% |
| Unpaid Family Workers | 0 | 0.0% |
| Total | 349 | 100.0% |
Employment Status by Age in Pylesville
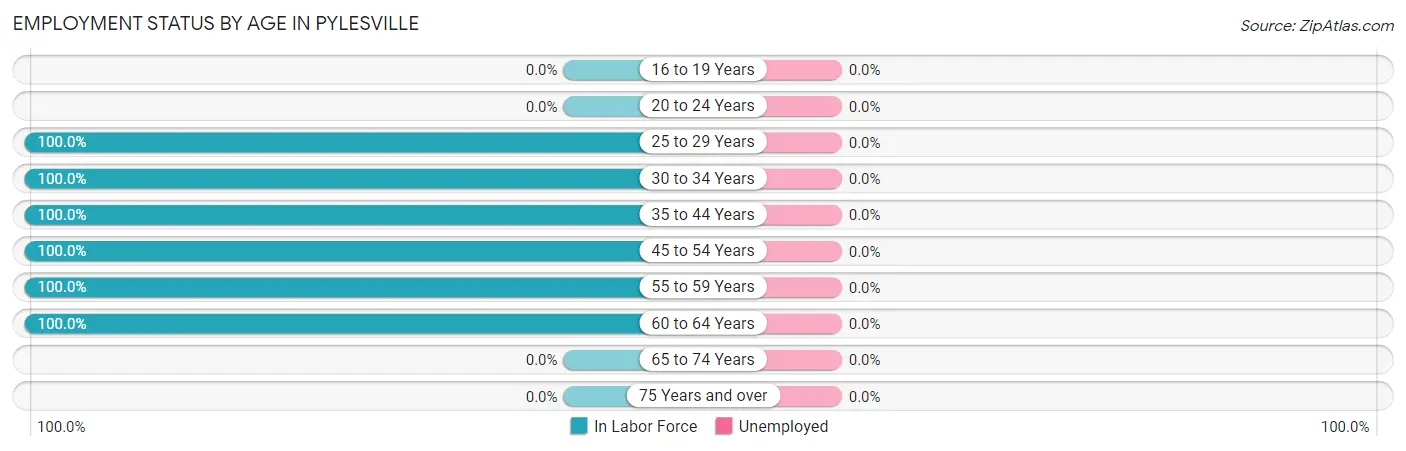
| Age Bracket | In Labor Force | Unemployed |
| 16 to 19 Years | 0 (0.0%) | 0 (0.0%) |
| 20 to 24 Years | 0 (0.0%) | 0 (0.0%) |
| 25 to 29 Years | 49 (100.0%) | 0 (0.0%) |
| 30 to 34 Years | 11 (100.0%) | 0 (0.0%) |
| 35 to 44 Years | 120 (100.0%) | 0 (0.0%) |
| 45 to 54 Years | 42 (100.0%) | 0 (0.0%) |
| 55 to 59 Years | 58 (100.0%) | 0 (0.0%) |
| 60 to 64 Years | 69 (100.0%) | 0 (0.0%) |
| 65 to 74 Years | 0 (0.0%) | 0 (0.0%) |
| 75 Years and over | 0 (0.0%) | 0 (0.0%) |
| Total | 349 (77.4%) | 0 (0.0%) |
Employment Status by Educational Attainment in Pylesville
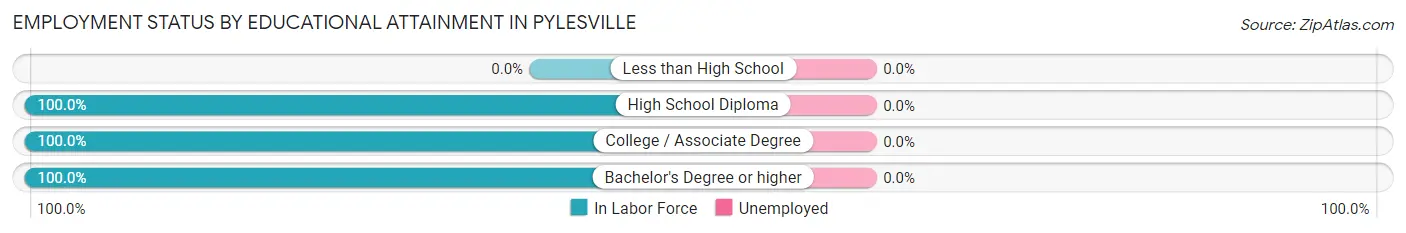
| Educational Attainment | In Labor Force | Unemployed |
| Less than High School | 0 (0.0%) | 0 (0.0%) |
| High School Diploma | 98 (100.0%) | 0 (0.0%) |
| College / Associate Degree | 123 (100.0%) | 0 (0.0%) |
| Bachelor's Degree or higher | 128 (100.0%) | 0 (0.0%) |
| Total | 349 (100.0%) | 0 (0.0%) |
Employment Occupations by Sex in Pylesville
Management, Business, Science and Arts Occupations
The most common Management, Business, Science and Arts occupations in Pylesville are Management (61 | 17.5%), Health Diagnosing & Treating (47 | 13.5%), Community & Social Service (29 | 8.3%), Health Technologists (24 | 6.9%), and Education Instruction & Library (23 | 6.6%).
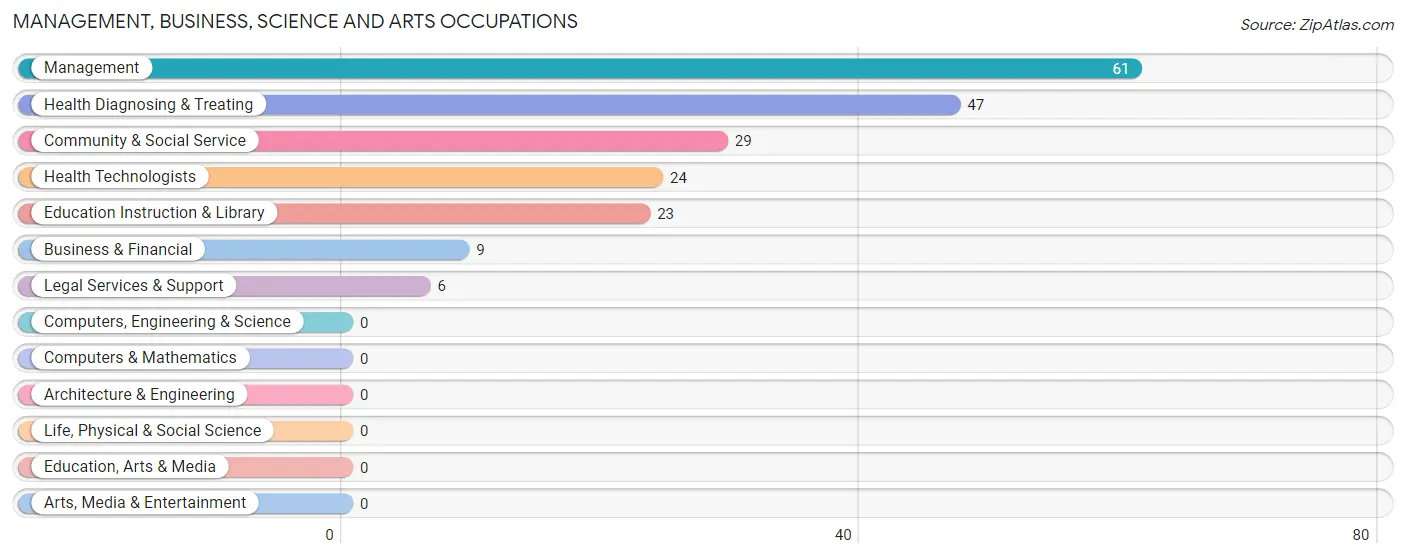
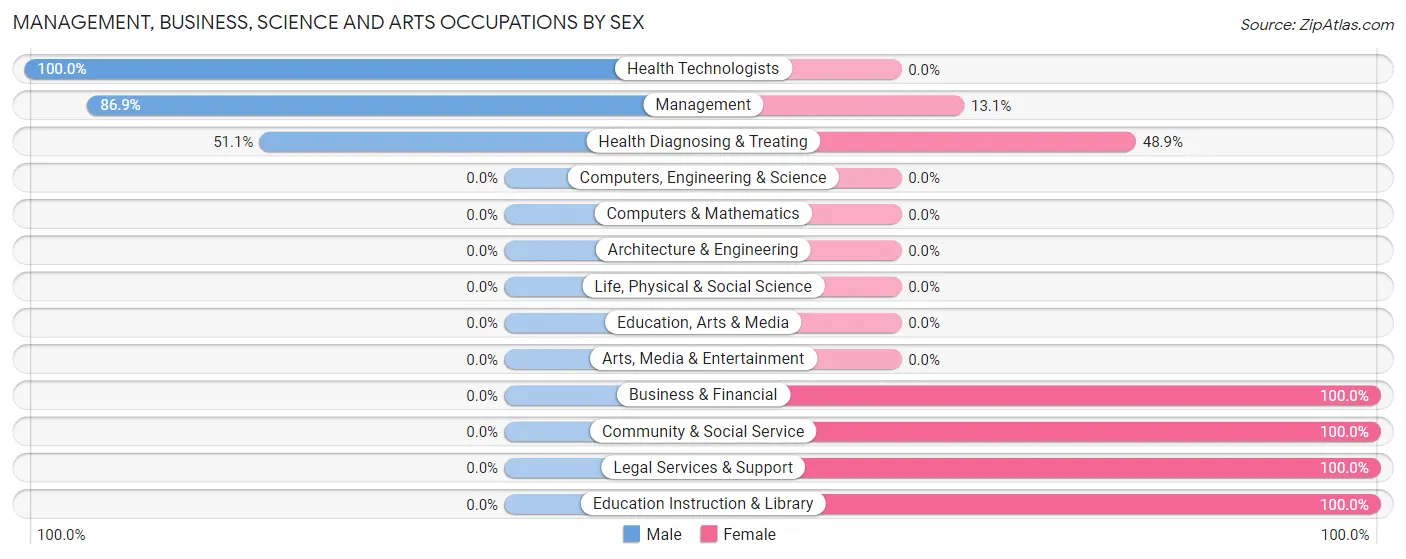
Management, Business, Science and Arts Occupations by Sex
Within the Management, Business, Science and Arts occupations in Pylesville, the most male-oriented occupations are Health Technologists (100.0%), Management (86.9%), and Health Diagnosing & Treating (51.1%), while the most female-oriented occupations are Business & Financial (100.0%), Community & Social Service (100.0%), and Legal Services & Support (100.0%).
| Occupation | Male | Female |
| Management | 53 (86.9%) | 8 (13.1%) |
| Business & Financial | 0 (0.0%) | 9 (100.0%) |
| Computers, Engineering & Science | 0 (0.0%) | 0 (0.0%) |
| Computers & Mathematics | 0 (0.0%) | 0 (0.0%) |
| Architecture & Engineering | 0 (0.0%) | 0 (0.0%) |
| Life, Physical & Social Science | 0 (0.0%) | 0 (0.0%) |
| Community & Social Service | 0 (0.0%) | 29 (100.0%) |
| Education, Arts & Media | 0 (0.0%) | 0 (0.0%) |
| Legal Services & Support | 0 (0.0%) | 6 (100.0%) |
| Education Instruction & Library | 0 (0.0%) | 23 (100.0%) |
| Arts, Media & Entertainment | 0 (0.0%) | 0 (0.0%) |
| Health Diagnosing & Treating | 24 (51.1%) | 23 (48.9%) |
| Health Technologists | 24 (100.0%) | 0 (0.0%) |
| Total (Category) | 77 (52.7%) | 69 (47.3%) |
| Total (Overall) | 127 (36.4%) | 222 (63.6%) |
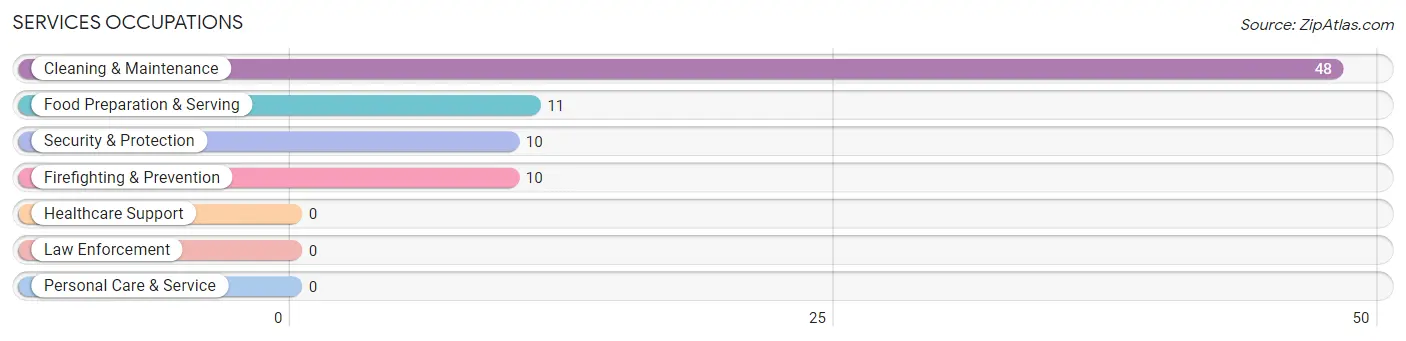
Services Occupations
The most common Services occupations in Pylesville are Cleaning & Maintenance (48 | 13.8%), Food Preparation & Serving (11 | 3.2%), Security & Protection (10 | 2.9%), and Firefighting & Prevention (10 | 2.9%).
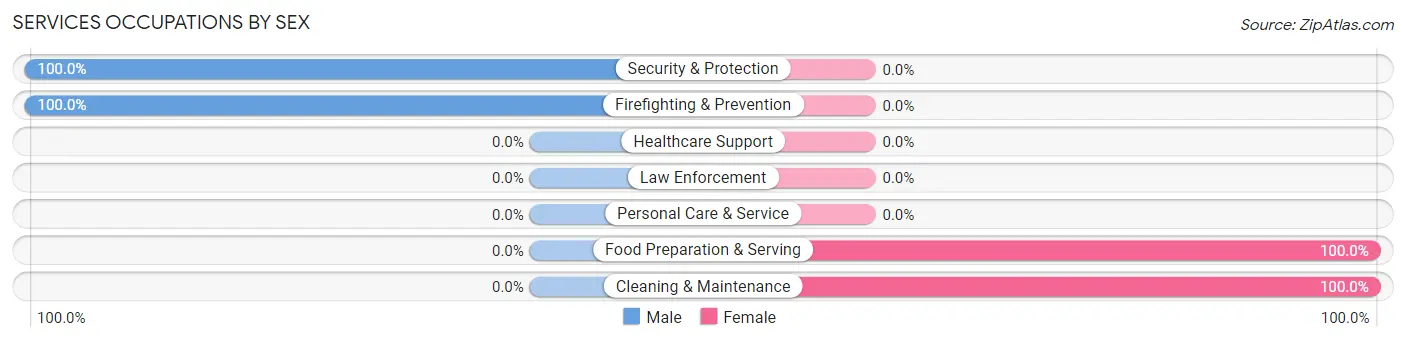
Services Occupations by Sex
Within the Services occupations in Pylesville, the most male-oriented occupations are Security & Protection (100.0%), and Firefighting & Prevention (100.0%), while the most female-oriented occupations are Food Preparation & Serving (100.0%), and Cleaning & Maintenance (100.0%).
| Occupation | Male | Female |
| Healthcare Support | 0 (0.0%) | 0 (0.0%) |
| Security & Protection | 10 (100.0%) | 0 (0.0%) |
| Firefighting & Prevention | 10 (100.0%) | 0 (0.0%) |
| Law Enforcement | 0 (0.0%) | 0 (0.0%) |
| Food Preparation & Serving | 0 (0.0%) | 11 (100.0%) |
| Cleaning & Maintenance | 0 (0.0%) | 48 (100.0%) |
| Personal Care & Service | 0 (0.0%) | 0 (0.0%) |
| Total (Category) | 10 (14.5%) | 59 (85.5%) |
| Total (Overall) | 127 (36.4%) | 222 (63.6%) |
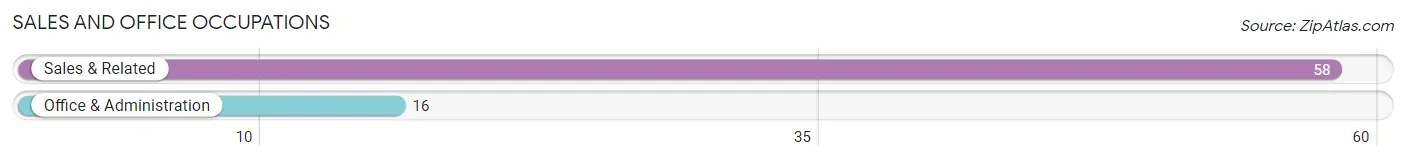
Sales and Office Occupations
The most common Sales and Office occupations in Pylesville are Sales & Related (58 | 16.6%), and Office & Administration (16 | 4.6%).
Sales and Office Occupations by Sex
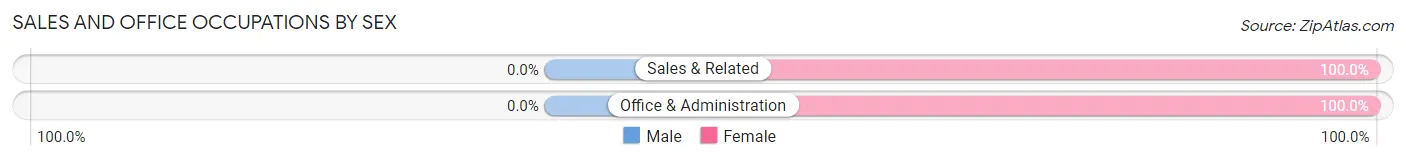
| Occupation | Male | Female |
| Sales & Related | 0 (0.0%) | 58 (100.0%) |
| Office & Administration | 0 (0.0%) | 16 (100.0%) |
| Total (Category) | 0 (0.0%) | 74 (100.0%) |
| Total (Overall) | 127 (36.4%) | 222 (63.6%) |
Natural Resources, Construction and Maintenance Occupations
The most common Natural Resources, Construction and Maintenance occupations in Pylesville are , and Installation, Maintenance & Repair (17 | 4.9%).

Natural Resources, Construction and Maintenance Occupations by Sex

| Occupation | Male | Female |
| Farming, Fishing & Forestry | 0 (0.0%) | 0 (0.0%) |
| Construction & Extraction | 0 (0.0%) | 0 (0.0%) |
| Installation, Maintenance & Repair | 17 (100.0%) | 0 (0.0%) |
| Total (Category) | 17 (100.0%) | 0 (0.0%) |
| Total (Overall) | 127 (36.4%) | 222 (63.6%) |
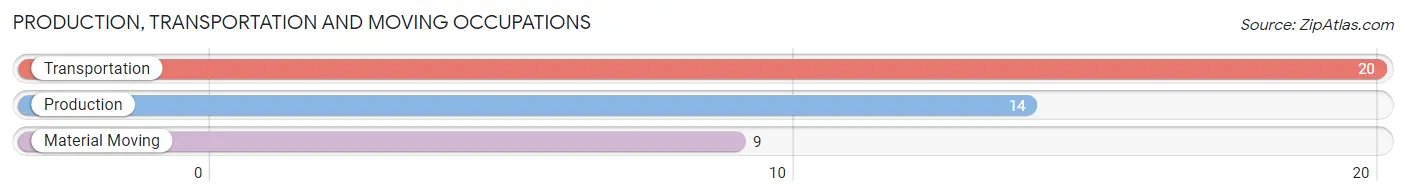
Production, Transportation and Moving Occupations
The most common Production, Transportation and Moving occupations in Pylesville are Transportation (20 | 5.7%), Production (14 | 4.0%), and Material Moving (9 | 2.6%).
Production, Transportation and Moving Occupations by Sex
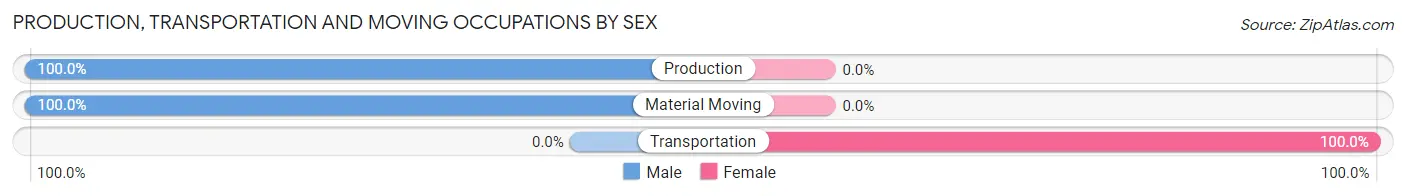
| Occupation | Male | Female |
| Production | 14 (100.0%) | 0 (0.0%) |
| Transportation | 0 (0.0%) | 20 (100.0%) |
| Material Moving | 9 (100.0%) | 0 (0.0%) |
| Total (Category) | 23 (53.5%) | 20 (46.5%) |
| Total (Overall) | 127 (36.4%) | 222 (63.6%) |
Employment Industries by Sex in Pylesville
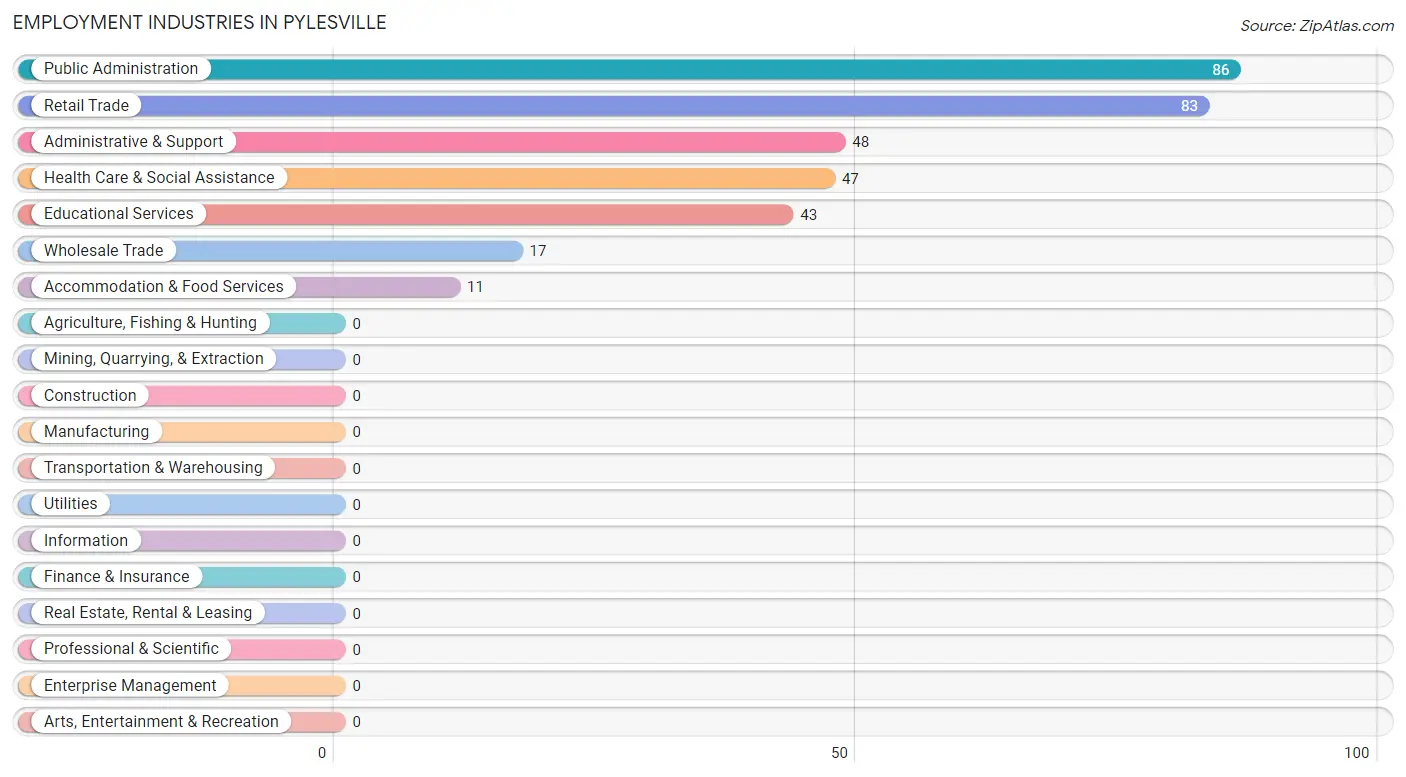
Employment Industries in Pylesville
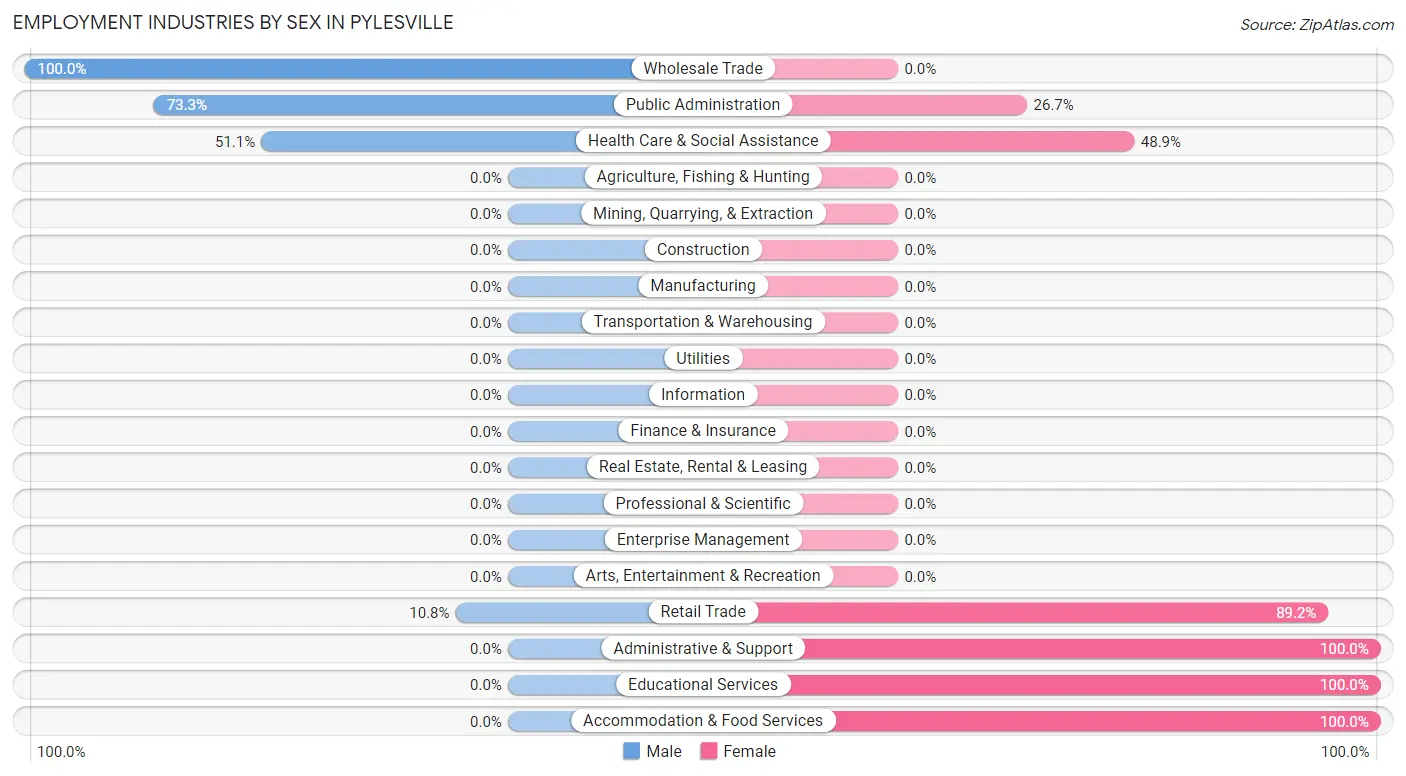
The major employment industries in Pylesville include Public Administration (86 | 24.6%), Retail Trade (83 | 23.8%), Administrative & Support (48 | 13.8%), Health Care & Social Assistance (47 | 13.5%), and Educational Services (43 | 12.3%).
Employment Industries by Sex in Pylesville
The Pylesville industries that see more men than women are Wholesale Trade (100.0%), Public Administration (73.3%), and Health Care & Social Assistance (51.1%), whereas the industries that tend to have a higher number of women are Administrative & Support (100.0%), Educational Services (100.0%), and Accommodation & Food Services (100.0%).
| Industry | Male | Female |
| Agriculture, Fishing & Hunting | 0 (0.0%) | 0 (0.0%) |
| Mining, Quarrying, & Extraction | 0 (0.0%) | 0 (0.0%) |
| Construction | 0 (0.0%) | 0 (0.0%) |
| Manufacturing | 0 (0.0%) | 0 (0.0%) |
| Wholesale Trade | 17 (100.0%) | 0 (0.0%) |
| Retail Trade | 9 (10.8%) | 74 (89.2%) |
| Transportation & Warehousing | 0 (0.0%) | 0 (0.0%) |
| Utilities | 0 (0.0%) | 0 (0.0%) |
| Information | 0 (0.0%) | 0 (0.0%) |
| Finance & Insurance | 0 (0.0%) | 0 (0.0%) |
| Real Estate, Rental & Leasing | 0 (0.0%) | 0 (0.0%) |
| Professional & Scientific | 0 (0.0%) | 0 (0.0%) |
| Enterprise Management | 0 (0.0%) | 0 (0.0%) |
| Administrative & Support | 0 (0.0%) | 48 (100.0%) |
| Educational Services | 0 (0.0%) | 43 (100.0%) |
| Health Care & Social Assistance | 24 (51.1%) | 23 (48.9%) |
| Arts, Entertainment & Recreation | 0 (0.0%) | 0 (0.0%) |
| Accommodation & Food Services | 0 (0.0%) | 11 (100.0%) |
| Public Administration | 63 (73.3%) | 23 (26.7%) |
| Total | 127 (36.4%) | 222 (63.6%) |
Education in Pylesville
School Enrollment in Pylesville
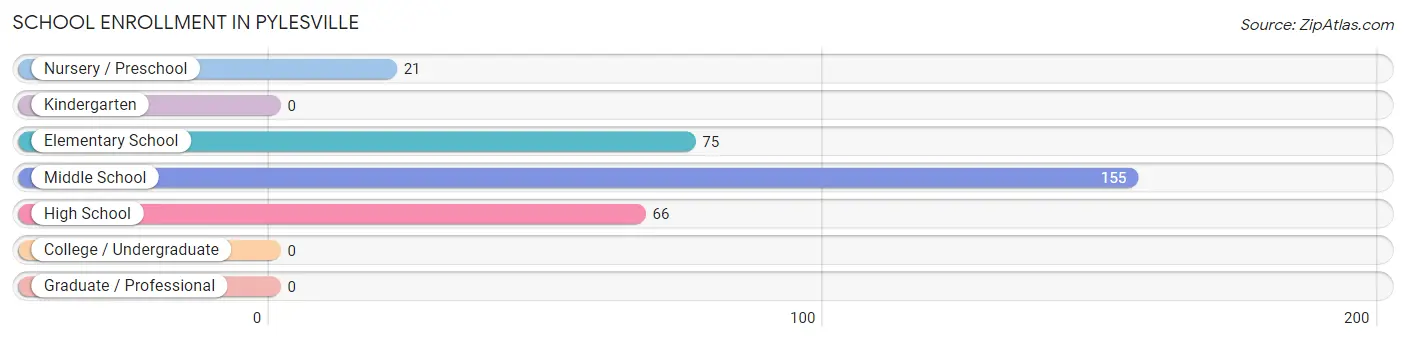
The most common levels of schooling among the 317 students in Pylesville are middle school (155 | 48.9%), elementary school (75 | 23.7%), and high school (66 | 20.8%).
| School Level | # Students | % Students |
| Nursery / Preschool | 21 | 6.6% |
| Kindergarten | 0 | 0.0% |
| Elementary School | 75 | 23.7% |
| Middle School | 155 | 48.9% |
| High School | 66 | 20.8% |
| College / Undergraduate | 0 | 0.0% |
| Graduate / Professional | 0 | 0.0% |
| Total | 317 | 100.0% |
School Enrollment by Age by Funding Source in Pylesville
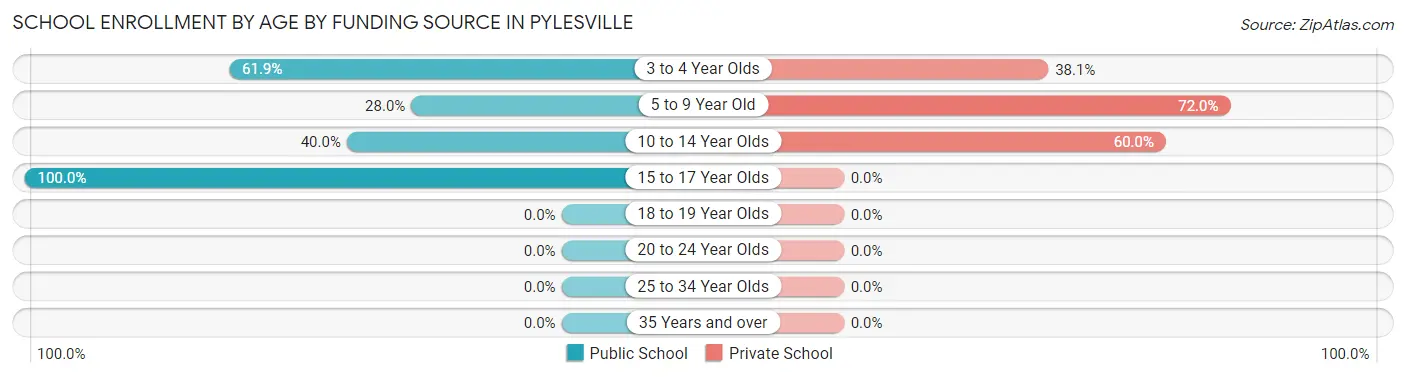
Out of a total of 317 students who are enrolled in schools in Pylesville, 170 (53.6%) attend a private institution, while the remaining 147 (46.4%) are enrolled in public schools. The age group of 5 to 9 year old has the highest likelihood of being enrolled in private schools, with 54 (72.0% in the age bracket) enrolled. Conversely, the age group of 15 to 17 year olds has the lowest likelihood of being enrolled in a private school, with 41 (100.0% in the age bracket) attending a public institution.
| Age Bracket | Public School | Private School |
| 3 to 4 Year Olds | 13 (61.9%) | 8 (38.1%) |
| 5 to 9 Year Old | 21 (28.0%) | 54 (72.0%) |
| 10 to 14 Year Olds | 72 (40.0%) | 108 (60.0%) |
| 15 to 17 Year Olds | 41 (100.0%) | 0 (0.0%) |
| 18 to 19 Year Olds | 0 (0.0%) | 0 (0.0%) |
| 20 to 24 Year Olds | 0 (0.0%) | 0 (0.0%) |
| 25 to 34 Year Olds | 0 (0.0%) | 0 (0.0%) |
| 35 Years and over | 0 (0.0%) | 0 (0.0%) |
| Total | 147 (46.4%) | 170 (53.6%) |
Educational Attainment by Field of Study in Pylesville
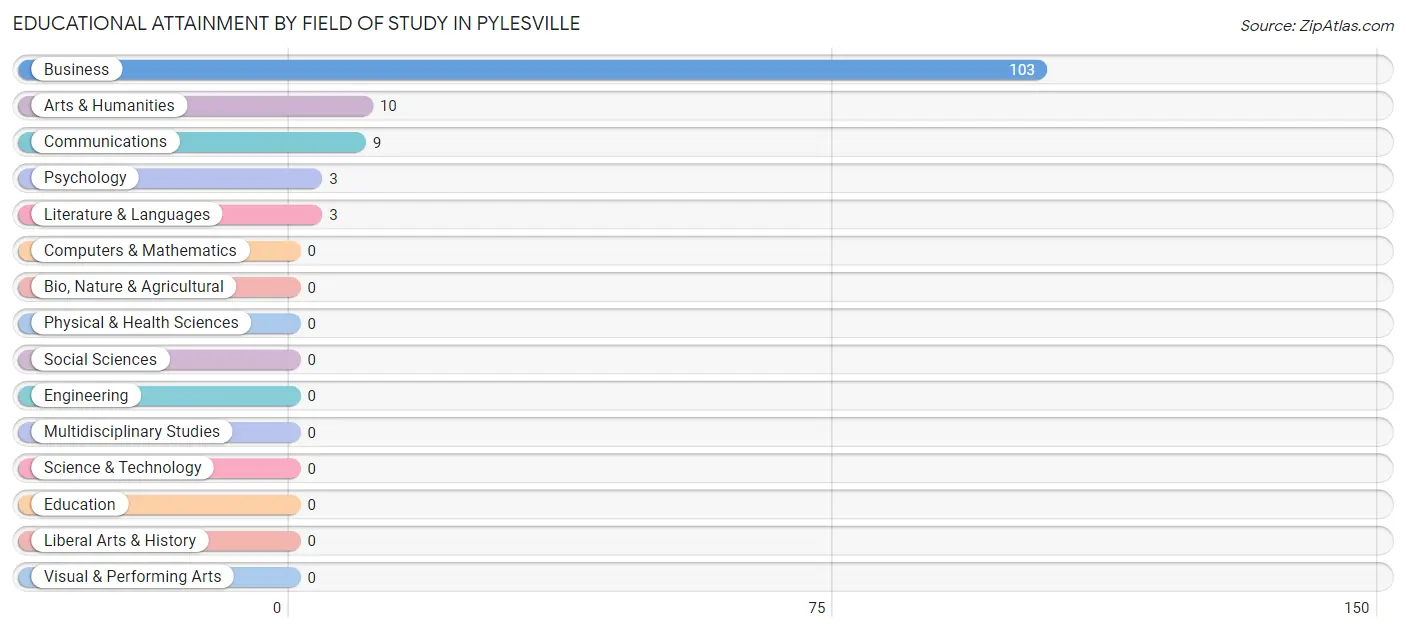
Business (103 | 80.5%), arts & humanities (10 | 7.8%), communications (9 | 7.0%), psychology (3 | 2.3%), and literature & languages (3 | 2.3%) are the most common fields of study among 128 individuals in Pylesville who have obtained a bachelor's degree or higher.
| Field of Study | # Graduates | % Graduates |
| Computers & Mathematics | 0 | 0.0% |
| Bio, Nature & Agricultural | 0 | 0.0% |
| Physical & Health Sciences | 0 | 0.0% |
| Psychology | 3 | 2.3% |
| Social Sciences | 0 | 0.0% |
| Engineering | 0 | 0.0% |
| Multidisciplinary Studies | 0 | 0.0% |
| Science & Technology | 0 | 0.0% |
| Business | 103 | 80.5% |
| Education | 0 | 0.0% |
| Literature & Languages | 3 | 2.3% |
| Liberal Arts & History | 0 | 0.0% |
| Visual & Performing Arts | 0 | 0.0% |
| Communications | 9 | 7.0% |
| Arts & Humanities | 10 | 7.8% |
| Total | 128 | 100.0% |
Transportation & Commute in Pylesville
Vehicle Availability by Sex in Pylesville
The most prevalent vehicle ownership categories in Pylesville are males with 3 vehicles (84, accounting for 66.1%) and females with 3 vehicles (101, making up 37.8%).
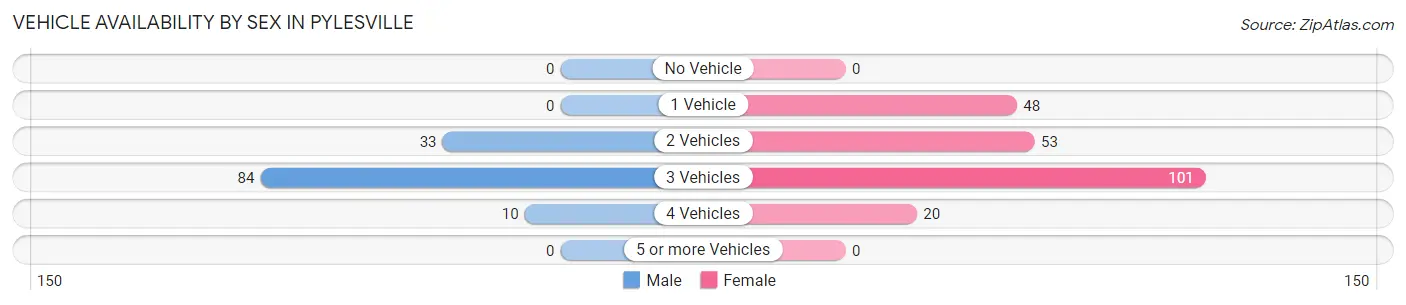
| Vehicles Available | Male | Female |
| No Vehicle | 0 (0.0%) | 0 (0.0%) |
| 1 Vehicle | 0 (0.0%) | 48 (21.6%) |
| 2 Vehicles | 33 (26.0%) | 53 (23.9%) |
| 3 Vehicles | 84 (66.1%) | 101 (45.5%) |
| 4 Vehicles | 10 (7.9%) | 20 (9.0%) |
| 5 or more Vehicles | 0 (0.0%) | 0 (0.0%) |
| Total | 127 (100.0%) | 222 (100.0%) |
Commute Time in Pylesville
The most frequently occuring commute durations in Pylesville are 20 to 24 minutes (82 commuters, 29.8%), 60 to 89 minutes (67 commuters, 24.4%), and 45 to 59 minutes (55 commuters, 20.0%).
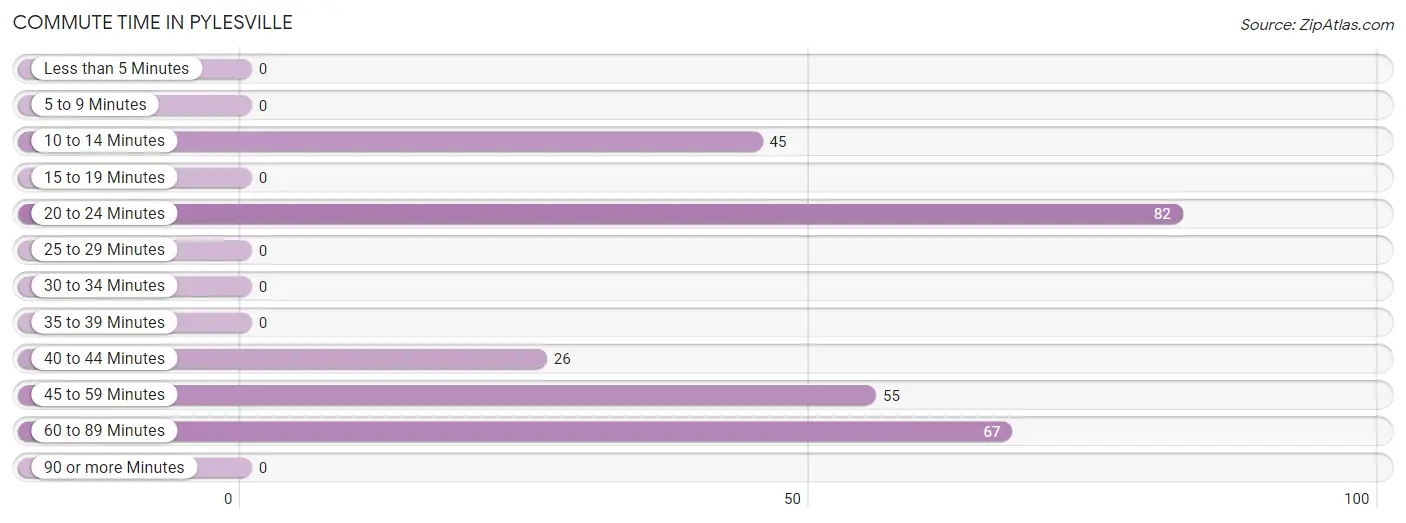
| Commute Time | # Commuters | % Commuters |
| Less than 5 Minutes | 0 | 0.0% |
| 5 to 9 Minutes | 0 | 0.0% |
| 10 to 14 Minutes | 45 | 16.4% |
| 15 to 19 Minutes | 0 | 0.0% |
| 20 to 24 Minutes | 82 | 29.8% |
| 25 to 29 Minutes | 0 | 0.0% |
| 30 to 34 Minutes | 0 | 0.0% |
| 35 to 39 Minutes | 0 | 0.0% |
| 40 to 44 Minutes | 26 | 9.5% |
| 45 to 59 Minutes | 55 | 20.0% |
| 60 to 89 Minutes | 67 | 24.4% |
| 90 or more Minutes | 0 | 0.0% |
Commute Time by Sex in Pylesville
The most common commute times in Pylesville are 60 to 89 minutes (67 commuters, 52.8%) for males and 20 to 24 minutes (58 commuters, 39.2%) for females.
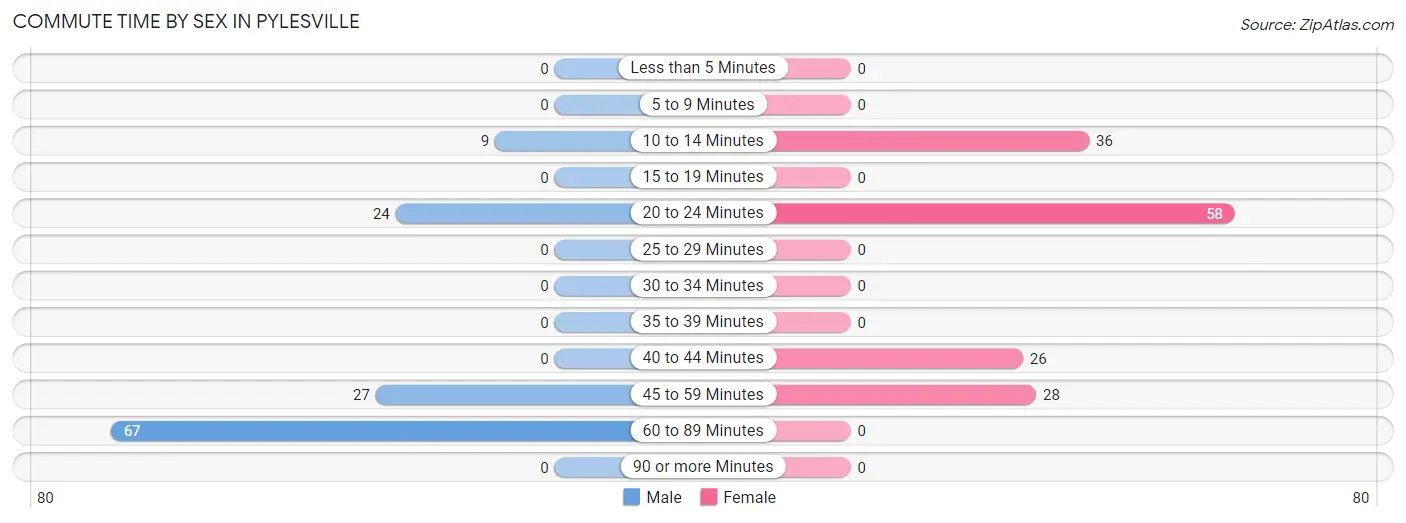
| Commute Time | Male | Female |
| Less than 5 Minutes | 0 (0.0%) | 0 (0.0%) |
| 5 to 9 Minutes | 0 (0.0%) | 0 (0.0%) |
| 10 to 14 Minutes | 9 (7.1%) | 36 (24.3%) |
| 15 to 19 Minutes | 0 (0.0%) | 0 (0.0%) |
| 20 to 24 Minutes | 24 (18.9%) | 58 (39.2%) |
| 25 to 29 Minutes | 0 (0.0%) | 0 (0.0%) |
| 30 to 34 Minutes | 0 (0.0%) | 0 (0.0%) |
| 35 to 39 Minutes | 0 (0.0%) | 0 (0.0%) |
| 40 to 44 Minutes | 0 (0.0%) | 26 (17.6%) |
| 45 to 59 Minutes | 27 (21.3%) | 28 (18.9%) |
| 60 to 89 Minutes | 67 (52.8%) | 0 (0.0%) |
| 90 or more Minutes | 0 (0.0%) | 0 (0.0%) |
Time of Departure to Work by Sex in Pylesville
The most frequent times of departure to work in Pylesville are 6:00 AM to 6:29 AM (84, 66.1%) for males and 6:00 AM to 6:29 AM (58, 39.2%) for females.
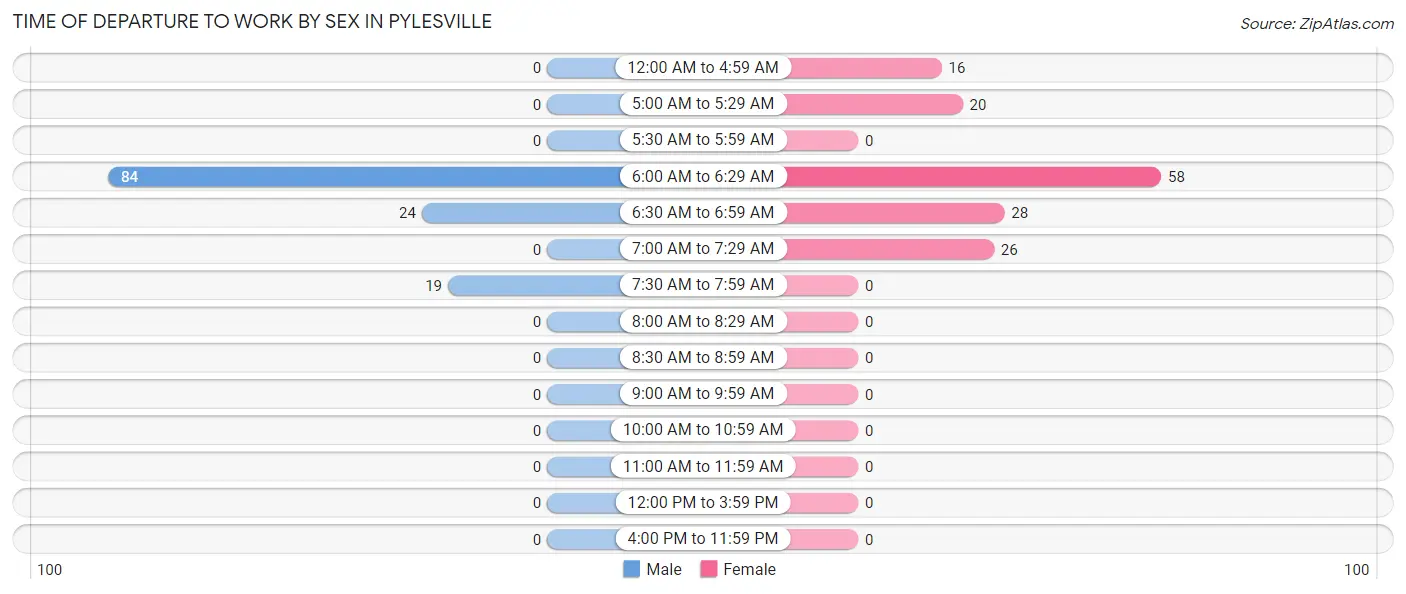
| Time of Departure | Male | Female |
| 12:00 AM to 4:59 AM | 0 (0.0%) | 16 (10.8%) |
| 5:00 AM to 5:29 AM | 0 (0.0%) | 20 (13.5%) |
| 5:30 AM to 5:59 AM | 0 (0.0%) | 0 (0.0%) |
| 6:00 AM to 6:29 AM | 84 (66.1%) | 58 (39.2%) |
| 6:30 AM to 6:59 AM | 24 (18.9%) | 28 (18.9%) |
| 7:00 AM to 7:29 AM | 0 (0.0%) | 26 (17.6%) |
| 7:30 AM to 7:59 AM | 19 (15.0%) | 0 (0.0%) |
| 8:00 AM to 8:29 AM | 0 (0.0%) | 0 (0.0%) |
| 8:30 AM to 8:59 AM | 0 (0.0%) | 0 (0.0%) |
| 9:00 AM to 9:59 AM | 0 (0.0%) | 0 (0.0%) |
| 10:00 AM to 10:59 AM | 0 (0.0%) | 0 (0.0%) |
| 11:00 AM to 11:59 AM | 0 (0.0%) | 0 (0.0%) |
| 12:00 PM to 3:59 PM | 0 (0.0%) | 0 (0.0%) |
| 4:00 PM to 11:59 PM | 0 (0.0%) | 0 (0.0%) |
| Total | 127 (100.0%) | 148 (100.0%) |
Housing Occupancy in Pylesville
Occupancy by Ownership in Pylesville
Of the total 222 dwellings in Pylesville, owner-occupied units account for 222 (100.0%), while renter-occupied units make up 0 (0.0%).
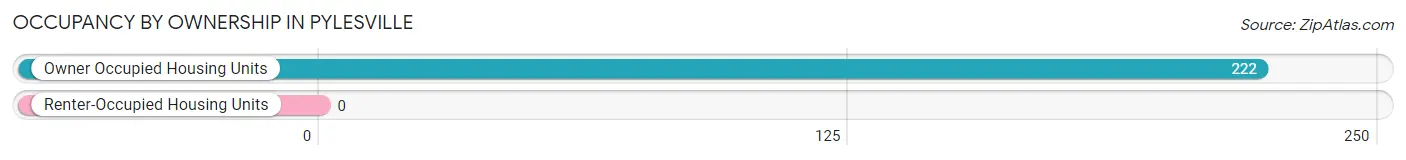
| Occupancy | # Housing Units | % Housing Units |
| Owner Occupied Housing Units | 222 | 100.0% |
| Renter-Occupied Housing Units | 0 | 0.0% |
| Total Occupied Housing Units | 222 | 100.0% |
Occupancy by Household Size in Pylesville
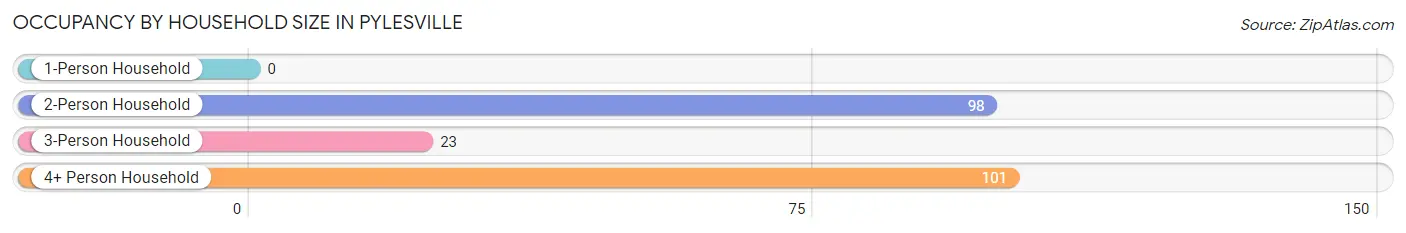
| Household Size | # Housing Units | % Housing Units |
| 1-Person Household | 0 | 0.0% |
| 2-Person Household | 98 | 44.1% |
| 3-Person Household | 23 | 10.4% |
| 4+ Person Household | 101 | 45.5% |
| Total Housing Units | 222 | 100.0% |
Occupancy by Ownership by Household Size in Pylesville
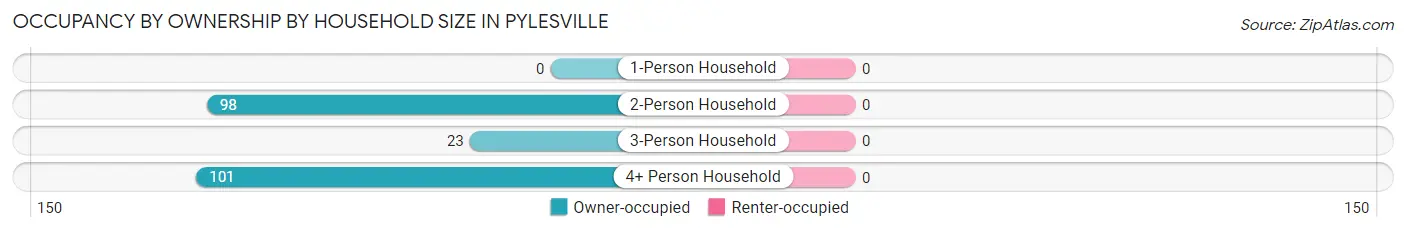
| Household Size | Owner-occupied | Renter-occupied |
| 1-Person Household | 0 (0.0%) | 0 (0.0%) |
| 2-Person Household | 98 (100.0%) | 0 (0.0%) |
| 3-Person Household | 23 (100.0%) | 0 (0.0%) |
| 4+ Person Household | 101 (100.0%) | 0 (0.0%) |
| Total Housing Units | 222 (100.0%) | 0 (0.0%) |
Occupancy by Educational Attainment in Pylesville
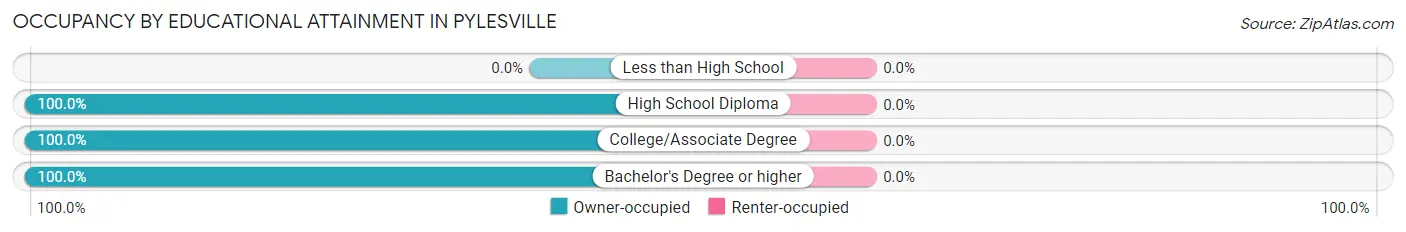
| Household Size | Owner-occupied | Renter-occupied |
| Less than High School | 0 (0.0%) | 0 (0.0%) |
| High School Diploma | 37 (100.0%) | 0 (0.0%) |
| College/Associate Degree | 93 (100.0%) | 0 (0.0%) |
| Bachelor's Degree or higher | 92 (100.0%) | 0 (0.0%) |
Occupancy by Age of Householder in Pylesville
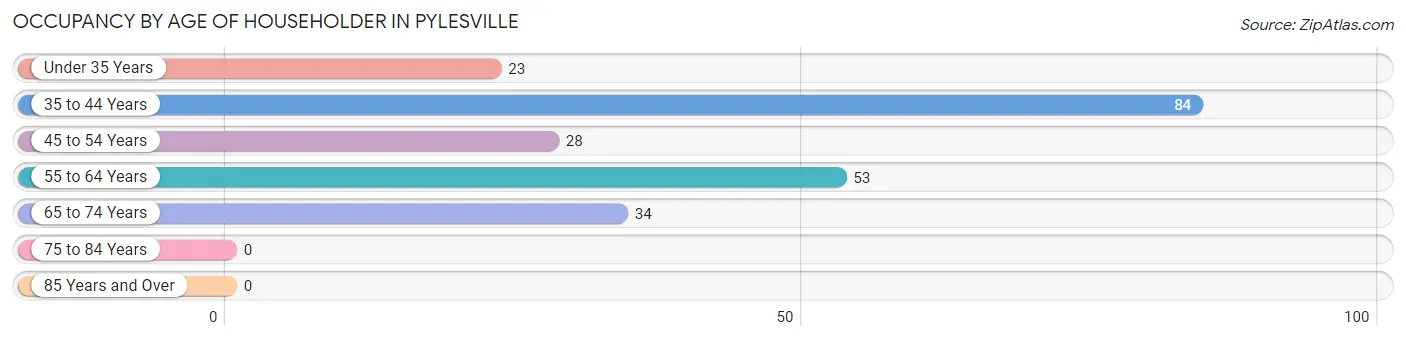
| Age Bracket | # Households | % Households |
| Under 35 Years | 23 | 10.4% |
| 35 to 44 Years | 84 | 37.8% |
| 45 to 54 Years | 28 | 12.6% |
| 55 to 64 Years | 53 | 23.9% |
| 65 to 74 Years | 34 | 15.3% |
| 75 to 84 Years | 0 | 0.0% |
| 85 Years and Over | 0 | 0.0% |
| Total | 222 | 100.0% |
Housing Finances in Pylesville
Median Income by Occupancy in Pylesville
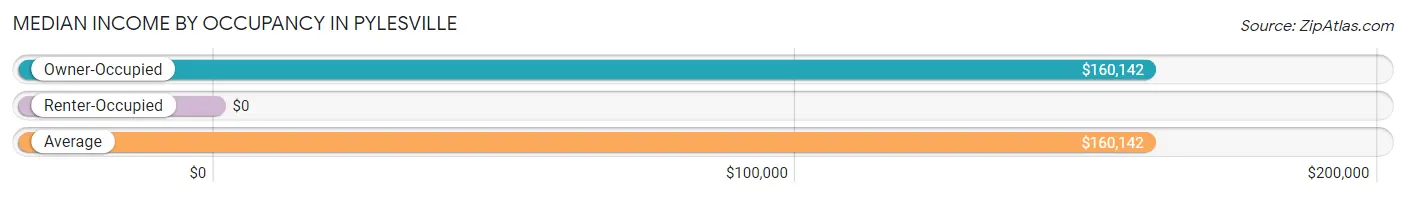
| Occupancy Type | # Households | Median Income |
| Owner-Occupied | 222 (100.0%) | $160,142 |
| Renter-Occupied | 0 (0.0%) | $0 |
| Average | 222 (100.0%) | $160,142 |
Occupancy by Householder Income Bracket in Pylesville
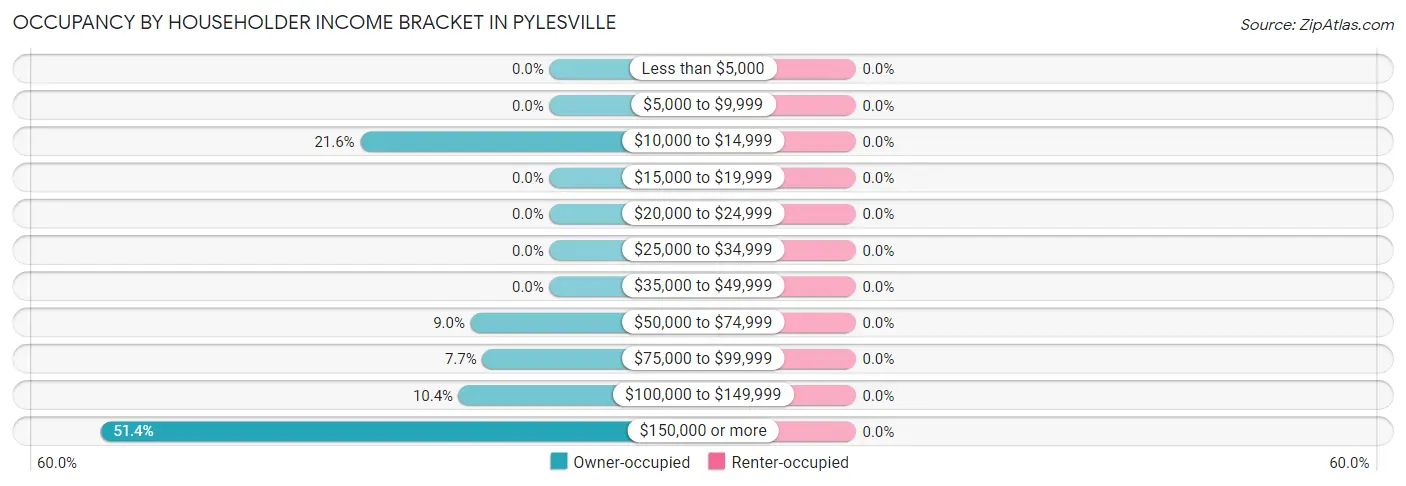
| Income Bracket | Owner-occupied | Renter-occupied |
| Less than $5,000 | 0 (0.0%) | 0 (0.0%) |
| $5,000 to $9,999 | 0 (0.0%) | 0 (0.0%) |
| $10,000 to $14,999 | 48 (21.6%) | 0 (0.0%) |
| $15,000 to $19,999 | 0 (0.0%) | 0 (0.0%) |
| $20,000 to $24,999 | 0 (0.0%) | 0 (0.0%) |
| $25,000 to $34,999 | 0 (0.0%) | 0 (0.0%) |
| $35,000 to $49,999 | 0 (0.0%) | 0 (0.0%) |
| $50,000 to $74,999 | 20 (9.0%) | 0 (0.0%) |
| $75,000 to $99,999 | 17 (7.7%) | 0 (0.0%) |
| $100,000 to $149,999 | 23 (10.4%) | 0 (0.0%) |
| $150,000 or more | 114 (51.3%) | 0 (0.0%) |
| Total | 222 (100.0%) | 0 (0.0%) |
Monthly Housing Cost Tiers in Pylesville
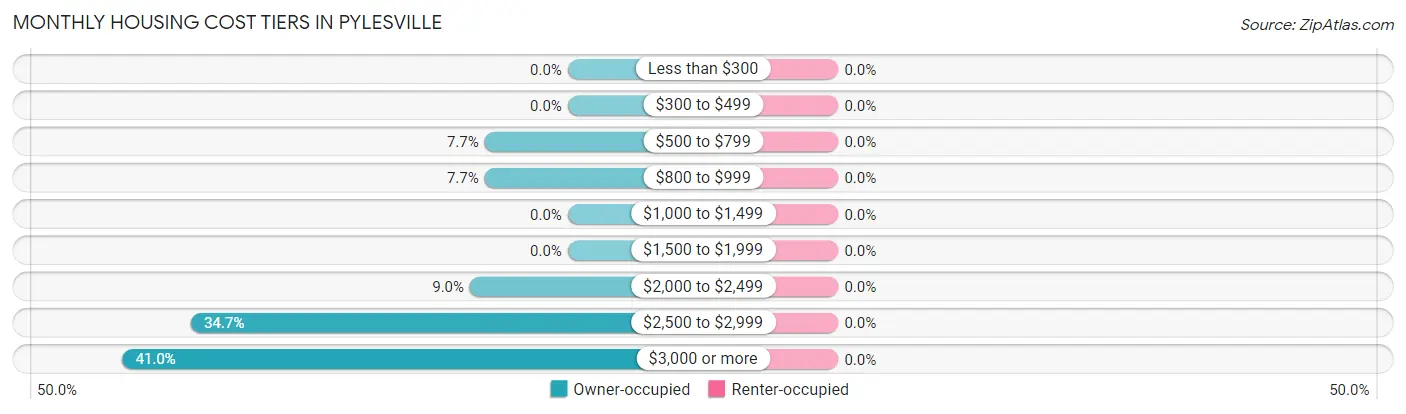
| Monthly Cost | Owner-occupied | Renter-occupied |
| Less than $300 | 0 (0.0%) | 0 (0.0%) |
| $300 to $499 | 0 (0.0%) | 0 (0.0%) |
| $500 to $799 | 17 (7.7%) | 0 (0.0%) |
| $800 to $999 | 17 (7.7%) | 0 (0.0%) |
| $1,000 to $1,499 | 0 (0.0%) | 0 (0.0%) |
| $1,500 to $1,999 | 0 (0.0%) | 0 (0.0%) |
| $2,000 to $2,499 | 20 (9.0%) | 0 (0.0%) |
| $2,500 to $2,999 | 77 (34.7%) | 0 (0.0%) |
| $3,000 or more | 91 (41.0%) | 0 (0.0%) |
| Total | 222 (100.0%) | 0 (0.0%) |
Physical Housing Characteristics in Pylesville
Housing Structures in Pylesville
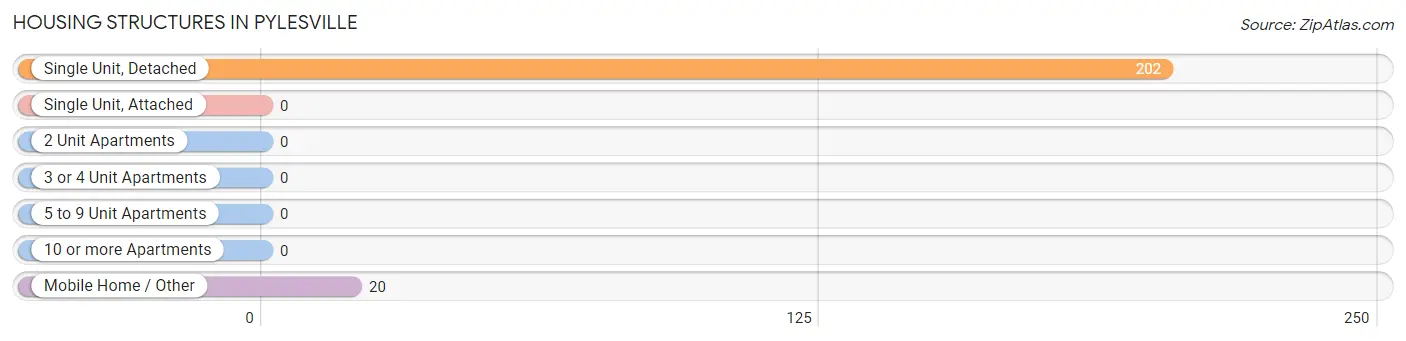
| Structure Type | # Housing Units | % Housing Units |
| Single Unit, Detached | 202 | 91.0% |
| Single Unit, Attached | 0 | 0.0% |
| 2 Unit Apartments | 0 | 0.0% |
| 3 or 4 Unit Apartments | 0 | 0.0% |
| 5 to 9 Unit Apartments | 0 | 0.0% |
| 10 or more Apartments | 0 | 0.0% |
| Mobile Home / Other | 20 | 9.0% |
| Total | 222 | 100.0% |
Housing Structures by Occupancy in Pylesville
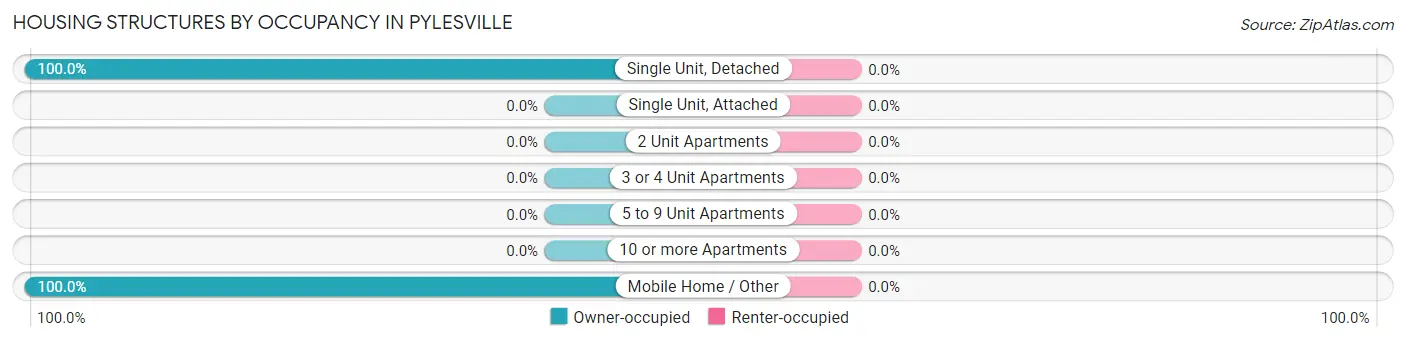
| Structure Type | Owner-occupied | Renter-occupied |
| Single Unit, Detached | 202 (100.0%) | 0 (0.0%) |
| Single Unit, Attached | 0 (0.0%) | 0 (0.0%) |
| 2 Unit Apartments | 0 (0.0%) | 0 (0.0%) |
| 3 or 4 Unit Apartments | 0 (0.0%) | 0 (0.0%) |
| 5 to 9 Unit Apartments | 0 (0.0%) | 0 (0.0%) |
| 10 or more Apartments | 0 (0.0%) | 0 (0.0%) |
| Mobile Home / Other | 20 (100.0%) | 0 (0.0%) |
| Total | 222 (100.0%) | 0 (0.0%) |
Housing Structures by Number of Rooms in Pylesville
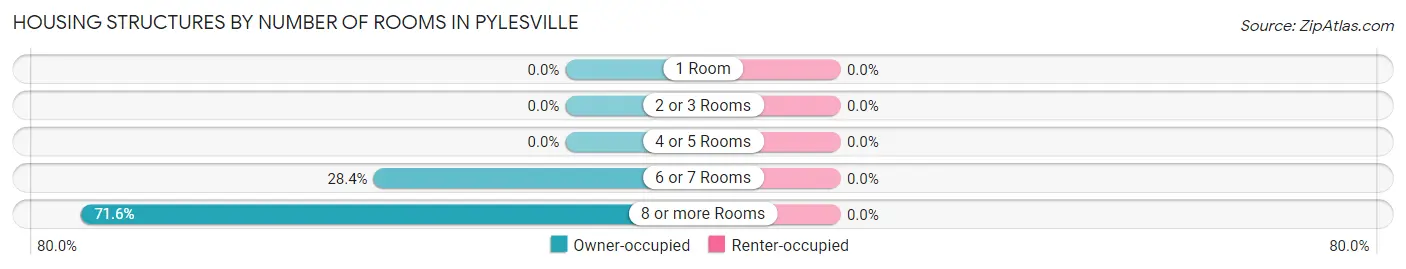
| Number of Rooms | Owner-occupied | Renter-occupied |
| 1 Room | 0 (0.0%) | 0 (0.0%) |
| 2 or 3 Rooms | 0 (0.0%) | 0 (0.0%) |
| 4 or 5 Rooms | 0 (0.0%) | 0 (0.0%) |
| 6 or 7 Rooms | 63 (28.4%) | 0 (0.0%) |
| 8 or more Rooms | 159 (71.6%) | 0 (0.0%) |
| Total | 222 (100.0%) | 0 (0.0%) |
Housing Structure by Heating Type in Pylesville
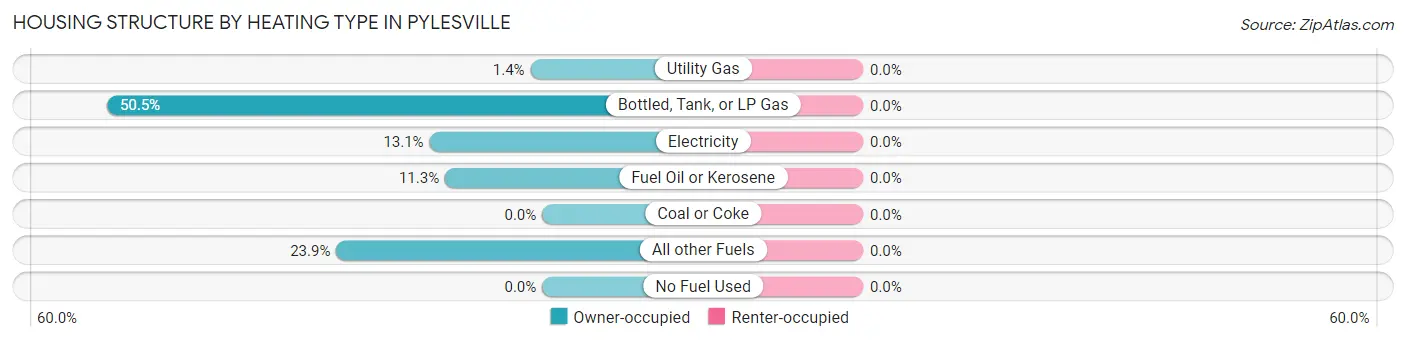
| Heating Type | Owner-occupied | Renter-occupied |
| Utility Gas | 3 (1.3%) | 0 (0.0%) |
| Bottled, Tank, or LP Gas | 112 (50.4%) | 0 (0.0%) |
| Electricity | 29 (13.1%) | 0 (0.0%) |
| Fuel Oil or Kerosene | 25 (11.3%) | 0 (0.0%) |
| Coal or Coke | 0 (0.0%) | 0 (0.0%) |
| All other Fuels | 53 (23.9%) | 0 (0.0%) |
| No Fuel Used | 0 (0.0%) | 0 (0.0%) |
| Total | 222 (100.0%) | 0 (0.0%) |
Household Vehicle Usage in Pylesville
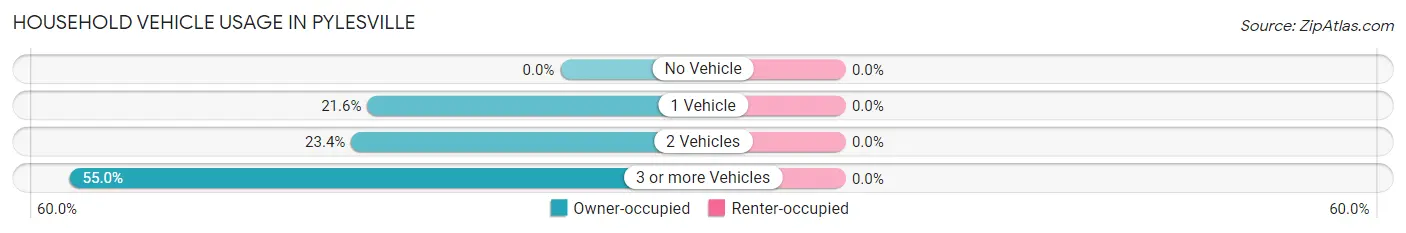
| Vehicles per Household | Owner-occupied | Renter-occupied |
| No Vehicle | 0 (0.0%) | 0 (0.0%) |
| 1 Vehicle | 48 (21.6%) | 0 (0.0%) |
| 2 Vehicles | 52 (23.4%) | 0 (0.0%) |
| 3 or more Vehicles | 122 (54.9%) | 0 (0.0%) |
| Total | 222 (100.0%) | 0 (0.0%) |
Real Estate & Mortgages in Pylesville
Real Estate and Mortgage Overview in Pylesville
| Characteristic | Without Mortgage | With Mortgage |
| Housing Units | 34 | 188 |
| Median Property Value | - | - |
| Median Household Income | - | - |
| Monthly Housing Costs | - | - |
| Real Estate Taxes | - | - |
Property Value by Mortgage Status in Pylesville
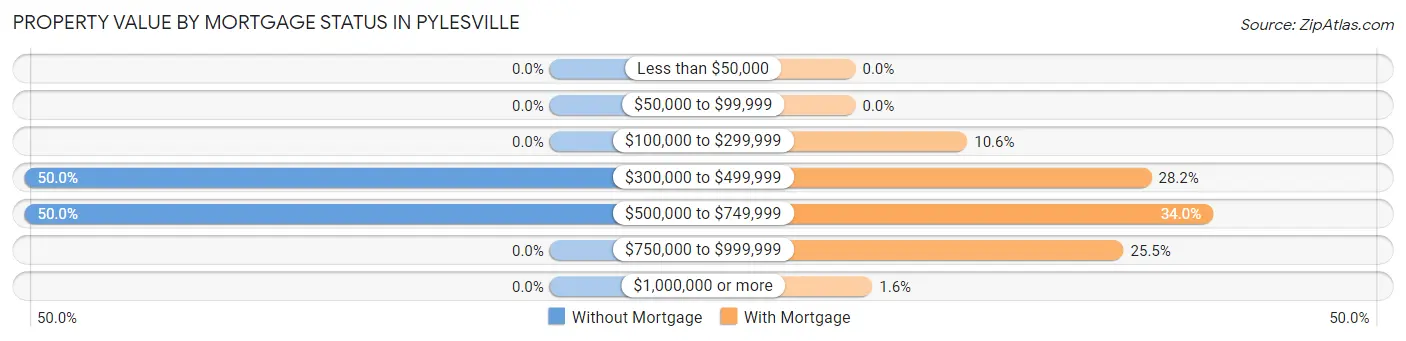
| Property Value | Without Mortgage | With Mortgage |
| Less than $50,000 | 0 (0.0%) | 0 (0.0%) |
| $50,000 to $99,999 | 0 (0.0%) | 0 (0.0%) |
| $100,000 to $299,999 | 0 (0.0%) | 20 (10.6%) |
| $300,000 to $499,999 | 17 (50.0%) | 53 (28.2%) |
| $500,000 to $749,999 | 17 (50.0%) | 64 (34.0%) |
| $750,000 to $999,999 | 0 (0.0%) | 48 (25.5%) |
| $1,000,000 or more | 0 (0.0%) | 3 (1.6%) |
| Total | 34 (100.0%) | 188 (100.0%) |
Household Income by Mortgage Status in Pylesville
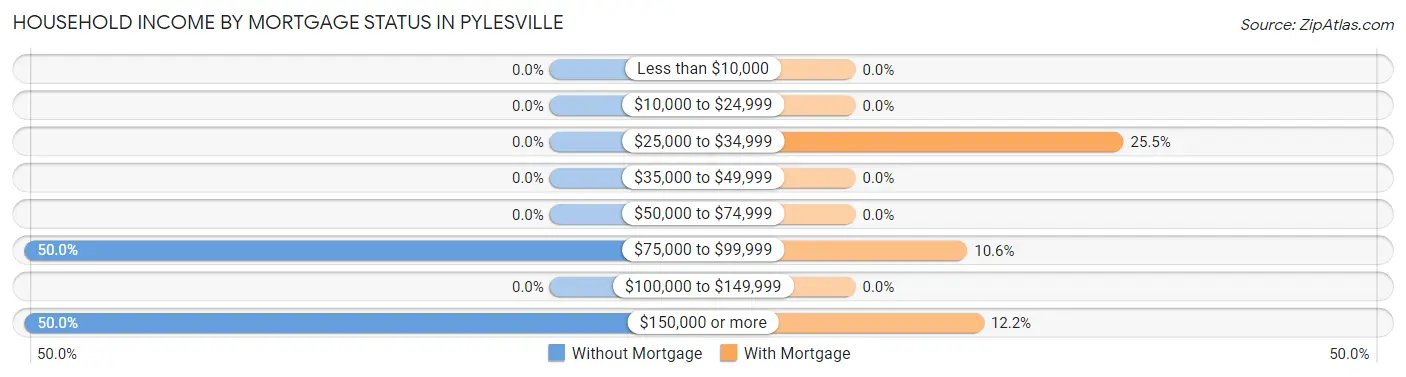
| Household Income | Without Mortgage | With Mortgage |
| Less than $10,000 | 0 (0.0%) | 0 (0.0%) |
| $10,000 to $24,999 | 0 (0.0%) | 0 (0.0%) |
| $25,000 to $34,999 | 0 (0.0%) | 48 (25.5%) |
| $35,000 to $49,999 | 0 (0.0%) | 0 (0.0%) |
| $50,000 to $74,999 | 0 (0.0%) | 0 (0.0%) |
| $75,000 to $99,999 | 17 (50.0%) | 20 (10.6%) |
| $100,000 to $149,999 | 0 (0.0%) | 0 (0.0%) |
| $150,000 or more | 17 (50.0%) | 23 (12.2%) |
| Total | 34 (100.0%) | 188 (100.0%) |
Property Value to Household Income Ratio in Pylesville
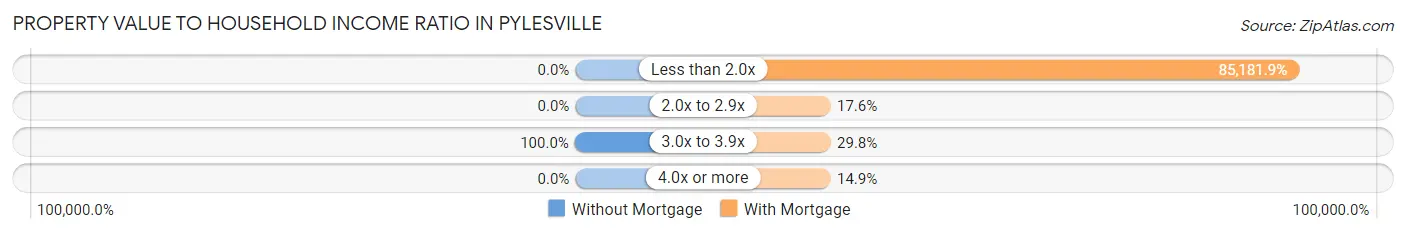
| Value-to-Income Ratio | Without Mortgage | With Mortgage |
| Less than 2.0x | 0 (0.0%) | 160,142 (85,181.9%) |
| 2.0x to 2.9x | 0 (0.0%) | 33 (17.5%) |
| 3.0x to 3.9x | 34 (100.0%) | 56 (29.8%) |
| 4.0x or more | 0 (0.0%) | 28 (14.9%) |
| Total | 34 (100.0%) | 188 (100.0%) |
Real Estate Taxes by Mortgage Status in Pylesville
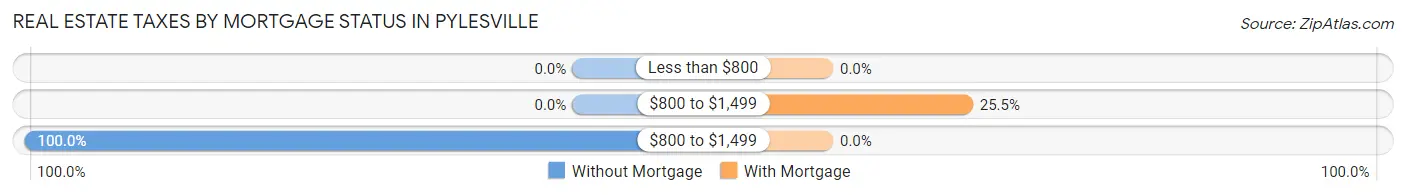
| Property Taxes | Without Mortgage | With Mortgage |
| Less than $800 | 0 (0.0%) | 0 (0.0%) |
| $800 to $1,499 | 0 (0.0%) | 48 (25.5%) |
| $800 to $1,499 | 34 (100.0%) | 0 (0.0%) |
| Total | 34 (100.0%) | 188 (100.0%) |
Health & Disability in Pylesville
Health Insurance Coverage by Age in Pylesville
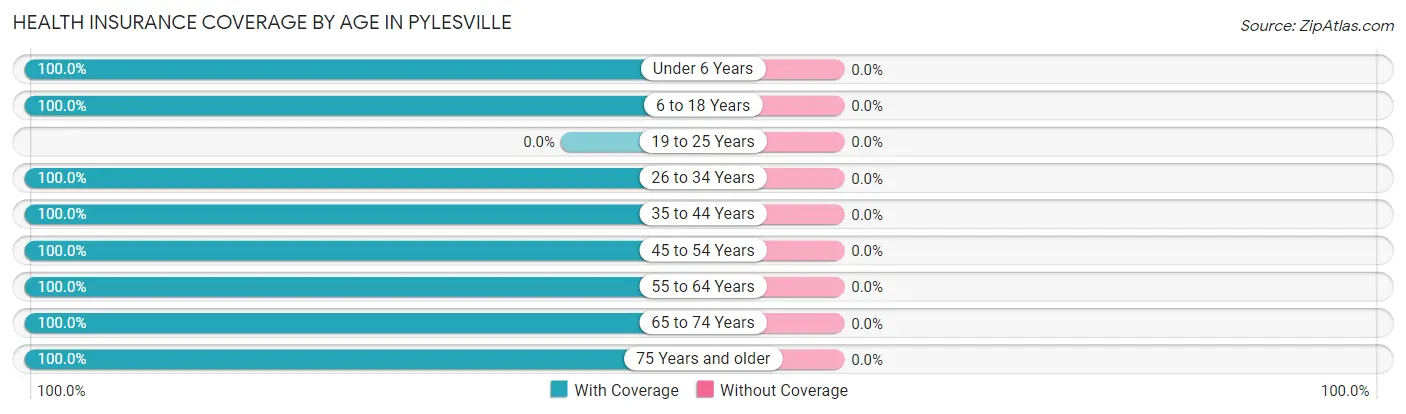
| Age Bracket | With Coverage | Without Coverage |
| Under 6 Years | 74 (100.0%) | 0 (0.0%) |
| 6 to 18 Years | 296 (100.0%) | 0 (0.0%) |
| 19 to 25 Years | 0 (0.0%) | 0 (0.0%) |
| 26 to 34 Years | 60 (100.0%) | 0 (0.0%) |
| 35 to 44 Years | 120 (100.0%) | 0 (0.0%) |
| 45 to 54 Years | 42 (100.0%) | 0 (0.0%) |
| 55 to 64 Years | 127 (100.0%) | 0 (0.0%) |
| 65 to 74 Years | 34 (100.0%) | 0 (0.0%) |
| 75 Years and older | 27 (100.0%) | 0 (0.0%) |
| Total | 780 (100.0%) | 0 (0.0%) |
Health Insurance Coverage by Citizenship Status in Pylesville
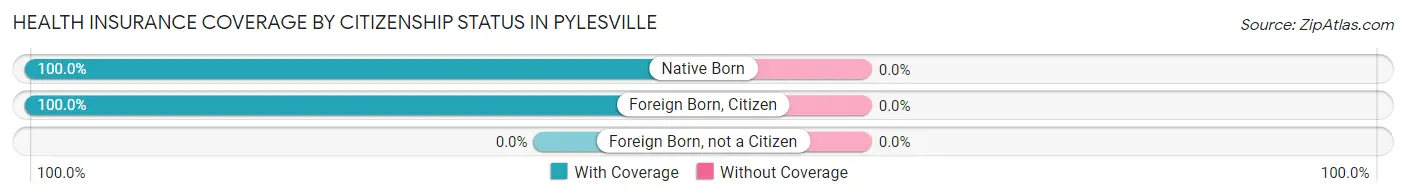
| Citizenship Status | With Coverage | Without Coverage |
| Native Born | 74 (100.0%) | 0 (0.0%) |
| Foreign Born, Citizen | 296 (100.0%) | 0 (0.0%) |
| Foreign Born, not a Citizen | 0 (0.0%) | 0 (0.0%) |
Health Insurance Coverage by Household Income in Pylesville
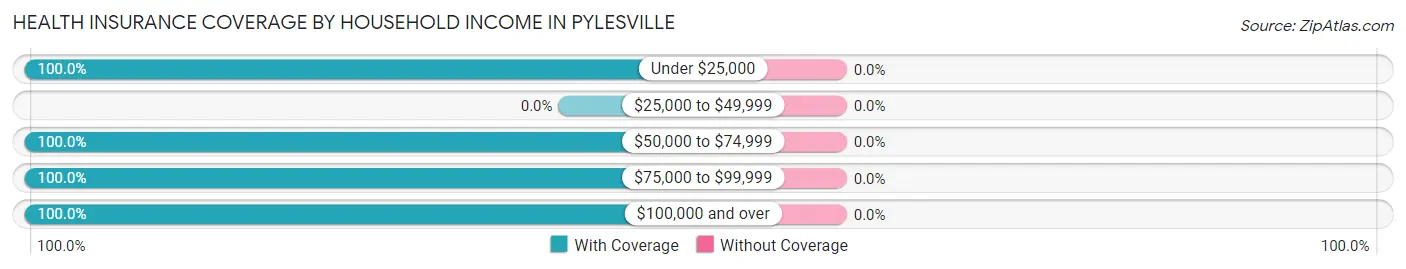
| Household Income | With Coverage | Without Coverage |
| Under $25,000 | 254 (100.0%) | 0 (0.0%) |
| $25,000 to $49,999 | 0 (0.0%) | 0 (0.0%) |
| $50,000 to $74,999 | 75 (100.0%) | 0 (0.0%) |
| $75,000 to $99,999 | 33 (100.0%) | 0 (0.0%) |
| $100,000 and over | 418 (100.0%) | 0 (0.0%) |
Public vs Private Health Insurance Coverage by Age in Pylesville
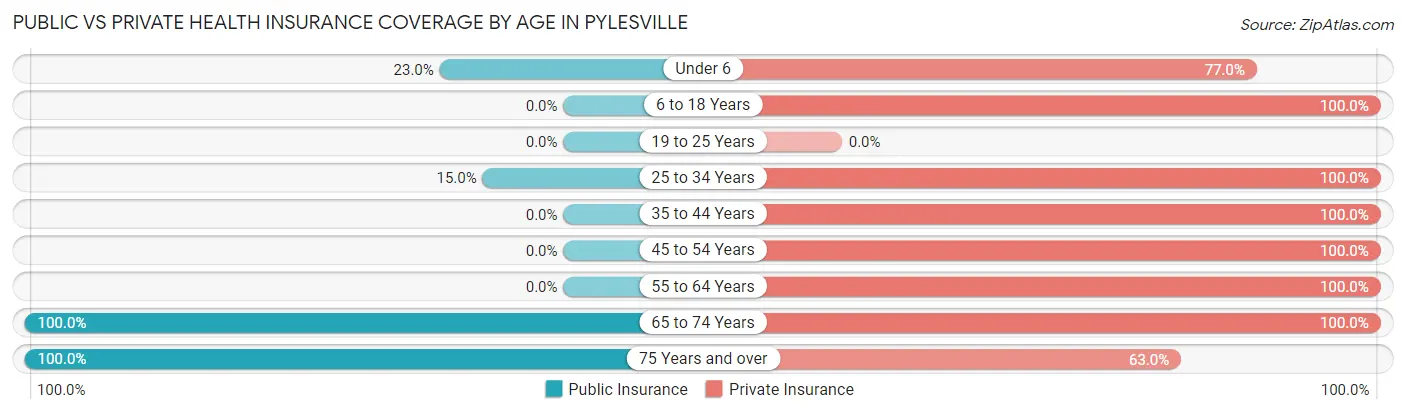
| Age Bracket | Public Insurance | Private Insurance |
| Under 6 | 17 (23.0%) | 57 (77.0%) |
| 6 to 18 Years | 0 (0.0%) | 296 (100.0%) |
| 19 to 25 Years | 0 (0.0%) | 0 (0.0%) |
| 25 to 34 Years | 9 (15.0%) | 60 (100.0%) |
| 35 to 44 Years | 0 (0.0%) | 120 (100.0%) |
| 45 to 54 Years | 0 (0.0%) | 42 (100.0%) |
| 55 to 64 Years | 0 (0.0%) | 127 (100.0%) |
| 65 to 74 Years | 34 (100.0%) | 34 (100.0%) |
| 75 Years and over | 27 (100.0%) | 17 (63.0%) |
| Total | 87 (11.2%) | 753 (96.5%) |
Disability Status by Sex by Age in Pylesville
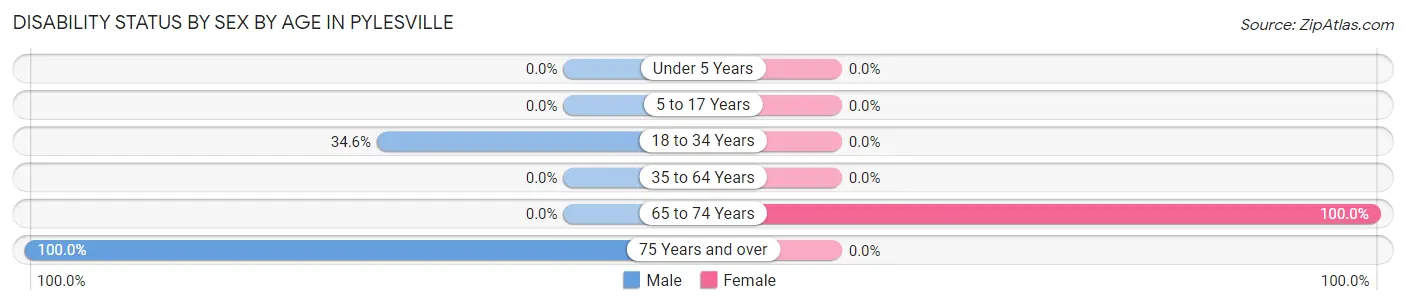
| Age Bracket | Male | Female |
| Under 5 Years | 0 (0.0%) | 0 (0.0%) |
| 5 to 17 Years | 0 (0.0%) | 0 (0.0%) |
| 18 to 34 Years | 9 (34.6%) | 0 (0.0%) |
| 35 to 64 Years | 0 (0.0%) | 0 (0.0%) |
| 65 to 74 Years | 0 (0.0%) | 17 (100.0%) |
| 75 Years and over | 27 (100.0%) | 0 (0.0%) |
Disability Class by Sex by Age in Pylesville
Disability Class: Hearing Difficulty
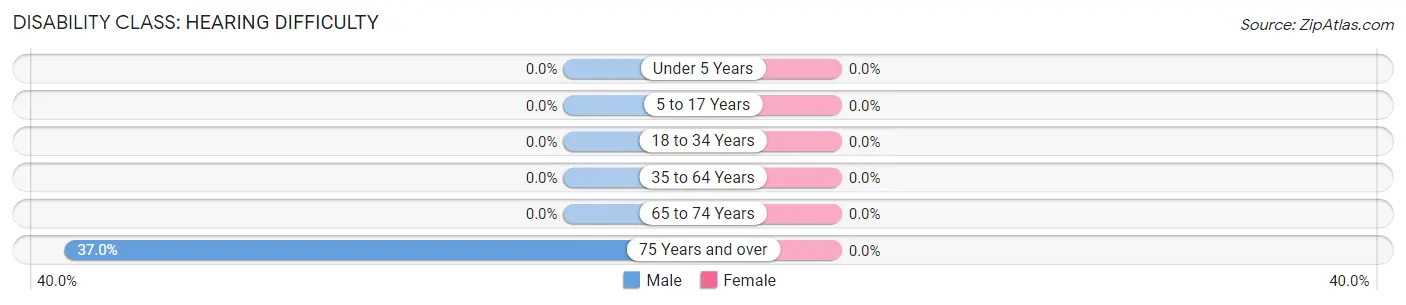
| Age Bracket | Male | Female |
| Under 5 Years | 0 (0.0%) | 0 (0.0%) |
| 5 to 17 Years | 0 (0.0%) | 0 (0.0%) |
| 18 to 34 Years | 0 (0.0%) | 0 (0.0%) |
| 35 to 64 Years | 0 (0.0%) | 0 (0.0%) |
| 65 to 74 Years | 0 (0.0%) | 0 (0.0%) |
| 75 Years and over | 10 (37.0%) | 0 (0.0%) |
Disability Class: Vision Difficulty
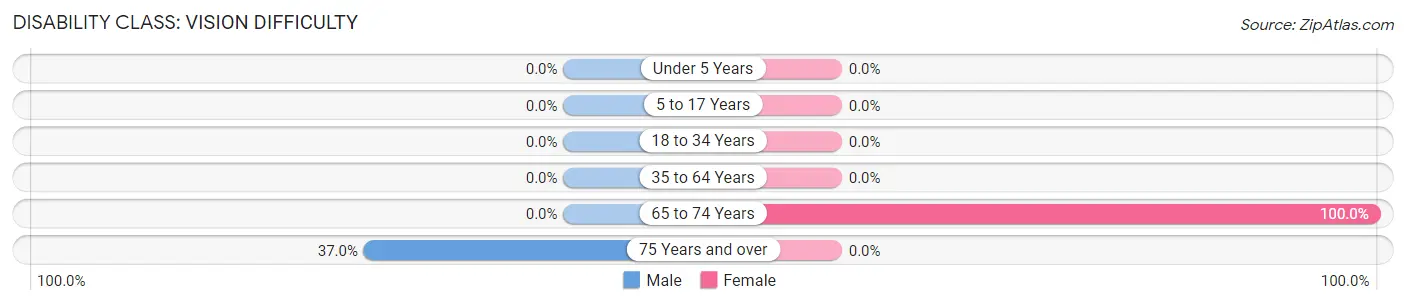
| Age Bracket | Male | Female |
| Under 5 Years | 0 (0.0%) | 0 (0.0%) |
| 5 to 17 Years | 0 (0.0%) | 0 (0.0%) |
| 18 to 34 Years | 0 (0.0%) | 0 (0.0%) |
| 35 to 64 Years | 0 (0.0%) | 0 (0.0%) |
| 65 to 74 Years | 0 (0.0%) | 17 (100.0%) |
| 75 Years and over | 10 (37.0%) | 0 (0.0%) |
Disability Class: Cognitive Difficulty
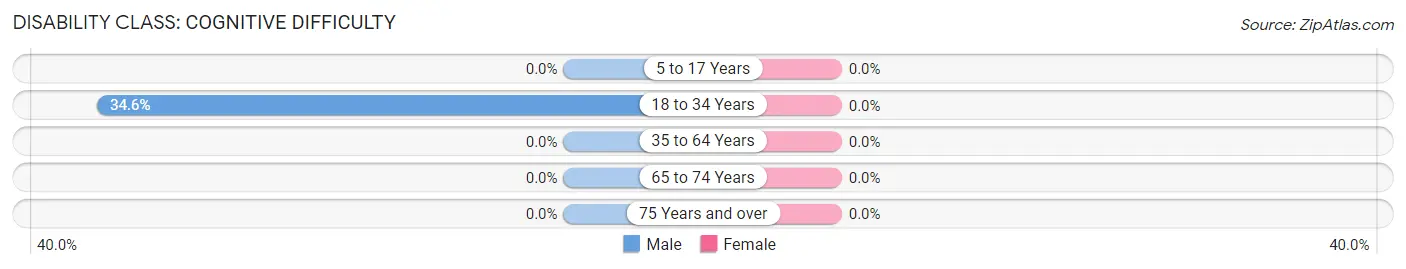
| Age Bracket | Male | Female |
| 5 to 17 Years | 0 (0.0%) | 0 (0.0%) |
| 18 to 34 Years | 9 (34.6%) | 0 (0.0%) |
| 35 to 64 Years | 0 (0.0%) | 0 (0.0%) |
| 65 to 74 Years | 0 (0.0%) | 0 (0.0%) |
| 75 Years and over | 0 (0.0%) | 0 (0.0%) |
Disability Class: Ambulatory Difficulty
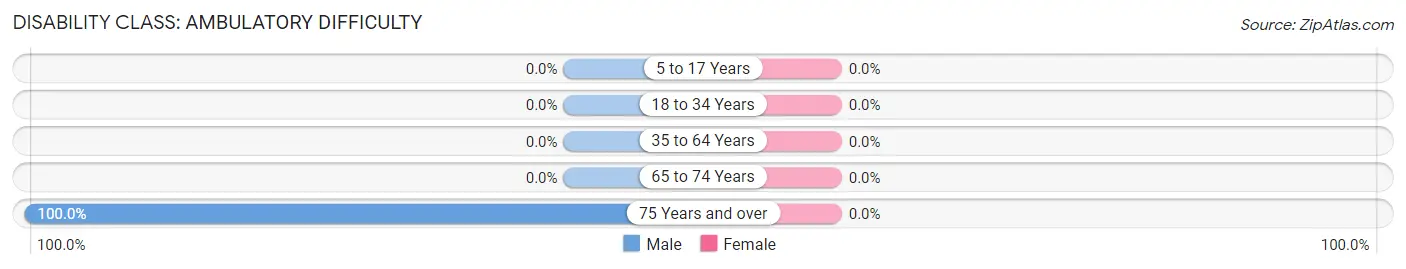
| Age Bracket | Male | Female |
| 5 to 17 Years | 0 (0.0%) | 0 (0.0%) |
| 18 to 34 Years | 0 (0.0%) | 0 (0.0%) |
| 35 to 64 Years | 0 (0.0%) | 0 (0.0%) |
| 65 to 74 Years | 0 (0.0%) | 0 (0.0%) |
| 75 Years and over | 27 (100.0%) | 0 (0.0%) |
Disability Class: Self-Care Difficulty

| Age Bracket | Male | Female |
| 5 to 17 Years | 0 (0.0%) | 0 (0.0%) |
| 18 to 34 Years | 0 (0.0%) | 0 (0.0%) |
| 35 to 64 Years | 0 (0.0%) | 0 (0.0%) |
| 65 to 74 Years | 0 (0.0%) | 0 (0.0%) |
| 75 Years and over | 27 (100.0%) | 0 (0.0%) |
Technology Access in Pylesville
Computing Device Access in Pylesville
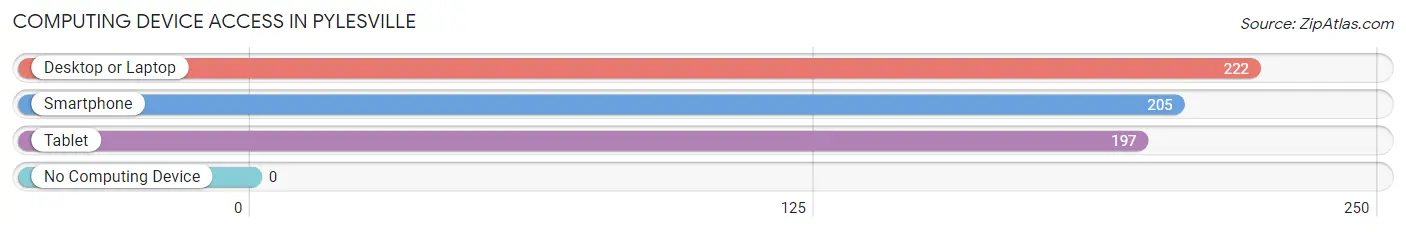
| Device Type | # Households | % Households |
| Desktop or Laptop | 222 | 100.0% |
| Smartphone | 205 | 92.3% |
| Tablet | 197 | 88.7% |
| No Computing Device | 0 | 0.0% |
| Total | 222 | 100.0% |
Internet Access in Pylesville
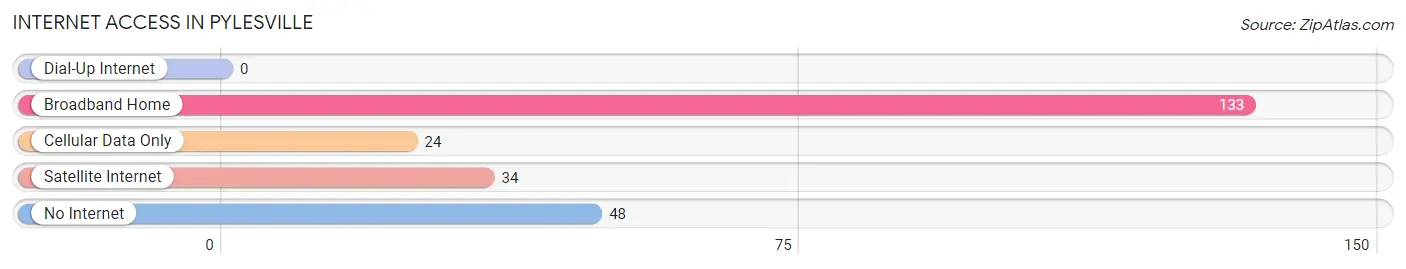
| Internet Type | # Households | % Households |
| Dial-Up Internet | 0 | 0.0% |
| Broadband Home | 133 | 59.9% |
| Cellular Data Only | 24 | 10.8% |
| Satellite Internet | 34 | 15.3% |
| No Internet | 48 | 21.6% |
| Total | 222 | 100.0% |
Pylesville Summary
Pylesville, Maryland is a small unincorporated community located in Harford County, Maryland. It is situated in the northern part of the county, approximately 20 miles northeast of Baltimore. The population of Pylesville was 1,845 as of the 2010 census.
History
Pylesville was first settled in the late 1700s by the Pyles family, who were among the earliest settlers in the area. The town was originally known as Pylesville Crossroads, and was named after the Pyles family. The town was officially incorporated in 1872.
Geography
Pylesville is located in northern Harford County, Maryland, approximately 20 miles northeast of Baltimore. It is situated in the northern part of the county, near the Pennsylvania border. The town is bordered by the towns of Whiteford, Street, and Darlington. The town is situated on the banks of the Susquehanna River, and is surrounded by rolling hills and farmland.
The climate in Pylesville is typical of the Mid-Atlantic region, with hot, humid summers and cold, wet winters. The average annual temperature is around 55 degrees Fahrenheit.
Economy
The economy of Pylesville is largely based on agriculture and tourism. The town is home to several farms, which produce a variety of crops, including corn, soybeans, wheat, and hay. The town is also home to several wineries, which produce a variety of wines.
Tourism is an important part of the local economy, as the town is home to several historic sites, including the Pylesville Historic District, which is listed on the National Register of Historic Places. The town is also home to several parks and recreational areas, including the Susquehanna State Park, which offers camping, fishing, and hiking opportunities.
Demographics
As of the 2010 census, the population of Pylesville was 1,845. The racial makeup of the town was 94.3% White, 2.2% African American, 0.3% Native American, 0.7% Asian, 0.1% Pacific Islander, and 2.4% from other races. The median household income was $60,938, and the median family income was $68,750.
Pylesville is home to a variety of religious denominations, including Baptist, Methodist, Presbyterian, and Catholic. The town is also home to several schools, including Pylesville Elementary School, Pylesville Middle School, and Pylesville High School.
Conclusion
Pylesville, Maryland is a small unincorporated community located in Harford County, Maryland. It is situated in the northern part of the county, approximately 20 miles northeast of Baltimore. The town was first settled in the late 1700s by the Pyles family, and was officially incorporated in 1872. The economy of Pylesville is largely based on agriculture and tourism, and the town is home to several historic sites, parks, and recreational areas. As of the 2010 census, the population of Pylesville was 1,845. The town is home to a variety of religious denominations, and several schools.
Common Questions
What is Per Capita Income in Pylesville?
Per Capita income in Pylesville is $48,077.
What is the Median Family Income in Pylesville?
Median Family Income in Pylesville is $160,142.
What is the Median Household income in Pylesville?
Median Household Income in Pylesville is $160,142.
What is Income or Wage Gap in Pylesville?
Income or Wage Gap in Pylesville is 68.7%.
Women in Pylesville earn 31.3 cents for every dollar earned by a man.
What is Inequality or Gini Index in Pylesville?
Inequality or Gini Index in Pylesville is 0.50.
What is the Total Population of Pylesville?
Total Population of Pylesville is 780.
What is the Total Male Population of Pylesville?
Total Male Population of Pylesville is 317.
What is the Total Female Population of Pylesville?
Total Female Population of Pylesville is 463.
What is the Ratio of Males per 100 Females in Pylesville?
There are 68.47 Males per 100 Females in Pylesville.
What is the Ratio of Females per 100 Males in Pylesville?
There are 146.06 Females per 100 Males in Pylesville.
What is the Median Population Age in Pylesville?
Median Population Age in Pylesville is 28.3 Years.
What is the Average Family Size in Pylesville
Average Family Size in Pylesville is 3.3 People.
What is the Average Household Size in Pylesville
Average Household Size in Pylesville is 3.5 People.
How Large is the Labor Force in Pylesville?
There are 349 People in the Labor Forcein in Pylesville.
What is the Percentage of People in the Labor Force in Pylesville?
77.4% of People are in the Labor Force in Pylesville.