Rosemont, MD Map & Demographics
Rosemont Map
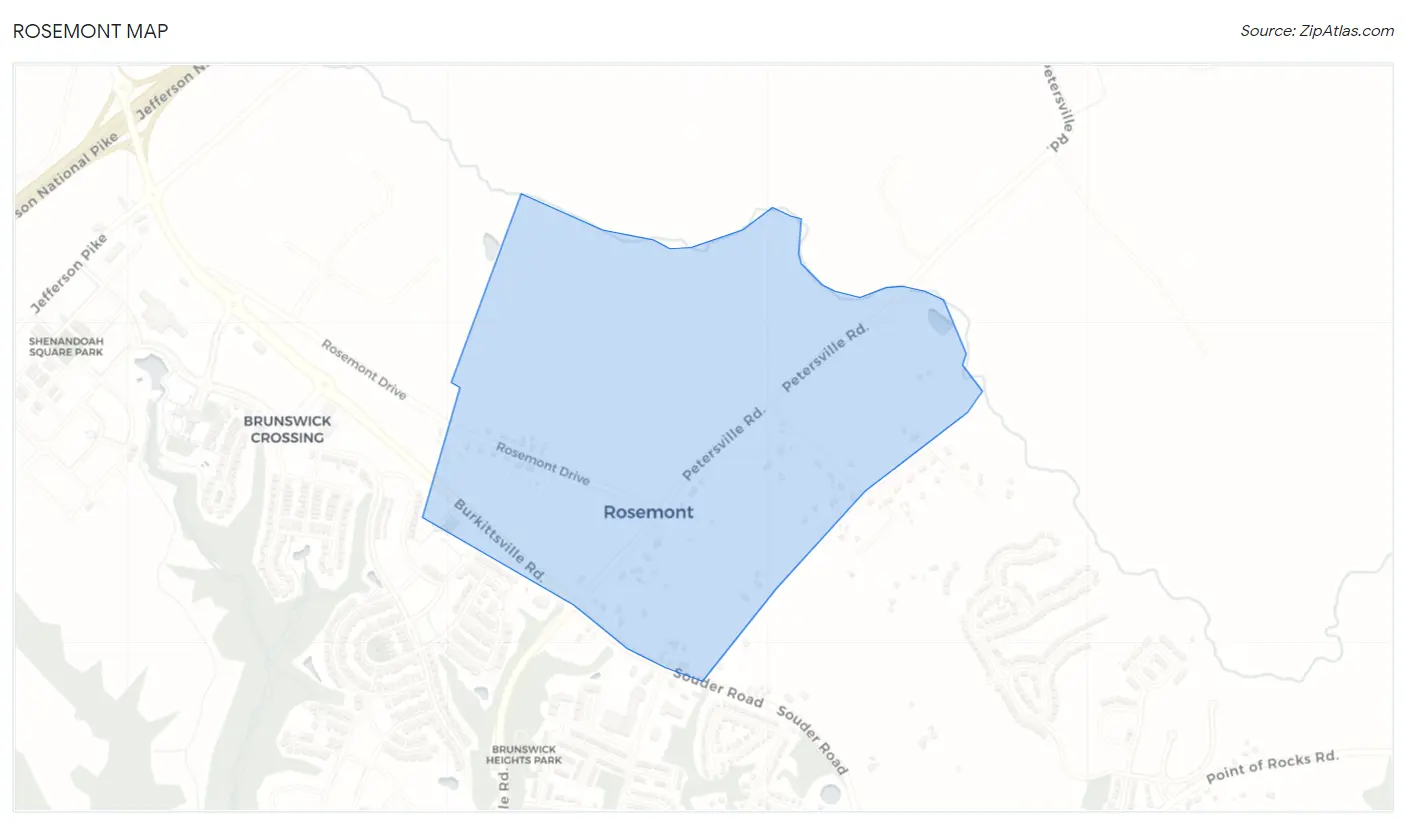
Rosemont Overview
$47,170
PER CAPITA INCOME
$112,679
AVG FAMILY INCOME
$108,750
AVG HOUSEHOLD INCOME
19.2%
WAGE / INCOME GAP [ % ]
80.8¢/ $1
WAGE / INCOME GAP [ $ ]
0.31
INEQUALITY / GINI INDEX
298
TOTAL POPULATION
166
MALE POPULATION
132
FEMALE POPULATION
125.76
MALES / 100 FEMALES
79.52
FEMALES / 100 MALES
57.2
MEDIAN AGE
2.8
AVG FAMILY SIZE
2.4
AVG HOUSEHOLD SIZE
127
LABOR FORCE [ PEOPLE ]
48.8%
PERCENT IN LABOR FORCE
2.4%
UNEMPLOYMENT RATE
Income in Rosemont
Income Overview in Rosemont
Per Capita Income in Rosemont is $47,170, while median incomes of families and households are $112,679 and $108,750 respectively.
| Characteristic | Number | Measure |
| Per Capita Income | 298 | $47,170 |
| Median Family Income | 88 | $112,679 |
| Mean Family Income | 88 | $119,447 |
| Median Household Income | 127 | $108,750 |
| Mean Household Income | 127 | $108,654 |
| Income Deficit | 88 | $0 |
| Wage / Income Gap (%) | 298 | 19.25% |
| Wage / Income Gap ($) | 298 | 80.75¢ per $1 |
| Gini / Inequality Index | 298 | 0.31 |
Earnings by Sex in Rosemont
Average Earnings in Rosemont are $48,750, $47,039 for men and $58,250 for women, a difference of 19.3%.
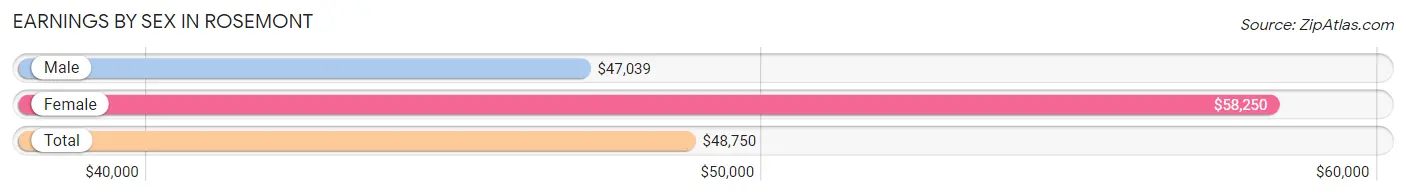
| Sex | Number | Average Earnings |
| Male | 89 (62.7%) | $47,039 |
| Female | 53 (37.3%) | $58,250 |
| Total | 142 (100.0%) | $48,750 |
Earnings by Sex by Income Bracket in Rosemont
The most common earnings brackets in Rosemont are $45,000 to $49,999 for men (21 | 23.6%) and $75,000 to $99,999 for women (11 | 20.7%).
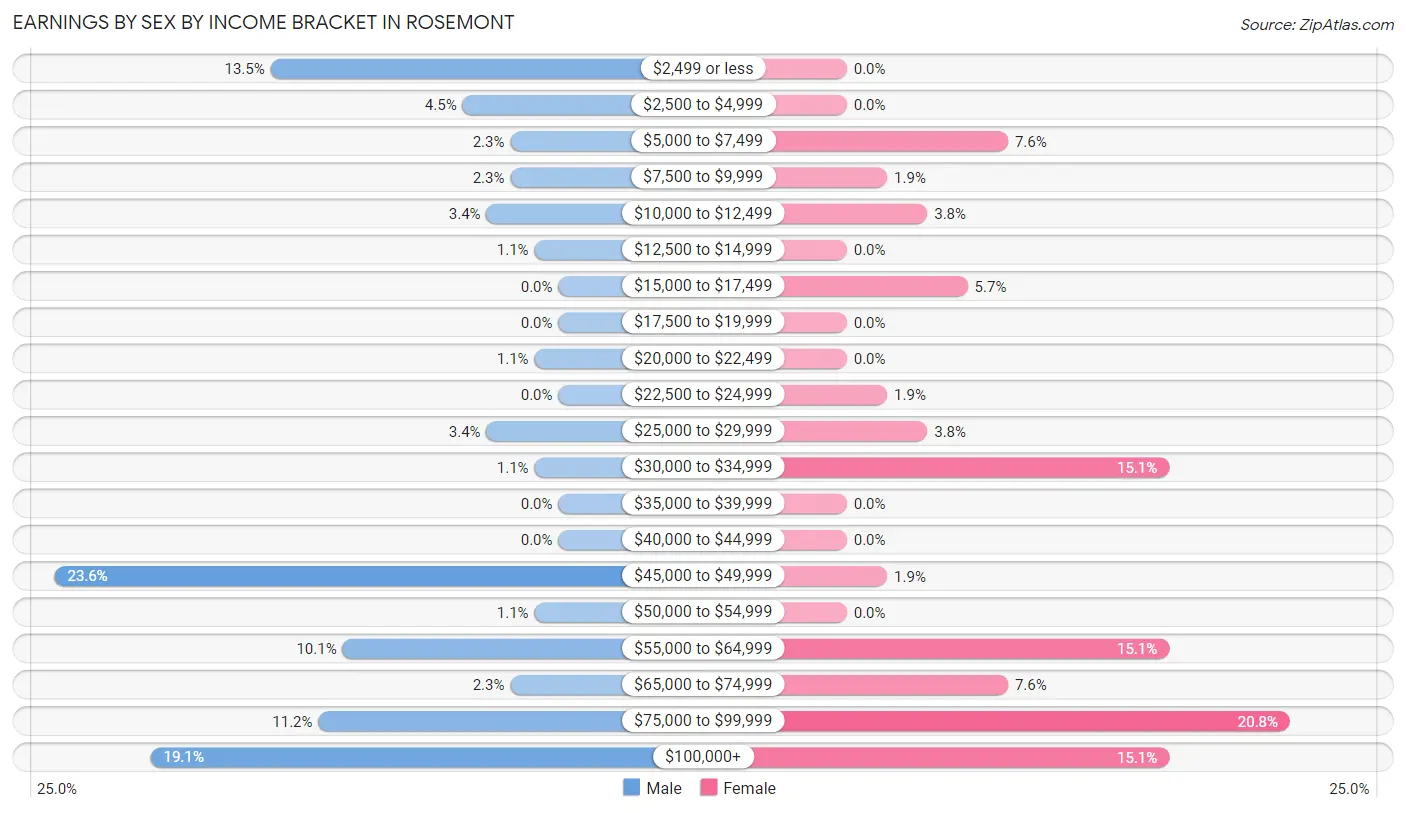
| Income | Male | Female |
| $2,499 or less | 12 (13.5%) | 0 (0.0%) |
| $2,500 to $4,999 | 4 (4.5%) | 0 (0.0%) |
| $5,000 to $7,499 | 2 (2.2%) | 4 (7.5%) |
| $7,500 to $9,999 | 2 (2.2%) | 1 (1.9%) |
| $10,000 to $12,499 | 3 (3.4%) | 2 (3.8%) |
| $12,500 to $14,999 | 1 (1.1%) | 0 (0.0%) |
| $15,000 to $17,499 | 0 (0.0%) | 3 (5.7%) |
| $17,500 to $19,999 | 0 (0.0%) | 0 (0.0%) |
| $20,000 to $22,499 | 1 (1.1%) | 0 (0.0%) |
| $22,500 to $24,999 | 0 (0.0%) | 1 (1.9%) |
| $25,000 to $29,999 | 3 (3.4%) | 2 (3.8%) |
| $30,000 to $34,999 | 1 (1.1%) | 8 (15.1%) |
| $35,000 to $39,999 | 0 (0.0%) | 0 (0.0%) |
| $40,000 to $44,999 | 0 (0.0%) | 0 (0.0%) |
| $45,000 to $49,999 | 21 (23.6%) | 1 (1.9%) |
| $50,000 to $54,999 | 1 (1.1%) | 0 (0.0%) |
| $55,000 to $64,999 | 9 (10.1%) | 8 (15.1%) |
| $65,000 to $74,999 | 2 (2.2%) | 4 (7.5%) |
| $75,000 to $99,999 | 10 (11.2%) | 11 (20.7%) |
| $100,000+ | 17 (19.1%) | 8 (15.1%) |
| Total | 89 (100.0%) | 53 (100.0%) |
Earnings by Sex by Educational Attainment in Rosemont
Average earnings in Rosemont are $48,750 for men and $63,750 for women, a difference of 23.5%. Men with an educational attainment of bachelor's degree enjoy the highest average annual earnings of $76,875, while those with graduate degree education earn the least with $46,382. Women with an educational attainment of bachelor's degree earn the most with the average annual earnings of $73,750, while those with high school diploma education have the smallest earnings of $58,750.
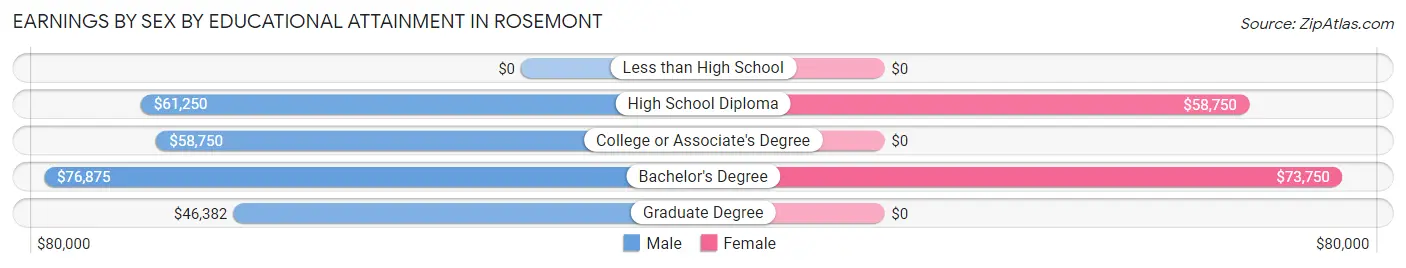
| Educational Attainment | Male Income | Female Income |
| Less than High School | - | - |
| High School Diploma | $61,250 | $58,750 |
| College or Associate's Degree | $58,750 | $0 |
| Bachelor's Degree | $76,875 | $73,750 |
| Graduate Degree | $46,382 | $0 |
| Total | $48,750 | $63,750 |
Family Income in Rosemont
Family Income Brackets in Rosemont
According to the Rosemont family income data, there are 24 families falling into the $100,000 to $149,999 income range, which is the most common income bracket and makes up 27.3% of all families.
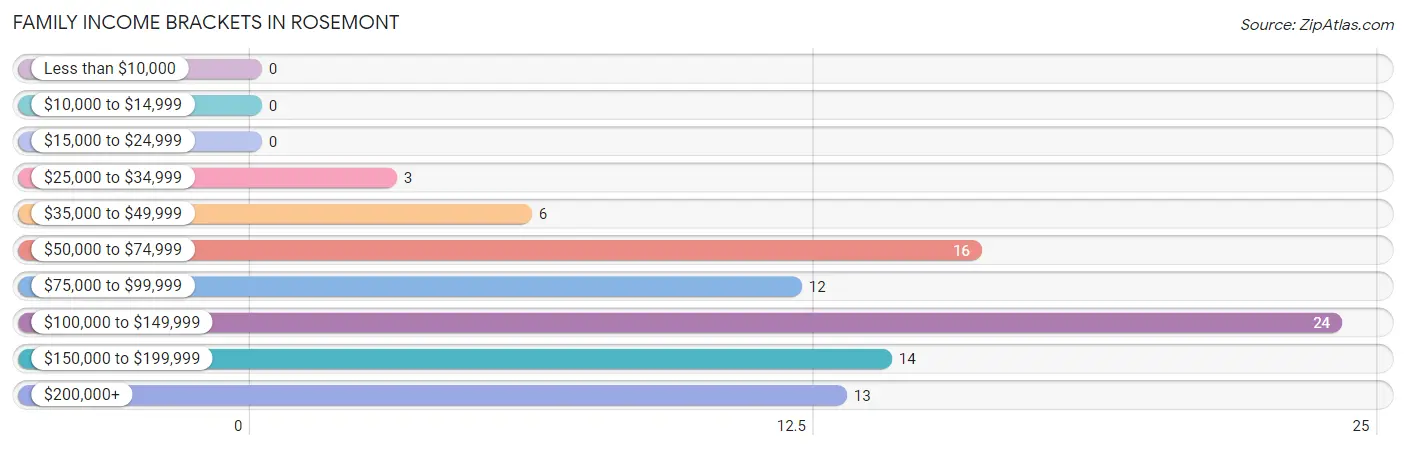
| Income Bracket | # Families | % Families |
| Less than $10,000 | 0 | 0.0% |
| $10,000 to $14,999 | 0 | 0.0% |
| $15,000 to $24,999 | 0 | 0.0% |
| $25,000 to $34,999 | 3 | 3.4% |
| $35,000 to $49,999 | 6 | 6.8% |
| $50,000 to $74,999 | 16 | 18.2% |
| $75,000 to $99,999 | 12 | 13.6% |
| $100,000 to $149,999 | 24 | 27.3% |
| $150,000 to $199,999 | 14 | 15.9% |
| $200,000+ | 13 | 14.8% |
Family Income by Famaliy Size in Rosemont
4-person families (10 | 11.4%) account for the highest median family income in Rosemont with $211,250 per family, while 4-person families (10 | 11.4%) have the highest median income of $52,812 per family member.
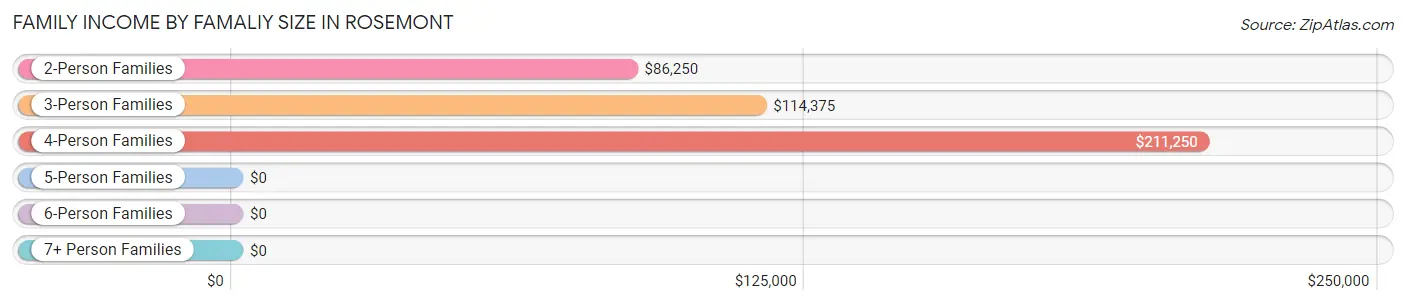
| Income Bracket | # Families | Median Income |
| 2-Person Families | 48 (54.5%) | $86,250 |
| 3-Person Families | 27 (30.7%) | $114,375 |
| 4-Person Families | 10 (11.4%) | $211,250 |
| 5-Person Families | 2 (2.3%) | $0 |
| 6-Person Families | 1 (1.1%) | $0 |
| 7+ Person Families | 0 (0.0%) | $0 |
| Total | 88 (100.0%) | $112,679 |
Family Income by Number of Earners in Rosemont
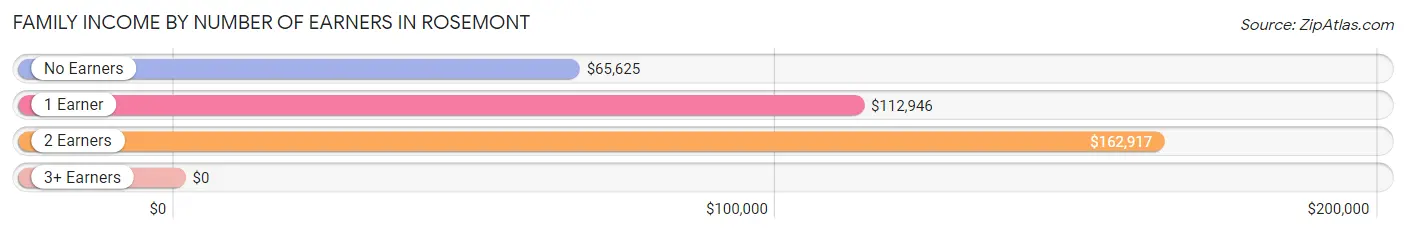
| Number of Earners | # Families | Median Income |
| No Earners | 21 (23.9%) | $65,625 |
| 1 Earner | 33 (37.5%) | $112,946 |
| 2 Earners | 29 (33.0%) | $162,917 |
| 3+ Earners | 5 (5.7%) | $0 |
| Total | 88 (100.0%) | $112,679 |
Household Income in Rosemont
Household Income Brackets in Rosemont
With 38 households falling in the category, the $100,000 to $149,999 income range is the most frequent in Rosemont, accounting for 29.9% of all households.
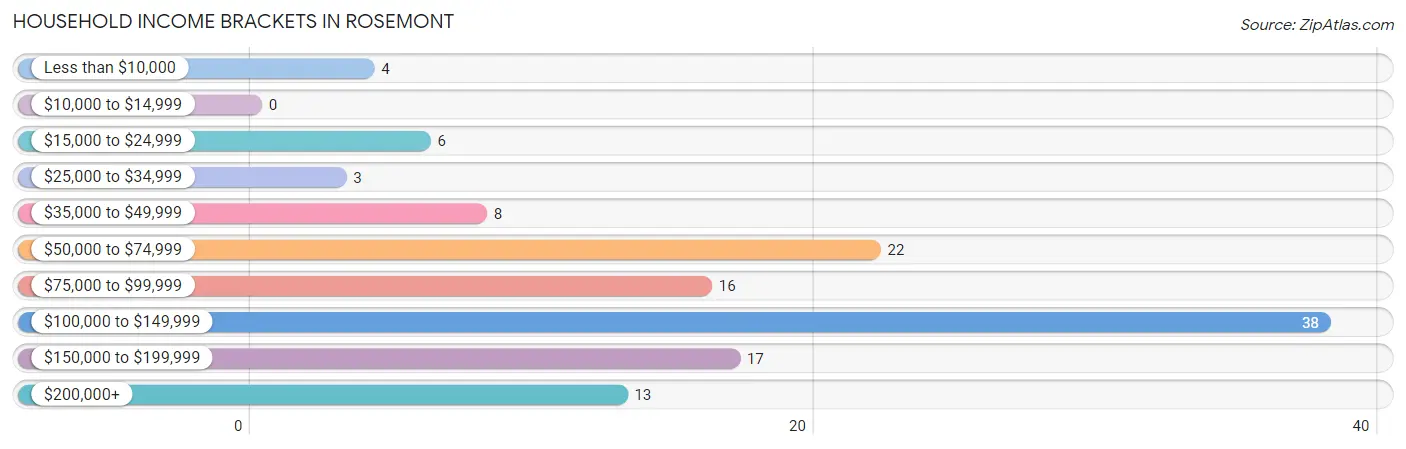
| Income Bracket | # Households | % Households |
| Less than $10,000 | 4 | 3.1% |
| $10,000 to $14,999 | 0 | 0.0% |
| $15,000 to $24,999 | 6 | 4.7% |
| $25,000 to $34,999 | 3 | 2.4% |
| $35,000 to $49,999 | 8 | 6.3% |
| $50,000 to $74,999 | 22 | 17.3% |
| $75,000 to $99,999 | 16 | 12.6% |
| $100,000 to $149,999 | 38 | 29.9% |
| $150,000 to $199,999 | 17 | 13.4% |
| $200,000+ | 13 | 10.2% |
Household Income by Householder Age in Rosemont
The median household income in Rosemont is $108,750, with the highest median household income of $155,625 found in the 45 to 64 years age bracket for the primary householder. A total of 37 households (29.1%) fall into this category. Meanwhile, the 15 to 24 years age bracket for the primary householder has the lowest median household income of $0, with 4 households (3.2%) in this group.
| Income Bracket | # Households | Median Income |
| 15 to 24 Years | 4 (3.2%) | $0 |
| 25 to 44 Years | 24 (18.9%) | $68,750 |
| 45 to 64 Years | 37 (29.1%) | $155,625 |
| 65+ Years | 62 (48.8%) | $95,000 |
| Total | 127 (100.0%) | $108,750 |
Poverty in Rosemont
Income Below Poverty by Sex and Age in Rosemont
With 3.6% poverty level for males and 9.9% for females among the residents of Rosemont, 25 to 34 year old males and 35 to 44 year old females are the most vulnerable to poverty, with 1 males (50.0%) and 6 females (40.0%) in their respective age groups living below the poverty level.
| Age Bracket | Male | Female |
| Under 5 Years | 1 (25.0%) | 0 (0.0%) |
| 5 Years | 0 (0.0%) | 0 (0.0%) |
| 6 to 11 Years | 0 (0.0%) | 0 (0.0%) |
| 12 to 14 Years | 0 (0.0%) | 0 (0.0%) |
| 15 Years | 0 (0.0%) | 0 (0.0%) |
| 16 and 17 Years | 0 (0.0%) | 0 (0.0%) |
| 18 to 24 Years | 0 (0.0%) | 0 (0.0%) |
| 25 to 34 Years | 1 (50.0%) | 3 (37.5%) |
| 35 to 44 Years | 0 (0.0%) | 6 (40.0%) |
| 45 to 54 Years | 0 (0.0%) | 0 (0.0%) |
| 55 to 64 Years | 0 (0.0%) | 2 (9.1%) |
| 65 to 74 Years | 4 (16.7%) | 0 (0.0%) |
| 75 Years and over | 0 (0.0%) | 2 (6.2%) |
| Total | 6 (3.6%) | 13 (9.9%) |
Income Above Poverty by Sex and Age in Rosemont
According to the poverty statistics in Rosemont, males aged 6 to 11 years and females aged under 5 years are the age groups that are most secure financially, with 100.0% of males and 100.0% of females in these age groups living above the poverty line.
| Age Bracket | Male | Female |
| Under 5 Years | 3 (75.0%) | 2 (100.0%) |
| 5 Years | 0 (0.0%) | 0 (0.0%) |
| 6 to 11 Years | 8 (100.0%) | 7 (100.0%) |
| 12 to 14 Years | 13 (100.0%) | 3 (100.0%) |
| 15 Years | 1 (100.0%) | 0 (0.0%) |
| 16 and 17 Years | 5 (100.0%) | 4 (100.0%) |
| 18 to 24 Years | 13 (100.0%) | 6 (100.0%) |
| 25 to 34 Years | 1 (50.0%) | 5 (62.5%) |
| 35 to 44 Years | 13 (100.0%) | 9 (60.0%) |
| 45 to 54 Years | 30 (100.0%) | 10 (100.0%) |
| 55 to 64 Years | 17 (100.0%) | 20 (90.9%) |
| 65 to 74 Years | 20 (83.3%) | 23 (100.0%) |
| 75 Years and over | 36 (100.0%) | 30 (93.8%) |
| Total | 160 (96.4%) | 119 (90.1%) |
Income Below Poverty Among Married-Couple Families in Rosemont
| Children | Above Poverty | Below Poverty |
| No Children | 58 (100.0%) | 0 (0.0%) |
| 1 or 2 Children | 14 (100.0%) | 0 (0.0%) |
| 3 or 4 Children | 1 (100.0%) | 0 (0.0%) |
| 5 or more Children | 0 (0.0%) | 0 (0.0%) |
| Total | 73 (100.0%) | 0 (0.0%) |
Income Below Poverty Among Single-Parent Households in Rosemont
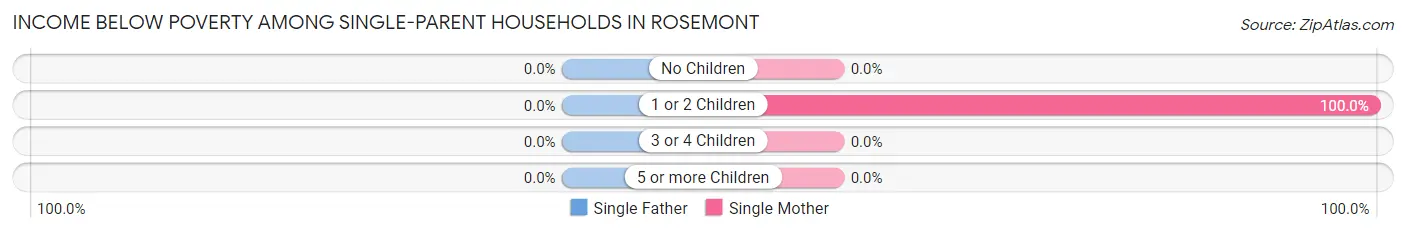
| Children | Single Father | Single Mother |
| No Children | 0 (0.0%) | 0 (0.0%) |
| 1 or 2 Children | 0 (0.0%) | 1 (100.0%) |
| 3 or 4 Children | 0 (0.0%) | 0 (0.0%) |
| 5 or more Children | 0 (0.0%) | 0 (0.0%) |
| Total | 0 (0.0%) | 1 (14.3%) |
Income Below Poverty Among Married-Couple vs Single-Parent Households in Rosemont
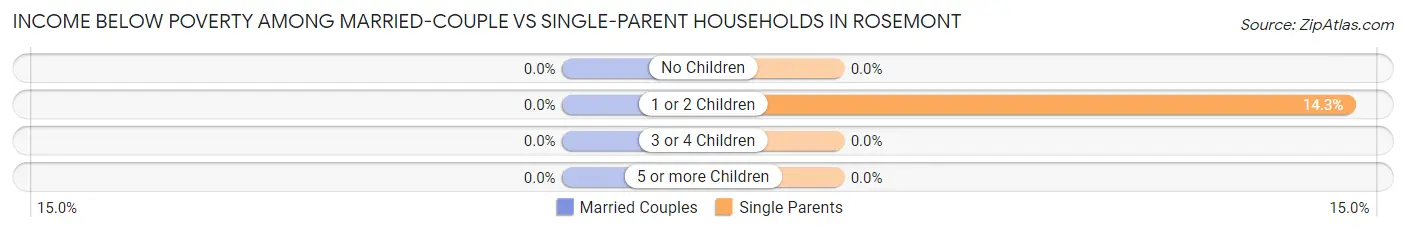
| Children | Married-Couple Families | Single-Parent Households |
| No Children | 0 (0.0%) | 0 (0.0%) |
| 1 or 2 Children | 0 (0.0%) | 1 (14.3%) |
| 3 or 4 Children | 0 (0.0%) | 0 (0.0%) |
| 5 or more Children | 0 (0.0%) | 0 (0.0%) |
| Total | 0 (0.0%) | 1 (6.7%) |
Race in Rosemont
The most populous races in Rosemont are White / Caucasian (276 | 92.6%), Two or more Races (17 | 5.7%), and Hispanic or Latino (6 | 2.0%).
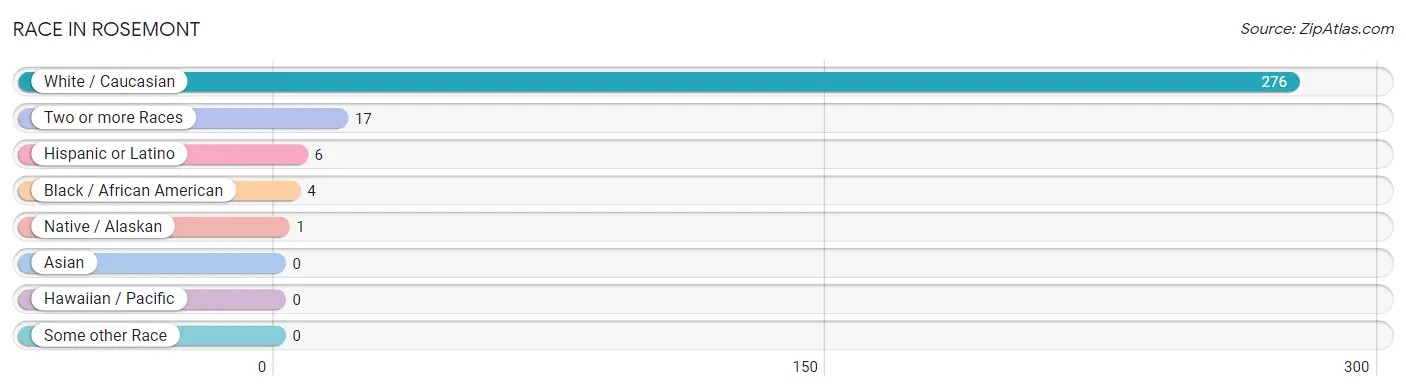
| Race | # Population | % Population |
| Asian | 0 | 0.0% |
| Black / African American | 4 | 1.3% |
| Hawaiian / Pacific | 0 | 0.0% |
| Hispanic or Latino | 6 | 2.0% |
| Native / Alaskan | 1 | 0.3% |
| White / Caucasian | 276 | 92.6% |
| Two or more Races | 17 | 5.7% |
| Some other Race | 0 | 0.0% |
| Total | 298 | 100.0% |
Ancestry in Rosemont
The most populous ancestries reported in Rosemont are German (116 | 38.9%), English (63 | 21.1%), Irish (39 | 13.1%), Italian (38 | 12.8%), and American (24 | 8.1%), together accounting for 94.0% of all Rosemont residents.
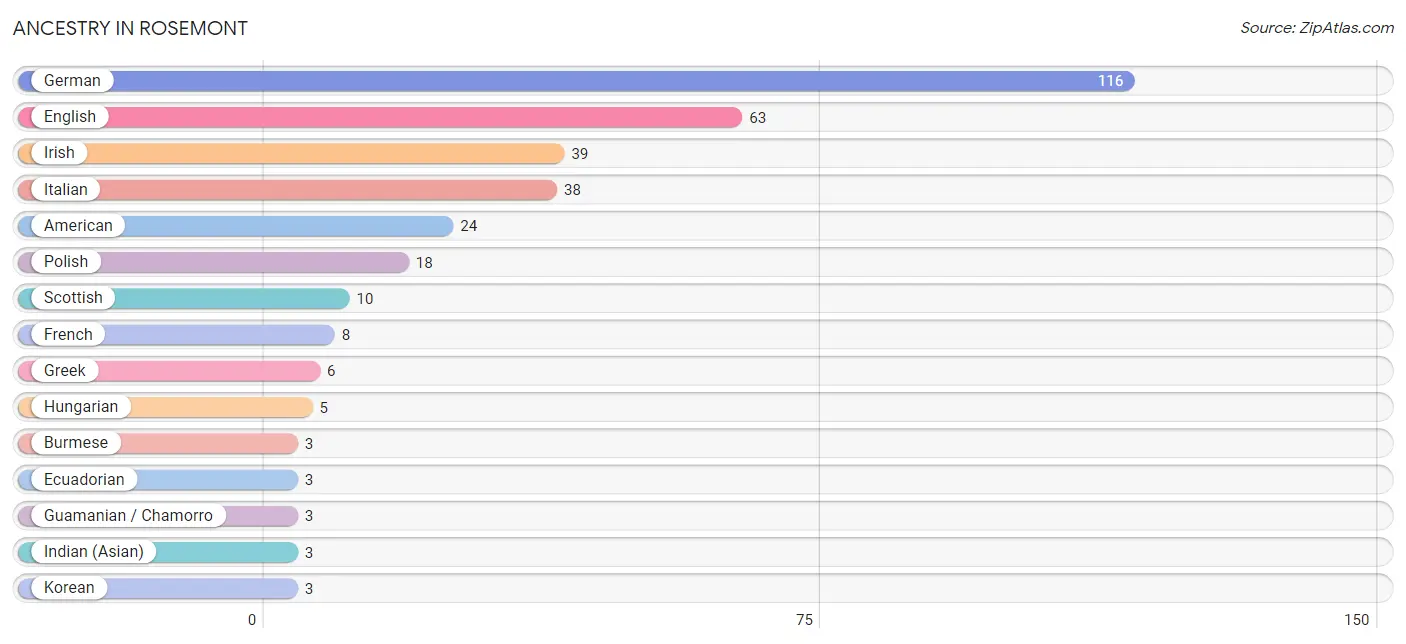
| Ancestry | # Population | % Population |
| American | 24 | 8.1% |
| Burmese | 3 | 1.0% |
| Cuban | 2 | 0.7% |
| Dutch | 1 | 0.3% |
| Ecuadorian | 3 | 1.0% |
| English | 63 | 21.1% |
| European | 2 | 0.7% |
| French | 8 | 2.7% |
| German | 116 | 38.9% |
| Greek | 6 | 2.0% |
| Guamanian / Chamorro | 3 | 1.0% |
| Hungarian | 5 | 1.7% |
| Indian (Asian) | 3 | 1.0% |
| Irish | 39 | 13.1% |
| Italian | 38 | 12.8% |
| Korean | 3 | 1.0% |
| Lithuanian | 1 | 0.3% |
| Native Hawaiian | 3 | 1.0% |
| Norwegian | 1 | 0.3% |
| Polish | 18 | 6.0% |
| Portuguese | 1 | 0.3% |
| Puerto Rican | 1 | 0.3% |
| Russian | 2 | 0.7% |
| Samoan | 3 | 1.0% |
| Scotch-Irish | 2 | 0.7% |
| Scottish | 10 | 3.4% |
| South American | 3 | 1.0% |
| South American Indian | 1 | 0.3% |
| Sri Lankan | 3 | 1.0% |
| Thai | 3 | 1.0% |
| Ukrainian | 3 | 1.0% | View All 31 Rows |
Immigrants in Rosemont
The most numerous immigrant groups reported in Rosemont came from Latin America (4 | 1.3%), South America (4 | 1.3%), Ecuador (3 | 1.0%), Europe (3 | 1.0%), and Germany (3 | 1.0%), together accounting for 5.7% of all Rosemont residents.
| Immigration Origin | # Population | % Population |
| Ecuador | 3 | 1.0% |
| Europe | 3 | 1.0% |
| Germany | 3 | 1.0% |
| Guyana | 1 | 0.3% |
| Latin America | 4 | 1.3% |
| South America | 4 | 1.3% |
| Western Europe | 3 | 1.0% | View All 7 Rows |
Sex and Age in Rosemont
Sex and Age in Rosemont
The most populous age groups in Rosemont are 45 to 49 Years (24 | 14.5%) for men and 75 to 79 Years (17 | 12.9%) for women.
| Age Bracket | Male | Female |
| Under 5 Years | 4 (2.4%) | 2 (1.5%) |
| 5 to 9 Years | 2 (1.2%) | 4 (3.0%) |
| 10 to 14 Years | 19 (11.5%) | 6 (4.5%) |
| 15 to 19 Years | 10 (6.0%) | 5 (3.8%) |
| 20 to 24 Years | 9 (5.4%) | 5 (3.8%) |
| 25 to 29 Years | 0 (0.0%) | 2 (1.5%) |
| 30 to 34 Years | 2 (1.2%) | 6 (4.5%) |
| 35 to 39 Years | 6 (3.6%) | 2 (1.5%) |
| 40 to 44 Years | 7 (4.2%) | 13 (9.9%) |
| 45 to 49 Years | 24 (14.5%) | 2 (1.5%) |
| 50 to 54 Years | 6 (3.6%) | 8 (6.1%) |
| 55 to 59 Years | 12 (7.2%) | 6 (4.5%) |
| 60 to 64 Years | 5 (3.0%) | 16 (12.1%) |
| 65 to 69 Years | 17 (10.2%) | 11 (8.3%) |
| 70 to 74 Years | 7 (4.2%) | 12 (9.1%) |
| 75 to 79 Years | 23 (13.9%) | 17 (12.9%) |
| 80 to 84 Years | 9 (5.4%) | 8 (6.1%) |
| 85 Years and over | 4 (2.4%) | 7 (5.3%) |
| Total | 166 (100.0%) | 132 (100.0%) |
Families and Households in Rosemont
Median Family Size in Rosemont
The median family size in Rosemont is 2.77 persons per family, with single female/mother families (7 | 8.0%) accounting for the largest median family size of 3.43 persons per family. On the other hand, single male/father families (8 | 9.1%) represent the smallest median family size with 2.63 persons per family.
| Family Type | # Families | Family Size |
| Married-Couple | 73 (83.0%) | 2.73 |
| Single Male/Father | 8 (9.1%) | 2.63 |
| Single Female/Mother | 7 (8.0%) | 3.43 |
| Total Families | 88 (100.0%) | 2.77 |
Median Household Size in Rosemont
The median household size in Rosemont is 2.35 persons per household, with single female/mother households (7 | 5.5%) accounting for the largest median household size of 3.57 persons per household. non-family households (39 | 30.7%) represent the smallest median household size with 1.31 persons per household.
| Household Type | # Households | Household Size |
| Married-Couple | 73 (57.5%) | 2.73 |
| Single Male/Father | 8 (6.3%) | 2.88 |
| Single Female/Mother | 7 (5.5%) | 3.57 |
| Non-family | 39 (30.7%) | 1.31 |
| Total Households | 127 (100.0%) | 2.35 |
Household Size by Marriage Status in Rosemont
Out of a total of 127 households in Rosemont, 88 (69.3%) are family households, while 39 (30.7%) are nonfamily households. The most numerous type of family households are 2-person households, comprising 47, and the most common type of nonfamily households are 1-person households, comprising 29.
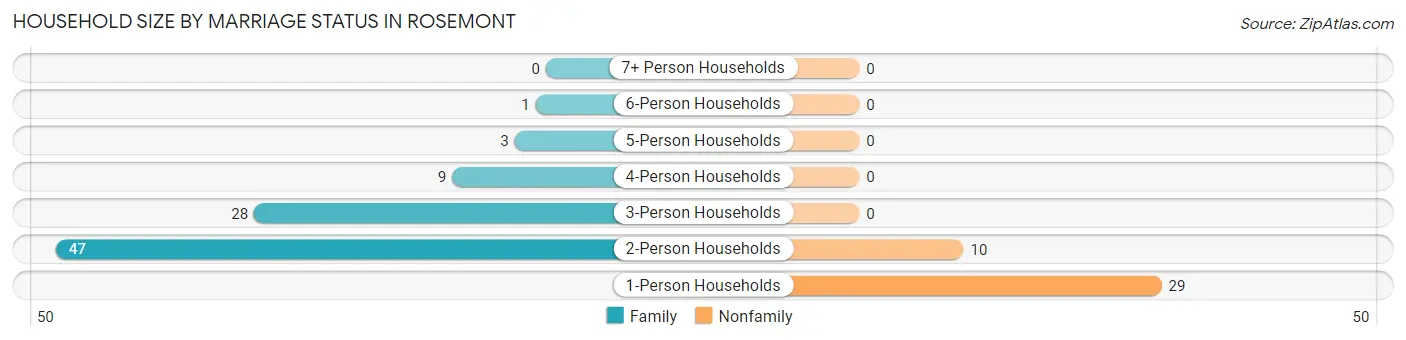
| Household Size | Family Households | Nonfamily Households |
| 1-Person Households | - | 29 (22.8%) |
| 2-Person Households | 47 (37.0%) | 10 (7.9%) |
| 3-Person Households | 28 (22.1%) | 0 (0.0%) |
| 4-Person Households | 9 (7.1%) | 0 (0.0%) |
| 5-Person Households | 3 (2.4%) | 0 (0.0%) |
| 6-Person Households | 1 (0.8%) | 0 (0.0%) |
| 7+ Person Households | 0 (0.0%) | 0 (0.0%) |
| Total | 88 (69.3%) | 39 (30.7%) |
Female Fertility in Rosemont
Fertility by Age in Rosemont
| Age Bracket | Women with Births | Births / 1,000 Women |
| 15 to 19 years | 0 (0.0%) | 0.0 |
| 20 to 34 years | 0 (0.0%) | 0.0 |
| 35 to 50 years | 0 (0.0%) | 0.0 |
| Total | 0 (0.0%) | 0.0 |
Fertility by Age by Marriage Status in Rosemont
| Age Bracket | Married | Unmarried |
| 15 to 19 years | 0 (0.0%) | 0 (0.0%) |
| 20 to 34 years | 0 (0.0%) | 0 (0.0%) |
| 35 to 50 years | 0 (0.0%) | 0 (0.0%) |
| Total | 0 (0.0%) | 0 (0.0%) |
Fertility by Education in Rosemont
| Educational Attainment | Women with Births | Births / 1,000 Women |
| Less than High School | 0 (0.0%) | 0.0 |
| High School Diploma | 0 (0.0%) | 0.0 |
| College or Associate's Degree | 0 (0.0%) | 0.0 |
| Bachelor's Degree | 0 (0.0%) | 0.0 |
| Graduate Degree | 0 (0.0%) | 0.0 |
| Total | 0 (0.0%) | 0.0 |
Fertility by Education by Marriage Status in Rosemont
| Educational Attainment | Married | Unmarried |
| Less than High School | 0 (0.0%) | 0 (0.0%) |
| High School Diploma | 0 (0.0%) | 0 (0.0%) |
| College or Associate's Degree | 0 (0.0%) | 0 (0.0%) |
| Bachelor's Degree | 0 (0.0%) | 0 (0.0%) |
| Graduate Degree | 0 (0.0%) | 0 (0.0%) |
| Total | 0 (0.0%) | 0 (0.0%) |
Employment Characteristics in Rosemont
Employment by Class of Employer in Rosemont
Among the 123 employed individuals in Rosemont, private company employees (69 | 56.1%), self-employed (not incorporated) (29 | 23.6%), and local government employees (11 | 8.9%) make up the most common classes of employment.
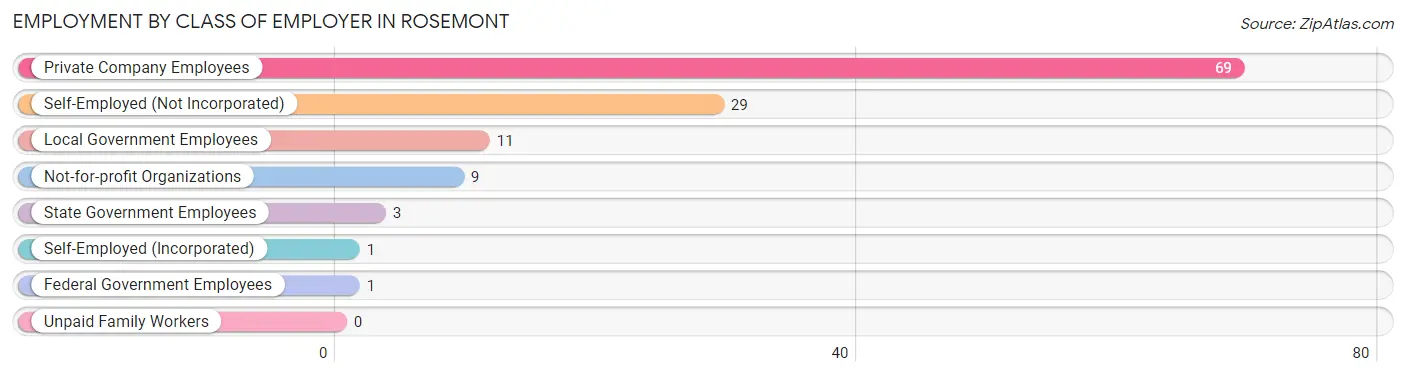
| Employer Class | # Employees | % Employees |
| Private Company Employees | 69 | 56.1% |
| Self-Employed (Incorporated) | 1 | 0.8% |
| Self-Employed (Not Incorporated) | 29 | 23.6% |
| Not-for-profit Organizations | 9 | 7.3% |
| Local Government Employees | 11 | 8.9% |
| State Government Employees | 3 | 2.4% |
| Federal Government Employees | 1 | 0.8% |
| Unpaid Family Workers | 0 | 0.0% |
| Total | 123 | 100.0% |
Employment Status by Age in Rosemont
According to the labor force statistics for Rosemont, out of the total population over 16 years of age (260), 48.8% or 127 individuals are in the labor force, with 2.4% or 3 of them unemployed. The age group with the highest labor force participation rate is 20 to 24 years, with 92.9% or 13 individuals in the labor force. Within the labor force, the 55 to 59 years age range has the highest percentage of unemployed individuals, with 15.4% or 2 of them being unemployed.
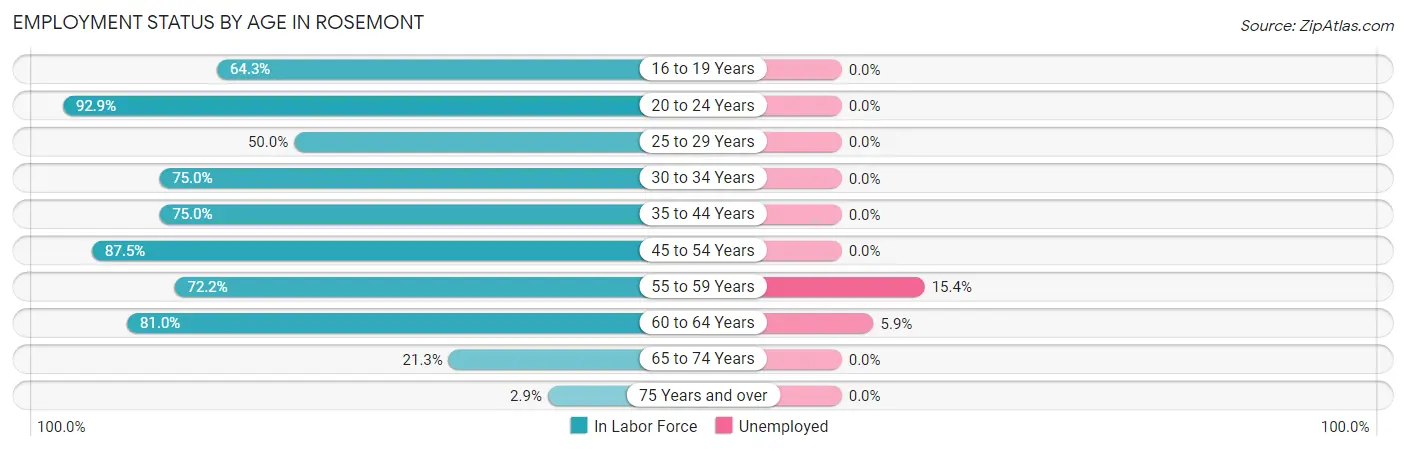
| Age Bracket | In Labor Force | Unemployed |
| 16 to 19 Years | 9 (64.3%) | 0 (0.0%) |
| 20 to 24 Years | 13 (92.9%) | 0 (0.0%) |
| 25 to 29 Years | 1 (50.0%) | 0 (0.0%) |
| 30 to 34 Years | 6 (75.0%) | 0 (0.0%) |
| 35 to 44 Years | 21 (75.0%) | 0 (0.0%) |
| 45 to 54 Years | 35 (87.5%) | 0 (0.0%) |
| 55 to 59 Years | 13 (72.2%) | 2 (15.4%) |
| 60 to 64 Years | 17 (81.0%) | 1 (5.9%) |
| 65 to 74 Years | 10 (21.3%) | 0 (0.0%) |
| 75 Years and over | 2 (2.9%) | 0 (0.0%) |
| Total | 127 (48.8%) | 3 (2.4%) |
Employment Status by Educational Attainment in Rosemont
According to labor force statistics for Rosemont, 79.5% of individuals (93) out of the total population between 25 and 64 years of age (117) are in the labor force, with 3.2% or 3 of them being unemployed. The group with the highest labor force participation rate are those with the educational attainment of bachelor's degree or higher, with 89.5% or 51 individuals in the labor force. Within the labor force, individuals with less than high school education have the highest percentage of unemployment, with 100.0% or 1 of them being unemployed.
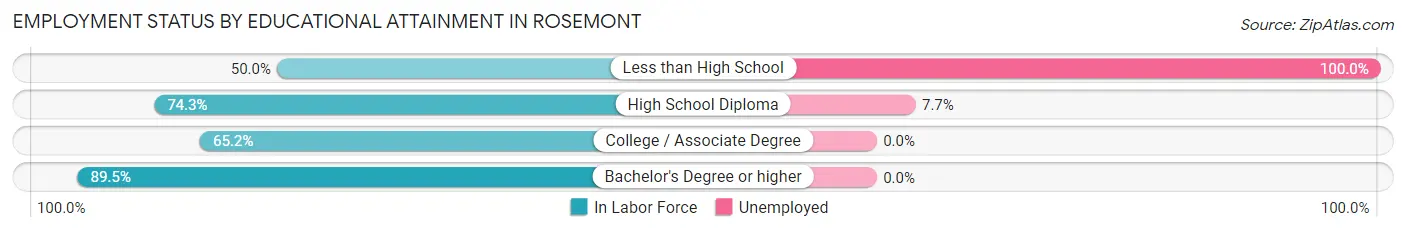
| Educational Attainment | In Labor Force | Unemployed |
| Less than High School | 1 (50.0%) | 2 (100.0%) |
| High School Diploma | 26 (74.3%) | 3 (7.7%) |
| College / Associate Degree | 15 (65.2%) | 0 (0.0%) |
| Bachelor's Degree or higher | 51 (89.5%) | 0 (0.0%) |
| Total | 93 (79.5%) | 4 (3.2%) |
Employment Occupations by Sex in Rosemont
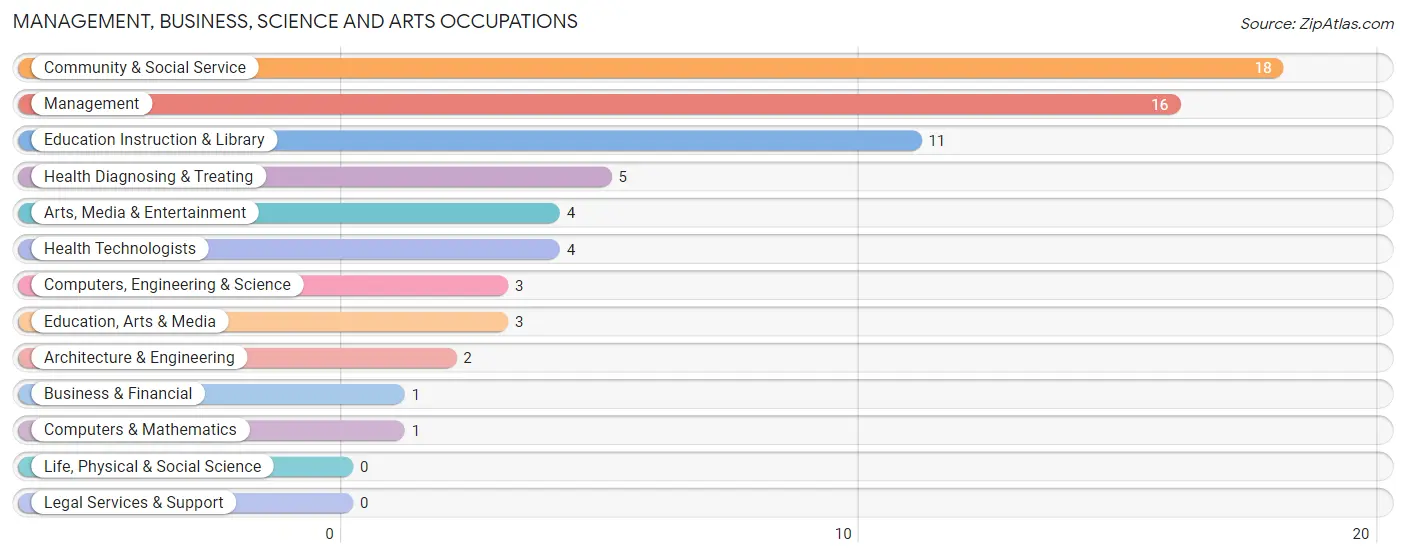
Management, Business, Science and Arts Occupations
The most common Management, Business, Science and Arts occupations in Rosemont are Community & Social Service (18 | 14.5%), Management (16 | 12.9%), Education Instruction & Library (11 | 8.9%), Health Diagnosing & Treating (5 | 4.0%), and Arts, Media & Entertainment (4 | 3.2%).
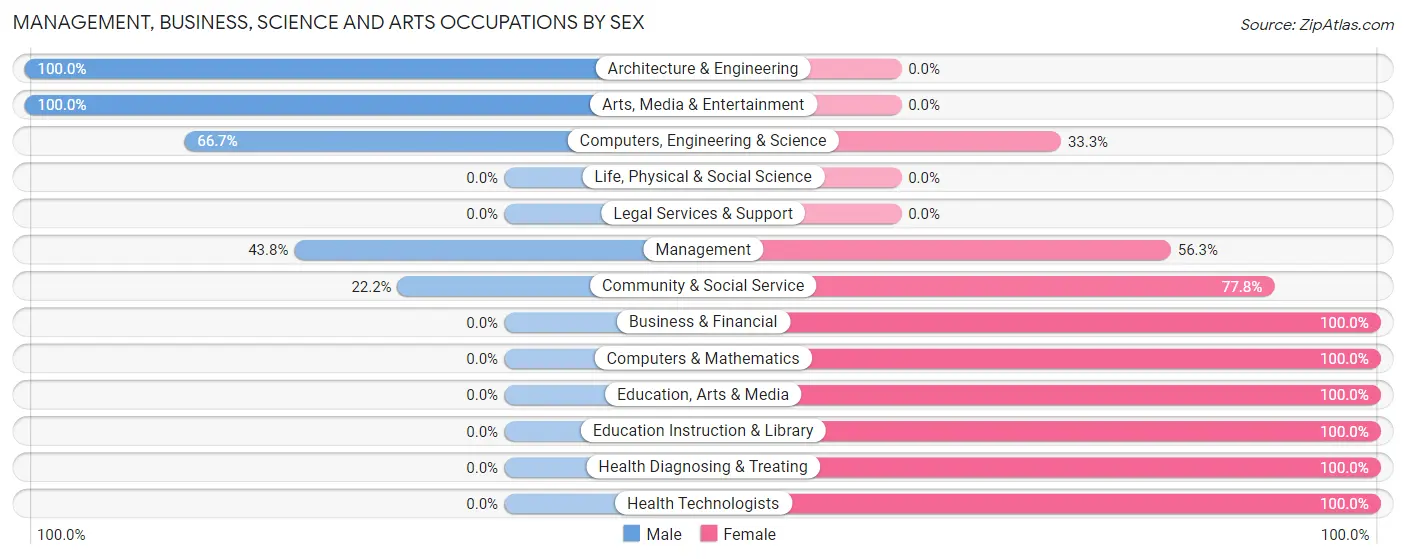
Management, Business, Science and Arts Occupations by Sex
Within the Management, Business, Science and Arts occupations in Rosemont, the most male-oriented occupations are Architecture & Engineering (100.0%), Arts, Media & Entertainment (100.0%), and Computers, Engineering & Science (66.7%), while the most female-oriented occupations are Business & Financial (100.0%), Computers & Mathematics (100.0%), and Education, Arts & Media (100.0%).
| Occupation | Male | Female |
| Management | 7 (43.8%) | 9 (56.2%) |
| Business & Financial | 0 (0.0%) | 1 (100.0%) |
| Computers, Engineering & Science | 2 (66.7%) | 1 (33.3%) |
| Computers & Mathematics | 0 (0.0%) | 1 (100.0%) |
| Architecture & Engineering | 2 (100.0%) | 0 (0.0%) |
| Life, Physical & Social Science | 0 (0.0%) | 0 (0.0%) |
| Community & Social Service | 4 (22.2%) | 14 (77.8%) |
| Education, Arts & Media | 0 (0.0%) | 3 (100.0%) |
| Legal Services & Support | 0 (0.0%) | 0 (0.0%) |
| Education Instruction & Library | 0 (0.0%) | 11 (100.0%) |
| Arts, Media & Entertainment | 4 (100.0%) | 0 (0.0%) |
| Health Diagnosing & Treating | 0 (0.0%) | 5 (100.0%) |
| Health Technologists | 0 (0.0%) | 4 (100.0%) |
| Total (Category) | 13 (30.2%) | 30 (69.8%) |
| Total (Overall) | 74 (59.7%) | 50 (40.3%) |
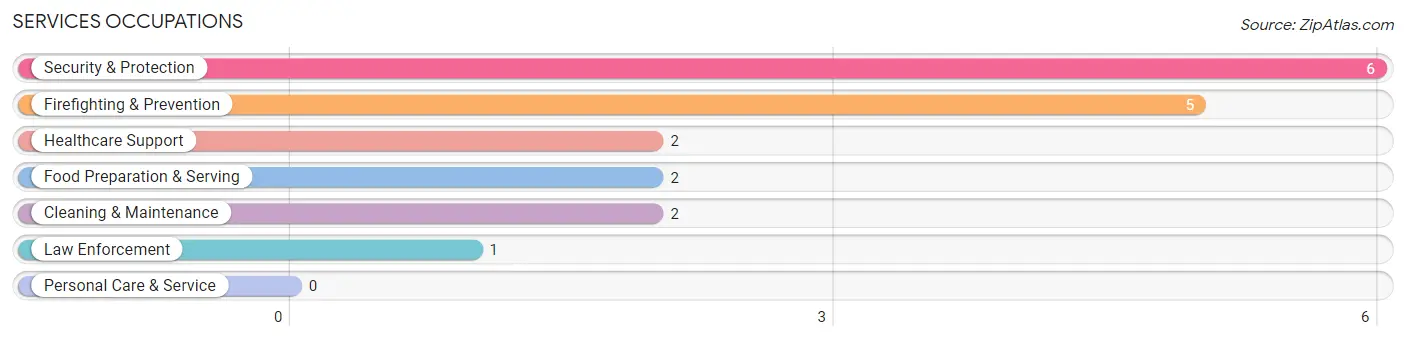
Services Occupations
The most common Services occupations in Rosemont are Security & Protection (6 | 4.8%), Firefighting & Prevention (5 | 4.0%), Healthcare Support (2 | 1.6%), Food Preparation & Serving (2 | 1.6%), and Cleaning & Maintenance (2 | 1.6%).
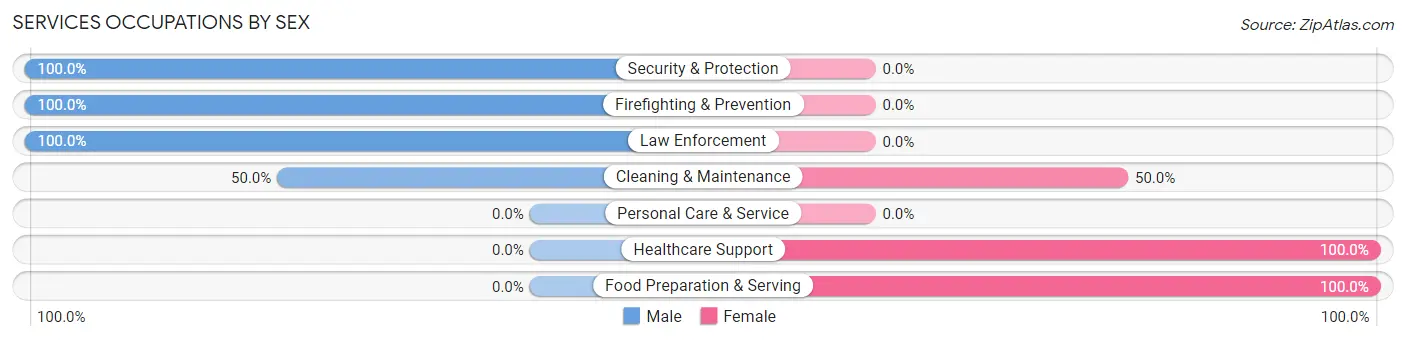
Services Occupations by Sex
Within the Services occupations in Rosemont, the most male-oriented occupations are Security & Protection (100.0%), Firefighting & Prevention (100.0%), and Law Enforcement (100.0%), while the most female-oriented occupations are Healthcare Support (100.0%), Food Preparation & Serving (100.0%), and Cleaning & Maintenance (50.0%).
| Occupation | Male | Female |
| Healthcare Support | 0 (0.0%) | 2 (100.0%) |
| Security & Protection | 6 (100.0%) | 0 (0.0%) |
| Firefighting & Prevention | 5 (100.0%) | 0 (0.0%) |
| Law Enforcement | 1 (100.0%) | 0 (0.0%) |
| Food Preparation & Serving | 0 (0.0%) | 2 (100.0%) |
| Cleaning & Maintenance | 1 (50.0%) | 1 (50.0%) |
| Personal Care & Service | 0 (0.0%) | 0 (0.0%) |
| Total (Category) | 7 (58.3%) | 5 (41.7%) |
| Total (Overall) | 74 (59.7%) | 50 (40.3%) |
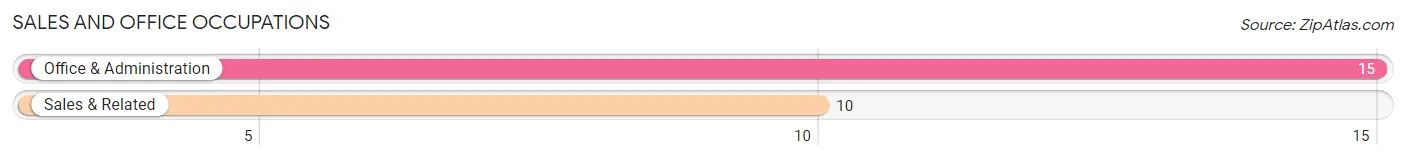
Sales and Office Occupations
The most common Sales and Office occupations in Rosemont are Office & Administration (15 | 12.1%), and Sales & Related (10 | 8.1%).
Sales and Office Occupations by Sex
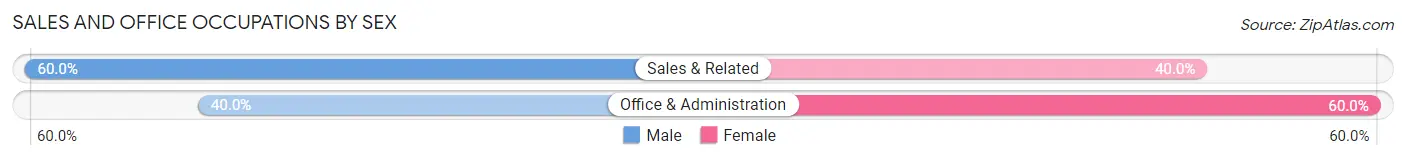
| Occupation | Male | Female |
| Sales & Related | 6 (60.0%) | 4 (40.0%) |
| Office & Administration | 6 (40.0%) | 9 (60.0%) |
| Total (Category) | 12 (48.0%) | 13 (52.0%) |
| Total (Overall) | 74 (59.7%) | 50 (40.3%) |
Natural Resources, Construction and Maintenance Occupations
The most common Natural Resources, Construction and Maintenance occupations in Rosemont are Installation, Maintenance & Repair (21 | 16.9%), and Construction & Extraction (6 | 4.8%).
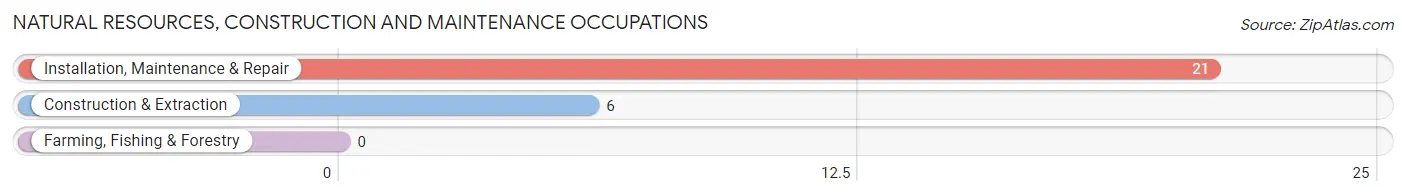
Natural Resources, Construction and Maintenance Occupations by Sex
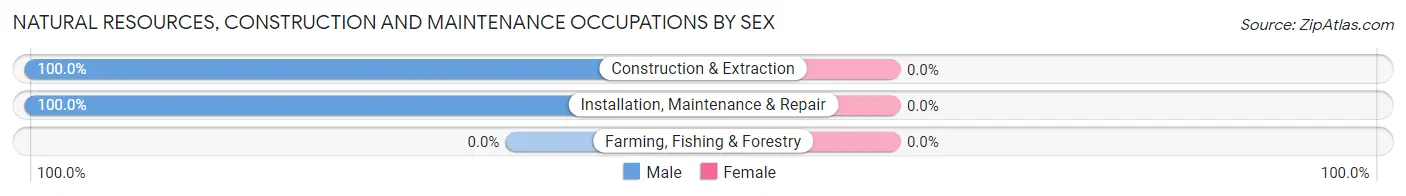
| Occupation | Male | Female |
| Farming, Fishing & Forestry | 0 (0.0%) | 0 (0.0%) |
| Construction & Extraction | 6 (100.0%) | 0 (0.0%) |
| Installation, Maintenance & Repair | 21 (100.0%) | 0 (0.0%) |
| Total (Category) | 27 (100.0%) | 0 (0.0%) |
| Total (Overall) | 74 (59.7%) | 50 (40.3%) |
Production, Transportation and Moving Occupations
The most common Production, Transportation and Moving occupations in Rosemont are Production (9 | 7.3%), Transportation (6 | 4.8%), and Material Moving (2 | 1.6%).
Production, Transportation and Moving Occupations by Sex
| Occupation | Male | Female |
| Production | 7 (77.8%) | 2 (22.2%) |
| Transportation | 6 (100.0%) | 0 (0.0%) |
| Material Moving | 2 (100.0%) | 0 (0.0%) |
| Total (Category) | 15 (88.2%) | 2 (11.8%) |
| Total (Overall) | 74 (59.7%) | 50 (40.3%) |
Employment Industries by Sex in Rosemont
Employment Industries in Rosemont
The major employment industries in Rosemont include Professional & Scientific (14 | 11.3%), Educational Services (12 | 9.7%), Retail Trade (10 | 8.1%), Administrative & Support (10 | 8.1%), and Health Care & Social Assistance (10 | 8.1%).
Employment Industries by Sex in Rosemont
The Rosemont industries that see more men than women are Transportation & Warehousing (100.0%), Utilities (100.0%), and Real Estate, Rental & Leasing (100.0%), whereas the industries that tend to have a higher number of women are Finance & Insurance (100.0%), Educational Services (100.0%), and Health Care & Social Assistance (100.0%).
| Industry | Male | Female |
| Agriculture, Fishing & Hunting | 0 (0.0%) | 0 (0.0%) |
| Mining, Quarrying, & Extraction | 0 (0.0%) | 0 (0.0%) |
| Construction | 3 (42.9%) | 4 (57.1%) |
| Manufacturing | 1 (16.7%) | 5 (83.3%) |
| Wholesale Trade | 4 (80.0%) | 1 (20.0%) |
| Retail Trade | 7 (70.0%) | 3 (30.0%) |
| Transportation & Warehousing | 6 (100.0%) | 0 (0.0%) |
| Utilities | 1 (100.0%) | 0 (0.0%) |
| Information | 0 (0.0%) | 0 (0.0%) |
| Finance & Insurance | 0 (0.0%) | 1 (100.0%) |
| Real Estate, Rental & Leasing | 2 (100.0%) | 0 (0.0%) |
| Professional & Scientific | 6 (42.9%) | 8 (57.1%) |
| Enterprise Management | 0 (0.0%) | 0 (0.0%) |
| Administrative & Support | 10 (100.0%) | 0 (0.0%) |
| Educational Services | 0 (0.0%) | 12 (100.0%) |
| Health Care & Social Assistance | 0 (0.0%) | 10 (100.0%) |
| Arts, Entertainment & Recreation | 6 (100.0%) | 0 (0.0%) |
| Accommodation & Food Services | 0 (0.0%) | 1 (100.0%) |
| Public Administration | 5 (62.5%) | 3 (37.5%) |
| Total | 74 (59.7%) | 50 (40.3%) |
Education in Rosemont
School Enrollment in Rosemont
The most common levels of schooling among the 57 students in Rosemont are middle school (22 | 38.6%), high school (13 | 22.8%), and college / undergraduate (11 | 19.3%).
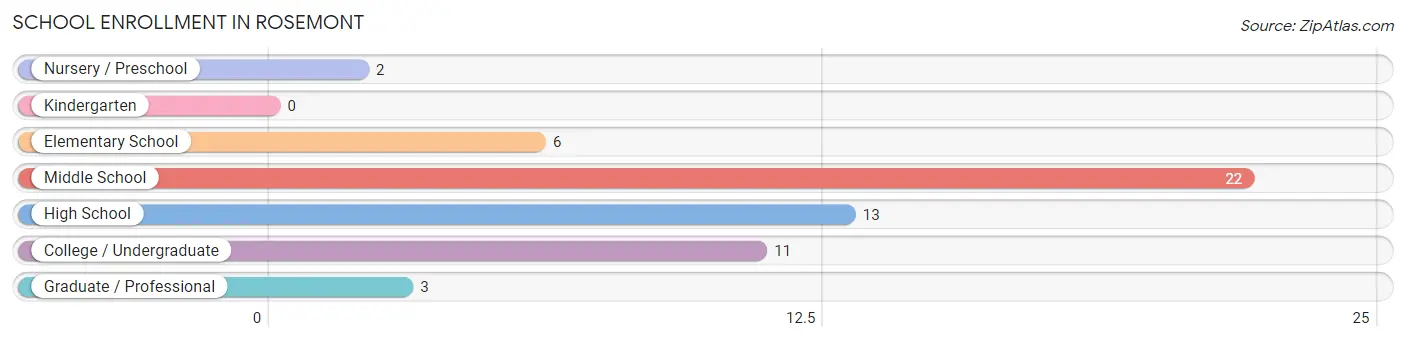
| School Level | # Students | % Students |
| Nursery / Preschool | 2 | 3.5% |
| Kindergarten | 0 | 0.0% |
| Elementary School | 6 | 10.5% |
| Middle School | 22 | 38.6% |
| High School | 13 | 22.8% |
| College / Undergraduate | 11 | 19.3% |
| Graduate / Professional | 3 | 5.3% |
| Total | 57 | 100.0% |
School Enrollment by Age by Funding Source in Rosemont
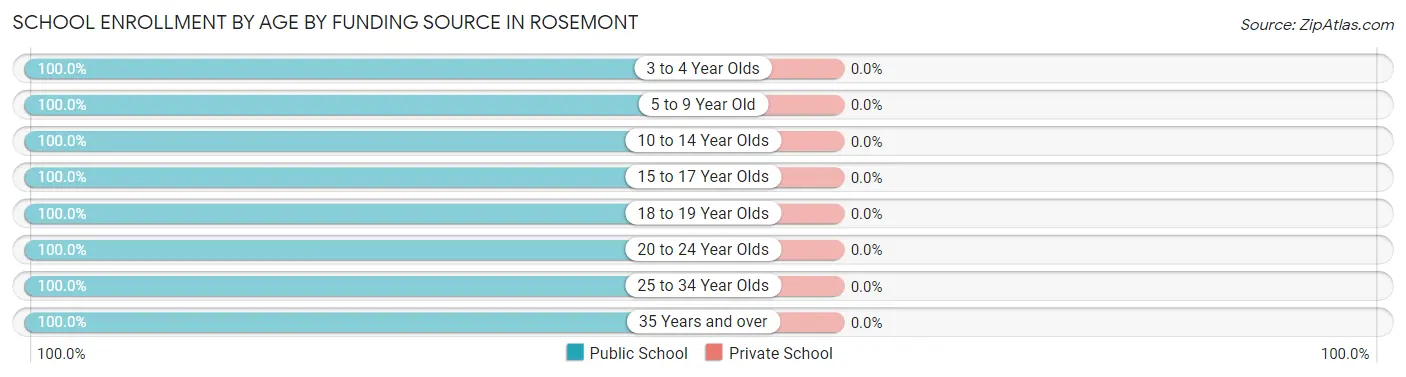
| Age Bracket | Public School | Private School |
| 3 to 4 Year Olds | 2 (100.0%) | 0 (0.0%) |
| 5 to 9 Year Old | 6 (100.0%) | 0 (0.0%) |
| 10 to 14 Year Olds | 25 (100.0%) | 0 (0.0%) |
| 15 to 17 Year Olds | 10 (100.0%) | 0 (0.0%) |
| 18 to 19 Year Olds | 5 (100.0%) | 0 (0.0%) |
| 20 to 24 Year Olds | 4 (100.0%) | 0 (0.0%) |
| 25 to 34 Year Olds | 1 (100.0%) | 0 (0.0%) |
| 35 Years and over | 4 (100.0%) | 0 (0.0%) |
| Total | 57 (100.0%) | 0 (0.0%) |
Educational Attainment by Field of Study in Rosemont
Business (29 | 33.7%), social sciences (7 | 8.1%), science & technology (7 | 8.1%), education (7 | 8.1%), and literature & languages (7 | 8.1%) are the most common fields of study among 86 individuals in Rosemont who have obtained a bachelor's degree or higher.
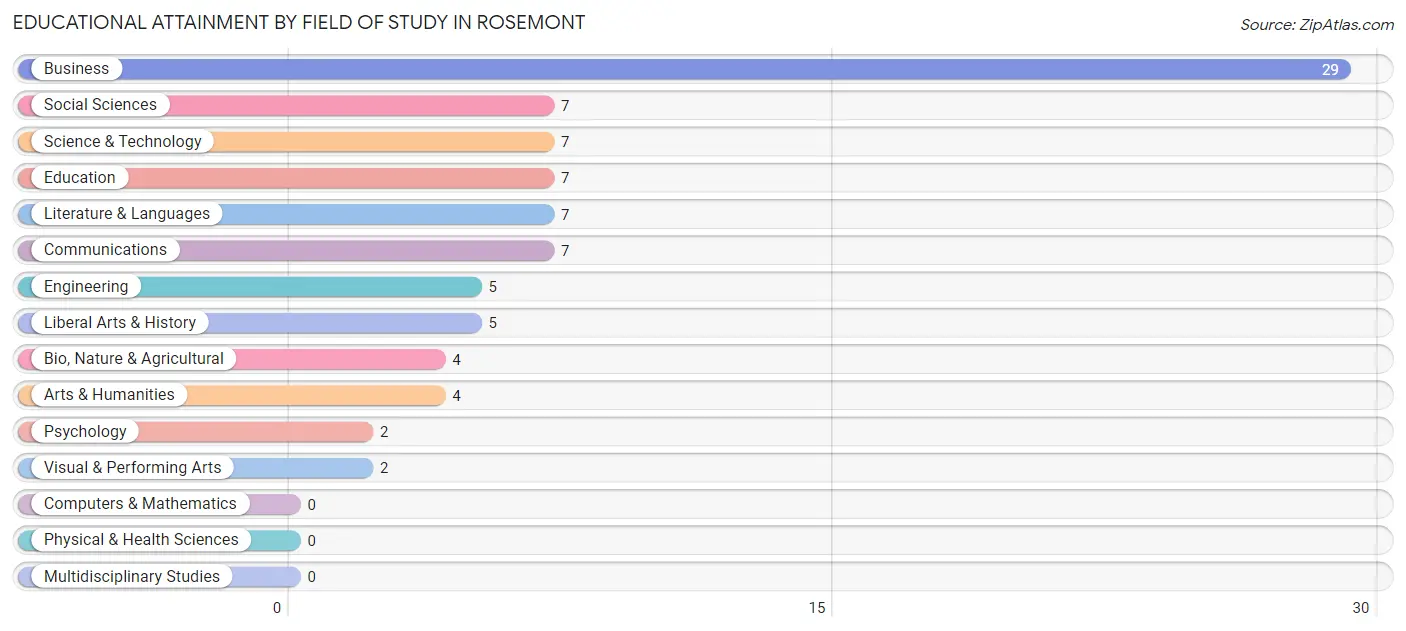
| Field of Study | # Graduates | % Graduates |
| Computers & Mathematics | 0 | 0.0% |
| Bio, Nature & Agricultural | 4 | 4.6% |
| Physical & Health Sciences | 0 | 0.0% |
| Psychology | 2 | 2.3% |
| Social Sciences | 7 | 8.1% |
| Engineering | 5 | 5.8% |
| Multidisciplinary Studies | 0 | 0.0% |
| Science & Technology | 7 | 8.1% |
| Business | 29 | 33.7% |
| Education | 7 | 8.1% |
| Literature & Languages | 7 | 8.1% |
| Liberal Arts & History | 5 | 5.8% |
| Visual & Performing Arts | 2 | 2.3% |
| Communications | 7 | 8.1% |
| Arts & Humanities | 4 | 4.6% |
| Total | 86 | 100.0% |
Transportation & Commute in Rosemont
Vehicle Availability by Sex in Rosemont
The most prevalent vehicle ownership categories in Rosemont are males with 2 vehicles (26, accounting for 35.6%) and females with 2 vehicles (17, making up 52.0%).
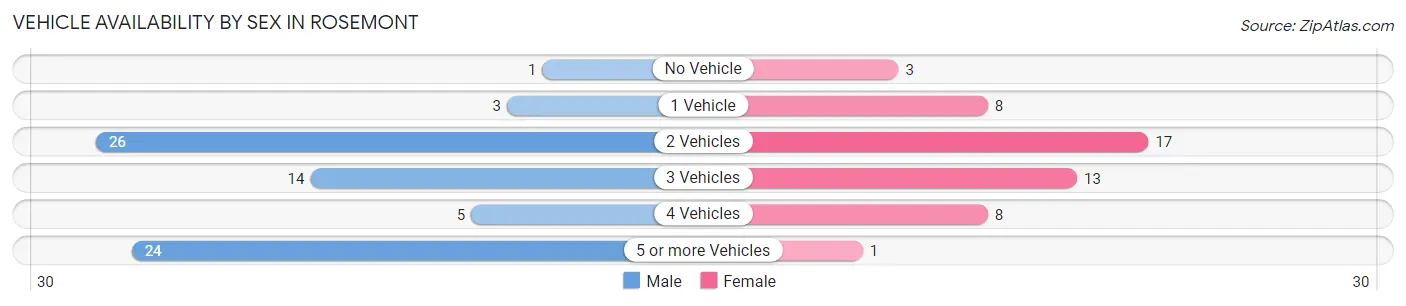
| Vehicles Available | Male | Female |
| No Vehicle | 1 (1.4%) | 3 (6.0%) |
| 1 Vehicle | 3 (4.1%) | 8 (16.0%) |
| 2 Vehicles | 26 (35.6%) | 17 (34.0%) |
| 3 Vehicles | 14 (19.2%) | 13 (26.0%) |
| 4 Vehicles | 5 (6.9%) | 8 (16.0%) |
| 5 or more Vehicles | 24 (32.9%) | 1 (2.0%) |
| Total | 73 (100.0%) | 50 (100.0%) |
Commute Time in Rosemont
The most frequently occuring commute durations in Rosemont are 20 to 24 minutes (24 commuters, 24.7%), 45 to 59 minutes (17 commuters, 17.5%), and 15 to 19 minutes (12 commuters, 12.4%).
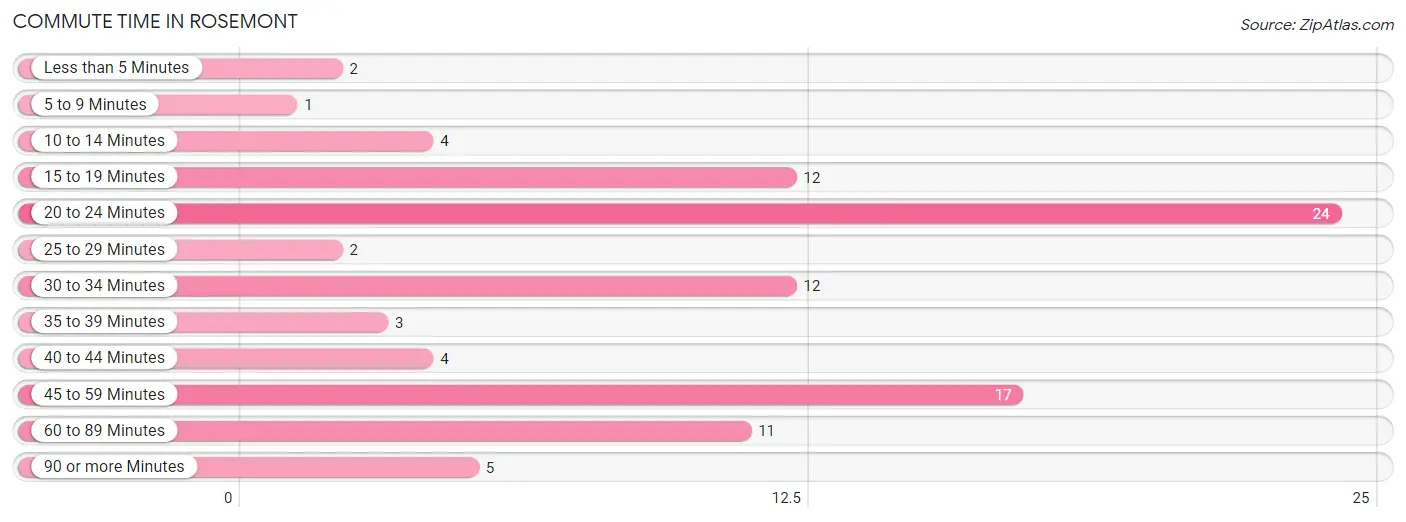
| Commute Time | # Commuters | % Commuters |
| Less than 5 Minutes | 2 | 2.1% |
| 5 to 9 Minutes | 1 | 1.0% |
| 10 to 14 Minutes | 4 | 4.1% |
| 15 to 19 Minutes | 12 | 12.4% |
| 20 to 24 Minutes | 24 | 24.7% |
| 25 to 29 Minutes | 2 | 2.1% |
| 30 to 34 Minutes | 12 | 12.4% |
| 35 to 39 Minutes | 3 | 3.1% |
| 40 to 44 Minutes | 4 | 4.1% |
| 45 to 59 Minutes | 17 | 17.5% |
| 60 to 89 Minutes | 11 | 11.3% |
| 90 or more Minutes | 5 | 5.1% |
Commute Time by Sex in Rosemont
The most common commute times in Rosemont are 20 to 24 minutes (15 commuters, 29.4%) for males and 20 to 24 minutes (9 commuters, 19.6%) for females.
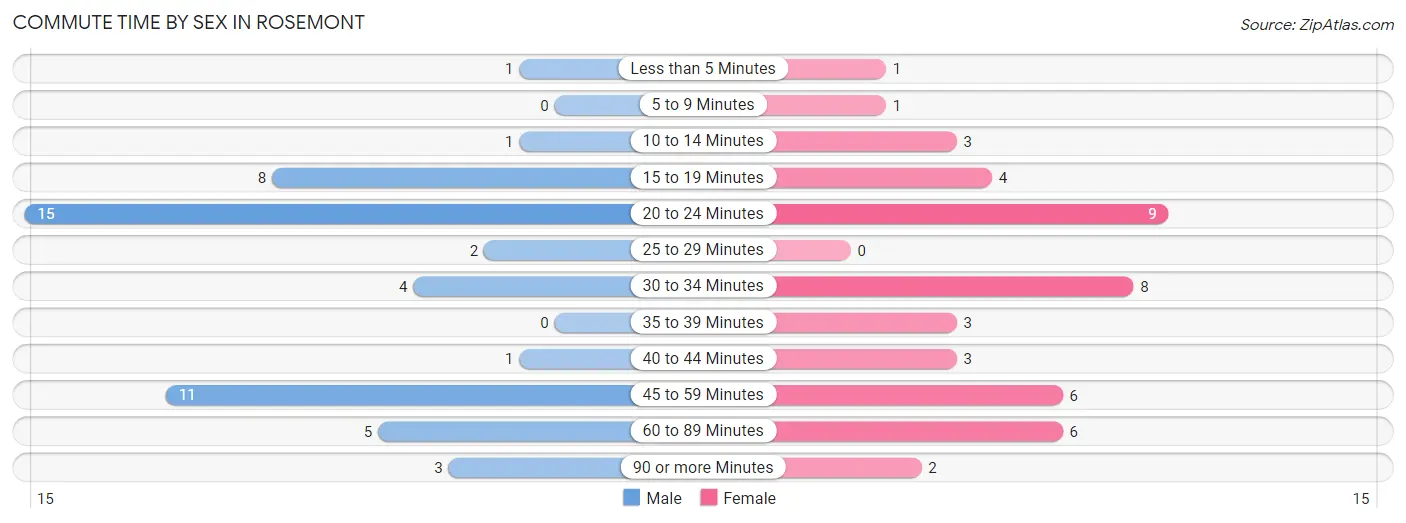
| Commute Time | Male | Female |
| Less than 5 Minutes | 1 (2.0%) | 1 (2.2%) |
| 5 to 9 Minutes | 0 (0.0%) | 1 (2.2%) |
| 10 to 14 Minutes | 1 (2.0%) | 3 (6.5%) |
| 15 to 19 Minutes | 8 (15.7%) | 4 (8.7%) |
| 20 to 24 Minutes | 15 (29.4%) | 9 (19.6%) |
| 25 to 29 Minutes | 2 (3.9%) | 0 (0.0%) |
| 30 to 34 Minutes | 4 (7.8%) | 8 (17.4%) |
| 35 to 39 Minutes | 0 (0.0%) | 3 (6.5%) |
| 40 to 44 Minutes | 1 (2.0%) | 3 (6.5%) |
| 45 to 59 Minutes | 11 (21.6%) | 6 (13.0%) |
| 60 to 89 Minutes | 5 (9.8%) | 6 (13.0%) |
| 90 or more Minutes | 3 (5.9%) | 2 (4.3%) |
Time of Departure to Work by Sex in Rosemont
The most frequent times of departure to work in Rosemont are 12:00 AM to 4:59 AM (12, 23.5%) for males and 7:00 AM to 7:29 AM (12, 26.1%) for females.
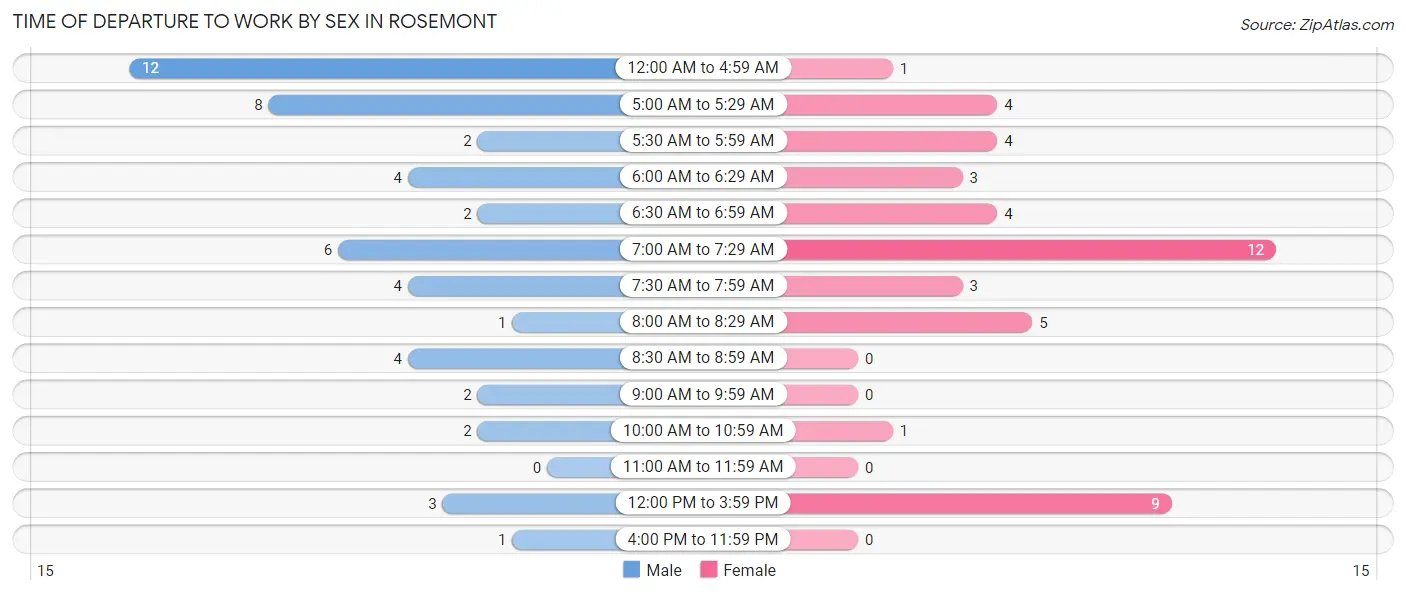
| Time of Departure | Male | Female |
| 12:00 AM to 4:59 AM | 12 (23.5%) | 1 (2.2%) |
| 5:00 AM to 5:29 AM | 8 (15.7%) | 4 (8.7%) |
| 5:30 AM to 5:59 AM | 2 (3.9%) | 4 (8.7%) |
| 6:00 AM to 6:29 AM | 4 (7.8%) | 3 (6.5%) |
| 6:30 AM to 6:59 AM | 2 (3.9%) | 4 (8.7%) |
| 7:00 AM to 7:29 AM | 6 (11.8%) | 12 (26.1%) |
| 7:30 AM to 7:59 AM | 4 (7.8%) | 3 (6.5%) |
| 8:00 AM to 8:29 AM | 1 (2.0%) | 5 (10.9%) |
| 8:30 AM to 8:59 AM | 4 (7.8%) | 0 (0.0%) |
| 9:00 AM to 9:59 AM | 2 (3.9%) | 0 (0.0%) |
| 10:00 AM to 10:59 AM | 2 (3.9%) | 1 (2.2%) |
| 11:00 AM to 11:59 AM | 0 (0.0%) | 0 (0.0%) |
| 12:00 PM to 3:59 PM | 3 (5.9%) | 9 (19.6%) |
| 4:00 PM to 11:59 PM | 1 (2.0%) | 0 (0.0%) |
| Total | 51 (100.0%) | 46 (100.0%) |
Housing Occupancy in Rosemont
Occupancy by Ownership in Rosemont
Of the total 127 dwellings in Rosemont, owner-occupied units account for 123 (96.9%), while renter-occupied units make up 4 (3.2%).
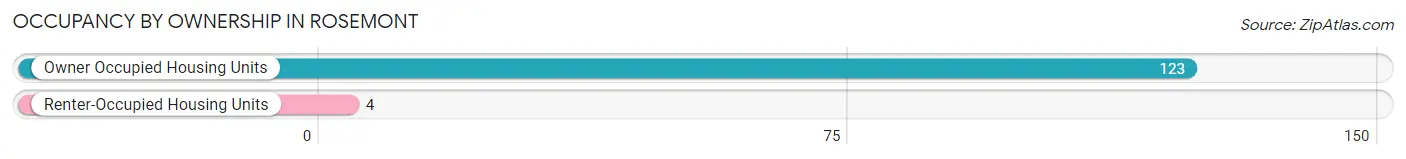
| Occupancy | # Housing Units | % Housing Units |
| Owner Occupied Housing Units | 123 | 96.9% |
| Renter-Occupied Housing Units | 4 | 3.2% |
| Total Occupied Housing Units | 127 | 100.0% |
Occupancy by Household Size in Rosemont
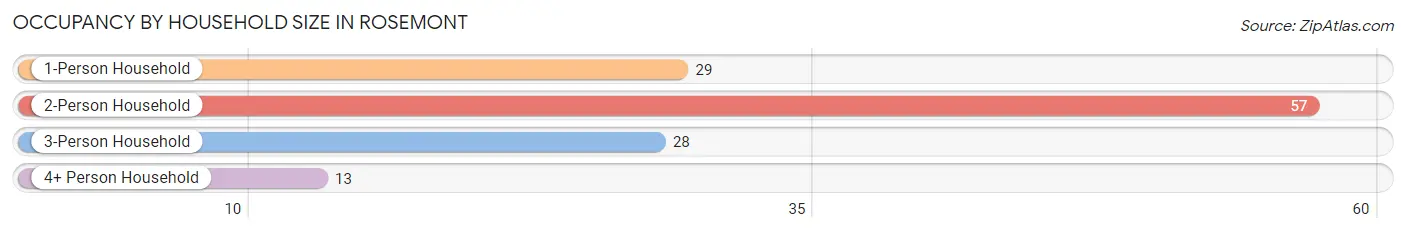
| Household Size | # Housing Units | % Housing Units |
| 1-Person Household | 29 | 22.8% |
| 2-Person Household | 57 | 44.9% |
| 3-Person Household | 28 | 22.1% |
| 4+ Person Household | 13 | 10.2% |
| Total Housing Units | 127 | 100.0% |
Occupancy by Ownership by Household Size in Rosemont
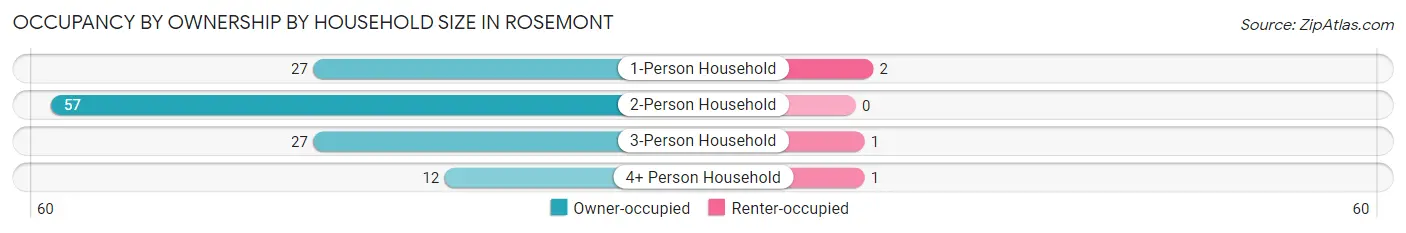
| Household Size | Owner-occupied | Renter-occupied |
| 1-Person Household | 27 (93.1%) | 2 (6.9%) |
| 2-Person Household | 57 (100.0%) | 0 (0.0%) |
| 3-Person Household | 27 (96.4%) | 1 (3.6%) |
| 4+ Person Household | 12 (92.3%) | 1 (7.7%) |
| Total Housing Units | 123 (96.9%) | 4 (3.2%) |
Occupancy by Educational Attainment in Rosemont
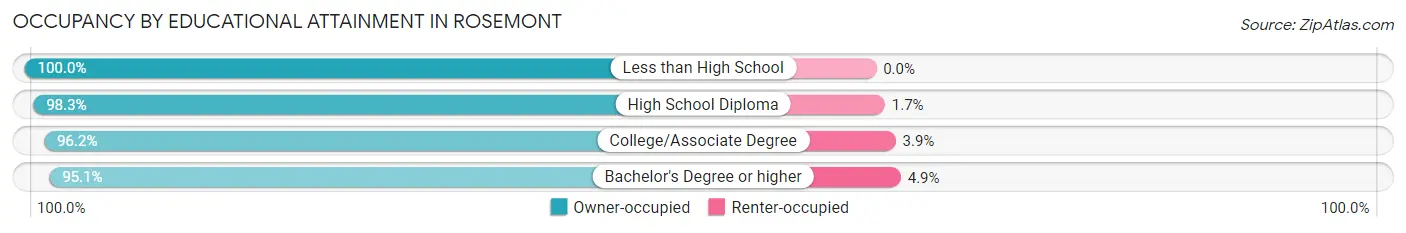
| Household Size | Owner-occupied | Renter-occupied |
| Less than High School | 2 (100.0%) | 0 (0.0%) |
| High School Diploma | 57 (98.3%) | 1 (1.7%) |
| College/Associate Degree | 25 (96.2%) | 1 (3.8%) |
| Bachelor's Degree or higher | 39 (95.1%) | 2 (4.9%) |
Occupancy by Age of Householder in Rosemont
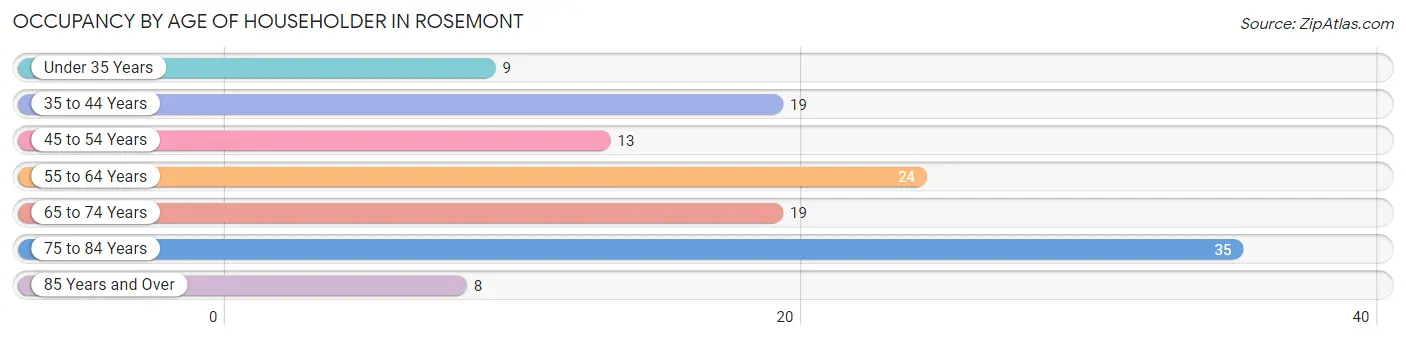
| Age Bracket | # Households | % Households |
| Under 35 Years | 9 | 7.1% |
| 35 to 44 Years | 19 | 15.0% |
| 45 to 54 Years | 13 | 10.2% |
| 55 to 64 Years | 24 | 18.9% |
| 65 to 74 Years | 19 | 15.0% |
| 75 to 84 Years | 35 | 27.6% |
| 85 Years and Over | 8 | 6.3% |
| Total | 127 | 100.0% |
Housing Finances in Rosemont
Median Income by Occupancy in Rosemont
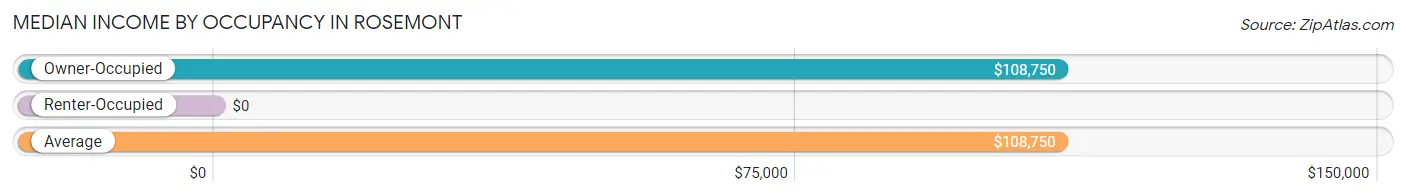
| Occupancy Type | # Households | Median Income |
| Owner-Occupied | 123 (96.9%) | $108,750 |
| Renter-Occupied | 4 (3.2%) | $0 |
| Average | 127 (100.0%) | $108,750 |
Occupancy by Householder Income Bracket in Rosemont
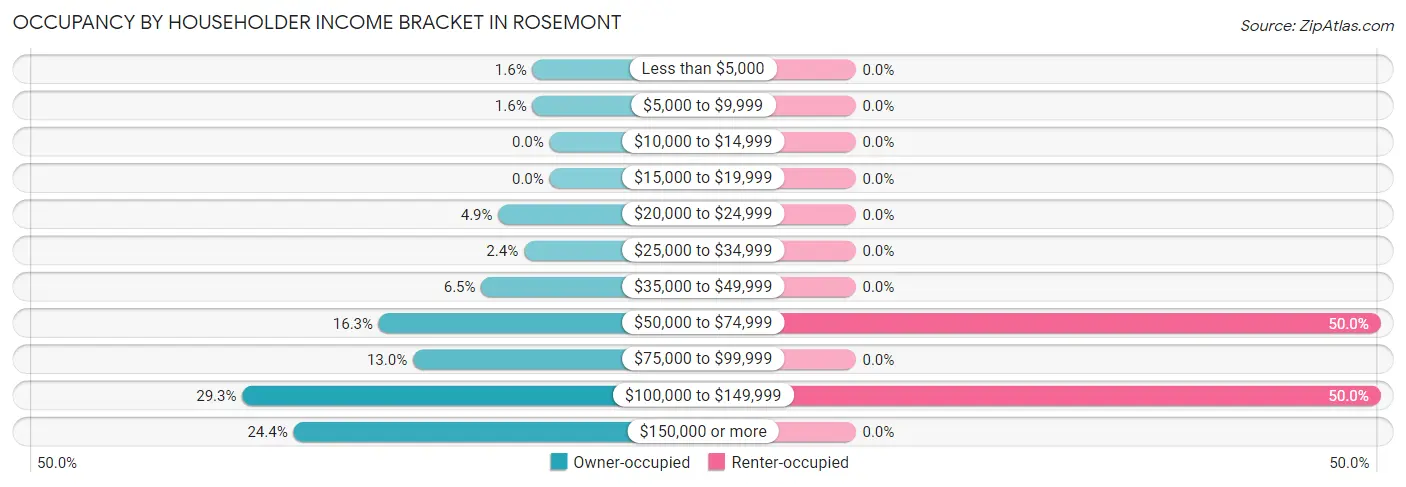
| Income Bracket | Owner-occupied | Renter-occupied |
| Less than $5,000 | 2 (1.6%) | 0 (0.0%) |
| $5,000 to $9,999 | 2 (1.6%) | 0 (0.0%) |
| $10,000 to $14,999 | 0 (0.0%) | 0 (0.0%) |
| $15,000 to $19,999 | 0 (0.0%) | 0 (0.0%) |
| $20,000 to $24,999 | 6 (4.9%) | 0 (0.0%) |
| $25,000 to $34,999 | 3 (2.4%) | 0 (0.0%) |
| $35,000 to $49,999 | 8 (6.5%) | 0 (0.0%) |
| $50,000 to $74,999 | 20 (16.3%) | 2 (50.0%) |
| $75,000 to $99,999 | 16 (13.0%) | 0 (0.0%) |
| $100,000 to $149,999 | 36 (29.3%) | 2 (50.0%) |
| $150,000 or more | 30 (24.4%) | 0 (0.0%) |
| Total | 123 (100.0%) | 4 (100.0%) |
Monthly Housing Cost Tiers in Rosemont
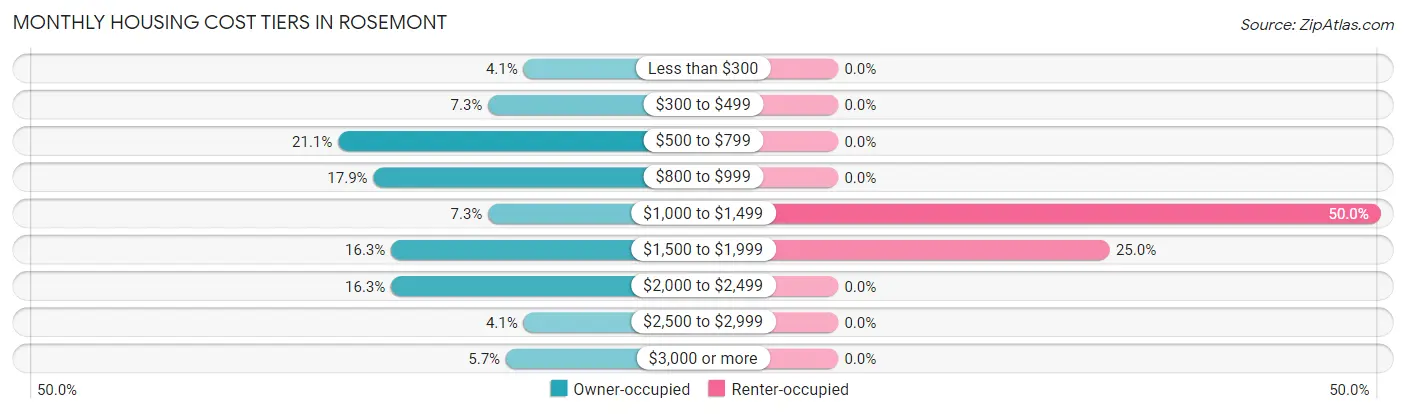
| Monthly Cost | Owner-occupied | Renter-occupied |
| Less than $300 | 5 (4.1%) | 0 (0.0%) |
| $300 to $499 | 9 (7.3%) | 0 (0.0%) |
| $500 to $799 | 26 (21.1%) | 0 (0.0%) |
| $800 to $999 | 22 (17.9%) | 0 (0.0%) |
| $1,000 to $1,499 | 9 (7.3%) | 2 (50.0%) |
| $1,500 to $1,999 | 20 (16.3%) | 1 (25.0%) |
| $2,000 to $2,499 | 20 (16.3%) | 0 (0.0%) |
| $2,500 to $2,999 | 5 (4.1%) | 0 (0.0%) |
| $3,000 or more | 7 (5.7%) | 0 (0.0%) |
| Total | 123 (100.0%) | 4 (100.0%) |
Physical Housing Characteristics in Rosemont
Housing Structures in Rosemont
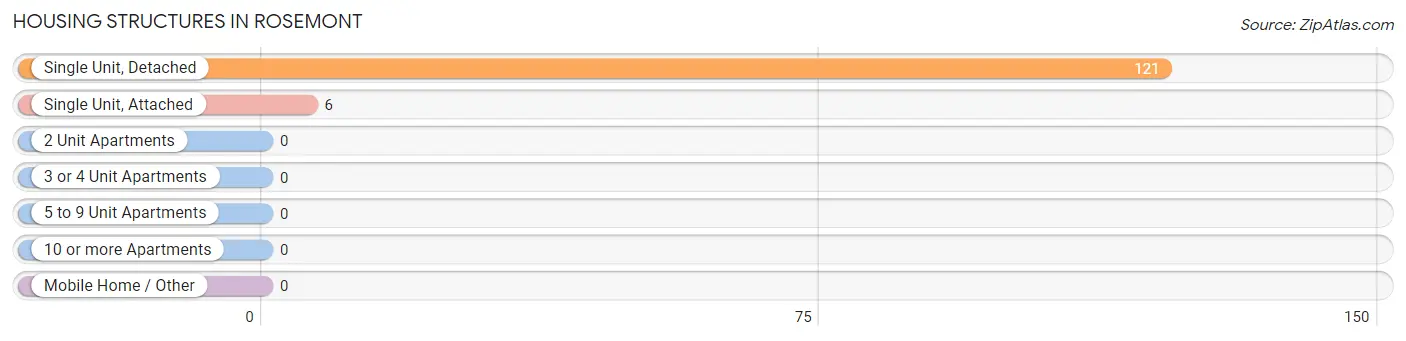
| Structure Type | # Housing Units | % Housing Units |
| Single Unit, Detached | 121 | 95.3% |
| Single Unit, Attached | 6 | 4.7% |
| 2 Unit Apartments | 0 | 0.0% |
| 3 or 4 Unit Apartments | 0 | 0.0% |
| 5 to 9 Unit Apartments | 0 | 0.0% |
| 10 or more Apartments | 0 | 0.0% |
| Mobile Home / Other | 0 | 0.0% |
| Total | 127 | 100.0% |
Housing Structures by Occupancy in Rosemont
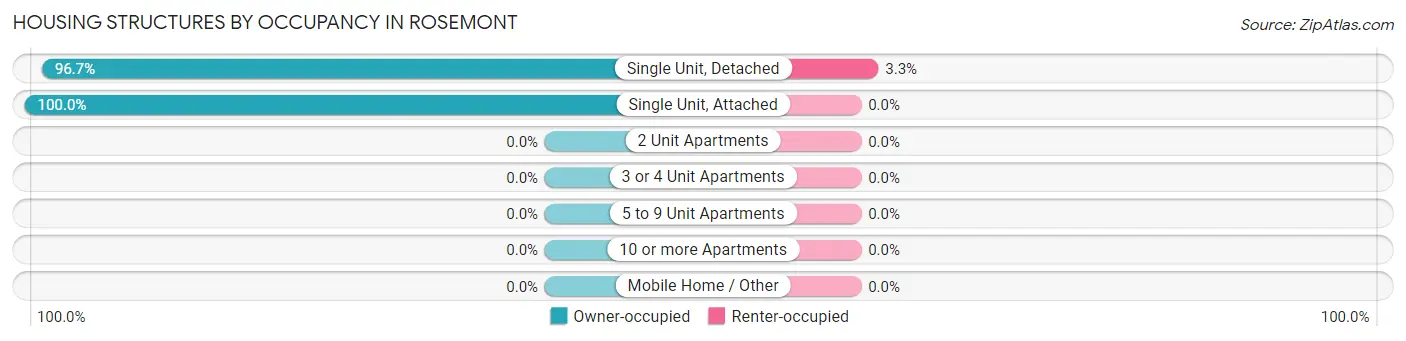
| Structure Type | Owner-occupied | Renter-occupied |
| Single Unit, Detached | 117 (96.7%) | 4 (3.3%) |
| Single Unit, Attached | 6 (100.0%) | 0 (0.0%) |
| 2 Unit Apartments | 0 (0.0%) | 0 (0.0%) |
| 3 or 4 Unit Apartments | 0 (0.0%) | 0 (0.0%) |
| 5 to 9 Unit Apartments | 0 (0.0%) | 0 (0.0%) |
| 10 or more Apartments | 0 (0.0%) | 0 (0.0%) |
| Mobile Home / Other | 0 (0.0%) | 0 (0.0%) |
| Total | 123 (96.9%) | 4 (3.2%) |
Housing Structures by Number of Rooms in Rosemont
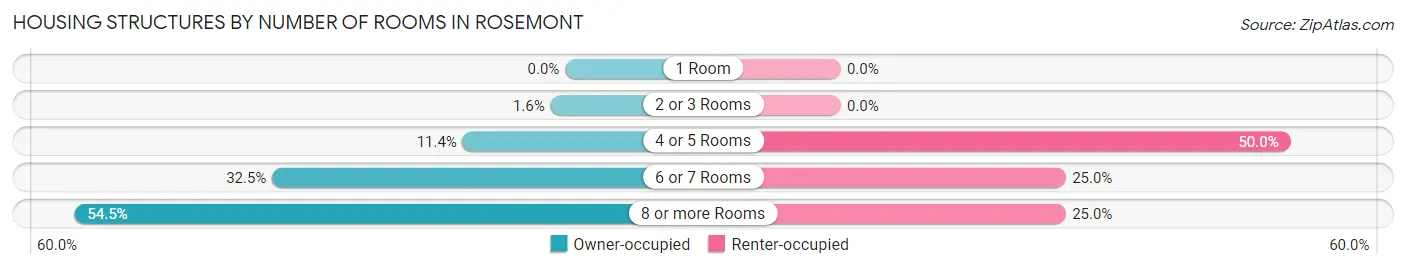
| Number of Rooms | Owner-occupied | Renter-occupied |
| 1 Room | 0 (0.0%) | 0 (0.0%) |
| 2 or 3 Rooms | 2 (1.6%) | 0 (0.0%) |
| 4 or 5 Rooms | 14 (11.4%) | 2 (50.0%) |
| 6 or 7 Rooms | 40 (32.5%) | 1 (25.0%) |
| 8 or more Rooms | 67 (54.5%) | 1 (25.0%) |
| Total | 123 (100.0%) | 4 (100.0%) |
Housing Structure by Heating Type in Rosemont
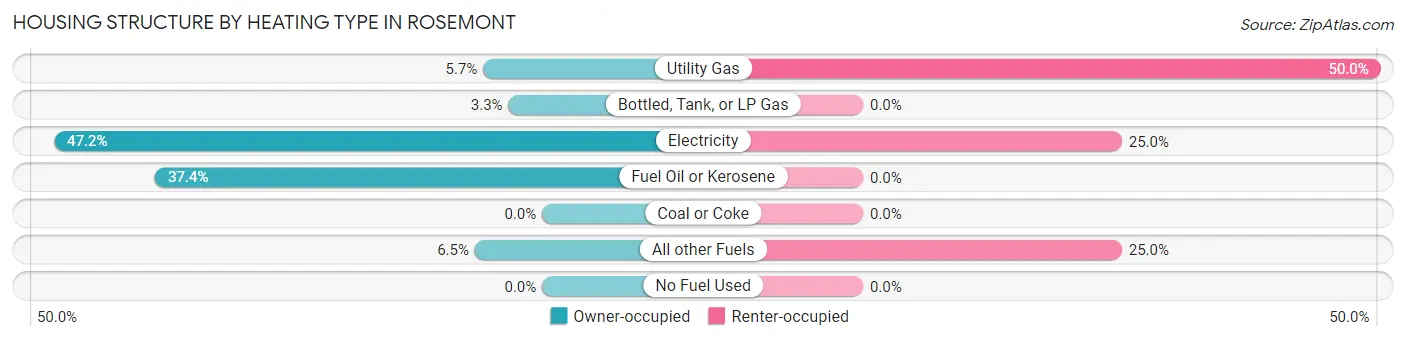
| Heating Type | Owner-occupied | Renter-occupied |
| Utility Gas | 7 (5.7%) | 2 (50.0%) |
| Bottled, Tank, or LP Gas | 4 (3.3%) | 0 (0.0%) |
| Electricity | 58 (47.1%) | 1 (25.0%) |
| Fuel Oil or Kerosene | 46 (37.4%) | 0 (0.0%) |
| Coal or Coke | 0 (0.0%) | 0 (0.0%) |
| All other Fuels | 8 (6.5%) | 1 (25.0%) |
| No Fuel Used | 0 (0.0%) | 0 (0.0%) |
| Total | 123 (100.0%) | 4 (100.0%) |
Household Vehicle Usage in Rosemont
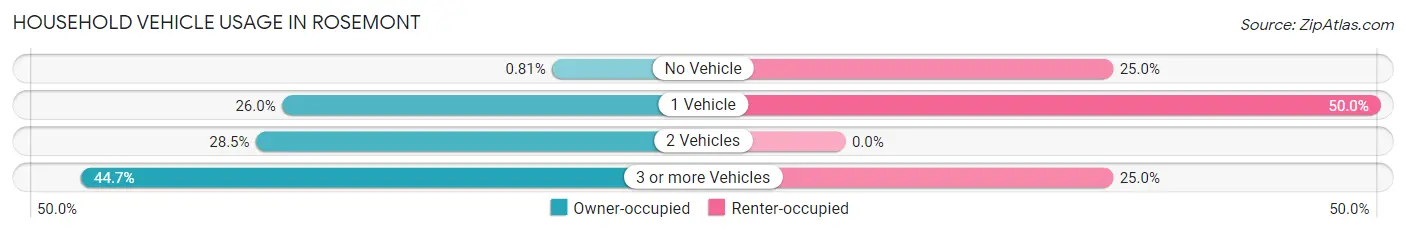
| Vehicles per Household | Owner-occupied | Renter-occupied |
| No Vehicle | 1 (0.8%) | 1 (25.0%) |
| 1 Vehicle | 32 (26.0%) | 2 (50.0%) |
| 2 Vehicles | 35 (28.5%) | 0 (0.0%) |
| 3 or more Vehicles | 55 (44.7%) | 1 (25.0%) |
| Total | 123 (100.0%) | 4 (100.0%) |
Real Estate & Mortgages in Rosemont
Real Estate and Mortgage Overview in Rosemont
| Characteristic | Without Mortgage | With Mortgage |
| Housing Units | 56 | 67 |
| Median Property Value | $433,300 | $370,700 |
| Median Household Income | $93,750 | $23 |
| Monthly Housing Costs | $732 | $7 |
| Real Estate Taxes | $4,125 | $2 |
Property Value by Mortgage Status in Rosemont
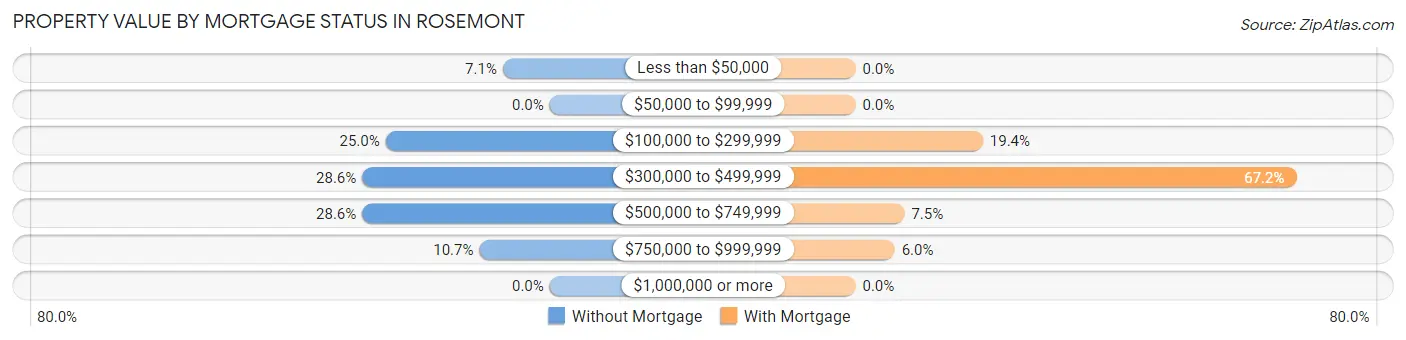
| Property Value | Without Mortgage | With Mortgage |
| Less than $50,000 | 4 (7.1%) | 0 (0.0%) |
| $50,000 to $99,999 | 0 (0.0%) | 0 (0.0%) |
| $100,000 to $299,999 | 14 (25.0%) | 13 (19.4%) |
| $300,000 to $499,999 | 16 (28.6%) | 45 (67.2%) |
| $500,000 to $749,999 | 16 (28.6%) | 5 (7.5%) |
| $750,000 to $999,999 | 6 (10.7%) | 4 (6.0%) |
| $1,000,000 or more | 0 (0.0%) | 0 (0.0%) |
| Total | 56 (100.0%) | 67 (100.0%) |
Household Income by Mortgage Status in Rosemont
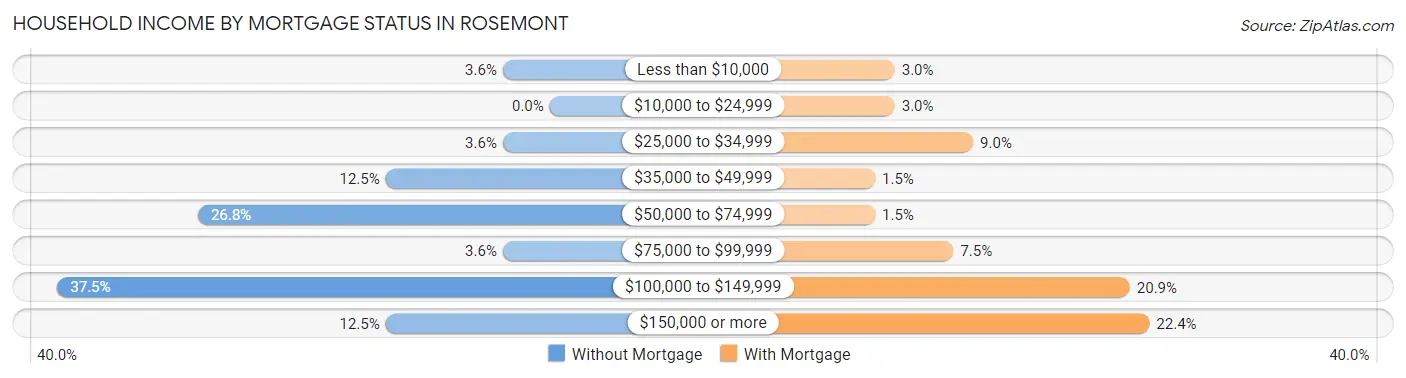
| Household Income | Without Mortgage | With Mortgage |
| Less than $10,000 | 2 (3.6%) | 2 (3.0%) |
| $10,000 to $24,999 | 0 (0.0%) | 2 (3.0%) |
| $25,000 to $34,999 | 2 (3.6%) | 6 (9.0%) |
| $35,000 to $49,999 | 7 (12.5%) | 1 (1.5%) |
| $50,000 to $74,999 | 15 (26.8%) | 1 (1.5%) |
| $75,000 to $99,999 | 2 (3.6%) | 5 (7.5%) |
| $100,000 to $149,999 | 21 (37.5%) | 14 (20.9%) |
| $150,000 or more | 7 (12.5%) | 15 (22.4%) |
| Total | 56 (100.0%) | 67 (100.0%) |
Property Value to Household Income Ratio in Rosemont
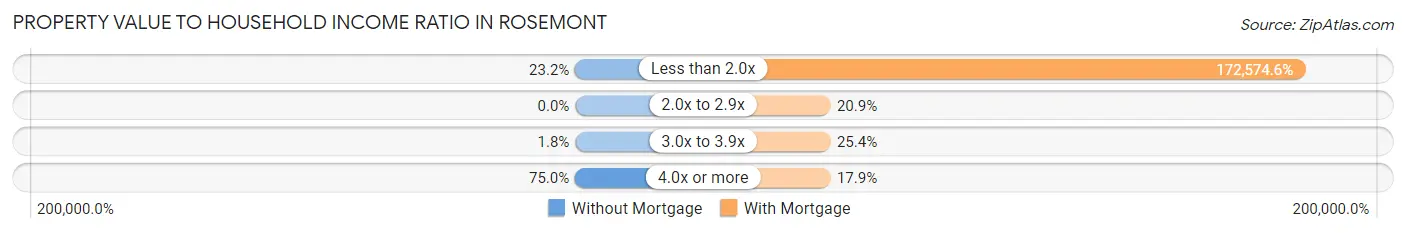
| Value-to-Income Ratio | Without Mortgage | With Mortgage |
| Less than 2.0x | 13 (23.2%) | 115,625 (172,574.6%) |
| 2.0x to 2.9x | 0 (0.0%) | 14 (20.9%) |
| 3.0x to 3.9x | 1 (1.8%) | 17 (25.4%) |
| 4.0x or more | 42 (75.0%) | 12 (17.9%) |
| Total | 56 (100.0%) | 67 (100.0%) |
Real Estate Taxes by Mortgage Status in Rosemont
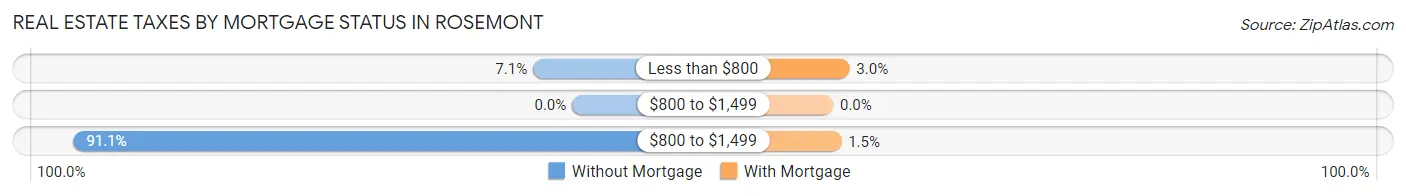
| Property Taxes | Without Mortgage | With Mortgage |
| Less than $800 | 4 (7.1%) | 2 (3.0%) |
| $800 to $1,499 | 0 (0.0%) | 0 (0.0%) |
| $800 to $1,499 | 51 (91.1%) | 1 (1.5%) |
| Total | 56 (100.0%) | 67 (100.0%) |
Health & Disability in Rosemont
Health Insurance Coverage by Age in Rosemont
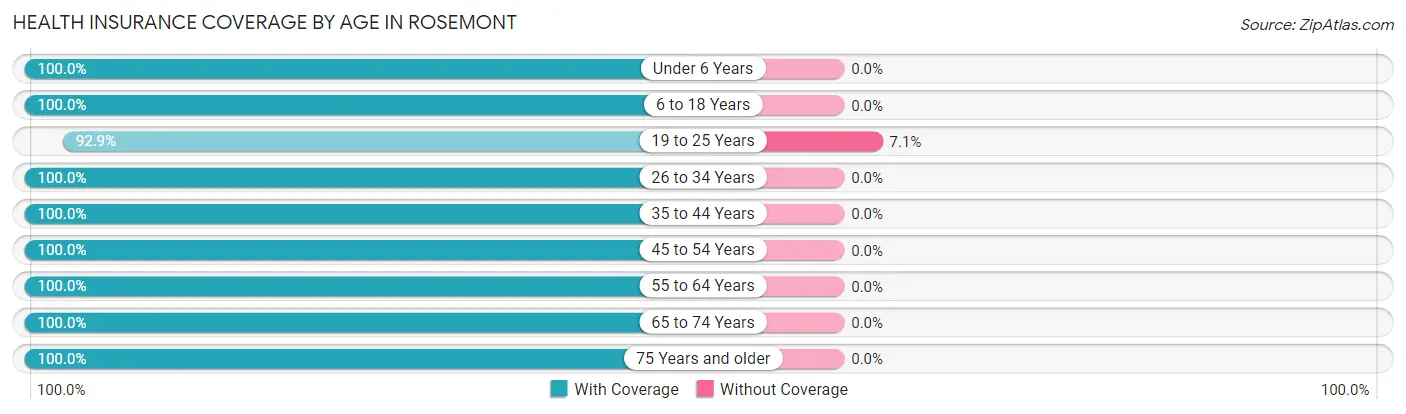
| Age Bracket | With Coverage | Without Coverage |
| Under 6 Years | 6 (100.0%) | 0 (0.0%) |
| 6 to 18 Years | 46 (100.0%) | 0 (0.0%) |
| 19 to 25 Years | 13 (92.9%) | 1 (7.1%) |
| 26 to 34 Years | 10 (100.0%) | 0 (0.0%) |
| 35 to 44 Years | 28 (100.0%) | 0 (0.0%) |
| 45 to 54 Years | 40 (100.0%) | 0 (0.0%) |
| 55 to 64 Years | 39 (100.0%) | 0 (0.0%) |
| 65 to 74 Years | 47 (100.0%) | 0 (0.0%) |
| 75 Years and older | 68 (100.0%) | 0 (0.0%) |
| Total | 297 (99.7%) | 1 (0.3%) |
Health Insurance Coverage by Citizenship Status in Rosemont
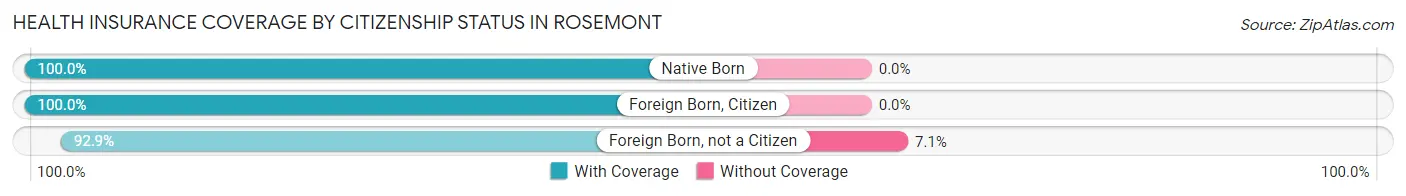
| Citizenship Status | With Coverage | Without Coverage |
| Native Born | 6 (100.0%) | 0 (0.0%) |
| Foreign Born, Citizen | 46 (100.0%) | 0 (0.0%) |
| Foreign Born, not a Citizen | 13 (92.9%) | 1 (7.1%) |
Health Insurance Coverage by Household Income in Rosemont
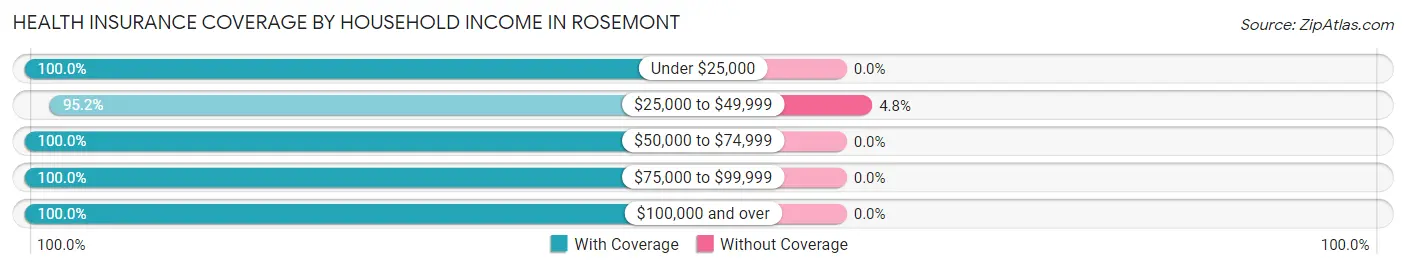
| Household Income | With Coverage | Without Coverage |
| Under $25,000 | 14 (100.0%) | 0 (0.0%) |
| $25,000 to $49,999 | 20 (95.2%) | 1 (4.8%) |
| $50,000 to $74,999 | 43 (100.0%) | 0 (0.0%) |
| $75,000 to $99,999 | 32 (100.0%) | 0 (0.0%) |
| $100,000 and over | 188 (100.0%) | 0 (0.0%) |
Public vs Private Health Insurance Coverage by Age in Rosemont
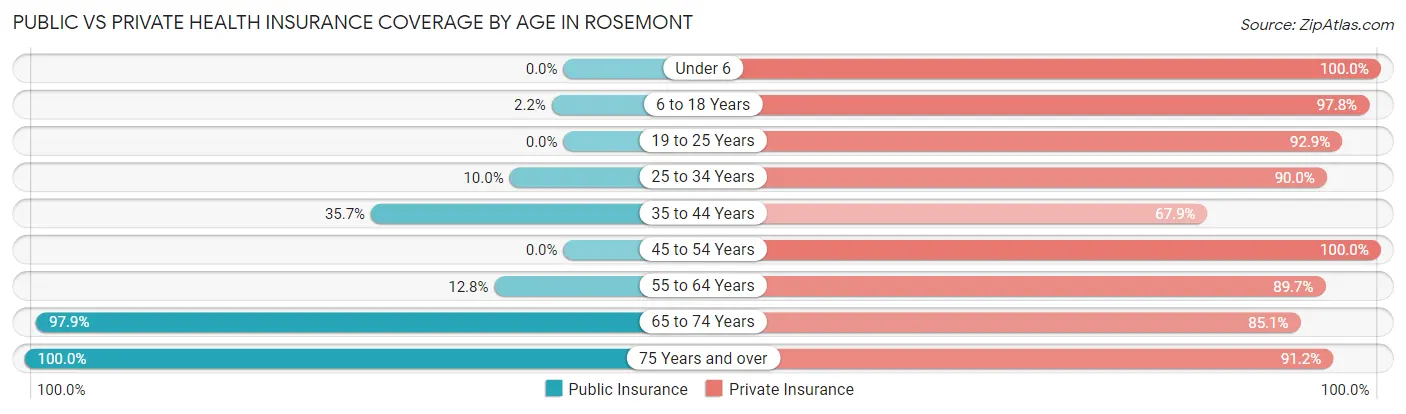
| Age Bracket | Public Insurance | Private Insurance |
| Under 6 | 0 (0.0%) | 6 (100.0%) |
| 6 to 18 Years | 1 (2.2%) | 45 (97.8%) |
| 19 to 25 Years | 0 (0.0%) | 13 (92.9%) |
| 25 to 34 Years | 1 (10.0%) | 9 (90.0%) |
| 35 to 44 Years | 10 (35.7%) | 19 (67.9%) |
| 45 to 54 Years | 0 (0.0%) | 40 (100.0%) |
| 55 to 64 Years | 5 (12.8%) | 35 (89.7%) |
| 65 to 74 Years | 46 (97.9%) | 40 (85.1%) |
| 75 Years and over | 68 (100.0%) | 62 (91.2%) |
| Total | 131 (44.0%) | 269 (90.3%) |
Disability Status by Sex by Age in Rosemont
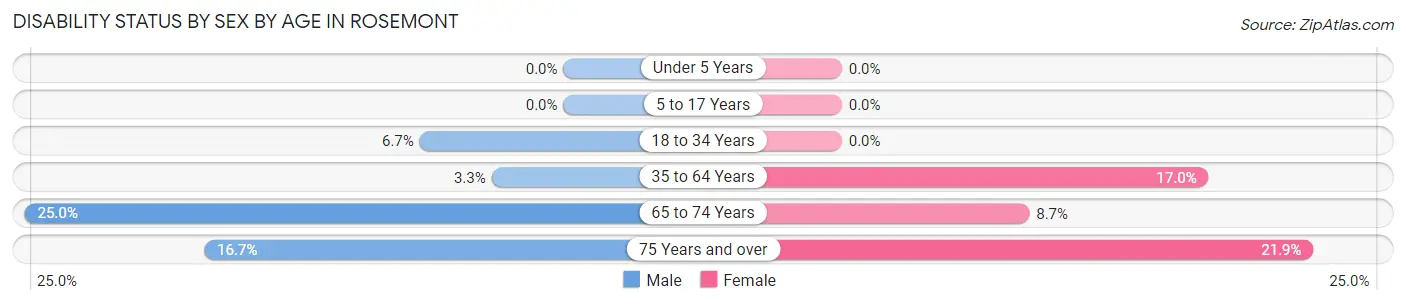
| Age Bracket | Male | Female |
| Under 5 Years | 0 (0.0%) | 0 (0.0%) |
| 5 to 17 Years | 0 (0.0%) | 0 (0.0%) |
| 18 to 34 Years | 1 (6.7%) | 0 (0.0%) |
| 35 to 64 Years | 2 (3.3%) | 8 (17.0%) |
| 65 to 74 Years | 6 (25.0%) | 2 (8.7%) |
| 75 Years and over | 6 (16.7%) | 7 (21.9%) |
Disability Class by Sex by Age in Rosemont
Disability Class: Hearing Difficulty

| Age Bracket | Male | Female |
| Under 5 Years | 0 (0.0%) | 0 (0.0%) |
| 5 to 17 Years | 0 (0.0%) | 0 (0.0%) |
| 18 to 34 Years | 0 (0.0%) | 0 (0.0%) |
| 35 to 64 Years | 1 (1.7%) | 0 (0.0%) |
| 65 to 74 Years | 4 (16.7%) | 0 (0.0%) |
| 75 Years and over | 6 (16.7%) | 2 (6.2%) |
Disability Class: Vision Difficulty
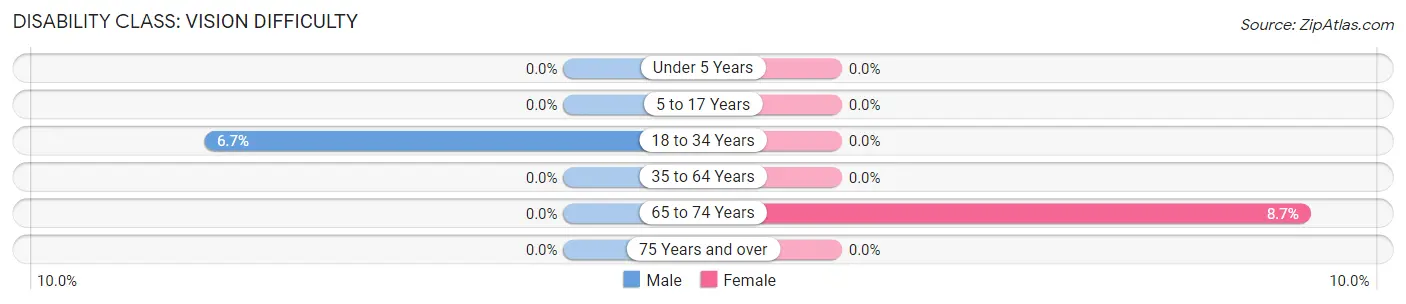
| Age Bracket | Male | Female |
| Under 5 Years | 0 (0.0%) | 0 (0.0%) |
| 5 to 17 Years | 0 (0.0%) | 0 (0.0%) |
| 18 to 34 Years | 1 (6.7%) | 0 (0.0%) |
| 35 to 64 Years | 0 (0.0%) | 0 (0.0%) |
| 65 to 74 Years | 0 (0.0%) | 2 (8.7%) |
| 75 Years and over | 0 (0.0%) | 0 (0.0%) |
Disability Class: Cognitive Difficulty
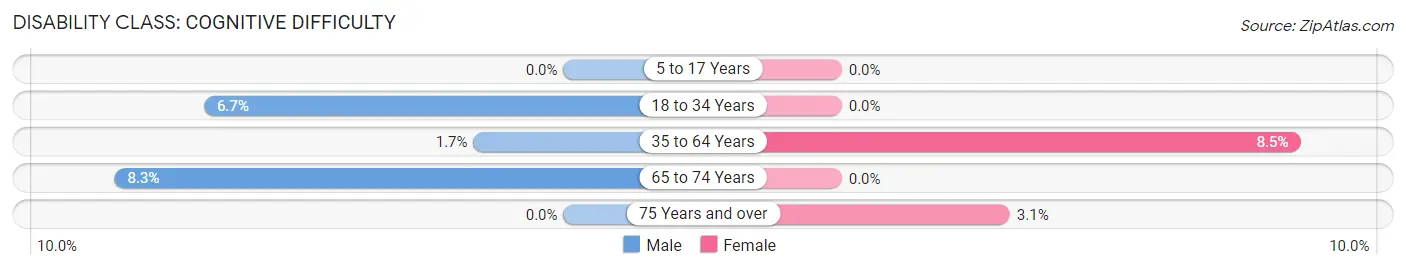
| Age Bracket | Male | Female |
| 5 to 17 Years | 0 (0.0%) | 0 (0.0%) |
| 18 to 34 Years | 1 (6.7%) | 0 (0.0%) |
| 35 to 64 Years | 1 (1.7%) | 4 (8.5%) |
| 65 to 74 Years | 2 (8.3%) | 0 (0.0%) |
| 75 Years and over | 0 (0.0%) | 1 (3.1%) |
Disability Class: Ambulatory Difficulty
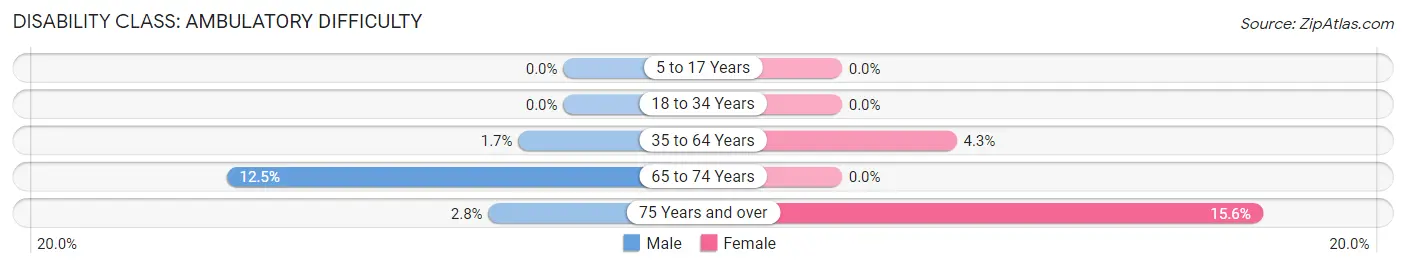
| Age Bracket | Male | Female |
| 5 to 17 Years | 0 (0.0%) | 0 (0.0%) |
| 18 to 34 Years | 0 (0.0%) | 0 (0.0%) |
| 35 to 64 Years | 1 (1.7%) | 2 (4.3%) |
| 65 to 74 Years | 3 (12.5%) | 0 (0.0%) |
| 75 Years and over | 1 (2.8%) | 5 (15.6%) |
Disability Class: Self-Care Difficulty
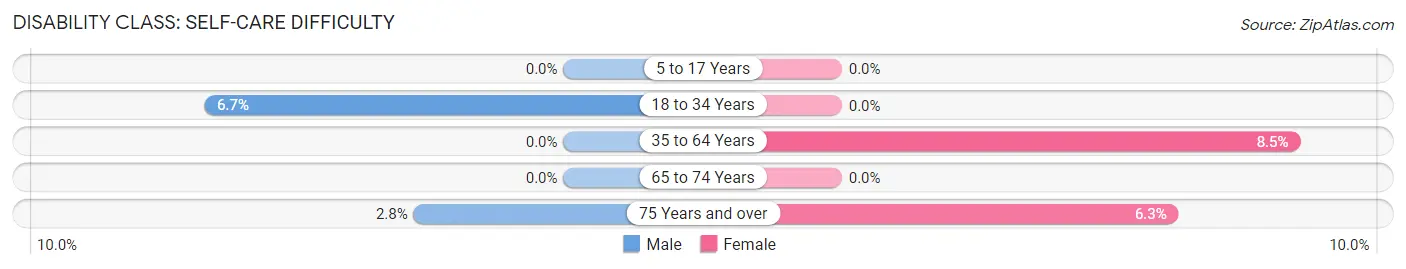
| Age Bracket | Male | Female |
| 5 to 17 Years | 0 (0.0%) | 0 (0.0%) |
| 18 to 34 Years | 1 (6.7%) | 0 (0.0%) |
| 35 to 64 Years | 0 (0.0%) | 4 (8.5%) |
| 65 to 74 Years | 0 (0.0%) | 0 (0.0%) |
| 75 Years and over | 1 (2.8%) | 2 (6.2%) |
Technology Access in Rosemont
Computing Device Access in Rosemont
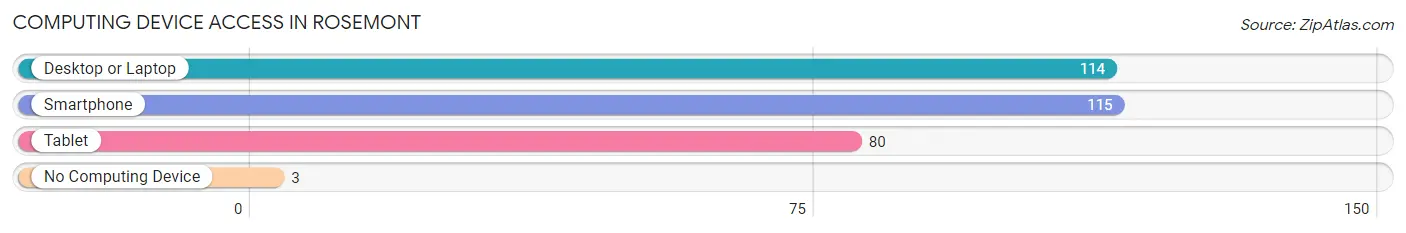
| Device Type | # Households | % Households |
| Desktop or Laptop | 114 | 89.8% |
| Smartphone | 115 | 90.5% |
| Tablet | 80 | 63.0% |
| No Computing Device | 3 | 2.4% |
| Total | 127 | 100.0% |
Internet Access in Rosemont
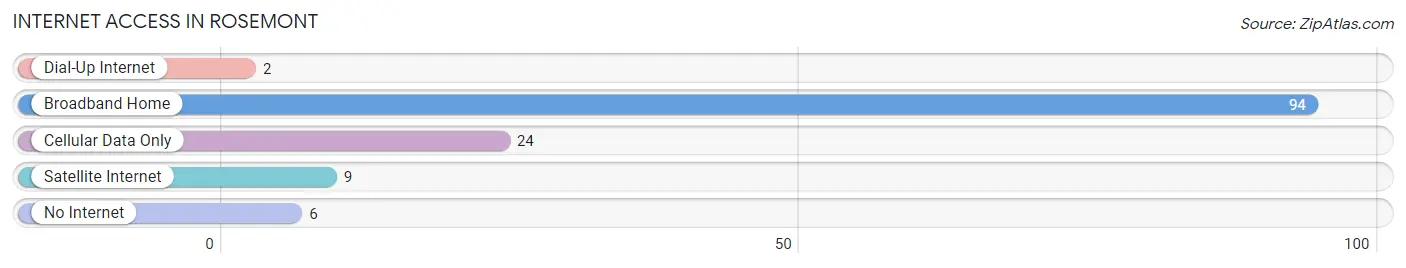
| Internet Type | # Households | % Households |
| Dial-Up Internet | 2 | 1.6% |
| Broadband Home | 94 | 74.0% |
| Cellular Data Only | 24 | 18.9% |
| Satellite Internet | 9 | 7.1% |
| No Internet | 6 | 4.7% |
| Total | 127 | 100.0% |
Rosemont Summary
Rosemont is a small unincorporated community located in Montgomery County, Maryland. It is situated in the northern part of the county, just south of the Potomac River. The community is bordered by the towns of Poolesville and Dickerson to the north, and the city of Gaithersburg to the south. Rosemont is part of the Washington Metropolitan Area and is located approximately 25 miles northwest of Washington, D.C.
History
The area that is now Rosemont was first settled in the late 1700s by a group of German immigrants. The community was originally known as “Rosemont” after the rose bushes that grew in the area. The name was officially adopted in 1883 when the post office was established.
In the early 1900s, Rosemont was a thriving agricultural community. The area was known for its dairy farms and orchards. The community also had a number of small businesses, including a general store, a blacksmith shop, and a grist mill.
In the 1950s, the area began to experience rapid growth as the Washington Metropolitan Area expanded. The population of Rosemont increased from just over 500 in 1950 to over 1,000 by 1960.
Geography
Rosemont is located in the northern part of Montgomery County, Maryland. It is situated in the Piedmont region of the state, which is characterized by rolling hills and valleys. The community is bordered by the towns of Poolesville and Dickerson to the north, and the city of Gaithersburg to the south.
The climate in Rosemont is typical of the Mid-Atlantic region, with hot, humid summers and cold, wet winters. The average annual temperature is around 55 degrees Fahrenheit.
Economy
The economy of Rosemont is largely based on agriculture and tourism. The area is home to several farms, including dairy farms, orchards, and vegetable farms. The community also has a number of small businesses, including restaurants, retail stores, and professional services.
The area is also a popular tourist destination. Rosemont is home to several historic sites, including the Rosemont Manor House, which was built in the late 1700s. The community also has several parks and recreational areas, including the Rosemont Nature Preserve.
Demographics
As of the 2010 census, the population of Rosemont was 1,845. The racial makeup of the community was 79.3% White, 11.2% African American, 4.2% Asian, and 5.3% Hispanic or Latino. The median household income was $90,945, and the median home value was $521,000.
Rosemont is a small, close-knit community with a strong sense of community. The area is home to several churches, including the Rosemont United Methodist Church and the Rosemont Presbyterian Church. The community also has a number of civic organizations, including the Rosemont Civic Association and the Rosemont Historical Society.
Common Questions
What is Per Capita Income in Rosemont?
Per Capita income in Rosemont is $47,170.
What is the Median Family Income in Rosemont?
Median Family Income in Rosemont is $112,679.
What is the Median Household income in Rosemont?
Median Household Income in Rosemont is $108,750.
What is Income or Wage Gap in Rosemont?
Income or Wage Gap in Rosemont is 19.2%.
Women in Rosemont earn 80.8 cents for every dollar earned by a man.
What is Inequality or Gini Index in Rosemont?
Inequality or Gini Index in Rosemont is 0.31.
What is the Total Population of Rosemont?
Total Population of Rosemont is 298.
What is the Total Male Population of Rosemont?
Total Male Population of Rosemont is 166.
What is the Total Female Population of Rosemont?
Total Female Population of Rosemont is 132.
What is the Ratio of Males per 100 Females in Rosemont?
There are 125.76 Males per 100 Females in Rosemont.
What is the Ratio of Females per 100 Males in Rosemont?
There are 79.52 Females per 100 Males in Rosemont.
What is the Median Population Age in Rosemont?
Median Population Age in Rosemont is 57.2 Years.
What is the Average Family Size in Rosemont
Average Family Size in Rosemont is 2.8 People.
What is the Average Household Size in Rosemont
Average Household Size in Rosemont is 2.4 People.
How Large is the Labor Force in Rosemont?
There are 127 People in the Labor Forcein in Rosemont.
What is the Percentage of People in the Labor Force in Rosemont?
48.8% of People are in the Labor Force in Rosemont.
What is the Unemployment Rate in Rosemont?
Unemployment Rate in Rosemont is 2.4%.