Zip Codes with the Highest Percentage of Population Employed in Administrative & Support Services in Glen Burnie, MD
RELATED REPORTS & OPTIONS
Administrative & Support Services
Glen Burnie
Compare Zip Codes
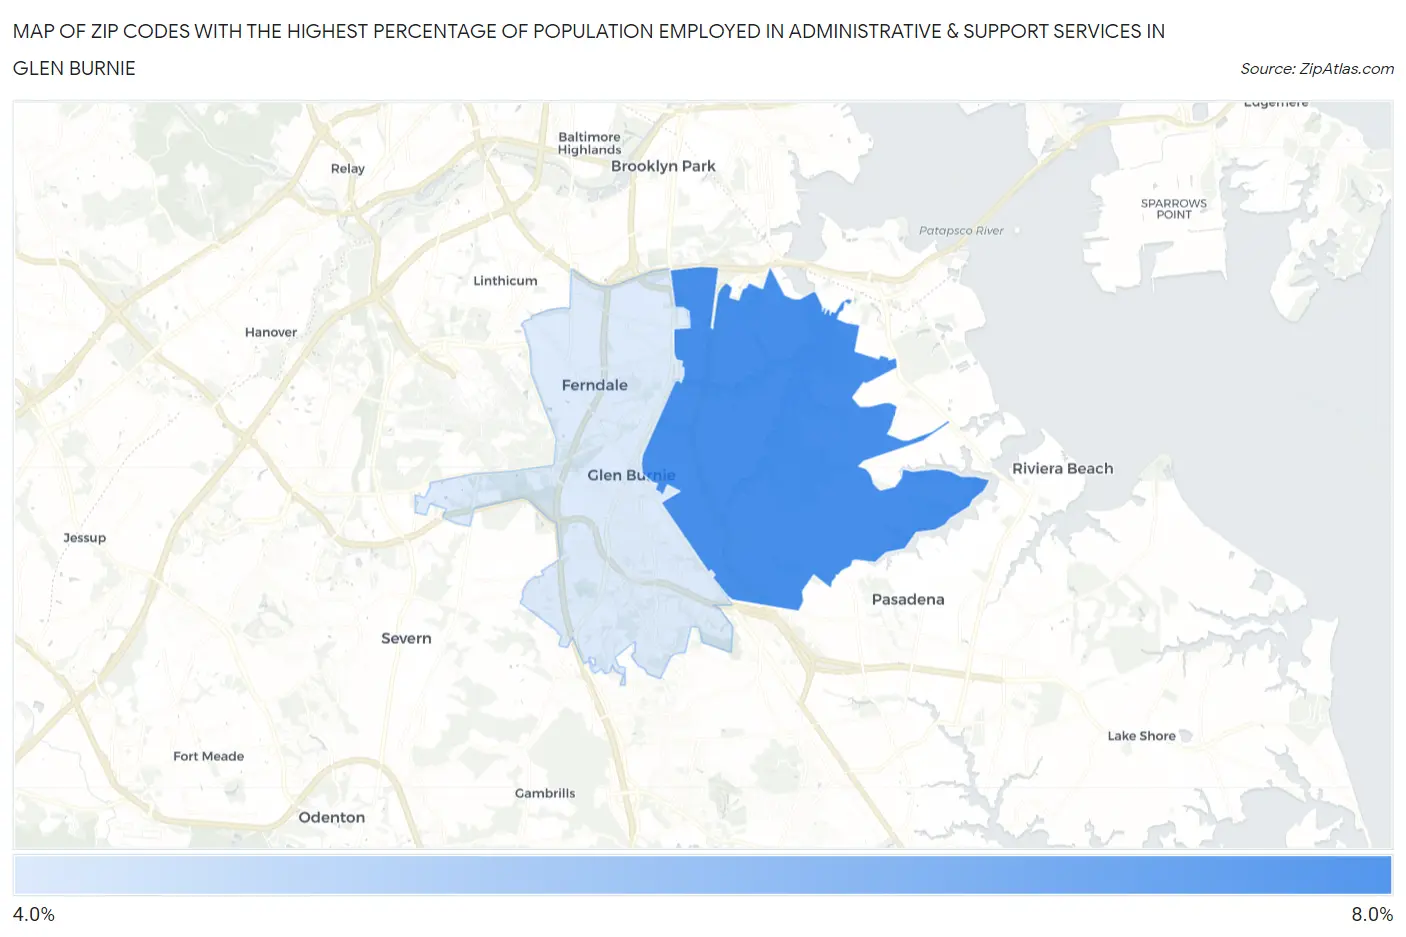
Map of Zip Codes with the Highest Percentage of Population Employed in Administrative & Support Services in Glen Burnie
4.6%
6.2%
Zip Codes with the Highest Percentage of Population Employed in Administrative & Support Services in Glen Burnie, MD
| Zip Code | % Employed | vs State | vs National | |
| 1. | 21060 | 6.2% | 4.2%(+1.93)#80 | 4.1%(+2.01)#4,488 |
| 2. | 21061 | 4.6% | 4.2%(+0.356)#140 | 4.1%(+0.438)#8,414 |
1
Common Questions
What are the Top Zip Codes with the Highest Percentage of Population Employed in Administrative & Support Services in Glen Burnie, MD?
Top Zip Codes with the Highest Percentage of Population Employed in Administrative & Support Services in Glen Burnie, MD are:
What zip code has the Highest Percentage of Population Employed in Administrative & Support Services in Glen Burnie, MD?
21060 has the Highest Percentage of Population Employed in Administrative & Support Services in Glen Burnie, MD with 6.2%.
What is the Percentage of Population Employed in Administrative & Support Services in Glen Burnie, MD?
Percentage of Population Employed in Administrative & Support Services in Glen Burnie is 6.0%.
What is the Percentage of Population Employed in Administrative & Support Services in Maryland?
Percentage of Population Employed in Administrative & Support Services in Maryland is 4.2%.
What is the Percentage of Population Employed in Administrative & Support Services in the United States?
Percentage of Population Employed in Administrative & Support Services in the United States is 4.1%.