Brooklyn Park, MD Map & Demographics
Brooklyn Park Map
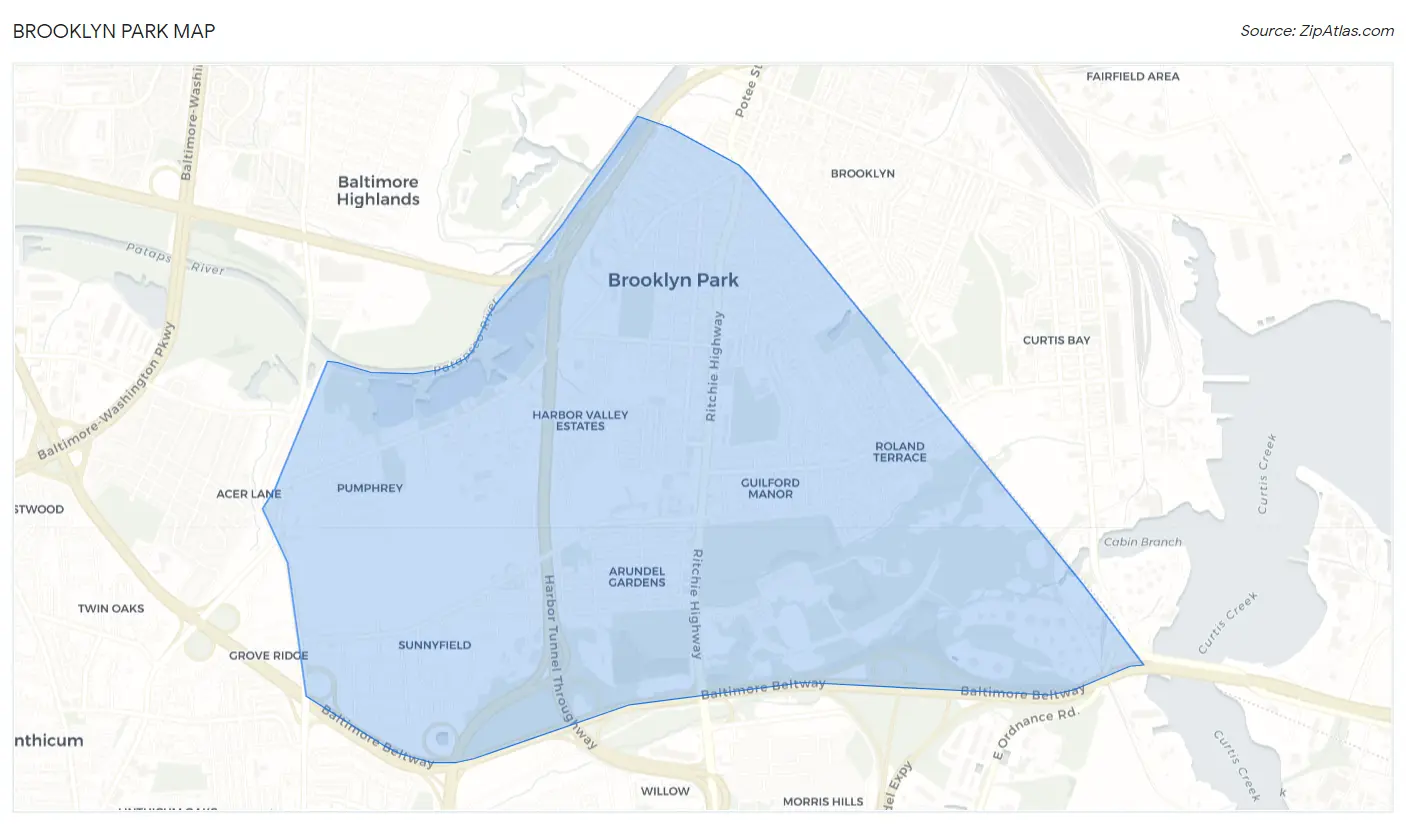
Brooklyn Park Overview
$32,015
PER CAPITA INCOME
$84,668
AVG FAMILY INCOME
$74,440
AVG HOUSEHOLD INCOME
40.5%
WAGE / INCOME GAP [ % ]
59.5¢/ $1
WAGE / INCOME GAP [ $ ]
$14,955
FAMILY INCOME DEFICIT
0.39
INEQUALITY / GINI INDEX
15,902
TOTAL POPULATION
8,240
MALE POPULATION
7,662
FEMALE POPULATION
107.54
MALES / 100 FEMALES
92.99
FEMALES / 100 MALES
39.0
MEDIAN AGE
3.4
AVG FAMILY SIZE
2.9
AVG HOUSEHOLD SIZE
7,668
LABOR FORCE [ PEOPLE ]
60.3%
PERCENT IN LABOR FORCE
4.0%
UNEMPLOYMENT RATE
Income in Brooklyn Park
Income Overview in Brooklyn Park
Per Capita Income in Brooklyn Park is $32,015, while median incomes of families and households are $84,668 and $74,440 respectively.
| Characteristic | Number | Measure |
| Per Capita Income | 15,902 | $32,015 |
| Median Family Income | 3,911 | $84,668 |
| Mean Family Income | 3,911 | $99,382 |
| Median Household Income | 5,495 | $74,440 |
| Mean Household Income | 5,495 | $90,481 |
| Income Deficit | 3,911 | $14,955 |
| Wage / Income Gap (%) | 15,902 | 40.47% |
| Wage / Income Gap ($) | 15,902 | 59.53¢ per $1 |
| Gini / Inequality Index | 15,902 | 0.39 |
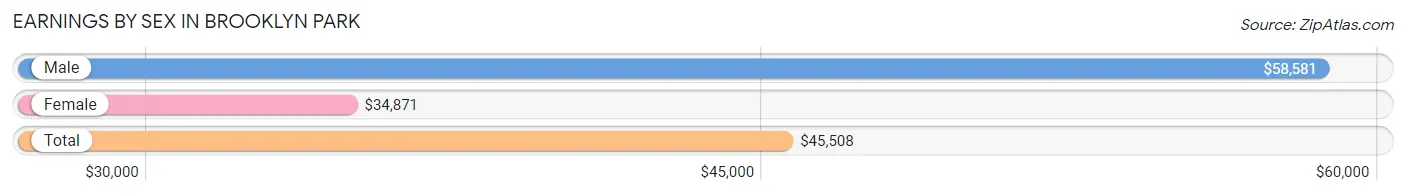
Earnings by Sex in Brooklyn Park
Average Earnings in Brooklyn Park are $45,508, $58,581 for men and $34,871 for women, a difference of 40.5%.
| Sex | Number | Average Earnings |
| Male | 4,205 (53.9%) | $58,581 |
| Female | 3,598 (46.1%) | $34,871 |
| Total | 7,803 (100.0%) | $45,508 |
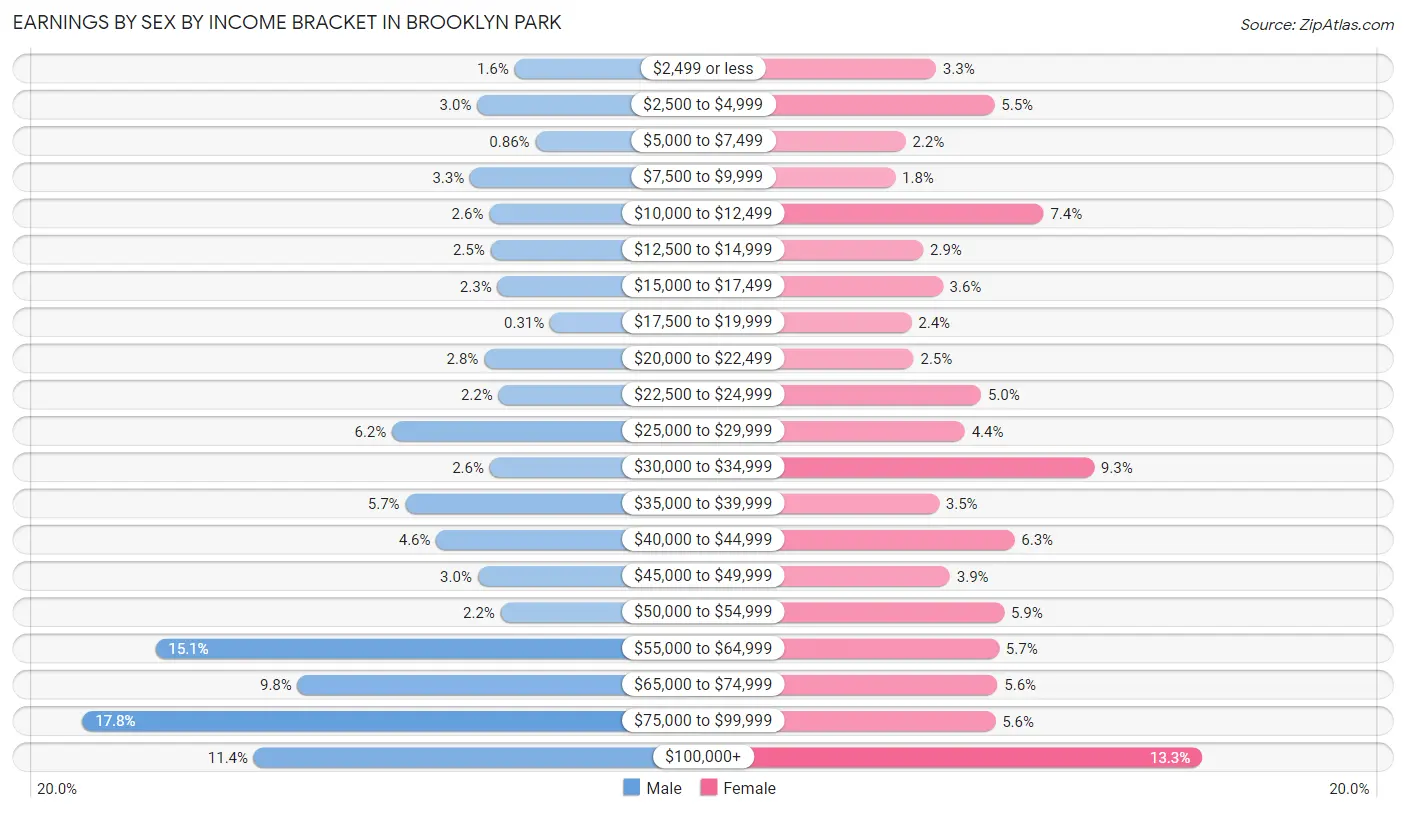
Earnings by Sex by Income Bracket in Brooklyn Park
The most common earnings brackets in Brooklyn Park are $75,000 to $99,999 for men (750 | 17.8%) and $100,000+ for women (479 | 13.3%).
| Income | Male | Female |
| $2,499 or less | 69 (1.6%) | 120 (3.3%) |
| $2,500 to $4,999 | 128 (3.0%) | 199 (5.5%) |
| $5,000 to $7,499 | 36 (0.9%) | 79 (2.2%) |
| $7,500 to $9,999 | 139 (3.3%) | 65 (1.8%) |
| $10,000 to $12,499 | 109 (2.6%) | 265 (7.4%) |
| $12,500 to $14,999 | 107 (2.5%) | 103 (2.9%) |
| $15,000 to $17,499 | 96 (2.3%) | 129 (3.6%) |
| $17,500 to $19,999 | 13 (0.3%) | 87 (2.4%) |
| $20,000 to $22,499 | 117 (2.8%) | 90 (2.5%) |
| $22,500 to $24,999 | 94 (2.2%) | 181 (5.0%) |
| $25,000 to $29,999 | 262 (6.2%) | 159 (4.4%) |
| $30,000 to $34,999 | 108 (2.6%) | 333 (9.3%) |
| $35,000 to $39,999 | 241 (5.7%) | 124 (3.5%) |
| $40,000 to $44,999 | 192 (4.6%) | 226 (6.3%) |
| $45,000 to $49,999 | 127 (3.0%) | 139 (3.9%) |
| $50,000 to $54,999 | 91 (2.2%) | 212 (5.9%) |
| $55,000 to $64,999 | 635 (15.1%) | 205 (5.7%) |
| $65,000 to $74,999 | 411 (9.8%) | 203 (5.6%) |
| $75,000 to $99,999 | 750 (17.8%) | 200 (5.6%) |
| $100,000+ | 480 (11.4%) | 479 (13.3%) |
| Total | 4,205 (100.0%) | 3,598 (100.0%) |
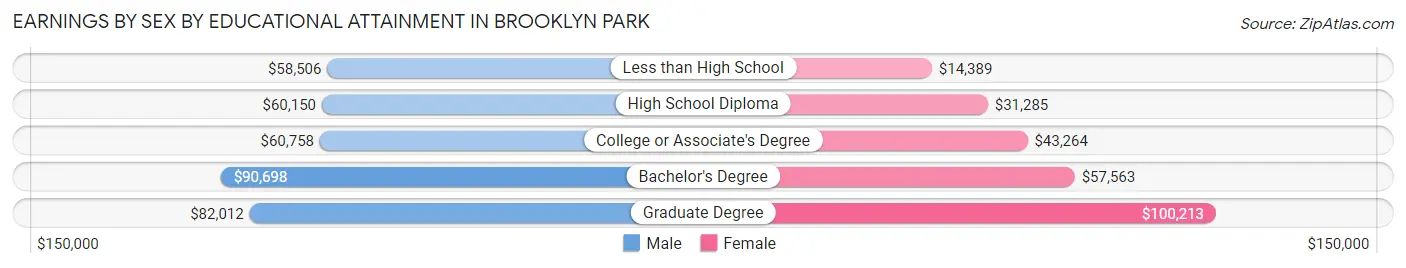
Earnings by Sex by Educational Attainment in Brooklyn Park
Average earnings in Brooklyn Park are $61,705 for men and $41,582 for women, a difference of 32.6%. Men with an educational attainment of bachelor's degree enjoy the highest average annual earnings of $90,698, while those with less than high school education earn the least with $58,506. Women with an educational attainment of graduate degree earn the most with the average annual earnings of $100,213, while those with less than high school education have the smallest earnings of $14,389.
| Educational Attainment | Male Income | Female Income |
| Less than High School | $58,506 | $14,389 |
| High School Diploma | $60,150 | $31,285 |
| College or Associate's Degree | $60,758 | $43,264 |
| Bachelor's Degree | $90,698 | $57,563 |
| Graduate Degree | $82,012 | $100,213 |
| Total | $61,705 | $41,582 |
Family Income in Brooklyn Park
Family Income Brackets in Brooklyn Park
According to the Brooklyn Park family income data, there are 813 families falling into the $100,000 to $149,999 income range, which is the most common income bracket and makes up 20.8% of all families. Conversely, the $10,000 to $14,999 income bracket is the least frequent group with only 27 families (0.7%) belonging to this category.
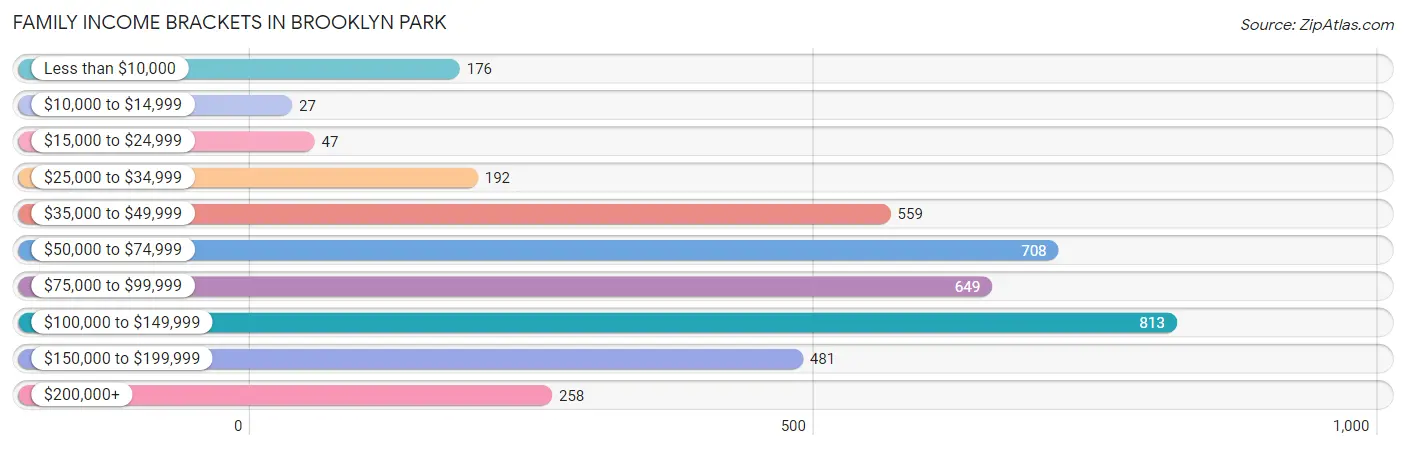
| Income Bracket | # Families | % Families |
| Less than $10,000 | 176 | 4.5% |
| $10,000 to $14,999 | 27 | 0.7% |
| $15,000 to $24,999 | 47 | 1.2% |
| $25,000 to $34,999 | 192 | 4.9% |
| $35,000 to $49,999 | 559 | 14.3% |
| $50,000 to $74,999 | 708 | 18.1% |
| $75,000 to $99,999 | 649 | 16.6% |
| $100,000 to $149,999 | 813 | 20.8% |
| $150,000 to $199,999 | 481 | 12.3% |
| $200,000+ | 258 | 6.6% |
Family Income by Famaliy Size in Brooklyn Park
4-person families (722 | 18.5%) account for the highest median family income in Brooklyn Park with $124,709 per family, while 2-person families (1,590 | 40.6%) have the highest median income of $36,534 per family member.
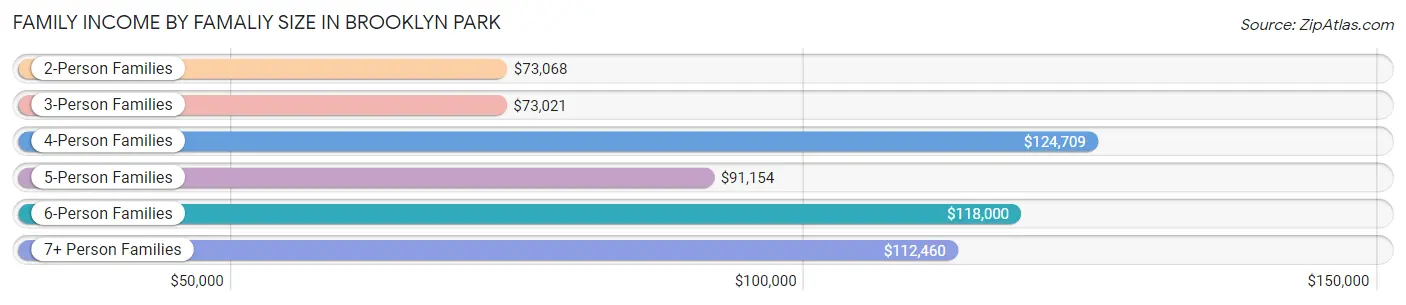
| Income Bracket | # Families | Median Income |
| 2-Person Families | 1,590 (40.6%) | $73,068 |
| 3-Person Families | 968 (24.7%) | $73,021 |
| 4-Person Families | 722 (18.5%) | $124,709 |
| 5-Person Families | 380 (9.7%) | $91,154 |
| 6-Person Families | 146 (3.7%) | $118,000 |
| 7+ Person Families | 105 (2.7%) | $112,460 |
| Total | 3,911 (100.0%) | $84,668 |
Family Income by Number of Earners in Brooklyn Park
The median family income in Brooklyn Park is $84,668, with families comprising 3+ earners (511) having the highest median family income of $148,750, while families with no earners (521) have the lowest median family income of $45,674, accounting for 13.1% and 13.3% of families, respectively.
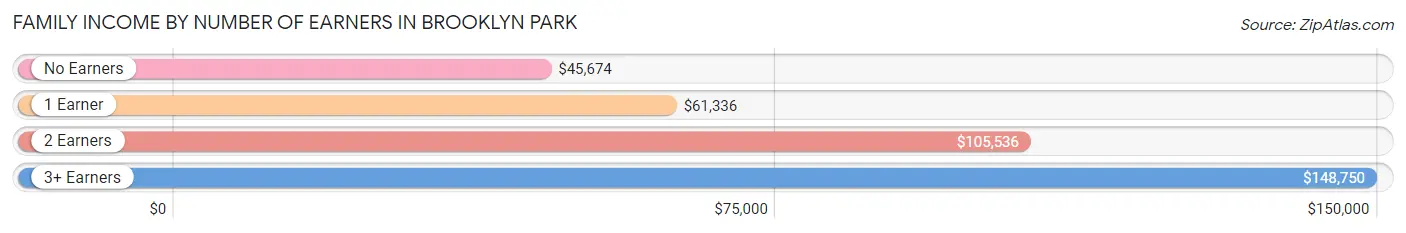
| Number of Earners | # Families | Median Income |
| No Earners | 521 (13.3%) | $45,674 |
| 1 Earner | 1,326 (33.9%) | $61,336 |
| 2 Earners | 1,553 (39.7%) | $105,536 |
| 3+ Earners | 511 (13.1%) | $148,750 |
| Total | 3,911 (100.0%) | $84,668 |
Household Income in Brooklyn Park
Household Income Brackets in Brooklyn Park
With 1,066 households falling in the category, the $50,000 to $74,999 income range is the most frequent in Brooklyn Park, accounting for 19.4% of all households. In contrast, only 77 households (1.4%) fall into the $10,000 to $14,999 income bracket, making it the least populous group.
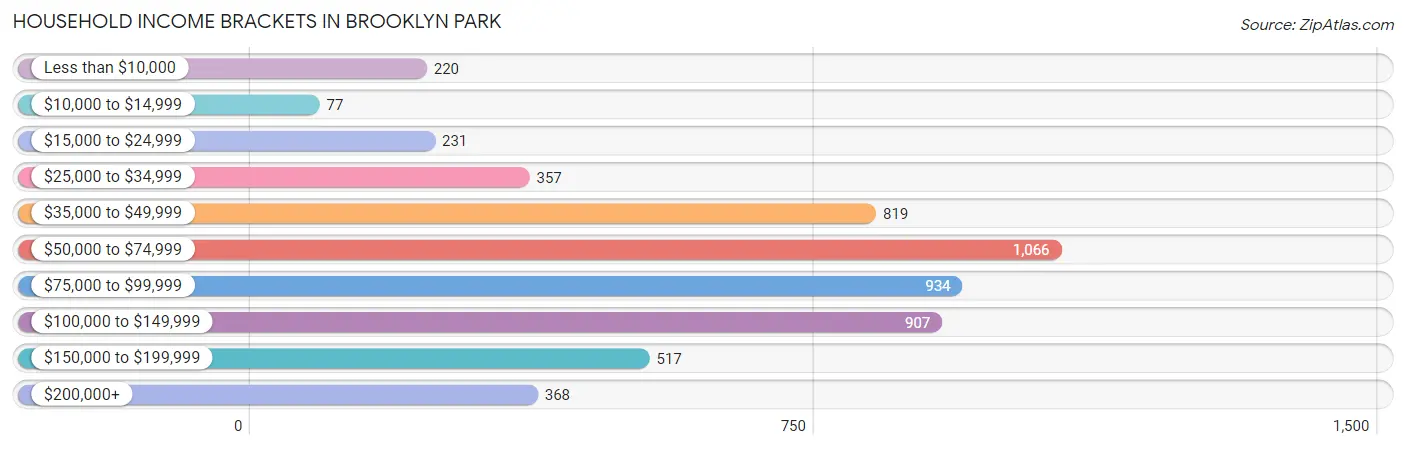
| Income Bracket | # Households | % Households |
| Less than $10,000 | 220 | 4.0% |
| $10,000 to $14,999 | 77 | 1.4% |
| $15,000 to $24,999 | 231 | 4.2% |
| $25,000 to $34,999 | 357 | 6.5% |
| $35,000 to $49,999 | 819 | 14.9% |
| $50,000 to $74,999 | 1,066 | 19.4% |
| $75,000 to $99,999 | 934 | 17.0% |
| $100,000 to $149,999 | 907 | 16.5% |
| $150,000 to $199,999 | 517 | 9.4% |
| $200,000+ | 368 | 6.7% |
Household Income by Householder Age in Brooklyn Park
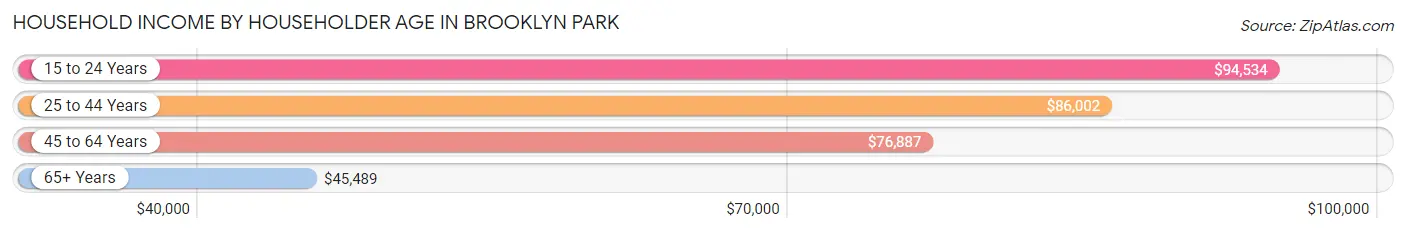
The median household income in Brooklyn Park is $74,440, with the highest median household income of $94,534 found in the 15 to 24 years age bracket for the primary householder. A total of 112 households (2.0%) fall into this category. Meanwhile, the 65+ years age bracket for the primary householder has the lowest median household income of $45,489, with 1,358 households (24.7%) in this group.
| Income Bracket | # Households | Median Income |
| 15 to 24 Years | 112 (2.0%) | $94,534 |
| 25 to 44 Years | 1,717 (31.2%) | $86,002 |
| 45 to 64 Years | 2,308 (42.0%) | $76,887 |
| 65+ Years | 1,358 (24.7%) | $45,489 |
| Total | 5,495 (100.0%) | $74,440 |
Poverty in Brooklyn Park
Income Below Poverty by Sex and Age in Brooklyn Park
With 10.1% poverty level for males and 11.5% for females among the residents of Brooklyn Park, 6 to 11 year old males and 5 year old females are the most vulnerable to poverty, with 111 males (20.2%) and 24 females (100.0%) in their respective age groups living below the poverty level.

| Age Bracket | Male | Female |
| Under 5 Years | 20 (3.5%) | 29 (6.6%) |
| 5 Years | 0 (0.0%) | 24 (100.0%) |
| 6 to 11 Years | 111 (20.2%) | 0 (0.0%) |
| 12 to 14 Years | 86 (18.3%) | 0 (0.0%) |
| 15 Years | 0 (0.0%) | 72 (62.6%) |
| 16 and 17 Years | 0 (0.0%) | 107 (51.7%) |
| 18 to 24 Years | 21 (2.9%) | 116 (13.7%) |
| 25 to 34 Years | 64 (8.8%) | 74 (8.8%) |
| 35 to 44 Years | 121 (8.4%) | 191 (16.9%) |
| 45 to 54 Years | 85 (9.0%) | 55 (5.7%) |
| 55 to 64 Years | 146 (11.2%) | 104 (9.3%) |
| 65 to 74 Years | 104 (17.7%) | 62 (10.9%) |
| 75 Years and over | 62 (13.3%) | 37 (6.9%) |
| Total | 820 (10.1%) | 871 (11.5%) |
Income Above Poverty by Sex and Age in Brooklyn Park
According to the poverty statistics in Brooklyn Park, males aged 5 years and females aged 6 to 11 years are the age groups that are most secure financially, with 100.0% of males and 100.0% of females in these age groups living above the poverty line.
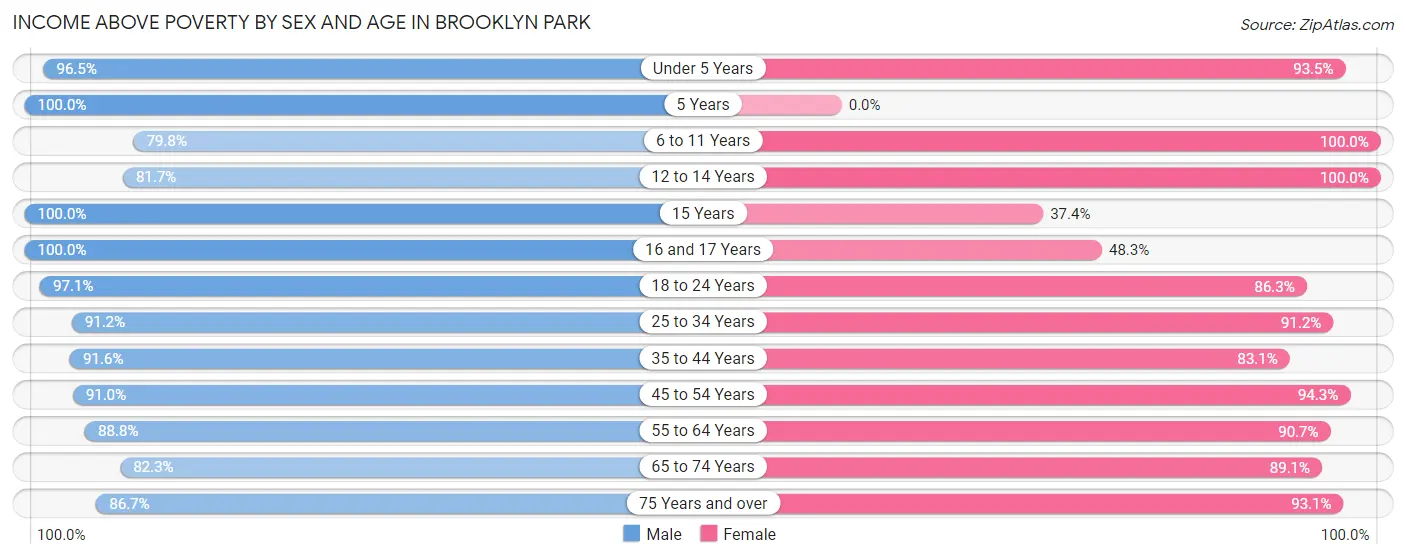
| Age Bracket | Male | Female |
| Under 5 Years | 547 (96.5%) | 414 (93.4%) |
| 5 Years | 99 (100.0%) | 0 (0.0%) |
| 6 to 11 Years | 438 (79.8%) | 520 (100.0%) |
| 12 to 14 Years | 385 (81.7%) | 286 (100.0%) |
| 15 Years | 73 (100.0%) | 43 (37.4%) |
| 16 and 17 Years | 196 (100.0%) | 100 (48.3%) |
| 18 to 24 Years | 708 (97.1%) | 728 (86.3%) |
| 25 to 34 Years | 665 (91.2%) | 767 (91.2%) |
| 35 to 44 Years | 1,313 (91.6%) | 939 (83.1%) |
| 45 to 54 Years | 864 (91.0%) | 915 (94.3%) |
| 55 to 64 Years | 1,154 (88.8%) | 1,011 (90.7%) |
| 65 to 74 Years | 482 (82.3%) | 507 (89.1%) |
| 75 Years and over | 403 (86.7%) | 498 (93.1%) |
| Total | 7,327 (89.9%) | 6,728 (88.5%) |
Income Below Poverty Among Married-Couple Families in Brooklyn Park
The poverty statistics for married-couple families in Brooklyn Park show that 2.1% or 55 of the total 2,568 families live below the poverty line. Families with no children have the highest poverty rate of 3.9%, comprising of 55 families. On the other hand, families with 1 or 2 children have the lowest poverty rate of 0.0%, which includes 0 families.
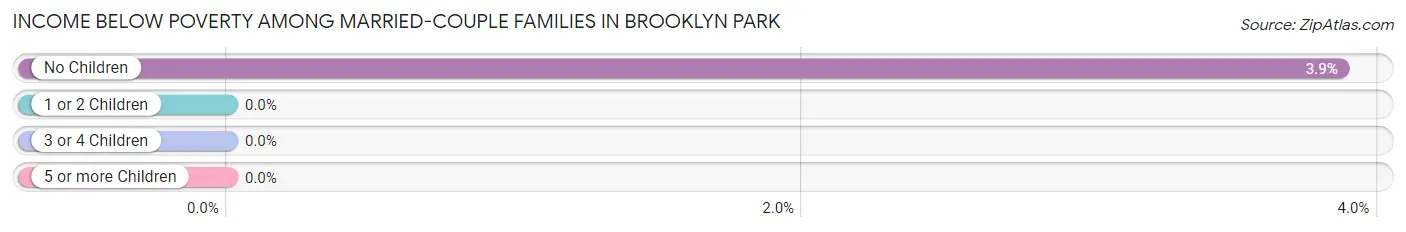
| Children | Above Poverty | Below Poverty |
| No Children | 1,368 (96.1%) | 55 (3.9%) |
| 1 or 2 Children | 929 (100.0%) | 0 (0.0%) |
| 3 or 4 Children | 203 (100.0%) | 0 (0.0%) |
| 5 or more Children | 13 (100.0%) | 0 (0.0%) |
| Total | 2,513 (97.9%) | 55 (2.1%) |
Income Below Poverty Among Single-Parent Households in Brooklyn Park
According to the poverty data in Brooklyn Park, 14.6% or 79 single-father households and 17.3% or 139 single-mother households are living below the poverty line. Among single-father households, those with 1 or 2 children have the highest poverty rate, with 68 households (33.0%) experiencing poverty. Likewise, among single-mother households, those with 3 or 4 children have the highest poverty rate, with 106 households (82.8%) falling below the poverty line.
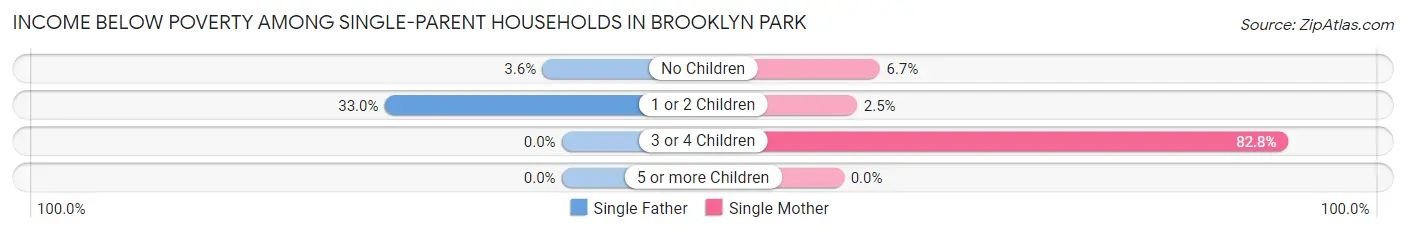
| Children | Single Father | Single Mother |
| No Children | 11 (3.6%) | 26 (6.7%) |
| 1 or 2 Children | 68 (33.0%) | 7 (2.5%) |
| 3 or 4 Children | 0 (0.0%) | 106 (82.8%) |
| 5 or more Children | 0 (0.0%) | 0 (0.0%) |
| Total | 79 (14.6%) | 139 (17.3%) |
Income Below Poverty Among Married-Couple vs Single-Parent Households in Brooklyn Park
The poverty data for Brooklyn Park shows that 55 of the married-couple family households (2.1%) and 218 of the single-parent households (16.2%) are living below the poverty level. Within the married-couple family households, those with no children have the highest poverty rate, with 55 households (3.9%) falling below the poverty line. Among the single-parent households, those with 3 or 4 children have the highest poverty rate, with 106 household (65.8%) living below poverty.
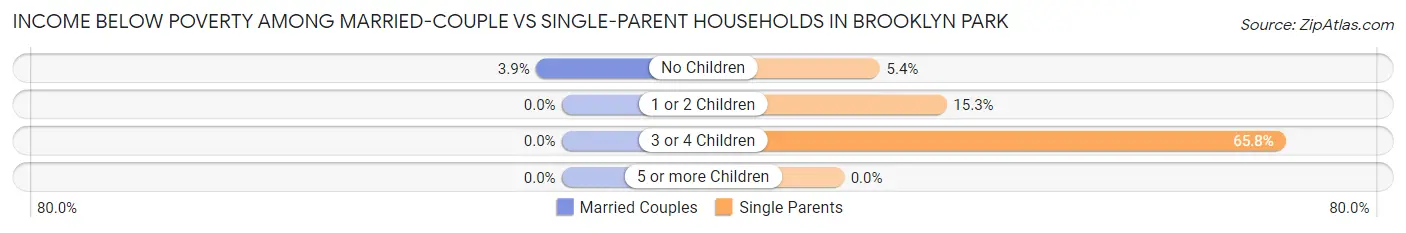
| Children | Married-Couple Families | Single-Parent Households |
| No Children | 55 (3.9%) | 37 (5.3%) |
| 1 or 2 Children | 0 (0.0%) | 75 (15.3%) |
| 3 or 4 Children | 0 (0.0%) | 106 (65.8%) |
| 5 or more Children | 0 (0.0%) | 0 (0.0%) |
| Total | 55 (2.1%) | 218 (16.2%) |
Race in Brooklyn Park
The most populous races in Brooklyn Park are White / Caucasian (8,535 | 53.7%), Black / African American (3,348 | 21.0%), and Hispanic or Latino (2,953 | 18.6%).
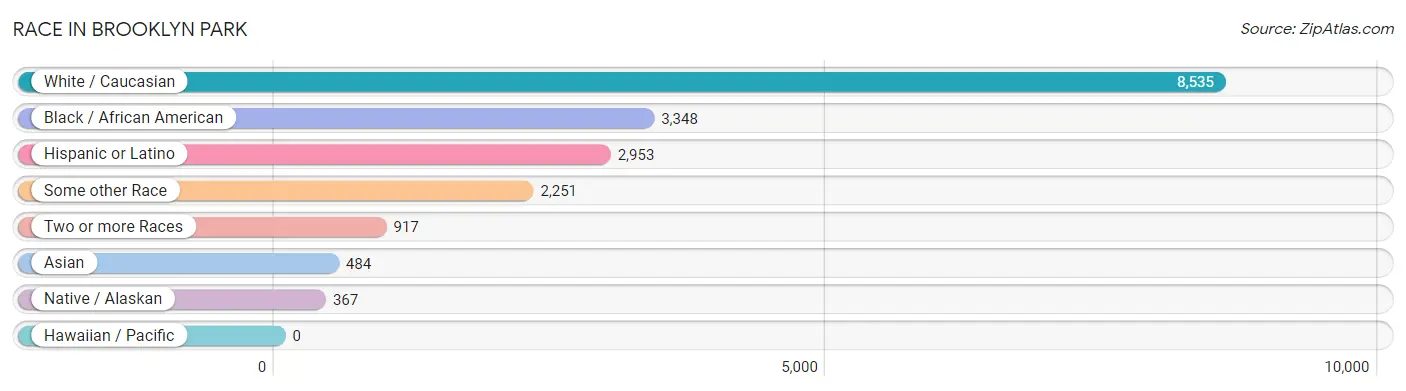
| Race | # Population | % Population |
| Asian | 484 | 3.0% |
| Black / African American | 3,348 | 21.0% |
| Hawaiian / Pacific | 0 | 0.0% |
| Hispanic or Latino | 2,953 | 18.6% |
| Native / Alaskan | 367 | 2.3% |
| White / Caucasian | 8,535 | 53.7% |
| Two or more Races | 917 | 5.8% |
| Some other Race | 2,251 | 14.2% |
| Total | 15,902 | 100.0% |
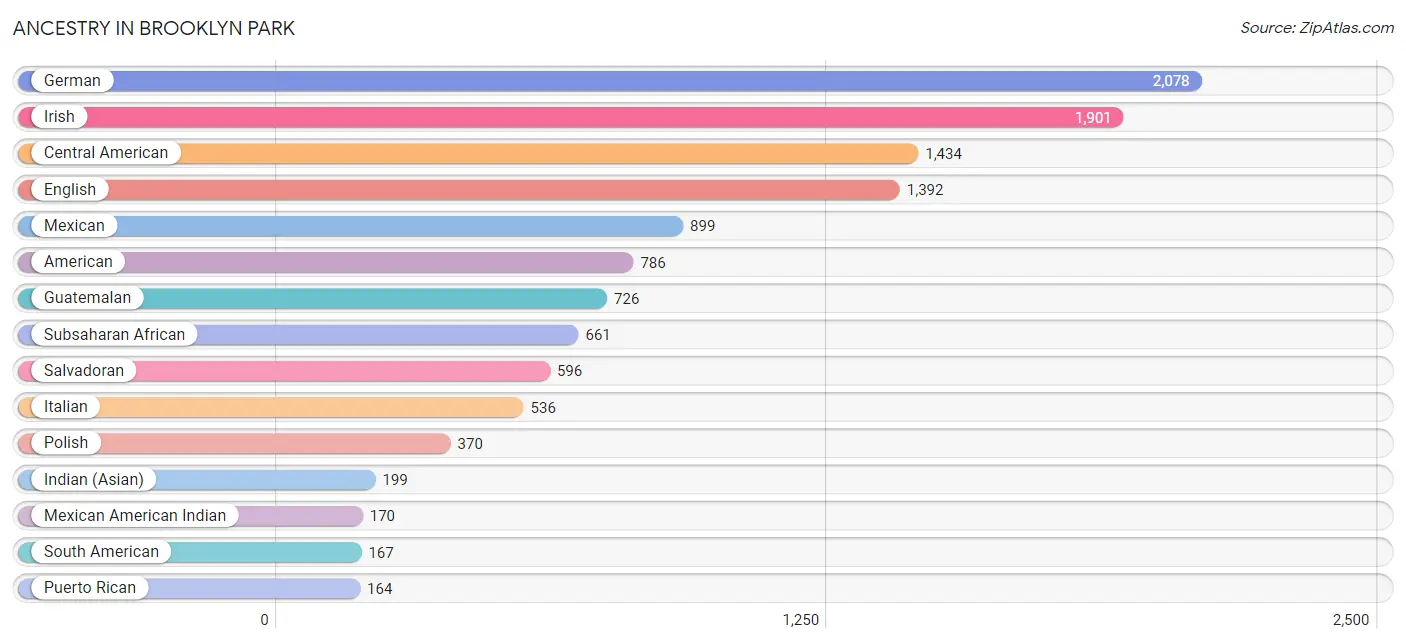
Ancestry in Brooklyn Park
The most populous ancestries reported in Brooklyn Park are German (2,078 | 13.1%), Irish (1,901 | 11.9%), Central American (1,434 | 9.0%), English (1,392 | 8.7%), and Mexican (899 | 5.7%), together accounting for 48.4% of all Brooklyn Park residents.
| Ancestry | # Population | % Population |
| African | 32 | 0.2% |
| Albanian | 62 | 0.4% |
| American | 786 | 4.9% |
| Apache | 6 | 0.0% |
| Argentinean | 7 | 0.0% |
| Basque | 16 | 0.1% |
| Bhutanese | 59 | 0.4% |
| Brazilian | 27 | 0.2% |
| British | 56 | 0.4% |
| Burmese | 15 | 0.1% |
| Canadian | 12 | 0.1% |
| Central American | 1,434 | 9.0% |
| Cherokee | 59 | 0.4% |
| Colombian | 69 | 0.4% |
| Czech | 6 | 0.0% |
| Czechoslovakian | 12 | 0.1% |
| Danish | 19 | 0.1% |
| Dominican | 48 | 0.3% |
| Dutch | 119 | 0.7% |
| Eastern European | 7 | 0.0% |
| Ecuadorian | 17 | 0.1% |
| English | 1,392 | 8.7% |
| European | 163 | 1.0% |
| French | 156 | 1.0% |
| French Canadian | 81 | 0.5% |
| German | 2,078 | 13.1% |
| Ghanaian | 142 | 0.9% |
| Greek | 41 | 0.3% |
| Guatemalan | 726 | 4.6% |
| Honduran | 112 | 0.7% |
| Hungarian | 57 | 0.4% |
| Indian (Asian) | 199 | 1.3% |
| Inupiat | 31 | 0.2% |
| Irish | 1,901 | 11.9% |
| Italian | 536 | 3.4% |
| Jamaican | 12 | 0.1% |
| Kenyan | 5 | 0.0% |
| Korean | 137 | 0.9% |
| Lithuanian | 81 | 0.5% |
| Lumbee | 9 | 0.1% |
| Mexican | 899 | 5.7% |
| Mexican American Indian | 170 | 1.1% |
| Native Hawaiian | 7 | 0.0% |
| Navajo | 6 | 0.0% |
| Nigerian | 85 | 0.5% |
| Norwegian | 105 | 0.7% |
| Pakistani | 17 | 0.1% |
| Polish | 370 | 2.3% |
| Portuguese | 30 | 0.2% |
| Puerto Rican | 164 | 1.0% |
| Russian | 3 | 0.0% |
| Salvadoran | 596 | 3.7% |
| Scandinavian | 7 | 0.0% |
| Scotch-Irish | 107 | 0.7% |
| Scottish | 127 | 0.8% |
| Slovak | 66 | 0.4% |
| South American | 167 | 1.1% |
| South American Indian | 14 | 0.1% |
| Spanish | 16 | 0.1% |
| Sri Lankan | 100 | 0.6% |
| Subsaharan African | 661 | 4.2% |
| Swedish | 91 | 0.6% |
| Thai | 108 | 0.7% |
| Ukrainian | 35 | 0.2% |
| Uruguayan | 57 | 0.4% |
| Venezuelan | 17 | 0.1% |
| Welsh | 28 | 0.2% |
| Yugoslavian | 10 | 0.1% | View All 68 Rows |
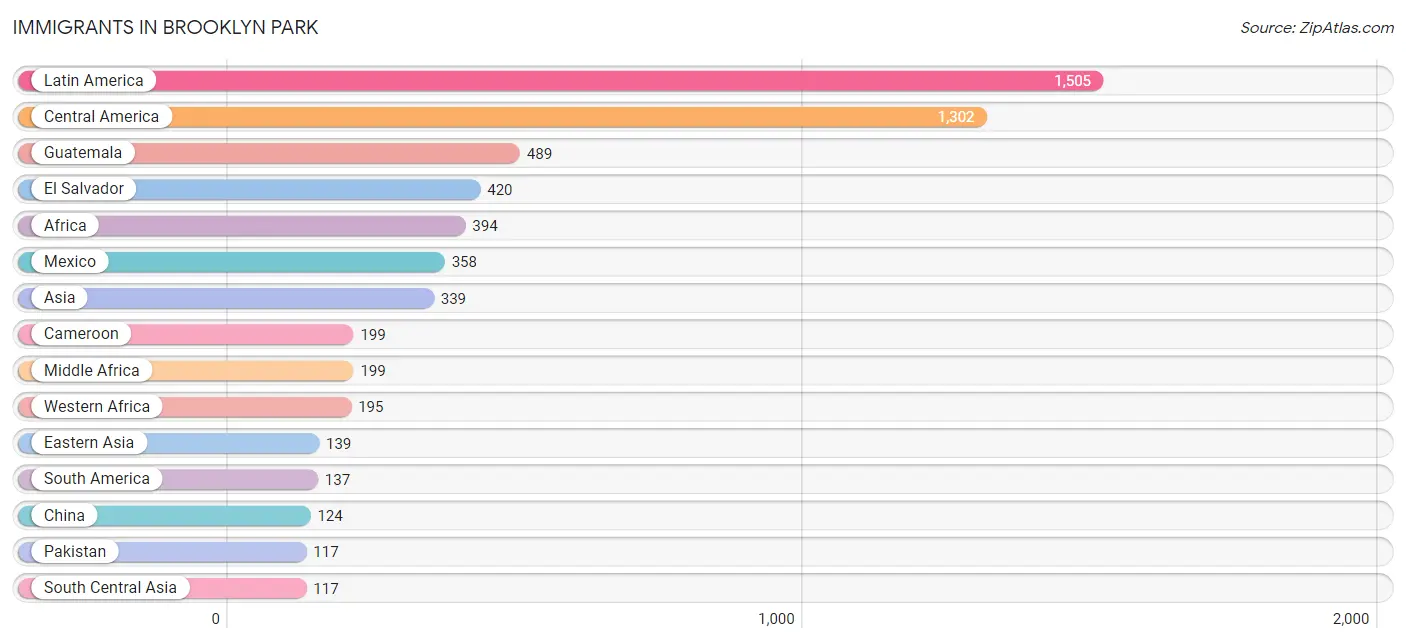
Immigrants in Brooklyn Park
The most numerous immigrant groups reported in Brooklyn Park came from Latin America (1,505 | 9.5%), Central America (1,302 | 8.2%), Guatemala (489 | 3.1%), El Salvador (420 | 2.6%), and Africa (394 | 2.5%), together accounting for 25.9% of all Brooklyn Park residents.
| Immigration Origin | # Population | % Population |
| Africa | 394 | 2.5% |
| Albania | 40 | 0.3% |
| Argentina | 7 | 0.0% |
| Asia | 339 | 2.1% |
| Cameroon | 199 | 1.3% |
| Caribbean | 66 | 0.4% |
| Central America | 1,302 | 8.2% |
| China | 124 | 0.8% |
| Colombia | 22 | 0.1% |
| Dominican Republic | 54 | 0.3% |
| Eastern Asia | 139 | 0.9% |
| Eastern Europe | 40 | 0.3% |
| Ecuador | 17 | 0.1% |
| El Salvador | 420 | 2.6% |
| England | 10 | 0.1% |
| Europe | 85 | 0.5% |
| Ghana | 116 | 0.7% |
| Guatemala | 489 | 3.1% |
| Guyana | 17 | 0.1% |
| Honduras | 35 | 0.2% |
| Italy | 12 | 0.1% |
| Jamaica | 12 | 0.1% |
| Korea | 15 | 0.1% |
| Latin America | 1,505 | 9.5% |
| Mexico | 358 | 2.2% |
| Middle Africa | 199 | 1.3% |
| Nigeria | 59 | 0.4% |
| Northern Europe | 33 | 0.2% |
| Pakistan | 117 | 0.7% |
| Philippines | 59 | 0.4% |
| South America | 137 | 0.9% |
| South Central Asia | 117 | 0.7% |
| South Eastern Asia | 83 | 0.5% |
| Southern Europe | 12 | 0.1% |
| Sweden | 23 | 0.1% |
| Thailand | 17 | 0.1% |
| Uruguay | 57 | 0.4% |
| Venezuela | 17 | 0.1% |
| Vietnam | 7 | 0.0% |
| Western Africa | 195 | 1.2% | View All 40 Rows |
Sex and Age in Brooklyn Park
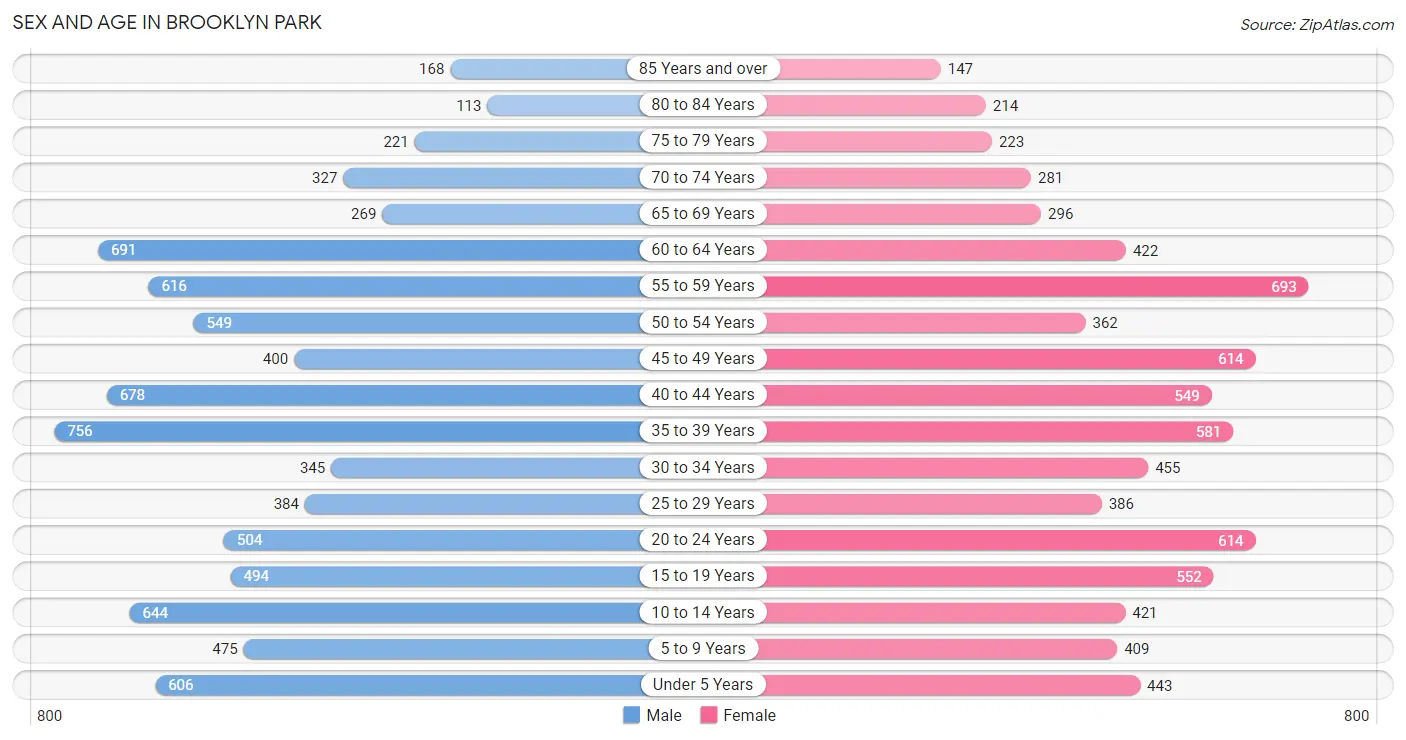
Sex and Age in Brooklyn Park
The most populous age groups in Brooklyn Park are 35 to 39 Years (756 | 9.2%) for men and 55 to 59 Years (693 | 9.0%) for women.
| Age Bracket | Male | Female |
| Under 5 Years | 606 (7.3%) | 443 (5.8%) |
| 5 to 9 Years | 475 (5.8%) | 409 (5.3%) |
| 10 to 14 Years | 644 (7.8%) | 421 (5.5%) |
| 15 to 19 Years | 494 (6.0%) | 552 (7.2%) |
| 20 to 24 Years | 504 (6.1%) | 614 (8.0%) |
| 25 to 29 Years | 384 (4.7%) | 386 (5.0%) |
| 30 to 34 Years | 345 (4.2%) | 455 (5.9%) |
| 35 to 39 Years | 756 (9.2%) | 581 (7.6%) |
| 40 to 44 Years | 678 (8.2%) | 549 (7.2%) |
| 45 to 49 Years | 400 (4.9%) | 614 (8.0%) |
| 50 to 54 Years | 549 (6.7%) | 362 (4.7%) |
| 55 to 59 Years | 616 (7.5%) | 693 (9.0%) |
| 60 to 64 Years | 691 (8.4%) | 422 (5.5%) |
| 65 to 69 Years | 269 (3.3%) | 296 (3.9%) |
| 70 to 74 Years | 327 (4.0%) | 281 (3.7%) |
| 75 to 79 Years | 221 (2.7%) | 223 (2.9%) |
| 80 to 84 Years | 113 (1.4%) | 214 (2.8%) |
| 85 Years and over | 168 (2.0%) | 147 (1.9%) |
| Total | 8,240 (100.0%) | 7,662 (100.0%) |
Families and Households in Brooklyn Park
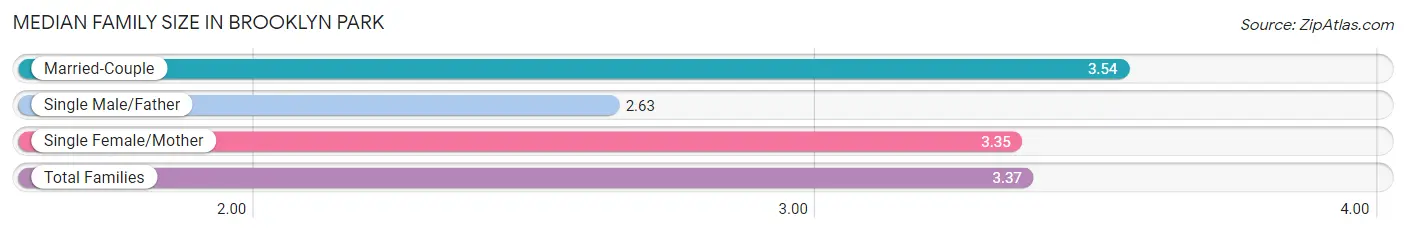
Median Family Size in Brooklyn Park
The median family size in Brooklyn Park is 3.37 persons per family, with married-couple families (2,568 | 65.7%) accounting for the largest median family size of 3.54 persons per family. On the other hand, single male/father families (542 | 13.9%) represent the smallest median family size with 2.63 persons per family.
| Family Type | # Families | Family Size |
| Married-Couple | 2,568 (65.7%) | 3.54 |
| Single Male/Father | 542 (13.9%) | 2.63 |
| Single Female/Mother | 801 (20.5%) | 3.35 |
| Total Families | 3,911 (100.0%) | 3.37 |
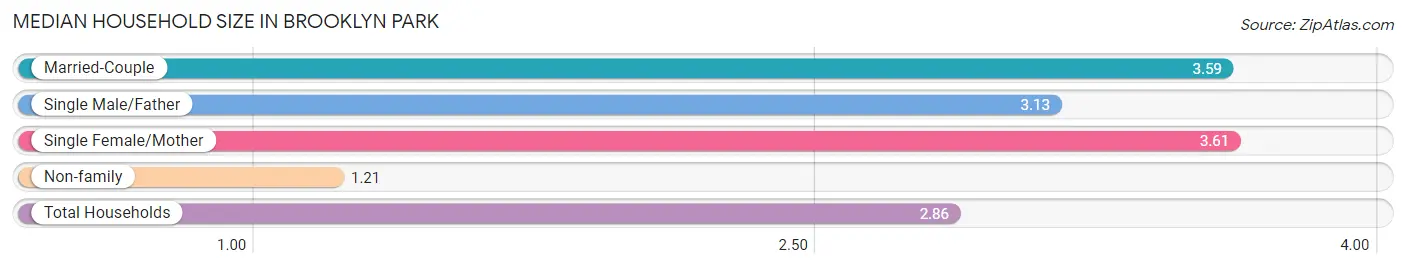
Median Household Size in Brooklyn Park
The median household size in Brooklyn Park is 2.86 persons per household, with single female/mother households (801 | 14.6%) accounting for the largest median household size of 3.61 persons per household. non-family households (1,584 | 28.8%) represent the smallest median household size with 1.21 persons per household.
| Household Type | # Households | Household Size |
| Married-Couple | 2,568 (46.7%) | 3.59 |
| Single Male/Father | 542 (9.9%) | 3.13 |
| Single Female/Mother | 801 (14.6%) | 3.61 |
| Non-family | 1,584 (28.8%) | 1.21 |
| Total Households | 5,495 (100.0%) | 2.86 |
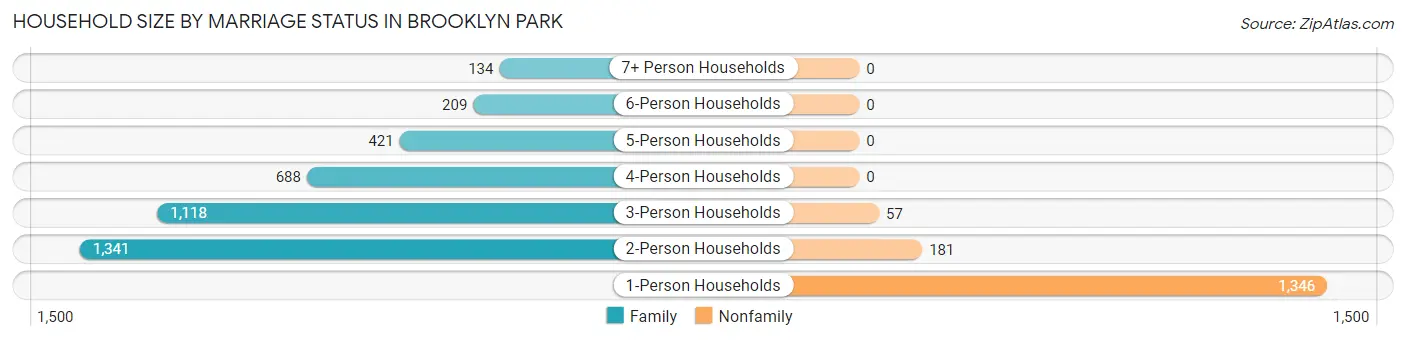
Household Size by Marriage Status in Brooklyn Park
Out of a total of 5,495 households in Brooklyn Park, 3,911 (71.2%) are family households, while 1,584 (28.8%) are nonfamily households. The most numerous type of family households are 2-person households, comprising 1,341, and the most common type of nonfamily households are 1-person households, comprising 1,346.
| Household Size | Family Households | Nonfamily Households |
| 1-Person Households | - | 1,346 (24.5%) |
| 2-Person Households | 1,341 (24.4%) | 181 (3.3%) |
| 3-Person Households | 1,118 (20.3%) | 57 (1.0%) |
| 4-Person Households | 688 (12.5%) | 0 (0.0%) |
| 5-Person Households | 421 (7.7%) | 0 (0.0%) |
| 6-Person Households | 209 (3.8%) | 0 (0.0%) |
| 7+ Person Households | 134 (2.4%) | 0 (0.0%) |
| Total | 3,911 (71.2%) | 1,584 (28.8%) |
Female Fertility in Brooklyn Park
Fertility by Age in Brooklyn Park
Average fertility rate in Brooklyn Park is 46.0 births per 1,000 women. Women in the age bracket of 20 to 34 years have the highest fertility rate with 82.0 births per 1,000 women. Women in the age bracket of 20 to 34 years acount for 67.8% of all women with births.
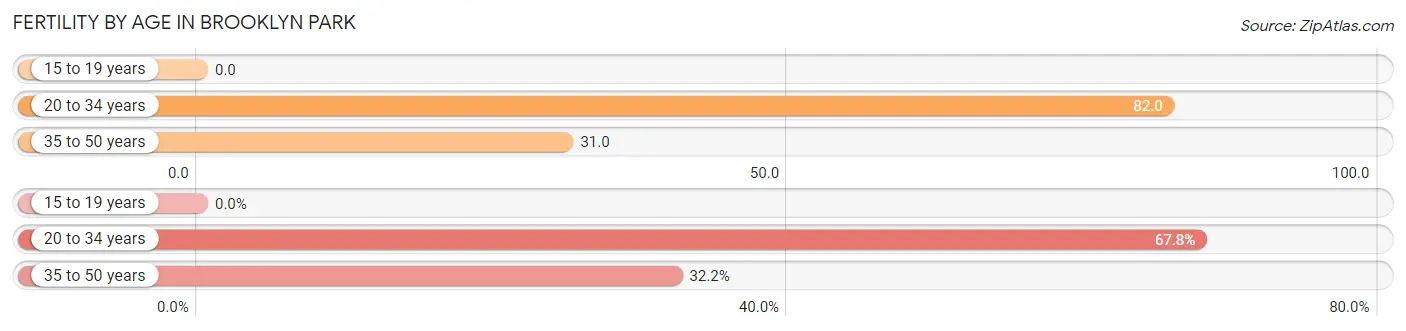
| Age Bracket | Women with Births | Births / 1,000 Women |
| 15 to 19 years | 0 (0.0%) | 0.0 |
| 20 to 34 years | 120 (67.8%) | 82.0 |
| 35 to 50 years | 57 (32.2%) | 31.0 |
| Total | 177 (100.0%) | 46.0 |
Fertility by Age by Marriage Status in Brooklyn Park
61.0% of women with births (177) in Brooklyn Park are married. The highest percentage of unmarried women with births falls into 20 to 34 years age bracket with 57.5% of them unmarried at the time of birth, while the lowest percentage of unmarried women with births belong to 35 to 50 years age bracket with 0.0% of them unmarried.
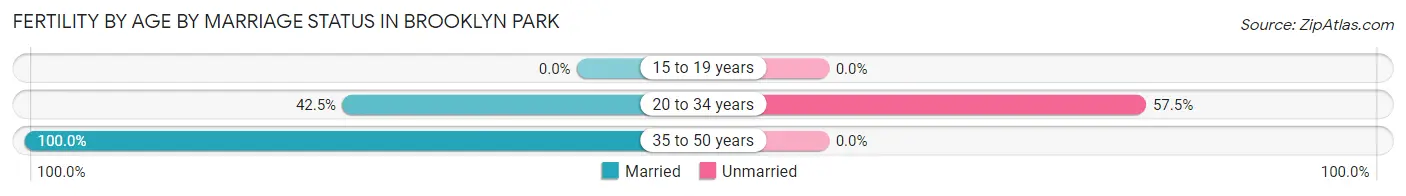
| Age Bracket | Married | Unmarried |
| 15 to 19 years | 0 (0.0%) | 0 (0.0%) |
| 20 to 34 years | 51 (42.5%) | 69 (57.5%) |
| 35 to 50 years | 57 (100.0%) | 0 (0.0%) |
| Total | 108 (61.0%) | 69 (39.0%) |
Fertility by Education in Brooklyn Park
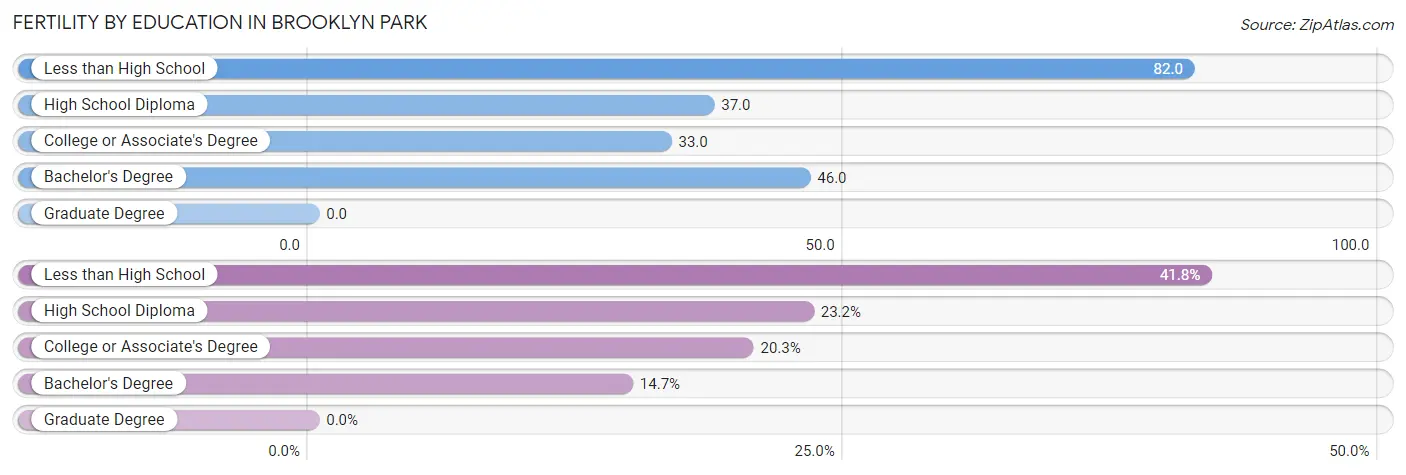
| Educational Attainment | Women with Births | Births / 1,000 Women |
| Less than High School | 74 (41.8%) | 82.0 |
| High School Diploma | 41 (23.2%) | 37.0 |
| College or Associate's Degree | 36 (20.3%) | 33.0 |
| Bachelor's Degree | 26 (14.7%) | 46.0 |
| Graduate Degree | 0 (0.0%) | 0.0 |
| Total | 177 (100.0%) | 46.0 |
Fertility by Education by Marriage Status in Brooklyn Park
39.0% of women with births in Brooklyn Park are unmarried. Women with the educational attainment of bachelor's degree are most likely to be married with 100.0% of them married at childbirth, while women with the educational attainment of high school diploma are least likely to be married with 63.4% of them unmarried at childbirth.
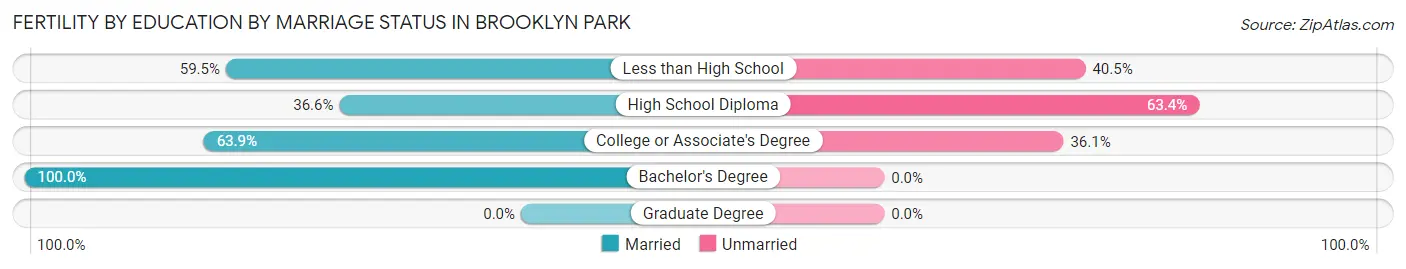
| Educational Attainment | Married | Unmarried |
| Less than High School | 44 (59.5%) | 30 (40.5%) |
| High School Diploma | 15 (36.6%) | 26 (63.4%) |
| College or Associate's Degree | 23 (63.9%) | 13 (36.1%) |
| Bachelor's Degree | 26 (100.0%) | 0 (0.0%) |
| Graduate Degree | 0 (0.0%) | 0 (0.0%) |
| Total | 108 (61.0%) | 69 (39.0%) |
Employment Characteristics in Brooklyn Park
Employment by Class of Employer in Brooklyn Park
Among the 7,264 employed individuals in Brooklyn Park, private company employees (4,844 | 66.7%), local government employees (615 | 8.5%), and federal government employees (566 | 7.8%) make up the most common classes of employment.
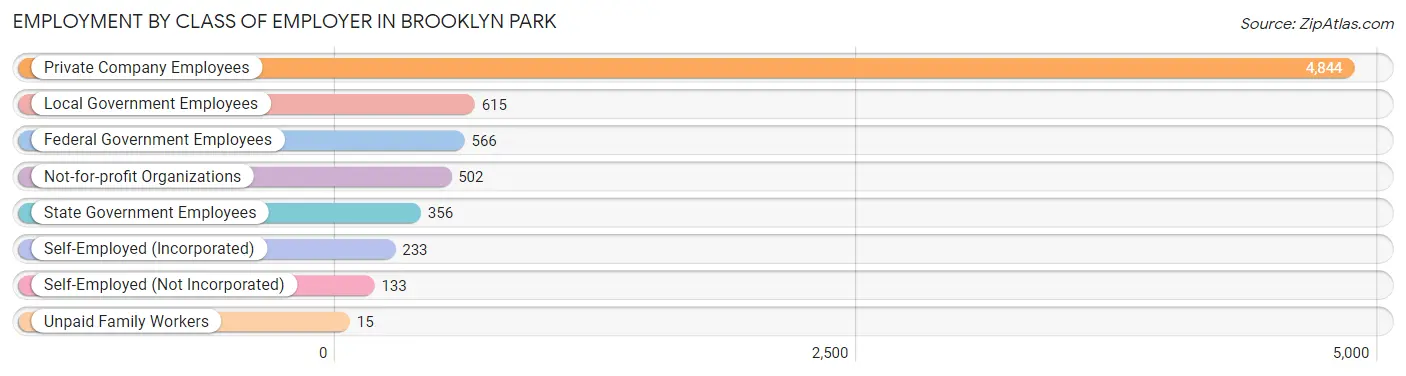
| Employer Class | # Employees | % Employees |
| Private Company Employees | 4,844 | 66.7% |
| Self-Employed (Incorporated) | 233 | 3.2% |
| Self-Employed (Not Incorporated) | 133 | 1.8% |
| Not-for-profit Organizations | 502 | 6.9% |
| Local Government Employees | 615 | 8.5% |
| State Government Employees | 356 | 4.9% |
| Federal Government Employees | 566 | 7.8% |
| Unpaid Family Workers | 15 | 0.2% |
| Total | 7,264 | 100.0% |
Employment Status by Age in Brooklyn Park
According to the labor force statistics for Brooklyn Park, out of the total population over 16 years of age (12,716), 60.3% or 7,668 individuals are in the labor force, with 4.0% or 307 of them unemployed. The age group with the highest labor force participation rate is 30 to 34 years, with 97.8% or 782 individuals in the labor force. Within the labor force, the 65 to 74 years age range has the highest percentage of unemployed individuals, with 13.6% or 32 of them being unemployed.
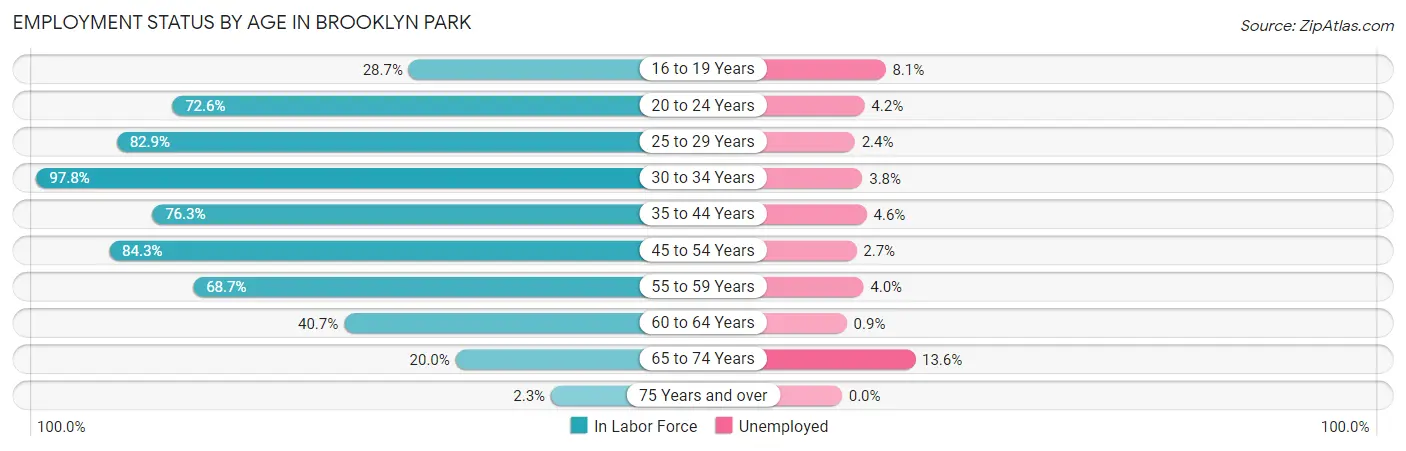
| Age Bracket | In Labor Force | Unemployed |
| 16 to 19 Years | 246 (28.7%) | 20 (8.1%) |
| 20 to 24 Years | 812 (72.6%) | 34 (4.2%) |
| 25 to 29 Years | 638 (82.9%) | 15 (2.4%) |
| 30 to 34 Years | 782 (97.8%) | 30 (3.8%) |
| 35 to 44 Years | 1,956 (76.3%) | 90 (4.6%) |
| 45 to 54 Years | 1,623 (84.3%) | 44 (2.7%) |
| 55 to 59 Years | 899 (68.7%) | 36 (4.0%) |
| 60 to 64 Years | 453 (40.7%) | 4 (0.9%) |
| 65 to 74 Years | 235 (20.0%) | 32 (13.6%) |
| 75 Years and over | 25 (2.3%) | 0 (0.0%) |
| Total | 7,668 (60.3%) | 307 (4.0%) |
Employment Status by Educational Attainment in Brooklyn Park
According to labor force statistics for Brooklyn Park, 74.9% of individuals (6,352) out of the total population between 25 and 64 years of age (8,481) are in the labor force, with 3.4% or 216 of them being unemployed. The group with the highest labor force participation rate are those with the educational attainment of bachelor's degree or higher, with 86.1% or 1,304 individuals in the labor force. Within the labor force, individuals with college / associate degree education have the highest percentage of unemployment, with 4.7% or 92 of them being unemployed.
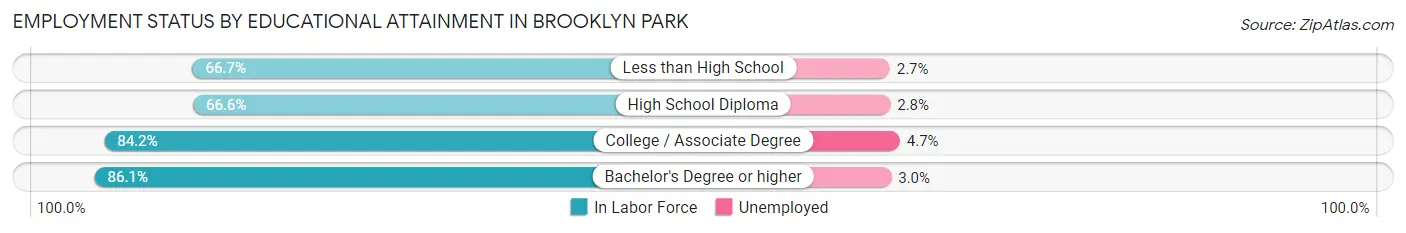
| Educational Attainment | In Labor Force | Unemployed |
| Less than High School | 957 (66.7%) | 39 (2.7%) |
| High School Diploma | 2,141 (66.6%) | 90 (2.8%) |
| College / Associate Degree | 1,951 (84.2%) | 109 (4.7%) |
| Bachelor's Degree or higher | 1,304 (86.1%) | 45 (3.0%) |
| Total | 6,352 (74.9%) | 288 (3.4%) |
Employment Occupations by Sex in Brooklyn Park
Management, Business, Science and Arts Occupations
The most common Management, Business, Science and Arts occupations in Brooklyn Park are Community & Social Service (681 | 9.4%), Management (552 | 7.6%), Computers, Engineering & Science (486 | 6.7%), Business & Financial (449 | 6.2%), and Education Instruction & Library (427 | 5.9%).
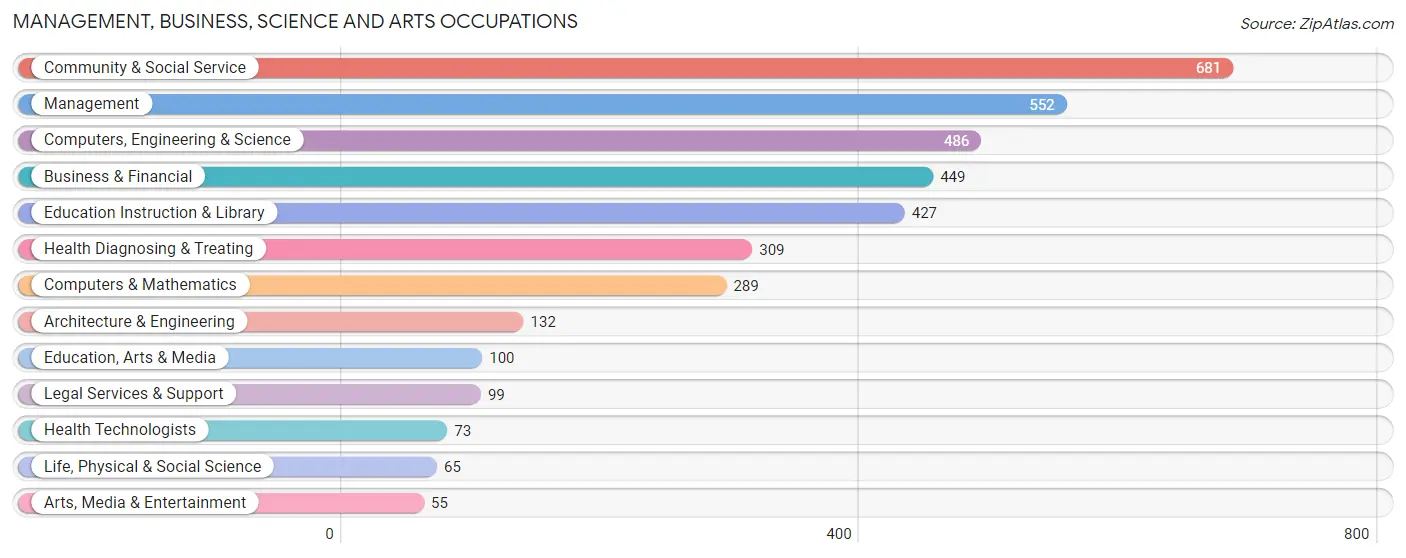
Management, Business, Science and Arts Occupations by Sex
Within the Management, Business, Science and Arts occupations in Brooklyn Park, the most male-oriented occupations are Architecture & Engineering (91.7%), Education, Arts & Media (91.0%), and Arts, Media & Entertainment (89.1%), while the most female-oriented occupations are Life, Physical & Social Science (100.0%), Health Technologists (100.0%), and Health Diagnosing & Treating (92.2%).
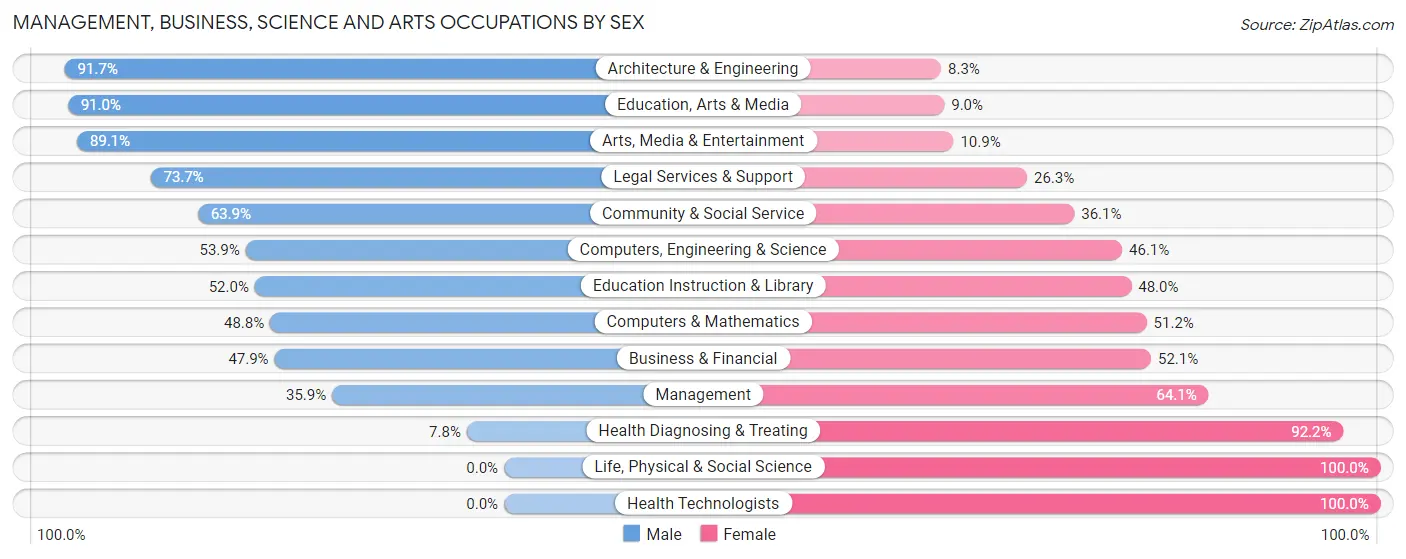
| Occupation | Male | Female |
| Management | 198 (35.9%) | 354 (64.1%) |
| Business & Financial | 215 (47.9%) | 234 (52.1%) |
| Computers, Engineering & Science | 262 (53.9%) | 224 (46.1%) |
| Computers & Mathematics | 141 (48.8%) | 148 (51.2%) |
| Architecture & Engineering | 121 (91.7%) | 11 (8.3%) |
| Life, Physical & Social Science | 0 (0.0%) | 65 (100.0%) |
| Community & Social Service | 435 (63.9%) | 246 (36.1%) |
| Education, Arts & Media | 91 (91.0%) | 9 (9.0%) |
| Legal Services & Support | 73 (73.7%) | 26 (26.3%) |
| Education Instruction & Library | 222 (52.0%) | 205 (48.0%) |
| Arts, Media & Entertainment | 49 (89.1%) | 6 (10.9%) |
| Health Diagnosing & Treating | 24 (7.8%) | 285 (92.2%) |
| Health Technologists | 0 (0.0%) | 73 (100.0%) |
| Total (Category) | 1,134 (45.8%) | 1,343 (54.2%) |
| Total (Overall) | 3,997 (55.2%) | 3,246 (44.8%) |
Services Occupations
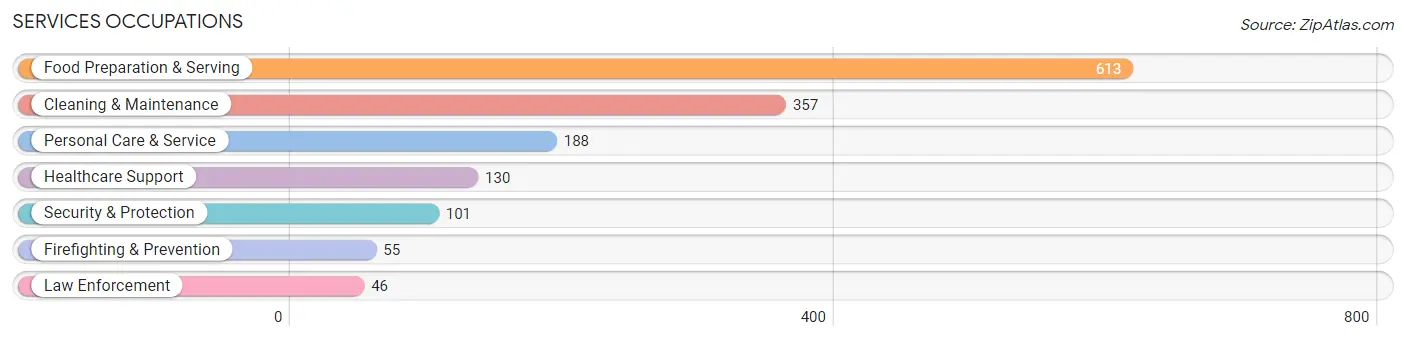
The most common Services occupations in Brooklyn Park are Food Preparation & Serving (613 | 8.5%), Cleaning & Maintenance (357 | 4.9%), Personal Care & Service (188 | 2.6%), Healthcare Support (130 | 1.8%), and Security & Protection (101 | 1.4%).
Services Occupations by Sex
Within the Services occupations in Brooklyn Park, the most male-oriented occupations are Law Enforcement (78.3%), Security & Protection (70.3%), and Firefighting & Prevention (63.6%), while the most female-oriented occupations are Healthcare Support (77.7%), Personal Care & Service (73.4%), and Cleaning & Maintenance (56.3%).
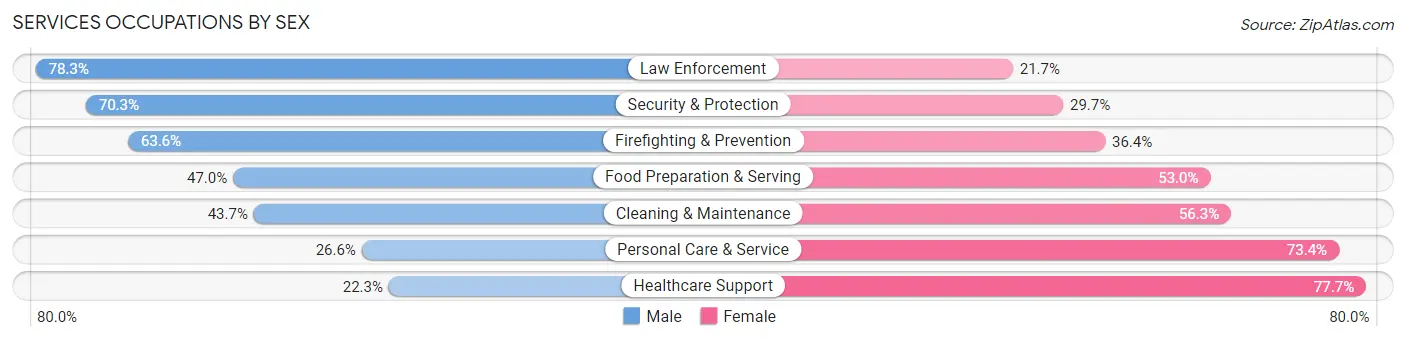
| Occupation | Male | Female |
| Healthcare Support | 29 (22.3%) | 101 (77.7%) |
| Security & Protection | 71 (70.3%) | 30 (29.7%) |
| Firefighting & Prevention | 35 (63.6%) | 20 (36.4%) |
| Law Enforcement | 36 (78.3%) | 10 (21.7%) |
| Food Preparation & Serving | 288 (47.0%) | 325 (53.0%) |
| Cleaning & Maintenance | 156 (43.7%) | 201 (56.3%) |
| Personal Care & Service | 50 (26.6%) | 138 (73.4%) |
| Total (Category) | 594 (42.8%) | 795 (57.2%) |
| Total (Overall) | 3,997 (55.2%) | 3,246 (44.8%) |
Sales and Office Occupations
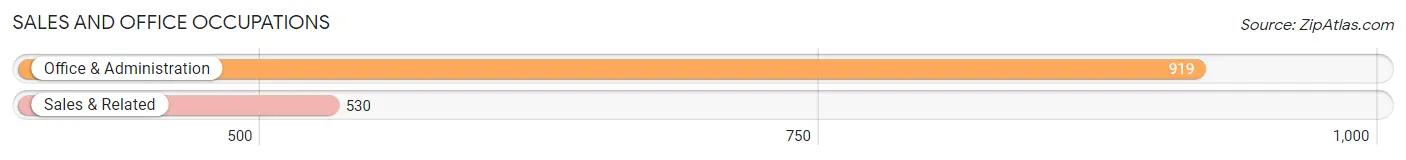
The most common Sales and Office occupations in Brooklyn Park are Office & Administration (919 | 12.7%), and Sales & Related (530 | 7.3%).
Sales and Office Occupations by Sex
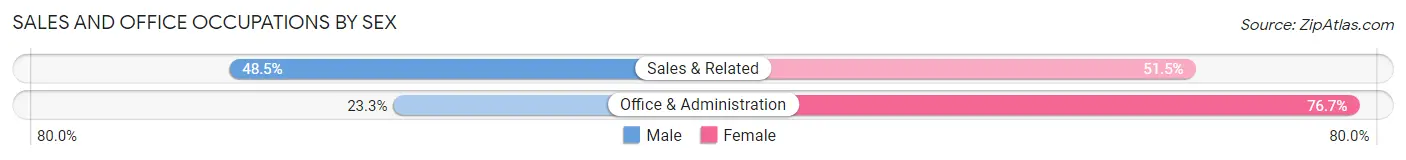
| Occupation | Male | Female |
| Sales & Related | 257 (48.5%) | 273 (51.5%) |
| Office & Administration | 214 (23.3%) | 705 (76.7%) |
| Total (Category) | 471 (32.5%) | 978 (67.5%) |
| Total (Overall) | 3,997 (55.2%) | 3,246 (44.8%) |
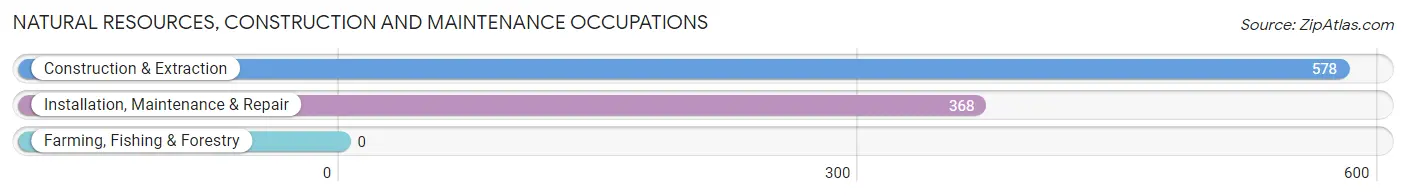
Natural Resources, Construction and Maintenance Occupations
The most common Natural Resources, Construction and Maintenance occupations in Brooklyn Park are Construction & Extraction (578 | 8.0%), and Installation, Maintenance & Repair (368 | 5.1%).
Natural Resources, Construction and Maintenance Occupations by Sex
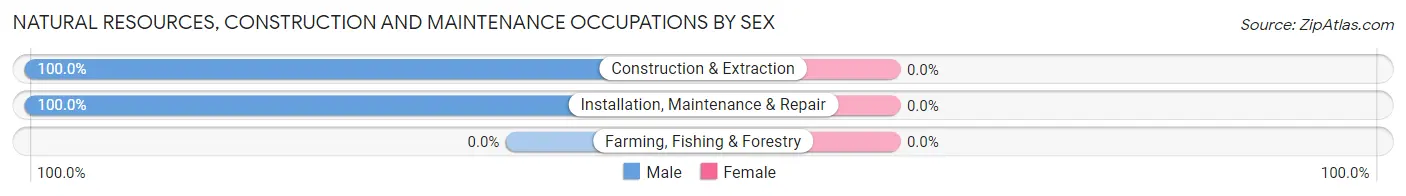
| Occupation | Male | Female |
| Farming, Fishing & Forestry | 0 (0.0%) | 0 (0.0%) |
| Construction & Extraction | 578 (100.0%) | 0 (0.0%) |
| Installation, Maintenance & Repair | 368 (100.0%) | 0 (0.0%) |
| Total (Category) | 946 (100.0%) | 0 (0.0%) |
| Total (Overall) | 3,997 (55.2%) | 3,246 (44.8%) |
Production, Transportation and Moving Occupations
The most common Production, Transportation and Moving occupations in Brooklyn Park are Transportation (390 | 5.4%), Material Moving (310 | 4.3%), and Production (282 | 3.9%).
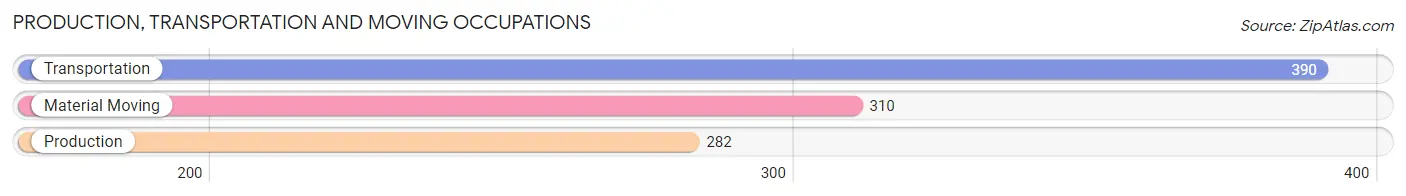
Production, Transportation and Moving Occupations by Sex
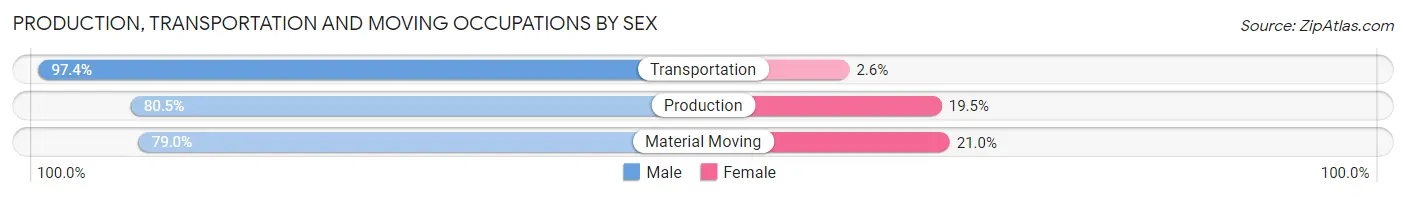
| Occupation | Male | Female |
| Production | 227 (80.5%) | 55 (19.5%) |
| Transportation | 380 (97.4%) | 10 (2.6%) |
| Material Moving | 245 (79.0%) | 65 (21.0%) |
| Total (Category) | 852 (86.8%) | 130 (13.2%) |
| Total (Overall) | 3,997 (55.2%) | 3,246 (44.8%) |
Employment Industries by Sex in Brooklyn Park
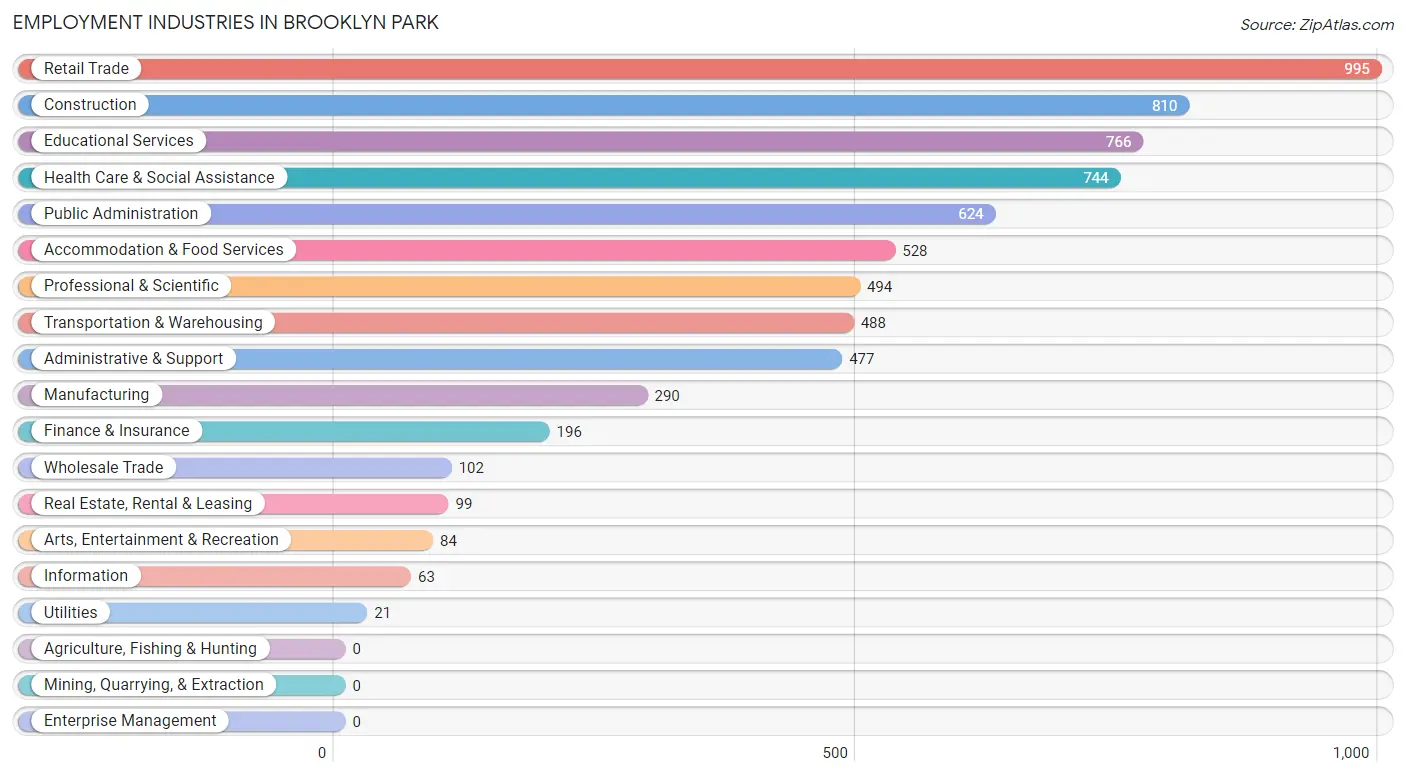
Employment Industries in Brooklyn Park
The major employment industries in Brooklyn Park include Retail Trade (995 | 13.7%), Construction (810 | 11.2%), Educational Services (766 | 10.6%), Health Care & Social Assistance (744 | 10.3%), and Public Administration (624 | 8.6%).
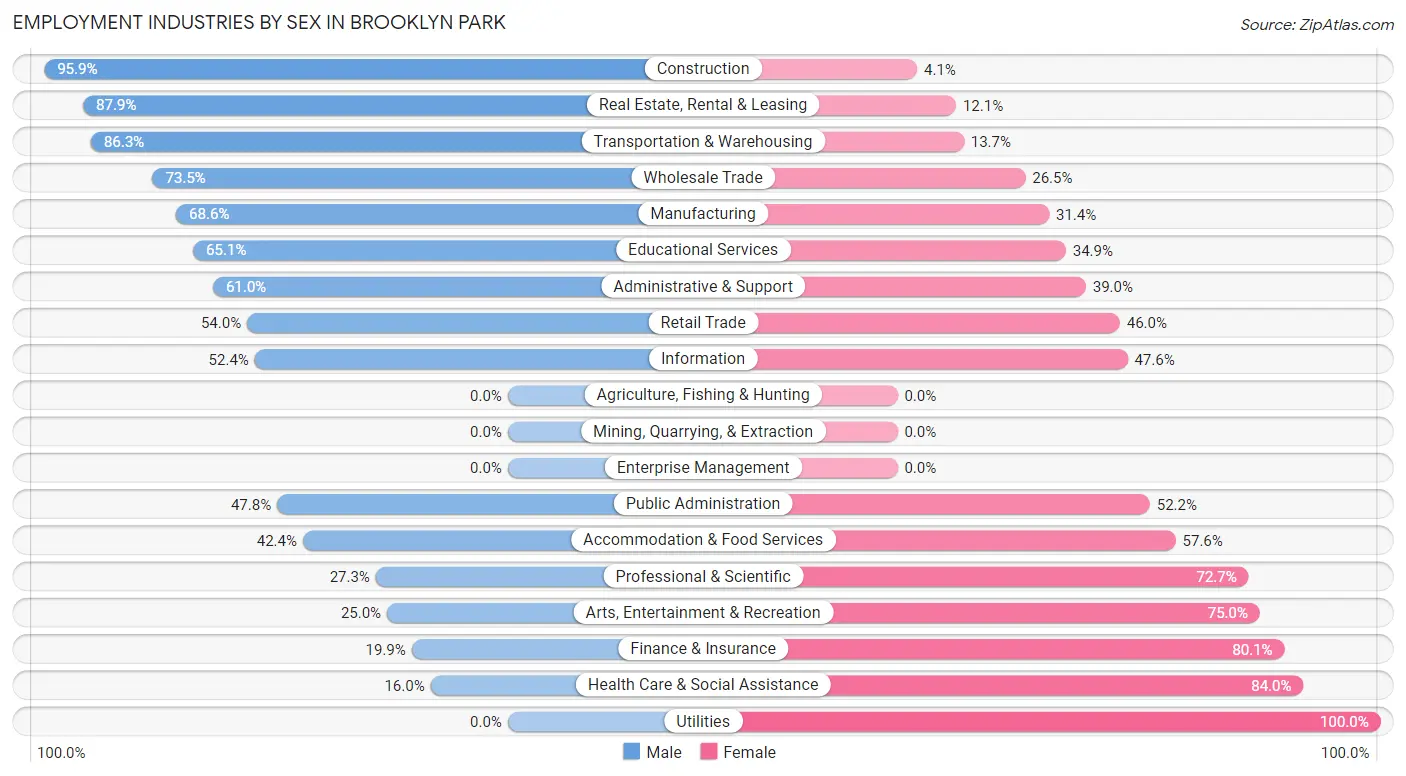
Employment Industries by Sex in Brooklyn Park
The Brooklyn Park industries that see more men than women are Construction (95.9%), Real Estate, Rental & Leasing (87.9%), and Transportation & Warehousing (86.3%), whereas the industries that tend to have a higher number of women are Utilities (100.0%), Health Care & Social Assistance (84.0%), and Finance & Insurance (80.1%).
| Industry | Male | Female |
| Agriculture, Fishing & Hunting | 0 (0.0%) | 0 (0.0%) |
| Mining, Quarrying, & Extraction | 0 (0.0%) | 0 (0.0%) |
| Construction | 777 (95.9%) | 33 (4.1%) |
| Manufacturing | 199 (68.6%) | 91 (31.4%) |
| Wholesale Trade | 75 (73.5%) | 27 (26.5%) |
| Retail Trade | 537 (54.0%) | 458 (46.0%) |
| Transportation & Warehousing | 421 (86.3%) | 67 (13.7%) |
| Utilities | 0 (0.0%) | 21 (100.0%) |
| Information | 33 (52.4%) | 30 (47.6%) |
| Finance & Insurance | 39 (19.9%) | 157 (80.1%) |
| Real Estate, Rental & Leasing | 87 (87.9%) | 12 (12.1%) |
| Professional & Scientific | 135 (27.3%) | 359 (72.7%) |
| Enterprise Management | 0 (0.0%) | 0 (0.0%) |
| Administrative & Support | 291 (61.0%) | 186 (39.0%) |
| Educational Services | 499 (65.1%) | 267 (34.9%) |
| Health Care & Social Assistance | 119 (16.0%) | 625 (84.0%) |
| Arts, Entertainment & Recreation | 21 (25.0%) | 63 (75.0%) |
| Accommodation & Food Services | 224 (42.4%) | 304 (57.6%) |
| Public Administration | 298 (47.8%) | 326 (52.2%) |
| Total | 3,997 (55.2%) | 3,246 (44.8%) |
Education in Brooklyn Park
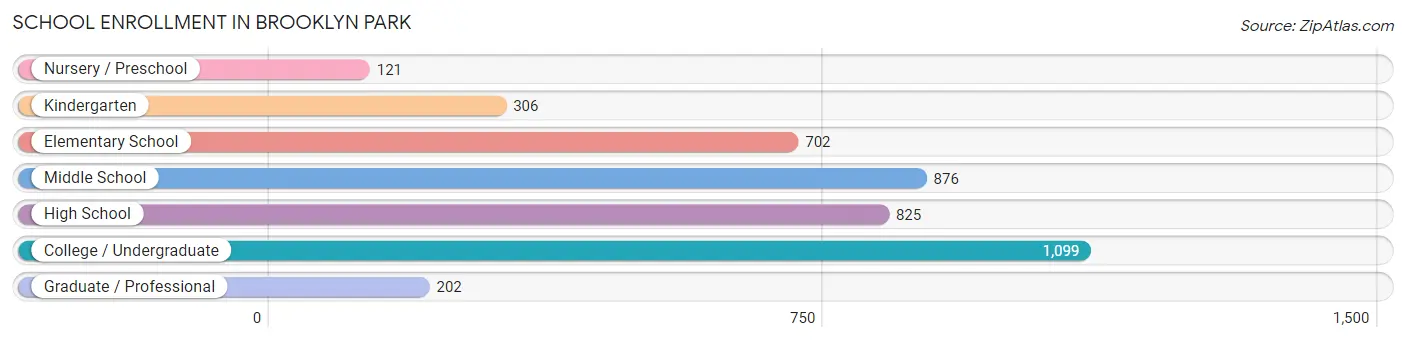
School Enrollment in Brooklyn Park
The most common levels of schooling among the 4,131 students in Brooklyn Park are college / undergraduate (1,099 | 26.6%), middle school (876 | 21.2%), and high school (825 | 20.0%).
| School Level | # Students | % Students |
| Nursery / Preschool | 121 | 2.9% |
| Kindergarten | 306 | 7.4% |
| Elementary School | 702 | 17.0% |
| Middle School | 876 | 21.2% |
| High School | 825 | 20.0% |
| College / Undergraduate | 1,099 | 26.6% |
| Graduate / Professional | 202 | 4.9% |
| Total | 4,131 | 100.0% |
School Enrollment by Age by Funding Source in Brooklyn Park
Out of a total of 4,131 students who are enrolled in schools in Brooklyn Park, 351 (8.5%) attend a private institution, while the remaining 3,780 (91.5%) are enrolled in public schools. The age group of 35 years and over has the highest likelihood of being enrolled in private schools, with 52 (17.7% in the age bracket) enrolled. Conversely, the age group of 10 to 14 year olds has the lowest likelihood of being enrolled in a private school, with 958 (98.3% in the age bracket) attending a public institution.
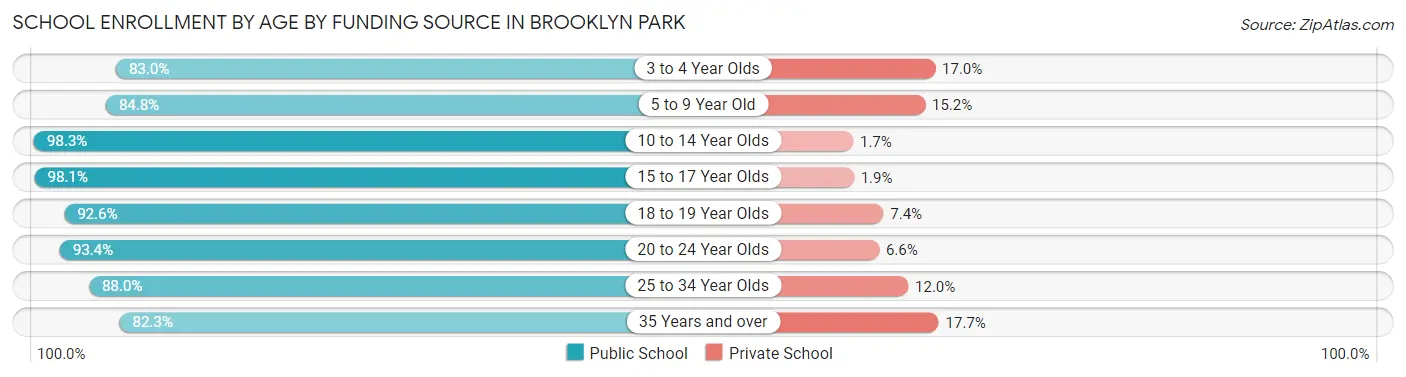
| Age Bracket | Public School | Private School |
| 3 to 4 Year Olds | 190 (83.0%) | 39 (17.0%) |
| 5 to 9 Year Old | 750 (84.8%) | 134 (15.2%) |
| 10 to 14 Year Olds | 958 (98.3%) | 17 (1.7%) |
| 15 to 17 Year Olds | 525 (98.1%) | 10 (1.9%) |
| 18 to 19 Year Olds | 376 (92.6%) | 30 (7.4%) |
| 20 to 24 Year Olds | 498 (93.4%) | 35 (6.6%) |
| 25 to 34 Year Olds | 242 (88.0%) | 33 (12.0%) |
| 35 Years and over | 242 (82.3%) | 52 (17.7%) |
| Total | 3,780 (91.5%) | 351 (8.5%) |
Educational Attainment by Field of Study in Brooklyn Park
Business (327 | 17.3%), education (218 | 11.5%), social sciences (193 | 10.2%), science & technology (154 | 8.2%), and communications (150 | 7.9%) are the most common fields of study among 1,890 individuals in Brooklyn Park who have obtained a bachelor's degree or higher.
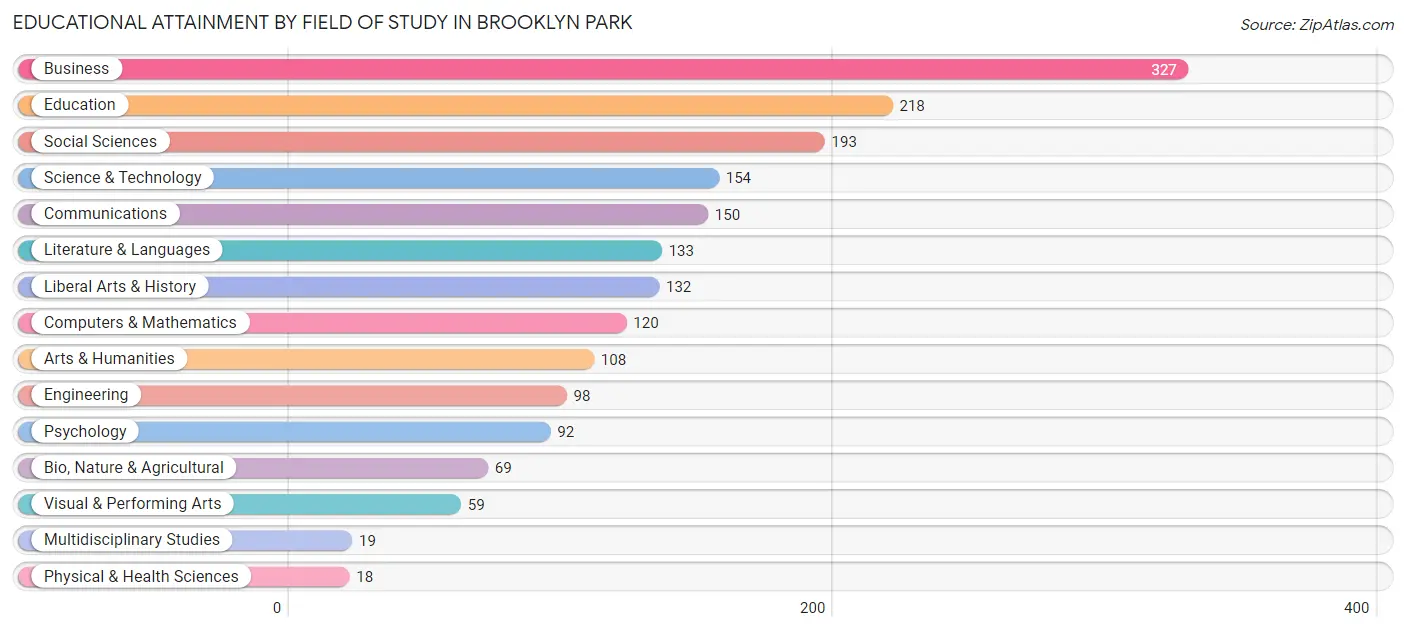
| Field of Study | # Graduates | % Graduates |
| Computers & Mathematics | 120 | 6.4% |
| Bio, Nature & Agricultural | 69 | 3.6% |
| Physical & Health Sciences | 18 | 0.9% |
| Psychology | 92 | 4.9% |
| Social Sciences | 193 | 10.2% |
| Engineering | 98 | 5.2% |
| Multidisciplinary Studies | 19 | 1.0% |
| Science & Technology | 154 | 8.2% |
| Business | 327 | 17.3% |
| Education | 218 | 11.5% |
| Literature & Languages | 133 | 7.0% |
| Liberal Arts & History | 132 | 7.0% |
| Visual & Performing Arts | 59 | 3.1% |
| Communications | 150 | 7.9% |
| Arts & Humanities | 108 | 5.7% |
| Total | 1,890 | 100.0% |
Transportation & Commute in Brooklyn Park
Vehicle Availability by Sex in Brooklyn Park
The most prevalent vehicle ownership categories in Brooklyn Park are males with 2 vehicles (1,613, accounting for 40.0%) and females with 2 vehicles (1,475, making up 50.0%).
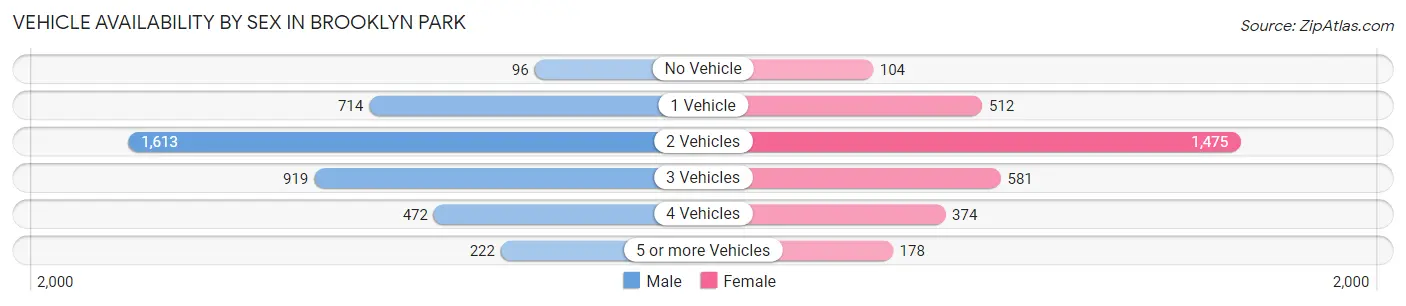
| Vehicles Available | Male | Female |
| No Vehicle | 96 (2.4%) | 104 (3.2%) |
| 1 Vehicle | 714 (17.7%) | 512 (15.9%) |
| 2 Vehicles | 1,613 (40.0%) | 1,475 (45.8%) |
| 3 Vehicles | 919 (22.8%) | 581 (18.0%) |
| 4 Vehicles | 472 (11.7%) | 374 (11.6%) |
| 5 or more Vehicles | 222 (5.5%) | 178 (5.5%) |
| Total | 4,036 (100.0%) | 3,224 (100.0%) |
Commute Time in Brooklyn Park
The most frequently occuring commute durations in Brooklyn Park are 15 to 19 minutes (1,280 commuters, 18.5%), 30 to 34 minutes (1,244 commuters, 18.0%), and 10 to 14 minutes (1,061 commuters, 15.4%).
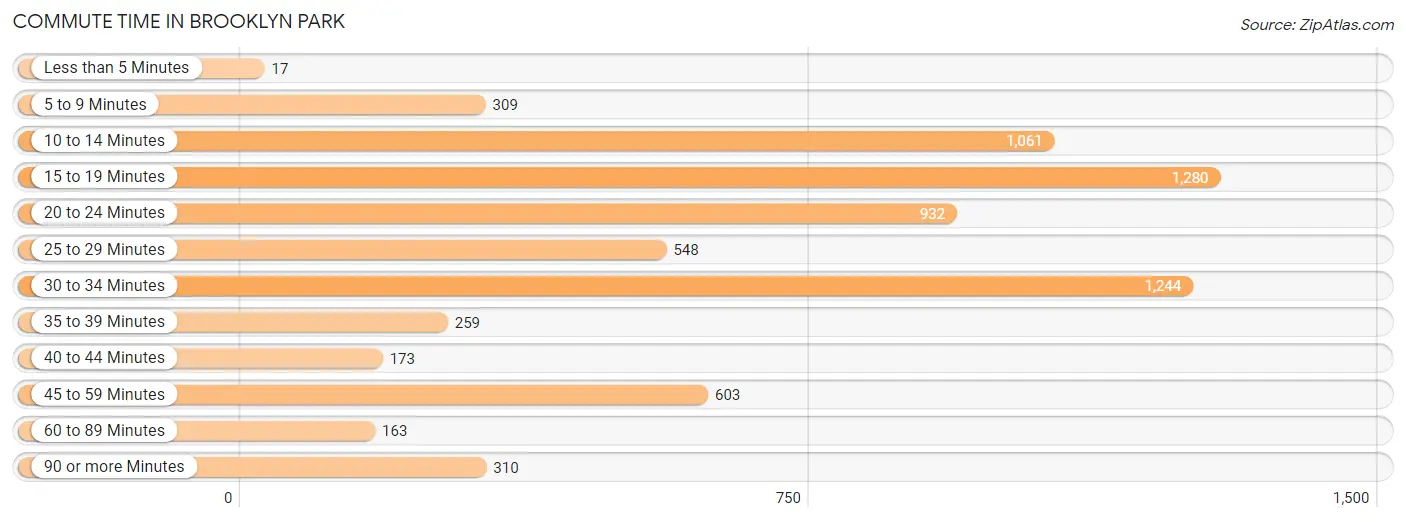
| Commute Time | # Commuters | % Commuters |
| Less than 5 Minutes | 17 | 0.3% |
| 5 to 9 Minutes | 309 | 4.5% |
| 10 to 14 Minutes | 1,061 | 15.4% |
| 15 to 19 Minutes | 1,280 | 18.5% |
| 20 to 24 Minutes | 932 | 13.5% |
| 25 to 29 Minutes | 548 | 7.9% |
| 30 to 34 Minutes | 1,244 | 18.0% |
| 35 to 39 Minutes | 259 | 3.7% |
| 40 to 44 Minutes | 173 | 2.5% |
| 45 to 59 Minutes | 603 | 8.7% |
| 60 to 89 Minutes | 163 | 2.4% |
| 90 or more Minutes | 310 | 4.5% |
Commute Time by Sex in Brooklyn Park
The most common commute times in Brooklyn Park are 15 to 19 minutes (881 commuters, 23.1%) for males and 30 to 34 minutes (498 commuters, 16.2%) for females.
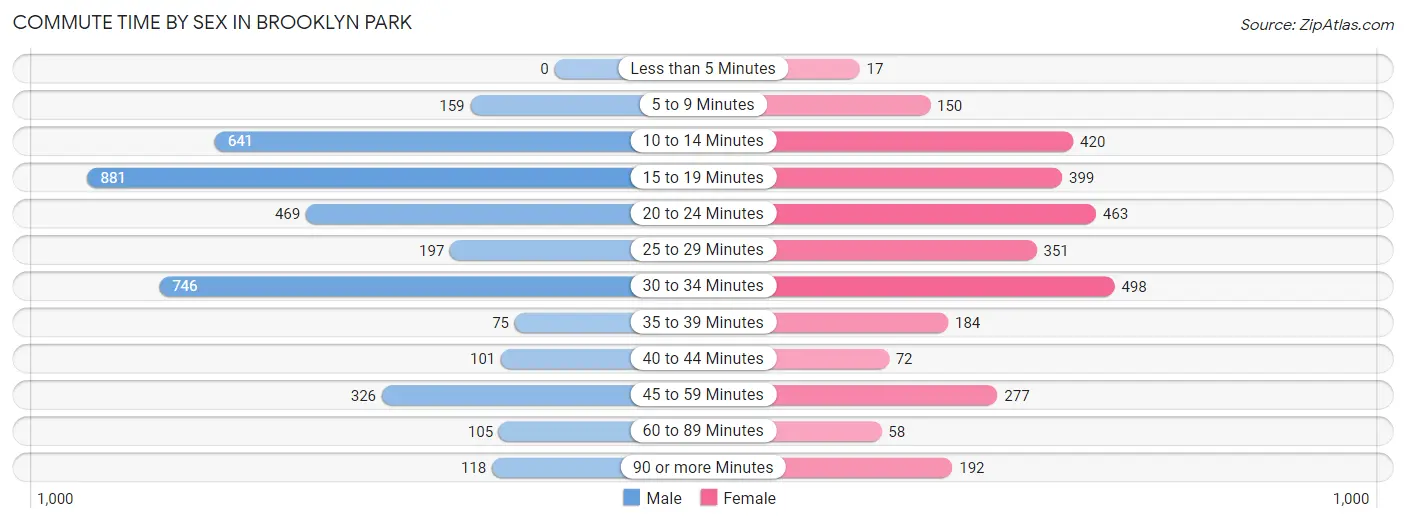
| Commute Time | Male | Female |
| Less than 5 Minutes | 0 (0.0%) | 17 (0.5%) |
| 5 to 9 Minutes | 159 (4.2%) | 150 (4.9%) |
| 10 to 14 Minutes | 641 (16.8%) | 420 (13.6%) |
| 15 to 19 Minutes | 881 (23.1%) | 399 (13.0%) |
| 20 to 24 Minutes | 469 (12.3%) | 463 (15.0%) |
| 25 to 29 Minutes | 197 (5.2%) | 351 (11.4%) |
| 30 to 34 Minutes | 746 (19.5%) | 498 (16.2%) |
| 35 to 39 Minutes | 75 (2.0%) | 184 (6.0%) |
| 40 to 44 Minutes | 101 (2.6%) | 72 (2.3%) |
| 45 to 59 Minutes | 326 (8.5%) | 277 (9.0%) |
| 60 to 89 Minutes | 105 (2.8%) | 58 (1.9%) |
| 90 or more Minutes | 118 (3.1%) | 192 (6.2%) |
Time of Departure to Work by Sex in Brooklyn Park
The most frequent times of departure to work in Brooklyn Park are 7:00 AM to 7:29 AM (580, 15.2%) for males and 6:30 AM to 6:59 AM (445, 14.4%) for females.
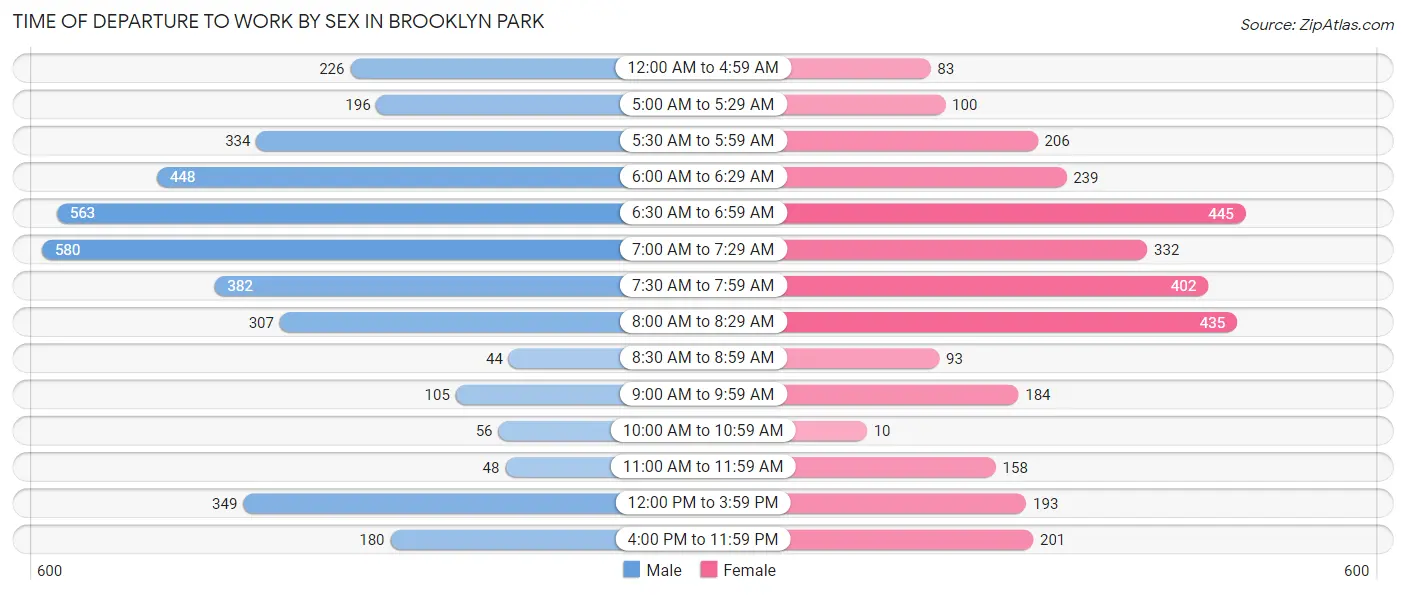
| Time of Departure | Male | Female |
| 12:00 AM to 4:59 AM | 226 (5.9%) | 83 (2.7%) |
| 5:00 AM to 5:29 AM | 196 (5.1%) | 100 (3.3%) |
| 5:30 AM to 5:59 AM | 334 (8.7%) | 206 (6.7%) |
| 6:00 AM to 6:29 AM | 448 (11.7%) | 239 (7.8%) |
| 6:30 AM to 6:59 AM | 563 (14.7%) | 445 (14.4%) |
| 7:00 AM to 7:29 AM | 580 (15.2%) | 332 (10.8%) |
| 7:30 AM to 7:59 AM | 382 (10.0%) | 402 (13.1%) |
| 8:00 AM to 8:29 AM | 307 (8.0%) | 435 (14.1%) |
| 8:30 AM to 8:59 AM | 44 (1.1%) | 93 (3.0%) |
| 9:00 AM to 9:59 AM | 105 (2.8%) | 184 (6.0%) |
| 10:00 AM to 10:59 AM | 56 (1.5%) | 10 (0.3%) |
| 11:00 AM to 11:59 AM | 48 (1.3%) | 158 (5.1%) |
| 12:00 PM to 3:59 PM | 349 (9.1%) | 193 (6.3%) |
| 4:00 PM to 11:59 PM | 180 (4.7%) | 201 (6.5%) |
| Total | 3,818 (100.0%) | 3,081 (100.0%) |
Housing Occupancy in Brooklyn Park
Occupancy by Ownership in Brooklyn Park
Of the total 5,495 dwellings in Brooklyn Park, owner-occupied units account for 4,465 (81.3%), while renter-occupied units make up 1,030 (18.7%).
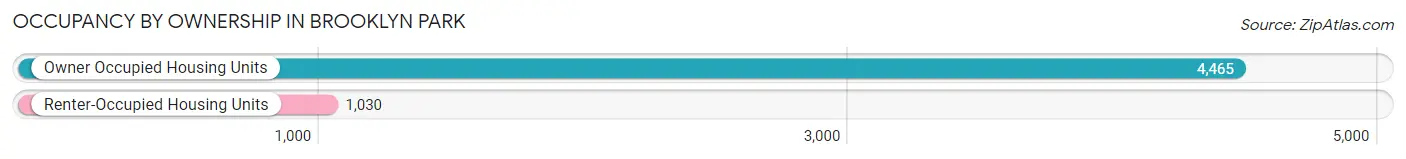
| Occupancy | # Housing Units | % Housing Units |
| Owner Occupied Housing Units | 4,465 | 81.3% |
| Renter-Occupied Housing Units | 1,030 | 18.7% |
| Total Occupied Housing Units | 5,495 | 100.0% |
Occupancy by Household Size in Brooklyn Park
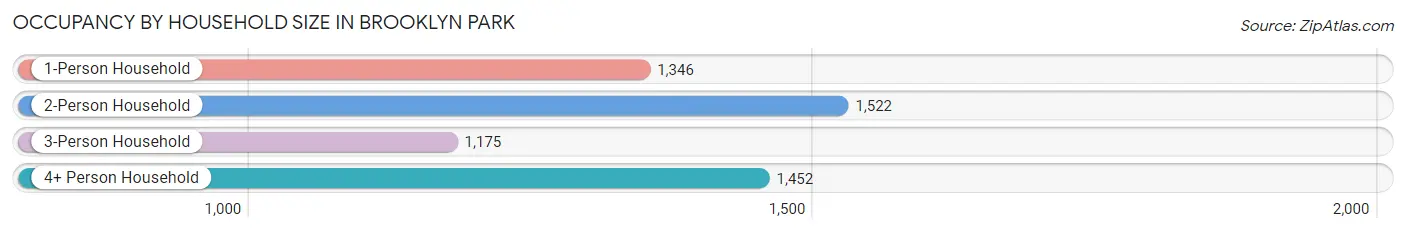
| Household Size | # Housing Units | % Housing Units |
| 1-Person Household | 1,346 | 24.5% |
| 2-Person Household | 1,522 | 27.7% |
| 3-Person Household | 1,175 | 21.4% |
| 4+ Person Household | 1,452 | 26.4% |
| Total Housing Units | 5,495 | 100.0% |
Occupancy by Ownership by Household Size in Brooklyn Park
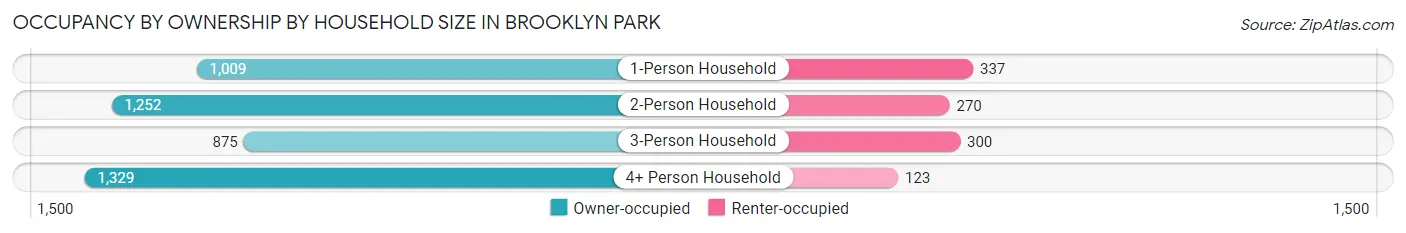
| Household Size | Owner-occupied | Renter-occupied |
| 1-Person Household | 1,009 (75.0%) | 337 (25.0%) |
| 2-Person Household | 1,252 (82.3%) | 270 (17.7%) |
| 3-Person Household | 875 (74.5%) | 300 (25.5%) |
| 4+ Person Household | 1,329 (91.5%) | 123 (8.5%) |
| Total Housing Units | 4,465 (81.3%) | 1,030 (18.7%) |
Occupancy by Educational Attainment in Brooklyn Park
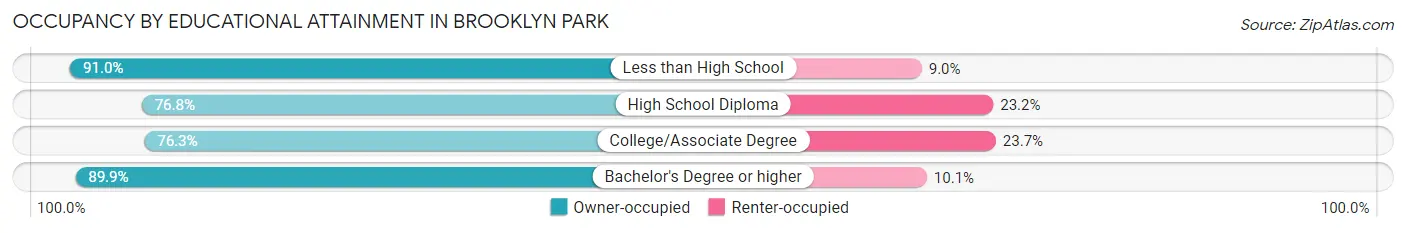
| Household Size | Owner-occupied | Renter-occupied |
| Less than High School | 805 (91.0%) | 80 (9.0%) |
| High School Diploma | 1,471 (76.8%) | 445 (23.2%) |
| College/Associate Degree | 1,304 (76.3%) | 406 (23.7%) |
| Bachelor's Degree or higher | 885 (89.9%) | 99 (10.1%) |
Occupancy by Age of Householder in Brooklyn Park
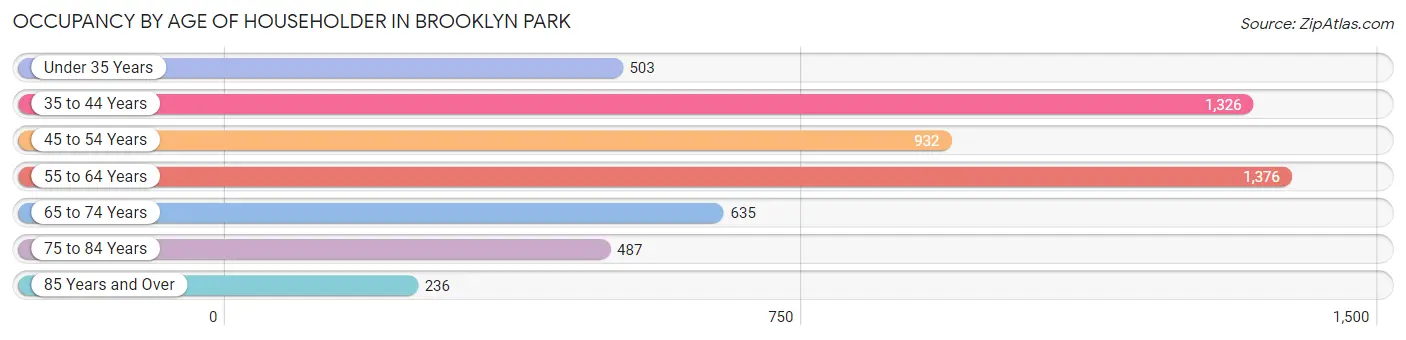
| Age Bracket | # Households | % Households |
| Under 35 Years | 503 | 9.1% |
| 35 to 44 Years | 1,326 | 24.1% |
| 45 to 54 Years | 932 | 17.0% |
| 55 to 64 Years | 1,376 | 25.0% |
| 65 to 74 Years | 635 | 11.6% |
| 75 to 84 Years | 487 | 8.9% |
| 85 Years and Over | 236 | 4.3% |
| Total | 5,495 | 100.0% |
Housing Finances in Brooklyn Park
Median Income by Occupancy in Brooklyn Park
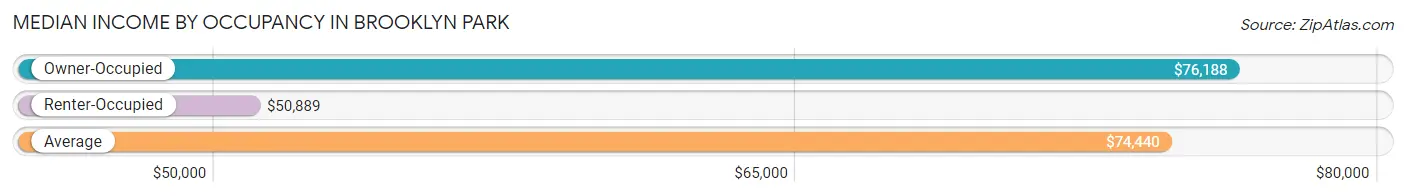
| Occupancy Type | # Households | Median Income |
| Owner-Occupied | 4,465 (81.3%) | $76,188 |
| Renter-Occupied | 1,030 (18.7%) | $50,889 |
| Average | 5,495 (100.0%) | $74,440 |
Occupancy by Householder Income Bracket in Brooklyn Park
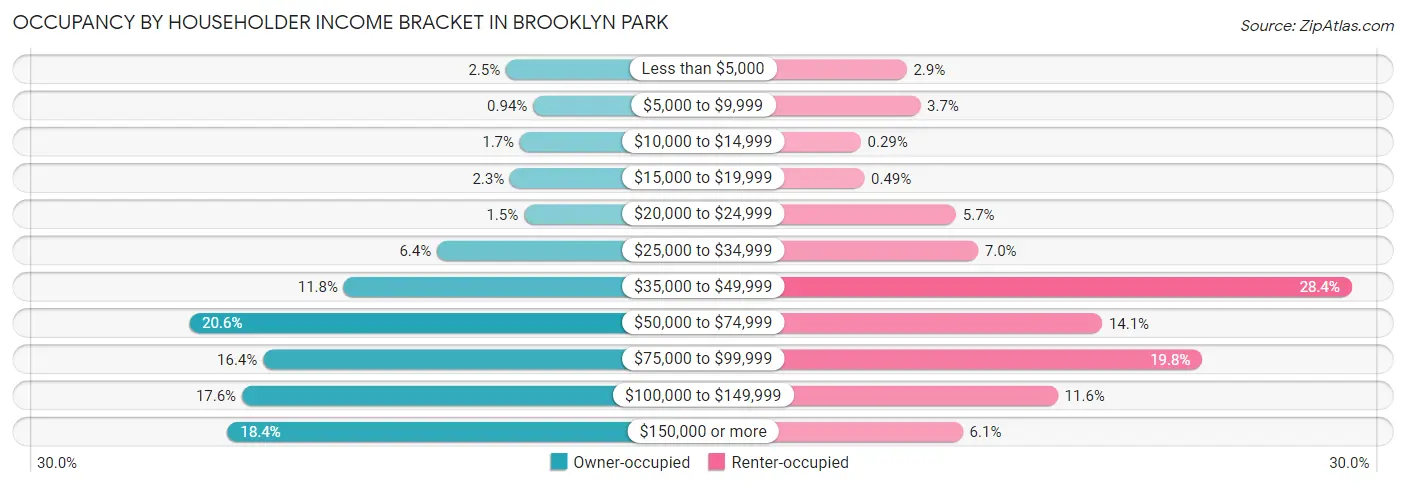
| Income Bracket | Owner-occupied | Renter-occupied |
| Less than $5,000 | 111 (2.5%) | 30 (2.9%) |
| $5,000 to $9,999 | 42 (0.9%) | 38 (3.7%) |
| $10,000 to $14,999 | 76 (1.7%) | 3 (0.3%) |
| $15,000 to $19,999 | 101 (2.3%) | 5 (0.5%) |
| $20,000 to $24,999 | 65 (1.5%) | 59 (5.7%) |
| $25,000 to $34,999 | 287 (6.4%) | 72 (7.0%) |
| $35,000 to $49,999 | 525 (11.8%) | 292 (28.3%) |
| $50,000 to $74,999 | 920 (20.6%) | 145 (14.1%) |
| $75,000 to $99,999 | 731 (16.4%) | 204 (19.8%) |
| $100,000 to $149,999 | 785 (17.6%) | 119 (11.6%) |
| $150,000 or more | 822 (18.4%) | 63 (6.1%) |
| Total | 4,465 (100.0%) | 1,030 (100.0%) |
Monthly Housing Cost Tiers in Brooklyn Park
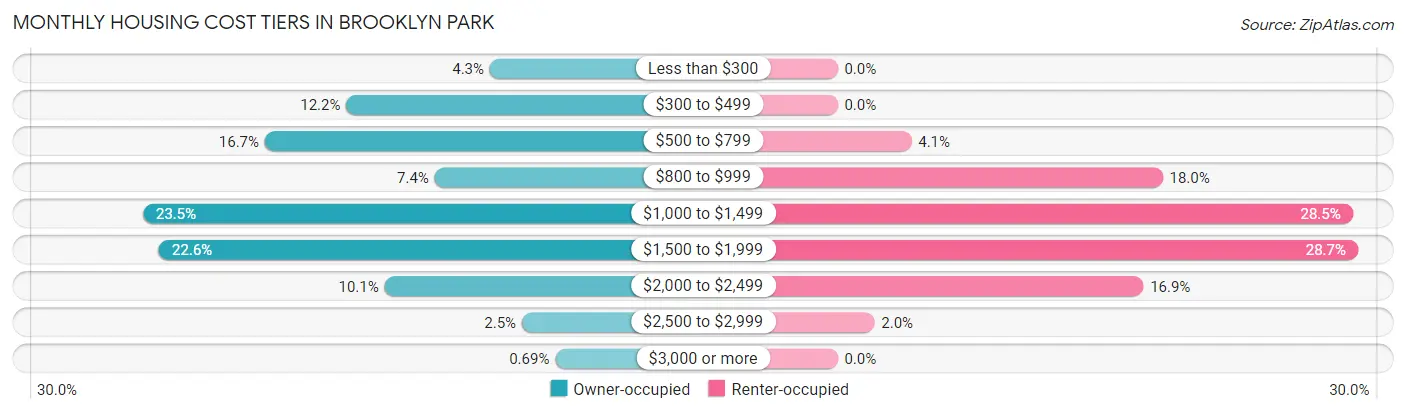
| Monthly Cost | Owner-occupied | Renter-occupied |
| Less than $300 | 192 (4.3%) | 0 (0.0%) |
| $300 to $499 | 546 (12.2%) | 0 (0.0%) |
| $500 to $799 | 747 (16.7%) | 42 (4.1%) |
| $800 to $999 | 328 (7.3%) | 185 (18.0%) |
| $1,000 to $1,499 | 1,048 (23.5%) | 293 (28.4%) |
| $1,500 to $1,999 | 1,008 (22.6%) | 296 (28.7%) |
| $2,000 to $2,499 | 452 (10.1%) | 174 (16.9%) |
| $2,500 to $2,999 | 113 (2.5%) | 21 (2.0%) |
| $3,000 or more | 31 (0.7%) | 0 (0.0%) |
| Total | 4,465 (100.0%) | 1,030 (100.0%) |
Physical Housing Characteristics in Brooklyn Park
Housing Structures in Brooklyn Park
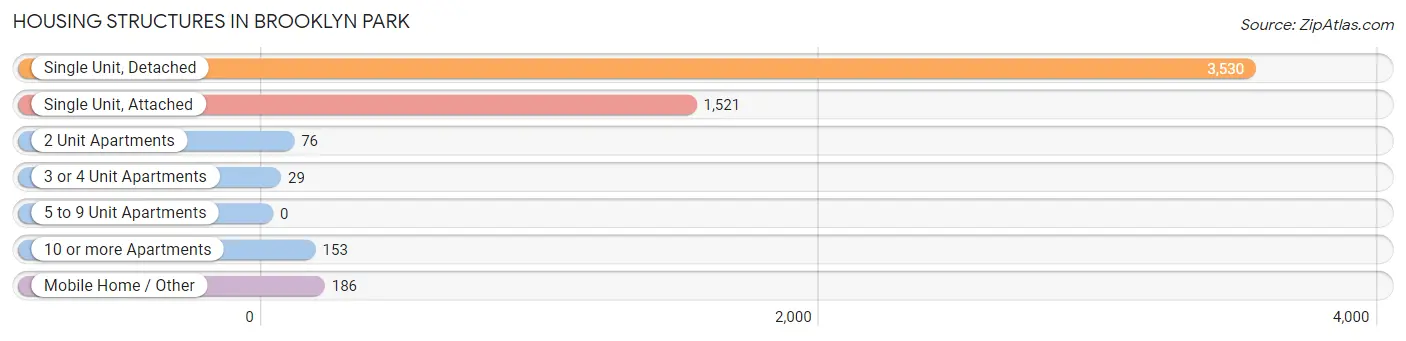
| Structure Type | # Housing Units | % Housing Units |
| Single Unit, Detached | 3,530 | 64.2% |
| Single Unit, Attached | 1,521 | 27.7% |
| 2 Unit Apartments | 76 | 1.4% |
| 3 or 4 Unit Apartments | 29 | 0.5% |
| 5 to 9 Unit Apartments | 0 | 0.0% |
| 10 or more Apartments | 153 | 2.8% |
| Mobile Home / Other | 186 | 3.4% |
| Total | 5,495 | 100.0% |
Housing Structures by Occupancy in Brooklyn Park
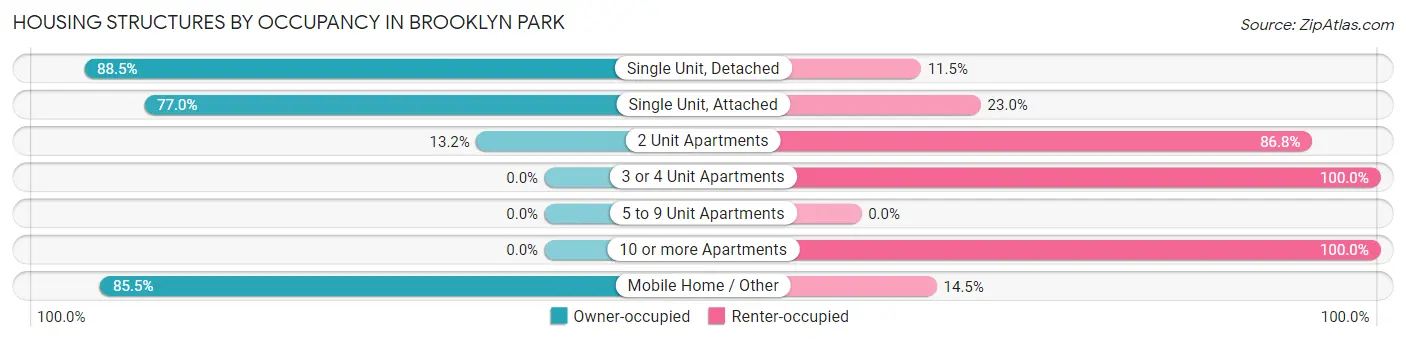
| Structure Type | Owner-occupied | Renter-occupied |
| Single Unit, Detached | 3,125 (88.5%) | 405 (11.5%) |
| Single Unit, Attached | 1,171 (77.0%) | 350 (23.0%) |
| 2 Unit Apartments | 10 (13.2%) | 66 (86.8%) |
| 3 or 4 Unit Apartments | 0 (0.0%) | 29 (100.0%) |
| 5 to 9 Unit Apartments | 0 (0.0%) | 0 (0.0%) |
| 10 or more Apartments | 0 (0.0%) | 153 (100.0%) |
| Mobile Home / Other | 159 (85.5%) | 27 (14.5%) |
| Total | 4,465 (81.3%) | 1,030 (18.7%) |
Housing Structures by Number of Rooms in Brooklyn Park
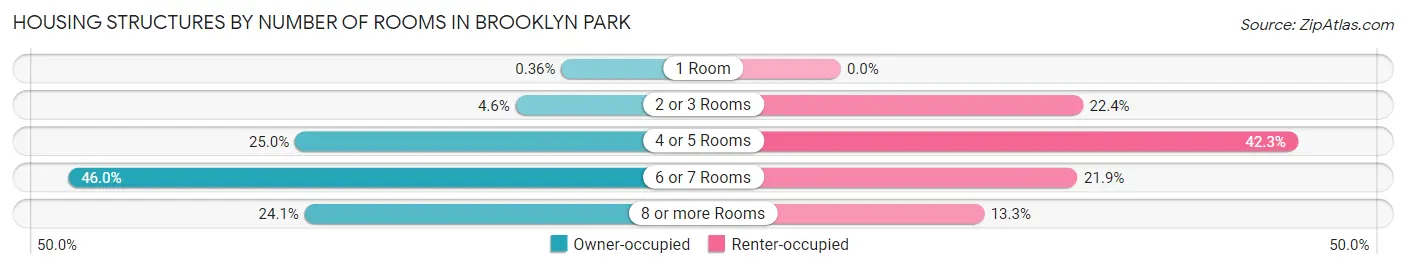
| Number of Rooms | Owner-occupied | Renter-occupied |
| 1 Room | 16 (0.4%) | 0 (0.0%) |
| 2 or 3 Rooms | 205 (4.6%) | 231 (22.4%) |
| 4 or 5 Rooms | 1,116 (25.0%) | 436 (42.3%) |
| 6 or 7 Rooms | 2,052 (46.0%) | 226 (21.9%) |
| 8 or more Rooms | 1,076 (24.1%) | 137 (13.3%) |
| Total | 4,465 (100.0%) | 1,030 (100.0%) |
Housing Structure by Heating Type in Brooklyn Park
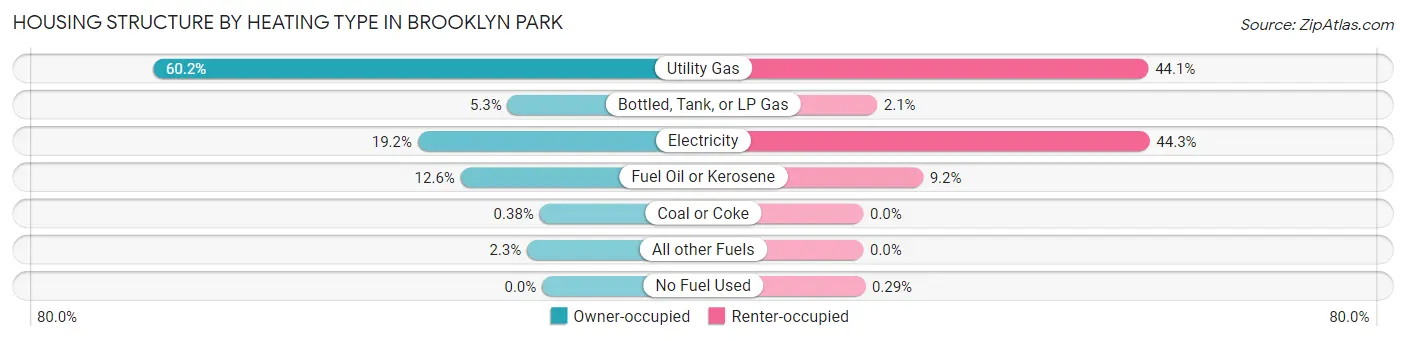
| Heating Type | Owner-occupied | Renter-occupied |
| Utility Gas | 2,686 (60.2%) | 454 (44.1%) |
| Bottled, Tank, or LP Gas | 238 (5.3%) | 22 (2.1%) |
| Electricity | 858 (19.2%) | 456 (44.3%) |
| Fuel Oil or Kerosene | 562 (12.6%) | 95 (9.2%) |
| Coal or Coke | 17 (0.4%) | 0 (0.0%) |
| All other Fuels | 104 (2.3%) | 0 (0.0%) |
| No Fuel Used | 0 (0.0%) | 3 (0.3%) |
| Total | 4,465 (100.0%) | 1,030 (100.0%) |
Household Vehicle Usage in Brooklyn Park
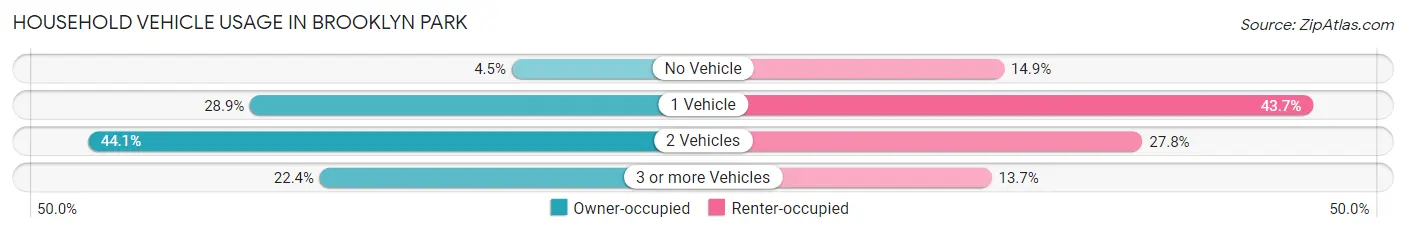
| Vehicles per Household | Owner-occupied | Renter-occupied |
| No Vehicle | 202 (4.5%) | 153 (14.8%) |
| 1 Vehicle | 1,292 (28.9%) | 450 (43.7%) |
| 2 Vehicles | 1,969 (44.1%) | 286 (27.8%) |
| 3 or more Vehicles | 1,002 (22.4%) | 141 (13.7%) |
| Total | 4,465 (100.0%) | 1,030 (100.0%) |
Real Estate & Mortgages in Brooklyn Park
Real Estate and Mortgage Overview in Brooklyn Park
| Characteristic | Without Mortgage | With Mortgage |
| Housing Units | 1,600 | 2,865 |
| Median Property Value | $228,200 | $241,700 |
| Median Household Income | $62,370 | $618 |
| Monthly Housing Costs | $522 | $31 |
| Real Estate Taxes | $2,289 | $39 |
Property Value by Mortgage Status in Brooklyn Park
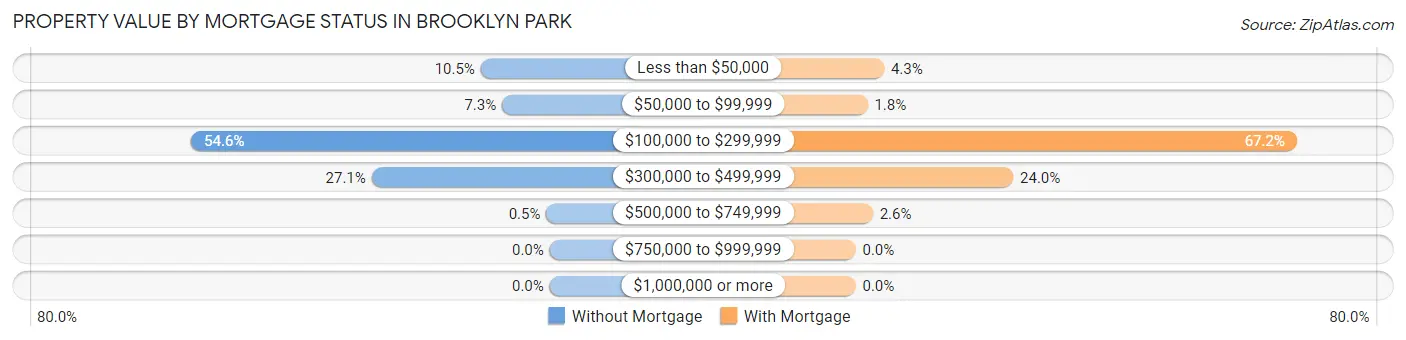
| Property Value | Without Mortgage | With Mortgage |
| Less than $50,000 | 168 (10.5%) | 124 (4.3%) |
| $50,000 to $99,999 | 116 (7.2%) | 52 (1.8%) |
| $100,000 to $299,999 | 874 (54.6%) | 1,926 (67.2%) |
| $300,000 to $499,999 | 434 (27.1%) | 688 (24.0%) |
| $500,000 to $749,999 | 8 (0.5%) | 75 (2.6%) |
| $750,000 to $999,999 | 0 (0.0%) | 0 (0.0%) |
| $1,000,000 or more | 0 (0.0%) | 0 (0.0%) |
| Total | 1,600 (100.0%) | 2,865 (100.0%) |
Household Income by Mortgage Status in Brooklyn Park
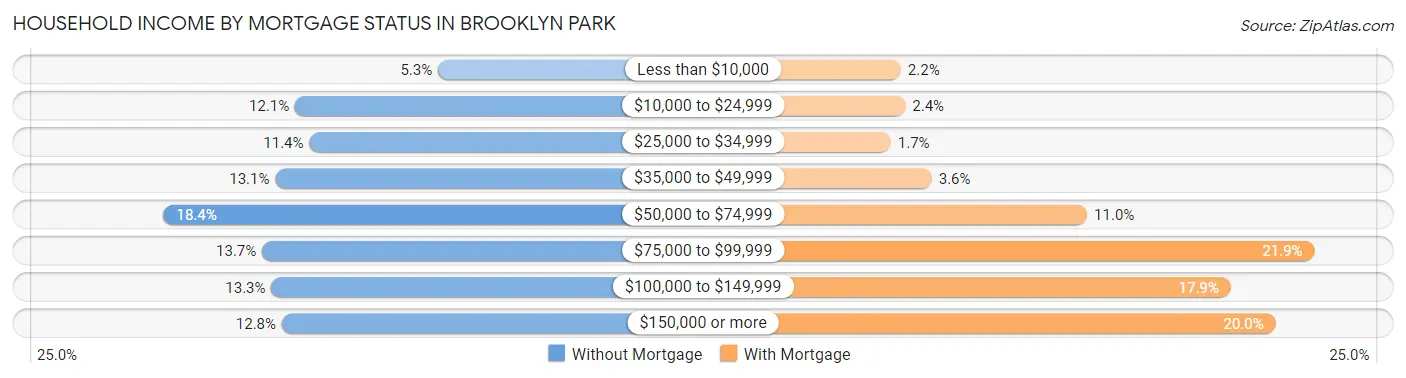
| Household Income | Without Mortgage | With Mortgage |
| Less than $10,000 | 85 (5.3%) | 62 (2.2%) |
| $10,000 to $24,999 | 194 (12.1%) | 68 (2.4%) |
| $25,000 to $34,999 | 183 (11.4%) | 48 (1.7%) |
| $35,000 to $49,999 | 209 (13.1%) | 104 (3.6%) |
| $50,000 to $74,999 | 294 (18.4%) | 316 (11.0%) |
| $75,000 to $99,999 | 219 (13.7%) | 626 (21.8%) |
| $100,000 to $149,999 | 212 (13.3%) | 512 (17.9%) |
| $150,000 or more | 204 (12.8%) | 573 (20.0%) |
| Total | 1,600 (100.0%) | 2,865 (100.0%) |
Property Value to Household Income Ratio in Brooklyn Park
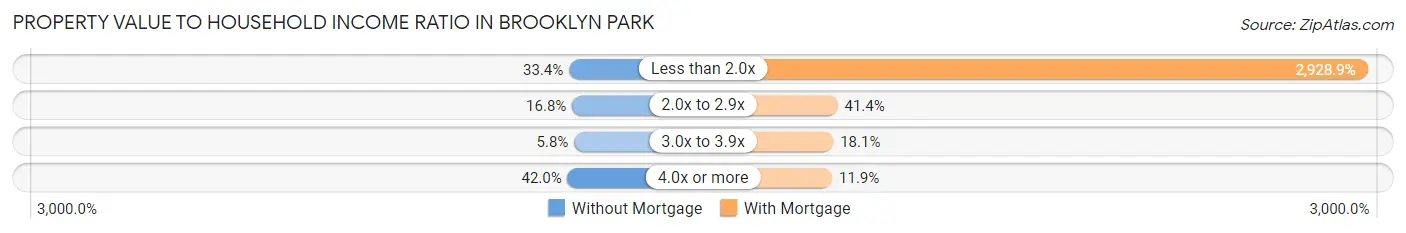
| Value-to-Income Ratio | Without Mortgage | With Mortgage |
| Less than 2.0x | 534 (33.4%) | 83,912 (2,928.9%) |
| 2.0x to 2.9x | 269 (16.8%) | 1,187 (41.4%) |
| 3.0x to 3.9x | 92 (5.8%) | 519 (18.1%) |
| 4.0x or more | 672 (42.0%) | 341 (11.9%) |
| Total | 1,600 (100.0%) | 2,865 (100.0%) |
Real Estate Taxes by Mortgage Status in Brooklyn Park
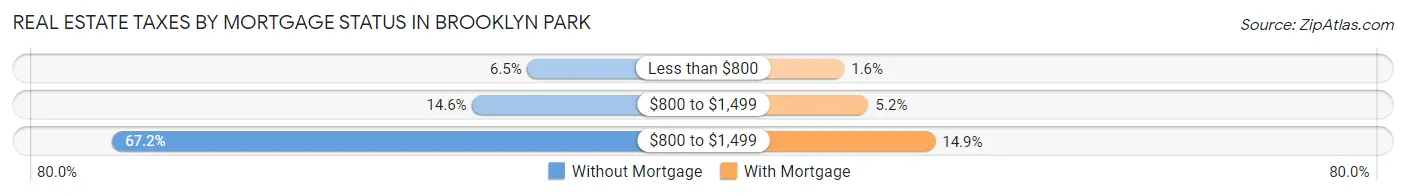
| Property Taxes | Without Mortgage | With Mortgage |
| Less than $800 | 104 (6.5%) | 47 (1.6%) |
| $800 to $1,499 | 233 (14.6%) | 149 (5.2%) |
| $800 to $1,499 | 1,075 (67.2%) | 428 (14.9%) |
| Total | 1,600 (100.0%) | 2,865 (100.0%) |
Health & Disability in Brooklyn Park
Health Insurance Coverage by Age in Brooklyn Park
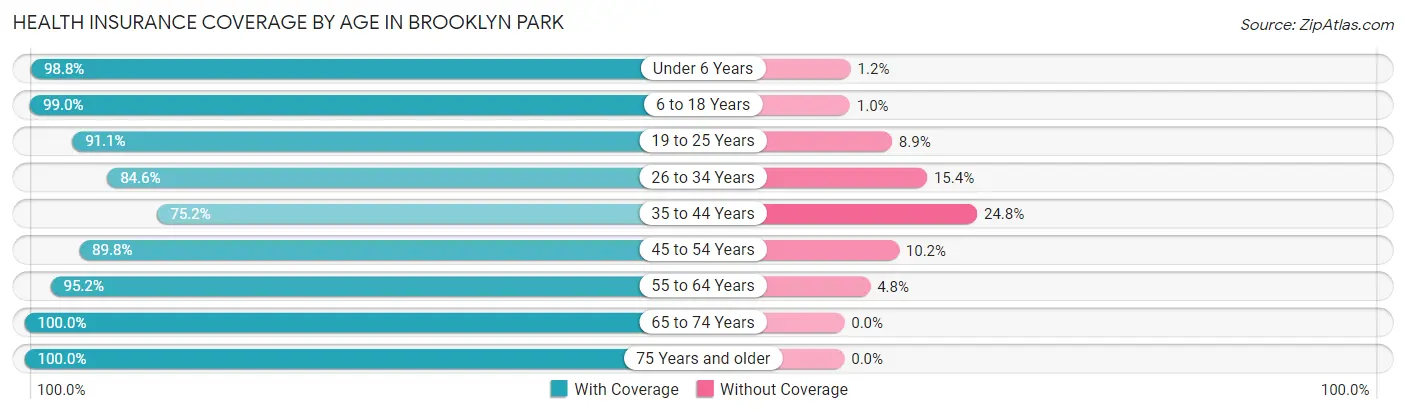
| Age Bracket | With Coverage | Without Coverage |
| Under 6 Years | 1,158 (98.8%) | 14 (1.2%) |
| 6 to 18 Years | 2,662 (99.0%) | 28 (1.0%) |
| 19 to 25 Years | 1,262 (91.1%) | 123 (8.9%) |
| 26 to 34 Years | 1,185 (84.6%) | 216 (15.4%) |
| 35 to 44 Years | 1,905 (75.2%) | 627 (24.8%) |
| 45 to 54 Years | 1,714 (89.8%) | 194 (10.2%) |
| 55 to 64 Years | 2,298 (95.2%) | 117 (4.8%) |
| 65 to 74 Years | 1,155 (100.0%) | 0 (0.0%) |
| 75 Years and older | 1,000 (100.0%) | 0 (0.0%) |
| Total | 14,339 (91.6%) | 1,319 (8.4%) |
Health Insurance Coverage by Citizenship Status in Brooklyn Park
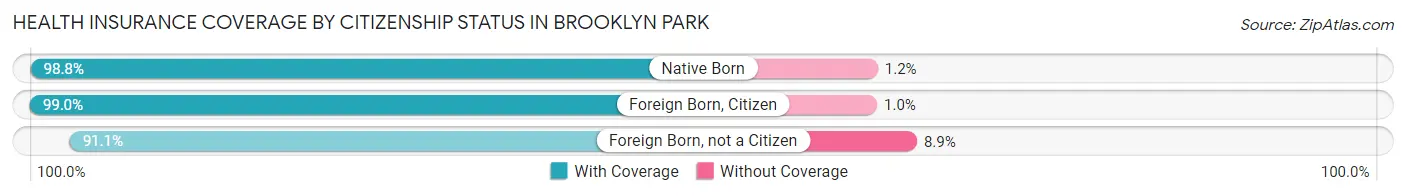
| Citizenship Status | With Coverage | Without Coverage |
| Native Born | 1,158 (98.8%) | 14 (1.2%) |
| Foreign Born, Citizen | 2,662 (99.0%) | 28 (1.0%) |
| Foreign Born, not a Citizen | 1,262 (91.1%) | 123 (8.9%) |
Health Insurance Coverage by Household Income in Brooklyn Park
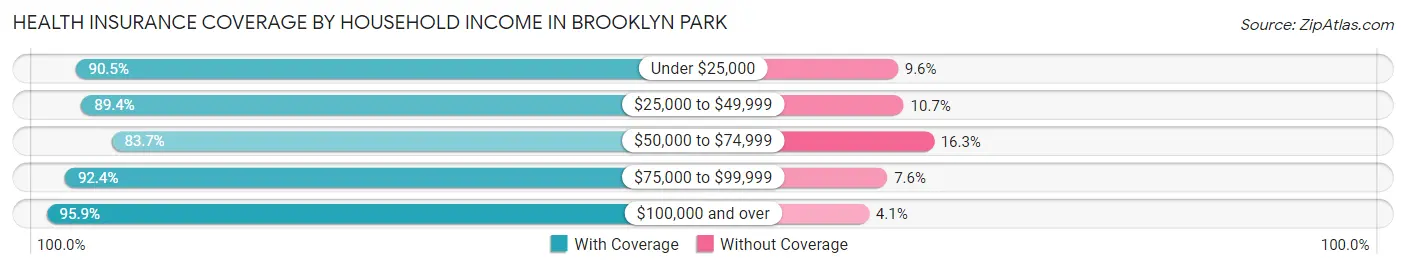
| Household Income | With Coverage | Without Coverage |
| Under $25,000 | 691 (90.4%) | 73 (9.6%) |
| $25,000 to $49,999 | 2,382 (89.3%) | 284 (10.6%) |
| $50,000 to $74,999 | 2,499 (83.7%) | 486 (16.3%) |
| $75,000 to $99,999 | 2,577 (92.4%) | 211 (7.6%) |
| $100,000 and over | 6,135 (95.9%) | 265 (4.1%) |
Public vs Private Health Insurance Coverage by Age in Brooklyn Park
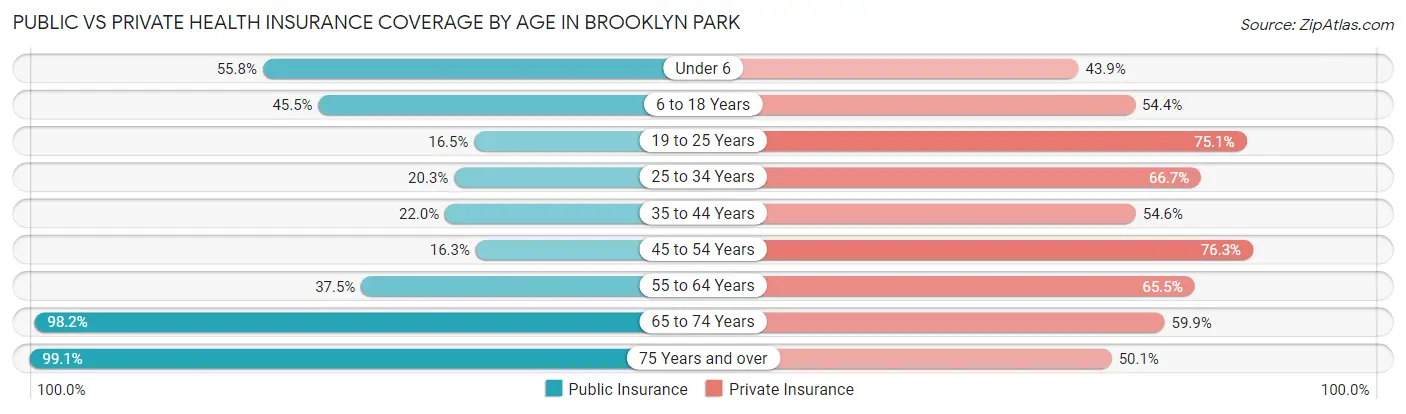
| Age Bracket | Public Insurance | Private Insurance |
| Under 6 | 654 (55.8%) | 515 (43.9%) |
| 6 to 18 Years | 1,223 (45.5%) | 1,464 (54.4%) |
| 19 to 25 Years | 229 (16.5%) | 1,040 (75.1%) |
| 25 to 34 Years | 284 (20.3%) | 934 (66.7%) |
| 35 to 44 Years | 556 (22.0%) | 1,382 (54.6%) |
| 45 to 54 Years | 310 (16.3%) | 1,456 (76.3%) |
| 55 to 64 Years | 906 (37.5%) | 1,581 (65.5%) |
| 65 to 74 Years | 1,134 (98.2%) | 692 (59.9%) |
| 75 Years and over | 991 (99.1%) | 501 (50.1%) |
| Total | 6,287 (40.2%) | 9,565 (61.1%) |
Disability Status by Sex by Age in Brooklyn Park
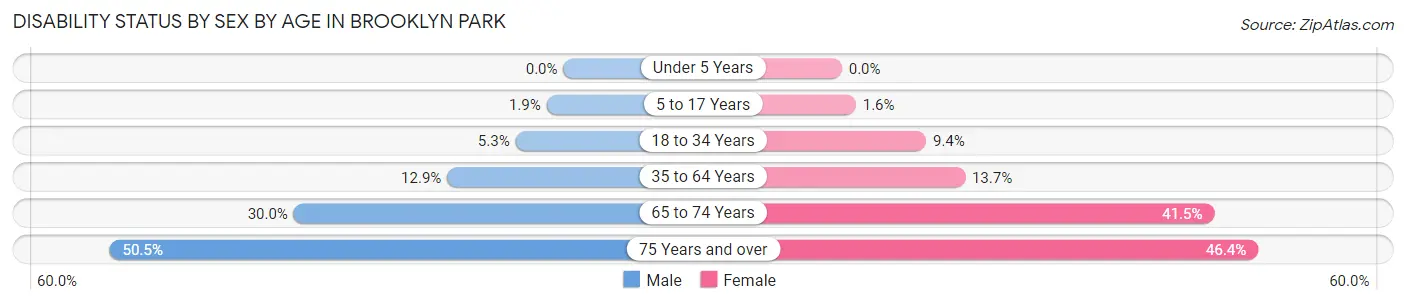
| Age Bracket | Male | Female |
| Under 5 Years | 0 (0.0%) | 0 (0.0%) |
| 5 to 17 Years | 26 (1.9%) | 18 (1.6%) |
| 18 to 34 Years | 76 (5.3%) | 153 (9.4%) |
| 35 to 64 Years | 471 (12.9%) | 441 (13.7%) |
| 65 to 74 Years | 176 (30.0%) | 236 (41.5%) |
| 75 Years and over | 235 (50.5%) | 248 (46.4%) |
Disability Class by Sex by Age in Brooklyn Park
Disability Class: Hearing Difficulty
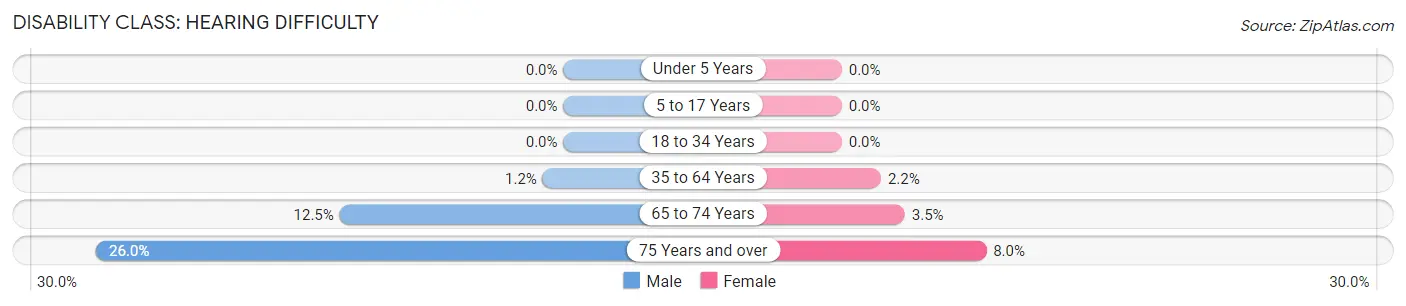
| Age Bracket | Male | Female |
| Under 5 Years | 0 (0.0%) | 0 (0.0%) |
| 5 to 17 Years | 0 (0.0%) | 0 (0.0%) |
| 18 to 34 Years | 0 (0.0%) | 0 (0.0%) |
| 35 to 64 Years | 42 (1.1%) | 70 (2.2%) |
| 65 to 74 Years | 73 (12.5%) | 20 (3.5%) |
| 75 Years and over | 121 (26.0%) | 43 (8.0%) |
Disability Class: Vision Difficulty
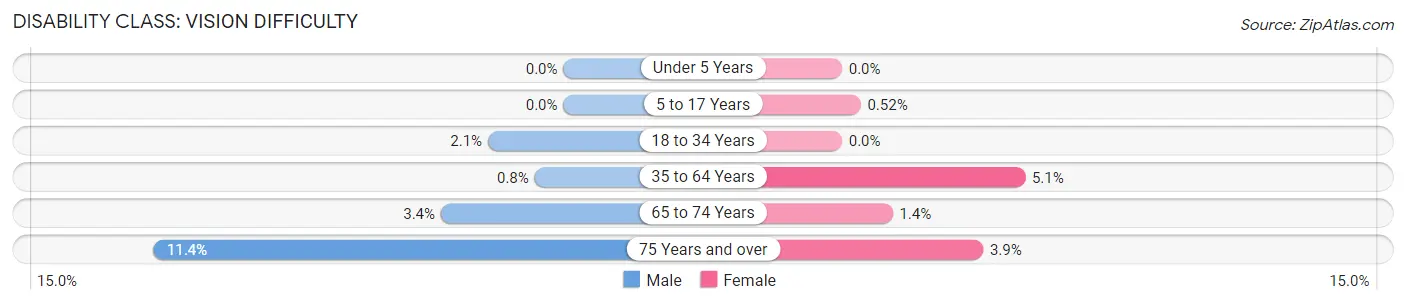
| Age Bracket | Male | Female |
| Under 5 Years | 0 (0.0%) | 0 (0.0%) |
| 5 to 17 Years | 0 (0.0%) | 6 (0.5%) |
| 18 to 34 Years | 30 (2.1%) | 0 (0.0%) |
| 35 to 64 Years | 29 (0.8%) | 164 (5.1%) |
| 65 to 74 Years | 20 (3.4%) | 8 (1.4%) |
| 75 Years and over | 53 (11.4%) | 21 (3.9%) |
Disability Class: Cognitive Difficulty
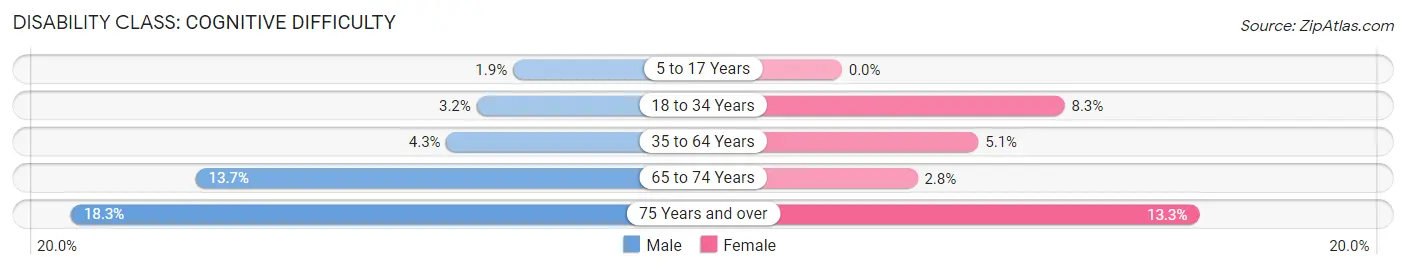
| Age Bracket | Male | Female |
| 5 to 17 Years | 26 (1.9%) | 0 (0.0%) |
| 18 to 34 Years | 46 (3.2%) | 135 (8.3%) |
| 35 to 64 Years | 158 (4.3%) | 163 (5.1%) |
| 65 to 74 Years | 80 (13.7%) | 16 (2.8%) |
| 75 Years and over | 85 (18.3%) | 71 (13.3%) |
Disability Class: Ambulatory Difficulty
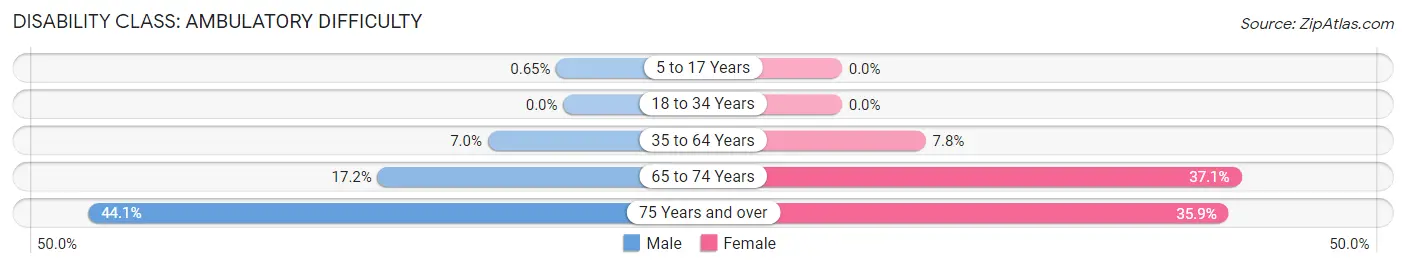
| Age Bracket | Male | Female |
| 5 to 17 Years | 9 (0.6%) | 0 (0.0%) |
| 18 to 34 Years | 0 (0.0%) | 0 (0.0%) |
| 35 to 64 Years | 255 (7.0%) | 250 (7.8%) |
| 65 to 74 Years | 101 (17.2%) | 211 (37.1%) |
| 75 Years and over | 205 (44.1%) | 192 (35.9%) |
Disability Class: Self-Care Difficulty

| Age Bracket | Male | Female |
| 5 to 17 Years | 9 (0.6%) | 12 (1.0%) |
| 18 to 34 Years | 8 (0.6%) | 0 (0.0%) |
| 35 to 64 Years | 73 (2.0%) | 53 (1.7%) |
| 65 to 74 Years | 28 (4.8%) | 55 (9.7%) |
| 75 Years and over | 104 (22.4%) | 53 (9.9%) |
Technology Access in Brooklyn Park
Computing Device Access in Brooklyn Park
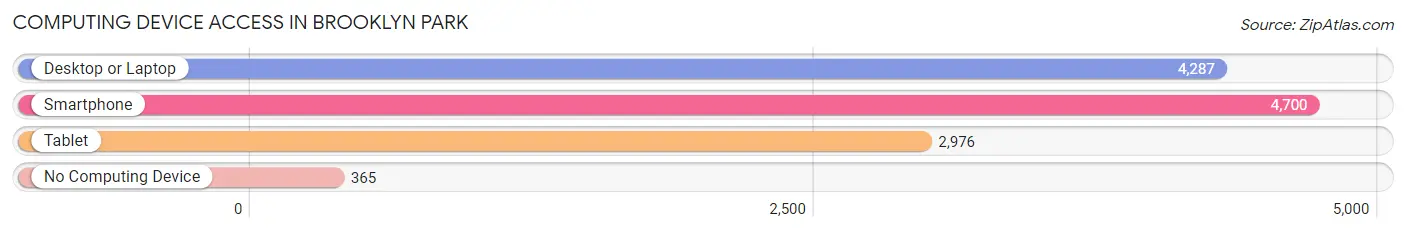
| Device Type | # Households | % Households |
| Desktop or Laptop | 4,287 | 78.0% |
| Smartphone | 4,700 | 85.5% |
| Tablet | 2,976 | 54.2% |
| No Computing Device | 365 | 6.6% |
| Total | 5,495 | 100.0% |
Internet Access in Brooklyn Park
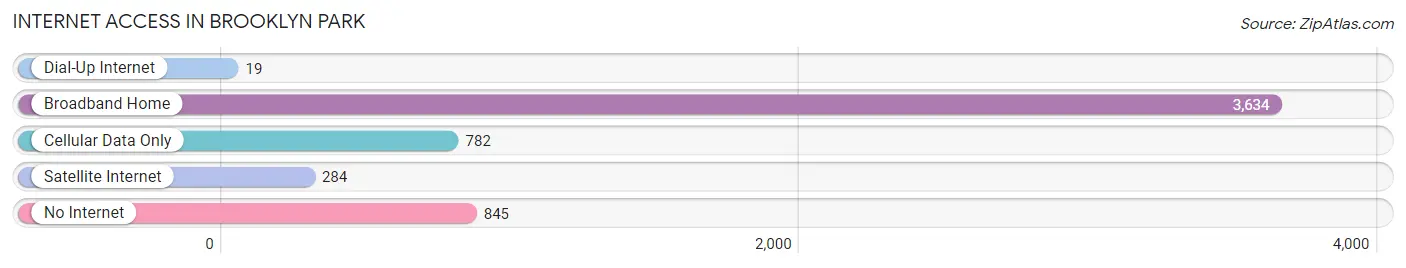
| Internet Type | # Households | % Households |
| Dial-Up Internet | 19 | 0.4% |
| Broadband Home | 3,634 | 66.1% |
| Cellular Data Only | 782 | 14.2% |
| Satellite Internet | 284 | 5.2% |
| No Internet | 845 | 15.4% |
| Total | 5,495 | 100.0% |
Brooklyn Park Summary
Brooklyn Park is a census-designated place located in Anne Arundel County, Maryland. It is located just north of Baltimore and is part of the Baltimore-Washington metropolitan area. The population of Brooklyn Park was estimated to be 30,845 in 2019.
History
The area that is now Brooklyn Park was originally inhabited by the Susquehannock Indians. The first European settlers arrived in the area in the late 1600s. The area was known as “Brookland” and was part of the larger area of Anne Arundel County. In the late 1800s, the area was renamed “Brooklyn Park” after the Brooklyn Park Railroad Station. The station was built in 1887 and was the first stop on the Baltimore and Annapolis Railroad.
In the early 1900s, the area began to develop as a residential community. The area was annexed by the City of Baltimore in 1918. In the 1950s, the area began to experience rapid growth as more people moved to the area. The population of Brooklyn Park increased from 4,000 in 1950 to over 30,000 in 2019.
Geography
Brooklyn Park is located in Anne Arundel County, Maryland. It is located just north of Baltimore and is part of the Baltimore-Washington metropolitan area. The area is bordered by Baltimore City to the south, Linthicum to the west, and Glen Burnie to the east. The area is located on the Patapsco River and is home to several parks and recreational areas.
The area is mostly flat with some rolling hills. The average elevation is around 50 feet above sea level. The area is located in a humid subtropical climate zone and experiences hot, humid summers and mild winters.
Economy
The economy of Brooklyn Park is largely based on the service industry. The area is home to several large employers, including the Anne Arundel Medical Center, the University of Maryland Medical Center, and the Baltimore-Washington International Airport. The area is also home to several retail stores, restaurants, and other businesses.
The median household income in Brooklyn Park is $60,845, which is higher than the national average. The unemployment rate in the area is 4.2%, which is lower than the national average.
Demographics
The population of Brooklyn Park was estimated to be 30,845 in 2019. The population is mostly white (71.3%), followed by African American (17.2%), Asian (5.2%), and Hispanic (4.3%). The median age in the area is 38.7 years.
The area is home to a diverse religious population. The largest religious group is Christian (63.3%), followed by Jewish (7.2%), Muslim (2.2%), and Buddhist (1.2%).
Conclusion
Brooklyn Park is a census-designated place located in Anne Arundel County, Maryland. It is located just north of Baltimore and is part of the Baltimore-Washington metropolitan area. The area was originally inhabited by the Susquehannock Indians and was later developed as a residential community in the early 1900s. The population of Brooklyn Park was estimated to be 30,845 in 2019. The economy of Brooklyn Park is largely based on the service industry and the median household income is $60,845. The population is mostly white (71.3%), followed by African American (17.2%), Asian (5.2%), and Hispanic (4.3%). The area is home to a diverse religious population, with the largest religious group being Christian (63.3%).
Common Questions
What is Per Capita Income in Brooklyn Park?
Per Capita income in Brooklyn Park is $32,015.
What is the Median Family Income in Brooklyn Park?
Median Family Income in Brooklyn Park is $84,668.
What is the Median Household income in Brooklyn Park?
Median Household Income in Brooklyn Park is $74,440.
What is Income or Wage Gap in Brooklyn Park?
Income or Wage Gap in Brooklyn Park is 40.5%.
Women in Brooklyn Park earn 59.5 cents for every dollar earned by a man.
What is Family Income Deficit in Brooklyn Park?
Family Income Deficit in Brooklyn Park is $14,955.
Families that are below poverty line in Brooklyn Park earn $14,955 less on average than the poverty threshold level.
What is Inequality or Gini Index in Brooklyn Park?
Inequality or Gini Index in Brooklyn Park is 0.39.
What is the Total Population of Brooklyn Park?
Total Population of Brooklyn Park is 15,902.
What is the Total Male Population of Brooklyn Park?
Total Male Population of Brooklyn Park is 8,240.
What is the Total Female Population of Brooklyn Park?
Total Female Population of Brooklyn Park is 7,662.
What is the Ratio of Males per 100 Females in Brooklyn Park?
There are 107.54 Males per 100 Females in Brooklyn Park.
What is the Ratio of Females per 100 Males in Brooklyn Park?
There are 92.99 Females per 100 Males in Brooklyn Park.
What is the Median Population Age in Brooklyn Park?
Median Population Age in Brooklyn Park is 39.0 Years.
What is the Average Family Size in Brooklyn Park
Average Family Size in Brooklyn Park is 3.4 People.
What is the Average Household Size in Brooklyn Park
Average Household Size in Brooklyn Park is 2.9 People.
How Large is the Labor Force in Brooklyn Park?
There are 7,668 People in the Labor Forcein in Brooklyn Park.
What is the Percentage of People in the Labor Force in Brooklyn Park?
60.3% of People are in the Labor Force in Brooklyn Park.
What is the Unemployment Rate in Brooklyn Park?
Unemployment Rate in Brooklyn Park is 4.0%.