Cities with the Highest Poverty Level Among Females Between Ages 18 and 24 in Florida
RELATED REPORTS & OPTIONS
Highest Poverty | Female 18-24
Florida
Compare Cities
Map of Cities with the Highest Poverty Level Among Females Between Ages 18 and 24 in Florida
0.0%
100.0%
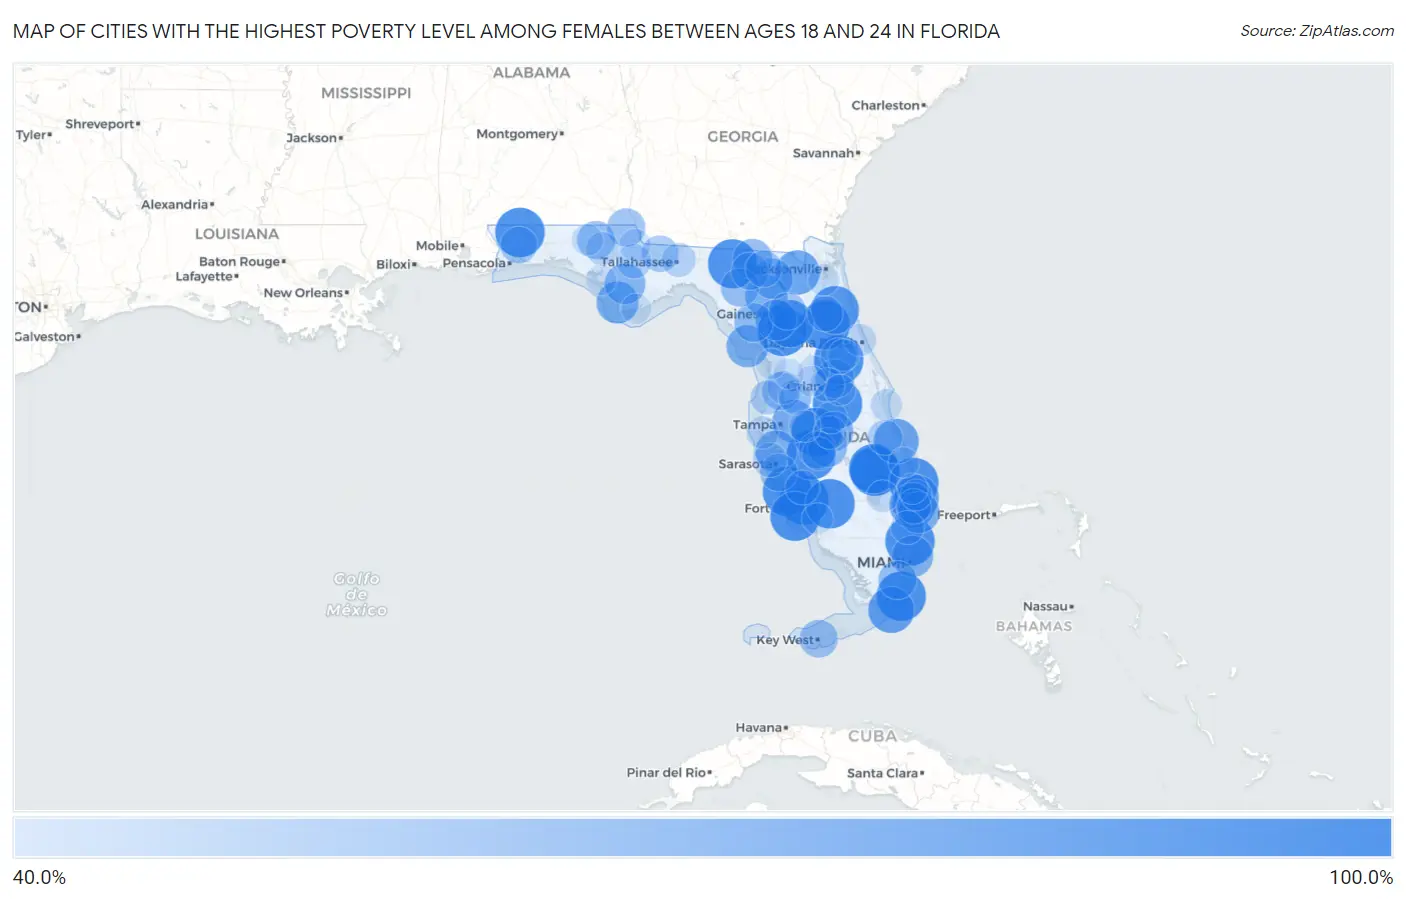
Cities with the Highest Poverty Level Among Females Between Ages 18 and 24 in Florida
| City | Female Poverty | vs State | vs National | |
| 1. | Taylor Creek | 100.0% | 19.3% (+80.7)#1 | 21.6% (+78.4)#8 |
| 2. | Burnt Store Marina | 100.0% | 19.3% (+80.7)#2 | 21.6% (+78.4)#55 |
| 3. | Campbell | 100.0% | 19.3% (+80.7)#3 | 21.6% (+78.4)#57 |
| 4. | Grove City | 100.0% | 19.3% (+80.7)#4 | 21.6% (+78.4)#76 |
| 5. | Boulevard Gardens | 100.0% | 19.3% (+80.7)#5 | 21.6% (+78.4)#82 |
| 6. | Cypress Quarters | 100.0% | 19.3% (+80.7)#6 | 21.6% (+78.4)#113 |
| 7. | Pine Lakes | 100.0% | 19.3% (+80.7)#7 | 21.6% (+78.4)#137 |
| 8. | North Key Largo | 100.0% | 19.3% (+80.7)#8 | 21.6% (+78.4)#138 |
| 9. | Silver Springs Shores East | 100.0% | 19.3% (+80.7)#9 | 21.6% (+78.4)#164 |
| 10. | Welaka | 100.0% | 19.3% (+80.7)#10 | 21.6% (+78.4)#209 |
| 11. | Heritage Bay | 100.0% | 19.3% (+80.7)#11 | 21.6% (+78.4)#227 |
| 12. | Jupiter Island | 100.0% | 19.3% (+80.7)#12 | 21.6% (+78.4)#231 |
| 13. | East Williston | 100.0% | 19.3% (+80.7)#13 | 21.6% (+78.4)#289 |
| 14. | Indian Lake Estates | 100.0% | 19.3% (+80.7)#14 | 21.6% (+78.4)#291 |
| 15. | Ona | 100.0% | 19.3% (+80.7)#15 | 21.6% (+78.4)#430 |
| 16. | Homeland | 100.0% | 19.3% (+80.7)#16 | 21.6% (+78.4)#575 |
| 17. | Berrydale | 100.0% | 19.3% (+80.7)#17 | 21.6% (+78.4)#722 |
| 18. | Captiva | 100.0% | 19.3% (+80.7)#18 | 21.6% (+78.4)#757 |
| 19. | Charleston Park | 100.0% | 19.3% (+80.7)#19 | 21.6% (+78.4)#976 |
| 20. | Lee | 98.6% | 19.3% (+79.3)#20 | 21.6% (+77.0)#998 |
| 21. | Hastings | 95.1% | 19.3% (+75.9)#21 | 21.6% (+73.5)#1,014 |
| 22. | Micanopy | 93.3% | 19.3% (+74.1)#22 | 21.6% (+71.7)#1,027 |
| 23. | Tavernier | 89.0% | 19.3% (+69.7)#23 | 21.6% (+67.4)#1,081 |
| 24. | Royal Palm Estates | 88.4% | 19.3% (+69.2)#24 | 21.6% (+66.8)#1,100 |
| 25. | Lake Park | 86.5% | 19.3% (+67.2)#25 | 21.6% (+64.9)#1,139 |
| 26. | Gifford | 85.9% | 19.3% (+66.6)#26 | 21.6% (+64.3)#1,147 |
| 27. | Glen St Mary | 84.6% | 19.3% (+65.4)#27 | 21.6% (+63.0)#1,172 |
| 28. | Tropical Park | 82.2% | 19.3% (+62.9)#28 | 21.6% (+60.6)#1,237 |
| 29. | Dover | 79.2% | 19.3% (+59.9)#29 | 21.6% (+57.6)#1,322 |
| 30. | Fort White | 77.3% | 19.3% (+58.0)#30 | 21.6% (+55.7)#1,399 |
| 31. | Florida Gulf Coast University | 77.1% | 19.3% (+57.8)#31 | 21.6% (+55.5)#1,404 |
| 32. | Port St Joe | 77.0% | 19.3% (+57.8)#32 | 21.6% (+55.5)#1,407 |
| 33. | Cedar Key | 76.9% | 19.3% (+57.7)#33 | 21.6% (+55.3)#1,408 |
| 34. | Plantation Mobile Home Park | 75.5% | 19.3% (+56.2)#34 | 21.6% (+53.9)#1,456 |
| 35. | Ellenton | 75.2% | 19.3% (+55.9)#35 | 21.6% (+53.6)#1,460 |
| 36. | Manalapan | 75.0% | 19.3% (+55.7)#36 | 21.6% (+53.4)#1,502 |
| 37. | Indian Creek | 75.0% | 19.3% (+55.7)#37 | 21.6% (+53.4)#1,523 |
| 38. | Archer | 74.0% | 19.3% (+54.7)#38 | 21.6% (+52.4)#1,537 |
| 39. | Wewahitchka | 73.0% | 19.3% (+53.8)#39 | 21.6% (+51.4)#1,576 |
| 40. | Watertown | 72.3% | 19.3% (+53.1)#40 | 21.6% (+50.7)#1,608 |
| 41. | Jasper | 69.3% | 19.3% (+50.1)#41 | 21.6% (+47.7)#1,732 |
| 42. | Babson Park | 68.7% | 19.3% (+49.4)#42 | 21.6% (+47.1)#1,771 |
| 43. | Lemon Grove | 68.1% | 19.3% (+48.8)#43 | 21.6% (+46.5)#1,800 |
| 44. | Manatee Road | 67.2% | 19.3% (+47.9)#44 | 21.6% (+45.6)#1,840 |
| 45. | South Apopka | 66.8% | 19.3% (+47.5)#45 | 21.6% (+45.2)#1,849 |
| 46. | Homestead Base | 65.6% | 19.3% (+46.3)#46 | 21.6% (+44.0)#1,979 |
| 47. | Mayo | 65.2% | 19.3% (+46.0)#47 | 21.6% (+43.6)#1,992 |
| 48. | Lake Kerr | 64.9% | 19.3% (+45.7)#48 | 21.6% (+43.3)#2,011 |
| 49. | Malone | 64.5% | 19.3% (+45.3)#49 | 21.6% (+42.9)#2,028 |
| 50. | Bonifay | 64.5% | 19.3% (+45.2)#50 | 21.6% (+42.9)#2,032 |
| 51. | Key West | 64.2% | 19.3% (+44.9)#51 | 21.6% (+42.6)#2,051 |
| 52. | Garden Grove | 64.0% | 19.3% (+44.7)#52 | 21.6% (+42.4)#2,057 |
| 53. | Osprey | 63.2% | 19.3% (+43.9)#53 | 21.6% (+41.6)#2,103 |
| 54. | Live Oak | 62.9% | 19.3% (+43.6)#54 | 21.6% (+41.3)#2,120 |
| 55. | Wauchula | 62.3% | 19.3% (+43.0)#55 | 21.6% (+40.7)#2,174 |
| 56. | Gainesville | 61.9% | 19.3% (+42.7)#56 | 21.6% (+40.3)#2,197 |
| 57. | Point Baker | 60.5% | 19.3% (+41.3)#57 | 21.6% (+38.9)#2,287 |
| 58. | White Springs | 60.0% | 19.3% (+40.7)#58 | 21.6% (+38.4)#2,311 |
| 59. | Quincy | 59.7% | 19.3% (+40.4)#59 | 21.6% (+38.1)#2,360 |
| 60. | Lake Mack Forest Hills | 59.0% | 19.3% (+39.7)#60 | 21.6% (+37.4)#2,403 |
| 61. | University Cdp Hillsborough County | 57.7% | 19.3% (+38.5)#61 | 21.6% (+36.1)#2,502 |
| 62. | Palatka | 56.4% | 19.3% (+37.1)#62 | 21.6% (+34.8)#2,619 |
| 63. | Fellsmere | 54.4% | 19.3% (+35.1)#63 | 21.6% (+32.8)#2,779 |
| 64. | Blountstown | 53.6% | 19.3% (+34.3)#64 | 21.6% (+32.0)#2,865 |
| 65. | Pine Air | 53.3% | 19.3% (+34.1)#65 | 21.6% (+31.7)#2,888 |
| 66. | Longboat Key | 52.9% | 19.3% (+33.7)#66 | 21.6% (+31.3)#2,921 |
| 67. | Charlotte Harbor | 52.8% | 19.3% (+33.5)#67 | 21.6% (+31.2)#2,953 |
| 68. | Oakland | 52.4% | 19.3% (+33.1)#68 | 21.6% (+30.8)#2,991 |
| 69. | Hudson | 51.9% | 19.3% (+32.7)#69 | 21.6% (+30.3)#3,036 |
| 70. | Tallahassee | 51.6% | 19.3% (+32.4)#70 | 21.6% (+30.0)#3,059 |
| 71. | University Cdp Orange County | 51.4% | 19.3% (+32.1)#71 | 21.6% (+29.8)#3,077 |
| 72. | Dade City North | 50.7% | 19.3% (+31.4)#72 | 21.6% (+29.1)#3,124 |
| 73. | Zolfo Springs | 50.0% | 19.3% (+30.7)#73 | 21.6% (+28.4)#3,162 |
| 74. | Wausau | 50.0% | 19.3% (+30.7)#74 | 21.6% (+28.4)#3,274 |
| 75. | Watergate | 49.6% | 19.3% (+30.4)#75 | 21.6% (+28.0)#3,365 |
| 76. | Crooked Lake Park | 49.0% | 19.3% (+29.7)#76 | 21.6% (+27.4)#3,395 |
| 77. | South Brooksville | 48.7% | 19.3% (+29.5)#77 | 21.6% (+27.1)#3,410 |
| 78. | Bay Pines | 47.1% | 19.3% (+27.8)#78 | 21.6% (+25.5)#3,580 |
| 79. | Holly Hill | 46.7% | 19.3% (+27.4)#79 | 21.6% (+25.1)#3,617 |
| 80. | Grenelefe | 46.2% | 19.3% (+26.9)#80 | 21.6% (+24.6)#3,687 |
| 81. | Pahokee | 45.6% | 19.3% (+26.4)#81 | 21.6% (+24.0)#3,766 |
| 82. | Grand Ridge | 45.6% | 19.3% (+26.4)#82 | 21.6% (+24.0)#3,770 |
| 83. | Dade City | 45.6% | 19.3% (+26.3)#83 | 21.6% (+24.0)#3,773 |
| 84. | Patrick Afb | 45.0% | 19.3% (+25.7)#84 | 21.6% (+23.4)#3,850 |
| 85. | Willow Oak | 44.8% | 19.3% (+25.5)#85 | 21.6% (+23.2)#3,880 |
| 86. | West Deland | 44.4% | 19.3% (+25.2)#86 | 21.6% (+22.8)#3,907 |
| 87. | Westville | 44.4% | 19.3% (+25.2)#87 | 21.6% (+22.8)#3,933 |
| 88. | Orange Park | 44.0% | 19.3% (+24.8)#88 | 21.6% (+22.5)#3,967 |
| 89. | Three Oaks | 43.4% | 19.3% (+24.1)#89 | 21.6% (+21.8)#4,034 |
| 90. | Oak Ridge | 43.0% | 19.3% (+23.7)#90 | 21.6% (+21.4)#4,076 |
| 91. | Juno Ridge | 42.9% | 19.3% (+23.6)#91 | 21.6% (+21.3)#4,092 |
| 92. | Leesburg | 42.6% | 19.3% (+23.3)#92 | 21.6% (+21.0)#4,157 |
| 93. | Mascotte | 42.1% | 19.3% (+22.8)#93 | 21.6% (+20.5)#4,221 |
| 94. | Limestone Creek | 41.8% | 19.3% (+22.5)#94 | 21.6% (+20.2)#4,263 |
| 95. | Springfield | 41.6% | 19.3% (+22.3)#95 | 21.6% (+20.0)#4,320 |
| 96. | Indian River Estates | 41.4% | 19.3% (+22.1)#96 | 21.6% (+19.8)#4,346 |
| 97. | Floral City | 41.2% | 19.3% (+21.9)#97 | 21.6% (+19.6)#4,361 |
| 98. | Crystal River | 40.9% | 19.3% (+21.7)#98 | 21.6% (+19.3)#4,404 |
| 99. | Apalachicola | 40.8% | 19.3% (+21.6)#99 | 21.6% (+19.2)#4,422 |
| 100. | Silver Springs | 40.4% | 19.3% (+21.1)#100 | 21.6% (+18.8)#4,482 |
Common Questions
What are the Top 10 Cities with the Highest Poverty Level Among Females Between Ages 18 and 24 in Florida?
Top 10 Cities with the Highest Poverty Level Among Females Between Ages 18 and 24 in Florida are:
#1
100.0%
#2
100.0%
#3
100.0%
#4
100.0%
#5
100.0%
#6
100.0%
#7
100.0%
#8
100.0%
#9
100.0%
#10
100.0%
What city has the Highest Poverty Level Among Females Between Ages 18 and 24 in Florida?
Taylor Creek has the Highest Poverty Level Among Females Between Ages 18 and 24 in Florida with 100.0%.
What is the Poverty Level Among Females Between Ages 18 and 24 in the State of Florida?
Poverty Level Among Females Between Ages 18 and 24 in Florida is 19.3%.
What is the Poverty Level Among Females Between Ages 18 and 24 in the United States?
Poverty Level Among Females Between Ages 18 and 24 in the United States is 21.6%.