Barranquitas, PR Map & Demographics
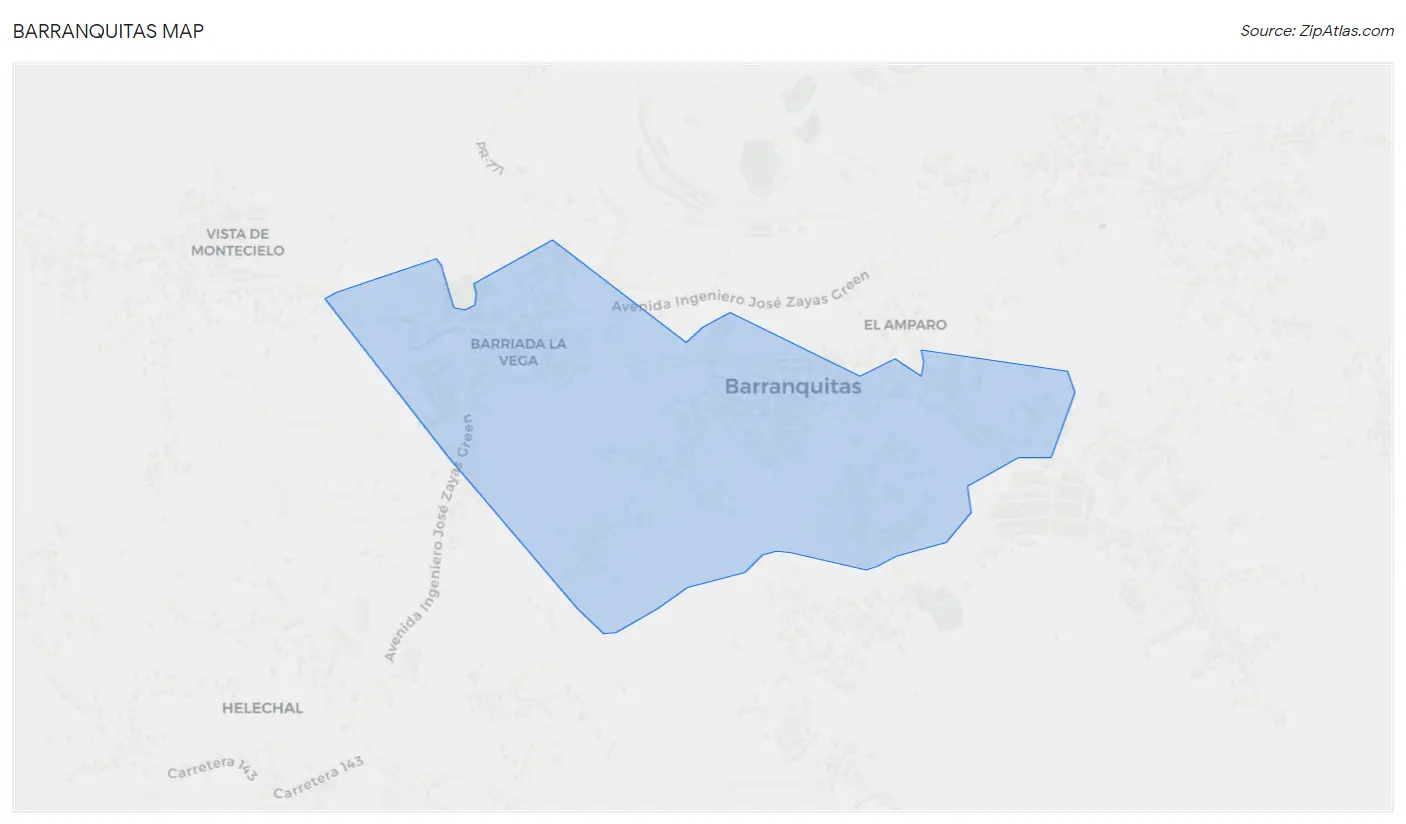
Barranquitas Map
Barranquitas Overview
$6,439
PER CAPITA INCOME
$13,188
AVG FAMILY INCOME
$11,935
AVG HOUSEHOLD INCOME
45.5%
WAGE / INCOME GAP [ % ]
54.5¢/ $1
WAGE / INCOME GAP [ $ ]
0.54
INEQUALITY / GINI INDEX
2,820
TOTAL POPULATION
1,438
MALE POPULATION
1,382
FEMALE POPULATION
104.05
MALES / 100 FEMALES
96.11
FEMALES / 100 MALES
32.1
MEDIAN AGE
3.8
AVG FAMILY SIZE
3.3
AVG HOUSEHOLD SIZE
842
LABOR FORCE [ PEOPLE ]
39.5%
PERCENT IN LABOR FORCE
28.1%
UNEMPLOYMENT RATE
Barranquitas Zip Codes
Barranquitas Area Codes
Income in Barranquitas
Income Overview in Barranquitas
Per Capita Income in Barranquitas is $6,439, while median incomes of families and households are $13,188 and $11,935 respectively.
| Characteristic | Number | Measure |
| Per Capita Income | 2,820 | $6,439 |
| Median Family Income | 625 | $13,188 |
| Mean Family Income | 625 | $16,828 |
| Median Household Income | 858 | $11,935 |
| Mean Household Income | 858 | $16,362 |
| Income Deficit | 625 | $0 |
| Wage / Income Gap (%) | 2,820 | 45.53% |
| Wage / Income Gap ($) | 2,820 | 54.47¢ per $1 |
| Gini / Inequality Index | 2,820 | 0.54 |
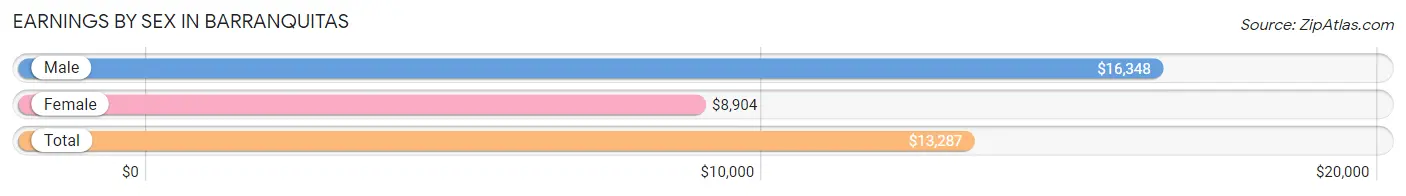
Earnings by Sex in Barranquitas
Average Earnings in Barranquitas are $13,287, $16,348 for men and $8,904 for women, a difference of 45.5%.
| Sex | Number | Average Earnings |
| Male | 493 (66.1%) | $16,348 |
| Female | 253 (33.9%) | $8,904 |
| Total | 746 (100.0%) | $13,287 |
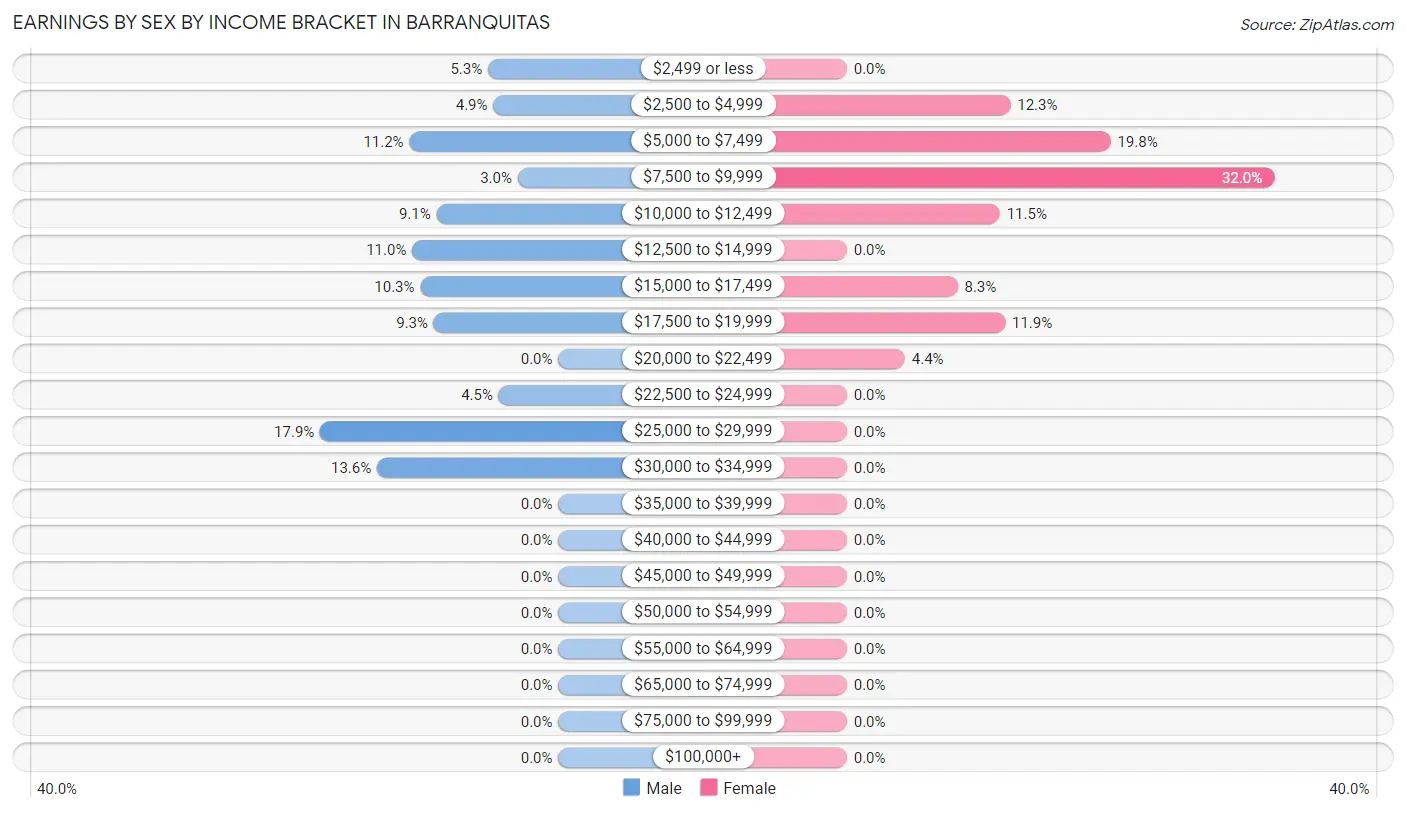
Earnings by Sex by Income Bracket in Barranquitas
The most common earnings brackets in Barranquitas are $25,000 to $29,999 for men (88 | 17.8%) and $7,500 to $9,999 for women (81 | 32.0%).
| Income | Male | Female |
| $2,499 or less | 26 (5.3%) | 0 (0.0%) |
| $2,500 to $4,999 | 24 (4.9%) | 31 (12.2%) |
| $5,000 to $7,499 | 55 (11.2%) | 50 (19.8%) |
| $7,500 to $9,999 | 15 (3.0%) | 81 (32.0%) |
| $10,000 to $12,499 | 45 (9.1%) | 29 (11.5%) |
| $12,500 to $14,999 | 54 (11.0%) | 0 (0.0%) |
| $15,000 to $17,499 | 51 (10.3%) | 21 (8.3%) |
| $17,500 to $19,999 | 46 (9.3%) | 30 (11.9%) |
| $20,000 to $22,499 | 0 (0.0%) | 11 (4.3%) |
| $22,500 to $24,999 | 22 (4.5%) | 0 (0.0%) |
| $25,000 to $29,999 | 88 (17.8%) | 0 (0.0%) |
| $30,000 to $34,999 | 67 (13.6%) | 0 (0.0%) |
| $35,000 to $39,999 | 0 (0.0%) | 0 (0.0%) |
| $40,000 to $44,999 | 0 (0.0%) | 0 (0.0%) |
| $45,000 to $49,999 | 0 (0.0%) | 0 (0.0%) |
| $50,000 to $54,999 | 0 (0.0%) | 0 (0.0%) |
| $55,000 to $64,999 | 0 (0.0%) | 0 (0.0%) |
| $65,000 to $74,999 | 0 (0.0%) | 0 (0.0%) |
| $75,000 to $99,999 | 0 (0.0%) | 0 (0.0%) |
| $100,000+ | 0 (0.0%) | 0 (0.0%) |
| Total | 493 (100.0%) | 253 (100.0%) |
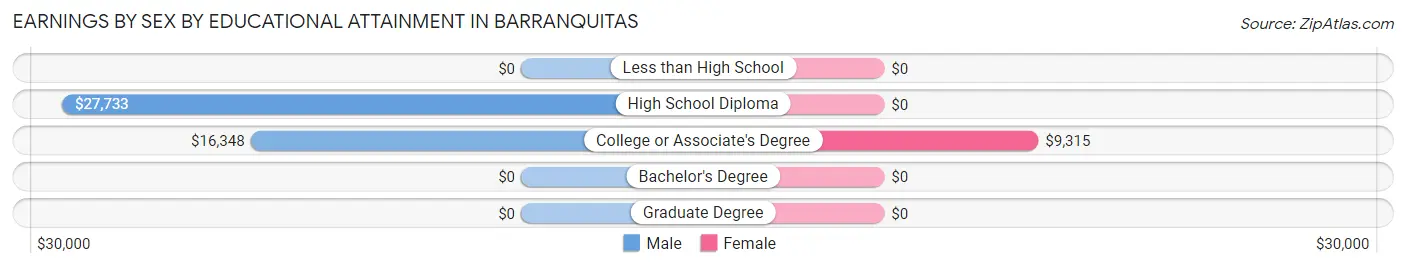
Earnings by Sex by Educational Attainment in Barranquitas
| Educational Attainment | Male Income | Female Income |
| Less than High School | - | - |
| High School Diploma | $27,733 | $0 |
| College or Associate's Degree | $16,348 | $9,315 |
| Bachelor's Degree | - | - |
| Graduate Degree | - | - |
| Total | - | - |
Family Income in Barranquitas
Family Income Brackets in Barranquitas
According to the Barranquitas family income data, there are 277 families falling into the less than $10,000 income range, which is the most common income bracket and makes up 44.3% of all families.
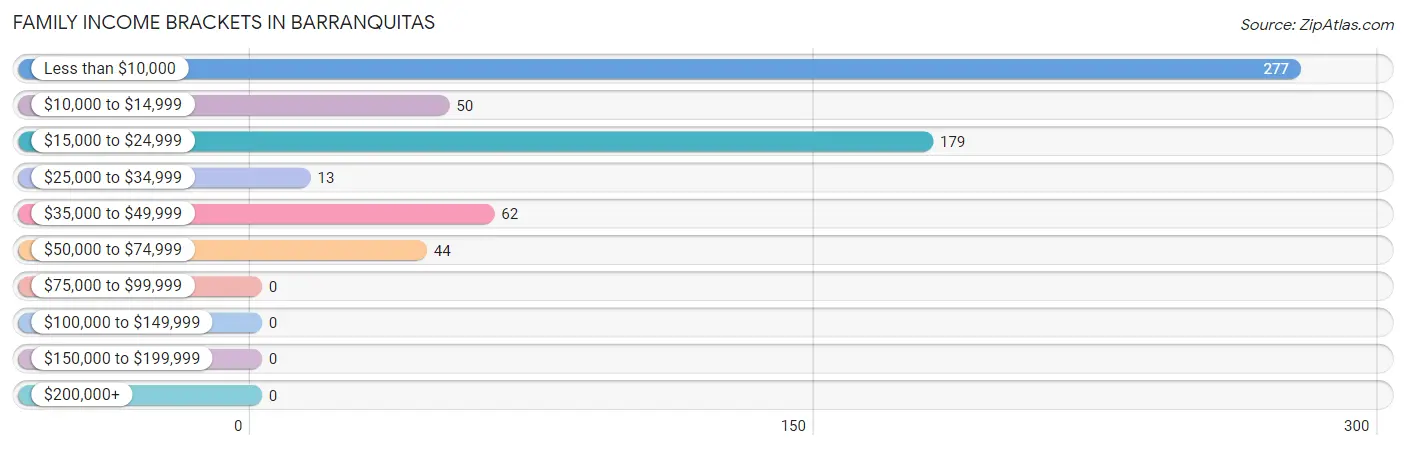
| Income Bracket | # Families | % Families |
| Less than $10,000 | 277 | 44.3% |
| $10,000 to $14,999 | 50 | 8.0% |
| $15,000 to $24,999 | 179 | 28.6% |
| $25,000 to $34,999 | 13 | 2.1% |
| $35,000 to $49,999 | 62 | 9.9% |
| $50,000 to $74,999 | 44 | 7.0% |
| $75,000 to $99,999 | 0 | 0.0% |
| $100,000 to $149,999 | 0 | 0.0% |
| $150,000 to $199,999 | 0 | 0.0% |
| $200,000+ | 0 | 0.0% |
Family Income by Famaliy Size in Barranquitas
2-person families (295 | 47.2%) account for the highest median family income in Barranquitas with $14,813 per family, while 2-person families (295 | 47.2%) have the highest median income of $7,406 per family member.
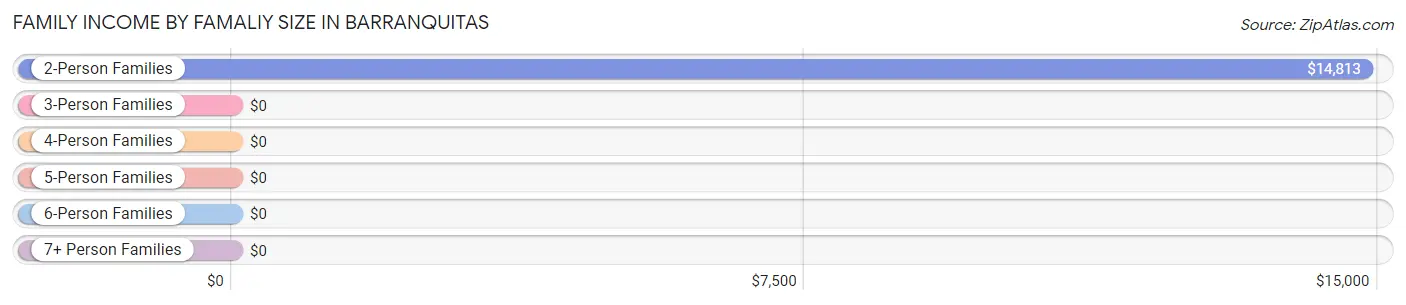
| Income Bracket | # Families | Median Income |
| 2-Person Families | 295 (47.2%) | $14,813 |
| 3-Person Families | 187 (29.9%) | $0 |
| 4-Person Families | 15 (2.4%) | $0 |
| 5-Person Families | 128 (20.5%) | $0 |
| 6-Person Families | 0 (0.0%) | $0 |
| 7+ Person Families | 0 (0.0%) | $0 |
| Total | 625 (100.0%) | $13,188 |
Family Income by Number of Earners in Barranquitas
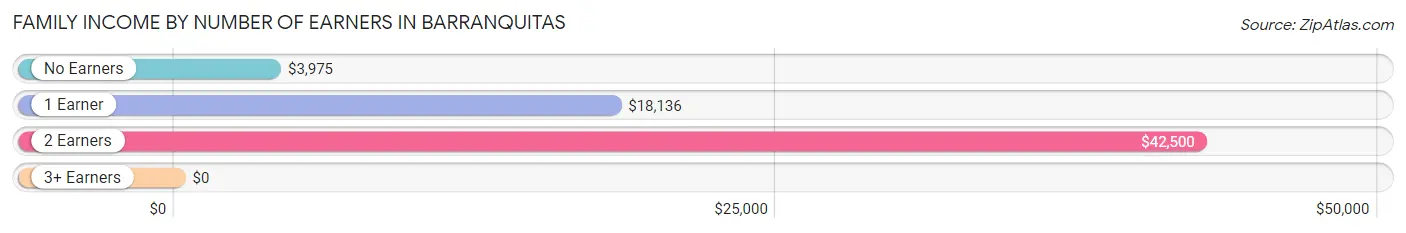
| Number of Earners | # Families | Median Income |
| No Earners | 335 (53.6%) | $3,975 |
| 1 Earner | 206 (33.0%) | $18,136 |
| 2 Earners | 66 (10.6%) | $42,500 |
| 3+ Earners | 18 (2.9%) | $0 |
| Total | 625 (100.0%) | $13,188 |
Household Income in Barranquitas
Household Income Brackets in Barranquitas
With 381 households falling in the category, the less than $10,000 income range is the most frequent in Barranquitas, accounting for 44.4% of all households.
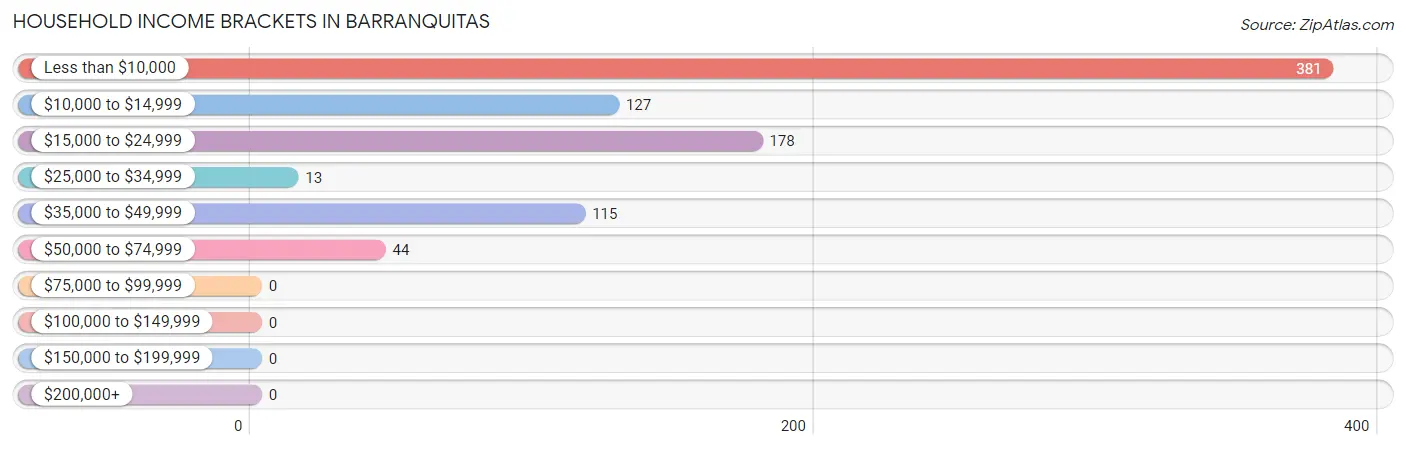
| Income Bracket | # Households | % Households |
| Less than $10,000 | 381 | 44.4% |
| $10,000 to $14,999 | 127 | 14.8% |
| $15,000 to $24,999 | 178 | 20.7% |
| $25,000 to $34,999 | 13 | 1.5% |
| $35,000 to $49,999 | 115 | 13.4% |
| $50,000 to $74,999 | 44 | 5.1% |
| $75,000 to $99,999 | 0 | 0.0% |
| $100,000 to $149,999 | 0 | 0.0% |
| $150,000 to $199,999 | 0 | 0.0% |
| $200,000+ | 0 | 0.0% |
Household Income by Householder Age in Barranquitas
The median household income in Barranquitas is $11,935, with the highest median household income of $15,575 found in the 65+ years age bracket for the primary householder. A total of 331 households (38.6%) fall into this category. Meanwhile, the 15 to 24 years age bracket for the primary householder has the lowest median household income of $0, with 27 households (3.2%) in this group.
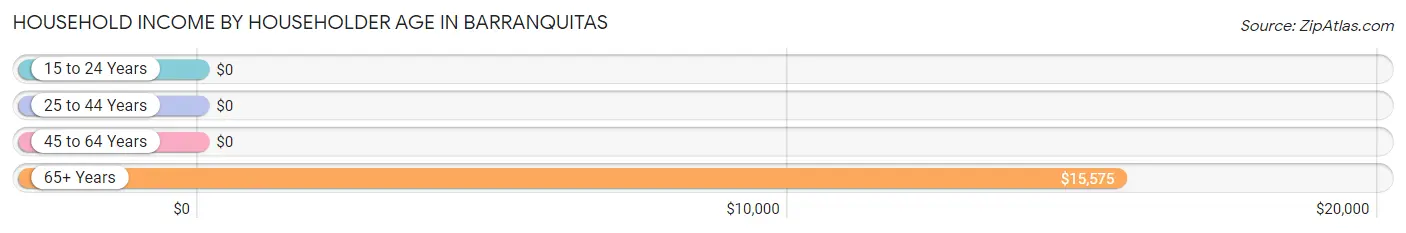
| Income Bracket | # Households | Median Income |
| 15 to 24 Years | 27 (3.2%) | $0 |
| 25 to 44 Years | 261 (30.4%) | $0 |
| 45 to 64 Years | 239 (27.9%) | $0 |
| 65+ Years | 331 (38.6%) | $15,575 |
| Total | 858 (100.0%) | $11,935 |
Poverty in Barranquitas
Income Below Poverty by Sex and Age in Barranquitas
With 67.0% poverty level for males and 74.5% for females among the residents of Barranquitas, under 5 year old males and under 5 year old females are the most vulnerable to poverty, with 127 males (100.0%) and 114 females (100.0%) in their respective age groups living below the poverty level.
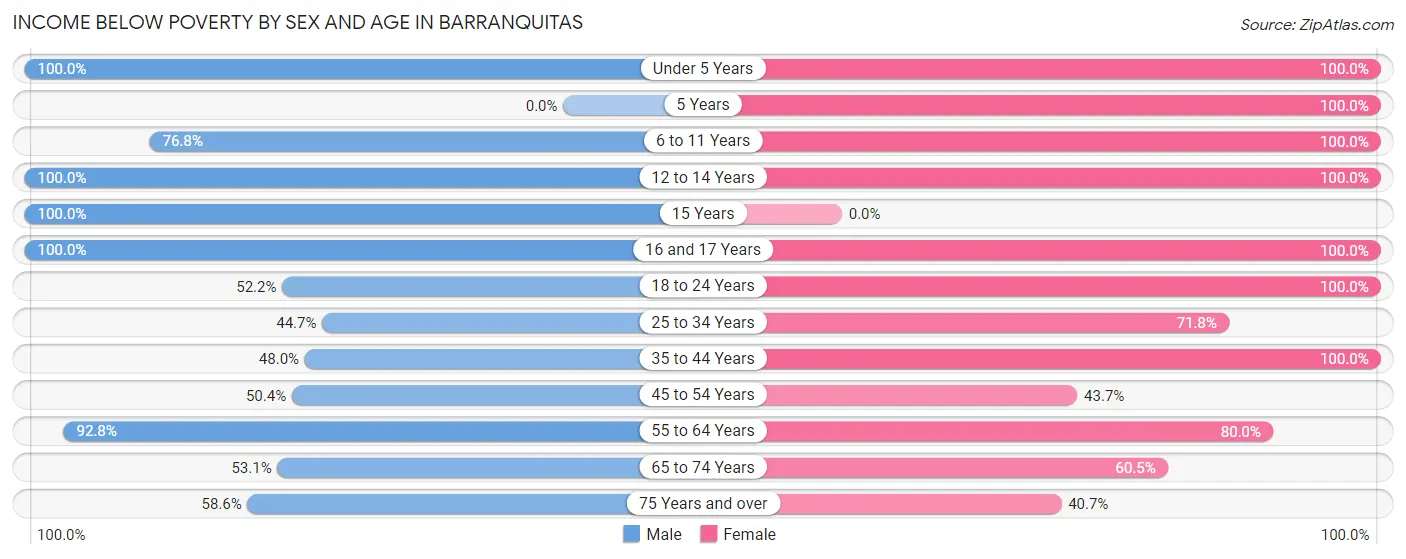
| Age Bracket | Male | Female |
| Under 5 Years | 127 (100.0%) | 114 (100.0%) |
| 5 Years | 0 (0.0%) | 27 (100.0%) |
| 6 to 11 Years | 96 (76.8%) | 92 (100.0%) |
| 12 to 14 Years | 64 (100.0%) | 106 (100.0%) |
| 15 Years | 33 (100.0%) | 0 (0.0%) |
| 16 and 17 Years | 46 (100.0%) | 20 (100.0%) |
| 18 to 24 Years | 120 (52.2%) | 120 (100.0%) |
| 25 to 34 Years | 85 (44.7%) | 153 (71.8%) |
| 35 to 44 Years | 71 (48.0%) | 87 (100.0%) |
| 45 to 54 Years | 68 (50.4%) | 97 (43.7%) |
| 55 to 64 Years | 154 (92.8%) | 68 (80.0%) |
| 65 to 74 Years | 26 (53.1%) | 78 (60.5%) |
| 75 Years and over | 68 (58.6%) | 68 (40.7%) |
| Total | 958 (67.0%) | 1,030 (74.5%) |
Income Above Poverty by Sex and Age in Barranquitas
According to the poverty statistics in Barranquitas, males aged 25 to 34 years and females aged 75 years and over are the age groups that are most secure financially, with 55.3% of males and 59.3% of females in these age groups living above the poverty line.
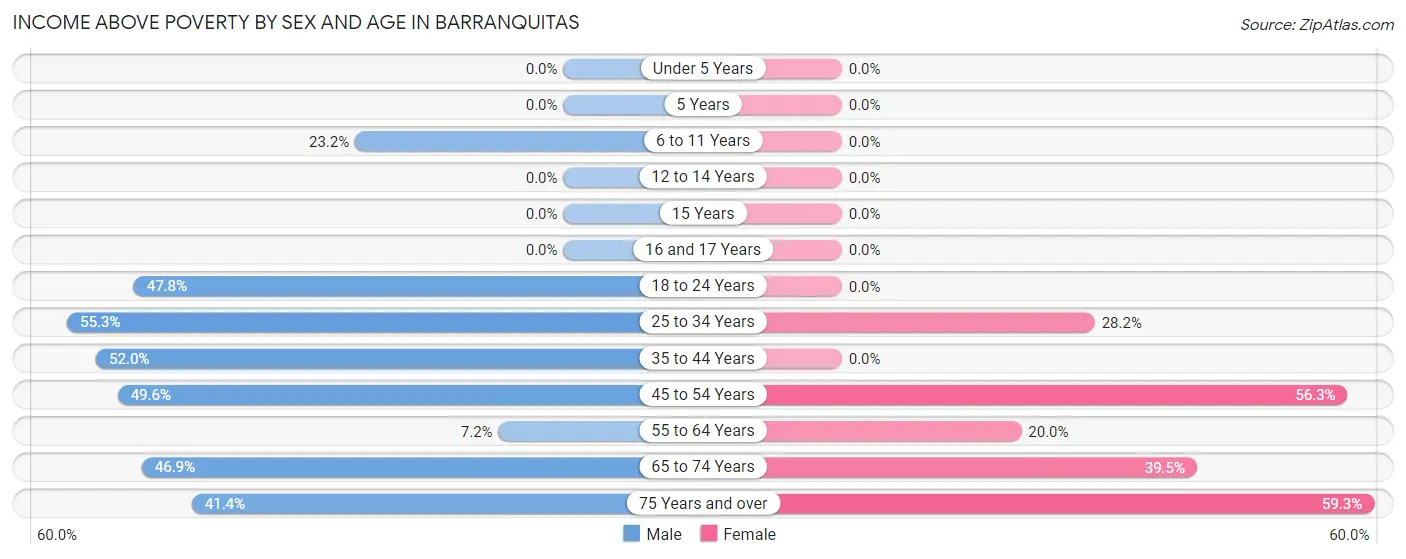
| Age Bracket | Male | Female |
| Under 5 Years | 0 (0.0%) | 0 (0.0%) |
| 5 Years | 0 (0.0%) | 0 (0.0%) |
| 6 to 11 Years | 29 (23.2%) | 0 (0.0%) |
| 12 to 14 Years | 0 (0.0%) | 0 (0.0%) |
| 15 Years | 0 (0.0%) | 0 (0.0%) |
| 16 and 17 Years | 0 (0.0%) | 0 (0.0%) |
| 18 to 24 Years | 110 (47.8%) | 0 (0.0%) |
| 25 to 34 Years | 105 (55.3%) | 60 (28.2%) |
| 35 to 44 Years | 77 (52.0%) | 0 (0.0%) |
| 45 to 54 Years | 67 (49.6%) | 125 (56.3%) |
| 55 to 64 Years | 12 (7.2%) | 17 (20.0%) |
| 65 to 74 Years | 23 (46.9%) | 51 (39.5%) |
| 75 Years and over | 48 (41.4%) | 99 (59.3%) |
| Total | 471 (33.0%) | 352 (25.5%) |
Income Below Poverty Among Married-Couple Families in Barranquitas
The poverty statistics for married-couple families in Barranquitas show that 28.2% or 33 of the total 117 families live below the poverty line. Families with no children have the highest poverty rate of 28.2%, comprising of 33 families. On the other hand, families with no children have the lowest poverty rate of 28.2%, which includes 33 families.
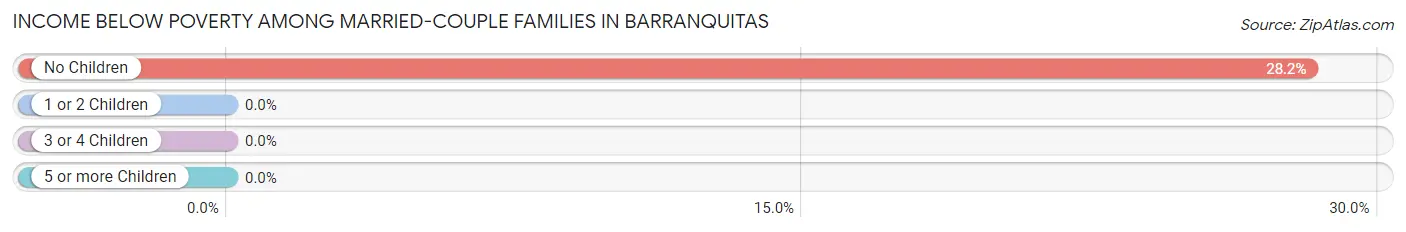
| Children | Above Poverty | Below Poverty |
| No Children | 84 (71.8%) | 33 (28.2%) |
| 1 or 2 Children | 0 (0.0%) | 0 (0.0%) |
| 3 or 4 Children | 0 (0.0%) | 0 (0.0%) |
| 5 or more Children | 0 (0.0%) | 0 (0.0%) |
| Total | 84 (71.8%) | 33 (28.2%) |
Income Below Poverty Among Single-Parent Households in Barranquitas
According to the poverty data in Barranquitas, 25.4% or 18 single-father households and 87.9% or 384 single-mother households are living below the poverty line. Among single-father households, those with no children have the highest poverty rate, with 18 households (36.7%) experiencing poverty. Likewise, among single-mother households, those with 1 or 2 children have the highest poverty rate, with 158 households (100.0%) falling below the poverty line.
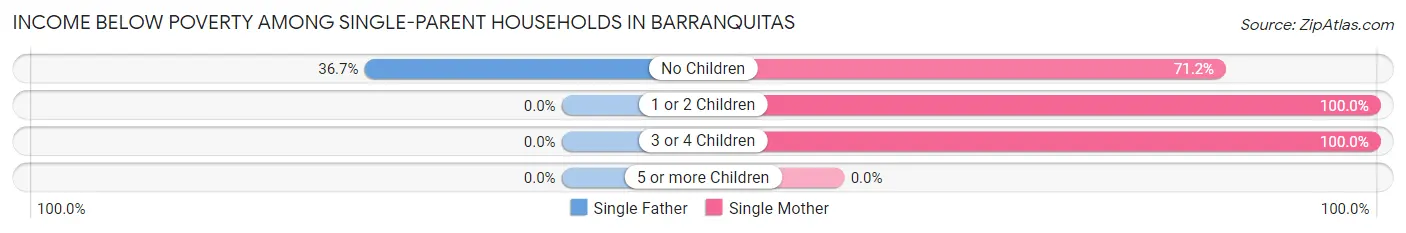
| Children | Single Father | Single Mother |
| No Children | 18 (36.7%) | 131 (71.2%) |
| 1 or 2 Children | 0 (0.0%) | 158 (100.0%) |
| 3 or 4 Children | 0 (0.0%) | 95 (100.0%) |
| 5 or more Children | 0 (0.0%) | 0 (0.0%) |
| Total | 18 (25.4%) | 384 (87.9%) |
Income Below Poverty Among Married-Couple vs Single-Parent Households in Barranquitas
The poverty data for Barranquitas shows that 33 of the married-couple family households (28.2%) and 402 of the single-parent households (79.1%) are living below the poverty level. Within the married-couple family households, those with no children have the highest poverty rate, with 33 households (28.2%) falling below the poverty line. Among the single-parent households, those with 3 or 4 children have the highest poverty rate, with 95 household (100.0%) living below poverty.
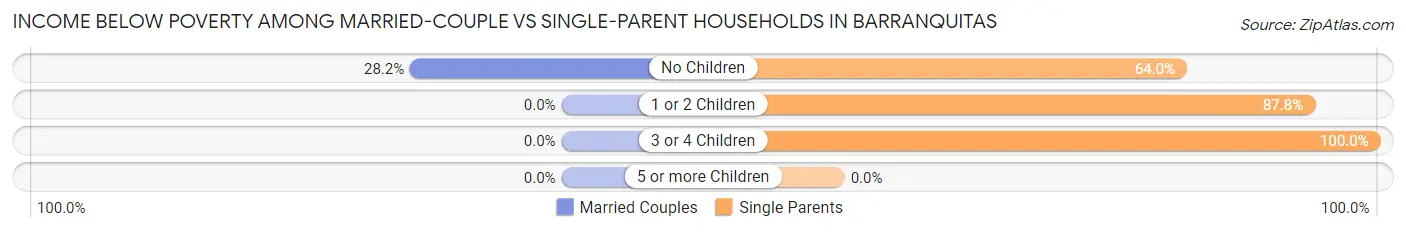
| Children | Married-Couple Families | Single-Parent Households |
| No Children | 33 (28.2%) | 149 (63.9%) |
| 1 or 2 Children | 0 (0.0%) | 158 (87.8%) |
| 3 or 4 Children | 0 (0.0%) | 95 (100.0%) |
| 5 or more Children | 0 (0.0%) | 0 (0.0%) |
| Total | 33 (28.2%) | 402 (79.1%) |
Race in Barranquitas
The most populous races in Barranquitas are Hispanic or Latino (2,812 | 99.7%), White / Caucasian (1,629 | 57.8%), and Two or more Races (745 | 26.4%).
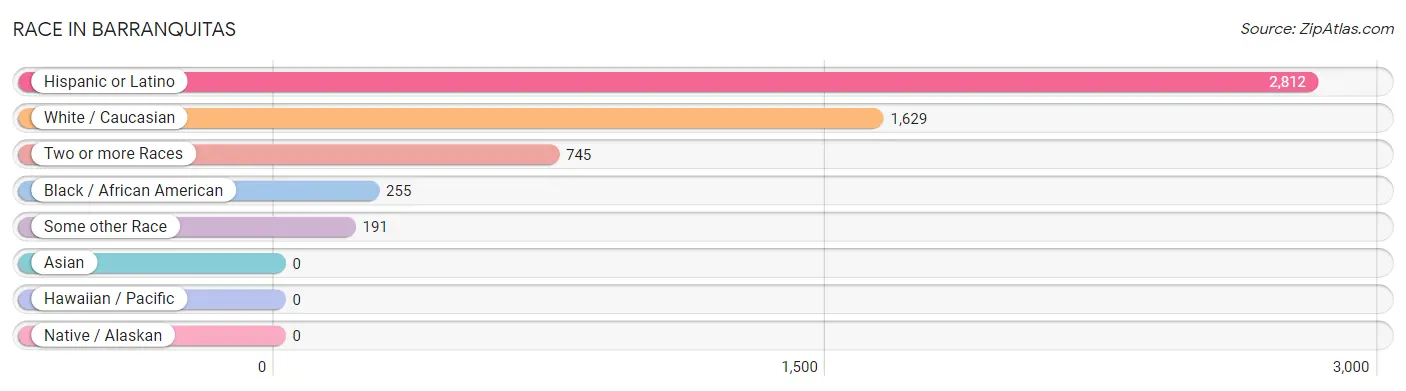
| Race | # Population | % Population |
| Asian | 0 | 0.0% |
| Black / African American | 255 | 9.0% |
| Hawaiian / Pacific | 0 | 0.0% |
| Hispanic or Latino | 2,812 | 99.7% |
| Native / Alaskan | 0 | 0.0% |
| White / Caucasian | 1,629 | 57.8% |
| Two or more Races | 745 | 26.4% |
| Some other Race | 191 | 6.8% |
| Total | 2,820 | 100.0% |
Ancestry in Barranquitas
The most populous ancestries reported in Barranquitas are Puerto Rican (2,772 | 98.3%), African (37 | 1.3%), Subsaharan African (37 | 1.3%), Dominican (31 | 1.1%), and Spaniard (9 | 0.3%), together accounting for 102.3% of all Barranquitas residents.
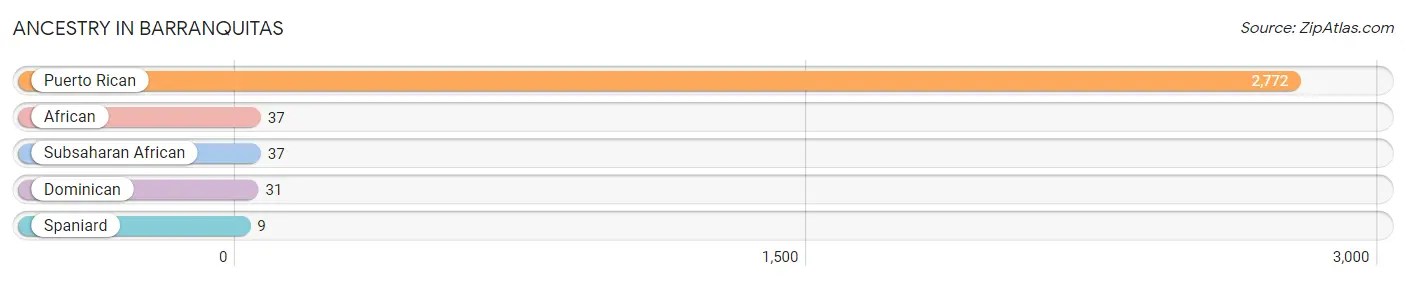
| Ancestry | # Population | % Population |
| African | 37 | 1.3% |
| Dominican | 31 | 1.1% |
| Puerto Rican | 2,772 | 98.3% |
| Spaniard | 9 | 0.3% |
| Subsaharan African | 37 | 1.3% | View All 5 Rows |
Immigrants in Barranquitas

| Immigration Origin | # Population | % Population | View All 0 Rows |
Sex and Age in Barranquitas
Sex and Age in Barranquitas
The most populous age groups in Barranquitas are 20 to 24 Years (205 | 14.3%) for men and 10 to 14 Years (179 | 13.0%) for women.
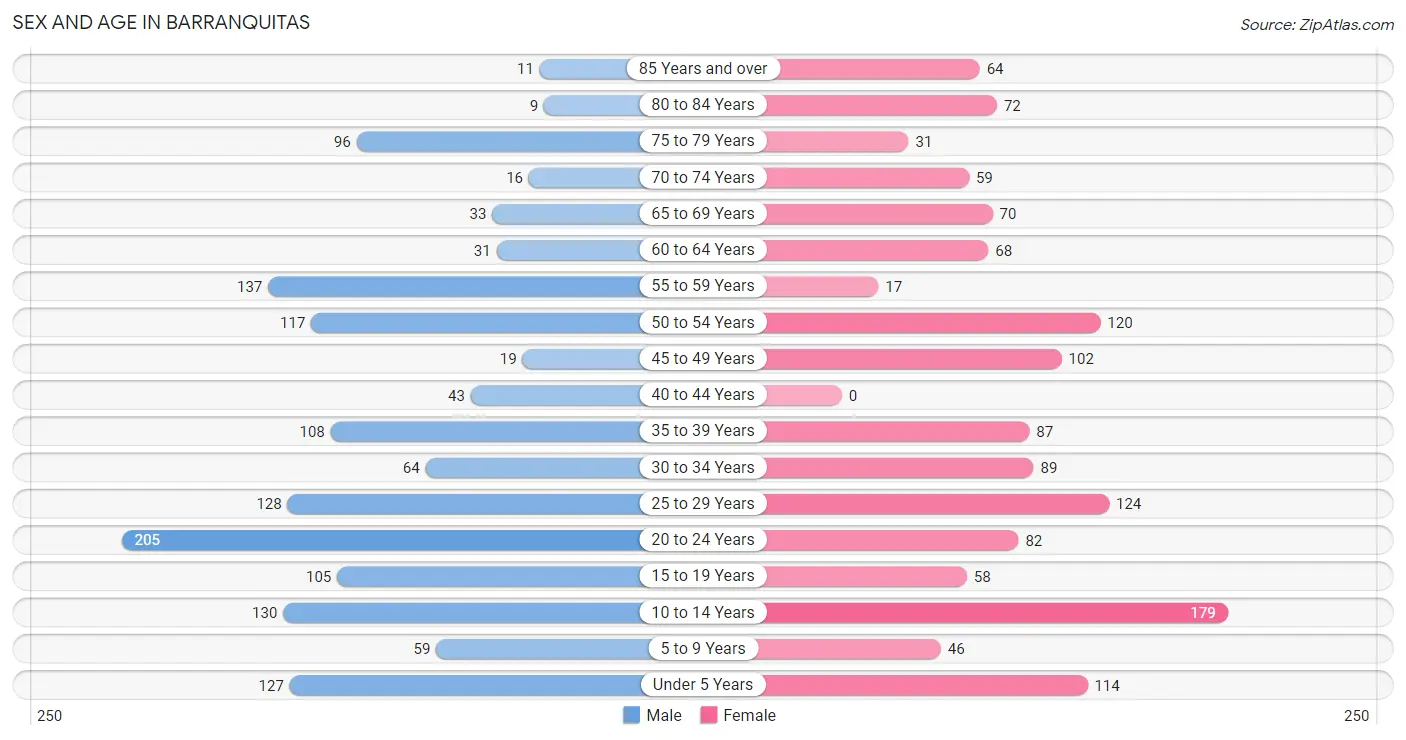
| Age Bracket | Male | Female |
| Under 5 Years | 127 (8.8%) | 114 (8.3%) |
| 5 to 9 Years | 59 (4.1%) | 46 (3.3%) |
| 10 to 14 Years | 130 (9.0%) | 179 (13.0%) |
| 15 to 19 Years | 105 (7.3%) | 58 (4.2%) |
| 20 to 24 Years | 205 (14.3%) | 82 (5.9%) |
| 25 to 29 Years | 128 (8.9%) | 124 (9.0%) |
| 30 to 34 Years | 64 (4.4%) | 89 (6.4%) |
| 35 to 39 Years | 108 (7.5%) | 87 (6.3%) |
| 40 to 44 Years | 43 (3.0%) | 0 (0.0%) |
| 45 to 49 Years | 19 (1.3%) | 102 (7.4%) |
| 50 to 54 Years | 117 (8.1%) | 120 (8.7%) |
| 55 to 59 Years | 137 (9.5%) | 17 (1.2%) |
| 60 to 64 Years | 31 (2.2%) | 68 (4.9%) |
| 65 to 69 Years | 33 (2.3%) | 70 (5.1%) |
| 70 to 74 Years | 16 (1.1%) | 59 (4.3%) |
| 75 to 79 Years | 96 (6.7%) | 31 (2.2%) |
| 80 to 84 Years | 9 (0.6%) | 72 (5.2%) |
| 85 Years and over | 11 (0.8%) | 64 (4.6%) |
| Total | 1,438 (100.0%) | 1,382 (100.0%) |
Families and Households in Barranquitas
Median Family Size in Barranquitas
The median family size in Barranquitas is 3.77 persons per family, with single female/mother families (437 | 69.9%) accounting for the largest median family size of 4.16 persons per family. On the other hand, married-couple families (117 | 18.7%) represent the smallest median family size with 2.66 persons per family.
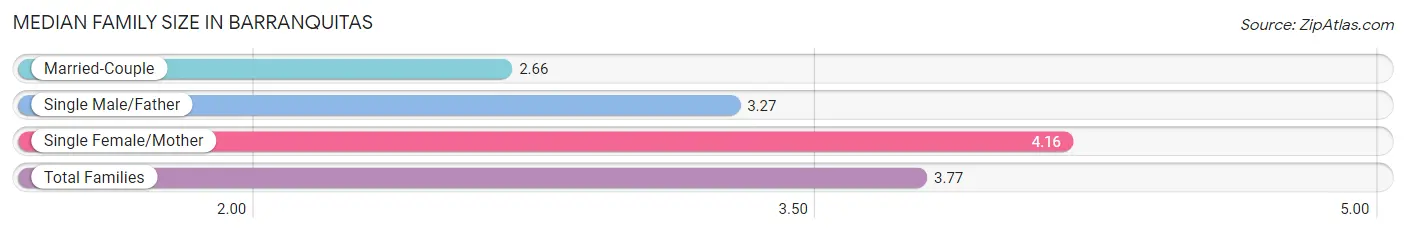
| Family Type | # Families | Family Size |
| Married-Couple | 117 (18.7%) | 2.66 |
| Single Male/Father | 71 (11.4%) | 3.27 |
| Single Female/Mother | 437 (69.9%) | 4.16 |
| Total Families | 625 (100.0%) | 3.77 |
Median Household Size in Barranquitas
The median household size in Barranquitas is 3.27 persons per household, with single female/mother households (437 | 50.9%) accounting for the largest median household size of 4.48 persons per household. non-family households (233 | 27.2%) represent the smallest median household size with 1.11 persons per household.
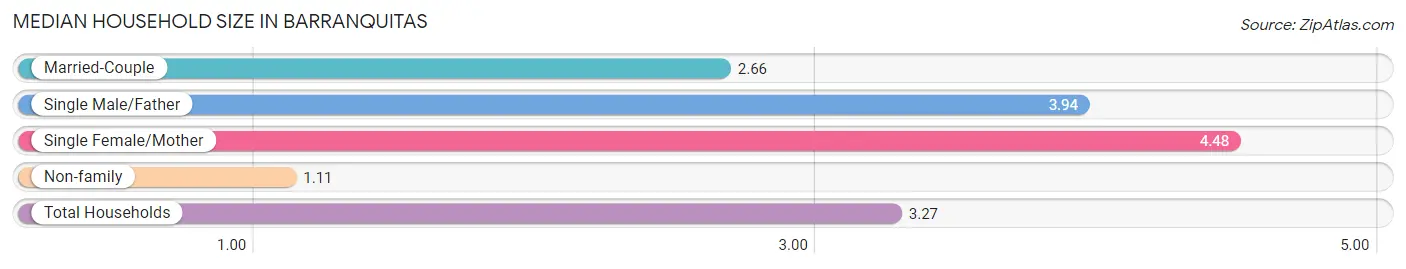
| Household Type | # Households | Household Size |
| Married-Couple | 117 (13.6%) | 2.66 |
| Single Male/Father | 71 (8.3%) | 3.94 |
| Single Female/Mother | 437 (50.9%) | 4.48 |
| Non-family | 233 (27.2%) | 1.11 |
| Total Households | 858 (100.0%) | 3.27 |
Household Size by Marriage Status in Barranquitas
Out of a total of 858 households in Barranquitas, 625 (72.8%) are family households, while 233 (27.2%) are nonfamily households. The most numerous type of family households are 3-person households, comprising 236, and the most common type of nonfamily households are 1-person households, comprising 208.
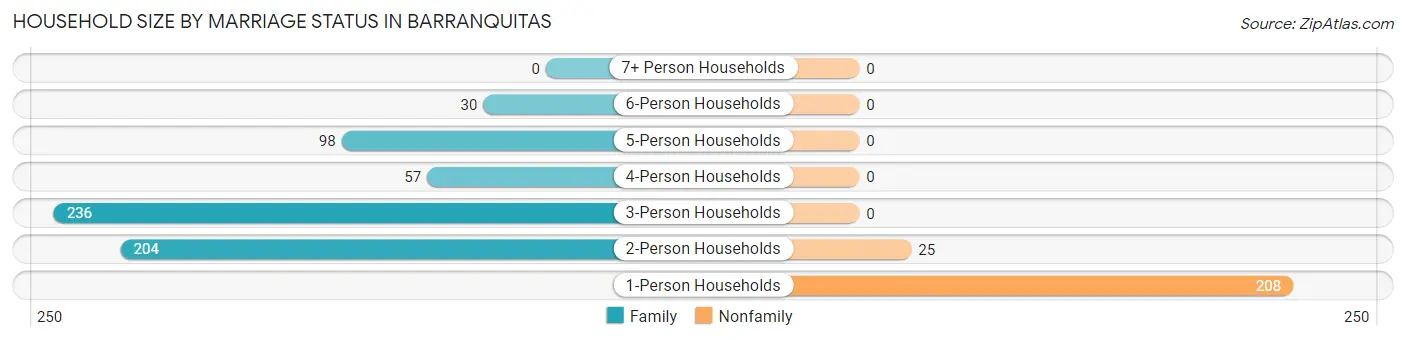
| Household Size | Family Households | Nonfamily Households |
| 1-Person Households | - | 208 (24.2%) |
| 2-Person Households | 204 (23.8%) | 25 (2.9%) |
| 3-Person Households | 236 (27.5%) | 0 (0.0%) |
| 4-Person Households | 57 (6.6%) | 0 (0.0%) |
| 5-Person Households | 98 (11.4%) | 0 (0.0%) |
| 6-Person Households | 30 (3.5%) | 0 (0.0%) |
| 7+ Person Households | 0 (0.0%) | 0 (0.0%) |
| Total | 625 (72.8%) | 233 (27.2%) |
Female Fertility in Barranquitas
Fertility by Age in Barranquitas
Average fertility rate in Barranquitas is 32.0 births per 1,000 women. Women in the age bracket of 20 to 34 years have the highest fertility rate with 61.0 births per 1,000 women. Women in the age bracket of 20 to 34 years acount for 100.0% of all women with births.
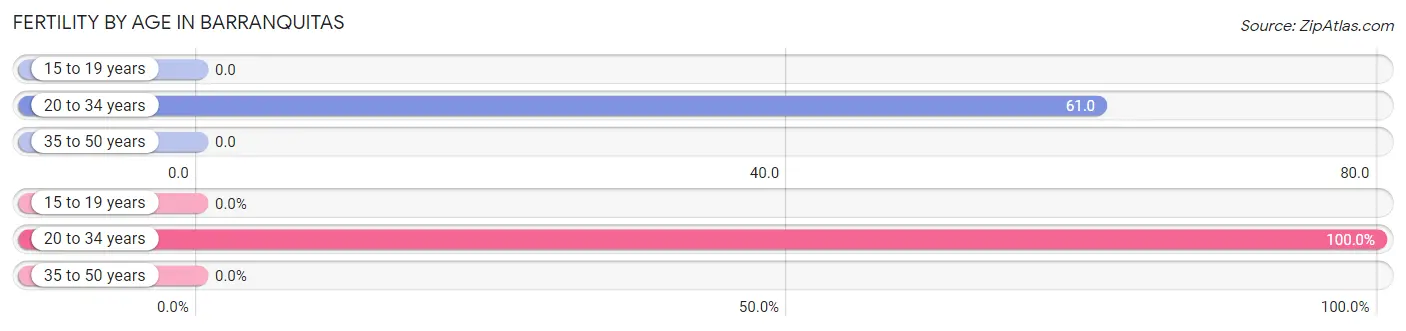
| Age Bracket | Women with Births | Births / 1,000 Women |
| 15 to 19 years | 0 (0.0%) | 0.0 |
| 20 to 34 years | 18 (100.0%) | 61.0 |
| 35 to 50 years | 0 (0.0%) | 0.0 |
| Total | 18 (100.0%) | 32.0 |
Fertility by Age by Marriage Status in Barranquitas
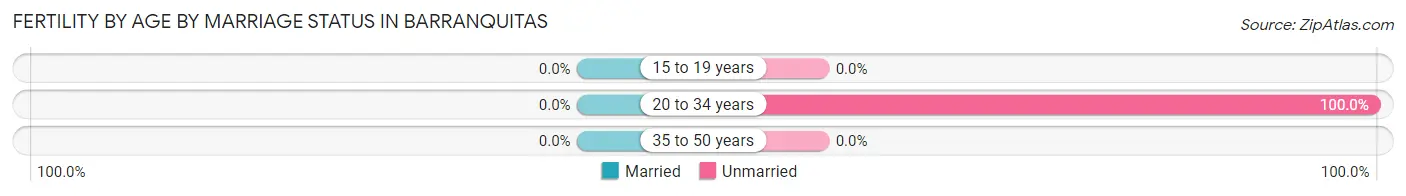
| Age Bracket | Married | Unmarried |
| 15 to 19 years | 0 (0.0%) | 0 (0.0%) |
| 20 to 34 years | 0 (0.0%) | 18 (100.0%) |
| 35 to 50 years | 0 (0.0%) | 0 (0.0%) |
| Total | 0 (0.0%) | 18 (100.0%) |
Fertility by Education in Barranquitas
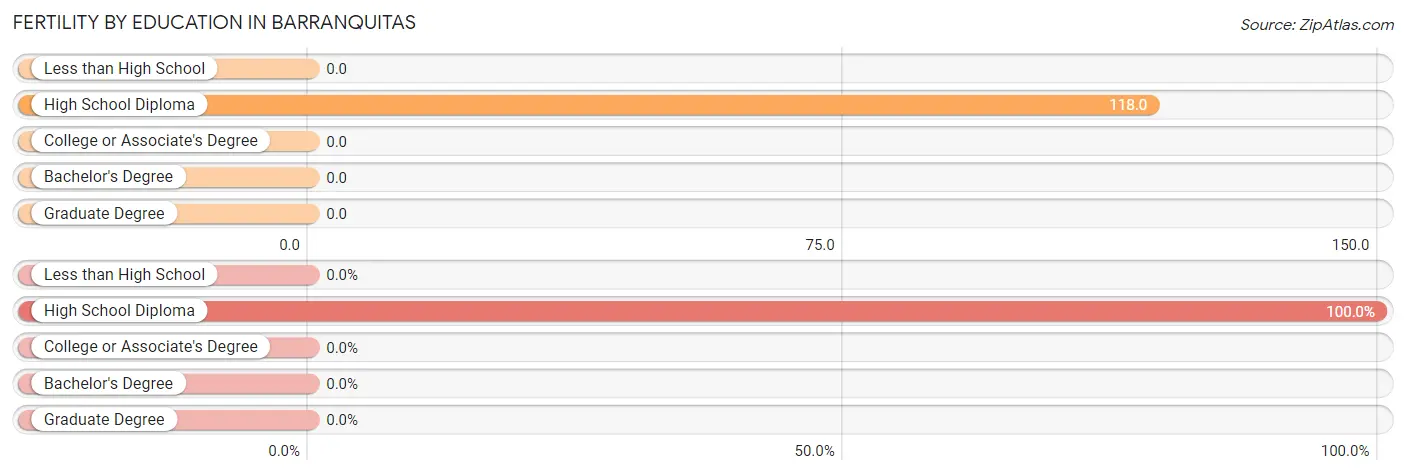
| Educational Attainment | Women with Births | Births / 1,000 Women |
| Less than High School | 0 (0.0%) | 0.0 |
| High School Diploma | 18 (100.0%) | 118.0 |
| College or Associate's Degree | 0 (0.0%) | 0.0 |
| Bachelor's Degree | 0 (0.0%) | 0.0 |
| Graduate Degree | 0 (0.0%) | 0.0 |
| Total | 18 (100.0%) | 32.0 |
Fertility by Education by Marriage Status in Barranquitas
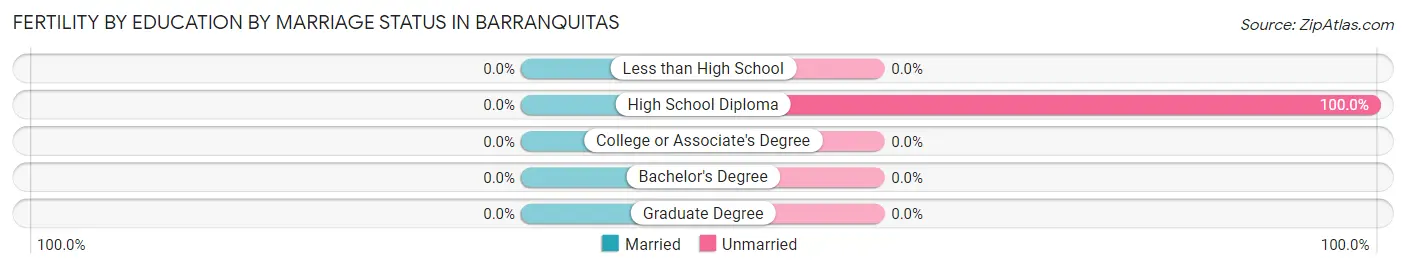
| Educational Attainment | Married | Unmarried |
| Less than High School | 0 (0.0%) | 0 (0.0%) |
| High School Diploma | 0 (0.0%) | 18 (100.0%) |
| College or Associate's Degree | 0 (0.0%) | 0 (0.0%) |
| Bachelor's Degree | 0 (0.0%) | 0 (0.0%) |
| Graduate Degree | 0 (0.0%) | 0 (0.0%) |
| Total | 0 (0.0%) | 18 (100.0%) |
Employment Characteristics in Barranquitas
Employment by Class of Employer in Barranquitas
Among the 593 employed individuals in Barranquitas, private company employees (390 | 65.8%), state government employees (94 | 15.9%), and self-employed (incorporated) (68 | 11.5%) make up the most common classes of employment.
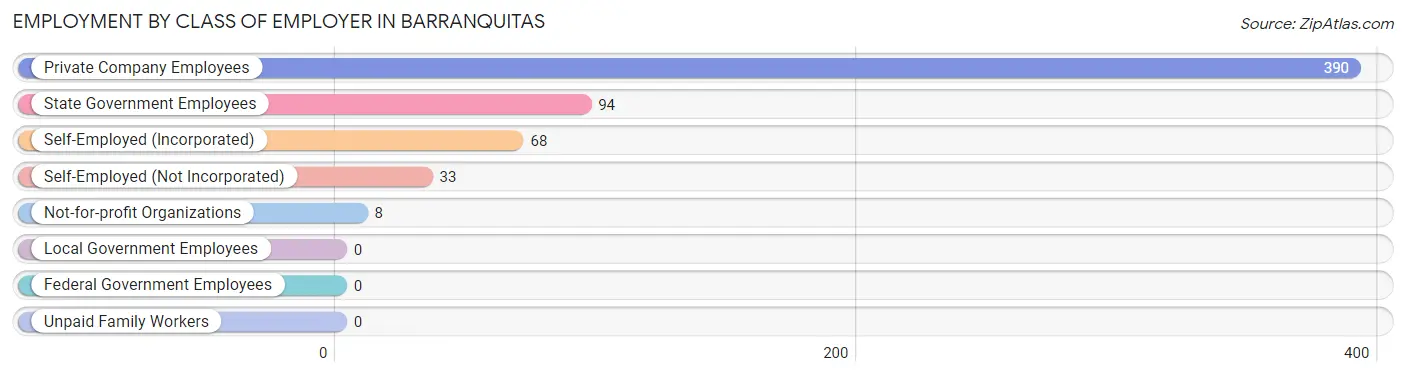
| Employer Class | # Employees | % Employees |
| Private Company Employees | 390 | 65.8% |
| Self-Employed (Incorporated) | 68 | 11.5% |
| Self-Employed (Not Incorporated) | 33 | 5.6% |
| Not-for-profit Organizations | 8 | 1.3% |
| Local Government Employees | 0 | 0.0% |
| State Government Employees | 94 | 15.9% |
| Federal Government Employees | 0 | 0.0% |
| Unpaid Family Workers | 0 | 0.0% |
| Total | 593 | 100.0% |
Employment Status by Age in Barranquitas
According to the labor force statistics for Barranquitas, out of the total population over 16 years of age (2,132), 39.5% or 842 individuals are in the labor force, with 28.1% or 237 of them unemployed. The age group with the highest labor force participation rate is 25 to 29 years, with 84.9% or 214 individuals in the labor force. Within the labor force, the 35 to 44 years age range has the highest percentage of unemployed individuals, with 49.7% or 84 of them being unemployed.
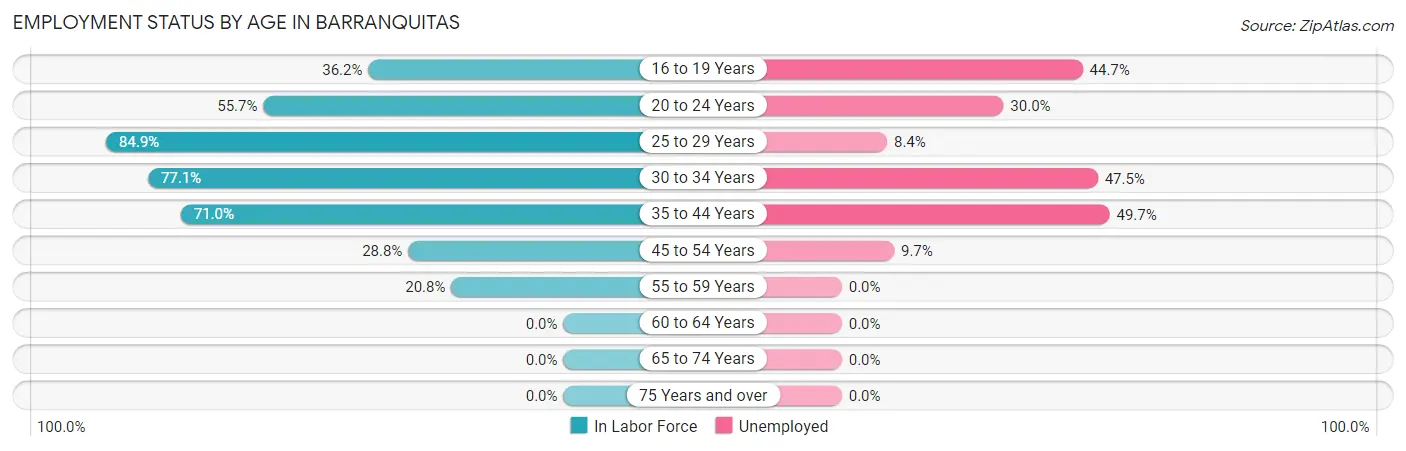
| Age Bracket | In Labor Force | Unemployed |
| 16 to 19 Years | 47 (36.2%) | 21 (44.7%) |
| 20 to 24 Years | 160 (55.7%) | 48 (30.0%) |
| 25 to 29 Years | 214 (84.9%) | 18 (8.4%) |
| 30 to 34 Years | 118 (77.1%) | 56 (47.5%) |
| 35 to 44 Years | 169 (71.0%) | 84 (49.7%) |
| 45 to 54 Years | 103 (28.8%) | 10 (9.7%) |
| 55 to 59 Years | 32 (20.8%) | 0 (0.0%) |
| 60 to 64 Years | 0 (0.0%) | 0 (0.0%) |
| 65 to 74 Years | 0 (0.0%) | 0 (0.0%) |
| 75 Years and over | 0 (0.0%) | 0 (0.0%) |
| Total | 842 (39.5%) | 237 (28.1%) |
Employment Status by Educational Attainment in Barranquitas
According to labor force statistics for Barranquitas, 50.7% of individuals (636) out of the total population between 25 and 64 years of age (1,254) are in the labor force, with 26.4% or 168 of them being unemployed. The group with the highest labor force participation rate are those with the educational attainment of high school diploma, with 59.9% or 229 individuals in the labor force. Within the labor force, individuals with high school diploma education have the highest percentage of unemployment, with 50.7% or 116 of them being unemployed.
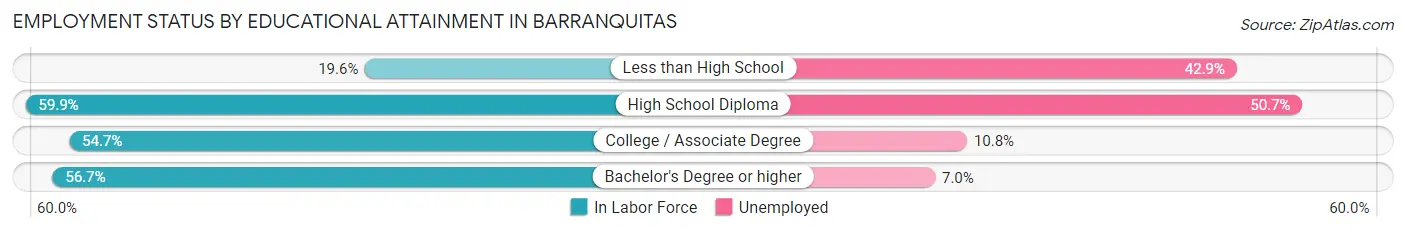
| Educational Attainment | In Labor Force | Unemployed |
| Less than High School | 42 (19.6%) | 92 (42.9%) |
| High School Diploma | 229 (59.9%) | 194 (50.7%) |
| College / Associate Degree | 222 (54.7%) | 44 (10.8%) |
| Bachelor's Degree or higher | 143 (56.7%) | 18 (7.0%) |
| Total | 636 (50.7%) | 331 (26.4%) |
Employment Occupations by Sex in Barranquitas
Management, Business, Science and Arts Occupations
The most common Management, Business, Science and Arts occupations in Barranquitas are Health Diagnosing & Treating (53 | 8.7%), and Health Technologists (53 | 8.7%).
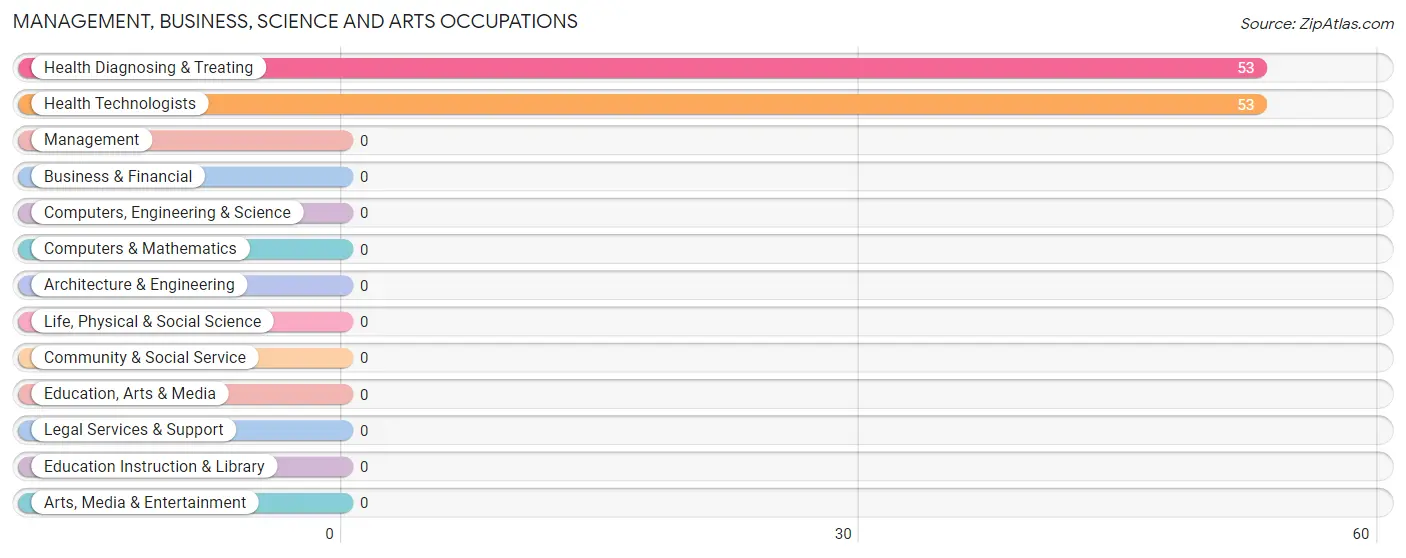
Management, Business, Science and Arts Occupations by Sex
Within the Management, Business, Science and Arts occupations in Barranquitas, the most male-oriented occupations are Health Diagnosing & Treating (84.9%), and Health Technologists (84.9%), while the most female-oriented occupations are Health Diagnosing & Treating (15.1%), and Health Technologists (15.1%).
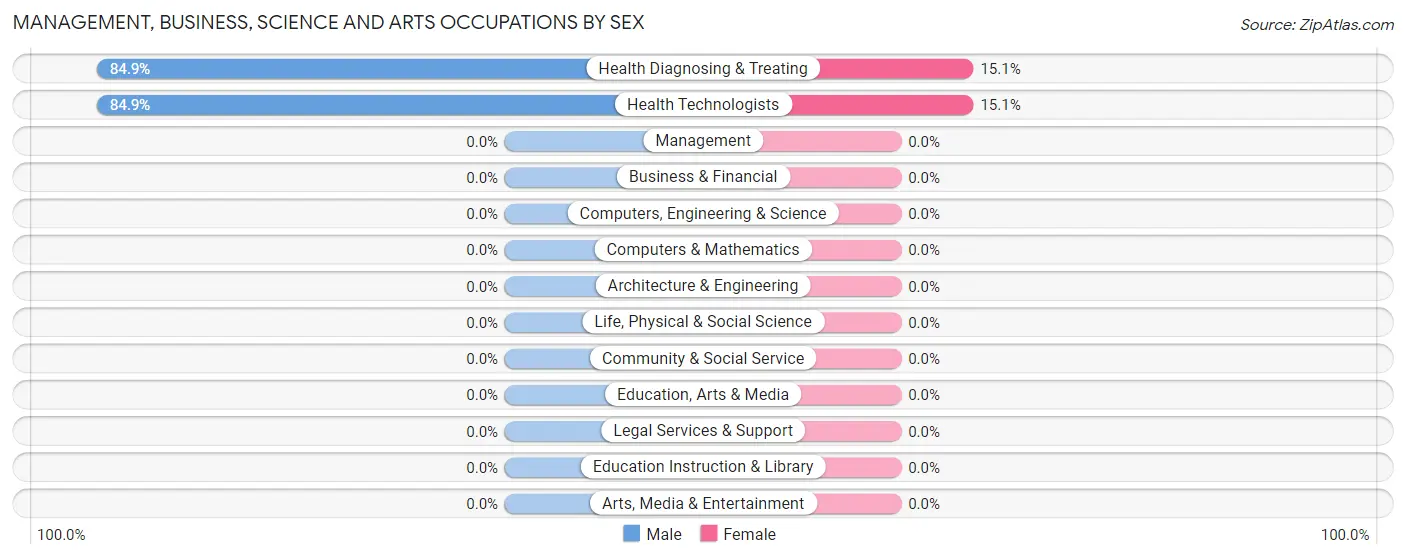
| Occupation | Male | Female |
| Management | 0 (0.0%) | 0 (0.0%) |
| Business & Financial | 0 (0.0%) | 0 (0.0%) |
| Computers, Engineering & Science | 0 (0.0%) | 0 (0.0%) |
| Computers & Mathematics | 0 (0.0%) | 0 (0.0%) |
| Architecture & Engineering | 0 (0.0%) | 0 (0.0%) |
| Life, Physical & Social Science | 0 (0.0%) | 0 (0.0%) |
| Community & Social Service | 0 (0.0%) | 0 (0.0%) |
| Education, Arts & Media | 0 (0.0%) | 0 (0.0%) |
| Legal Services & Support | 0 (0.0%) | 0 (0.0%) |
| Education Instruction & Library | 0 (0.0%) | 0 (0.0%) |
| Arts, Media & Entertainment | 0 (0.0%) | 0 (0.0%) |
| Health Diagnosing & Treating | 45 (84.9%) | 8 (15.1%) |
| Health Technologists | 45 (84.9%) | 8 (15.1%) |
| Total (Category) | 45 (84.9%) | 8 (15.1%) |
| Total (Overall) | 458 (75.6%) | 148 (24.4%) |
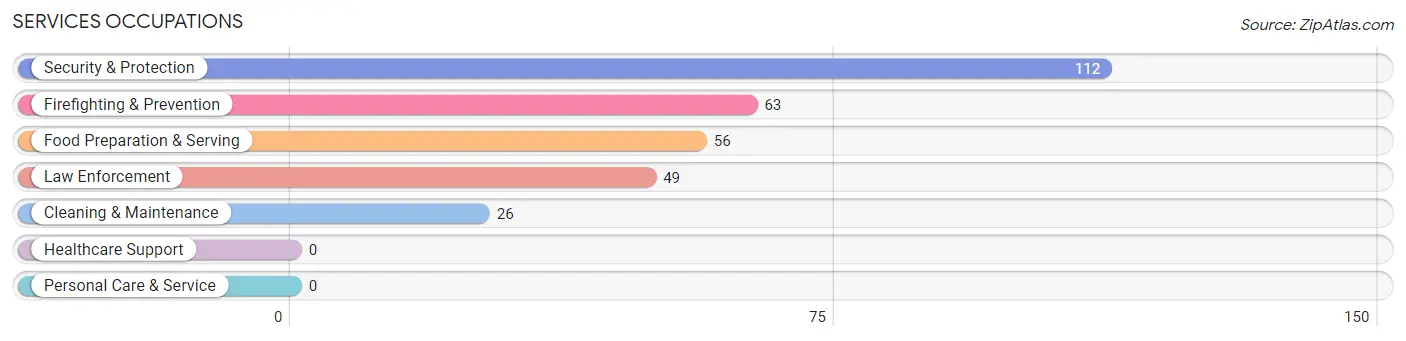
Services Occupations
The most common Services occupations in Barranquitas are Security & Protection (112 | 18.5%), Firefighting & Prevention (63 | 10.4%), Food Preparation & Serving (56 | 9.2%), Law Enforcement (49 | 8.1%), and Cleaning & Maintenance (26 | 4.3%).
Services Occupations by Sex
Within the Services occupations in Barranquitas, the most male-oriented occupations are Security & Protection (100.0%), Firefighting & Prevention (100.0%), and Law Enforcement (100.0%), while the most female-oriented occupations are Cleaning & Maintenance (100.0%), and Food Preparation & Serving (53.6%).
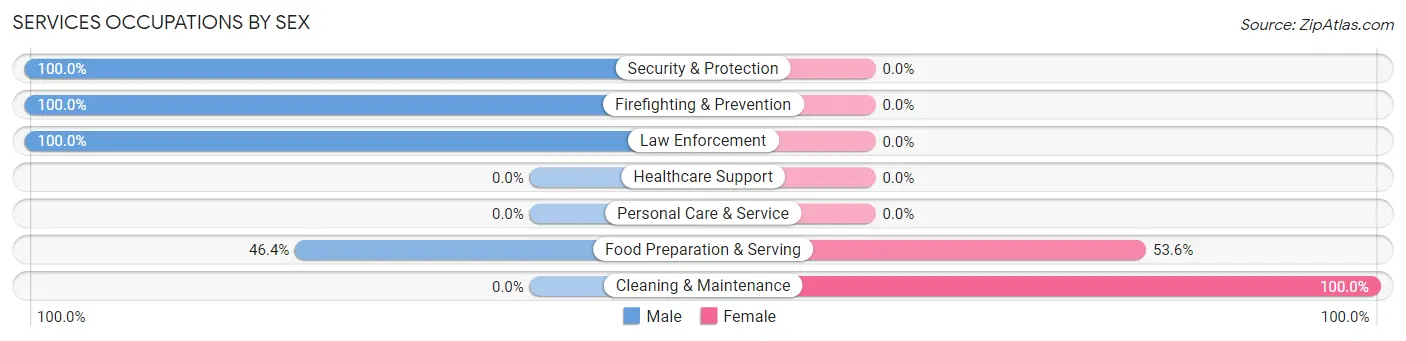
| Occupation | Male | Female |
| Healthcare Support | 0 (0.0%) | 0 (0.0%) |
| Security & Protection | 112 (100.0%) | 0 (0.0%) |
| Firefighting & Prevention | 63 (100.0%) | 0 (0.0%) |
| Law Enforcement | 49 (100.0%) | 0 (0.0%) |
| Food Preparation & Serving | 26 (46.4%) | 30 (53.6%) |
| Cleaning & Maintenance | 0 (0.0%) | 26 (100.0%) |
| Personal Care & Service | 0 (0.0%) | 0 (0.0%) |
| Total (Category) | 138 (71.1%) | 56 (28.9%) |
| Total (Overall) | 458 (75.6%) | 148 (24.4%) |
Sales and Office Occupations
The most common Sales and Office occupations in Barranquitas are Sales & Related (126 | 20.8%), and Office & Administration (53 | 8.7%).

Sales and Office Occupations by Sex

| Occupation | Male | Female |
| Sales & Related | 73 (57.9%) | 53 (42.1%) |
| Office & Administration | 22 (41.5%) | 31 (58.5%) |
| Total (Category) | 95 (53.1%) | 84 (46.9%) |
| Total (Overall) | 458 (75.6%) | 148 (24.4%) |
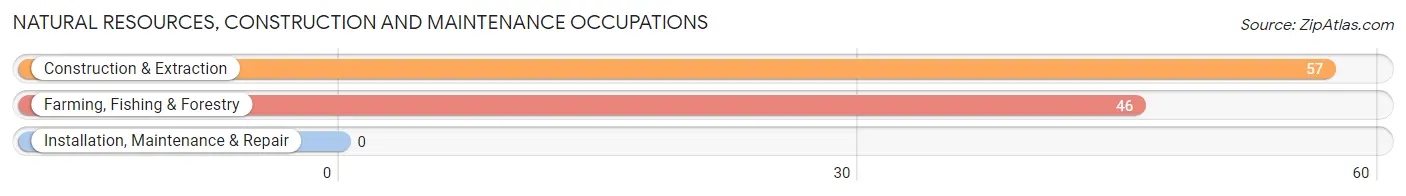
Natural Resources, Construction and Maintenance Occupations
The most common Natural Resources, Construction and Maintenance occupations in Barranquitas are Construction & Extraction (57 | 9.4%), and Farming, Fishing & Forestry (46 | 7.6%).
Natural Resources, Construction and Maintenance Occupations by Sex

| Occupation | Male | Female |
| Farming, Fishing & Forestry | 46 (100.0%) | 0 (0.0%) |
| Construction & Extraction | 57 (100.0%) | 0 (0.0%) |
| Installation, Maintenance & Repair | 0 (0.0%) | 0 (0.0%) |
| Total (Category) | 103 (100.0%) | 0 (0.0%) |
| Total (Overall) | 458 (75.6%) | 148 (24.4%) |
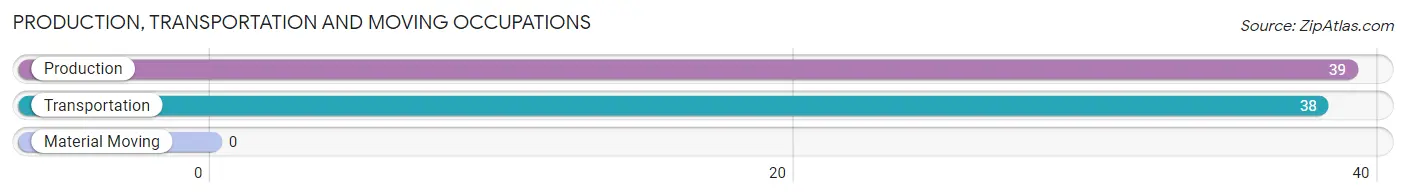
Production, Transportation and Moving Occupations
The most common Production, Transportation and Moving occupations in Barranquitas are Production (39 | 6.4%), and Transportation (38 | 6.3%).
Production, Transportation and Moving Occupations by Sex
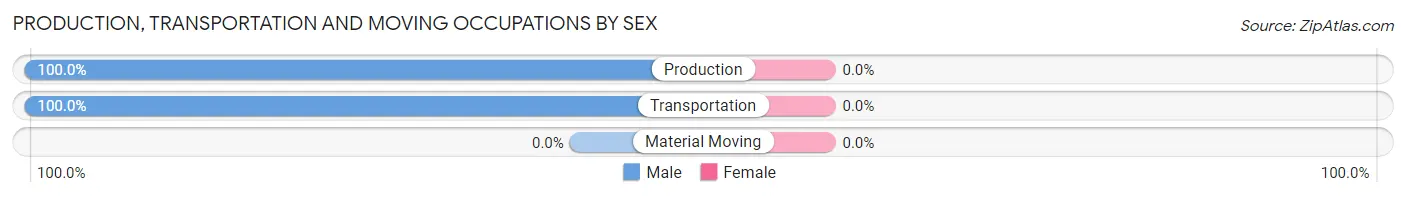
| Occupation | Male | Female |
| Production | 39 (100.0%) | 0 (0.0%) |
| Transportation | 38 (100.0%) | 0 (0.0%) |
| Material Moving | 0 (0.0%) | 0 (0.0%) |
| Total (Category) | 77 (100.0%) | 0 (0.0%) |
| Total (Overall) | 458 (75.6%) | 148 (24.4%) |
Employment Industries by Sex in Barranquitas
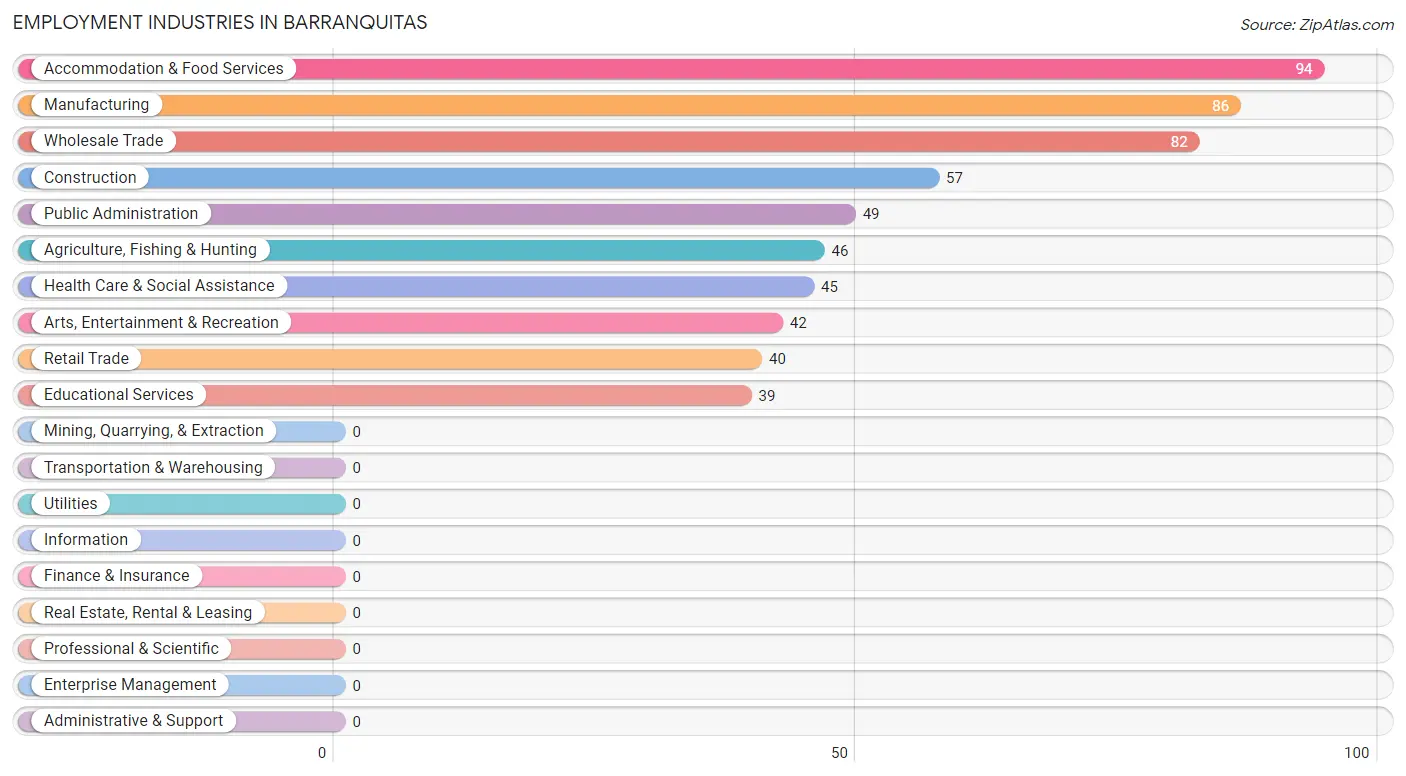
Employment Industries in Barranquitas
The major employment industries in Barranquitas include Accommodation & Food Services (94 | 15.5%), Manufacturing (86 | 14.2%), Wholesale Trade (82 | 13.5%), Construction (57 | 9.4%), and Public Administration (49 | 8.1%).
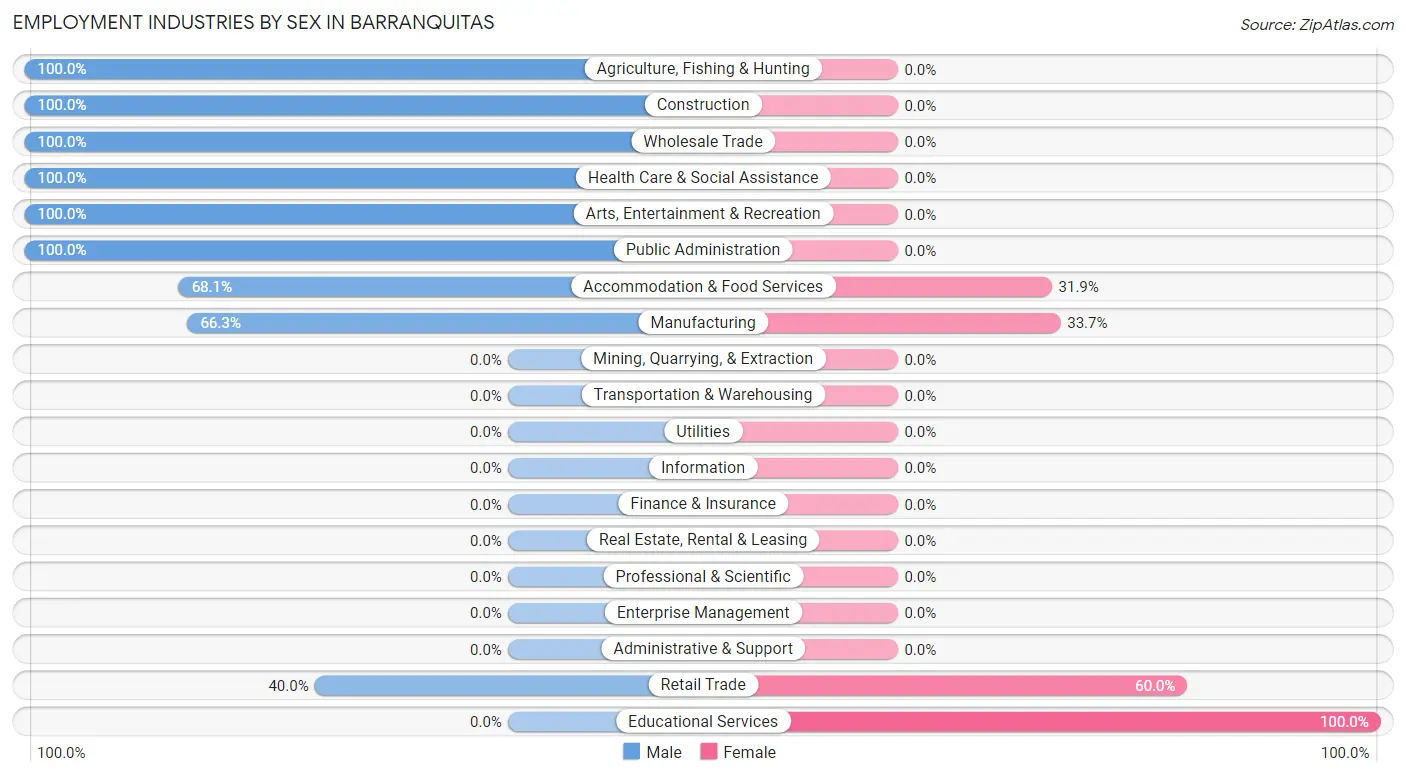
Employment Industries by Sex in Barranquitas
The Barranquitas industries that see more men than women are Agriculture, Fishing & Hunting (100.0%), Construction (100.0%), and Wholesale Trade (100.0%), whereas the industries that tend to have a higher number of women are Educational Services (100.0%), Retail Trade (60.0%), and Manufacturing (33.7%).
| Industry | Male | Female |
| Agriculture, Fishing & Hunting | 46 (100.0%) | 0 (0.0%) |
| Mining, Quarrying, & Extraction | 0 (0.0%) | 0 (0.0%) |
| Construction | 57 (100.0%) | 0 (0.0%) |
| Manufacturing | 57 (66.3%) | 29 (33.7%) |
| Wholesale Trade | 82 (100.0%) | 0 (0.0%) |
| Retail Trade | 16 (40.0%) | 24 (60.0%) |
| Transportation & Warehousing | 0 (0.0%) | 0 (0.0%) |
| Utilities | 0 (0.0%) | 0 (0.0%) |
| Information | 0 (0.0%) | 0 (0.0%) |
| Finance & Insurance | 0 (0.0%) | 0 (0.0%) |
| Real Estate, Rental & Leasing | 0 (0.0%) | 0 (0.0%) |
| Professional & Scientific | 0 (0.0%) | 0 (0.0%) |
| Enterprise Management | 0 (0.0%) | 0 (0.0%) |
| Administrative & Support | 0 (0.0%) | 0 (0.0%) |
| Educational Services | 0 (0.0%) | 39 (100.0%) |
| Health Care & Social Assistance | 45 (100.0%) | 0 (0.0%) |
| Arts, Entertainment & Recreation | 42 (100.0%) | 0 (0.0%) |
| Accommodation & Food Services | 64 (68.1%) | 30 (31.9%) |
| Public Administration | 49 (100.0%) | 0 (0.0%) |
| Total | 458 (75.6%) | 148 (24.4%) |
Education in Barranquitas
School Enrollment in Barranquitas
The most common levels of schooling among the 818 students in Barranquitas are middle school (309 | 37.8%), college / undergraduate (139 | 17.0%), and nursery / preschool (122 | 14.9%).
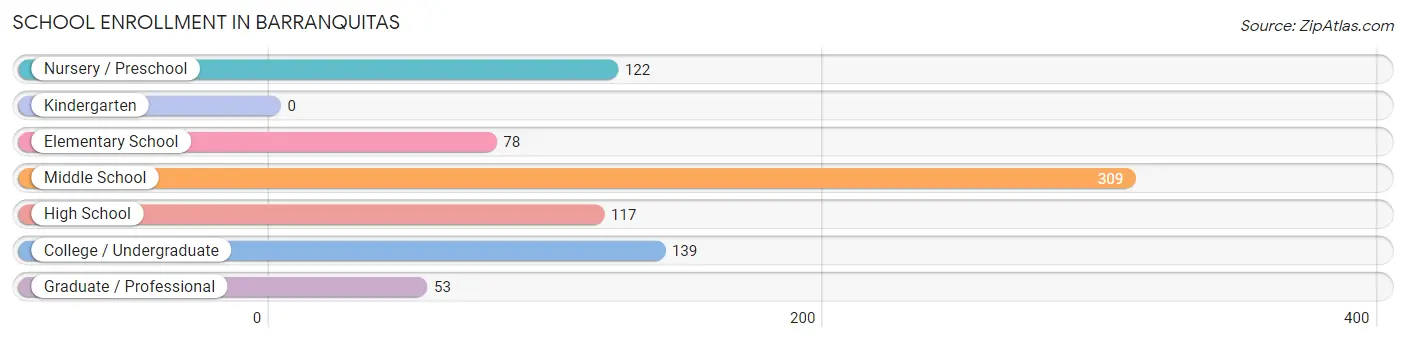
| School Level | # Students | % Students |
| Nursery / Preschool | 122 | 14.9% |
| Kindergarten | 0 | 0.0% |
| Elementary School | 78 | 9.5% |
| Middle School | 309 | 37.8% |
| High School | 117 | 14.3% |
| College / Undergraduate | 139 | 17.0% |
| Graduate / Professional | 53 | 6.5% |
| Total | 818 | 100.0% |
School Enrollment by Age by Funding Source in Barranquitas
Out of a total of 818 students who are enrolled in schools in Barranquitas, 220 (26.9%) attend a private institution, while the remaining 598 (73.1%) are enrolled in public schools. The age group of 18 to 19 year olds has the highest likelihood of being enrolled in private schools, with 17 (100.0% in the age bracket) enrolled. Conversely, the age group of 5 to 9 year old has the lowest likelihood of being enrolled in a private school, with 105 (100.0% in the age bracket) attending a public institution.
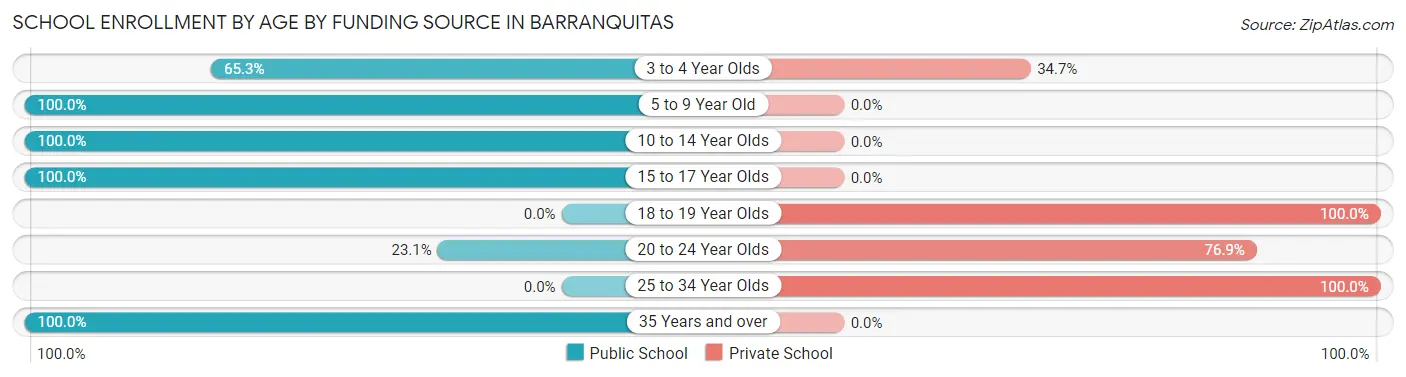
| Age Bracket | Public School | Private School |
| 3 to 4 Year Olds | 62 (65.3%) | 33 (34.7%) |
| 5 to 9 Year Old | 105 (100.0%) | 0 (0.0%) |
| 10 to 14 Year Olds | 309 (100.0%) | 0 (0.0%) |
| 15 to 17 Year Olds | 99 (100.0%) | 0 (0.0%) |
| 18 to 19 Year Olds | 0 (0.0%) | 17 (100.0%) |
| 20 to 24 Year Olds | 21 (23.1%) | 70 (76.9%) |
| 25 to 34 Year Olds | 0 (0.0%) | 100 (100.0%) |
| 35 Years and over | 2 (100.0%) | 0 (0.0%) |
| Total | 598 (73.1%) | 220 (26.9%) |
Educational Attainment by Field of Study in Barranquitas
Science & technology (83 | 24.6%), education (64 | 19.0%), liberal arts & history (49 | 14.5%), business (44 | 13.1%), and arts & humanities (42 | 12.5%) are the most common fields of study among 337 individuals in Barranquitas who have obtained a bachelor's degree or higher.
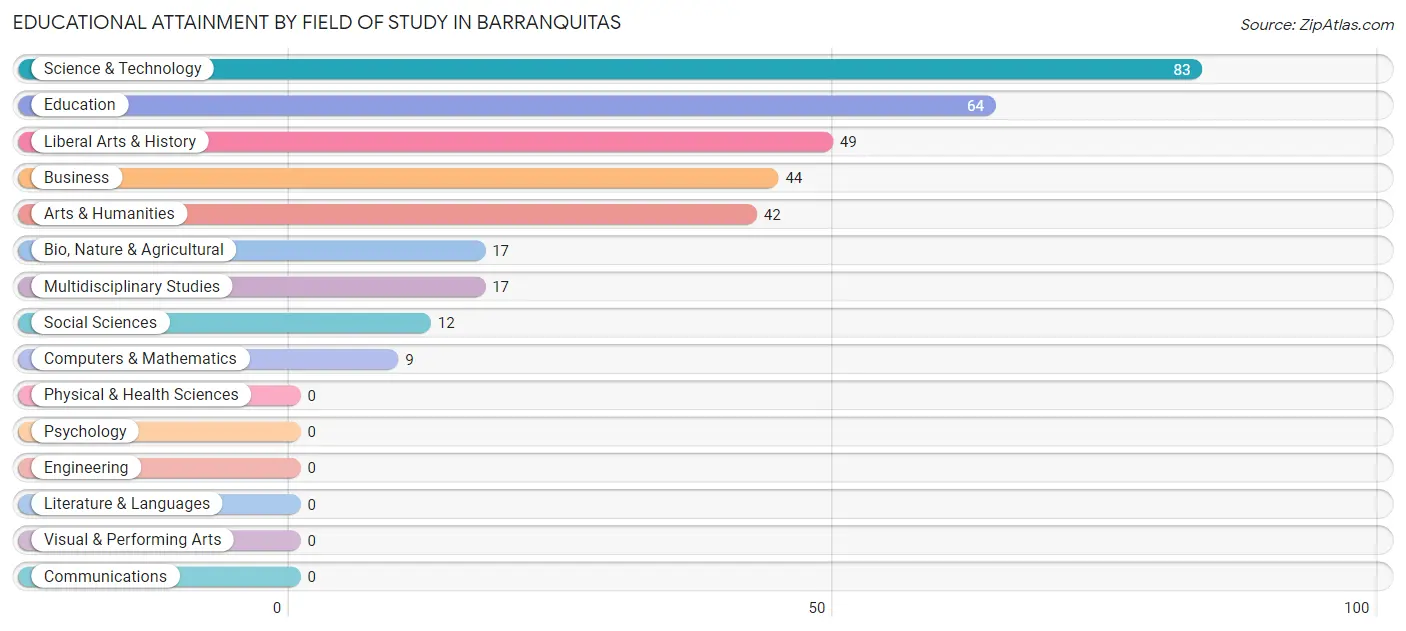
| Field of Study | # Graduates | % Graduates |
| Computers & Mathematics | 9 | 2.7% |
| Bio, Nature & Agricultural | 17 | 5.0% |
| Physical & Health Sciences | 0 | 0.0% |
| Psychology | 0 | 0.0% |
| Social Sciences | 12 | 3.6% |
| Engineering | 0 | 0.0% |
| Multidisciplinary Studies | 17 | 5.0% |
| Science & Technology | 83 | 24.6% |
| Business | 44 | 13.1% |
| Education | 64 | 19.0% |
| Literature & Languages | 0 | 0.0% |
| Liberal Arts & History | 49 | 14.5% |
| Visual & Performing Arts | 0 | 0.0% |
| Communications | 0 | 0.0% |
| Arts & Humanities | 42 | 12.5% |
| Total | 337 | 100.0% |
Transportation & Commute in Barranquitas
Vehicle Availability by Sex in Barranquitas
The most prevalent vehicle ownership categories in Barranquitas are males with 2 vehicles (197, accounting for 44.3%) and females with 2 vehicles (62, making up 133.1%).
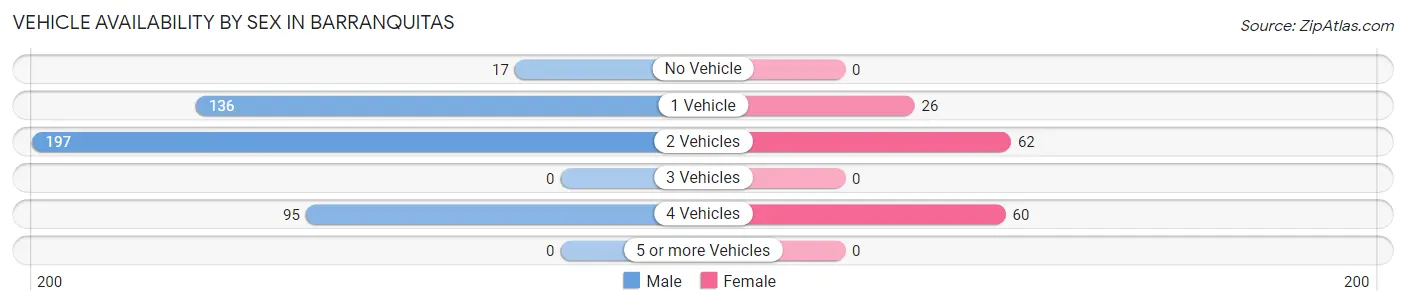
| Vehicles Available | Male | Female |
| No Vehicle | 17 (3.8%) | 0 (0.0%) |
| 1 Vehicle | 136 (30.6%) | 26 (17.6%) |
| 2 Vehicles | 197 (44.3%) | 62 (41.9%) |
| 3 Vehicles | 0 (0.0%) | 0 (0.0%) |
| 4 Vehicles | 95 (21.3%) | 60 (40.5%) |
| 5 or more Vehicles | 0 (0.0%) | 0 (0.0%) |
| Total | 445 (100.0%) | 148 (100.0%) |
Commute Time in Barranquitas
The most frequently occuring commute durations in Barranquitas are 90 or more minutes (107 commuters, 18.0%), 15 to 19 minutes (98 commuters, 16.5%), and 20 to 24 minutes (95 commuters, 16.0%).
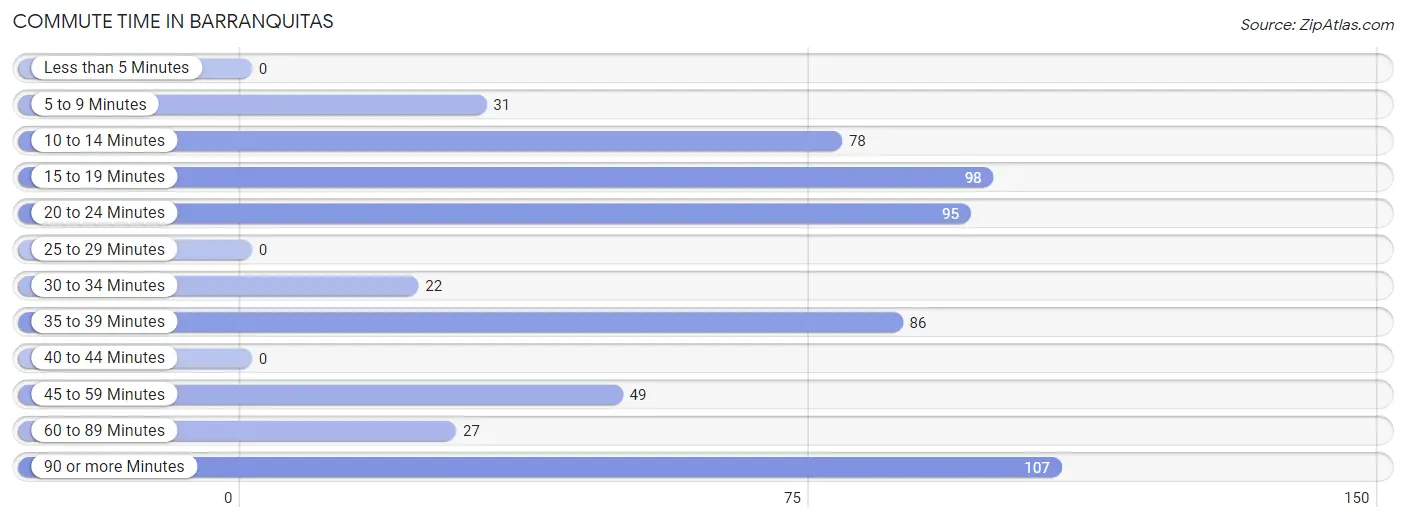
| Commute Time | # Commuters | % Commuters |
| Less than 5 Minutes | 0 | 0.0% |
| 5 to 9 Minutes | 31 | 5.2% |
| 10 to 14 Minutes | 78 | 13.2% |
| 15 to 19 Minutes | 98 | 16.5% |
| 20 to 24 Minutes | 95 | 16.0% |
| 25 to 29 Minutes | 0 | 0.0% |
| 30 to 34 Minutes | 22 | 3.7% |
| 35 to 39 Minutes | 86 | 14.5% |
| 40 to 44 Minutes | 0 | 0.0% |
| 45 to 59 Minutes | 49 | 8.3% |
| 60 to 89 Minutes | 27 | 4.5% |
| 90 or more Minutes | 107 | 18.0% |
Commute Time by Sex in Barranquitas
The most common commute times in Barranquitas are 90 or more minutes (107 commuters, 24.0%) for males and 15 to 19 minutes (56 commuters, 37.8%) for females.
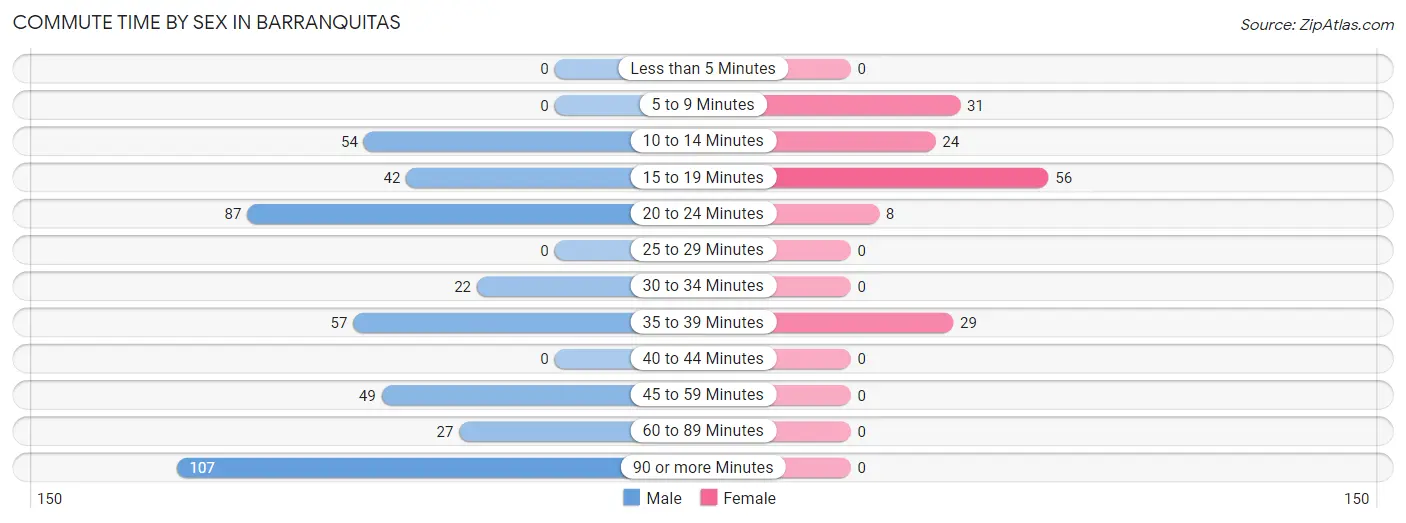
| Commute Time | Male | Female |
| Less than 5 Minutes | 0 (0.0%) | 0 (0.0%) |
| 5 to 9 Minutes | 0 (0.0%) | 31 (20.9%) |
| 10 to 14 Minutes | 54 (12.1%) | 24 (16.2%) |
| 15 to 19 Minutes | 42 (9.4%) | 56 (37.8%) |
| 20 to 24 Minutes | 87 (19.6%) | 8 (5.4%) |
| 25 to 29 Minutes | 0 (0.0%) | 0 (0.0%) |
| 30 to 34 Minutes | 22 (4.9%) | 0 (0.0%) |
| 35 to 39 Minutes | 57 (12.8%) | 29 (19.6%) |
| 40 to 44 Minutes | 0 (0.0%) | 0 (0.0%) |
| 45 to 59 Minutes | 49 (11.0%) | 0 (0.0%) |
| 60 to 89 Minutes | 27 (6.1%) | 0 (0.0%) |
| 90 or more Minutes | 107 (24.0%) | 0 (0.0%) |
Time of Departure to Work by Sex in Barranquitas
The most frequent times of departure to work in Barranquitas are 5:30 AM to 5:59 AM (95, 21.3%) for males and 7:00 AM to 7:29 AM (32, 21.6%) for females.
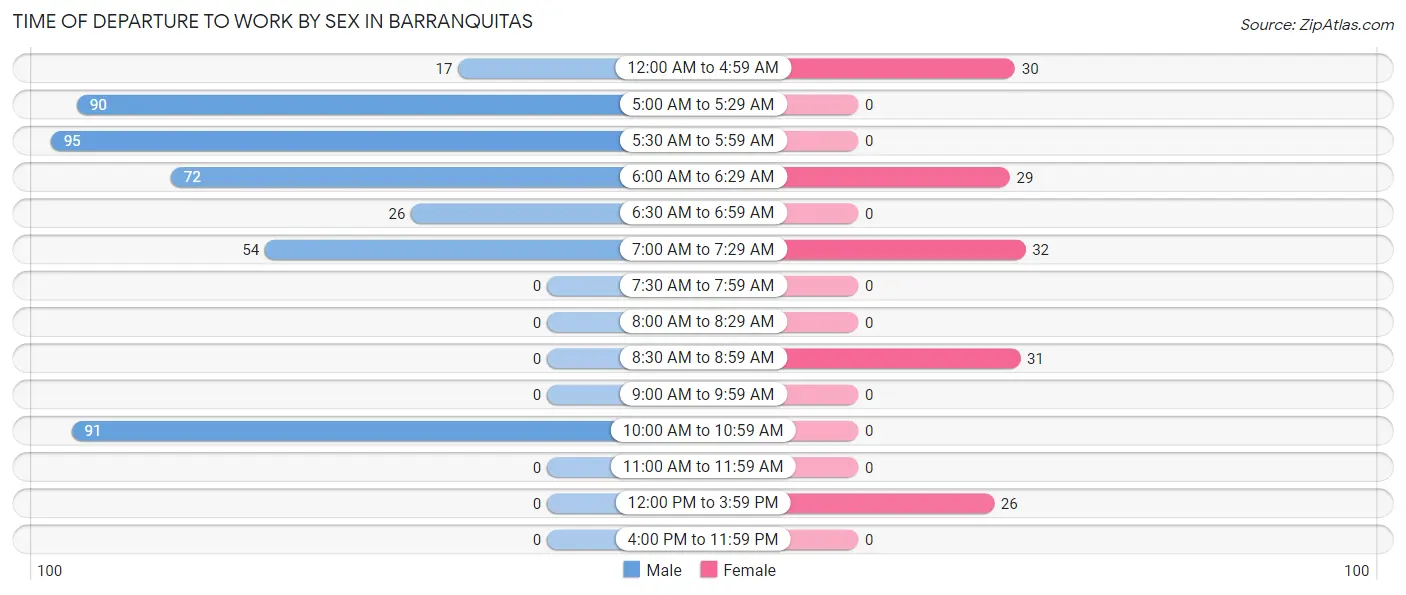
| Time of Departure | Male | Female |
| 12:00 AM to 4:59 AM | 17 (3.8%) | 30 (20.3%) |
| 5:00 AM to 5:29 AM | 90 (20.2%) | 0 (0.0%) |
| 5:30 AM to 5:59 AM | 95 (21.3%) | 0 (0.0%) |
| 6:00 AM to 6:29 AM | 72 (16.2%) | 29 (19.6%) |
| 6:30 AM to 6:59 AM | 26 (5.8%) | 0 (0.0%) |
| 7:00 AM to 7:29 AM | 54 (12.1%) | 32 (21.6%) |
| 7:30 AM to 7:59 AM | 0 (0.0%) | 0 (0.0%) |
| 8:00 AM to 8:29 AM | 0 (0.0%) | 0 (0.0%) |
| 8:30 AM to 8:59 AM | 0 (0.0%) | 31 (20.9%) |
| 9:00 AM to 9:59 AM | 0 (0.0%) | 0 (0.0%) |
| 10:00 AM to 10:59 AM | 91 (20.4%) | 0 (0.0%) |
| 11:00 AM to 11:59 AM | 0 (0.0%) | 0 (0.0%) |
| 12:00 PM to 3:59 PM | 0 (0.0%) | 26 (17.6%) |
| 4:00 PM to 11:59 PM | 0 (0.0%) | 0 (0.0%) |
| Total | 445 (100.0%) | 148 (100.0%) |
Housing Occupancy in Barranquitas
Occupancy by Ownership in Barranquitas
Of the total 858 dwellings in Barranquitas, owner-occupied units account for 258 (30.1%), while renter-occupied units make up 600 (69.9%).
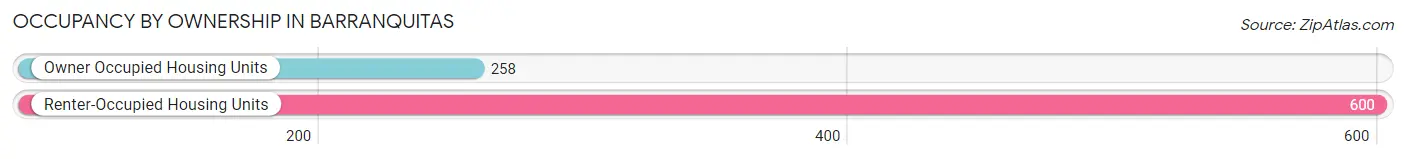
| Occupancy | # Housing Units | % Housing Units |
| Owner Occupied Housing Units | 258 | 30.1% |
| Renter-Occupied Housing Units | 600 | 69.9% |
| Total Occupied Housing Units | 858 | 100.0% |
Occupancy by Household Size in Barranquitas
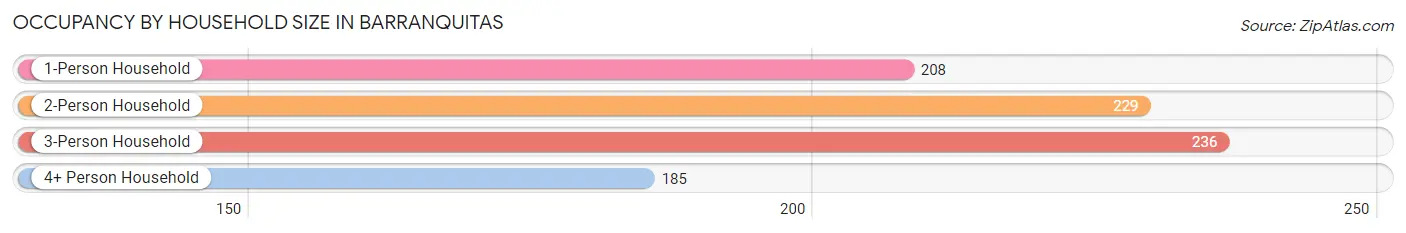
| Household Size | # Housing Units | % Housing Units |
| 1-Person Household | 208 | 24.2% |
| 2-Person Household | 229 | 26.7% |
| 3-Person Household | 236 | 27.5% |
| 4+ Person Household | 185 | 21.6% |
| Total Housing Units | 858 | 100.0% |
Occupancy by Ownership by Household Size in Barranquitas
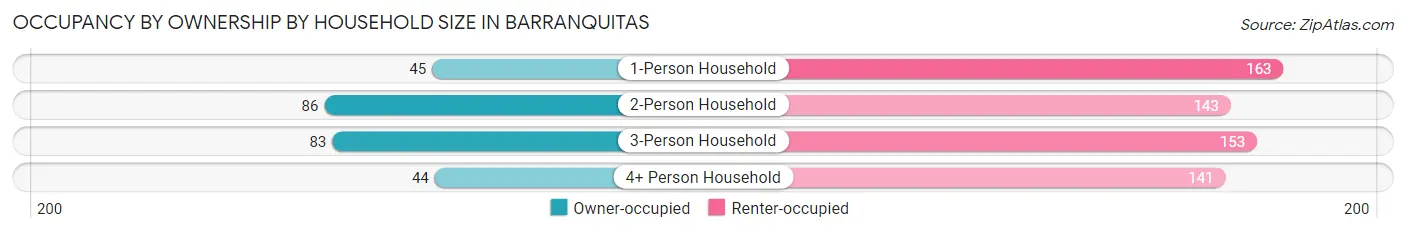
| Household Size | Owner-occupied | Renter-occupied |
| 1-Person Household | 45 (21.6%) | 163 (78.4%) |
| 2-Person Household | 86 (37.6%) | 143 (62.5%) |
| 3-Person Household | 83 (35.2%) | 153 (64.8%) |
| 4+ Person Household | 44 (23.8%) | 141 (76.2%) |
| Total Housing Units | 258 (30.1%) | 600 (69.9%) |
Occupancy by Educational Attainment in Barranquitas
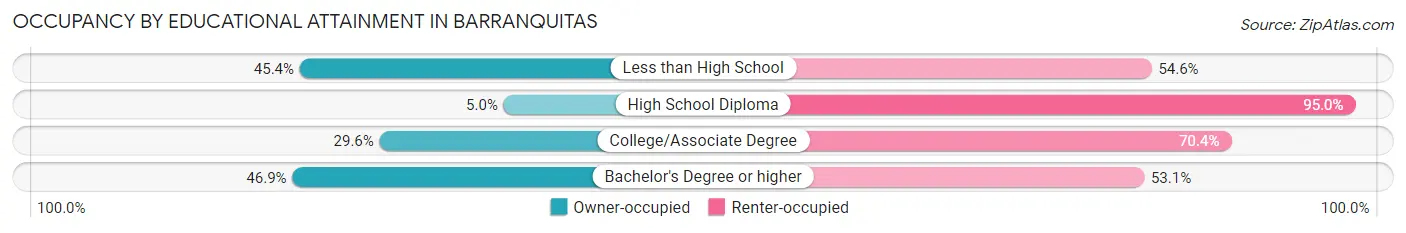
| Household Size | Owner-occupied | Renter-occupied |
| Less than High School | 139 (45.4%) | 167 (54.6%) |
| High School Diploma | 13 (5.0%) | 247 (95.0%) |
| College/Associate Degree | 53 (29.6%) | 126 (70.4%) |
| Bachelor's Degree or higher | 53 (46.9%) | 60 (53.1%) |
Occupancy by Age of Householder in Barranquitas
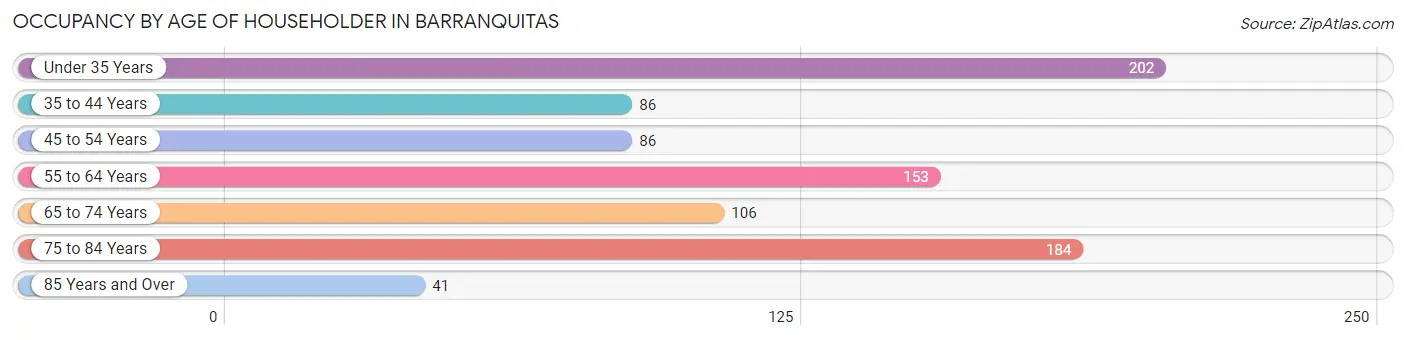
| Age Bracket | # Households | % Households |
| Under 35 Years | 202 | 23.5% |
| 35 to 44 Years | 86 | 10.0% |
| 45 to 54 Years | 86 | 10.0% |
| 55 to 64 Years | 153 | 17.8% |
| 65 to 74 Years | 106 | 12.3% |
| 75 to 84 Years | 184 | 21.4% |
| 85 Years and Over | 41 | 4.8% |
| Total | 858 | 100.0% |
Housing Finances in Barranquitas
Median Income by Occupancy in Barranquitas
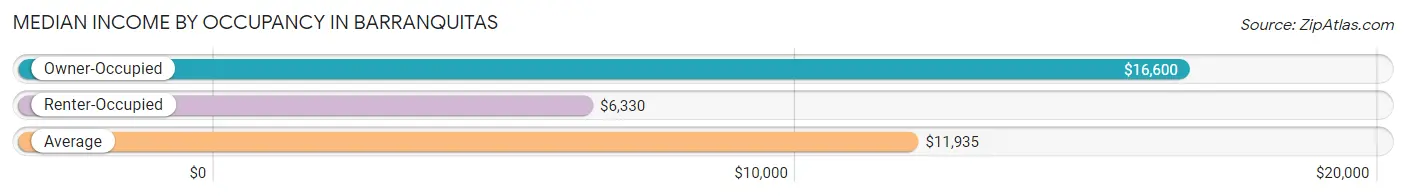
| Occupancy Type | # Households | Median Income |
| Owner-Occupied | 258 (30.1%) | $16,600 |
| Renter-Occupied | 600 (69.9%) | $6,330 |
| Average | 858 (100.0%) | $11,935 |
Occupancy by Householder Income Bracket in Barranquitas
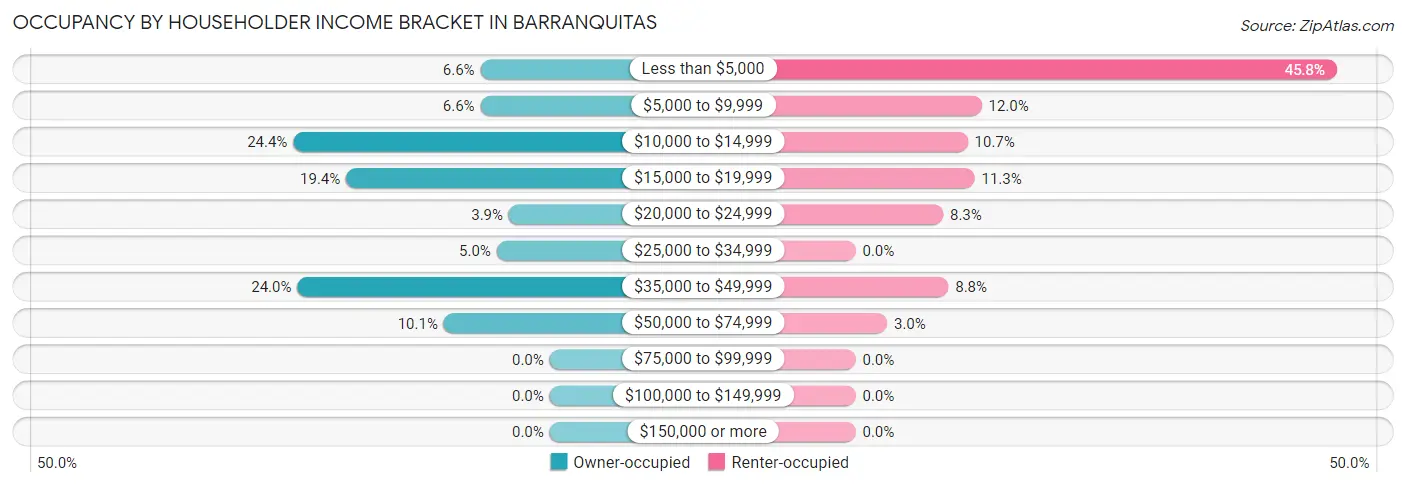
| Income Bracket | Owner-occupied | Renter-occupied |
| Less than $5,000 | 17 (6.6%) | 275 (45.8%) |
| $5,000 to $9,999 | 17 (6.6%) | 72 (12.0%) |
| $10,000 to $14,999 | 63 (24.4%) | 64 (10.7%) |
| $15,000 to $19,999 | 50 (19.4%) | 68 (11.3%) |
| $20,000 to $24,999 | 10 (3.9%) | 50 (8.3%) |
| $25,000 to $34,999 | 13 (5.0%) | 0 (0.0%) |
| $35,000 to $49,999 | 62 (24.0%) | 53 (8.8%) |
| $50,000 to $74,999 | 26 (10.1%) | 18 (3.0%) |
| $75,000 to $99,999 | 0 (0.0%) | 0 (0.0%) |
| $100,000 to $149,999 | 0 (0.0%) | 0 (0.0%) |
| $150,000 or more | 0 (0.0%) | 0 (0.0%) |
| Total | 258 (100.0%) | 600 (100.0%) |
Monthly Housing Cost Tiers in Barranquitas
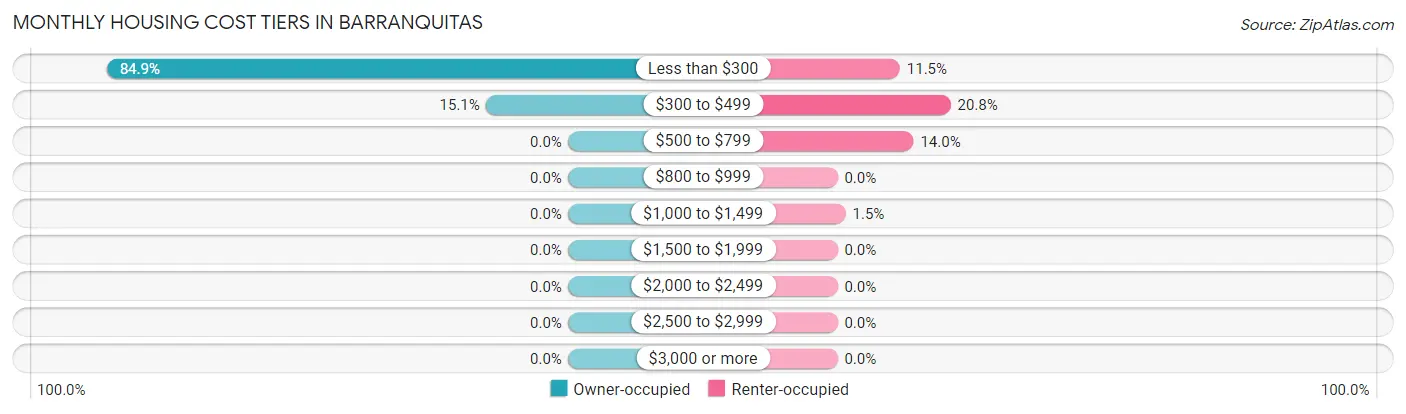
| Monthly Cost | Owner-occupied | Renter-occupied |
| Less than $300 | 219 (84.9%) | 69 (11.5%) |
| $300 to $499 | 39 (15.1%) | 125 (20.8%) |
| $500 to $799 | 0 (0.0%) | 84 (14.0%) |
| $800 to $999 | 0 (0.0%) | 0 (0.0%) |
| $1,000 to $1,499 | 0 (0.0%) | 9 (1.5%) |
| $1,500 to $1,999 | 0 (0.0%) | 0 (0.0%) |
| $2,000 to $2,499 | 0 (0.0%) | 0 (0.0%) |
| $2,500 to $2,999 | 0 (0.0%) | 0 (0.0%) |
| $3,000 or more | 0 (0.0%) | 0 (0.0%) |
| Total | 258 (100.0%) | 600 (100.0%) |
Physical Housing Characteristics in Barranquitas
Housing Structures in Barranquitas
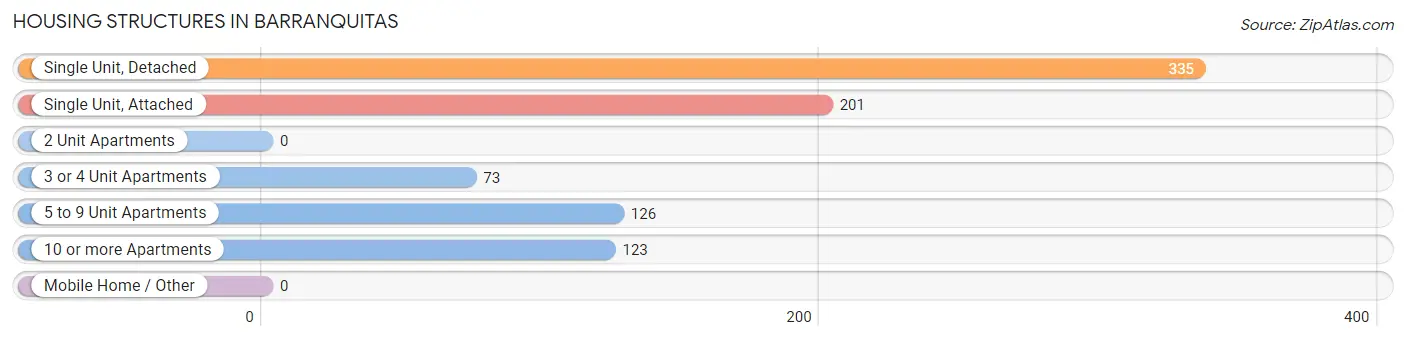
| Structure Type | # Housing Units | % Housing Units |
| Single Unit, Detached | 335 | 39.0% |
| Single Unit, Attached | 201 | 23.4% |
| 2 Unit Apartments | 0 | 0.0% |
| 3 or 4 Unit Apartments | 73 | 8.5% |
| 5 to 9 Unit Apartments | 126 | 14.7% |
| 10 or more Apartments | 123 | 14.3% |
| Mobile Home / Other | 0 | 0.0% |
| Total | 858 | 100.0% |
Housing Structures by Occupancy in Barranquitas
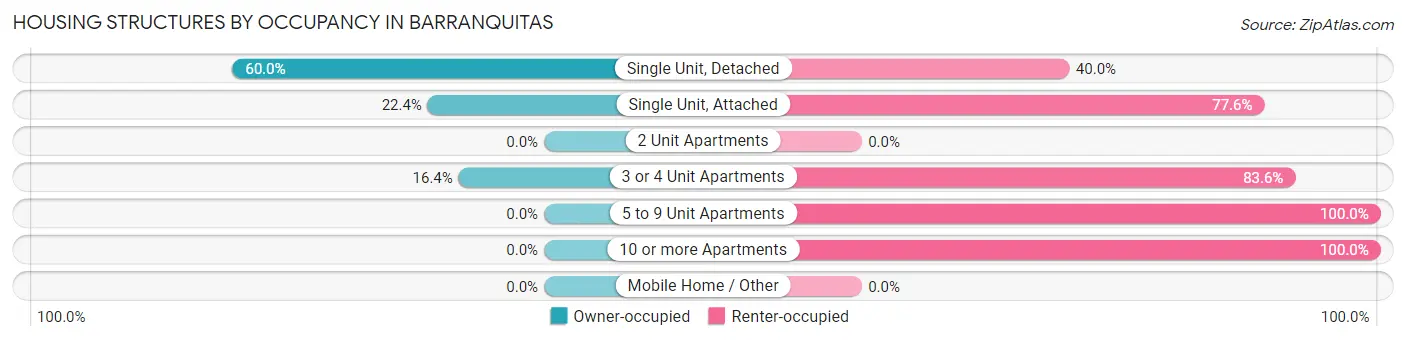
| Structure Type | Owner-occupied | Renter-occupied |
| Single Unit, Detached | 201 (60.0%) | 134 (40.0%) |
| Single Unit, Attached | 45 (22.4%) | 156 (77.6%) |
| 2 Unit Apartments | 0 (0.0%) | 0 (0.0%) |
| 3 or 4 Unit Apartments | 12 (16.4%) | 61 (83.6%) |
| 5 to 9 Unit Apartments | 0 (0.0%) | 126 (100.0%) |
| 10 or more Apartments | 0 (0.0%) | 123 (100.0%) |
| Mobile Home / Other | 0 (0.0%) | 0 (0.0%) |
| Total | 258 (30.1%) | 600 (69.9%) |
Housing Structures by Number of Rooms in Barranquitas
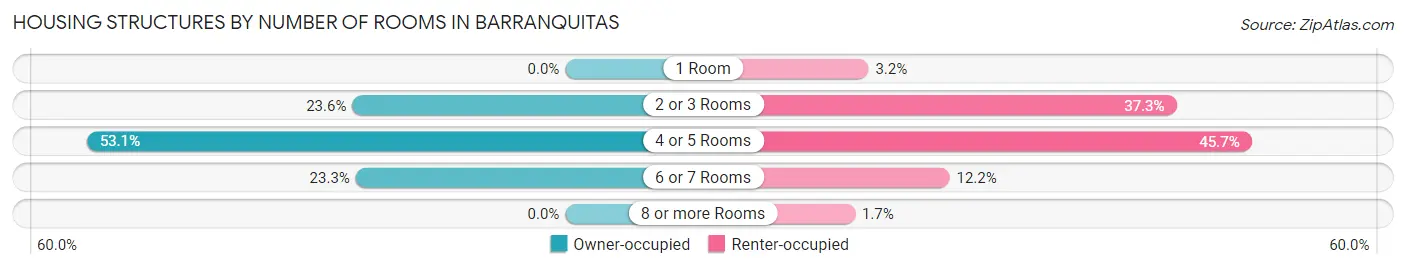
| Number of Rooms | Owner-occupied | Renter-occupied |
| 1 Room | 0 (0.0%) | 19 (3.2%) |
| 2 or 3 Rooms | 61 (23.6%) | 224 (37.3%) |
| 4 or 5 Rooms | 137 (53.1%) | 274 (45.7%) |
| 6 or 7 Rooms | 60 (23.3%) | 73 (12.2%) |
| 8 or more Rooms | 0 (0.0%) | 10 (1.7%) |
| Total | 258 (100.0%) | 600 (100.0%) |
Housing Structure by Heating Type in Barranquitas
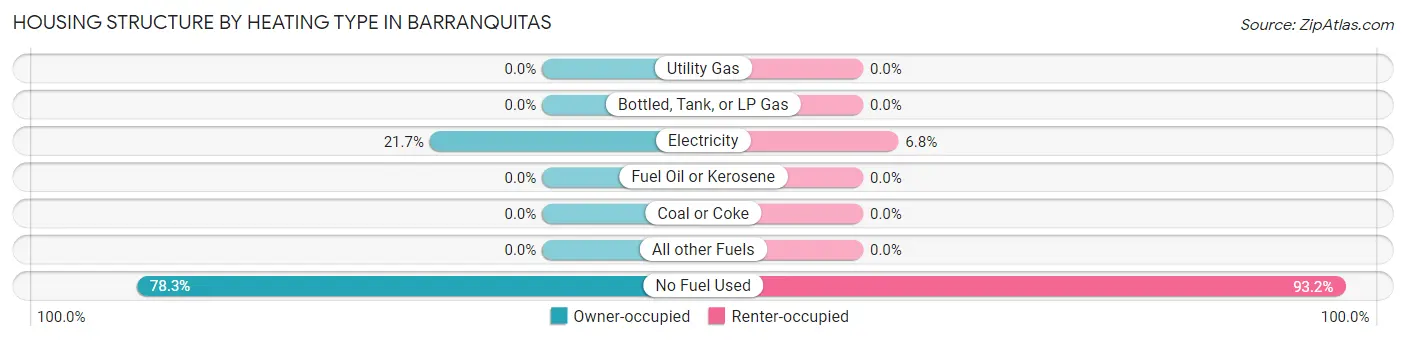
| Heating Type | Owner-occupied | Renter-occupied |
| Utility Gas | 0 (0.0%) | 0 (0.0%) |
| Bottled, Tank, or LP Gas | 0 (0.0%) | 0 (0.0%) |
| Electricity | 56 (21.7%) | 41 (6.8%) |
| Fuel Oil or Kerosene | 0 (0.0%) | 0 (0.0%) |
| Coal or Coke | 0 (0.0%) | 0 (0.0%) |
| All other Fuels | 0 (0.0%) | 0 (0.0%) |
| No Fuel Used | 202 (78.3%) | 559 (93.2%) |
| Total | 258 (100.0%) | 600 (100.0%) |
Household Vehicle Usage in Barranquitas
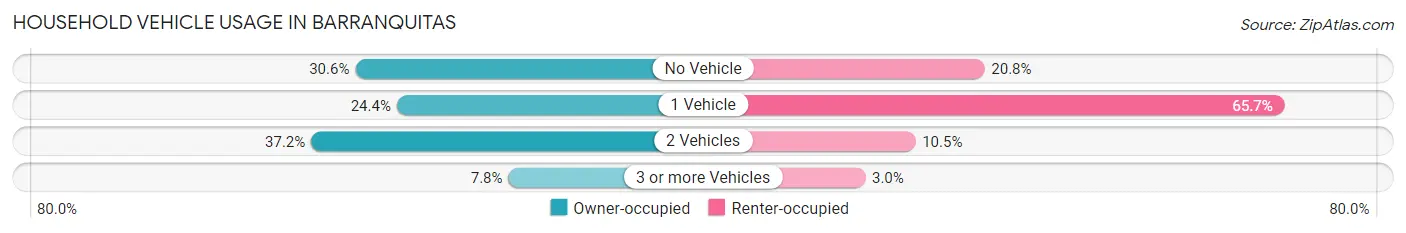
| Vehicles per Household | Owner-occupied | Renter-occupied |
| No Vehicle | 79 (30.6%) | 125 (20.8%) |
| 1 Vehicle | 63 (24.4%) | 394 (65.7%) |
| 2 Vehicles | 96 (37.2%) | 63 (10.5%) |
| 3 or more Vehicles | 20 (7.7%) | 18 (3.0%) |
| Total | 258 (100.0%) | 600 (100.0%) |
Real Estate & Mortgages in Barranquitas
Real Estate and Mortgage Overview in Barranquitas
| Characteristic | Without Mortgage | With Mortgage |
| Housing Units | 258 | 0 |
| Median Property Value | $108,500 | $0 |
| Median Household Income | $16,600 | $0 |
| Monthly Housing Costs | $170 | $0 |
| Real Estate Taxes | - | - |
Property Value by Mortgage Status in Barranquitas
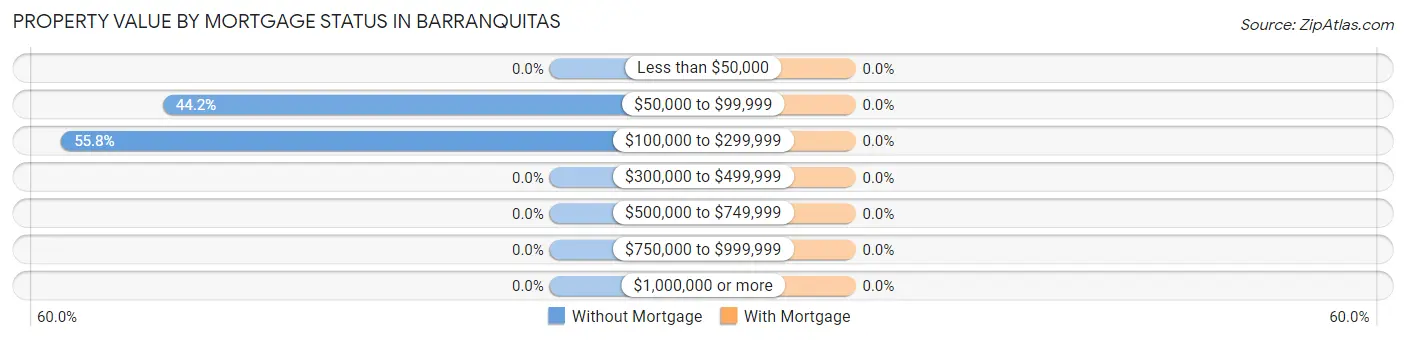
| Property Value | Without Mortgage | With Mortgage |
| Less than $50,000 | 0 (0.0%) | 0 (0.0%) |
| $50,000 to $99,999 | 114 (44.2%) | 0 (0.0%) |
| $100,000 to $299,999 | 144 (55.8%) | 0 (0.0%) |
| $300,000 to $499,999 | 0 (0.0%) | 0 (0.0%) |
| $500,000 to $749,999 | 0 (0.0%) | 0 (0.0%) |
| $750,000 to $999,999 | 0 (0.0%) | 0 (0.0%) |
| $1,000,000 or more | 0 (0.0%) | 0 (0.0%) |
| Total | 258 (100.0%) | 0 (0.0%) |
Household Income by Mortgage Status in Barranquitas
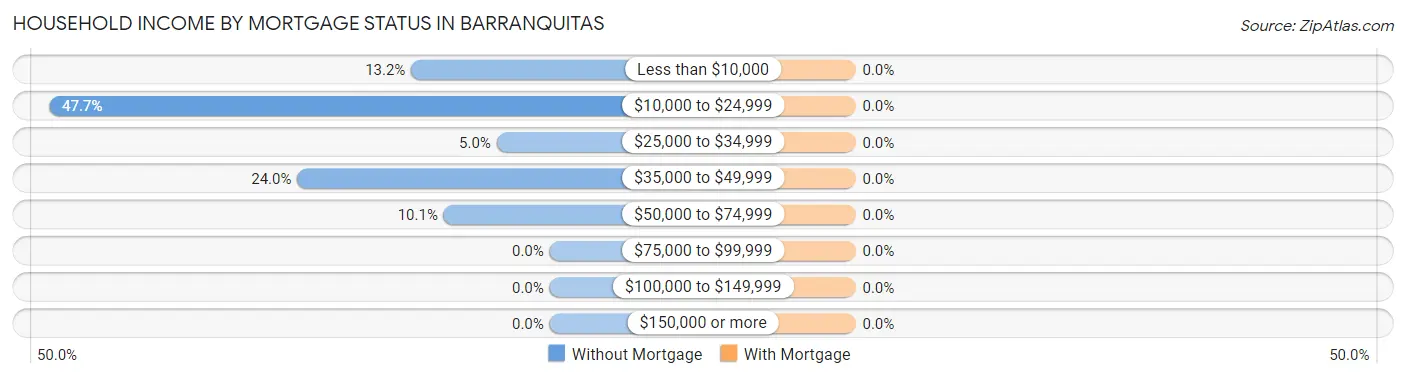
| Household Income | Without Mortgage | With Mortgage |
| Less than $10,000 | 34 (13.2%) | 0 (0.0%) |
| $10,000 to $24,999 | 123 (47.7%) | 0 (0.0%) |
| $25,000 to $34,999 | 13 (5.0%) | 0 (0.0%) |
| $35,000 to $49,999 | 62 (24.0%) | 0 (0.0%) |
| $50,000 to $74,999 | 26 (10.1%) | 0 (0.0%) |
| $75,000 to $99,999 | 0 (0.0%) | 0 (0.0%) |
| $100,000 to $149,999 | 0 (0.0%) | 0 (0.0%) |
| $150,000 or more | 0 (0.0%) | 0 (0.0%) |
| Total | 258 (100.0%) | 0 (0.0%) |
Property Value to Household Income Ratio in Barranquitas
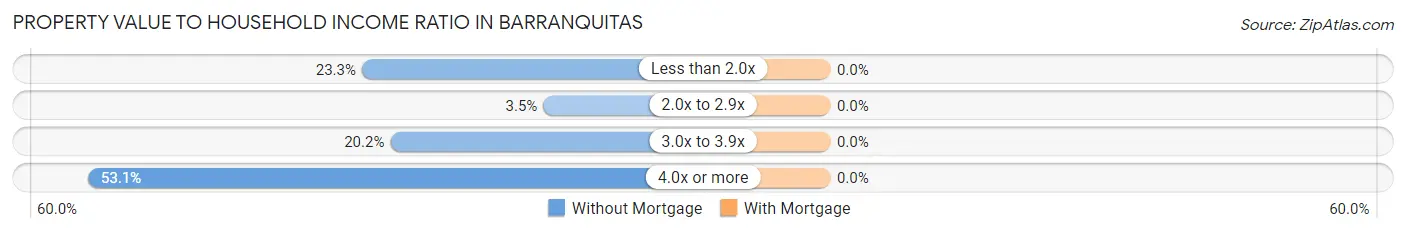
| Value-to-Income Ratio | Without Mortgage | With Mortgage |
| Less than 2.0x | 60 (23.3%) | 0 (0.0%) |
| 2.0x to 2.9x | 9 (3.5%) | 0 (0.0%) |
| 3.0x to 3.9x | 52 (20.2%) | 0 (0.0%) |
| 4.0x or more | 137 (53.1%) | 0 (0.0%) |
| Total | 258 (100.0%) | 0 (0.0%) |
Real Estate Taxes by Mortgage Status in Barranquitas
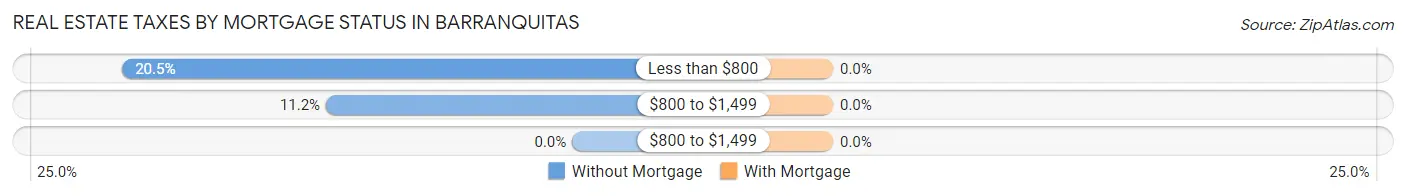
| Property Taxes | Without Mortgage | With Mortgage |
| Less than $800 | 53 (20.5%) | 0 (0.0%) |
| $800 to $1,499 | 29 (11.2%) | 0 (0.0%) |
| $800 to $1,499 | 0 (0.0%) | 0 (0.0%) |
| Total | 258 (100.0%) | 0 (0.0%) |
Health & Disability in Barranquitas
Health Insurance Coverage by Age in Barranquitas
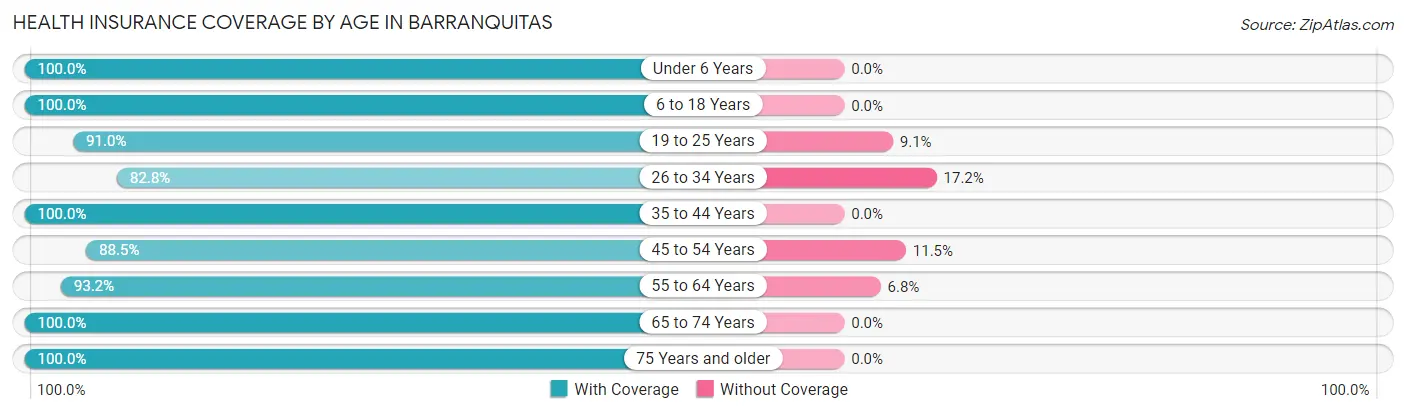
| Age Bracket | With Coverage | Without Coverage |
| Under 6 Years | 268 (100.0%) | 0 (0.0%) |
| 6 to 18 Years | 524 (100.0%) | 0 (0.0%) |
| 19 to 25 Years | 402 (90.9%) | 40 (9.0%) |
| 26 to 34 Years | 226 (82.8%) | 47 (17.2%) |
| 35 to 44 Years | 235 (100.0%) | 0 (0.0%) |
| 45 to 54 Years | 316 (88.5%) | 41 (11.5%) |
| 55 to 64 Years | 234 (93.2%) | 17 (6.8%) |
| 65 to 74 Years | 178 (100.0%) | 0 (0.0%) |
| 75 Years and older | 283 (100.0%) | 0 (0.0%) |
| Total | 2,666 (94.8%) | 145 (5.2%) |
Health Insurance Coverage by Citizenship Status in Barranquitas

| Citizenship Status | With Coverage | Without Coverage |
| Native Born | 268 (100.0%) | 0 (0.0%) |
| Foreign Born, Citizen | 524 (100.0%) | 0 (0.0%) |
| Foreign Born, not a Citizen | 402 (90.9%) | 40 (9.0%) |
Health Insurance Coverage by Household Income in Barranquitas
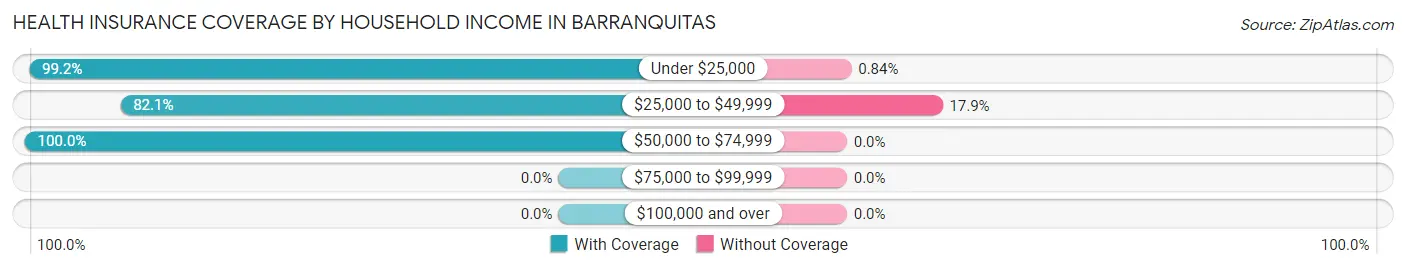
| Household Income | With Coverage | Without Coverage |
| Under $25,000 | 1,883 (99.2%) | 16 (0.8%) |
| $25,000 to $49,999 | 591 (82.1%) | 129 (17.9%) |
| $50,000 to $74,999 | 188 (100.0%) | 0 (0.0%) |
| $75,000 to $99,999 | 0 (0.0%) | 0 (0.0%) |
| $100,000 and over | 0 (0.0%) | 0 (0.0%) |
Public vs Private Health Insurance Coverage by Age in Barranquitas
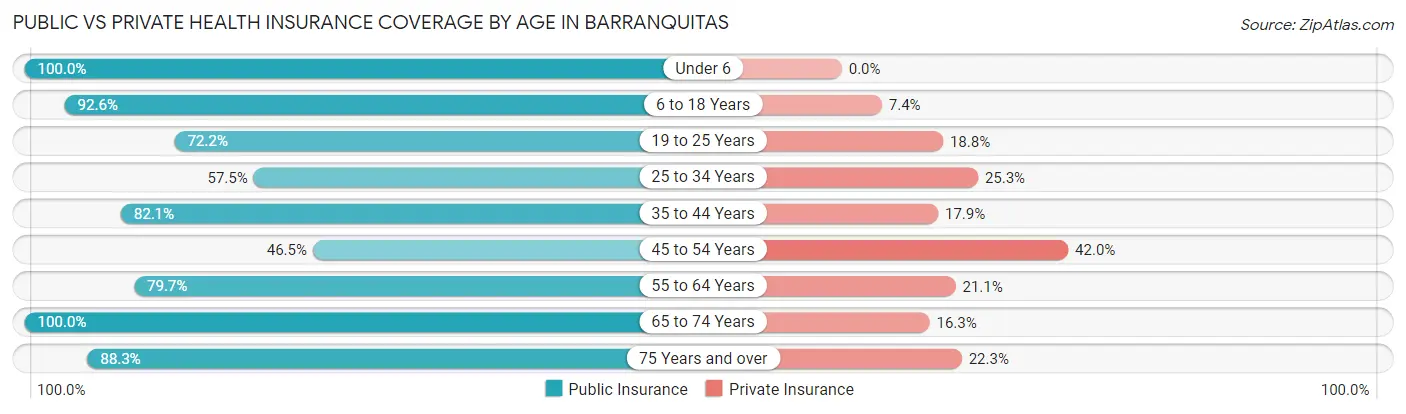
| Age Bracket | Public Insurance | Private Insurance |
| Under 6 | 268 (100.0%) | 0 (0.0%) |
| 6 to 18 Years | 485 (92.6%) | 39 (7.4%) |
| 19 to 25 Years | 319 (72.2%) | 83 (18.8%) |
| 25 to 34 Years | 157 (57.5%) | 69 (25.3%) |
| 35 to 44 Years | 193 (82.1%) | 42 (17.9%) |
| 45 to 54 Years | 166 (46.5%) | 150 (42.0%) |
| 55 to 64 Years | 200 (79.7%) | 53 (21.1%) |
| 65 to 74 Years | 178 (100.0%) | 29 (16.3%) |
| 75 Years and over | 250 (88.3%) | 63 (22.3%) |
| Total | 2,216 (78.8%) | 528 (18.8%) |
Disability Status by Sex by Age in Barranquitas
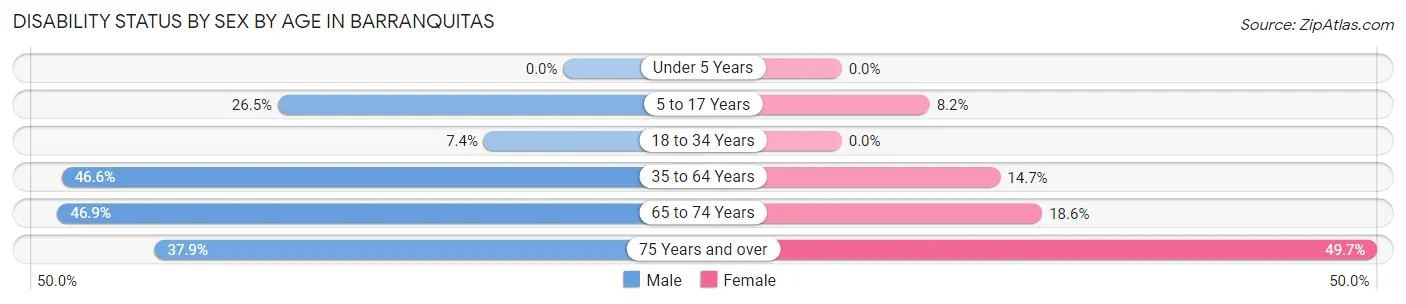
| Age Bracket | Male | Female |
| Under 5 Years | 0 (0.0%) | 0 (0.0%) |
| 5 to 17 Years | 71 (26.5%) | 20 (8.2%) |
| 18 to 34 Years | 31 (7.4%) | 0 (0.0%) |
| 35 to 64 Years | 209 (46.6%) | 58 (14.7%) |
| 65 to 74 Years | 23 (46.9%) | 24 (18.6%) |
| 75 Years and over | 44 (37.9%) | 83 (49.7%) |
Disability Class by Sex by Age in Barranquitas
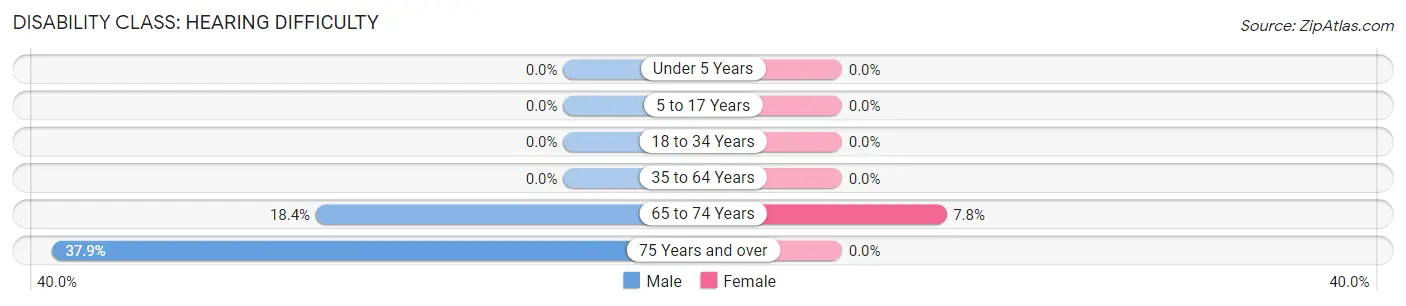
Disability Class: Hearing Difficulty
| Age Bracket | Male | Female |
| Under 5 Years | 0 (0.0%) | 0 (0.0%) |
| 5 to 17 Years | 0 (0.0%) | 0 (0.0%) |
| 18 to 34 Years | 0 (0.0%) | 0 (0.0%) |
| 35 to 64 Years | 0 (0.0%) | 0 (0.0%) |
| 65 to 74 Years | 9 (18.4%) | 10 (7.7%) |
| 75 Years and over | 44 (37.9%) | 0 (0.0%) |
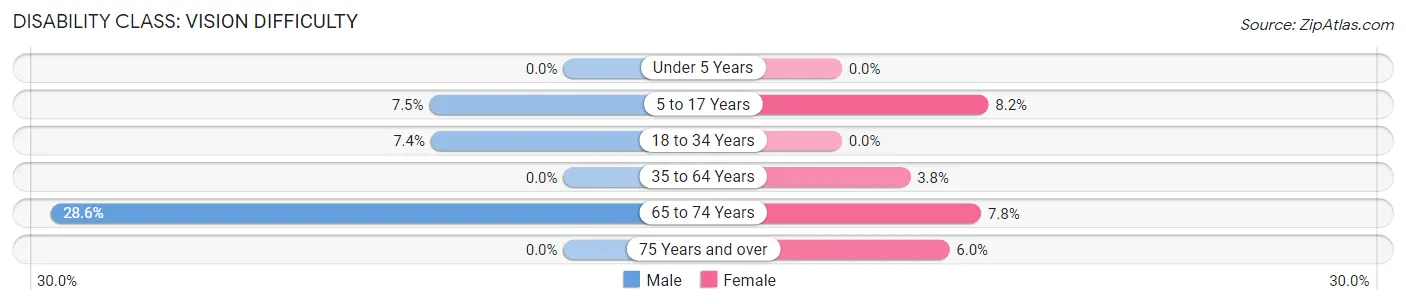
Disability Class: Vision Difficulty
| Age Bracket | Male | Female |
| Under 5 Years | 0 (0.0%) | 0 (0.0%) |
| 5 to 17 Years | 20 (7.5%) | 20 (8.2%) |
| 18 to 34 Years | 31 (7.4%) | 0 (0.0%) |
| 35 to 64 Years | 0 (0.0%) | 15 (3.8%) |
| 65 to 74 Years | 14 (28.6%) | 10 (7.7%) |
| 75 Years and over | 0 (0.0%) | 10 (6.0%) |
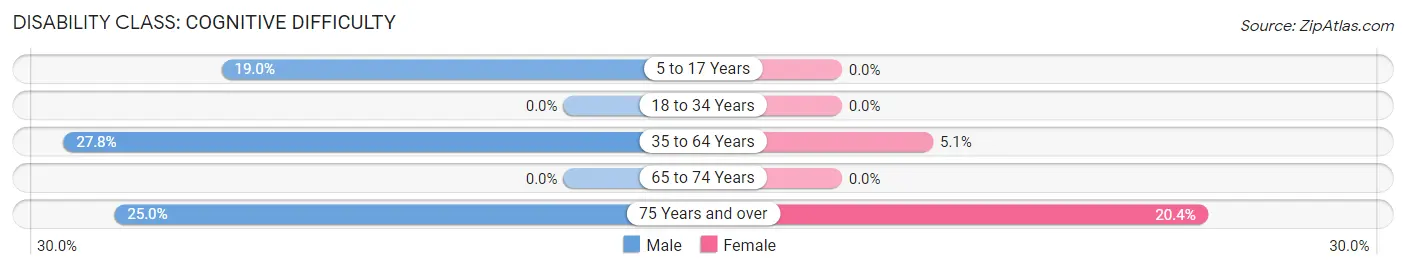
Disability Class: Cognitive Difficulty
| Age Bracket | Male | Female |
| 5 to 17 Years | 51 (19.0%) | 0 (0.0%) |
| 18 to 34 Years | 0 (0.0%) | 0 (0.0%) |
| 35 to 64 Years | 125 (27.8%) | 20 (5.1%) |
| 65 to 74 Years | 0 (0.0%) | 0 (0.0%) |
| 75 Years and over | 29 (25.0%) | 34 (20.4%) |
Disability Class: Ambulatory Difficulty

| Age Bracket | Male | Female |
| 5 to 17 Years | 0 (0.0%) | 0 (0.0%) |
| 18 to 34 Years | 0 (0.0%) | 0 (0.0%) |
| 35 to 64 Years | 136 (30.3%) | 15 (3.8%) |
| 65 to 74 Years | 0 (0.0%) | 14 (10.8%) |
| 75 Years and over | 44 (37.9%) | 64 (38.3%) |
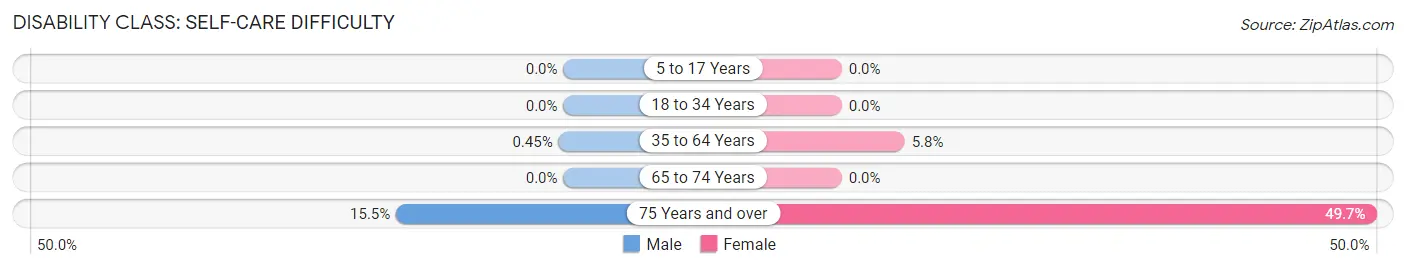
Disability Class: Self-Care Difficulty
| Age Bracket | Male | Female |
| 5 to 17 Years | 0 (0.0%) | 0 (0.0%) |
| 18 to 34 Years | 0 (0.0%) | 0 (0.0%) |
| 35 to 64 Years | 2 (0.4%) | 23 (5.8%) |
| 65 to 74 Years | 0 (0.0%) | 0 (0.0%) |
| 75 Years and over | 18 (15.5%) | 83 (49.7%) |
Technology Access in Barranquitas
Computing Device Access in Barranquitas
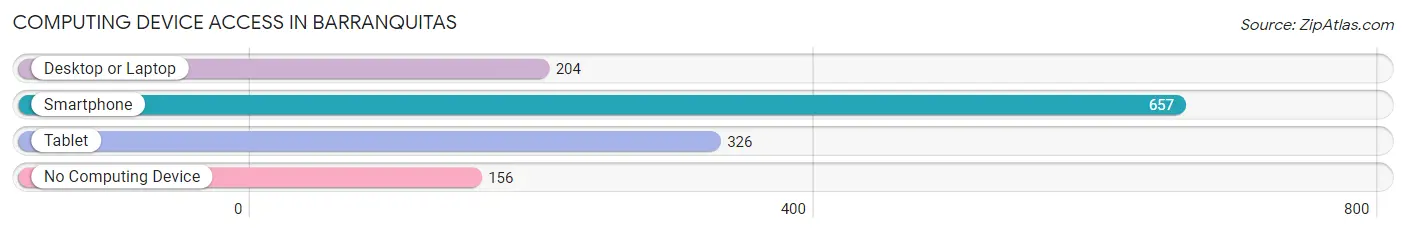
| Device Type | # Households | % Households |
| Desktop or Laptop | 204 | 23.8% |
| Smartphone | 657 | 76.6% |
| Tablet | 326 | 38.0% |
| No Computing Device | 156 | 18.2% |
| Total | 858 | 100.0% |
Internet Access in Barranquitas
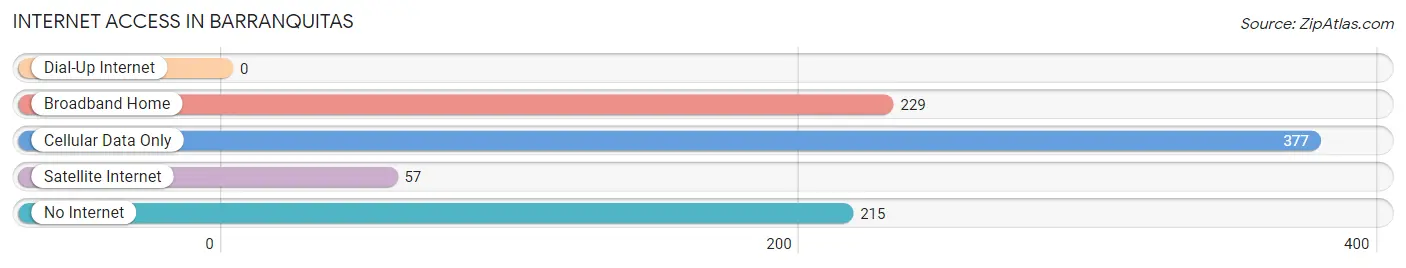
| Internet Type | # Households | % Households |
| Dial-Up Internet | 0 | 0.0% |
| Broadband Home | 229 | 26.7% |
| Cellular Data Only | 377 | 43.9% |
| Satellite Internet | 57 | 6.6% |
| No Internet | 215 | 25.1% |
| Total | 858 | 100.0% |
Barranquitas Summary
Barranquitas is a municipality located in the central region of Puerto Rico, in the Cordillera Central mountain range. It is bordered by the municipalities of Corozal, Naranjito, Orocovis, and Comerío. The town is known as the “Cradle of the Puerto Rican Jíbaro”, and is home to many of the island’s traditional customs and culture.
History
Barranquitas was founded in 1793 by Don Juan de Aponte y Díaz, a Spanish military officer. The town was originally named “Barranquitas de Abajo”, and was part of the municipality of Comerío. In 1824, Barranquitas was separated from Comerío and became an independent municipality.
The town was an important center of the Puerto Rican independence movement in the 19th century. In 1868, the town was the site of a major battle between the Spanish forces and the Puerto Rican rebels. The rebels were led by General Antonio Valero de Bernabé, who was later killed in the battle.
Geography
Barranquitas is located in the Cordillera Central mountain range, at an elevation of 1,000 feet (305 meters) above sea level. The town covers an area of approximately 24 square miles (62 square kilometers). The terrain is mostly mountainous, with some flat areas in the lower elevations. The highest point in the municipality is Cerro de Punta, which rises to an elevation of 3,087 feet (941 meters).
The climate in Barranquitas is tropical, with temperatures ranging from the mid-70s to the mid-80s Fahrenheit (21-29 Celsius). The town receives an average of 60 inches (152 centimeters) of rain per year.
Economy
The economy of Barranquitas is largely based on agriculture and tourism. The town is known for its production of coffee, tobacco, and other agricultural products. Tourism is also an important part of the local economy, with many visitors coming to the town to experience its traditional culture and customs.
Demographics
As of the 2010 census, Barranquitas had a population of 24,818. The population is mostly of Puerto Rican descent, with a small minority of African and European descent. The town has a median age of 36.7 years, and a median household income of $17,845.
The majority of the population is Roman Catholic, with a small minority of other religious denominations. Spanish is the primary language spoken in Barranquitas, although English is also spoken by some of the population.
Conclusion
Barranquitas is a municipality located in the central region of Puerto Rico, in the Cordillera Central mountain range. It was founded in 1793 and is known as the “Cradle of the Puerto Rican Jíbaro”. The town has a population of 24,818, and its economy is largely based on agriculture and tourism. Barranquitas is home to many of the island’s traditional customs and culture, and is an important center of the Puerto Rican independence movement.
Common Questions
What is Per Capita Income in Barranquitas?
Per Capita income in Barranquitas is $6,439.
What is the Median Family Income in Barranquitas?
Median Family Income in Barranquitas is $13,188.
What is the Median Household income in Barranquitas?
Median Household Income in Barranquitas is $11,935.
What is Income or Wage Gap in Barranquitas?
Income or Wage Gap in Barranquitas is 45.5%.
Women in Barranquitas earn 54.5 cents for every dollar earned by a man.
What is Inequality or Gini Index in Barranquitas?
Inequality or Gini Index in Barranquitas is 0.54.
What is the Total Population of Barranquitas?
Total Population of Barranquitas is 2,820.
What is the Total Male Population of Barranquitas?
Total Male Population of Barranquitas is 1,438.
What is the Total Female Population of Barranquitas?
Total Female Population of Barranquitas is 1,382.
What is the Ratio of Males per 100 Females in Barranquitas?
There are 104.05 Males per 100 Females in Barranquitas.
What is the Ratio of Females per 100 Males in Barranquitas?
There are 96.11 Females per 100 Males in Barranquitas.
What is the Median Population Age in Barranquitas?
Median Population Age in Barranquitas is 32.1 Years.
What is the Average Family Size in Barranquitas
Average Family Size in Barranquitas is 3.8 People.
What is the Average Household Size in Barranquitas
Average Household Size in Barranquitas is 3.3 People.
How Large is the Labor Force in Barranquitas?
There are 842 People in the Labor Forcein in Barranquitas.
What is the Percentage of People in the Labor Force in Barranquitas?
39.5% of People are in the Labor Force in Barranquitas.
What is the Unemployment Rate in Barranquitas?
Unemployment Rate in Barranquitas is 28.1%.